Abstract
Background:
Re-openings of estuary barrages for ecosystem restoration are rare globally. The Nakdong River Estuary (NRE), South Korea, provides a unique opportunity to assess the effects of temporary barrage re-opening on fish population structure.
Methods:
We conducted monthly fish population surveys both upstream and downstream of the estuary barrage from 2021 to 2023, categorizing results into closing period (CP) and opening period (OP).
Results:
During the OP, we observed shifts in fish distribution, including decreased proportions of non-indigenous species and altered habitat distributions. Additionally, we observed an increase in brackish water species populations and their upstream movement. Monthly frequency analysis revealed that brackish and non-indigenous species exhibited high frequencies mainly during OP (July to October), while freshwater (demersal) species showed low frequencies during the same period.
Discussion:
Our study highlights the significant impact of temporary estuarine ecosystem restoration on fish distribution and emphasizes the need for careful consideration of both frequency and duration of estuary barrage re-openings.
1 Introduction
Estuarine ecosystems represent unique environments that are defined as semi-enclosed coastal waters connected to the sea, either permanently or periodically, with salinity levels different from those of the adjacent open ocean due to freshwater inputs, resulting in characteristic biota (Barnabe and Barnabe-Quet, 2000; Pinckney et al., 2001; Elliott and Whitfield, 2011). These dynamic systems support a diverse range of habitats that form in brackish waters where nutrients from seawater and freshwater converge (Day et al., 2012; Snedden et al., 2013). Consequently, these habitats not only act as migration corridors for fish moving between marine and freshwater areas but also provide several essential functions that optimize fish survival, development and growth (Jensen et al., 2010; Dimitriadis et al., 2012). This is well-documented from major estuarine systems worldwide, such as the Rhine Delta in the Netherlands (Smit et al., 1997), the Elbe Estuary in Germany (Heininger et al., 2015) and Australia’s Murray River system (Thom et al., 2020), where restoration efforts have focused on maintaining connectivity between marine and freshwater environments. Furthermore, the expansion of fish mobility through these connected systems may stabilize the food web in the ecosystems and increase fish stocks (Mann, 1993; Winemiller and Jepsen, 1998). However, over the past century, estuary barrages built for various purposes such as urbanization, tidal power generation and traffic management, have diminished or eliminated brackish water areas connecting saltwater and freshwater areas (Burt and Rees, 2001; Kidd et al., 2015).
Changes in estuarine ecosystems, particularly the loss of brackish water areas, reduce biodiversity by eliminating specialized brackish water species (Cognetti and Maltagliati, 2000; Wolff, 2000). Specifically, conversion to freshwater environments impacts diadromous fish species that require brackish zones for migration (Pihl et al., 2002) and affects the overall fish community, as many fish species are highly sensitive to alterations in environmental conditions (Baptista et al., 2010; Sievert et al., 2016).
Despite the importance of estuarine ecosystems, brackish water areas are disappearing, and various approaches for conservation and restoration have been proposed (Elliott et al., 2007; Borja et al., 2010; Li et al., 2022). These restoration approaches include: (1) creation of small inlets in dams and dam removal (Ysebaert et al., 2016; Bellmore et al., 2019; Abbott et al., 2020; Karim et al., 2021; Morley et al., 2020); (2) adoption of environmentally friendly operations such as water quality management and reduced sediment discharge (McKenney and Kiesecker, 2010; Li et al., 2013; Tickner et al., 2020); (3) designation of protected areas such as Ramsar wetlands (Kumar and Pattnaik, 2012; Bowman, 2013; Bridgewater and Kim, 2021). These approaches present significant challenges. Dam removal often involves extensive physical infrastructure changes, complex permitting processes and high one-time costs (Catalano et al., 2007; Gardner et al., 2013; Poulos and Chernoff, 2017). In contrast, water quality management typically requires long-term investments in infrastructure, land use modifications and sustained policy enforcement to achieve desired outcomes.
Furthermore, studies examining fish communities following the restoration of brackish water areas where estuarine barrages have been built provide important insights into ecosystem recovery processes (Abbott et al., 2020). However, comprehensive evaluations of fish community responses to temporary barrage openings remain limited, particularly in monsoon-affected estuarine systems.
In South Korea, the connection between rivers and the sea has been severed by the construction of the Nakdong River Estuary (NRE) barrage (Park et al., 2020). As the Four Major Rivers Project progressed, water depth increased, land habitat diversity decreased (Song and Lynch, 2018). Consequently, the NRE habitat changed, non-indigenous species have become dominant, and species diversity has rapidly declined (Yoon et al., 2016; Jo et al., 2019). Recognizing these issues, the Korean government is experimenting with re-opening NRE to form brackish water areas aiming to restore species diversity (Choi et al., 2023). In some areas, restoration plans have been realized through temporary opening of estuary barrages. However, previous studies have primarily focused on water quality and zooplankton communities, with limited evaluation of fish community responses (Chung and Kang, 2013; Ahn et al., 2014; Im et al., 2020; Kim et al., 2022). Therefore, the re-opening of the NRE provides an opportunity to explore the ecological consequences of these changes (Baird et al., 2020).
Identifying patterns in ecosystem dynamics helps to develop management plans, understand ecosystem characteristics and comprehend marine, brackish and freshwater ecosystems (Heino and Mykrä, 2006; Hwang et al., 2010). The relationship between ecosystem structure and function is complex; therefore, it is necessary to use ecologically appropriate methods to identify ecosystem patterns (Olden et al., 2008). Self-organizing map (SOM) systems using these networks are powerful methods for elucidating complex ecosystem dynamics (Astel et al., 2007; Li et al., 2018; Amiri and Nakagawa, 2021). We investigated changes in fish distribution during the closing period (CP) and opening period (OP) of the NRE. We used SOM analysis to (1) observe fish distribution in the NRE over three years (2021-2023), (2) to investigate changes in fish distribution according to the ecological characteristics of CP and OP in the NRE, and (3) to discuss the elaboration an appropriate estuary barrage opening protocol and management based on our results. We hypothesized that the temporary formation of estuarine ecosystems would have a strong influence on the fish distribution depending on their ecological characteristics.
2 Materials and methods
2.1 Study area description and NRE re-opening protocol
The Nakdong River is South Korea’s longest waterway, boasting an expansive drainage area of approximately 23,384 km2 stretching across 510 km. In South Korea, a substantial amount of rainfall occurs during the summer monsoon, whereas winter experiences a comparatively low rainfall. Consequently, the construction of dams capable of storing the available freshwater is important. Constructed between 1983 and 1987, the Nakdong River barrage (35°08′20.3″N, 128°57′26.2″E) was established to function as a sustainable water supply and to control salt intrusion (Park et al., 2008). The barrage consists of 10 sluices, including four regulatory gates (length: 47.5 m, height: 8.3 m) and six main gates (length: 47.5 m, height: 9.2 m). The regulatory gate (gate 9) predominantly releases freshwater downstream during the rainy season (typically July–August) and low tides, effectively upholding the water level. In contrast, the main gates typically remain sealed. When opening commenced, only one regulatory gate (gate number 9) was utilized (Figures 1A, C; Supplementary Figure S1A). The regulatory gate is operated by adjusting either the lower chamber (Supplementary Figure S1B) or the upper section (Supplementary Figure S1C; Supporting Information). Thirteen regulatory gate re-openings occurred during the field survey period from 2021 to 2023 (Supplementary Table S1). To assess the impact of the NRE re-opening, we conducted 27 surveys—12 CPs and 15 OPs in the NRE (Supplementary Table S2).
Figure 1

Description of study sites in NRE (A). Cross-sectional views show the amount of seawater during the closing period (CP) in the NRE (B) and the intrusion of 9,300,000 tons of seawater during the opening period (OP) in the NRE (C). Site A comprises the sum of the three sites exposed to seawater. The blue colours and S represent the mean penetration distance of saltwater after the opening of the NRE. The amount of salt is represented by colours ranging from blue (0) to red (greater than 9.5).
2.2 Field survey and data collection
To analyze the spatiotemporal changes in fish assemblages resulting from the opening of the NRE, we conducted fish sampling at eight study sites located upstream of the NRE (Figure 1; Supplementary Table S3). The survey was divided into upstream and downstream sites based on the NRE. The three sites downstream of the NRE were regarded as equally affected by seawater and termed Site A (K-water, 2022). Additionally, five locations (B: 1 km, C: 4 km, D: 8 km, E: 12 km, F: 15 km) upstream of the NRE were investigated. The maximum penetration distance (S) of saltwater during the survey period was determined by referencing the average salinity distribution data presented in a report (Figure 1; Water Resources Management Information System (WAMIS), 2023). Fish were sampled monthly from March 2021 to August 2023 (Supplementary Table S3). Many winter season samples (December–February) were excluded because the study area is protected as a cultural heritage area for wintering birds. A total of 162 samples were collected from eight sites. The sampling sites encompassed diverse habitat types characteristic of estuarine environments. Sites A, situated downstream of the NRE, were characterized by sandy substrate with tidal influence and minimal vegetation coverage. The upstream sites (B–F) featured two distinct habitat zones: riparian zones with sandy riverbeds supporting submerged and emergent aquatic vegetation (predominantly Phragmites australis and Typha orientalis), and central channel zones with muddy substrates and sparse vegetation coverage. This habitat heterogeneity across the salinity gradient allowed for comprehensive sampling across different substrate types, vegetation conditions, and salinity regimes typical of transitional estuarine environments.
The fish sampling methodology followed the standardized protocols established by the National Institute of Environmental Research (National Institute of Environmental Research (NIER), 2017), validated in previous studies in the NRE (Yoon et al., 2016; Park et al., 2020). The survey sites were categorized into saltwater and freshwater regions, with sampling conducted using multiple gear types to ensure comprehensive coverage of fish assemblages. In saltwater areas, fish were collected using two types of standardized gillnets (12-hour deployment; 4-node: 40 × 40 mm mesh size, length 50 m, height 1.5 m; 12-node: 12 × 12 mm mesh size, length 50 m, height 0.85 m) and fish traps (48-hour deployment; mesh: 15 × 15 mm, width 1.5 m, number of traps: 60) following NIER protocols. In the freshwater areas (sites B–F), surveys were conducted using both active and passive gear types to sample fish in the central and riparian zones. For riparian zones, sampling included scoop nets (4 × 4 mm mesh size; 30-min sampling along a 100 m transect from downstream to upstream) and casting nets (6 × 6 mm mesh size; 10 casts per survey). In the central zones, fixed shore-nets (48-hour deployment; mesh: 4 × 4 mm, height: 2 m, leader net: 20 m, three fish traps attached), the aforementioned gill nets and longline fishing (24-hour deployment; needle length: 16.3 mm, barb length: 9.2 mm, barb width: 8.1 mm, number of needles per basket: 100) were employed. This standardized multi-gear approach, consistent with previous studies in this system (Yoon et al., 2016), ensured comprehensive sampling across different microhabitats and temporal periods.
The collected fish were identified as described by Kim and Park (2002) and then released. The species list was classified by Nelson (2006). However, non-indigenous species such as largemouth bass (Micropterus salmoides) and bluegill (Lepomis macrochirus) were not released, as required by regulations by the Act on the Conservation and Use of Biological Diversity (Act No. 14513, Dec. 27, 2016, Ministry of the Environment). Fish were classified based on historical records of their geographical distribution to assess the impact of barrage operations on different species origins. This classification system included four categories: endemic species (native and found only in South Korea), native species (native but also found in other countries), translocated species (introduced from other basins within South Korea) and non-indigenous species (introduced from other countries) (Kim and Park, 2002). Additionally, fish were classified according to their habitat characteristics by referring to FishBase to understand species-specific responses to salinity changes (see FishBase: http://www.fishbase.org/search.php). Morphological parameters (length ± 0.1 cm, weight ± 0.1 g) of the collected fish were measured immediately after capture.
2.3 Water quality measurements and data collection
We measured water quality variables to quantify environmental changes associated with barrage operations and establish the relationship between physical-chemical conditions and fish community responses. These measurements included. We measured water quality variables during daytime (09:00-12:00) in connection with the fish samplings, including water temperature, dissolved oxygen (DO), biological oxygen demand (BOD) and surface water conductivity. At each site, salinity was measured in upper (surface water), middle and bottom water based on the maximum water depth. Additionally, we collected water samples (2 L at 0.5 m depth) from the fish sampling site to determine total nitrogen (TN), total phosphorus (TP), CP and OP in the NRE. A DO meter (YSI Model 58, USA) was used to measure water temperature and DO, and conductivity and salinity were measured using a conductivity meter (YSI model 152; Yellow Springs Instruments, Yellow Springs, OH, USA). TP was determined as molybdate reactive phosphorus (Murphy and Riley, 1962) following persulfate digestion (Koroleff, 1970), and TN was determined as nitrite after potassium persulfate digestion (Solorzano and Sharp, 1980). Water quality data for 2021 that could not be measured during the same period were collected from reports (Water Resources Management Information System (WAMIS), 2023).
2.4 Self-organizing map analysis with sampling data during CP and OP in the NRE
Self-organizing map (SOM) analysis was performed to compare the patterns of CP and OP fish sampling data in the NRE. A SOM is an algorithm that reduces data dimensionality (Kohonen, 1989). The Kohonen network is a competitive network system in which neurones in a Euclidean map space compete. The SOM training was performed using a series of fish sampling data obtained from each site. A detailed description of the SOM modelling analysis is provided in the Methods section of the appendix. In total, 162 data samples (CP 67 and OP 95) were collected for each variable. There are no strict rules regarding the number of output neurones that should be obtained (Park et al., 2007); therefore, we trained the SOM with different map sizes to choose a suitable model. A batch-learning algorithm was used. After training, the data were clustered according to the calculated U-matrix, which provided the dissimilarity between the data samples on the map plane. Clustering mostly focused on organizing distribution patterns into clusters based on (1) different discrete series of species at the sites and (2) CP and OP in the NRE. Matlab 6.1 and a SOM coding solution based on the SOM Toolbox for MATLAB (Vesanto et al., 2000) were used to develop the SOM model. Through the above SOM analysis, the clustered nodes were compared with a dendrogram, leading to the division of the clusters into five groups. These separated clusters were considered fish ecological characteristic types by comparison with the clustering results of each fish species (Cluster 1: freshwater (benthopelagic), Cluster 2: marine, Cluster 3: freshwater (demersal), Cluster 4: non- indigenous, Cluster 5: brackish; Figure 2; Supplementary Figure S2). Additionally, the number of nodes within each of the five clusters was tallied, and the distribution ratio was calculated for each study site.
Figure 2
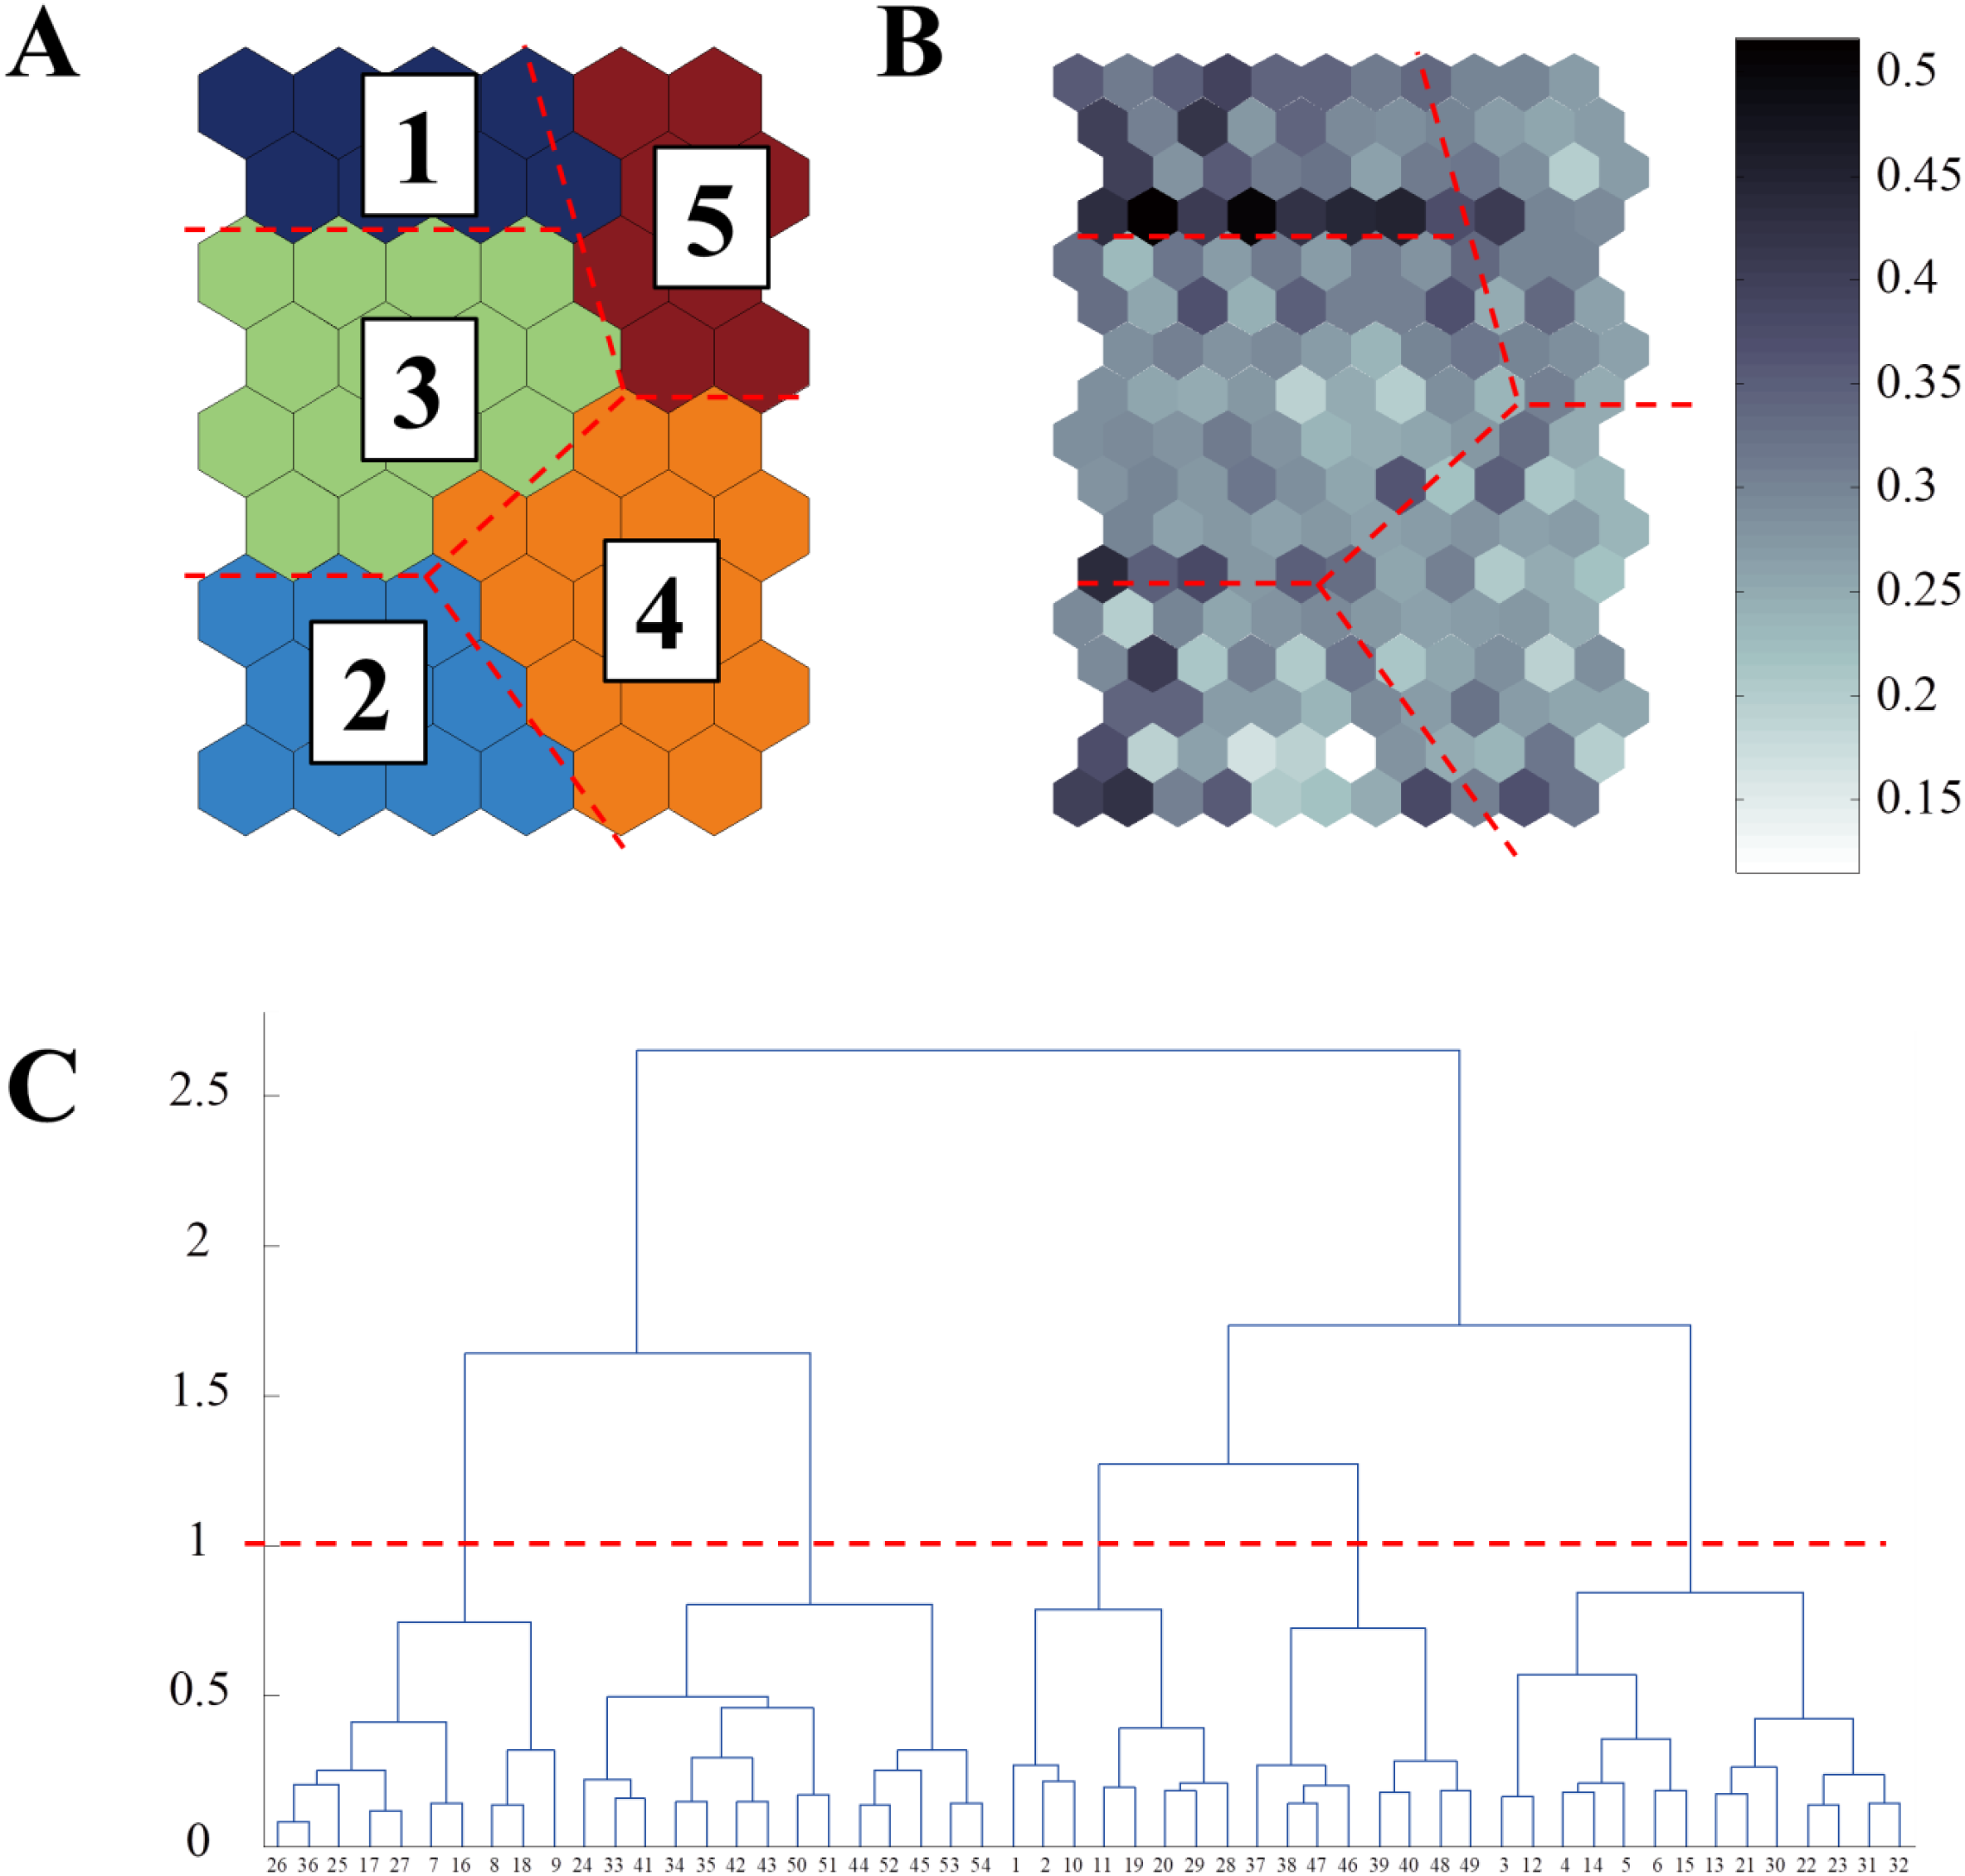
Results of self-organising map (SOM) clustering. (A) Clustering of cells on the map plane by five groups; (B) U-matrix; (C) Dendrogram showing the dissimilarity of cells in the map.
2.5 Data analysis and statistics
We conducted all analyses using individual fish collected from the six study sites designated A–F (Figure 1). In the seawater area, analysis was conducted by combining the three seawater sites into one (Site A) owing to variations in sampling gear, differences in survey site width and the small number of individuals collected. All gear types were deployed simultaneously at each site following standardized protocols, with consistent sampling effort across sites. While different gear types have different catch efficiencies, the concurrent deployment of multiple gear types provides a comprehensive representation of the fish assemblage at each site. This approach has been validated in previous studies of this system (Yoon et al., 2016; Park et al., 2020) and ensures that sampling bias remains consistent across all sites, allowing reliable site-to-site comparisons.
The collected fish were categorized into five types based on their ecological characteristics: freshwater (benthopelagic and demersal), non-indigenous, brackish and marine species. To assess the impact of CP and OP on the NRE, the collection rate was examined according to the study site (from site A to site F) where the samples were collected. The number of individuals collected in each period (individual numbers/sample) was divided by the total number of samples to standardize the collection rates of CP and OP in the NRE.
The data were analyzed using SPSS software version 19. Water quality data, including salinity, were categorized into CP and OP groups for the six study sites, and significance was assessed through an independent t-test. An independent SPSS t-test was used to compare the means of water temperature, dissolved oxygen, biological oxygen demand, total nitrogen, total phosphorus, and conductivity between CP and OP. A significance level of P < 0.05 was applied in all analyses. To account for multiple comparisons across different variables and sites, Bonferroni correction was applied to adjust p-values, with statistical significance maintained at α = 0.05.
3 Results
3.1 Change in water quality CP and OP in NRE
We observed increased salinity with depth during the OP from site B to site D (upstream of the dam) (Table 1; P < 0.05). The seawater sites showed no significant differences in salinity at any depth during either CP or OP. At site B, salinity increased at all depths during the OP (P < 0.05), whereas at sites C and D salinity increased at all depths (P < 0.05) except for the bottom layer.
Table 1
| Sites | Depth | Closing period (n= 12) | Opening period (n= 15) | ||||||||
|---|---|---|---|---|---|---|---|---|---|---|---|
| Mean | Standard deviation | Standard error | Min. | Max. | Mean | Standard deviation | Standard error | Min. | Max. | ||
| A | Upper | 15.94 | 1.20 | 6.03 | 13.37 | 17.24 | 19.74 | 4.85 | 5.10 | 12.13 | 28.82 |
| Middle | 19.57 | 1.55 | 7.40 | 18.69 | 22.38 | 23.20 | 6.32 | 5.99 | 14.08 | 32.93 | |
| Bottom | 16.08 | 5.47 | 6.08 | 12.90 | 25.08 | 21.20 | 9.47 | 5.47 | 8.50 | 35.24 | |
| B | Upper * | 0.11 | 0.02 | 0.04 | 0.10 | 0.16 | 0.23 | 0.14 | 0.06 | 0.10 | 0.52 |
| Middle * | 0.11 | 0.03 | 0.04 | 0.10 | 0.17 | 0.23 | 0.13 | 0.06 | 0.10 | 0.52 | |
| Bottom * | 0.11 | 0.03 | 0.04 | 0.10 | 0.17 | 0.25 | 0.13 | 0.07 | 0.10 | 0.52 | |
| C | Upper * | 0.11 | 0.02 | 0.04 | 0.10 | 0.15 | 0.18 | 0.09 | 0.05 | 0.08 | 0.35 |
| Middle * | 0.11 | 0.02 | 0.04 | 0.10 | 0.15 | 0.20 | 0.10 | 0.05 | 0.08 | 0.35 | |
| Bottom | 0.11 | 0.02 | 0.04 | 0.10 | 0.15 | 0.15 | 0.08 | 0.04 | 0.08 | 0.34 | |
| D | Upper * | 0.11 | 0.02 | 0.04 | 0.10 | 0.15 | 0.16 | 0.06 | 0.04 | 0.08 | 0.28 |
| Middle * | 0.11 | 0.02 | 0.04 | 0.10 | 0.15 | 0.17 | 0.07 | 0.04 | 0.08 | 0.29 | |
| Bottom | 0.11 | 0.02 | 0.04 | 0.10 | 0.15 | 0.14 | 0.05 | 0.04 | 0.08 | 0.24 | |
| E | Upper | 0.11 | 0.02 | 0.04 | 0.10 | 0.15 | 0.15 | 0.05 | 0.04 | 0.08 | 0.24 |
| Middle | 0.11 | 0.02 | 0.04 | 0.10 | 0.15 | 0.14 | 0.04 | 0.04 | 0.08 | 0.20 | |
| Bottom | 0.11 | 0.02 | 0.04 | 0.10 | 0.16 | 0.13 | 0.03 | 0.04 | 0.09 | 0.17 | |
| F | Upper | 0.11 | 0.02 | 0.04 | 0.10 | 0.15 | 0.13 | 0.05 | 0.03 | 0.09 | 0.25 |
| Middle | 0.11 | 0.02 | 0.04 | 0.10 | 0.15 | 0.14 | 0.05 | 0.03 | 0.09 | 0.25 | |
| Bottom | 0.11 | 0.02 | 0.04 | 0.10 | 0.15 | 0.11 | 0.02 | 0.03 | 0.09 | 0.16 | |
Comparison of salinity values (psu) in upper, middle, and bottom waters during the closing and opening periods of the NRE.
Bold characters indicate significant p-values; *p < 0.05.
Water quality exhibited significant differences in DO, TN and conductivity values between CP and OP, whereas other water quality variables (water temperature, BOD and TP) did not change (Supplementary Table S4). Specifically, DO values were significantly different at site B (P= 0.029) and TN from sites B to E (B: P = 0.001; C: P = 0.001; D: P = 0.001; E: P = 0.001).
A noticeable difference in conductivity, indicative of salinity inflow, was observed in the OP. Conductivity increased significantly at sites A and C (A: P = 0.001; B: P = 0.017; C: P = 0.017). Although water temperature and BOD showed no statistically significant differences, they remained relatively lower than those of CP. DO, which was closely related to water temperature, exhibited an inverse relationship and tended to increase in OP.
3.2 Clustering of data on fish individuals according to ecological characteristics
Based on the fish data, the best SOM model consisted of 54 output neurones arranged in nine rows and six columns, and the training results were satisfactory (quantization error, 0.982; topographic error, 0.043) (Figure 2). The U-matrix generated from the trained model provided five clusters (Figure 2B). The map characteristics were determined by comparing the changing patterns of the input variables on the map (Supplementary Figure S2). Each cluster was divided into five sample sets according to the ecological characteristics: freshwater (benthopelagic) (cluster 1: upper left; blue), marine (cluster 2: lower left; sky-blue), freshwater (demersal) (cluster 3: middle left; green), non-indigenous (cluster 4: lower right; orange) and brackish (cluster 5: upper right; red) segments (Figure 2A; Supplementary Figure S2).
Examination of the distribution characteristics of each cluster revealed that freshwater species were primarily found in the middle and upper parts of the NRE sites (Figure 3). Non-indigenous species were distributed in the middle, whereas brackish species were mainly found in the seawater and the upper parts of the NRE sites (Figure 3). Marine species were predominantly distributed at sites A and B, adjacent to the seawater, with some being present even in the upper part of the NRE (site F) (Figure 3). When analyzing the monthly frequency of fish collected for each cluster, freshwater species were mainly collected in October, whereas non-indigenous species were predominantly observed from September to November (Figure 4). Brackish species were predominantly collected in July, while marine species were mainly collected in November (Figure 4).
Figure 3
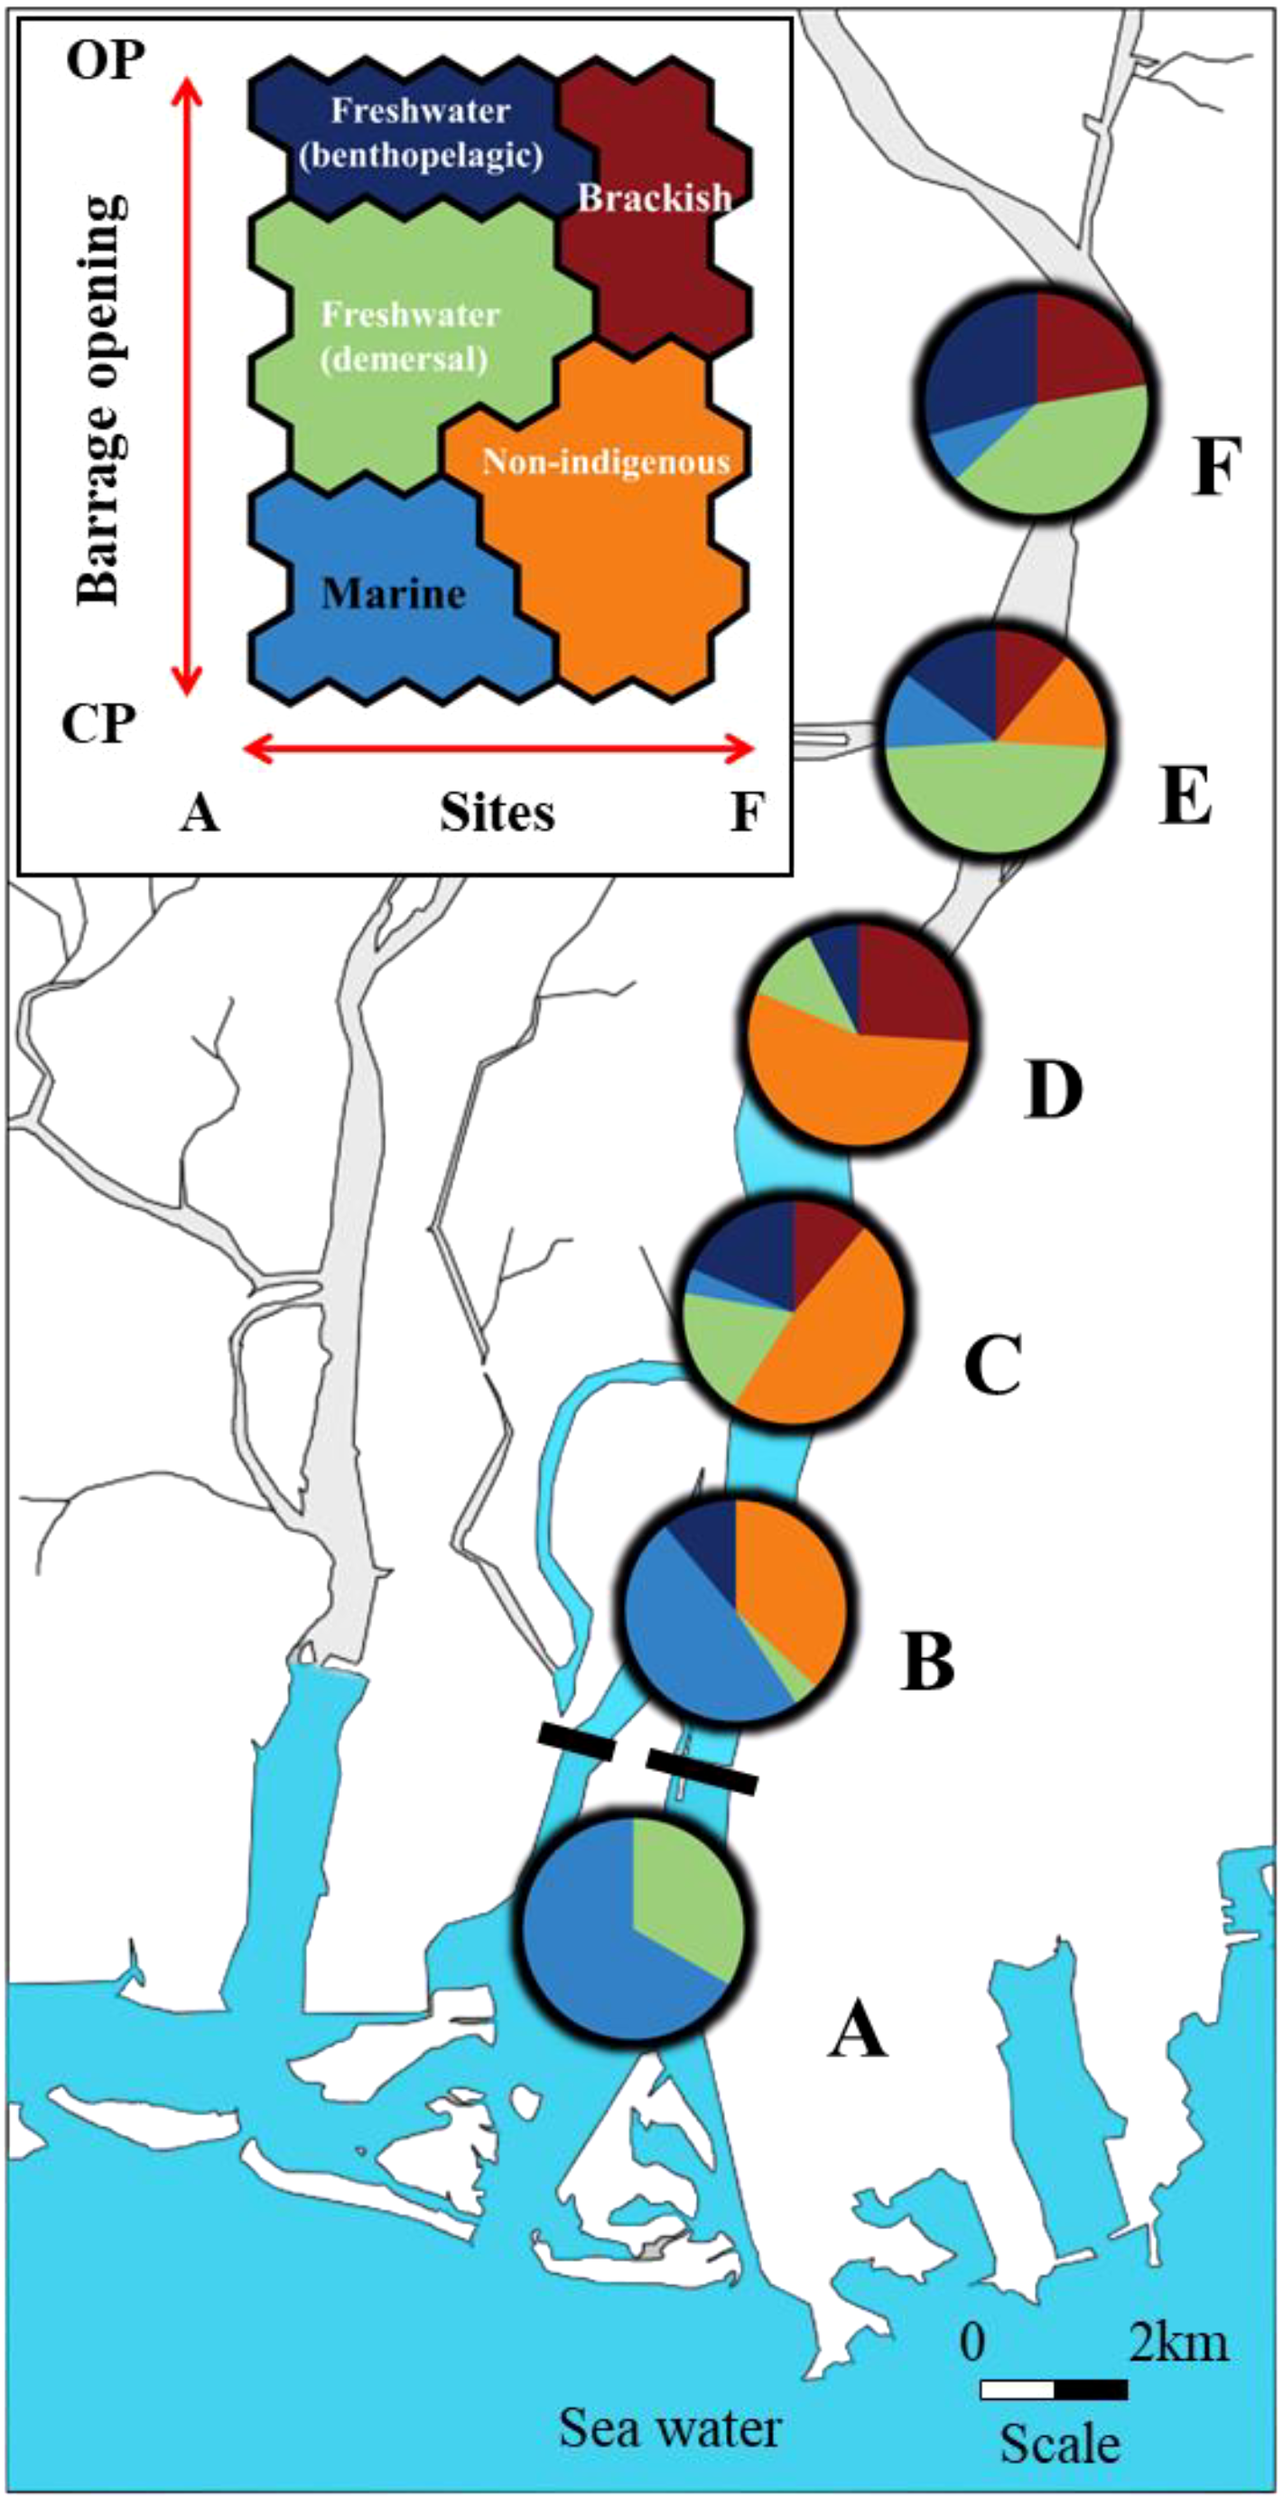
Distribution of individual fish SOM data in terms of spatial changes. (A) denotes the seawater study site, and (B–F) are the study sites based on their distances from the NRE. Each colour represents the concentrated clustering proportion corresponding to the species type. Blue, freshwater (benthopelagic); green, freshwater (demersal); orange, non-indigenous; red, brackish; sky blue, marine.
Figure 4
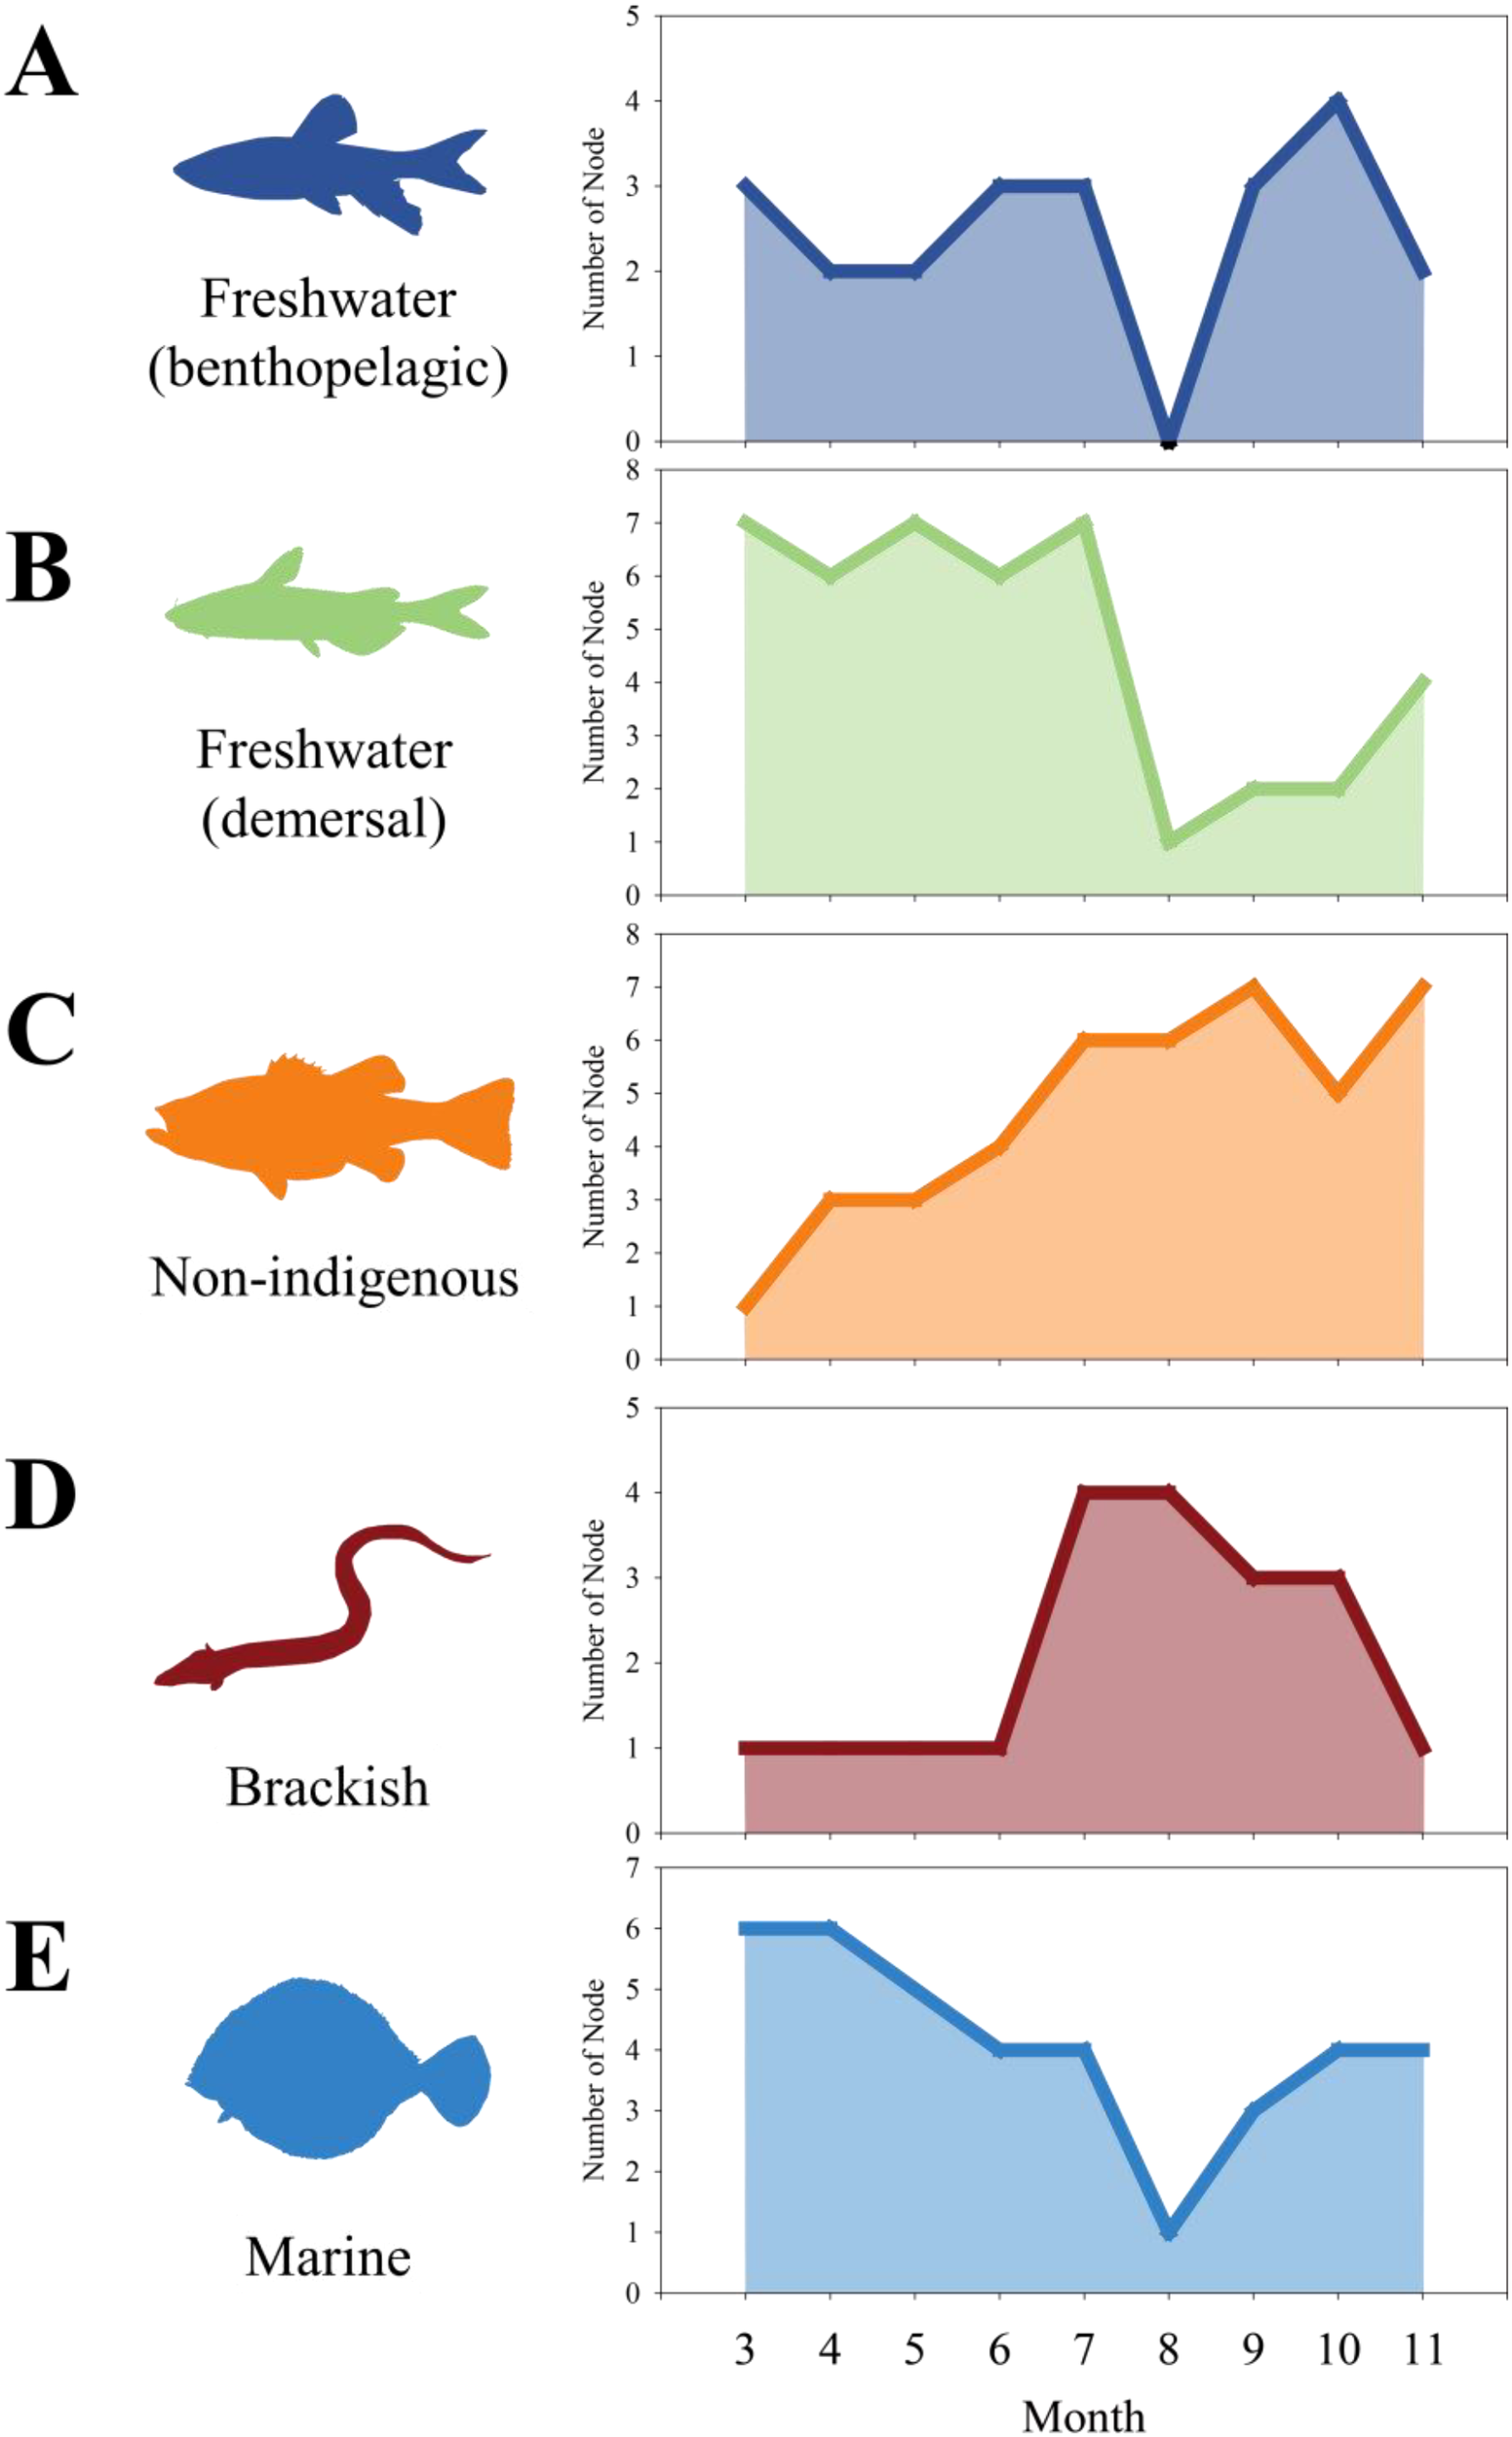
Monthly distribution of individual fish data based on the self-organising map analysis. (A) freshwater (benthopelagic); (B) freshwater (demersal); (C) non-indigenous; (D) brackish; (E) marine.
3.3 Clustering of the study sites CP and OP in NRE
When comparing the collected fish frequency of each cluster in CP and OP, we observed changes in the distribution pattern following re-opening (Figure 5). Freshwater (benthopelagic) species were distributed only at sites D, E and F during CP but occurred at all freshwater sites (B-F) during OP. In CP, freshwater (demersal) species were distributed from site C to site F. However, in OP, these species were primarily found at sites E and F (Figure 5). Non-indigenous species, dominant at sites B and D (> 50% in CP), were concentrated at site D in OP. Brackish species, initially distributed from the middle part (site C) to the end part (site F) during CP, primarily inhabited the middle area (site D) during OP. Marine species, predominantly distributed in saltwater areas (site A), showed an expanded distribution range to include freshwater areas E during OP. When comparing the abundance of fish species to each ecological characteristic in CP and OP, the contribution of brackish species tended to increase during OP, while other species showed a decreasing tendency (Figure 5). Overall, the abundance of both freshwater and marine species decreased in OP. The abundances of the non-indigenous species M. salmoides and L. macrochirus the abundance tended to decrease in the OP, whereas Erythroculter erythropterus showed increased abundance at sites B and C. Anguilla japonica, a brackish species, was concentrated at sites C and D during OP and showed increasing abundance. Plecoglossus altivelis, not collected in CP, occurred from sites C to F during OP. The distribution area of Rhinogobius giurinus expanded from sites B to F during OP, and abundance also increased (Table 2).
Figure 5
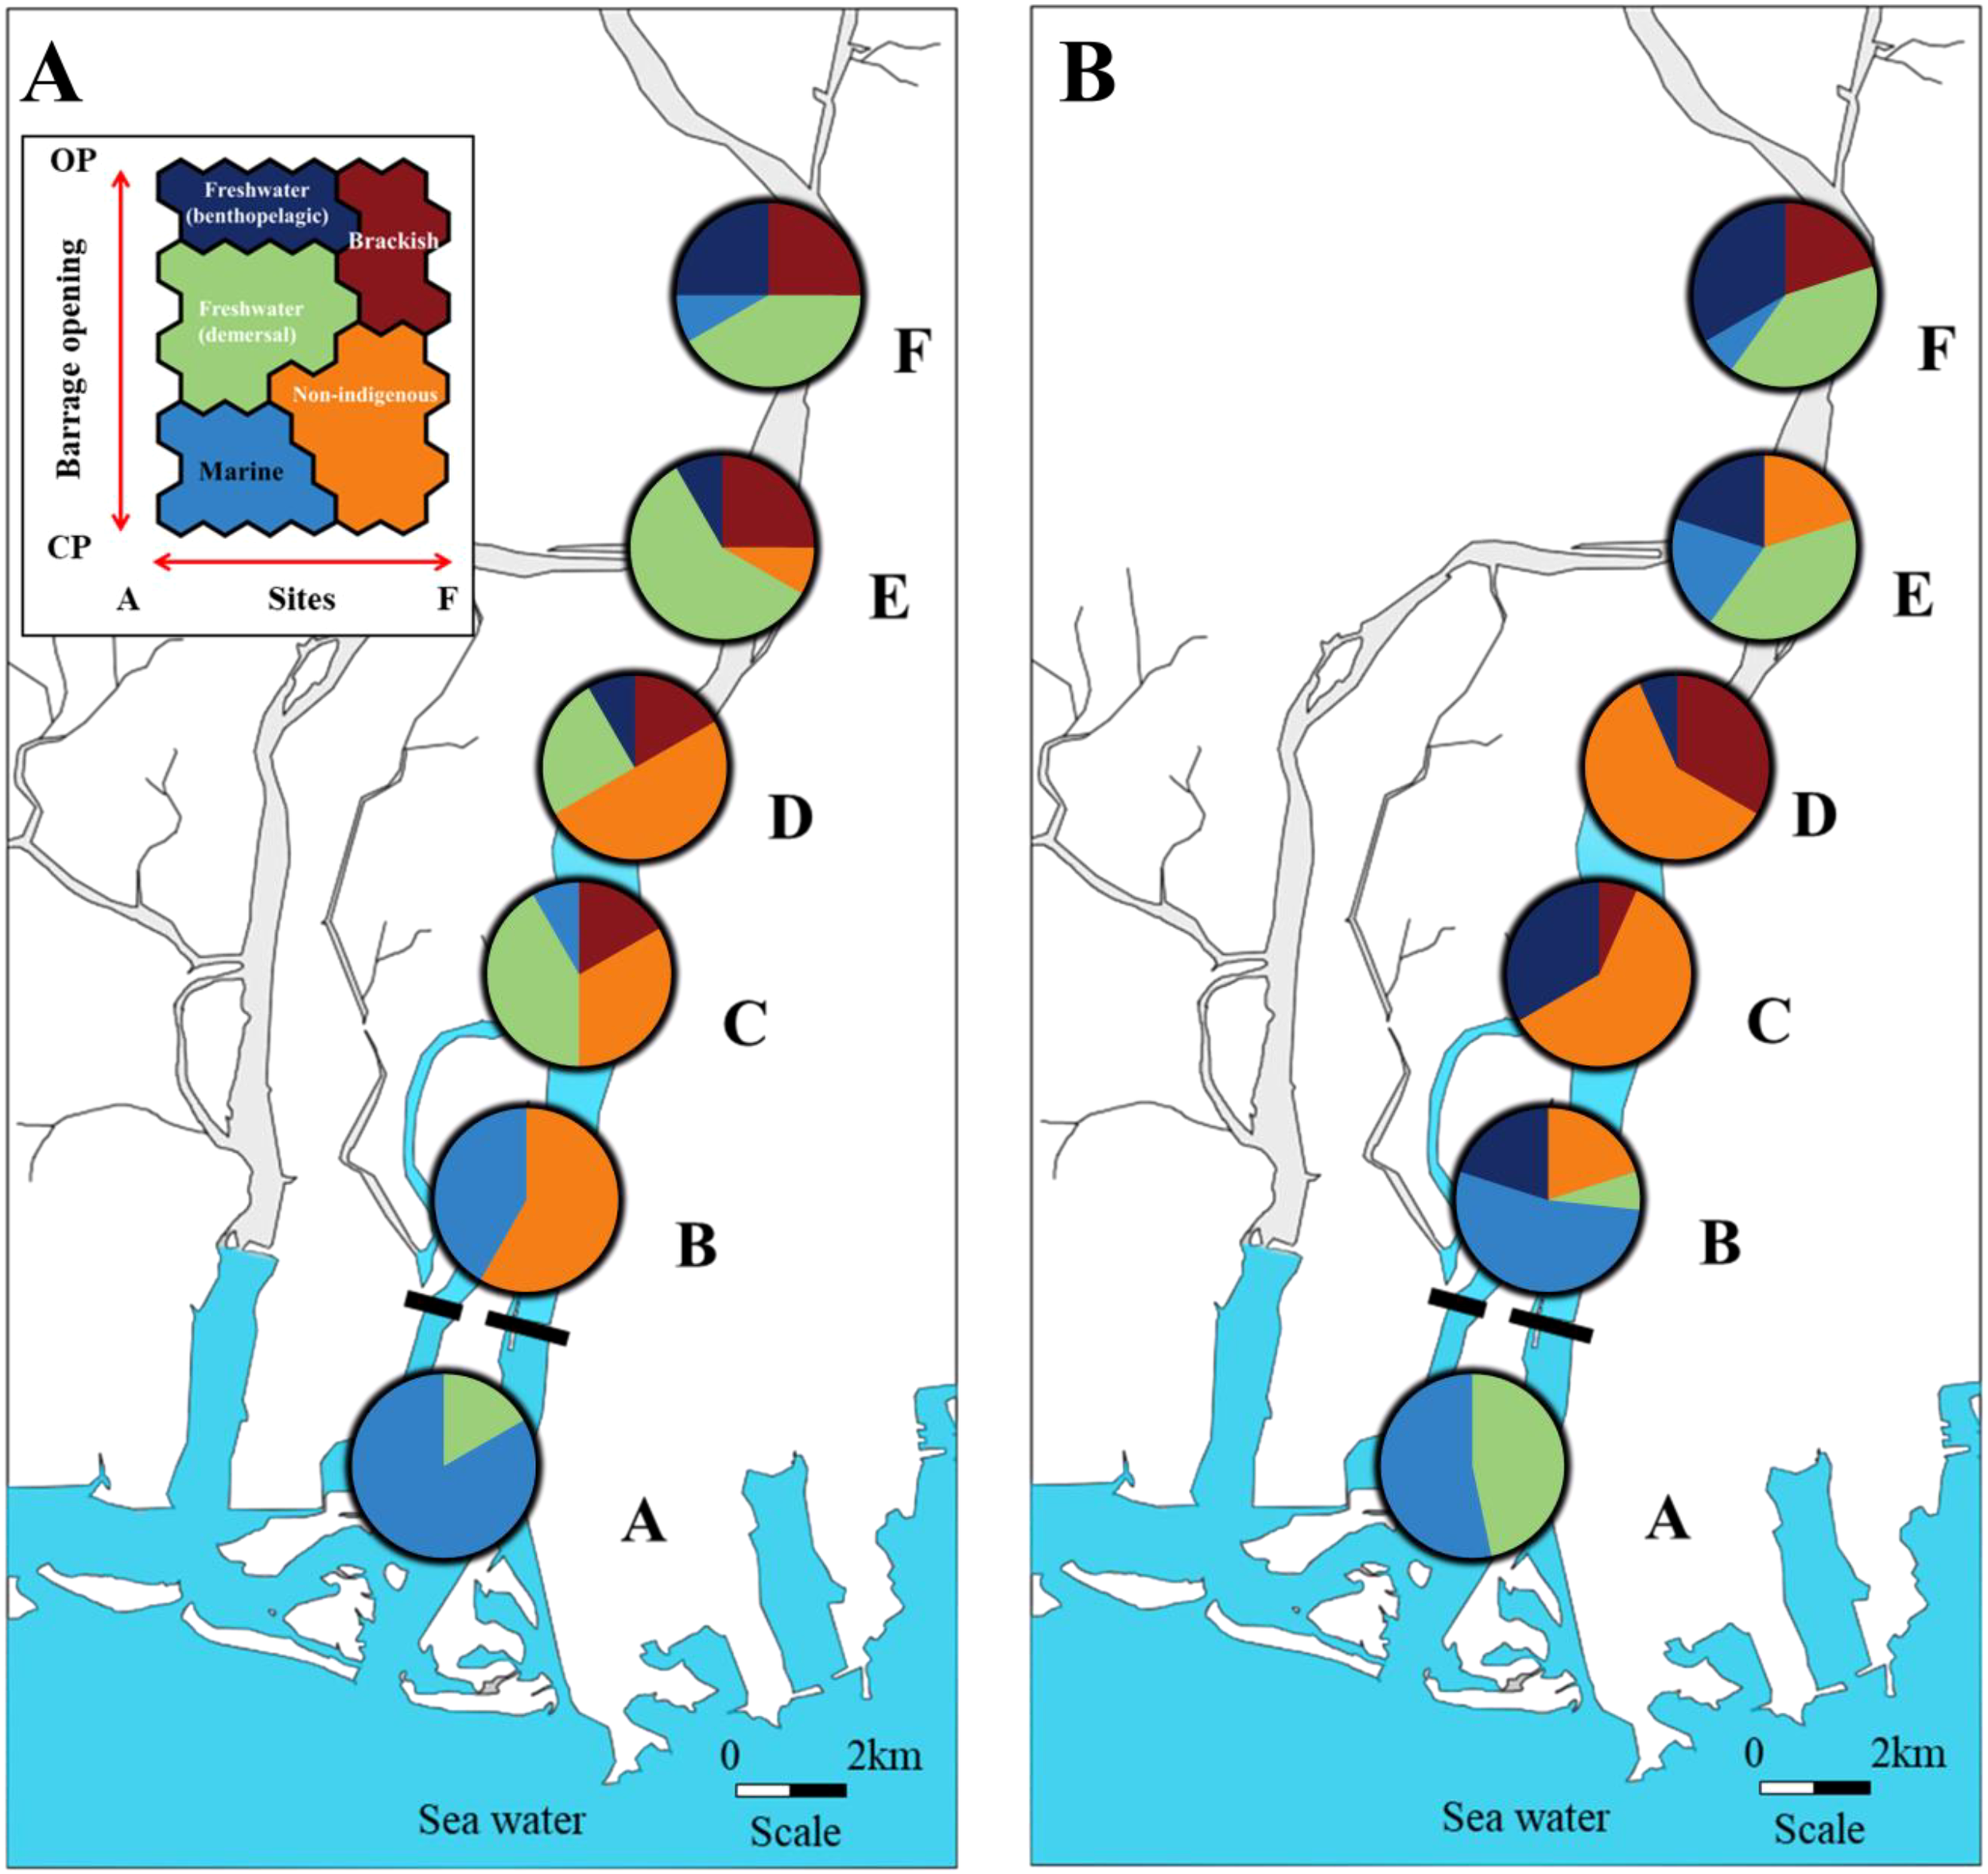
Distribution of individual fish data on the self-organising map depicting spatiotemporal changes in CP (A) and OP (B) in the NRE. (A) denotes the seawater study site, and (B–F) correspond to the study sites based on their distances from the NRE. Each colour represents the concentrated clustering proportion corresponding to the species type. Blue: freshwater (benthopelagic); green: freshwater (demersal); orange: non-indigenous; red: brackish; sky blue: marine.
Table 2
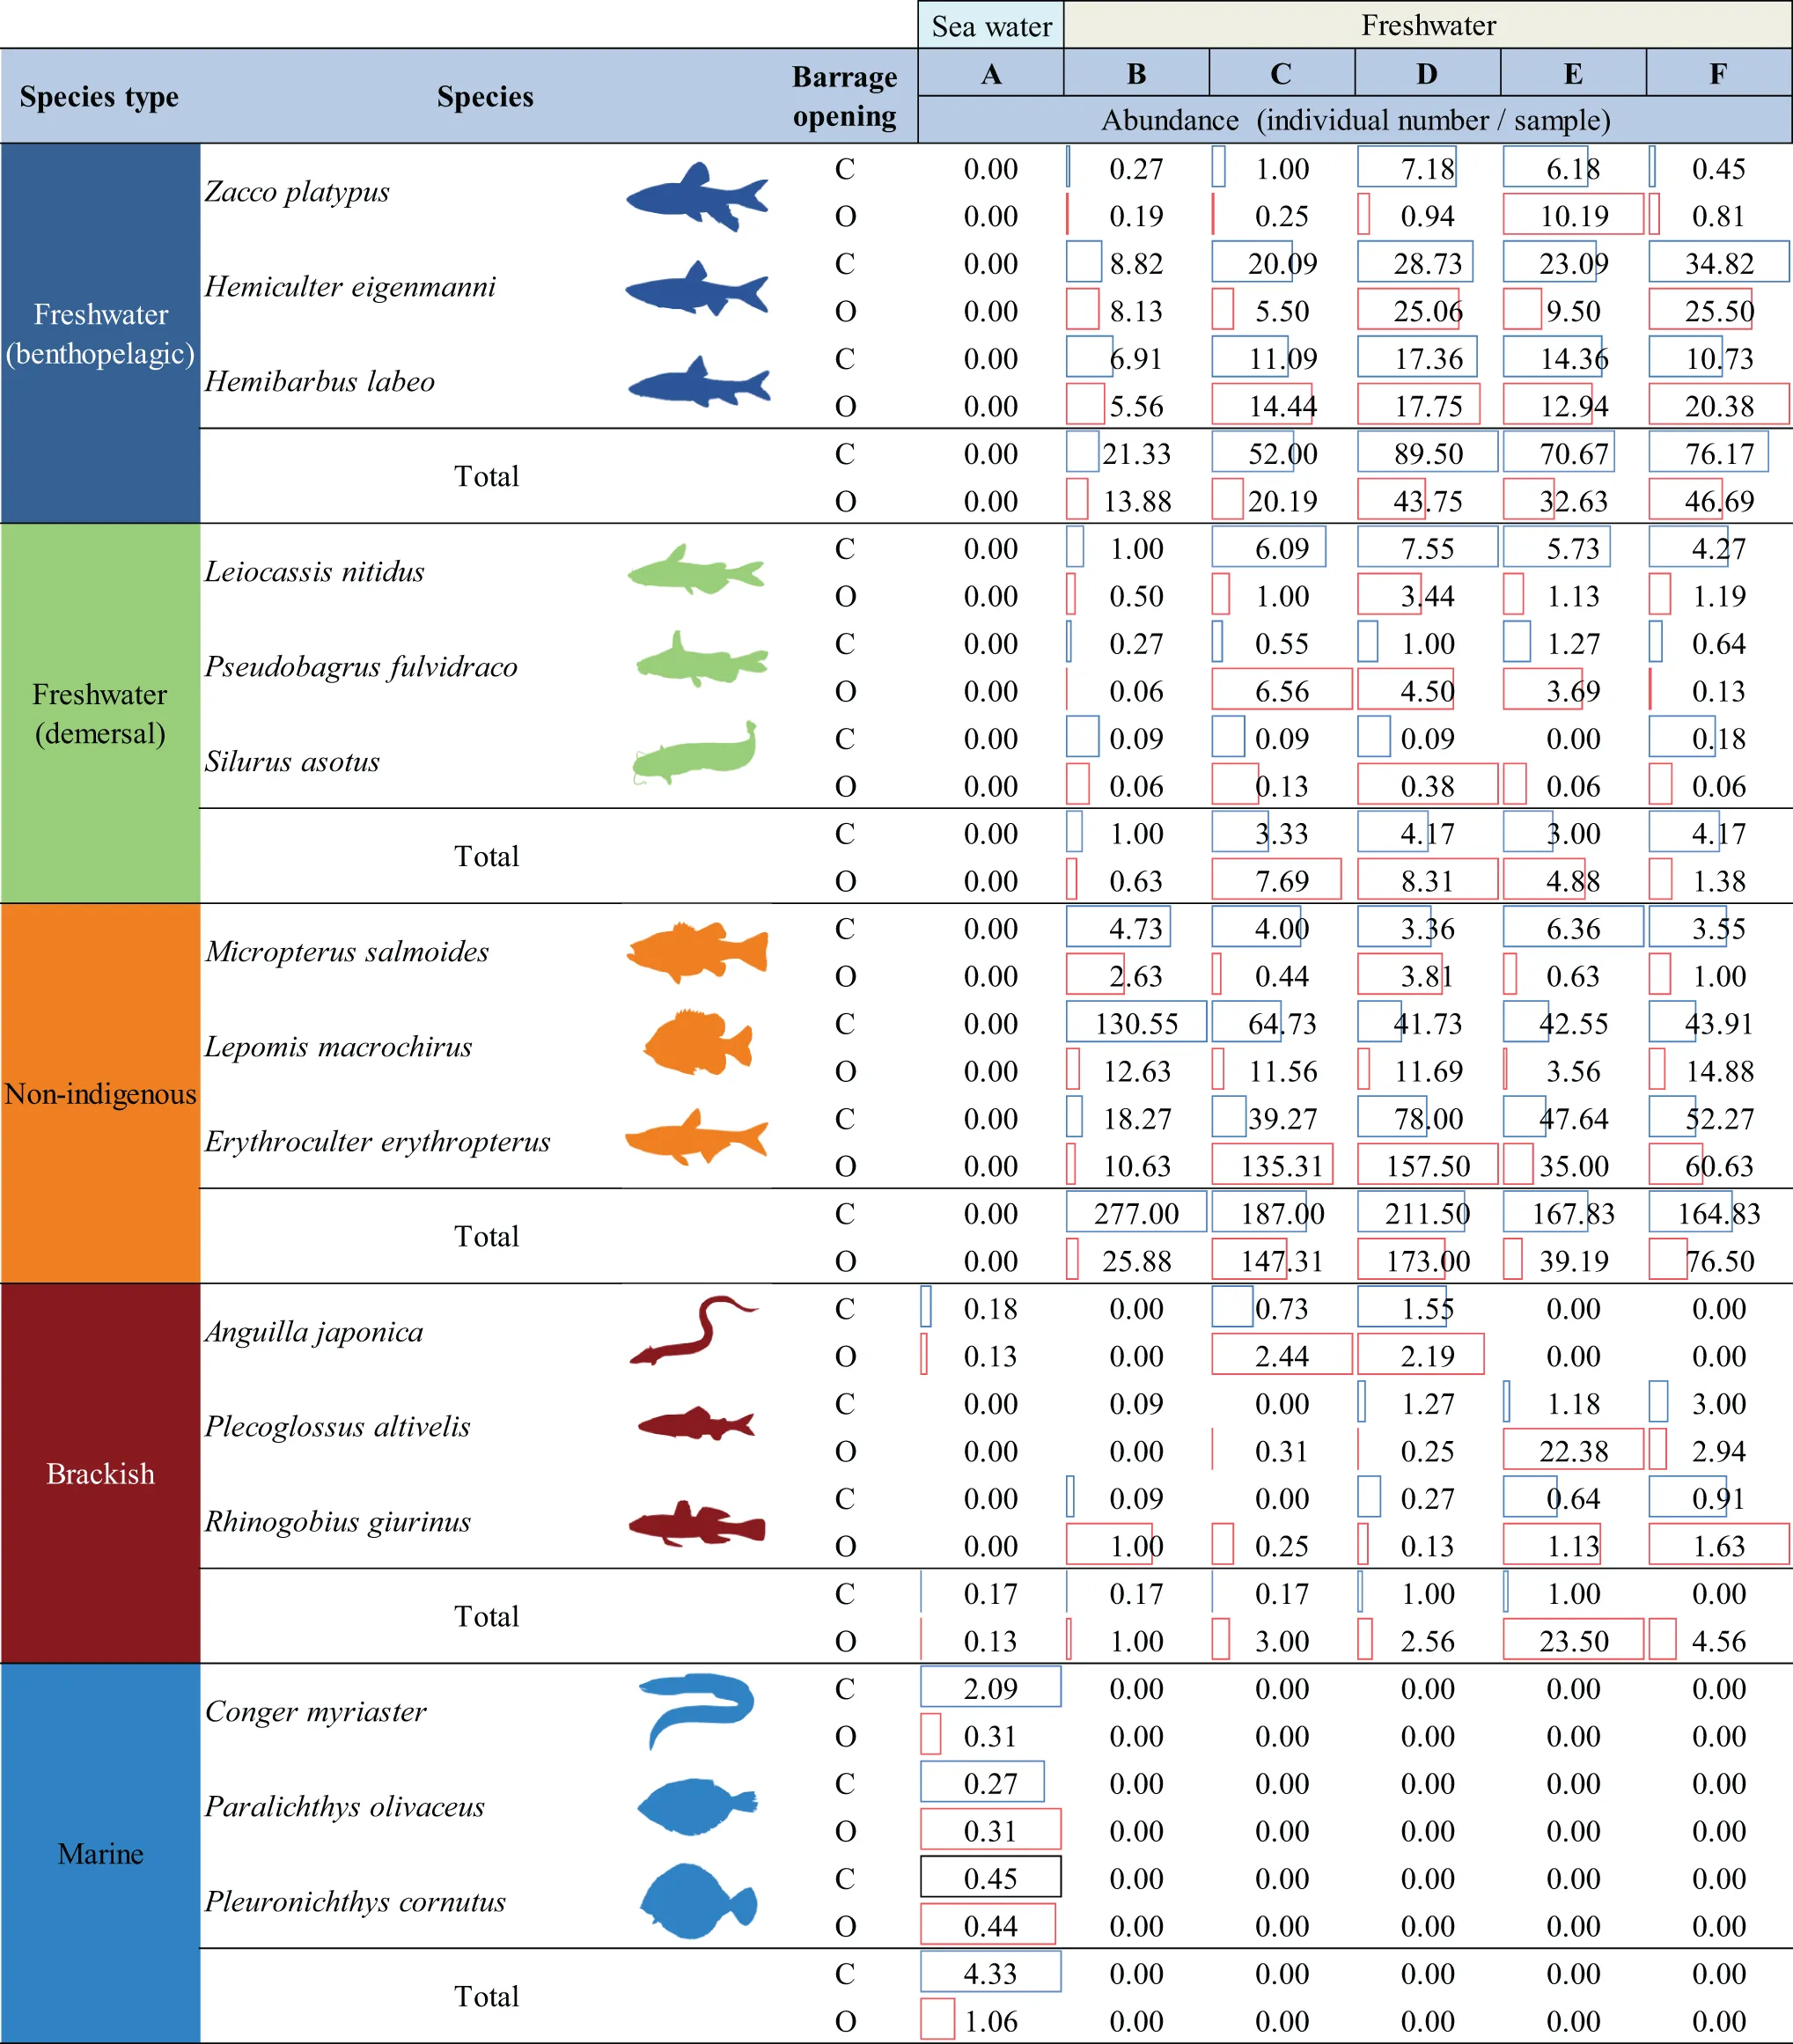
|
Comparison of changes in the abundance and spatial distribution of CP (C) and OP (O) fish species in the NRE.
Colors represent different species types: blue (freshwater benthopelagic), green (freshwater demersal), orange (non-indigenous), red (brackish), light blue (marine).
4 Discussion
Our results provide evidence that temporary opening of the NRE caused significant alterations in fish population structure. Previous studies have typically observed an increase in the abundance of brackish species with the complete opening of estuarine barrages (Poulos and Chernoff, 2017; Hansen et al., 2023). Surprisingly, our results indicated that the abundance of brackish species increased even with the temporary opening of NRE (Table 2). Additionally, we noted a reduction in the distribution range of freshwater (demersal) species and a decline in the abundance of non-indigenous species (Table 2; Figure 5).
4.1 Changes in fish population structures during the CP and OP of the NRE
We found that the temporary salt intrusion extended up to 5 km from the NRE (site D; Table 1), and the subsequent changes led to an expansion of the distribution area and increased abundance of brackish species, a shift in the distribution area of non-indigenous species and a decline in non-indigenous species abundance (Table 2; Figure 5).
Brackish species, which prefer high salinity environments (Franco et al., 2019), experienced an increased distribution range and population as salinity expanded during the OP in our study area. Previous studies involving complete dam removal have shown an increase in brackish species, including Anguillidae, which thrive at high salinity (Edeline et al., 2005; Foley et al., 2017; Fukuda et al., 2019). We observed an increase in A. japonica, exhibiting migratory behavior, during the OP (Table 2). Conversely, the occurrence frequency of freshwater (demersal) species decreased during the same period (Figure 4). While freshwater fish species typically exhibit salt avoidance behavior (Zhou et al., 2022), demersal species seem less capable of swimming and did not avoid temporary salt intrusion as effectively as benthopelagic species (Kim et al., 2001; Leis et al., 2009). In particular, Leiocassis nitidus, known for feeding in the lower depth layer (Kim et al., 2001), may have been hampered by the salinity increase here during the OP. An increase in the population and occurrence frequency of brackish fish species was observed during the OP. Opening estuary barrages during the migration period of brackish species to facilitate their migration may enhance fish diversity in estuarine ecosystems (Tamario et al., 2019). Therefore, we propose that opening the estuary barrage during the migration period of brackish fish species is a viable approach to enhance fish diversity in estuarine ecosystems.
Non-indigenous species generally exhibited similar behavioral patterns to freshwater species, demonstrating salt avoidance. Our results showed salt intrusion up to 5 km from the NRE, suggesting that the decline in non-indigenous species may be linked to salinity avoidance behavior. Since most freshwater fish demonstrate such behavior (James et al., 2003; Kumar et al., 2018), the non-indigenous species in our study experienced population declines and distribution shifts upstream during the OP. Our results also revealed a decrease in the contribution of some non-indigenous species (e.g., M. salmoides and L. macrochirus) but not for the entire non-indigenous community. In contrast to other non-indigenous species, E. erythropterus was not affected; instead, its contribution increased during the OP. Some previous studies reported that non-indigenous fish species initially move to areas with relatively low salinity to avoid salty conditions but eventually adapted (Schofield et al., 2006; Capps et al., 2011; Nepal and Fabrizio, 2019). Therefore, it appears that E. erythropterus adapted to salinity and did not exhibit avoidance behavior. In a study of avoidance behavior of M. salmoides, Meador and Kelso (1990) reported a significant decrease in growth rate with increasing salinity, while all died at 12‰. In our study area, salt intrusion reached 1‰ near 3 km from the NRE (Supplementary Table S4), and the maximum salinity value reached up to 9‰ during the longest sluice opening of NRE (Figure 1). These increases are sufficient to trigger avoidance behavior in M. salmoides during the OP. Therefore, temporary salinity intrusion during the OP may create shifts in the contribution of the different non-indigenous species.
4.2 Suggestions for the NRE barrage re-opening management protocol for restoration of the estuarine ecosystem
Given the multiple functions of estuary barrages, complete opening or removal presents significant challenges (Burt and Rees, 2001; Kidd et al., 2015). Therefore, we propose a strategy of estuarine restoration by optimizing temporary sluice openings. Our results show a relatively low occurrence frequency of brackish species from February to April (Figure 4), coinciding with the migration period of brackish species (A. japonica: Cheng and Tzeng, 1996; Tsukamoto, 2006; P. altivelis: Aritomi et al., 2017; Hyporhamphus sajori: Yu et al., 2016). Therefore, future research should examine the effects of implementing regular monthly sluice operations during the peak migration period (February to April) for brackish water species. Based on previous studies of estuarine restoration (Montagna et al., 2022) and controlled flow management in similar systems (Gardner et al., 2016), a systematic monitoring program could evaluate fish responses to different opening frequencies and durations. Such research could assess how regular opening patterns influence the formation and persistence of estuarine conditions, potentially enhancing fish species diversity through extended periods of habitat availability for brackish species. Our study demonstrated that partial sluice operation (one of 10 sluices) can help control non-indigenous species, with potential for more effective management through multiple sluice operations. However, managing salt intrusion requires careful balance of multiple stakeholder needs. Our results demonstrated that while increased saltwater intrusion can help control non-indigenous species, it can adversely affect salt-sensitive native species like L. nitidus. In monsoon-affected estuarine ecosystems with 5th-9th order streams, uncontrolled salt intrusion can extend approximately 50 km upstream (Post, 1984). This presents significant management challenges as salinity levels above 0.3‰ can impact drinking water quality and industrial use (Kim et al., 2018), while agricultural activities require freshwater conditions (Ha et al., 2003).
Based on successful management approaches in similar systems (Weng et al., 2020; Kwak et al., 2023), we propose an adaptive management framework for the NRE. The opening and closing of sluice gates should ideally mimic natural patterns of seasonal freshwater flows to maintain salinity variations as close as possible to historical estuarine conditions. Our proposed spring opening schedule (March-May) aligns with natural peak flow periods and fish migration timing, representing an approach that works with rather than against natural hydrological cycles. Deviations from natural flow patterns should only be considered under specific, well-justified management scenarios, such as extreme drought or flood events that require adaptive responses to protect both ecological integrity and human water security. A comprehensive monitoring program should be established to track native species distributions and their salt tolerance thresholds throughout the system. This monitoring would inform the development of specific salinity targets that optimize ecological benefits while protecting stakeholder water needs. The sluice operation protocols should be designed with sufficient flexibility to respond to seasonal variations and monitoring results, allowing adjustments based on both environmental conditions and species responses. Additionally, implementing an early warning system for critical salinity thresholds would enable proactive management responses to protect both ecological and human water use requirements. This integrated approach would allow for dynamic management of salt intrusion while maintaining the balance between ecosystem restoration and essential water uses.
To enhance the system’s resilience to environmental changes, this adaptive framework should also incorporate contingency plans for extreme scenarios (Weng et al., 2020). During prolonged drought events, the sluice operation protocol may need to prioritize maintaining minimum freshwater flows while implementing more frequent but shorter duration openings to manage salt intrusion (Adams, 2014). Conversely, during extreme rainfall events, extended barrage openings may be necessary to prevent flooding while monitoring salinity impacts on estuarine species (Kim et al., 2021). Long-term climate change scenarios, such as sea level rise and altered precipitation patterns, will require periodic reassessment of salinity targets and operational protocols (Peirson et al., 2015). These adjustments might include modifications to opening durations, frequencies and timing to maintain ecological functions under changing environmental conditions (Birnie-Gauvin et al., 2017).
5 Conclusions
Our results demonstrated notable changes in the fish population structures during OP in an estuarine ecosystem. Based on our findings, we recommend opening the sluice gates during spring (March-May) for periods of 3–4 weeks to coincide with the peak migration period of brackish species, particularly A. japonica (Japanese eel). The opening regime should aim to achieve salinity levels up to 9‰ at a site approximately 3 km adjacent to NRE (site B). Our data showed that this regime effectively reduced non-indigenous freshwater species abundance (37.2%) while increasing brackish species presence by 86.6%. While previous studies have established general relationships between salinity and fish distribution, our findings quantify the effectiveness of controlled, short-term openings in NRE, demonstrating that even brief salt intrusion episodes can significantly alter community composition. Our results provides managers with a practical, time-bounded approach for achieving desired ecological outcomes in regulated estuaries. Future research should focus on optimizing opening durations and frequencies across different seasons to develop a comprehensive year-round management strategy.
Statements
Data availability statement
The raw data supporting the conclusions of this article will be made available by the authors, without undue reservation.
Ethics statement
The animal study was approved by Institute Review Board, Institutional Biosafety Committee, Institutional Animal Care and Use Committee. The study was conducted in accordance with the local legislation and institutional requirements.
Author contributions
J-SG: Formal Analysis, Investigation, Methodology, Writing – original draft. DH: Investigation, Methodology, Writing – review & editing. G-JJ: Conceptualization, Writing – review & editing. D-KK: Methodology, Writing – review & editing. J-YL: Writing – review & editing, Resources. S-NK: Investigation, Writing – review & editing. K-SJ: Data curation, Writing – review & editing. EJ: Conceptualization, Writing – review & editing. HJ: Conceptualization, Funding acquisition, Investigation, Methodology, Resources, Visualization, Writing – original draft, Writing – review & editing.
Funding
The author(s) declare that financial support was received for the research and/or publication of this article. This study was supported by the National Research Foundation of Korea (NRF) grant funded by the Korean government (MSIT) (RS-2024-00348206). This study was financially supported by the 『2023 Post-Doc Development Program』 of Pusan National University.
Conflict of interest
Authors J-YL was employed by Korea Water Resource Corporation.
Author K-SJ was employed by Ecological Engineering Institute Co. Ltd.
The remaining authors declare that the research was conducted in the absence of any commercial or financial relationships that could be construed as a potential conflict of interest.
Generative AI statement
The author(s) declare that no Generative AI was used in the creation of this manuscript.
Publisher’s note
All claims expressed in this article are solely those of the authors and do not necessarily represent those of their affiliated organizations, or those of the publisher, the editors and the reviewers. Any product that may be evaluated in this article, or claim that may be made by its manufacturer, is not guaranteed or endorsed by the publisher.
Supplementary material
The Supplementary Material for this article can be found online at: https://www.frontiersin.org/articles/10.3389/fmars.2025.1542823/full#supplementary-material
References
1
Abbott B. N. Wallace J. Nicholas D. M. Karim F. Waltham N. J. (2020). Bund removal to re-establish tidal flow, remove aquatic weeds and restore coastal wetland services—North Queensland, Australia. PloS One15, e0217531. doi: 10.1371/journal.pone.0217531
2
Adams J. B. (2014). A review of methods and frameworks used to determine the environmental water requirements of estuaries. Hydrol. Sci. J.59, 451–465. doi: 10.1080/02626667.2013.816426
3
Ahn J. M. Lee S. Kang T. (2014). Evaluation of dams and weirs operating for water resource management of the Geum River. Sci. Total. Environ.478, 103–115. doi: 10.1016/j.scitotenv.2014.01.038
4
Amiri V. Nakagawa K. (2021). Using a linear discriminant analysis (LDA)-based nomenclature system and self-organizing maps (SOM) for spatiotemporal assessment of groundwater quality in a coastal aquifer. J. Hydrol.603, 127082. doi: 10.1016/j.jhydrol.2021.127082
5
Aritomi A. Andou E. Yonezawa T. Kume G. (2017). Monthly occurrence and feeding habits of larval and juvenile Ryukyu-ayu Plecoglossus altivelis ryukyuensis in an estuarine lake and coastal area of the Kawauchi River, Amami-oshima Island, southern Japan. Ichthyol. Res.64, 159–168. doi: 10.1007/s10228-016-0550-7
6
Astel A. Tsakovski S. Barbieri P. Simeonov V. (2007). Comparison of self-organizing maps classification approach with cluster and principal components analysis for large environmental data sets. Water Res.41, 4566–4578. doi: 10.1016/j.watres.2007.06.030
7
Baird I. G. Manorom K. Phenow A. Gaja-Svasti S. (2020). Opening the gates of the Pak Mun Dam: Fish migrations, domestic water supply, irrigation projects and politics. Water Altern.13, 141–159.
8
Baptista J. Martinho F. Dolbeth M. Viegas I. Cabral H. Pardal M. (2010). Effects of freshwater flow on the fish assemblage of the Mondego estuary (Portugal): comparison between drought and non-drought years. Mar. Freshw.61, 490–501. doi: 10.1071/MF09174
9
Barnabe G. Barnabe-Quet R. (2000). Ecology and management of coastal waters: the aquatic environment (Berlin, Germany: Springer Science & Business Media).
10
Bellmore J. R. Pess G. R. Duda J. J. O’Connor J. E. East A. E. Foley M. M. et al . (2019). Conceptualizing ecological responses to dam removal: If you remove it, what’s to come? BioScience69, 26–39. doi: 10.1093/biosci/biy152
11
Birnie-Gauvin K. Tummers J. S. Lucas M. C. Aarestrup K. (2017). Adaptive management in the context of barriers in European freshwater ecosystems. J. Environ. Manage.204, 436–441. doi: 10.1016/j.jenvman.2017.09.023
12
Borja Á. Dauer D. M. Elliott M. Simenstad C. A. (2010). Medium-and long-term recovery of estuarine and coastal ecosystems: patterns, rates and restoration effectiveness. Estuaries. Coast.33, 1249–1260. doi: 10.1007/s12237-010-9347-5
13
Bowman M. (2013). “The Ramsar Convention on Wetlands: has it made a difference?,” in Yearbook of International Cooperation on Environment and Development 2002-03 (Routledge: Routledge), 61–68.
14
Bridgewater P. Kim R. E. (2021). The Ramsar convention on wetlands at 50. Nat. Ecol. Evol.5, 268–270. doi: 10.1038/s41559-021-01392-5
15
Burt N. Rees A. (2001). Guidelines for the assessment and planning of estuarine barrages (London: Thomas Telford).
16
Capps K. A. Nico L. G. Mendoza-Carranza M. Arévalo-Frías W. Ropicki A. J. Heilpern S. A. et al . (2011). Salinity tolerance of non-native suckermouth armoured catfish (Loricariidae: Pterygoplichthys) in south-eastern Mexico: implications for invasion and dispersal. Aquat. Conserv.: Mar. Freshw.21, 528–540. doi: 10.1002/aqc.1210
17
Catalano M. J. Bozek M. A. Pellett T. D. (2007). Effects of dam removal on fish assemblage structure and spatial distributions in the Baraboo River, Wisconsin. N. Am. J. Fish. Manage.27, 519–530. doi: 10.1577/M06-001.1
18
Cheng P. W. Tzeng W. N. (1996). Timing of metamorphosis and estuarine arrival across the dispersal range of the Japanese eel Anguilla japonica. Mar. Ecol. Prog. Ser.131, 87–96. doi: 10.3354/meps131087
19
Choi H. Kim B. Lee G. Noh S. J. (2023). Enhancing Tidal wave predictions for the estuary of the nakdong river using a fixed-lag smoother. Energies16, 237. doi: 10.3390/en16010237
20
Chung M. G. Kang H. (2013). A review of ecosystem service studies: concept, approach and future work in Korea. J. Ecol. Environ.36, 1–9. doi: 10.5141/ecoenv.2013.001
21
Cognetti G. Maltagliati F. (2000). Biodiversity and adaptive mechanisms in brackish water fauna. Mar. pollut. Bull.40, 7–14. doi: 10.1016/S0025-326X(99)00173-3
22
Day J. W. Jr. Yáñez-Arancibia A. Kemp W. M. Crump B. C. (2012). Introduction to estuarine ecology. Estuar. Coast., 1–18. doi: 10.1002/9781118412787
23
Dimitriadis C. Evagelopoulos A. Koutsoubas D. (2012). Functional diversity and redundancy of soft bottom communities in brackish waters areas: local vs regional effects. J. Exp. Mar. Biol. Ecol.426, 53–59. doi: 10.1016/j.jembe.2012.05.016
24
Edeline E. Dufour S. Elie P. (2005). Role of glass eel salinity preference in the control of habitat selection and growth plasticity in Anguilla Anguilla. Mar. Ecol. Prog.304, 191–199. doi: 10.3354/meps304191
25
Elliott M. Burdon D. Hemingway K. L. Apitz S. E. (2007). Estuarine, coastal and marine ecosystem restoration: confusing management and science–a revision of concepts. Estuar. Coast. Shelf. Sci.74, 349–366. doi: 10.1016/j.ecss.2007.05.034
26
Elliott M. Whitfield A. K. (2011). Challenging paradigms in estuarine ecology and management. Estuar. Coast. Shelf. Sci.94, 306–314. doi: 10.1016/j.ecss.2011.06.016
27
Foley M. M. Warrick J. A. Ritchie A. Stevens A. W. Shafroth P. B. Duda J. J. et al . (2017). Coastal habitat and biological community response to dam removal on the Elwha River. Ecol. Monogr.87, 552–577. doi: 10.1002/ecm.1268
28
Franco T. P. Neves L. M. Araújo F. G. (2019). Better with more or less salt? The association of fish assemblages in coastal lagoons with different salinity ranges. Hydrobiologia828, 83–100. doi: 10.1007/s10750-018-3804-8
29
Fukuda N. Yokouchi K. Yamamoto T. Kurogi H. Yada T. (2019). Salinity and odor preferences of Japanese eel during the first year of post-recruitment growth in saline water. J. Ethol.37, 93–99. doi: 10.1007/s10164-018-0572-x
30
Gardner C. Coghlan S. M. Jr. Zydlewski J. Saunders R. (2013). Distribution and abundance of stream fishes in relation to barriers: implications for monitoring stream recovery after barrier removal. River. Res. Appl.29, 65–78. doi: 10.1002/rra.1572
31
Gardner C. J. Rees-Jones J. Morris G. Bryant P. G. Lucas M. C. (2016). The influence of sluice gate operation on the migratory behaviour of Atlantic salmon Salmo salar (L.) smolts. J. Ecohydraul.1, 90–101. doi: 10.1080/24705357.2016.1252251
32
Ha K. Jang M. H. Joo G. J. (2003). Winter Stephanodiscus bloom development in the Nakdong River regulated by an estuary dam and tributaries. Hydrobiologia506, 221–227. doi: 10.1023/B:HYDR.0000008564.64010.4c
33
Hansen H. H. Andersen K. H. Bergman E. (2023). Projecting fish community responses to dam removal–Data-limited modeling. Ecol. Indic.154, 110805. doi: 10.1016/j.ecolind.2023.110805
34
Heininger P. Keller I. Quick I. Schwartz R. Vollmer S. (2015). Sediment management on river-basinscale: The river Elbe. Sediment. Matters., 201–247. doi: 10.1007/978-3-319-14696-6_13
35
Heino J. Mykrä H. (2006). Assessing physical surrogates for biodiversity: do tributary and stream type classifications reflect macroinvertebrate assemblage diversity in running waters? Biol. Conserv.129, 418–426. doi: 10.1016/j.biocon.2005.11.009
36
Hwang J. S. Kumar R. Hsieh C. W. Kuo A. Y. Souissi S. Hsu M. H. et al . (2010). Patterns of zooplankton distribution along the marine, estuarine and riverine portions of the Danshuei ecosystem in northern Taiwan. Zool. Stud.49, 335–352.
37
Im R. Y. Kim J. Y. Nishihiro J. Joo G. J. (2020). Large weir construction causes the loss of seasonal habitat in riverine wetlands: a case study of the Four Large River Projects in South Korea. Ecol. Eng.152, 105839. doi: 10.1016/j.ecoleng.2020.105839
38
James K. R. Cant B. Ryan T. (2003). Responses of freshwater biota to rising salinity levels and implications for saline water management: a review. Aust. J. Bot.51, 703–713. doi: 10.1071/BT02110
39
Jensen E. Brucet S. Meerhoff M. Nathansen L. Jeppesen E. (2010). Community structure and diel migration of zooplankton in shallow brackish lakes: role of salinity and predators. Hydrobiologia646, 215–229. doi: 10.1007/s10750-010-0172-4
40
Jo H. Jeppesen E. Ventura M. Buchaca T. Gim J. S. Yoon J. D. et al . (2019). Responses of fish assemblage structure to large-scale weir construction in riverine ecosystems. Sci. Total. Environ.657, 1334–1342. doi: 10.1016/j.scitotenv.2018.11.446
41
Karim F. Wallace J. Abbott B. N. Nicholas M. Waltham N. J. (2021). Modelling the removal of an earth bund to maximise seawater ingress into a coastal wetland. Estuar. Coast. Shelf. Sci.263, 107626. doi: 10.1016/j.ecss.2021.107626
42
Kidd I. M. Fischer A. Chai S. Davis J. A. (2015). A scenario-based approach to evaluating potential environmental impacts following a tidal barrage installation. Ocean. Coast. Manage.116, 9–19. doi: 10.1016/j.ocecoaman.2015.06.016
43
Kim Y. G. Jo M. B. Kim P. Oh S. N. Choe J. H. Kim B. Y. et al . (2021). Effective flood control method in river downstream affected by tidal effect using optimal operation of estuary barrage. J. Waterw. Port. Coast. Ocean. Eng.147, 04021030. doi: 10.1061/(ASCE)WW.1943-5460.0000671
44
Kim S. K. Joo G. J. Choi J. Y. (2022). Effect of gated weir opening on the topography and zooplankton community of Geum River, South Korea. Land11, 529. doi: 10.3390/land11040529
45
Kim Y. H. Lee C. L. JyeGal S. J. (2001). Histochemistry of the mucous cells in the skin of Pseudobagrus fulvidraco and Leiocassis nitidus (Bagridae, Siluriformes). Kor. J. Ichthyol.13, 93–99.
46
Kim I. S. Park J. Y. (2002). Freshwater Fishes of Korea (Seoul: Kyo-Hak Publishing Co.).
47
Kim T. W. Yang H. S. Park B. W. Yoon J. S. (2018). Study on water level and salinity characteristics of nakdong river estuary area by discharge variations at changnyeong-haman weir (1). J. Ocean. Eng. Technol.32, 361–366. doi: 10.26748/KSOE.2018.6.32.5.361
48
Kohonen T. (1989). Self-organization and associative memory (Heidelberg: Springer). doi: 10.1007/978-3-642-88163-3
49
Koroleff F. (1970). Determination of total phosphorus in natural waters by means of persulphate oxidation. Interlab Report No. 3. International Council for the Exploration of the Sea. 1–11.
50
Kumar M. U. Ansal M. D. Kaur V. I. (2018). Salinity tolerance and survival of freshwater carp, labeo rohita ham.(rohu) in inland saline water. Indian J. Ecol.45, 872–875.
51
Kumar R. Pattnaik A. K. (2012). Chilika: an integrated management planning framework for conservation and wise use. Chilika Development Authority technical report. 1-156.
52
Kwak D. H. Song Y. S. Choi Y. H. Kim K. M. Jeong Y. H. (2023). Influence of sluice gate operation on salinity stratification and hypoxia development in a brackish estuary dam. Reg. Stud. Mar. Sci.57, 102731. doi: 10.1016/j.rsma.2022.102731
53
K-water (2022). Nakdong estuary water quality and aquatic ecosystem monitoring (in korean) (Busan, Korea: Korea Water Resources Corporation).
54
Leis J. M. Piola R. F. Hay A. C. Wen C. Kan K. P. (2009). Ontogeny of behaviour relevant to dispersal and connectivity in the larvae of two non-reef demersal, tropical fish species. Mar. Freshw.60, 211–223. doi: 10.1071/MF08186
55
Li T. Sun G. Yang C. Liang K. Ma S. Huang L. (2018). Using self-organizing map for coastal water quality classification: Towards a better understanding of patterns and processes. Sci. Total. Environ.628, 1446–1459. doi: 10.1016/j.scitotenv.2018.02.163
56
Li S. Xie T. Bai J. Cui B. (2022). Degradation and ecological restoration of estuarine wetlands in China. Wetlands42, 90. doi: 10.1007/s13157-022-01589-9
57
Li K. Zhu C. Wu L. Huang L. (2013). Problems caused by the Three Gorges Dam construction in the Yangtze River basin: a review. Environ. Rev.21, 127–135. doi: 10.1139/er-2012-0051
58
Mann K. H. (1993). Physical oceanography, food chains, and fish stocks: a review. ICES. J. Mar. Sci.50, 105–119. doi: 10.1006/jmsc.1993.1013
59
McKenney B. A. Kiesecker J. M. (2010). Policy development for biodiversity offsets: a review of offset frameworks. Environ. Manage.45, 165–176. doi: 10.1007/s00267-009-9396-3
60
Meador M. R. Kelso W. E. (1990). Growth of largemouth bass in low-salinity environments. Trans. Am. Fish. Soc119, 545–552. doi: 10.1577/1548-8659(1990)119<0545:GOLBIL>2.3.CO;2
61
Montagna P. A. Palmer T. A. Pollack J. B. (2022). Effect of temporarily opening and closing the marine connection of a river estuary. Estuaries. Coast.45, 1–12. doi: 10.1007/s12237-022-01159-6
62
Morley S. A. Foley M. M. Duda J. J. Beirne M. M. Paradis R. L. Johnson R. C. et al . (2020). Shifting food web structure during dam removal—Disturbance and recovery during a major restoration action. PloS One15, e0239198. doi: 10.1371/journal.pone.0239198
63
Murphy J. Riley J. (1962). A modified single solution method for the determination of phosphate in natural waters. Anal. Chim. Acta27, 31–36. doi: 10.1016/S0003-2670(00)88444-5
64
National Institute of Environmental Research (NIER) (2017). Biomonitering Survey and Assessment Manual, NIERGP2017-198. [Korean Literature]. (Incheon, Republic of Korea: National Institute of Environmental Research)
65
Nelson J. S. (2006). Fishes of the World. 4th edn (New York, NY: John Wiley and Sons).
66
Nepal V. Fabrizio M. C. (2019). High salinity tolerance of invasive blue catfish suggests potential for further range expansion in the Chesapeake Bay region. PloS One14, e0224770. doi: 10.1371/journal.pone.0224770
67
Olden J. D. Lawler J. J. Poff N. L. (2008). Machine learning methods without tears: a primer for ecologists. Q. Rev. Biol.83, 171–193. doi: 10.1086/587826
68
Park J. M. Riedel R. Ju H. H. Choi H. C. (2020). Fish assemblage structure comparison between freshwater and estuarine habitats in the lower Nakdong River, South Korea. J. Mar. Sci. Eng.8, 496. doi: 10.3390/jmse8070496
69
Park Y. S. Song M. Y. Park Y. C. Oh K. H. Cho E. Chon T. S. (2007). Community patterns of benthic macroinvertebrates collected on the national scale in Korea. Ecol. Modell.203, 26–33. doi: 10.1016/j.ecolmodel.2006.04.032
70
Park S. Yaan H. S. Lee I. C. Kim H. T. (2008). Correlation between meteorological factors and water discharge from the nakdong river barrage, Korea. J. Korean. Soc Mar. Environ. Saf.14, 111–117.
71
Peirson W. Davey E. Jones A. Hadwen W. Bishop K. Beger M. et al . (2015). Opportunistic management of estuaries under climate change: A new adaptive decision-making framework and its practical application. J. Environ. Manage.163, 214–223. doi: 10.1016/j.jenvman.2015.08.021
72
Pihl L. Cattrijsse A. Codling I. Mathieson S. McLusky D. S. Roberts C. (2002). “Habitat use by fishes in estuaries and other brackish areas,” in Fishes in estuaries, (Oxford, UK: Blackwell Science, Oxford) 10–53.
73
Pinckney J. L. Paerl H. W. Tester P. Richardson T. L. (2001). The role of nutrient loading and eutrophication in estuarine ecology. Environ. Health Perspect.109, 699–706. doi: 10.1289/ehp.01109s5699
74
Post J. C. (1984). Nakdong estuary barrage and land reclamation–ecological aspects. Water Sci. Technol.16, 223–231. doi: 10.2166/wst.1984.0055
75
Poulos H. M. Chernoff B. (2017). Effects of dam removal on fish community interactions and stability in the Eightmile River system, Connecticut, USA. Environ. Manage.59, 249–263. doi: 10.1007/s00267-016-0794-z
76
Schofield P. J. Brown M. E. Fuller P. L. (2006). Salinity tolerance of goldfish Carassius auratus L., a non-native fish in the United States. Fla. Sci., 258–268.
77
Sievert N. A. Paukert C. P. Tsang Y. P. Infante D. (2016). Development and assessment of indices to determine stream fish vulnerability to climate change and habitat alteration. Ecol. Indic.67, 403–416. doi: 10.1016/j.ecolind.2016.03.013
78
Smit H. van der Velde G. Smits R. Coops H. (1997). Ecosystem responses in the Rhine-Meuse delta during two decades after enclosure and steps toward estuary restoration. Estuaries20, 504–520. doi: 10.2307/1352610
79
Snedden G. A. Cable J. E. Kjerfve B. (2013). “Estuarine geomorphology and coastal hydrology,” in Estuarine ecology, (Hoboken, NJ, USA: John Wiley & Sons, Hoboken) 19–38. doi: 10.1002/9781118412787
80
Solorzano L. Sharp J. H. (1980). Determination of total dissolved nitrogen in natural waters. Limnol. Oceanogr.25, 751–754. doi: 10.4319/lo.1980.25.4.0751
81
Song H. Lynch M. J. (2018). Restoration of nature or special interests? A political economy analysis of the four major rivers restoration project in South Korea. Crit. Criminol.26, 251–270. doi: 10.1007/s10612-018-9384-0
82
Tamario C. Sunde J. Petersson E. Tibblin P. Forsman A. (2019). Ecological and evolutionary consequences of environmental change and management actions for migrating fish. Front. Ecol. Evol.7. doi: 10.3389/fevo.2019.00271
83
Thom B. Rocheta E. Steinfeld C. Harvey N. Pittock J. Cowell P. (2020). The role of coastal processes in the management of the mouth of the River Murray, Australia: Present and future challenges. River. Res. Appl.36, 656–667. doi: 10.1002/rra.3551
84
Tickner D. Opperman J. J. Abell R. Acreman M. Arthington A. H. Bunn S. E. et al . (2020). Bending the curve of global freshwater biodiversity loss: an emergency recovery plan. BioScience70, 330–342. doi: 10.1093/biosci/biaa002
85
Tsukamoto K. (2006). Spawning of eels near a seamount. Nature439, 929–929. doi: 10.1038/439929a
86
Vesanto J. Himberg J. Alhoniemi E. Parhankangas J. (2000). SOM toolbox for Matlab 5, (Helsinki, Finland: Helsinki University of Technology) Vol. 57.
87
Water Resources Management Information System (WAMIS) (2023). Water quality data of the Nakdong River estuary. Available online at: http://www.wamis.go.kr (Accessed 15 December 2023).
88
Weng X. Jiang C. Zhang M. Yuan M. Zeng T. (2020). Numeric study on the influence of Sluice-Gate Operation on Salinity, nutrients and organisms in the Jiaojiang River Estuary, China. Water12, 2026. doi: 10.3390/w12072026
89
Winemiller K. O. Jepsen D. B. (1998). Effects of seasonality and fish movement on tropical river food webs. J. Fish. Biol.53, 267–296. doi: 10.1111/j.1095-8649.1998.tb01032.x
90
Wolff W. J. (2000). Causes of extirpations in the Wadden Sea, an estuarine area in the Netherlands. Conserv. Biol.14, 876–885. doi: 10.1046/j.1523-1739.2000.98203.x
91
Yoon J. D. Jang M. H. Jo H. B. Jeong K. S. Kim G. Y. Joo G. J. (2016). Changes of fish assemblages after construction of an estuary barrage in the lower Nakdong River, South Korea. Limnology17, 183–197. doi: 10.1007/s10201-015-0476-1
92
Ysebaert T. van der Hoek D. J. Wortelboer R. Wijsman J. W. Tangelder M. Nolte A. (2016). Management options for restoring estuarine dynamics and implications for ecosystems: A quantitative approach for the Southwest Delta in the Netherlands. Ocean. Coast. Manage.121, 33–48. doi: 10.1016/j.ocecoaman.2015.11.005
93
Yu H. J. Kai Y. Kim J. K. (2016). Genetic diversity and population structure of Hyporhamphus sajori (B eloniformes: H emiramphidae) inferred from mtDNA control region and msDNA markers. J. Fish. Biol.89, 2607–2624. doi: 10.1111/jfb.13152
94
Zhou L. Liu K. Zhao Y. Cui L. Dong C. Wang Z. (2022). Increasing salinization of freshwater limits invasiveness of a live-bearing fish: Insights from behavioral and life-history traits. Environ. pollut.308, 119658. doi: 10.1016/j.envpol.2022.119658
Summary
Keywords
re-openings of estuary barrages, Nakdong River Estuary, non-indigenous species, brackish water species, estuarine ecosystem restoration
Citation
Gim J-S, Hong D, Joo G-J, Kim D-K, Lee J-Y, Kwak S-N, Jeong K-S, Jeppesen E and Jo H (2025) Responses of fish population structure to barrage re-opening in an estuarine ecosystem. Front. Mar. Sci. 12:1542823. doi: 10.3389/fmars.2025.1542823
Received
10 December 2024
Accepted
23 June 2025
Published
21 July 2025
Volume
12 - 2025
Edited by
Rochelle Diane Seitz, College of William & Mary, United States
Reviewed by
José Lino Vieira De Oliveira Costa, University of Lisbon, Portugal
Heyue Zhang, Hohai University, China
Updates
Copyright
© 2025 Gim, Hong, Joo, Kim, Lee, Kwak, Jeong, Jeppesen and Jo.
This is an open-access article distributed under the terms of the Creative Commons Attribution License (CC BY). The use, distribution or reproduction in other forums is permitted, provided the original author(s) and the copyright owner(s) are credited and that the original publication in this journal is cited, in accordance with accepted academic practice. No use, distribution or reproduction is permitted which does not comply with these terms.
*Correspondence: Hyunbin Jo, prozeva@bhu.ac.kr
Disclaimer
All claims expressed in this article are solely those of the authors and do not necessarily represent those of their affiliated organizations, or those of the publisher, the editors and the reviewers. Any product that may be evaluated in this article or claim that may be made by its manufacturer is not guaranteed or endorsed by the publisher.