 Yuye Zou
 Xiaohui Wang1
 Qiang Zhang
- 1College of Economics and Management, Shanghai Maritime University, Shanghai, China
- 2College of Transport and Communications, Shanghai Maritime University, Shanghai, China
This paper analyzes 441 of China's green port policies using text mining and quantitative evaluation methods to promote the sustainable development of China’s ports and accelerate the achievement of the “dual carbon” goal. The study first reviews the evolution of these policies, categorizing them into three stages: the embryonic stage, the startup stage, and the development stage. High-frequency words were extracted for each stage, followed by dimensionality reduction using Principal Component Analysis (PCA) and clustering analysis to classify the policies. The Latent Dirichlet Allocation (LDA) topic model was then applied to identify the main policy themes, and a Policy Modeling Consistency (PMC) index model was developed. The study evaluated 19 representative policies using cosine similarity and correlation coefficients. The analysis revealed several key issues: (1) the entity responsible for policy issuance is singular, with insufficient interdepartmental collaboration; (2) short-term policies are lacking, with weak responsiveness; (3) policies targeting shipping companies are underdeveloped; and (4) there is an imbalance in the use of policy instruments, with a focus on mandatory and hybrid tools. Based on these findings, the paper proposes several suggestions for improving green port development policies.
1 Introduction
Global warming has had a profound impact on both human society and natural ecosystems. The primary driver of climate change is the rising concentration of carbon dioxide (CO2), with emissions increasing annually. According to the official website of Our World in Data, global CO2 emissions reached 33.884 billion tons in 2021, marking a 5.6% increase compared to the previous year. Notably, China’s carbon emissions were projected to be 11.336 billion tons-more than double those of the United States (5 billion tons) and nearly three times those of the European Union (3.15 billion tons). In response to this challenge, China announced two key goals on September 22, 2020: “Carbon Peak” and “Carbon Neutrality”, collectively referred to as the “Dual Carbon” goals. In September 2021, the Central Committee of the Communist Party of China and the State Council jointly issued the Opinions on Fully, Accurately, and Comprehensively Implementing the New Development Concepts to Achieve Carbon Peak and Carbon Neutrality. This document emphasized the need to promote the adoption of new energy vehicles and vessels, optimize transportation structures, and continuously reduce energy consumption and CO2 emission intensity within the transportation sector. These measures are intended to lay a solid foundation for achieving the “Dual Carbon” objectives.
Shipping is the cornerstone of global trade, with around 90% of internationally traded goods transported by sea. While the rapid expansion of the shipping industry has fueled economic growth, it has also resulted in significant environmental challenges. The sector is a major contributor to air pollution, generating large amounts of carbon dioxide (CO2), sulfur oxides (SOx) and nitrogen oxides (NOx), which adversely affect air quality and human health. Specifically, The shipping industry accounts for approximately 3.1% of global annual anthropogenic carbon dioxide (CO2) emissions and 15% and 13% of global average annual NOx and SOx emissions, respectively, issued by International Maritime Organization (IMO, 2014). Ports are an important driving force for world economic growth, yet they are also significant sources of energy consumption and pollution (Deng et al., 2022). Port activities contribute substantially to greenhouse gas emissions from the shipping industry. In response to these challenges, various international organizations and governments have introduced policies and regulations aimed at reducing carbon emissions from ports. These efforts not only address current emission control issues but also provide a roadmap for ports to adopt more sustainable practices, helping to mitigate the risk of future increases in carbon emissions.
Chinese ports play a crucial role in global supply chain. In 2024, the total cargo throughput of ports nationwide reached 1.76 billion tons, with container throughput reaching 330 million TEUs, maintaining its position as the world’s largest. They are particularly significant in advancing “the Belt and Road Initiative” and connecting domestic and international markets. However, as the scale of ports continues to expand, issues such as energy consumption and environmental pollution have become increasingly prominent, necessitating the adoption of green transformation measures. The Chinese government is actively promoting green development, introducing a series of environmental policies aimed at fostering the sustainable development of the port industry. The necessity of green development for ports is not only reflected in addressing environmental challenges but also in enhancing their international competitiveness and long-term development potential, aligning with China’s broader trend toward a green, low-carbon transformation.
Before the reform and opening-up, China’s port construction primarily focused on supporting economic growth and foreign trade, with limited attention to environmental issues. As a result, pollution control and resource utilization efficiency were relatively low. Following the reform and opening-up, the growing emphasis on environmental protection led the government to gradually integrate the concept of green development into port infrastructure. A series of policies were enacted and implemented to promote the green transformation of ports. To systematically examine the development trends and effectiveness of these policies, identify their shortcomings, optimize policy design, and drive the sustainable development of the port industry, this study aims to provide both theoretical support and practical guidance for the formulation of more effective green port policies. It collects green port policy documents from China since the reform and opening-up, explores the evolution of these policies, and quantitatively analyzes their impacts. This research seeks to enhance environmental protection, improve resource utilization efficiency, and strengthen the international competitiveness of China’s ports.
To address this issue, this study combines the latent dirichlet allocation (LDA) model with the policy modeling consistency (PMC) framework to explore the evolution of China’s shipping carbon emission policy from a qualitative perspective, while also analyzing the specific effects of policy implementation using a quantitative model. The innovation of this paper lies in several key aspects: (1) revealing the core issues and trends in the evolution of policies through automated text mining and detailed analysis, (2) tracking the shift in policy priorities by integrating time series analysis, and (3) evaluating policy effects and industry impacts by combining both quantitative and qualitative approaches. These methodologies enable the formulation of precise policy optimization recommendations. This approach offers a comprehensive understanding of the practical effectiveness of green port policies, social feedback, and their alignment with global green development goals, providing data-driven support for future policy development and the green transformation of ports.
Reducing carbon emissions and protecting the environment are global priorities, and ports, as crucial trade hubs, play a significant role in carbon emissions. Although research on carbon emission policies and air pollutant forecasting for ports exists, comprehensive studies on China’s green port policy remain scarce. This paper makes two key contributions: (1) It presents a theoretical framework for quantitatively analyzing green port policies. This is achieved by quantifying policy texts, reducing data dimensions using principal component analysis, and categorizing them through cluster analysis. The LDA topic model extracts the core themes, while the PMC index assesses the policies’ effectiveness, offering practical recommendations for policymakers and providing theoretical support for studies on port carbon emissions. (2) It enhances the understanding of the themes and structure of green port policies by identifying key issues and trends through the LDA model. Additionally, the paper evaluates the implementation of these policies using the PMC index, which measures the internal consistency, efficiency, and impact of the policies on environmental, economic, and social development.
The remainder of this paper is structured as follows. Section 2 provides a review of the relevant literature. Section 3 outlines the methods and data used in this study. Section 4 examines the evolution of China’s green port policy. Section 5 presents a quantitative evaluation of these policies. Finally, Section 6 offers concluding remarks and suggestions.
2 Literature review
2.1 Green ports policies
The concept of a green port emphasizes the integration of environmental protection and sustainable development into port operations, aiming to minimize ecological impact. Its core objective is to harmonize economic growth with environmental stewardship, thereby fostering the long-term sustainability of ports (Pavlic et al., 2014). As a global trend in port development, green ports emphasize the crucial role of environmental management in port operations (Teerawattana and Yang, 2019). There are various strategies to promote the green development of ports, such as reducing energy consumption by ships (Peng et al., 2020), advancing marine power replacement technologies (Chen et al., 2019), and decreasing carbon emissions from ships docked at ports. Furthermore, digitalization and smart technologies are also vital to the sustainable development of ports (Yau et al., 2020; Zhang et al., 2024). Achieving the goal of green ports requires the implementation of effective policies. Well-designed policies can support sustainable development while enhancing ports’ competitive advantage in the global green trade arena. International and regional organizations, as well as national governments, are actively developing policies and regulations to advance greening initiatives. For example, the IMO introduced a preliminary strategy to reduce greenhouse gas emissions from international shipping, setting emission reduction targets for 20302050 to support the greening of both ports and shipping (IMO, 2018). The International Association of Ports and Harbors (IAPH) launched the the Environmental Ship Index to assess ships’ carbon emissions (IAPH, 2011). The rapid expansion of China’s ports has resulted in significant environmental pollution challenges. In response to these issues and to promote a green transformation in maritime transport, the Chinese Ministry of Transport (CMT) has introduced a series of policies. For example, The Guiding Opinions on Promoting Port Transformation and Upgrading established four key objectives aimed at advancing the green transformation of ports, enhancing environmental protection, and supporting ecological conservation and restoration projects (CMT, 2014). The Guidance on Building World-Class Ports emphasizes the importance of establishing a clean, low-carbon energy system for ports, as well as reducing pollution emissions from port operations (CMT, 2019). Furthermore, the Green Port Grade Evaluation Guide seeks to encourage the green development of China’s ports by promoting environmental protection, resource conservation, and energy efficiency (CMT, 2020). In addition to these national policies, various local governments have implemented a range of regulations and initiatives focused on energy conservation and emission reduction. Under the framework of China’s “dual carbon” policy, ports are progressively advancing their green transformation through innovations in intelligence, technology, and modernization. To refine these policies, it is crucial to conduct a comprehensive evaluation of existing green port strategies, identifying both their strengths and shortcomings. This will provide valuable insights into the effectiveness of China’s green port policies (Zhang et al., 2022b).
2.2 Green port policies evolution
The study of policy evolution is not only a summary of the past, but also very forward-looking and practical. Policy evolution research can provide strong support for decision makers, help them better understand the trajectory of policy change, effectiveness and shortcomings, so as to make more reasonable and effective decisions. Qualitative analysis methods (literature reviews, case studies, policy analysis, in-depth interviews, etc.) demonstrate the complexity and diversity of policy evolution, which has a considerable application in various fields such as environment policies (Jordan et al., 2010) and new energy vehicle policies (Wang et al., 2021). However, qualitative analysis relies too much on the personal perspective and understanding of the interviewees, and the results are subjective and lack systematic data support, which makes it difficult to draw a universally applicable conclusion. About the method of analyzing the evolution of green port policy, it is worth mentioning that most of the existing literature use qualitative methods (Tseng and Pilcher, 2019), and only a few studies carry out quantitative analysis. For example, (Lin et al., 2022) drawn a knowledge map in the field of green ports, explores the current research trends and cooperation networks among countries (regions), institutions and authors as well as the evolution and mutation of keywords. (Cheng et al., 2024) evaluated policy incentives and their effectiveness by building an evolutionary game model capable of capturing complex dynamics among ports, shipping companies, and government agencies. (Chen et al., 2024b) used the social network analysis method to explore the cooperative relationship between different levels of green shipping policy entities in China, their respective roles and the changing trend of policy themes. The knowledge graph relies on prior knowledge to construct structured relationships, the game theory model focuses on the strategic interactions between decision-makers, and the social network method analyzes the relationships among participants. These methods, however, cannot automatically extract latent topics from large amounts of policy text data or objectively analyze the evolution of policy content.
Topic modeling is a powerful technique in text mining used for data analysis, uncovering hidden structures, and identifying relationships among text documents. LDA is one of the most widely used methods for topic modeling, enabling the discovery of latent topic structures within text data and facilitating the extraction of topics from large document corpora. The LDA method is applied in many fields to study policy trends, for instance, complaint narratives (Bastani et al., 2019), biochemistry research (Kang et al., 2019), Internet of Things (Sharma et al., 2022), 5G patent (Tian et al., 2024), artificial intelligence research (Yu and Xiang, 2023). There are also some researches in the field of shipping, for example, mobility pattern analysis of ship trajectories (Huang et al., 2020), patent for unmanned boat (Lin et al., 2024), China’s port integration policy (Chen et al., 2024a). In particular, some scholars are concerned about the development of green shipping and ports. For example, (Shi et al., 2018) conducted a comprehensive review of green shipping research, including 213 papers published in the SSCI transport journal between 1988 and 2017, to establish a theoretical green shipping system, and identified future research topics that will focus on establishing green shipping institutions and legislative policies. (Shi et al., 2023) applied CiteSpace bibliometric analysis and LDA model hierarchical clustering method to visually analyze the evolution process and research frontier of green port knowledge field. Unfortunately, as far as we know, there is no research on the evolution of green port policy since China’s reform and opening up by using LDA theme word analysis.
2.3 Green port policies evaluation
Policy evaluation plays a vital role in optimizing and refining policy measures, improving their implementation efficiency, and informing future policy development. It focuses on assessing the outcomes of a policy against specific assumptions (Brock et al., 2007). A well-conducted evaluation can provide valuable insights, enabling policymakers to adjust and enhance their policies (Zhang et al., 2022b). Selecting the appropriate evaluation method is critical in this process. The literature proposes various qualitative and quantitative approaches to assess policy impacts (Peterman, 1975). While qualitative methods have long been in use, quantitative techniques such as the difference-in-differences (DID) model, analytic hierarchy process (AHP), system dynamics principles (SDP), and regression discontinuity (RD) design, which can handle both standard and atypical data, have garnered increasing attention. For instance, (Liu et al., 2022) employed the DID approach to examine the impact of Russia’s Arctic strategy on the development of ports along the Northern Sea Route, within the context of accelerated Arctic glacier melting due to global warming. To objectively assess the progress of green port development, (Wan et al., 2018) developed a quantitative evaluation model, determined the weights of various indices using the AHP, and assessed each index. This model offers valuable insights for comparing green port development across different countries or regions. Similarly, (Zhou et al., 2020) used SDP to create a model for port energy conservation and emission reduction, simulating the effects of various policy scenarios and conducting comparative analyses. (Zhang et al., 2022a) applied the RD method to demonstrate a causal relationship between the reduction in sulfur dioxide emissions and the implementation of the emission control area policy at Shanghai Port.
The PMC index model is a quantitative tool designed to assess the impact of policies on specific economic or market indicators. It provides a systematic framework for evaluating policy effects and quantifying their influence on key economic variables. The model’s robustness and flexibility have made it widely adopted across various fields, such as the development of traditional Chinese medicine policies (Yang et al., 2022b), peak carbon emissions and carbon neutrality policies (Lu et al., 2022), advanced industrial policies (Tian et al., 2022), green development policies (Dai et al., 2021), and health promotion policies (Yang et al., 2022a). Additionally, the PMC index model has been applied in quantitative evaluations of shipping policies. For example, (Hu and Yin, 2023) analyzed 101 shipping policies from 2001 to 2021, sourced from the official website of the Ministry of Transport. They identified key policy texts and constructed an evaluation index system for shipping policies using text mining techniques. (Zhou et al., 2024) developed a policy evaluation system based on the PMC index model to assess 17 green port-related policies currently implemented along China’s coastline. (Zhang et al., 2023) applied the PMC index method to quantitatively evaluate 15 representative policies addressing varying degrees of shipping decarbonization in China. However, despite these efforts, there remains a lack of comprehensive studies that examine the evolution and overall evaluation of green port policies across China.
Although scholars have made notable theoretical and practical advancements in port policy, several challenges remain: (1) Much of the existing research relies primarily on qualitative analysis, which introduces significant subjectivity and compromises the objectivity and scientific rigor of the evaluation results. (2) There is a lack of research on the evolution of port green development policies, which limits our understanding of how these policies evolve over time. (3) Current evaluation methods typically provide broad assessments of policies but lack in-depth analysis of specific policies, leading to less targeted and actionable findings. Addressing these issues is the primary focus of this paper.
3 Methodology and policies sample
To address these issues mentioned above, this paper employs a quantitative approach to examine the evolution and changes in China’s green development policies. It aims to scientifically identify the shortcomings of current green port policies, enhance the policy system, and contribute to achieving the “dual carbon” goal. This study first applies principal component analysis to reduce the dimensionality of port carbon emission policy texts, then uses cluster analysis to categorize the texts, and employs the LDA topic model to extract themes from China’s green port development policies. Finally, it uses the PMC index model to evaluate these policies and offers recommendations for policy makers, providing a theoretical foundation and data analysis for the field of port carbon emission policy.
The LDA and PMC models are employed to analyze and evaluate the green port policies issued by both central and local governments in China since 1980. The research framework, as illustrated in Figure 1, consists of the following steps: (1) collecting and screening relevant policy documents; (2) applying the PCA method to reduce the dimensionality of the green port policy texts; (3) using K-means cluster analysis to categorize the green port policy texts; (4) utilizing the LDA topic model to extract key topics from the policy texts; (5) selecting specific topics derived from the LDA model to serve as indicators for the PMC index model; and (6) conducting text mining and policy evaluation based on the PMC index model.
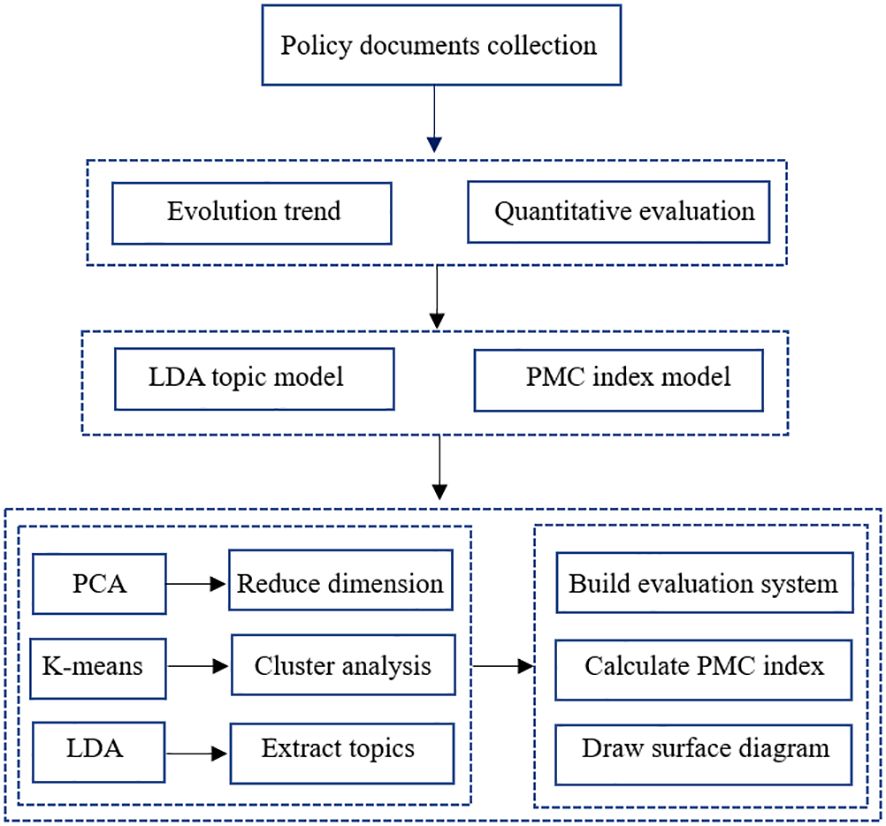
Figure 1. Analysis framework of port green policy, including data preprocessing, research content, methods and steps.
3.1 Methods
3.1.1 Principal component analysis
The PCA is a widely used data analysis technique that identifies and retains the principal components contributing most significantly to the variance within a dataset. By applying orthogonal transformation, PCA reduces the dimensionality of the data, simplifying its complexity and improving the efficiency of analysis and interpretation. This reduction in dimensions is achieved without losing critical information, facilitating more effective clustering and analysis of policy text data in future studies. The calculation steps of the Principal Component Analysis (PCA) method are as follows:
Step 1: Standardize the original data.
Transform the data into a standard normal distribution with a mean of 0 and a standard deviation of 1, in order to eliminate the impact of differences in scale or numerical values between variables on the analysis results. The specific formula is , where X is the original data, µ is the mean, σ is the standard deviation, and Z is the standardized data.
Step 2: Compute the covariance matrix.
The covariance matrix C is a matrix composed of the covariances between the features in the dataset. For the standardized data, the covariance matrix C is expressed as , where is an symmetric matrix, where is the number of indicators. The element represents the covariance between the i-th feature and the j-th feature, and n is the number of data points.
Step 3: Compute the eigenvalues λi.
The eigenvalues can be obtained by solving the characteristic equation . Then, the eigenvalues are sorted in descending order, and the variance contribution rate and cumulative variance contribution rate for each eigenvalue are calculated. Select the top k eigenvalues (k ≤ p) that are greater than 1 and have a cumulative variance contribution rate greater than 90%. The corresponding eigenvectors are the principal components, and k represents the number of principal components.
Step 4: Projection to new space.
Use the selected eigenvectors (i.e., principal components) to project the original data into a new space. Suppose the matrix Wk is formed by the first k principal components (where each column is an eigenvector). The projected data can be obtained using the following formula: Fk = X · Wk, where Fk is the dimensionality-reduced data.
3.1.2 K-means clustering analysis
The K-means clustering analysis is a fundamental technique in unsupervised learning, widely used in data mining and machine learning. The algorithm determines the optimal number of clusters, K, using the silhouette coefficient, and begins with randomly selected initial centroids. In each iteration, each sample is assigned to the cluster associated with its nearest centroid, and the centroids are recalculated as the mean of all samples within each cluster. This iterative process continues until the centroids stabilize or a predefined number of iterations is reached, at which point the clustering analysis is complete. The process of the K-means clustering algorithm can be described in detail through the following steps:
Step 1: Evaluate and determine the number of clusters, K (i.e., the number of clusters), using methods such as heuristics, the elbow method, and silhouette coefficient.
Step 2: Randomly select K data points as the initial cluster centers.
Step 3: Assign each data point to the cluster whose center is closest to it.
Step 4: Recalculate the mean of each cluster as the new cluster center, using the formula , where is the number of data points in cluster Ck, and xiis a data point belonging to cluster Ck.
Step 5: Repeat the assignment and update steps until the change in cluster centers is smaller than a threshold or the maximum number of iterations is reached.
3.1.3 LDA topic model
The LDA is a three-layer Bayesian probabilistic model used in unsupervised learning to infer underlying topics from a set of documents or a corpus. It assumes that each document is composed of multiple latent topics, which in turn consist of specific words, creating a hierarchical structure among words, topics, and documents. LDA reduces the high-dimensional representation of document-word relationships into two low-dimensional matrices: the document-topic matrix and the topic-word matrix, both of which follow multinomial distributions. The conditional probability of occurrence of the n-th word wdnin document d can be expressed as Equation 1, which is defined as follows:
where stands for the number of topic. represents the occurrence probability of under topic . is the probability of belonging to topic in document .
When the LDA topic model is used to generate text topics, it is usually necessary to determine the number of topics first. This paper determines the optimal number of topics by calculating the confusion degree corresponding to each topic number, and the topic number corresponding to the lower confusion degree is the optimal number of topics. Equation 2 is a confusing calculation formula:
where M is the number of documents. Nd represents the number of words contained in each document d. wd represents terms in document d. represents the probability that the word under given document d.
3.1.4 PMC index model
The PMC index model is a scientific and quantitative evaluation model of policy text to evaluate the internal consistency of policy and the merits and disadvantages of policy. There are five steps to build the PMC index model:
Step 1: Through the mining of the policy text to determine the primary evaluation variables and secondary evaluation variables.
Step 2: Multi-input-output table is built through text analysis and variable assignment. After sorting out the content of the selected policy text, if the content of the selected policy text covers the second-level variables, the second-level variable Xij= 1, otherwise Xij= 0.
Step 3: Calculate the average value of the second-level variable under each first-level variable of each policy as the numerical result of the corresponding first-level indicator. As shown in Equation 3:
where i represents the first-level variable, j represents the second-level variable corresponding to the first-level variable, and n is the number of second-level variables corresponding to the first-level variable. represents the number of second-level variables corresponding to the first-level variables of each policy.
Step 4: Calculate the PMC index according to the following (Equation 4):
Step 5: Draw PMC surface diagram. The PMC surface is a tool to display the effect of strategy evaluation in the form of images. Establishing PMC matrix is the basis of constructing PMC surface. We organize the first-level variable scores into a 3 × 3 matrix, which is shown in Equation 5:
The nine first-level variables on the PMC matrix correspond to the 9 points on the PMC surface plot. A convex part indicates a high score, while a concave part indicates a low score. This approach allows us to see more clearly the advantages and disadvantages of policies.
3.2 Policies samples
In this paper, considering the availability of data, we collected policy documents from 1980 to 2023. This is primarily due to China’s focus on economic development before the 1978 reform and opening up, with less attention given to environmental pollution issues. An Octopus collector is employed to search for keywords within the government information and policy and regulation sections of official websites including the People’s Government of the People’s Republic of China (https://www.gov.cn/), the Ministry of Transport (https://www.mot.gov.cn/), municipal and provincial transportation bureaus, the Water Transportation Bureau (https://zizhan.mot.gov.cn/sj2019/shuiyunj/), and the Maritime Safety Bureau (https://www.msa.gov.cn/), ensuring the comprehensiveness of the policy text data. To further enhance the dataset, policy texts from the “Peking University Magic Weapon Database” and other relevant government document databases were incorporated, totaling 679 policy texts. Due to significant duplication, irrelevant content, and limited information related to green ports in the original data, manual cleaning was conducted using Excel. Non-policy documents, such as news updates, reply letters, and drafts for comments, were excluded, retaining only key details like policy title, text, publishing agency, and date. Ultimately, 441 valid data points were selected. To refine text processing, a Jieba stop word table and custom dictionary were created, and Python’s Jieba module was used for word segmentation and stop word removal.
4 Evolution of green port policies
4.1 Policies classification
This paper divides the evolution of green port policy into stages based on key events and significant policy release dates. Given the absence of energy conservation, emission reduction, and green port policies in China from 1949 to 1979, the study categorizes the green port policies from 1980 to 2023 into three distinct stages. Figure 2 illustrates the evolution of port green development policies over time. The increasing number of issued documents reflects a gradual upward trend, indicating a rising demand for port green development policies, which reflects the country’s great attention to and investment in green port construction.
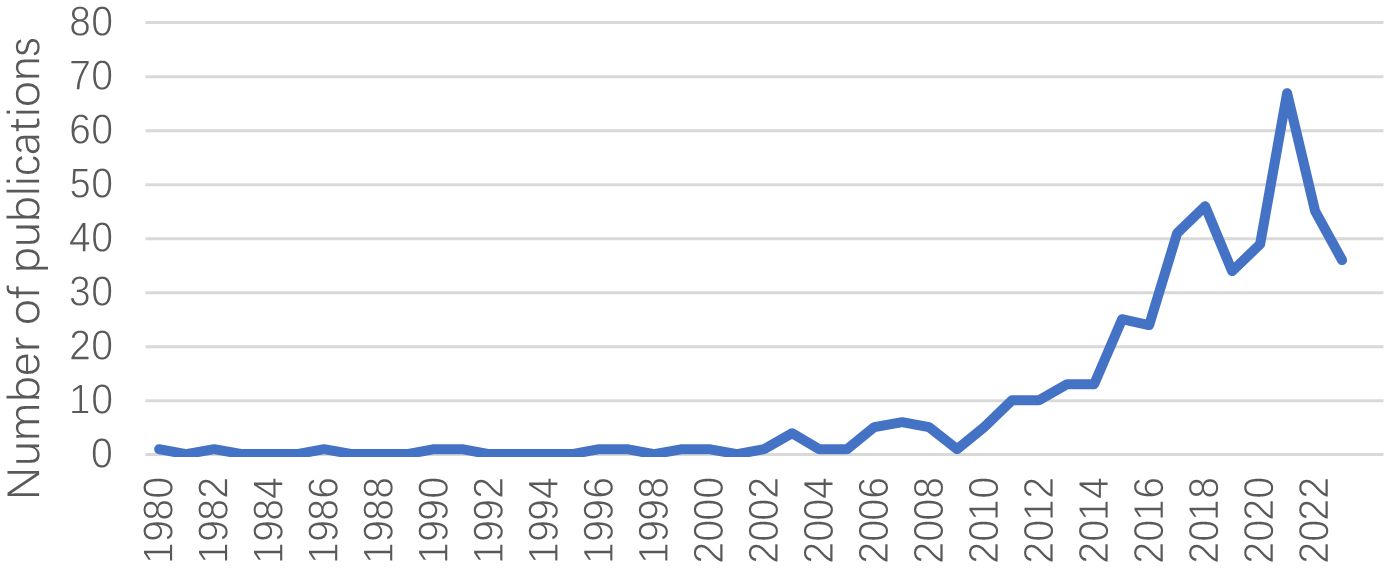
Figure 2. Time series plot of the number of issued documents of China’s green port policies.
From 1980 to 2000, the development of China’s green shipping policies was relatively limited, mainly focusing on economic development, with little attention paid to environmental protection. After China joined the WTO in 2001, the global emphasis on environmental protection and sustainable development prompted China to focus on the construction of green ports. Subsequently, China gradually introduced the concept of sustainable development. As import and export trade continued to grow, the country placed greater emphasis on the development of port infrastructure. During this period, although China began to pay attention to the construction of green ports, this concept was not yet fully emphasized or widely implemented. In July 2011, the IMO officially launched the Energy Efficiency Design Index (EEDI), aimed at improving the energy efficiency of new ships and reducing greenhouse gas emissions. In response to the EEDI standards, the Chinese government held the 7th National Environmental Protection Conference in December 2011, aiming to actively promote the greening of port facilities, optimize energy usage, and enhance overall transportation efficiency through technological innovation, while also fostering the development of low-carbon transport systems. Following this, China has formulated and introduced a series of green port policies, for example, in the “13th Five-Year Plan” green shipping policies explicitly proposed goals such as energy-saving and emission reduction, improving energy efficiency in shipping, and accelerating the research and development of green shipping technologies. As environmental protection laws and regulations improved, such as the implementation of the “Ship Pollution Discharge Standards” and “Ship Air Pollutant Discharge Control Standards” green shipping policies gradually shifted from single technical requirements to more comprehensive policies, covering emission reduction, clean energy application, and green port transformation. By 2020, Chinese government set the “carbon peak and carbon neutrality” goals, and the shipping industry began to focus on reducing carbon emissions as a core future development objective, further advancing green shipping policies. In a word, the push from a series of major domestic and international events and policies led to the gradual transition of China’s green shipping policies from an initial singular focus to comprehensive and systematic development.
This subsection applies PCA to perform dimensionality reduction on text data by transforming the original data into a covariance matrix. For the policy texts from 1980 to 2000, where the cumulative variance contribution rate of the first 5 principal components reaches 90%. For the policy texts from 2001 to 2010, the cumulative variance contribution rate of the first 18 principal components reaches 90%. For the policy texts from 2011 to 2023, the cumulative variance contribution rate of the first 241 principal components reaches 90%. Table 1 presents the cumulative contribution rates of each principal component. K-means clustering is then applied to the reduced data. The classification of policy texts is determined by analyzing the silhouette coefficient and the plot of the sum of squared errors (SSE) as the value of K changes. The silhouette coefficient is a metric used to evaluate the quality of clustering, with values ranging from [−1,1]. The closer the value is to 1, the better the clustering quality, indicating the optimal number of clusters. The SSE in K-means clustering represents the sum of squared distances from each sample to its cluster center. A smaller SSE indicates better clustering performance. Figure 3 shows the trends of the silhouette coefficient and SSE as K varies.

Table 1. The cumulative contribution rates (CCR) of each principal component.

Figure 3. The silhouette coefficient (left) and SSE (right) change as K varies. (a) The silhouette coefficient and SSE of policy texts during 1980-2000. (b) The silhouette coefficient and SSE of policy texts during 2001-2010. (c) The silhouette coefficient and SSE of policy texts during 2011-2023.
From Figure 3a, it can be observed that as K increases, the SSE decreases progressively. After K = 3, the rate of decrease in the silhouette coefficient slows down and gradually approaches 0. Therefore, the policy texts from 1980 to 1999 are divided into three categories. From Figure 3b, it can be seen that the SSE decreases as K increases. The silhouette coefficient is relatively high at K = 2 and K = 3, with a smaller SSE at K = 3 compared to K = 2. Therefore, the policy texts from 2000 to 2010 are classified into three categories. From Figure 3c, it is evident that the SSE gradually decreases as K increases. The silhouette coefficient reaches its peak at K = 5, with a corresponding smaller SSE. Thus, the optimal number of clusters is K = 5. Hence, the policy texts from 2011 to 2023 are classified into five categories.
4.1.1 Germination period (1980-2000)
In the early stages of reform and opening-up, China’s shipping industry gradually transitioned from the traditional planned economy model to a market-oriented, internationalized, and green development approach. Driven by the reform and opening-up, the shipping industry experienced rapid growth, while corresponding green port policies began to take shape as environmental issues became increasingly prominent. In 1980, the Third Session of the Fifth National People’s Congress introduced measures to improve energy management and promote conservation, marking the start of China’s focus on energy efficiency. Since then, energy issues have become crucial to the country’s economic development, leading to policies aimed at enhancing energy efficiency and reducing pollution. From Table 2, keywords in policy documents included “energy conservation”, “environmental protection”, “pollution”, “emission” and “climate change” reflecting growing environmental awareness as the transportation industry expanded. The government prioritized energy efficiency, emission reduction, and climate change mitigation. Before 1980, few Chinese ports ranked among the top 100 globally by container throughput. However, as China’s economy and foreign trade grew, terms like “sea area” and “marine environment” began to gain attention, indicating rising environmental concerns in the maritime sector.
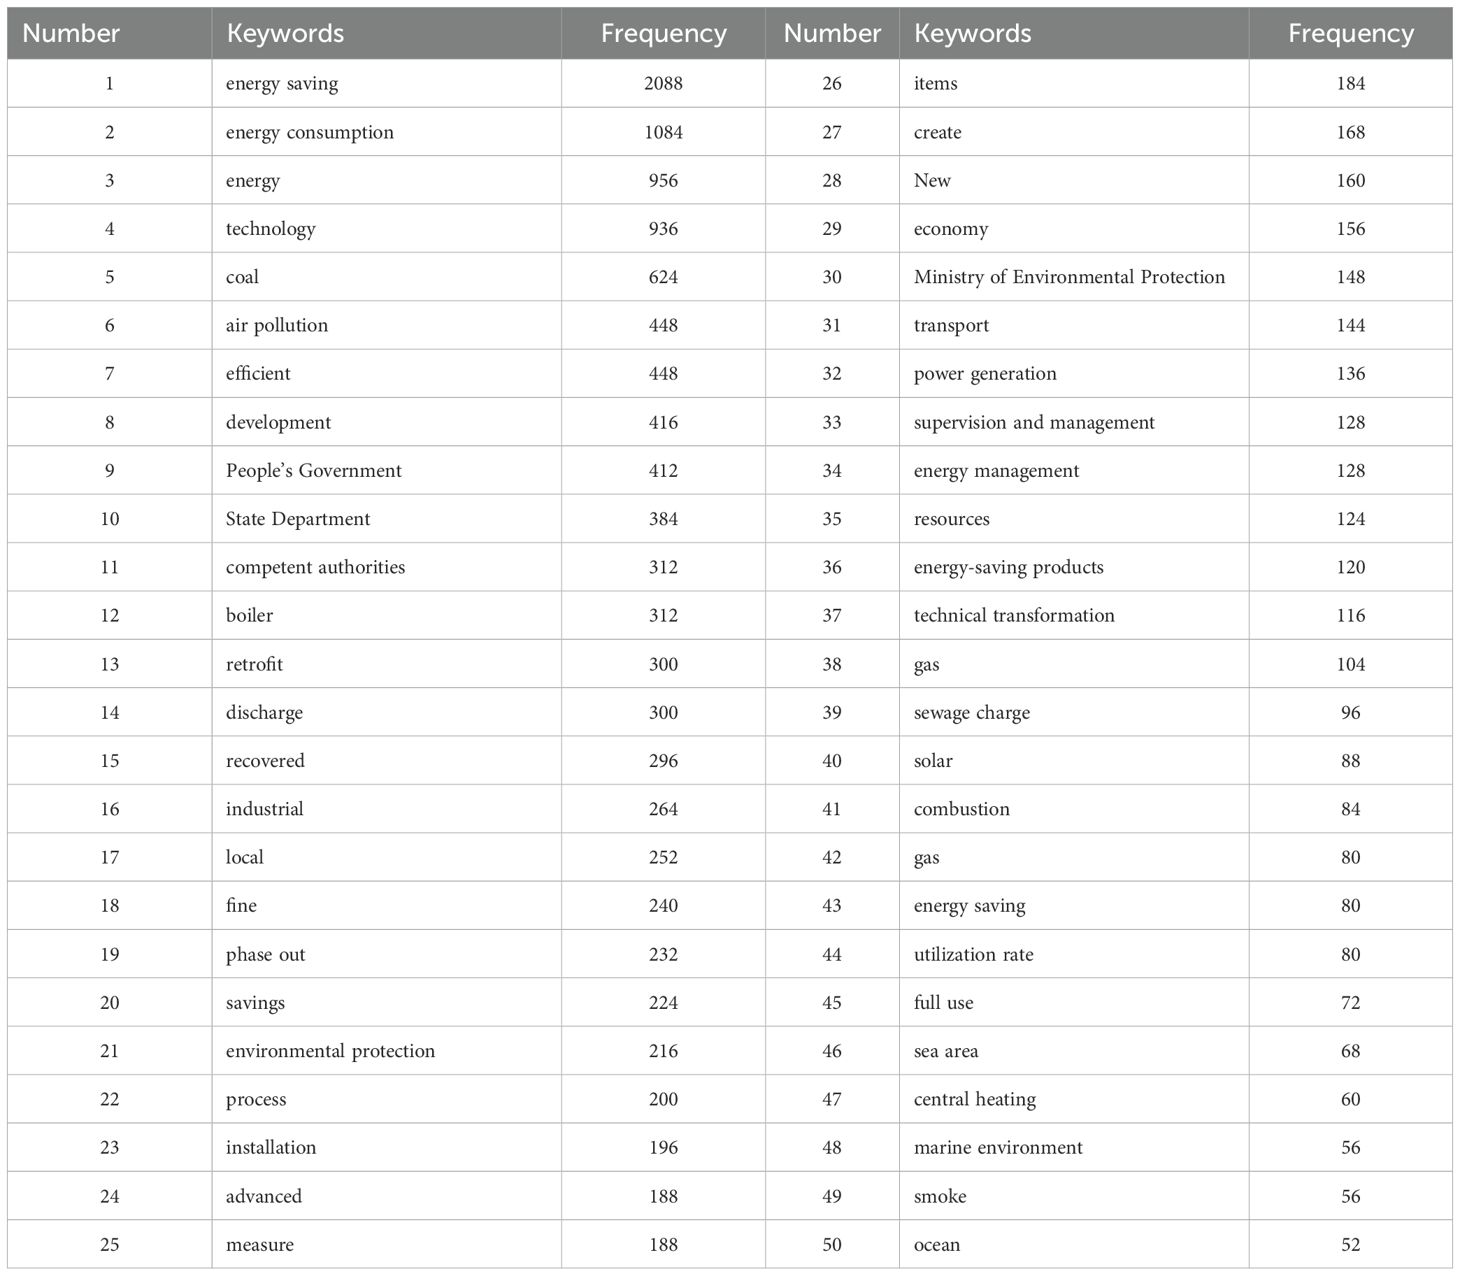
Table 2. Statistics of keyword frequency of China’s green port policies during 1980-2000.
Based on the PCA and K-means clustering analysis methods, the policy texts from 1980 to 2000 are divided into the following three categories: (1) “Pollution prevention and control” policy, which not only focuses on reducing pollution and improving environmental quality, but also focuses on promoting sustainable development and green transformation of ports. Through strict pollution control and the application of clean technology, the port can reduce the negative impact on the surrounding water, air, soil and ecological environment, protect human health, and enhance the comprehensive competitiveness of the port. (2) “Energy utilization and energy-saving technology” policy, which not only focuses on improving the energy efficiency of the port itself, but also involve the integrated cooperation between the port and the shipping, logistics, energy and other industries. With increasing global attention to climate change issues, the port industry’s efforts in energy use and energy conservation will become even more important to help achieve green ports and sustainable development goals. (3) “Pollutant discharge management” policy. The port emission management policy takes into account various factors such as emission standards, environmental impact assessment, and green technology application, with the aim of reducing the pollution of the port and its surrounding environment and promoting sustainable development. With the global attention to environmental protection, port discharge management policies are being upgraded, and more stringent measures are being taken to achieve environmental goals.
4.1.2 Initial exploration period (2001-2010)
After China’s accession to the World Trade Organization (WTO) in 2001, the international market has increased requirements for environmental protection and sustainable development, which has pushed the Chinese government to strengthen the formulation and implementation of green port policies. In response to global environmental standards and to enhance port competitiveness, China has strengthened policy support for green port construction, issued a series of environmental regulations and industry standards, encouraged ports to adopt energy saving and emission reduction technologies, promoted the construction of green logistics systems, and required port enterprises to comply with international environmental standards. These policies promote the gradual development of China’s ports in the direction of low carbon, environmental protection and efficiency. By analyzing green port policy texts from 2001 to 2010, Python identified key terms, showing a significant rise in green port-related policies compared to 1980-2000. During this period, the focus shifted to renewable energy sources like wind, hydro, and solar power, with an emphasis on balancing port development with environmental protection and marine ecology. This marked the beginning of government efforts to explore green port policies.
The policy texts for 2001–2010 are divided into three categories by K-means cluster method: (1) “Technological innovation leads the development of new engineering projects” policy, which focuses on the combination of innovation and environmental engineering projects, and promotes the development of environmental engineering through the development and application of control systems. (2) “Energy conservation and emission reduction and pollutant monitoring and assessment” policy, which emphasize the importance of energy conservation and emission reduction. They manage energy use and pollutant emissions through monitoring, statistics and assessment to achieve environmental protection and sustainable development goals. (3) “Prevention and control of pollutant emission from ships” policy. The leading role of the people’s government in the prevention and control of pollutants from ships and environmental protection, as well as the responsibility of the competent departments for the effective management of air pollution from ships were emphasized. At the same time, it also reflects the importance of preventing and controlling ship pollutant discharge for environmental protection. The keywords of this period are shown in Table 3.
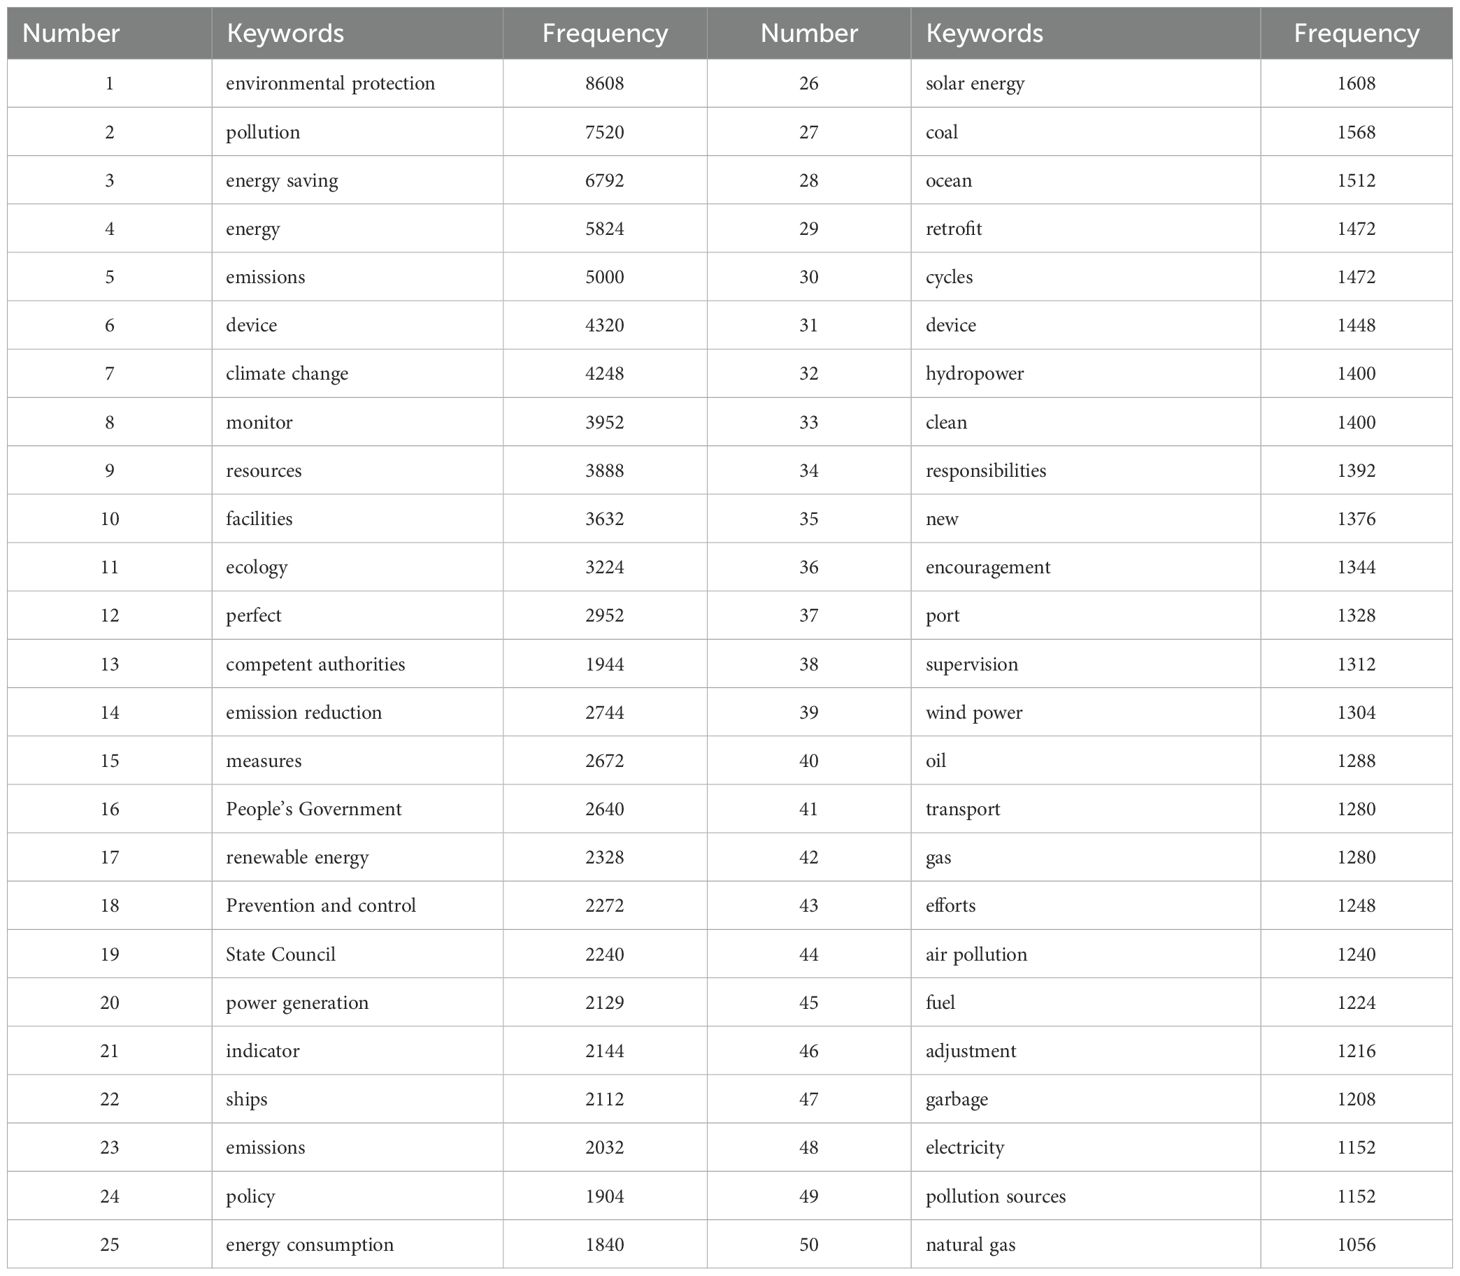
Table 3. Statistics of keyword frequency of China’s green port policies during 2001-2010.
4.1.3 Growth and development period (2011-2023)
In 2011, the Seventh National Environmental Protection Conference highlighted the need to address marine pollution and atmospheric pollutants exceeding standards, marking a new phase in China’s green port development focused on sustainability. As port operations expanded with growing trade, congestion and pollution increased, challenging both environmental and economic sustainability. In response, green port construction became central to China’s goals of “carbon peak” and “carbon neutrality” aligning economic growth with environmental protection. Policies emphasized eco-friendly ships, improved operational efficiency, reduced emissions, and strengthened environmental infrastructure. From Table 4, keywords like “energy saving”, “emission reduction” and “clean energy” reflect efforts to lower carbon emissions through cleaner energy and optimized logistics, supporting the achievement of sustainability goals.

Table 4. Statistics of keyword frequency of China’s green port policies during 2011-2023.
From K-means clustering analysis, the policy texts for 2001–2023 can be divided into the following five categories: (1) “Green transportation system planning and improvement” policy. The government plays a key role in enhancing transportation logistics and port capacity through policy guidance, infrastructure development, technological innovation, coordination, and financial support to promote sustainable industry growth. (2) “Regional ecological resource development and environmental engineering improvement” policy, which emphasizes balancing regional economic development with environmental protection by adjusting industrial structure and optimizing resource allocation. It also promotes regional integration, trans-regional ecological compensation, and cooperation to enhance ecological resource development, environmental engineering, and green port construction. (3) “Ship accident prevention and oil spill treatment” policy, which emphasizes enhancing emergency response capabilities in the shipping sector, with a focus on green port construction, environmental protection, and sustainable development. Strengthening emergency response, particularly for oil spills, helps reduce environmental pollution and damage, protecting both the port and surrounding ecosystems. This improved response capacity supports the development of green ports by enhancing environmental protection, security, risk management, and public trust, fostering a harmonious relationship between ports and the environment. (4) “Port and ship facility management” policy, which emphasizes the key responsibilities of maritime management agencies in overseeing port facilities, implementing shore power systems, preventing pollution, and conducting inspections. (5) “Port ship pollutant prevention and control” policy, which focuses on managing ship pollutants in ports, including their reception, disposal, and related environmental facilities. The policy emphasizes effective pollutant management by government agencies to promote environmental protection and sustainable development, highlighting the government’s efforts in preventing and controlling ship pollution.
China’s port green development policy has evolved through three stages: the germination period, the initial exploration period, and the growth and development period. During the germination period, Chinese government recognized the importance of green development and began formulating relevant policies and measures. As global environmental awareness grew, the transformation of ports-vital nodes in the global economic system-toward green and sustainable practices became increasingly urgent. At this stage, the government strengthened its focus on energy conservation, emission reduction and pollution prevention, setting initial goals and directions for green development. In the initial exploration period, China began implementing its green port development policies. Governments at various levels, along with enterprises, actively explored paths and models for green development. During this phase, the focus of policies shifted to monitoring pollutant levels and controlling emissions from ships. At the same time, the government invested in research, development, and promotion of green technologies in ports to support their green transformation. By the time of the growth and development period, significant progress had been made. The green development level of China’s ports improved substantially. During this stage, the policy emphasis moved toward systematization and coordination, with a focus on improving the port transportation system, developing regional ecological resources, and enhancing environmental infrastructure. The government also strengthened management of ship oil spills and port facilities to ensure effective implementation of green policies.
4.2 Policies topic analysis beyond LDA topic model
This section applies LDA for topic modeling to the policy categories of China’s green ports across three periods. LDA assumes that each policy document is a mixture of multiple latent topics, and each topic is represented by a probability distribution over a set of words. The LDA model iteratively optimizes by using Gibbs sampling to assign latent topics to each document and word until convergence. After the model training is complete, each topic is associated with a set of high-probability words, which are the keywords of the topic and reflect its core meaning. Finally, perplexity is used to evaluate the model’s performance, with a lower perplexity indicating that the model can better predict new data and that the topic extraction is more effective. Through this process, representative topics for each category of policy text can be extracted, providing a solid foundation for further analysis. The perplexity of policy texts in each category is calculated based on Equation 2, and Figure 4 illustrates the trend of perplexity for each category of policy text as the number of topics changes.
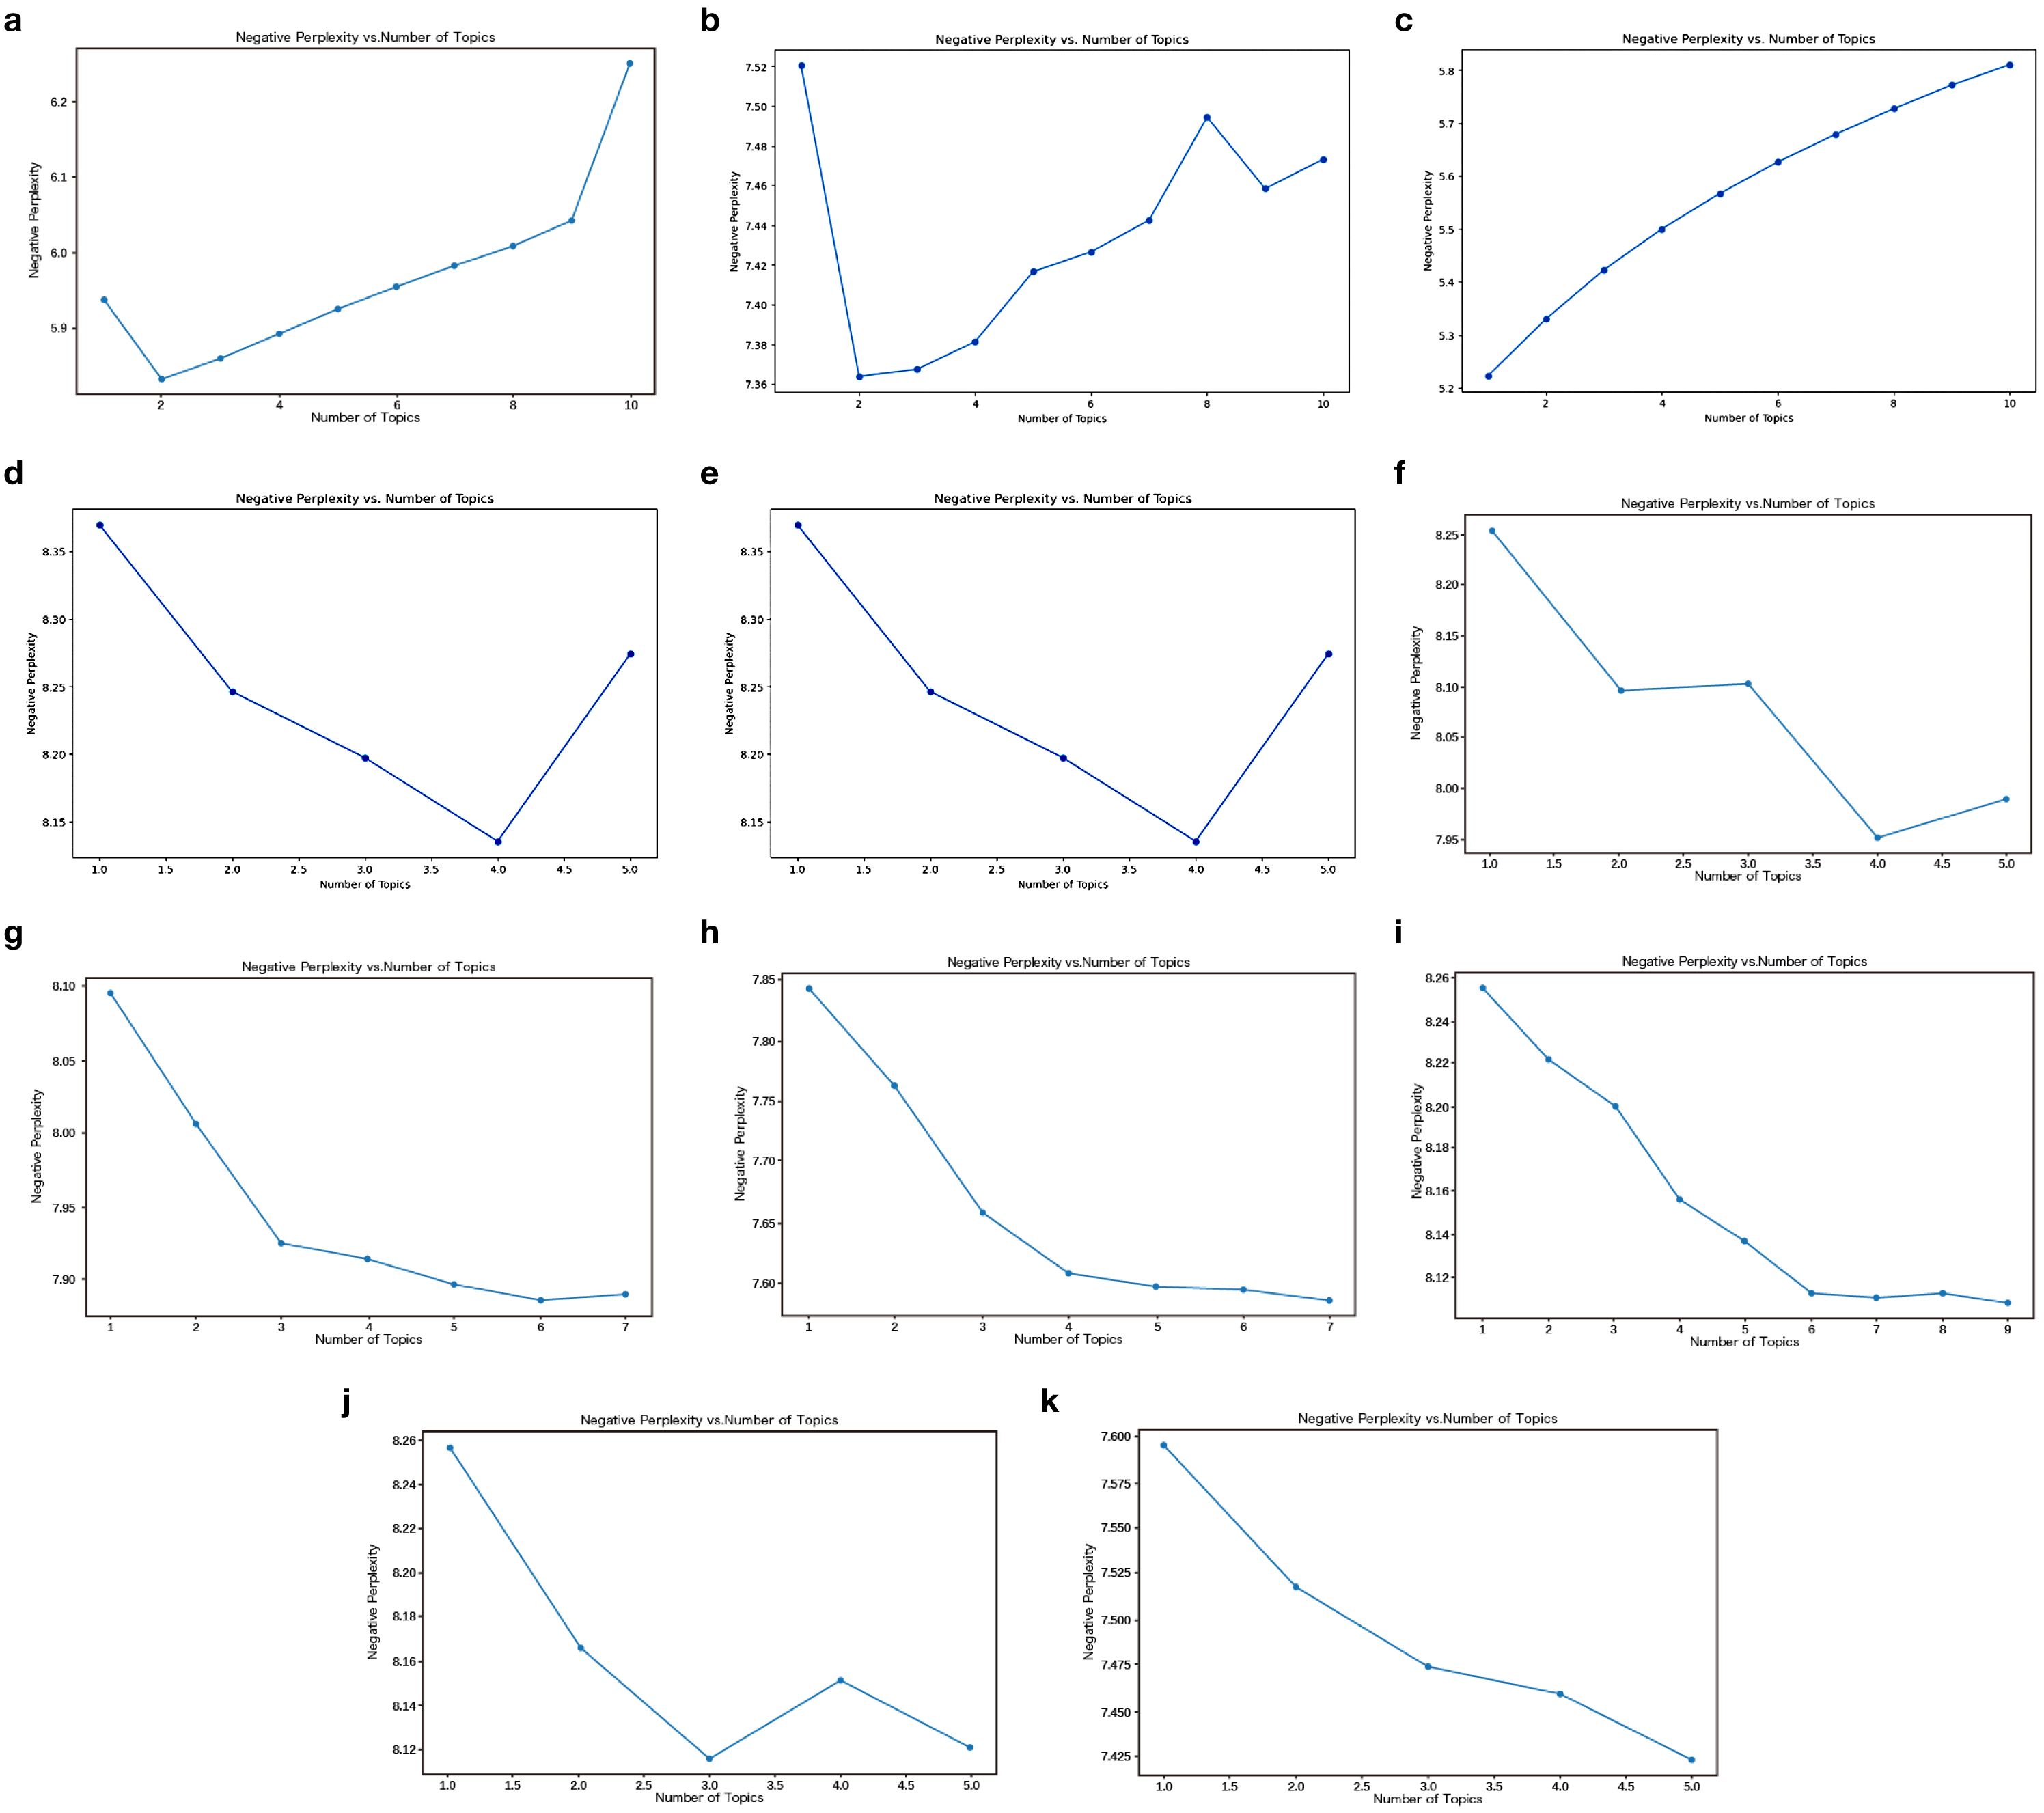
Figure 4. The degree of confusion varies with the number of topics (Kij denotes the degree of confusion, where i represents the three periods of China’s green port policy, and j represents the categories of policy texts in each period.). (a) The degree of confusion K11. (b) The degree of confusion K12. (c) The degree of confusion K13. (d) The degree of confusion K21. (e) The degree of confusion K22. (f) The degree of confusion K23. (g) The degree of confusion K31. (h) The degree of confusion K32. (i) The degree of confusion K33. (j) The degree of confusion K34. (k) The degree of confusion K35.
4.2.1 Topic analysis of policies from 1980 to 2000
4.2.1.1 “Pollution prevention and control” policy text mining
According to the degree of confusion in Figure 4a, the perplexity is lowest when the number of topics is 2, hence the number of topics for “pollution prevention and control” policy is determined to be 2. Following the subject terms in Table 5, topic 1 “energy utilization and circular economy” indicates that the government has implemented policies aimed at reducing energy consumption and waste, developing new energy sources, maintaining energy-consuming equipment, and promoting energy reuse. These measures collectively form a policy system designed to advance energy utilization and the circular economy, with the goals of improving energy efficiency, enhancing resource recycling, and fostering environmental protection through policy guidance, thereby supporting sustainable development. Topic 2 “air pollution prevention and environmental protection supervision” mainly involves the role and responsibility of government agencies, the source and impact of air pollution, economic punishment measures, environmental protection facilities and emission standards. Together, these measures constitute a policy system for air pollution prevention and environmental protection aimed at protecting the ecological environment.
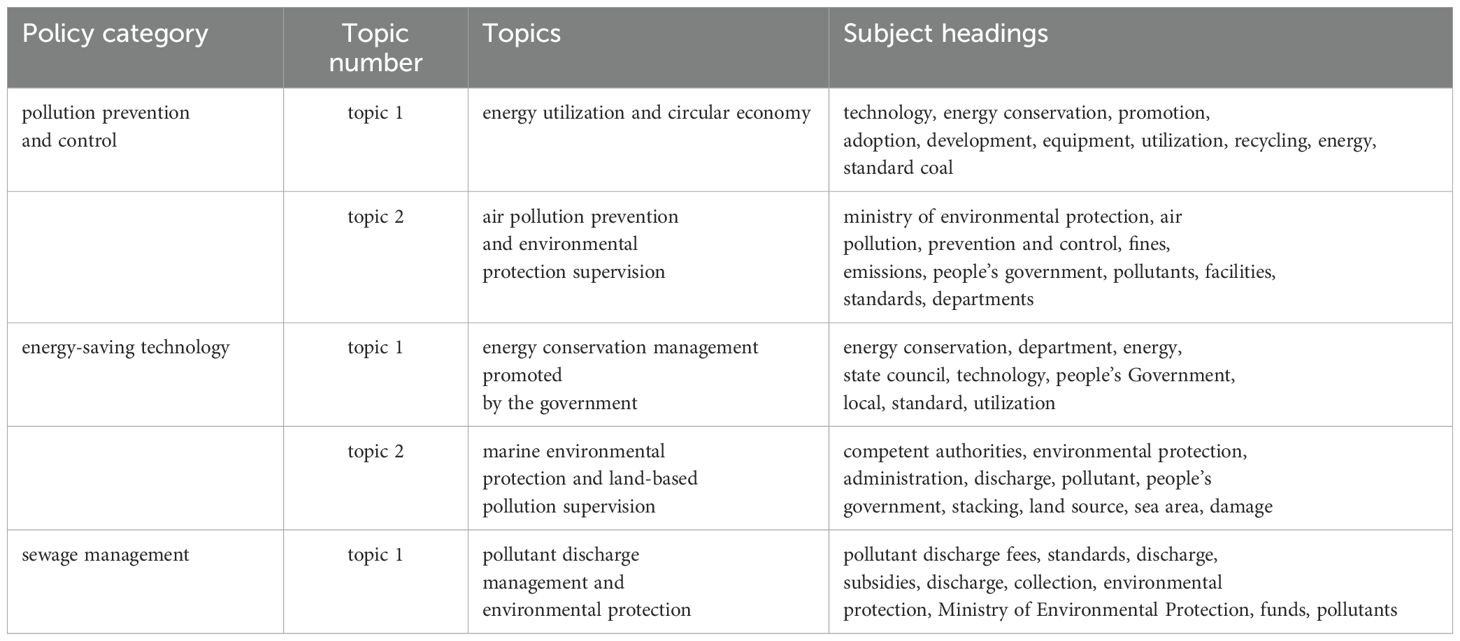
Table 5. Topics and subject headings of China’s green port policies during 1980-2000.
4.2.1.2 “Energy utilization and energy-saving technology” policy text mining
The number of topics of “energy utilization and energy-saving technology” policy is 2 based on Figure 4b. Following the subject terms in Table 5, topic 1 “energy conservation management promoted by the government” covers energy conservation management and policy formulation and implementation at the government level, including the roles and responsibilities of The State Council and local governments, research and development and application of energy conservation technologies, and the development and enforcement of energy conservation standards. By formulating energy conservation laws and standards, the government defines energy conservation goals and requirements, standardizes energy consumption behaviors in various industries and fields, and promotes energy conservation work and achieves efficient use of energy. Topic 2 can be summarized as “marine environmental protection and land-based pollution supervision”. The government plays a crucial role in the process of marine environmental protection and land-based pollution supervision. The government effectively promotes the progress of marine environmental protection and land-based pollution management through the formulation of laws and standards, supervision and law enforcement, economic incentives, publicity and education, technical support and research and development.
4.2.1.3 “Sewage management” policy text mining
As shown in Figure 4c, the perplexity value increases with the number of topics. Therefore, the number of topics corresponding to the lowest perplexity is 1, and thus the optimal number of topics is finally determined to be 1. In view of Table 5, topic 1 can be summarized as “pollutant discharge management and environmental protection”. Government policy means play a vital role in pollutant discharge management and environmental protection. By making laws and regulations, strengthening supervision, providing economic incentives, technical support and publicity and education, the government can effectively promote the progress of sewage management and environmental protection, and protect the quality of the water environment and the overall ecological environment.
From 1980 to 2000, policies issued by Chinese government gradually focused on “energy utilization and circular economy” and “marine environmental protection and land-based pollution control”, with increasing attention given to port environmental protection issues by government departments. However, during this period, the number of policies specifically addressing green ports was relatively low, and most of them concentrated on areas such as “energy utilization”, “energy-saving management” and “environmental protection”. Despite the limited number of green port policies, these initiatives significantly raised environmental awareness among port enterprises and drove improvements and innovations in energy use, energy-saving management, and environmental protection, thereby laying a solid foundation for the subsequent development of green port construction.
4.2.2 Topic analysis of various policies from 2001 to 2010
4.2.2.1 “Technological innovation leads the development of green port projects” policy text mining
From Figure 4d, the perplexity is lowest when the number of topics is 4, hence the number of topics of “technological innovation leads the development of green port projects” policy is 4. Following its keywords in Table 6, topic 1 “technological innovation and investment in vehicle and ship system transformation” reflects that in the vehicle and vessel industry, technological innovation and system transformation to promote the development of new equipment and devices, as well as the corresponding investment support, through the vehicle and vessel system transformation, to achieve the purpose of reducing energy consumption and low carbon emissions. Topic 2 “technological innovation and project development” indicates that green port construction is inseparable from technological innovation and project development. Government departments promote green port construction by supporting port technological innovation and project development. Topic 3 “technological innovation and export-oriented engineering design” highlights the role of technological innovation and engineering design in the energy saving and emission reduction equipment of green ports, reduces the impact of port operation on the environment through the use of advanced technology and equipment, and provides technical support for the green development of ports in other countries and regions through the export of engineering technology. Topic 4 “sino-foreign technical cooperation and new equipment development” reflects the joint efforts between Chinese and foreign enterprises in technical cooperation, new equipment development and design. Through strengthening international cooperation, introducing advanced technology, developing new equipment and other measures, the construction and continuous development of green ports can be promoted, and the coordinated development of port economy and environmental protection can be achieved.
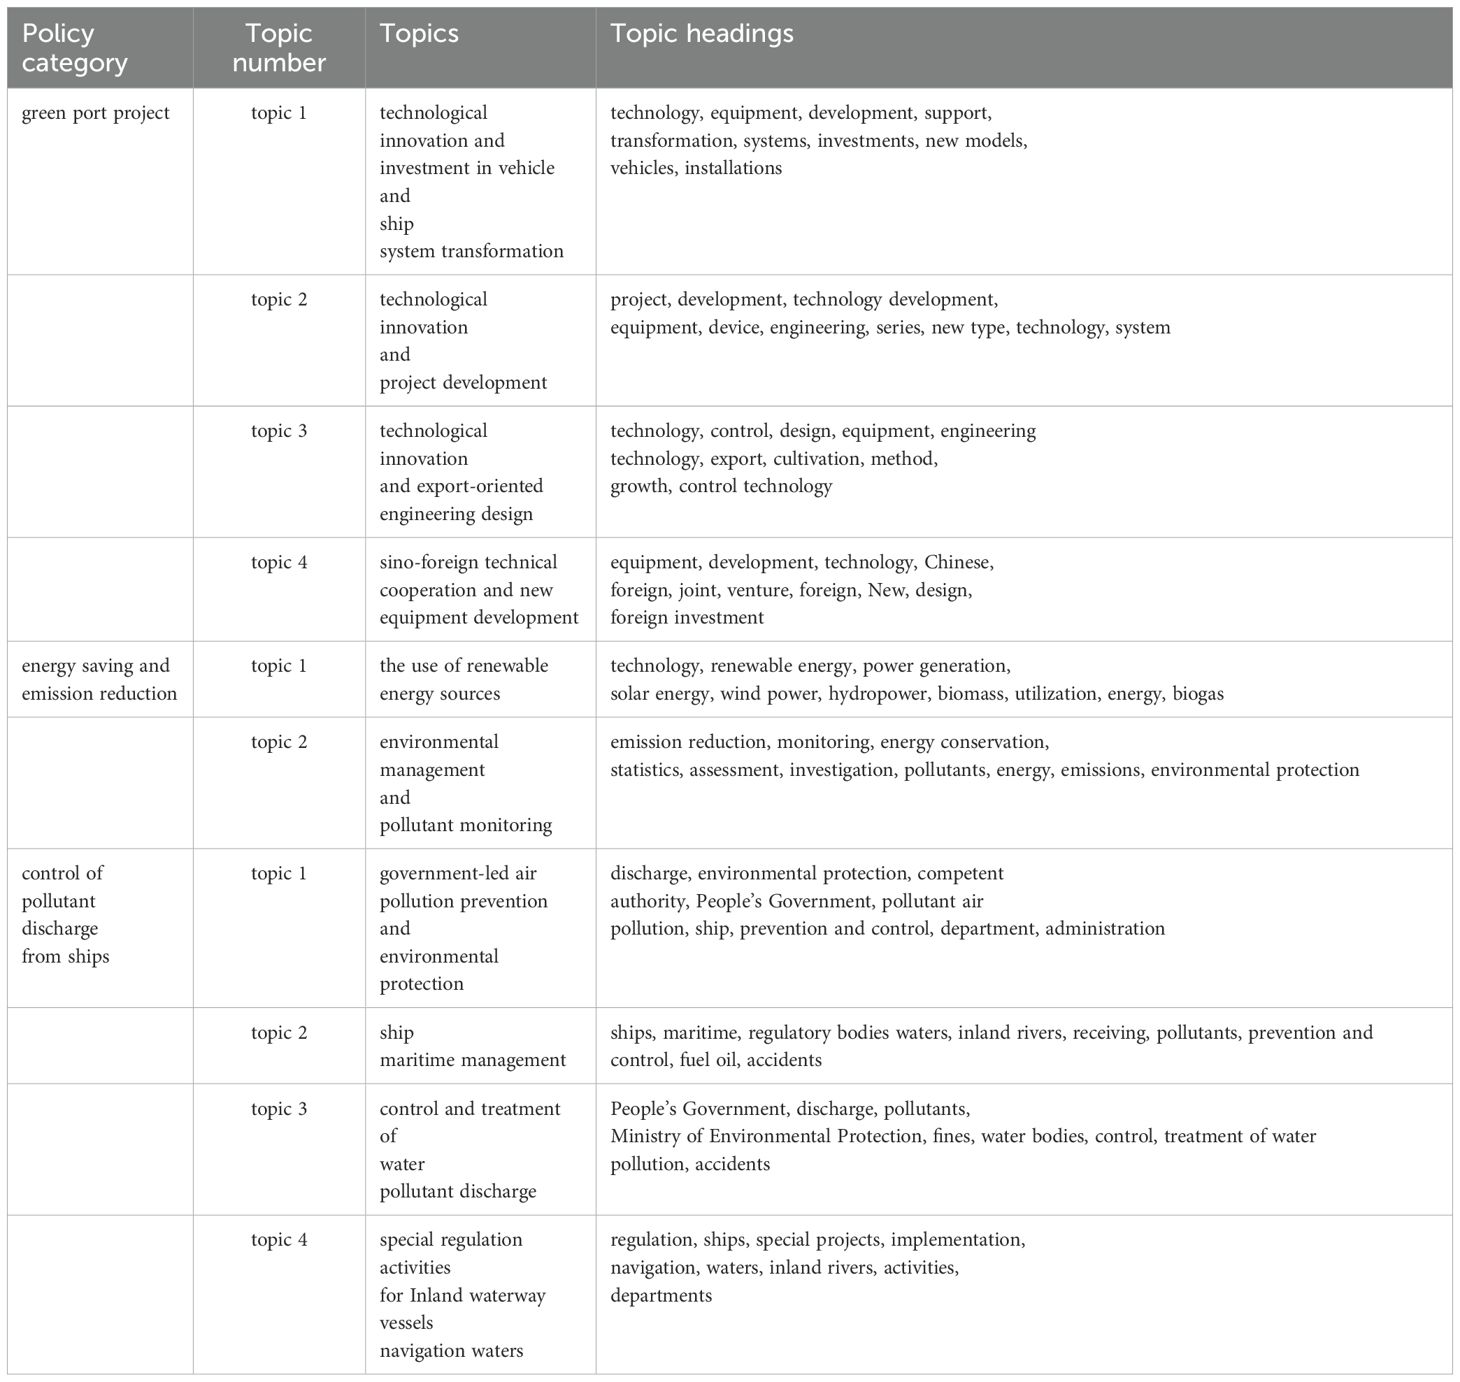
Table 6. Topics and subject headings of China’s green port policies during 2001-2010.
4.2.2.2 “Energy conservation, emission reduction and pollutant monitoring and assessment” policy text mining
The number of topics of “energy conservation, emission reduction and pollutant monitoring and assessment” policy is 2 according to Figure 4e. Topic 1 “the use of renewable energy sources” highlights the importance of renewable energy technologies, with particular emphasis on the application of solar, wind, hydropower and biomass in power generation and energy use. Biogas, as a form of biomass energy utilization, is reflected in this topic. Through technological innovation and the use of renewable energy, carbon emissions can be effectively reduced, sustainable use of energy and environmental protection can be achieved. Topic 2 “environmental management and pollutant monitoring” emphasizes the role of monitoring, statistics, assessment and other means in the management and control of pollutant emissions and energy efficiency. Through effective monitoring and statistics, the government can accurately understand the emissions and energy use, and then promote the implementation of energy conservation and emission reduction measures through assessment and investigation.
4.2.2.3 “Ship pollutant emission control” policy text mining
The number of topics of “ship pollutant emission control” policy is 4 in view of Figure 4f. Based on the keywords in Table 6, topic 1 “government-led air pollution prevention and environmental protection” emphasizes emphasizes the government’s role in controlling emissions from sources like ships to reduce air pollution and protect the environment. Topic 2 “ship maritime management” focuses on the responsibilities of maritime agencies in managing pollutants from ships in inland waters, ensuring compliance with pollution treatment regulations to protect the water environment. Topic 3 “control and treatment of water pollutant discharge” highlights the role of the government and the Ministry of Environmental Protection in regulating and penalizing pollutant discharges to safeguard water quality and ecology. Topic 4 “special regulation activities for Inland waterway vessels navigation waters” underscores the importance of managing inland vessel navigation and waterway safety, aiming to build green ports and promote sustainable development.
From 2001 to 2010, China’s green ports entered a period of rapid development. As global climate change became an increasingly pressing issue, carbon emission control was gradually incorporated into the green port policy framework. During this period, the Chinese government placed growing emphasis on green port construction, with an increase in the number of policies released and a broader range of policy content. This included emerging areas such as “technological innovation leading green port project development”, “renewable energy utilization” and “technological innovation and transformation of vessel and vehicle systems”.
4.2.3 Topic analysis of policies from 2011 to 2023
4.2.3.1 “Green transportation system planning and improvement” policy text mining
From Figure 4g, when the number of topics is 3, the perplexity curve shows the largest decrease. As the number of topics continues to increase, the downward trend in perplexity becomes less noticeable. Moreover, an excessive number of topics may lead to overfitting. Therefore the number of topics for “green transportation system planning and improvement” policy is determined to be 3. According to the subject words in Table 7, the three topics can be summarized as follows: Topic 1 “green transportation technology and logistics system enhancement” focuses on improving port logistics through system upgrades, capacity building, and development to enhance efficiency and reduce resource waste and environmental impact. Topic 2 “international shipping planning and port facilities improvement” emphasizes the development of international shipping, port infrastructure, and waterways to boost the internationalization of Yangtze River shipping and promote trade and logistics exchanges. Topic 3 “green port hazardous chemicals management and facility construction” aims at safely managing hazardous chemicals in ports to prevent marine pollution, with a focus on planning and building appropriate facilities.
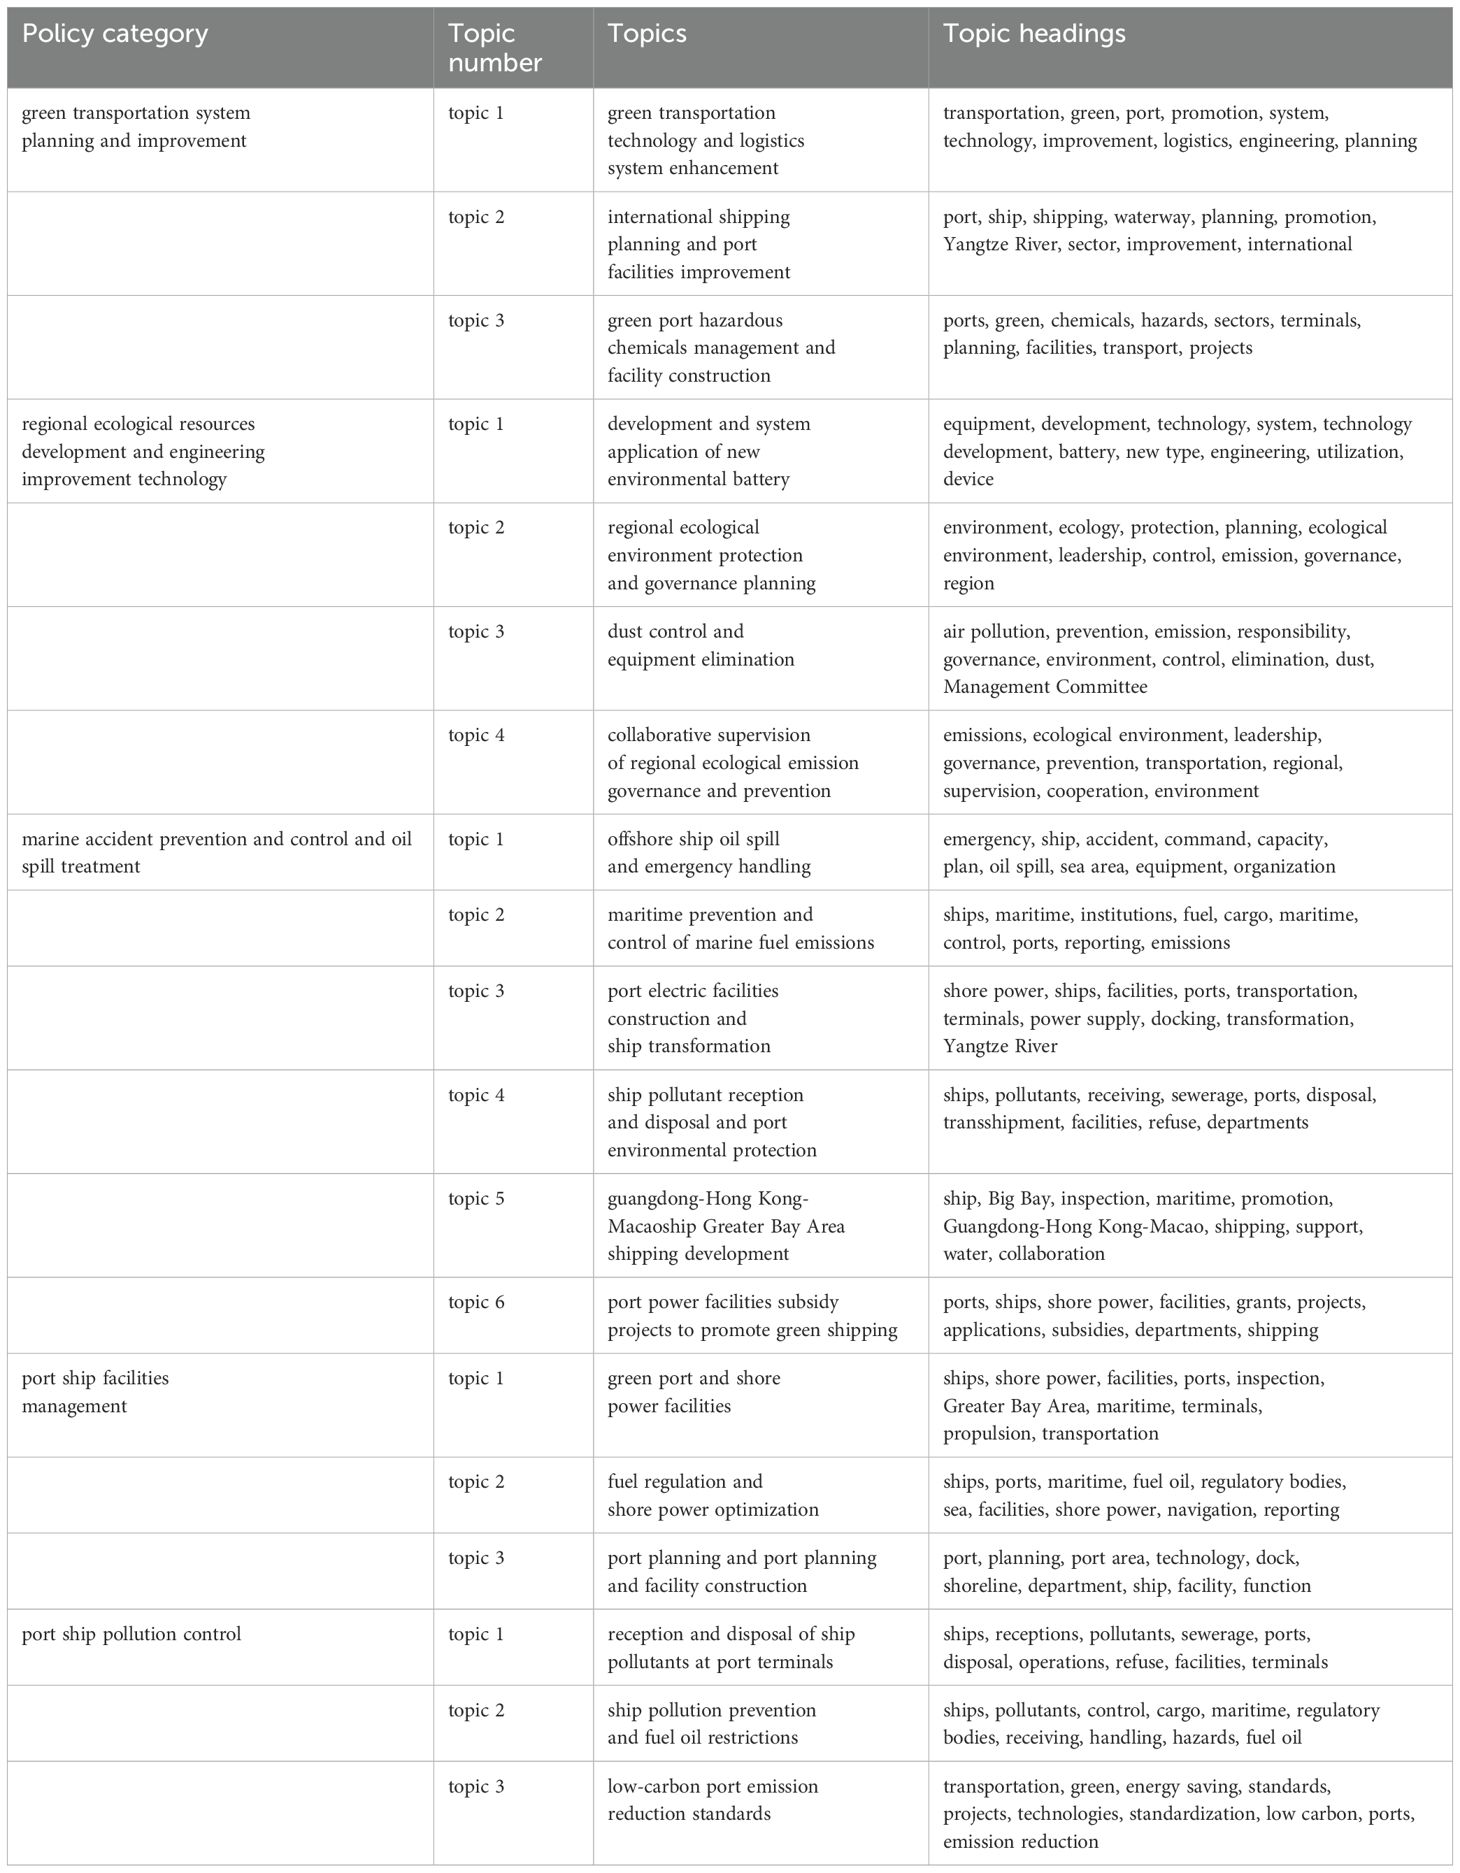
Table 7. Topics and subject headings of China’s green port policies during 2011-2023.
4.2.3.2 “Regional ecological resources development and environmental engineering improvement” policy text mining
As shown in Table 7, “regional ecological resources development and environmental engineering improvement” policy covers 3 topics based on Figure 4h, which can be summarized as follows: Topic 1 “development and system application of new battery technology” focuses on green ports balancing environmental impact and economic benefits, with new batteries offering high energy, low cost, and eco-friendly solutions. Topic 2 “regional ecological environment protection and governance planning” emphasizes the importance of regional ecological management for sustainable development, with green port construction serving as a practical implementation. Topic 3 “dust control and equipment elimination” addresses policy efforts to reduce pollutant emissions through eliminating old vehicles and ships, and managing dust pollution in port areas. Topic 4 “collaborative supervision of regional ecological emission governance and prevention” highlights the role of leading units in overseeing and promoting green port development, ensuring ecological protection and sustainable growth.
4.2.3.3 “Ship accident prevention and control and oil spill treatment” policy text mining
As illustrated in Table 7, “ship accident prevention and control and oil spill treatment” policy covers 6 topics based on Figure 4i, which can be summarized as follows: Topic 1 “offshore ship oil spill and emergency handling” focuses on emergency response, from planning to coordination and implementation, ensuring quick, effective action to mitigate environmental, safety, and economic impacts during maritime accidents. Topic 2 “maritime prevention and control of marine fuel emissions” emphasizes the regulation of marine fuel emissions by maritime agencies to protect the marine environment. Topic 3 “port electric facilities construction and ship transformation” aims to reduce ship fuel consumption and emissions during port calls by developing shore power facilities, supporting green shipping. Topic 4 “ship pollutant reception and disposal and port environmental protection” highlights the role of ports in managing ship pollutants and maintaining a clean marine environment. Topic 5 “Guangdong-Hong Kong-Macao Greater Bay Area shipping development” focuses on enhancing maritime collaboration and ensuring safe, compliant shipping in the Greater Bay Area. Topic 6 “port power facilities subsidy projects to promote green shipping” encourages the use of shore power through government subsidies to reduce emissions and support sustainable shipping.
4.2.3.4 “Port ship facility management” policy text mining
Figure 4j and Table 7 show that “port ship facility management” policy covers 3 topics. Topic 1 “green port and shore power facilities” focuses on reducing ship emissions during docking, promoting sustainable port and transport development, and ensuring safety and compliance through government and maritime oversight. Topic 2 “fuel regulation and shore power optimization” indicates that Maritime authorities regulate ship fuel use and emissions, enforcing laws to prevent pollution and maintain ecological sustainability in ports. Topic 3 “port planning and facility construction” emphasizes technological innovation in port planning, balancing ship operations with environmental protection, and guiding green transformation and sustainable development through policy-driven planning.
4.2.3.5 “Port ship pollution control” policy text mining
As shown in Figure 4k and Table 7, “port ship pollution control” policy contains the following 3 topics. Topic 1 “reception and disposal of ship pollutants at port terminals” optimizes facilities for pollutant disposal reduces direct discharges into water and the environment, enhancing overall environmental protection and supporting green port development. Topic 2 “ship pollution prevention and fuel oil restrictions” strengthens pollution reception and prevention reduces harm to waters and the environment, ensuring safety in cargo transport and promoting green shipping through maritime administration. Topic 3 “low-carbon port emission reduction standards” aims to standardize and implement projects for energy conservation, emission reduction, and sustainable development in the port and transportation sectors.
From 2011 to 2023, China’s green port policies evolved from deepening development to comprehensive optimization, with green port construction becoming a key focus of port development. The government introduced a series of specific policies to encourage port operators and enterprises to participate. During this period, ports widely adopted eco-friendly equipment and technologies, such as facility upgrades, shore power supply systems, and the use of new energy vessels, significantly reducing ship emissions. At the same time, energy conservation and emissions reduction were actively promoted, with innovative measures taken to improve operational efficiency and environmental performance.
4.3 Analysis on the characteristics of policy evolution
According to the clustering and keywords analysis of China’s green port policies from 1980 to 2023, we find that the development of China’s green port policy has the following trend characteristics:
4.3.1 The policy focus shifted from environmental protection to sustainable development
From the 1990s to the early 2000s, China’s green port policies mainly focused on environmental protection and pollution control, addressing emissions of pollutants such as exhaust gases, waste water, and noise during port operations, aiming to reduce the negative impact on the surrounding ecosystem. With the deepening of the green development concept, policies gradually transitioned to more comprehensive sustainable development goals, covering areas such as low-carbon economy, resource conservation, and energy efficiency. Emphasis began to be placed on the lifecycle management of green ports, alongside the promotion of green technologies and renewable energy applications.
4.3.2 The policy-makers shifted from government to industry and local governments
In the early stages of China’s green port policy, the formulation and implementation of policies were primarily led by the central government, especially by the Ministry of Transport and the Ministry of Environmental Protection, which issued a series of documents on port pollution control and environmental protection. As the construction of green ports deepened, the roles of local governments and industry associations gradually became more prominent. Local governments introduced region-specific policies based on the actual conditions of their ports, and the government also strengthened communication and cooperation with port enterprises, research institutions, and the public. The diversification of policy bodies enhanced the flexibility and targeting of the policies.
4.3.3 Policy management shifted from a single approach to comprehensive management
In the early stages, green port policies primarily relied on environmental regulations and administrative management to achieve their goals, with a focus on controlling the environmental impacts of port operations. In recent years, with the expansion of the green port concept, policy management has gradually transitioned to a more integrated approach. The government not only set environmental protection requirements but also encouraged ports to adopt energy-saving and emissions-reducing measures, promoted the application of green technologies, and facilitated the transition to a low-carbon economy. At the same time, market mechanisms have been gradually introduced into policy management, with incentive policies such as fiscal subsidies and tax breaks guiding enterprises to actively participate in green transformation.
5 Evaluation of green ports policies
An initial policy document library containing 441 China’s green port policies is established. The term frequency-inverse document frequency (TF-IDF) method is used to convert these policy texts into feature vectors, which gauges the significance of a word within a particular set of documents or corpus. Then the cosine similarity is employed to calculate the correlation of each two vectors X and Y, which is given as follows:
where represents the inner product of vectors X and Y. stands for Euclidean norm. This paper selects 17 strategy texts from the initial strategy document library, which are closely related to the topics of “green, port, ship, air pollution, carbon emission” and the correlation coefficient is greater than 0.1. In addition, two policy documents have been added that are closely related to “green ports”, “carbon peak” and “carbon neutrality”. Finally, 19 representative databases of China’s green port policies were established, including 9 national policies and 10 local policies, as shown in Table 8.
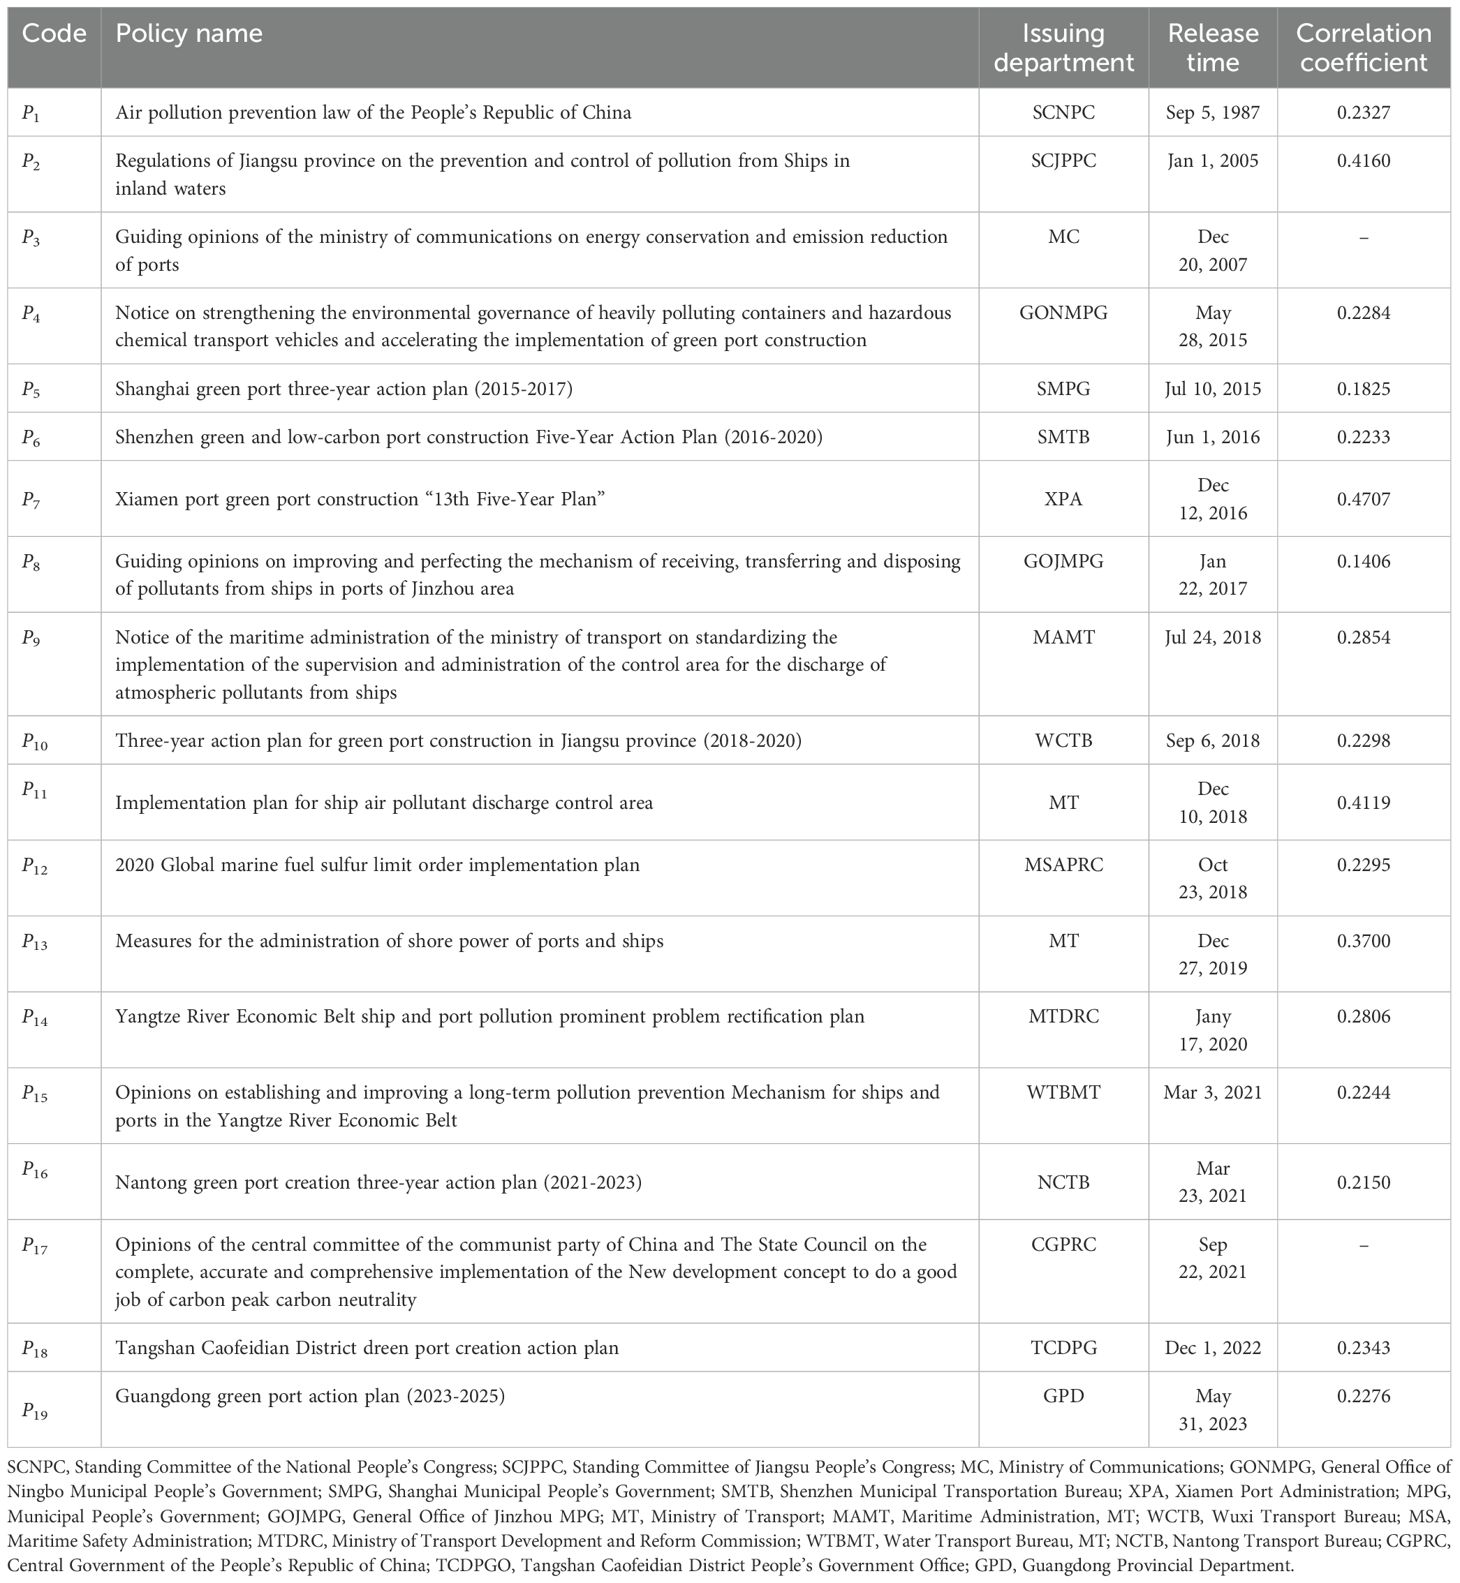
Table 8. China’s representative policies related to green port since 1987.
5.1 PMC model construction for green port policies
5.1.1 PMC index system construction
According to the policy categories summarized by the LDA model, the theme of each policy category, and the selected 19 policy contents, the index system of PMC model is established. According to the study of (Estrada, 2011), policy evaluation indicators are divided into 9 first-level indicators and 36 second-level indicators, and the importance and weight of the second-level indicators are the same. If the second-level indicators are involved in the policy text, the value is 1; otherwise, the value is 0. Table 9 shows the primary and secondary indicators of the green port policy.
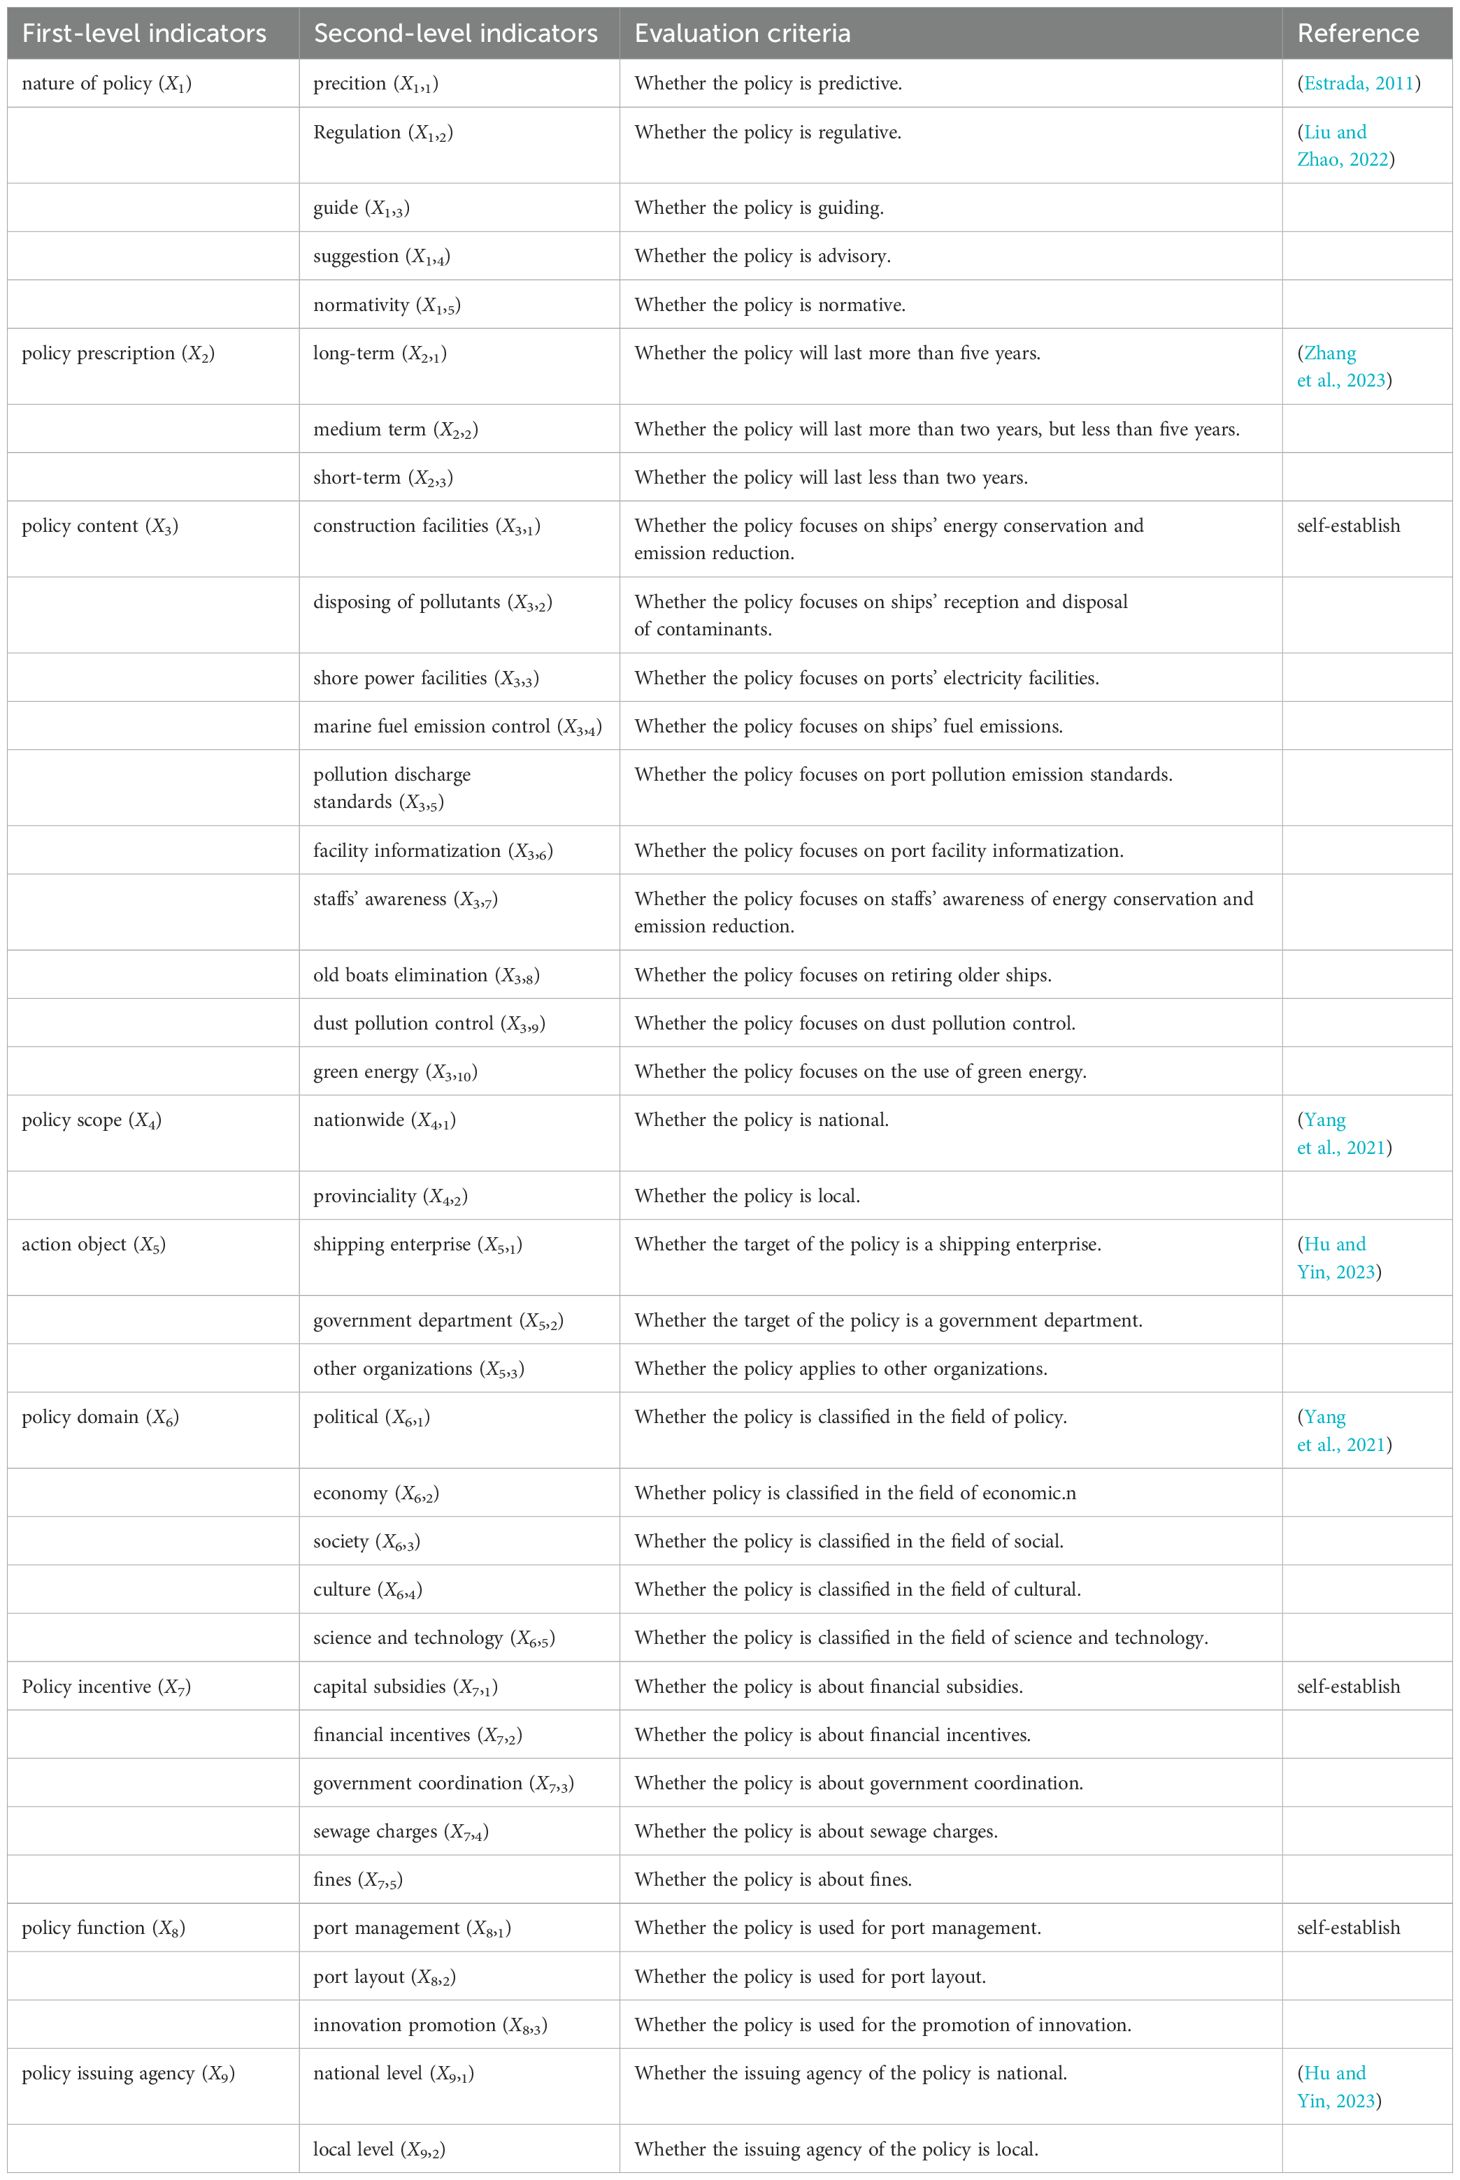
Table 9. Variables setting for evaluation of China’s representative green port policies.
Estrada’s PMC grading index standard has certain value in assessing port management capabilities, but it has some limitations in terms of green development when applied to China’s context. China’s green port policy emphasizes environmental protection, emission reduction, and sustainable development, while the Estrada standard mainly focuses on port management efficiency and operational capacity, without fully covering key areas such as environmental protection measures and the application of green technologies. Specifically, China’s green port policy not only concerns the environmental impact of ports themselves but also involves ecological protection and social responsibility for the surrounding communities. Therefore, in constructing the PMC model, this paper incorporates indicators related to green development, such as energy conservation and emission reduction, use of green energy, and low-carbon transportation. It also integrates core areas of China’s green port policy and its implementing entities. Additionally, considering the specificity of China’s port policy, the model incorporates policy incentives and penalties to assess the effectiveness of policy implementation and the ports’ responsiveness. Through these improvements, the PMC standard can more comprehensively reflect the actual needs of China’s green port policy, enhancing its guidance and adaptability to the green transformation process.
5.1.2 Calculate the PMC index
To more intuitively judge the merits and demerits of the policy, the obtained index needs to be graded. According to (Estrada, 2011), the PMC index is divided into four grades according to score: perfect (8’-9’), excellent (6’-7.99’), acceptable (4’-5.99’) and bad (0-3.99’). According to formula (5), the PMC index of green port policy is obtained, as shown in Table 10. In the policy evaluation scale, 3 policies are rated “excellent” and 16 policies are rated “acceptable”. Among these policies, the policy P3 scores the highest at 6.88. The policy P9 scores the lowest at 4.33. According to the PMC index of all policies, the average PMC index is 5.28, which belongs to the “acceptable”. According to the above data, the vast majority of policies are more comprehensive, but there is still room for optimization.

Table 10. PMC index of China’s representative green port policies.
5.1.3 Draw PMC surface diagram
To more intuitively assess the internal consistency of the policies, the first-level variable scores of 19 policies were transformed into a 3×3 matrix. The PMC surface graphs of all policies as shown in Figure 5, which represents the evaluation result of the policy according to different surface colors and the degree of convex. The concave surface indicates the lower the score. The PMC surface maps for each policy reveal noticeable unevenness, indicating inconsistencies in the scores across various indicators. The unevenness highlights the differences in policy content, objectives, and implementation strategies among the documents. Such variations are a natural part of the policymaking process, as documents from different levels and departments must be tailored to their specific socio-economic and environmental contexts to address the unique needs of various segments and levels.
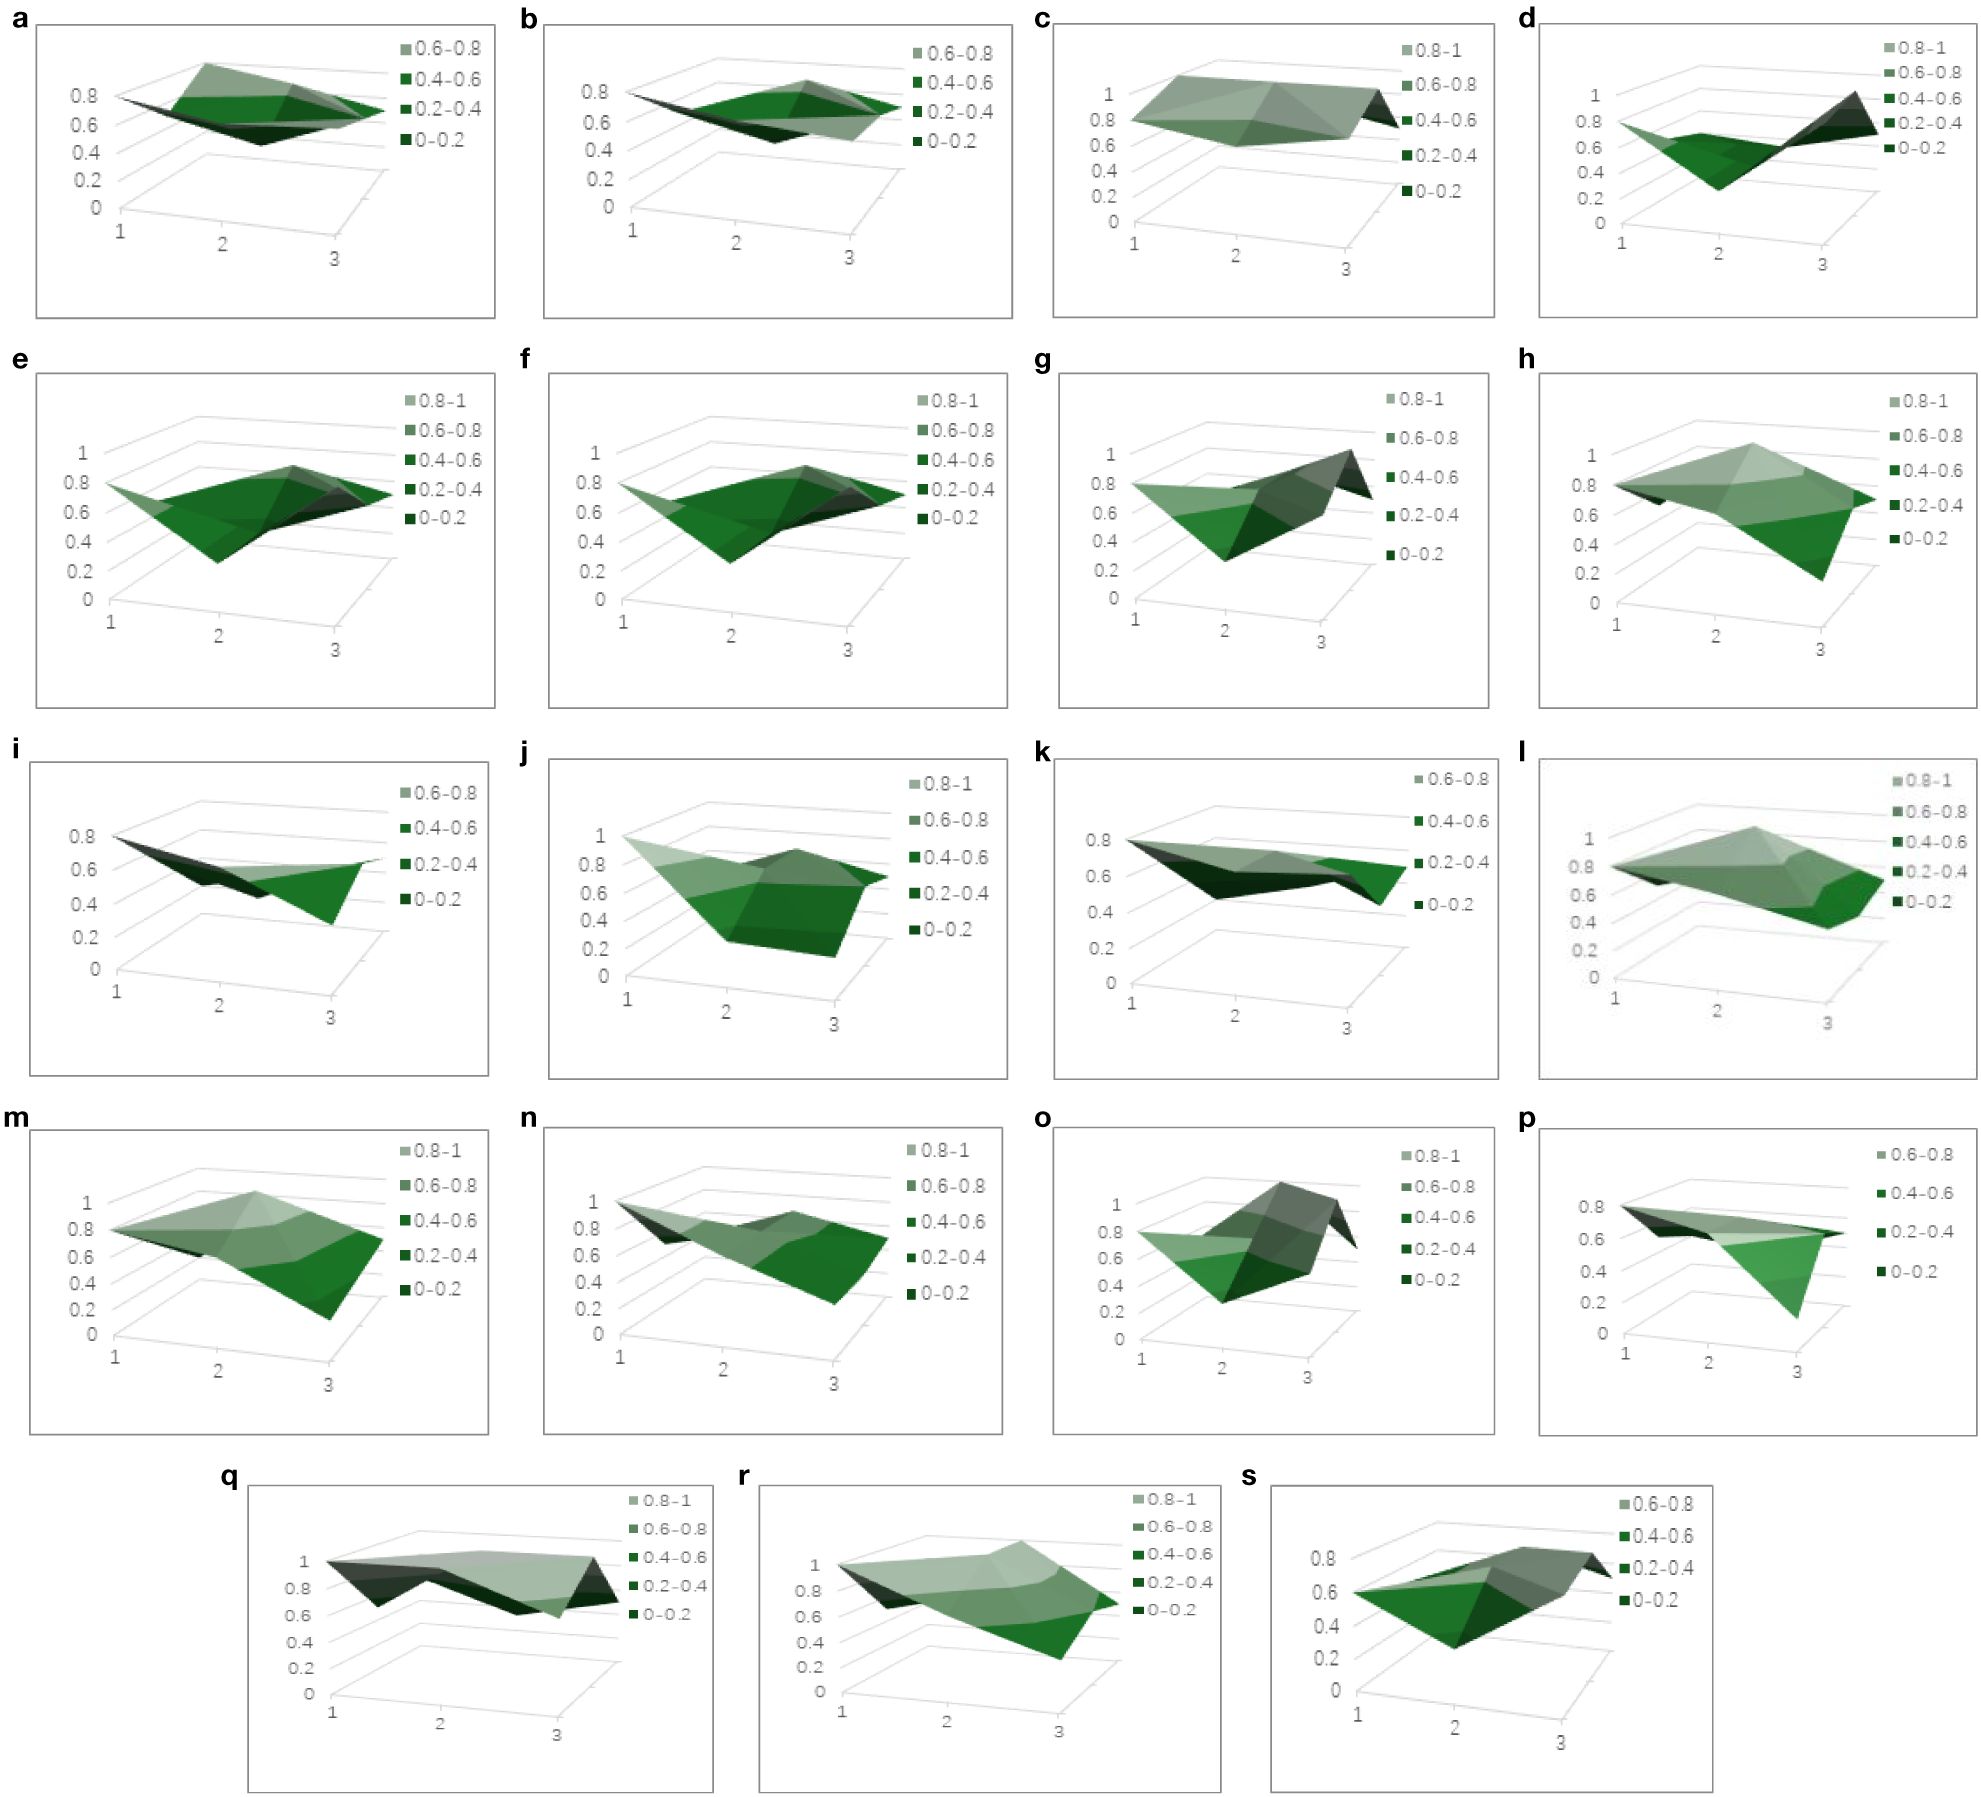
Figure 5. PMC surface plots of China’s representative green port policies. (a) PMC surface for policy P1. (b) PMC surface for policy P2. (c) PMC surface for policy P3. (d) PMC surface for policy P4. (e) PMC surface for policy P5. (f) PMC surface for policy P6. (g) PMC surface for policy P7. (h) PMC surface for policy P8. (i) PMC surface for policy P9. (j) PMC surface for policy P10. (k) PMC surface for policy P11. (l) PMC surface for policy P12. (m) PMC surface for policy P13. (n) PMC surface for policy P14. (o) PMC surface for policy P15. (p) PMC surface for policy P16. (q) PMC surface for policy P17. (r) PMC surface for policy P18. (s) PMC surface for policy P19.
5.2 China’s green port policy beyond the PMC model
5.2.1 Overall evaluation of policies
In both national and local policy documents, there are policies with high and low PMC index scores. This indicates that, at both the national and local levels, there are differences in the quality and effectiveness of policies. Policies with higher scores typically contain practical and feasible measures that can effectively address specific issues and promote the development of green ports. However, these policies often lack compulsory measures such as “rewards” and “punishments”. Therefore, to enhance policy implementation, it is important to strengthen compulsory measures like rewards and penalties. Policies with lower scores tend to have shortcomings in certain areas, such as incomplete content, insufficient incentives and penalties, and limited scope of application. These differences arise from the combined influence of multiple factors. On one hand, different policies target different issues and fields, each with varying complexity and difficulty of implementation. As a result, even policies at the same level may have differing scores due to the specific characteristics and requirements of the policy itself. On the other hand, the formulation and implementation of policies are influenced by various factors, including political environment, economic conditions, and socio-cultural background. Changes in these factors can significantly affect the quality and effectiveness of policies.
The formulation of local policies is not necessarily related. The policies P9, P11, P12 are national policies derived from the implementation of green port policies by provinces, ignoring “port layout” and “emission reduction technology innovation”. The policies P6, P8, P16 are the policies issued by the region for the construction of green ports, ignoring “port layout” and “emission reduction technology innovation”. Local governments usually formulate policies and measures in line with local characteristics according to the guidance and requirements of national policies, combined with local economic, social, cultural and other specific conditions. Thus, if a specific measure is lacking in a national policy, the local government is likely to lack it accordingly. The implementation policies of the Ministry of Transport and the Maritime Safety Administration in various places did not take into account the development status and existing problems of the provinces, and most provinces and cities applied the principles and frameworks of the central policy documents, which lacked relevance and easily caused a waste of resources.
The structure of China’s green port policy tools is unbalanced, and the use of reward and punishment policy tools is less. At present, the green port construction is still in the development stage, and a mature green port policy system has not yet been formed. Most of the relevant policies and regulations are normative policy documents such as administrative regulations, and there is a lack of safeguard measures for the implementation of green port policies in various places. The policies P10 and P16 are all policy documents aimed at the construction of green ports, ignoring the indicators of “ship fuel emission control”, “port facility informatization” and “elimination of old vehicles and ships”, which play an important role in port cleanliness and the construction of green ports. The policies of government departments involve a relatively macro scope and lack specific measures, but this also leaves a certain degree of autonomy and flexibility for subordinate departments to better adapt to the actual situation and make targeted adjustments.
5.2.2 Evaluation of respective policies
Among the “excellent” policies, the national policy P3 and the regional policy P18 with the highest scores are selected. Among the “acceptable” policies, the national policy P9 and the local policy P16 with the lowest PMC scores are selected. In addition, the policy P17 is a policy document on “carbon peak” and “carbon neutrality” first released by the Central People’s Government of the People’s Republic of China on September 22, 2021, which has important guiding significance for China’s carbon emission reduction cause.
5.2.2.1 “Excellent” representative policy evaluation
Policy P3 is a national policy issued by the Ministry of Communications, which aims to change the development mode of port economy, promote the development of port circular economy, and effectively implement energy conservation and emission reduction measures. The scores of X4, X5 and X6 are all 1, indicating that the policy is broad in coverage, target and policy area. However, X7 has the lowest score, pointing out the lack of incentives and penalties such as “subsidies”, “pollution charges” and “fines” in the policy. Incentive and punishment measures are the key means in the implementation of the policy, through the adjustment of economic interests can effectively guide the social behavior to get closer to the policy goal. Therefore, in the process of policy formulation, the use of these incentives and penalties should be fully considered to ensure the effective implementation of the policy and achieve the expected effect.
Policy P18 is a local policy issued by the People’s Government of Caofeidian District, Tangshan City. The highest scores of X1, X5 and X8 indicate that the policy is an important part of regional development, the targeted areas are very clear, and the problems that the policy aims to solve have high practical utility. The lowest scores of X3 and X7 indicate the lack of policies related to energy conservation and emission reduction of port ships and incentive and punishment measures, which makes it difficult for ports to achieve the goal of sustainable development. Therefore, when formulating relevant policies, these aspects should be fully considered to ensure the comprehensiveness and effectiveness of the policies. The policy P18, issued by the People’s Government of Caofeidian District, Tangshan City, scores highest in X1, X5 and X8, reflecting its significant role in regional development, clear targeting, and high practical utility. However, the lowest scores in X3 and X7 highlight deficiencies in energy conservation and emission reduction measures for port ships, as well as in incentive and penalty mechanisms. These gaps hinder the ports’ ability to achieve sustainable development. To ensure comprehensive and effective policies, these aspects should be thoroughly addressed in future policy formulations.
5.2.2.2 “Acceptable” representative policy evaluation
Policy P9 is a regulation issued by the Ministry of Transport’s Maritime Safety Administration to strengthen the control of ship air pollution emission control areas, with a PMC index score of 4.33. The policy has lower scores for X3, X5, X7 and X8, and lacks provisions on port energy-saving and emission-reduction equipment, emission standards, port facility informatization, increasing staff awareness of energy-saving and emission reduction, phasing out old ships, and dust pollution prevention. While the policy focuses on ship fuel, equipment, and shore power usage, the supervision of ship air pollution should also consider the management of ships, ports, terminals, the definition of emission control areas, and penalties for violations to ensure effective policy implementation. Additionally, the policy lacks incentives such as financial subsidies, rewards, pollution fees, and fines, which weakens the economic deterrents and impacts its ability to prevent violations. The policy also fails to address port layout optimization and the innovation of emission-reduction technologies, which may hinder the achievement of energy-saving and emission-reduction goals at ports and limit technological progress in emission control.
Policy P16 is a local regulation issued by Nantong City to promote the development of green ports, with a PMC index score of 4.67. The policy focuses on planning and macro measures but lacks specific actions, such as handling ship pollution at ports, shore power facilities, fuel emission control, clean energy use, and other related aspects. The policy should outline detailed action plans, define specific measures, and strengthen supervision and evaluation. It also lacks incentives and penalties like subsidies, pollution fees, and fines, which weakens its effectiveness. Additionally, the policy does not address port management and emission-reduction technology innovation, both of which are crucial for controlling ship emissions. Improving port management and advancing emission-reduction technologies are key to achieving green and low-carbon port development.
5.2.2.3 “Typical” representative policy evaluation
Policy P17 is a policy issued by the Central Committee of the Communist Party of China and The State Council on dual-carbon work opinions, the PMC index is 6.63, and the score of X8 is low. The policy is a national document with the functions of guidance, regulation, supervision, planning and suggestions to promote national development. The policy content is macro but does not cover details such as “disposal of pollutants from ships”, “elimination of old vehicles and ships” and “dust prevention and control”. Governments at all levels should implement relevant measures in light of actual conditions. The policy applies to a wide range of targets, stimulates the initiative of local governments and enterprises, and ensures that policy objectives are achieved. The policy emphasizes basic research, cutting-edge technology, and low carbon new materials, but does not involve local issues such as “port management” and “layout”, requiring local governments to formulate specific policies according to the actual situation. Port management is important to the regional economy, and local governments should be flexible in formulating relevant policies.
6 Conclusions and suggestions
6.1 Conclusions
This paper studies the evolution of green port policies by dividing the green port policy texts into three stages. The PCA is then applied to reduce the dimensionality of the texts from each stage to the same set of dimensions. Next, cluster analysis is performed to categorize the policy texts from each stage, and the LDA topic model is used to extract the topics for each category. Finally, some of the topics are selected as indicators for the PMC index model, and a comprehensive evaluation is conducted on 19 representative policy texts related to green ports. The research results show that:
1. The issuing authority of the policy is too singular. The main body of the green port policy release is mainly national and local independent release, and the policy of multi-department joint release accounts for a relatively small proportion. This is mainly because the construction of green ports requires professional departments to formulate and implement policies, and in the administrative management system, there is a lack of effective coordination mechanism between the central government and local governments, resulting in poor policy cohesion. Therefore, the issuing subject of green port policy is relatively scattered, and the policies jointly issued by multi-departments are relatively rare.
2. The number of short-term policies is too few. It can be seen from the multi-input-output table that the vast majority of policy texts focus on medium - and long-term timeliness, while short-term timeliness policies are rare. This reflects the commitment of the government departments in promoting the sustainable development of green ports and helps to ensure the stability and continuity of the policy. However, the lack of timeliness of short-term policies also means that in some emergency situations, the policy system may lack flexibility and the ability to respond quickly.
3. The number of policies targeting shipping companies is relatively small. Most green port policies target government departments and other relevant organizations, and relatively few policies target shipping enterprises. This shows that the role and positioning of shipping enterprises in port operation has not been fully valued, and the understanding and research of policy makers on how to effectively guide shipping enterprises to participate in green port construction is also insufficient.
4. Policy instruments are unevenly distributed. In the green port policy, supply, demand and environmental tools have been applied. As can be seen from the multi-input-output table, the policy tools in the study show the characteristics of “emphasizing the mandatory and mixed type and neglecting the voluntary type”. Coercive tools are mainly based on penalties and levies to ensure the implementation of regulations; Hybrid tools such as financial assistance, demonstration projects and subsidies have played a key role in advancing policy objectives; The use of voluntary tools is limited, and if they are insufficient, they may lead to difficulties in policy implementation.
In this paper, we use the LDA and PMC to perform text mining and text analysis on China’s green port policies over the past 40 years, effectively extracting latent themes and structures from a large volume of policy texts, helping to identify the core trends and focus areas of the policies. LDA extracts themes through probabilistic models, while PMC reveals latent structures through matrix factorization. The combination of these methods aids in the in-depth exploration of the policy’s multi-level information. However, their limitations include the sensitivity of LDA to the pre-set number of topics and the difficulty of considering the context and background information within policy texts. PMC may also overlook domain-specific deep structures. Future research will focus on two main aspects: (1) Optimizing the models by integrating domain knowledge, introducing more customized algorithms such as deep learning-based models, to better handle the diversity and dynamics of policies, while strengthening the understanding of context and the dynamic analysis of policy evolution. (2) Using discourse analysis to examine language, symbols, and narrative structures in policy texts, revealing ideologies, power dynamics, and social implications, particularly in green shipping issues. (3) Employing network analysis to explore the interactions among government agencies, shipping companies, environmental groups, and other stakeholders, shedding light on cooperation, conflict, and the driving forces behind green shipping policies.
6.2 Suggestions
This paper uses the text mining method to classify, explore and evaluate China’s green port development policy, and the research results reveal the shortcomings and corresponding emphases of the existing policy texts. In order to further strengthen the guidance to the government, enterprises and individuals, accelerate the construction of green ports, and strive to achieve the goal of “carbon peak” and “carbon neutrality”, this paper gives the following suggestions for the problems found in the research:
1. Enhance solidarity, cooperation, and resource sharing among departments by establishing a dedicated policy coordination body. The body can establish a specialized supervision mechanism to regularly check the policy implementation by relevant departments, ensuring the achievement of goals. At the same time, set up a policy evaluation team to provide timely feedback on issues and improvement suggestions, promoting policy optimization. Develop a collaborative model between local and central governments, where local governments regularly report the implementation progress and challenges to the central government, which will adjust policies or provide support based on the feedback.
2. Improve responsiveness and effectiveness in green port development, the government should place greater emphasis on the formulation of short-term policies. This will address societal concerns more promptly and create a supportive environment for the successful implementation of medium- and long-term policies. By increasing the number and variety of short-term policies, the government can establish a comprehensive policy system that integrates both short-term and long-term strategies. This approach will enhance the flexibility and relevance of policies, enabling them to better address a range of issues and challenges as they arise.
3. Enhance the management of the green transformation for shipping enterprises by developing specific and targeted green port policies that clearly outline requirements and support measures. Establish a strong cooperation mechanism among the government, port management agencies, and shipping enterprises to jointly advance green port construction and the green transformation of shipping. Additionally, strengthen the supervision and assessment processes to ensure that shipping enterprises comply with policy requirements and achieve their green transformation goals effectively.
4. Utilize policy tools judiciously by tailoring them to the specific needs and stages of green port construction. Implement a well-balanced mix of different policy tools and regularly assess their effectiveness. Adjust strategies based on evaluation results to ensure that the application of these tools aligns with the actual needs and conditions of green port development.
5. Develop short-term policies with quick results, such as strengthening the application of digitalization and intelligence to improve port operation efficiency and reduce resource waste through intelligent technologies. Encourage collaboration between ports and businesses to jointly build a green supply chain, promote environmentally friendly logistics and low-carbon transportation, and reduce the carbon footprint in the transportation process.
Data availability statement
The original contributions presented in the study are included in the article. Further inquiries can be directed to the corresponding author.
Author contributions
YZ: Funding acquisition, Writing – original draft, Writing – review & editing. XW: Data curation, Methodology, Software, Writing – review & editing. QZ: Funding acquisition, Investigation, Writing – review & editing.
Funding
The author(s) declare that financial support was received for the research and/or publication of this article. This research is supported by National Natural Science Foundation of China (12101393, 42001114) and National Key R&D Program of China (2022YFE0115100).
Conflict of interest
The authors declare that the research was conducted in the absence of any commercial or financial relationships that could be construed as a potential conflict of interest.
Generative AI statement
The author(s) declare that no Generative AI was used in the creation of this manuscript.
Publisher’s note
All claims expressed in this article are solely those of the authors and do not necessarily represent those of their affiliated organizations, or those of the publisher, the editors and the reviewers. Any product that may be evaluated in this article, or claim that may be made by its manufacturer, is not guaranteed or endorsed by the publisher.
References
Bastani K., Namavari H., and Shaffer J. (2019). Latent dirichlet allocation (LDA) for topic modeling of the CFPB consumer complaints. Expert Syst. Appl. 127, 256–271. doi: 10.1016/j.eswa.2019.03.001
Brock W. A., Durlauf S. N., and West K. D. (2007). Model uncertainty and policy evaluation: Some theory and empirics. J. Econometrics 136, 629–664. doi: 10.1016/j.jeconom.2005.11.009
Chen J., Zheng T., Garg A., Xu L., Li S., and Fei Y. (2019). Alternative maritime power application as a green port strategy: Barriers in China. J. Cleaner Production 213, 825–837. doi: 10.1016/j.jclepro.2018.12.177
Chen Q., Tang Y., and Lu B. (2024a). Exploring the evolution trends of port integration policy in China by a text mining approach. Transport Policy 153, 159–172. doi: 10.1016/j.tranpol.2024.05.020
Chen S., Miao C., and Zhang Q. (2024b). Understanding the evolution of China’s green shipping policies: Evidence by social network analysis. J. Cleaner Production 482, 144204. doi: 10.1016/j.jclepro.2024.144204
Cheng Y., Lin B., and Li Q. (2024). Data-driven strategies in the evolutionary game of green port construction: analyzing policy incentives for shore power adoption. J. Electrical Syst. 20, 181–190. doi: 10.52783/jes.2371
CMT (2014). The guiding opinions on promoting port transformation and upgrading. Available online at: https://www.gov.cn/gongbao/content/2014/content2739865.htm (Accessed January 02, 2024).
CMT (2019). The guidance on building world-class ports. Available online at: https://www.gov.cn/xinwen/201911/13/content5451577.htm (Accessed January 02, 2024).
CMT (2020). The green port grade evaluation guide. Available online at: https://xxgk.mot.gov.cn/2020/jigou/syj/202006/t202006233314948.html (Accessed January 02, 2024).
Dai S., Zhang W., Zong J., Wang Y., and Wang G. (2021). How effective is the green development policy of China’s Yangtze River Economic Belt? a quantitative evaluation based on the pmc-index model. Int. J. Environ. Res. Public Health 18, 7676. doi: 10.3390/ijerph18147676
Deng G., Chen J., and Liu Q. (2022). Influence mechanism and evolutionary game of environmental regulation on green port construction. Sustainability 14, 2930. doi: 10.3390/su14052930
Estrada M. A. R. (2011). Policy modeling: Definition, classification and evaluation. J. Policy Modeling 33, 523–536. doi: 10.1016/j.jpolmod.2011.02.003
Hu H. and Yin M. (2023). Evaluation of China’s shipping policy based on PMC index model. J. Shanghai Maritime Univ. 44, 83–89.
Huang L., Wen Y., Guo W., Zhu X., Zhou C., Zhang F., et al. (2020). Mobility pattern analysis of ship trajectories based on semantic transformation and topic model. Ocean Eng. 201, 107092. doi: 10.1016/j.oceaneng.2020.107092
IAPH (2011). The environmental ship index. Available online at: https://www.iaphworldports.org/environmental-ship-indexesi/ (Accessed January 03, 2024).
IMO (2014). Third IMO greenhouse gas study 2014. Available online at: https://research.manchester.ac.uk/en/publications/thirdimo-greenhouse-gas-study-2014 (Accessed January 04, 2024).
IMO (2018). Initial IMO strategy on reduction of GHG emissions from ships. Available online at: https://www.imo.org/en/MediaCentre/HotTopics/Pages/Reducing-greenhouse-gasemissions-fromships.aspx (Accessed January 04, 2024).
Jordan A., Huitema D., Van Asselt H., Rayner T., and Berkhout F. (2010). Climate change policy in the European Union: confronting the dilemmas of mitigation and adaptation? (London: Cambridge University).
Kang H. J., Kim C., and Kang K. (2019). Analysis of the trends in biochemical research using latent dirichlet allocation (LDA). Processes 7, 379. doi: 10.3390/pr7060379
Lin C., Dai G., Wang S., and Fu X. (2022). The evolution of green port research: a knowledge mapping analysis. Sustainability 14, 11857. doi: 10.3390/su141911857
Lin Y., Wang X., Yang J., and Wang S. (2024). Core technology topic identification and evolution analysis based on patent text mining—A case study of unmanned ship. Appl. Sci. 14, 4661. doi: 10.3390/app14114661
Liu H., Wang C., Zhang M., and Wang S. (2022). Evaluating the effects of air pollution control policies in China using a difference-in-differences approach. Sci. Total Environ. 845, 157333. doi: 10.1016/j.scitotenv.2022.157333
Liu Y. and Zhao H. (2022). Quantitative evaluation of policy based on PMC index model: A case study of China’s textile industry policy. Math. Problems Eng. 2022, 1870185. doi: 10.1155/2022/1870185
Lu C., Wang B., Chen T., and Yang J. (2022). A document analysis of peak carbon emissions and carbon neutrality policies based on a PMC index model in China. Int. J. Environ. Res. Public Health 19, 9312. doi: 10.3390/ijerph19159312
Pavlic B., Cepak F., Sucic B., Peckaj M., and Kandus B. (2014). Sustainable port infrastructure, practical implementation of the green port concept. Thermal Sci. 18, 935–948. doi: 10.2298/TSCI1403935P
Peng Y., Liu H., Li X., Huang J., and Wang W. (2020). Machine learning method for energy consumption prediction of ships in port considering green ports. J. Cleaner Production 264, 121564. doi: 10.1016/j.jclepro.2020.121564
Peterman R. M. (1975). New techniques for policy evaluation in ecological systems: Methodology for a case study of pacific salmon fisheries. J. Fisheries Board Canada 32, 2179–2188. doi: 10.1139/f75-25
Sharma C., Batra I., Sharma S., Malik A., Hosen A. S., and Ra I. (2022). Predicting trends and research patterns of smart cities: a semi-automatic review using latent dirichlet allocation (LDA). IEEE Access 10, 121080–121095. doi: 10.1109/ACCESS.2022.3214310
Shi C., Qian D., and Ke L. (2023). “Research on green port based on LDA model and CiteSpace bibliometric analysis,” in International Conference on Pure, Applied, and Computational Mathematics (PACM 2023), vol. 12725. 125–131. doi: 10.1117/12.2679115
Shi W., Xiao Y., Chen Z., McLaughlin H., and Li K. X. (2018). Evolution of green shipping research: themes and methods. Maritime Policy Manage. 45, 863–876. doi: 10.1080/03088839.2018.1489150
Teerawattana R. and Yang Y. (2019). Environmental performance indicators for green port policy evaluation: Case study of Laem Chabang port. Asian J. Shipping Logistics 35, 63–69. doi: 10.1016/j.ajsl.2019.03.009
Tian Y., Zhang K., Hong J., and Meng F. (2022). Evaluation of China’s high-advanced industrial policy: A PMC index model approach. Math. Problems Eng. 2022, 9963611. doi: 10.1155/2022/9963611
Tian C., Zhang J., Liu D., Wang Q., and Lin S. (2024). Technological topic analysis of standard-essential patents based on the improved latent dirichlet allocation (LDA) model. Technol. Anal. Strategic Manage. 36, 2084–2099. doi: 10.1080/09537325.2022.2130039
Tseng P. and Pilcher N. (2019). Evaluating the key factors of green port policies in Taiwan through quantitative and qualitative approaches. Transport Policy 82, 127–137. doi: 10.1016/j.tranpol.2018.12.014
Wan C., Zhang D., Yan X., and Yang Z. (2018). A novel model for the quantitative evaluation of green port development–A case study of major ports in China. Transportation Res. Part D: Transport Environ. 61, 431–443. doi: 10.1016/j.trd.2017.06.021
Wang X., Huang L., Daim T., Li X., and Li Z. (2021). Evaluation of China’s new energy vehicle policy texts with quantitative and qualitative analysis. Technol. Soc. 67, 101770. doi: 10.1016/j.techsoc.2021.101770
Yang Y., Tang J., Li Z., and Wen J. (2022b). How effective is the health promotion policy in Sichuan, China: based on the PMC-Index model and field evaluation. BMC Public Health 22, 2391. doi: 10.1186/s12889-022-14860-9
Yang T., Xing C., and Li X. (2021). Evaluation and analysis of new-energy vehicle industry policies in the context of technical innovation in China. J. Cleaner Production 281, 125126. doi: 10.1016/j.jclepro.2020.125126
Yang C., Yin S., Cui D., Mao Z., Sun Y., Jia C., et al. (2022a). Quantitative evaluation of traditional Chinese medicine development policy: A PMC index model approach. Front. Public Health 10. doi: 10.3389/fpubh.2022.1041528
Yau K. A., Peng S., Qadir J., Low Y., and Ling M. H. (2020). Towards smart port infrastructures: Enhancing port activities using information and communications technology. IEEE Access 8, 83387–83404. doi: 10.1109/ACCESS.2020.2990961
Yu D. and Xiang B. (2023). Discovering topics and trends in the field of Artificial Intelligence: Using LDA topic modeling. Expert Syst. Appl. 225, 120114. doi: 10.1016/j.eswa.2023.120114
Zhang Q., Chen C., Zheng J., and Chen L. (2023). Quantitative evaluation of China’s shipping decarbonization policies: The PMC-Index approach. Front. Mar. Sci. 10. doi: 10.3389/fmars.2023.1119663
Zhang Q., Liu H., and Wan Z. (2022a). Evaluation on the effectiveness of ship emission control area policy: Heterogeneity detection with the regression discontinuity method. Environ. Impact Assess. Rev. 94, 106747. doi: 10.1016/j.ocecoaman.2022.106064
Zhang Z., Song C., Zhang J., Chen Z., Liu M., Aziz F., et al. (2024). Digitalization and innovation in green ports: A review of current issues, contributions and the way forward in promoting sustainable ports and maritime logistics. Sci. Total Environ. 912, 169075. doi: 10.1016/j.scitotenv.2023.169075
Zhang Y., Zhou R., Chen J., and Rangel-Buitrago N. (2022b). The effectiveness of emission control policies in regulating air pollution over coastal ports of China: spatiotemporal variations of no2 and so2. Ocean Coast. Manage. 219, 106064. doi: 10.1016/j.ocecoaman.2022.106064
Zhou K., Yuan X., Guo Z., Wu J., and Li R. (2024). Research on sustainable port: Evaluation of green port policies on China’s coasts. Sustainability 16, 4017. doi: 10.3390/su16104017
Keywords: green port policy, principal component analysis, cluster analysis, LDA topic model, PMC index model
Citation: Zou Y, Wang X and Zhang Q (2025) Evolution and quantitative evaluation of China’s green port policies: evidence from text mining and text analysis. Front. Mar. Sci. 12:1546755. doi: 10.3389/fmars.2025.1546755
Received: 17 December 2024; Accepted: 21 April 2025;
Published: 16 May 2025.
Edited by:
Tsz Leung Yip, Hong Kong Polytechnic University, Hong Kong SAR, ChinaReviewed by:
Yusheng Zhou, Hong Kong Polytechnic University, Hong Kong SAR, ChinaJie Xue, Shanghai Jiao Tong University, China
Copyright © 2025 Zou, Wang and Zhang. This is an open-access article distributed under the terms of the Creative Commons Attribution License (CC BY). The use, distribution or reproduction in other forums is permitted, provided the original author(s) and the copyright owner(s) are credited and that the original publication in this journal is cited, in accordance with accepted academic practice. No use, distribution or reproduction is permitted which does not comply with these terms.
*Correspondence: Qiang Zhang, cWlhbmd6aGFuZ0BzaG10dS5lZHUuY24=