 Louise C. V. Rewrie1*
 Burkard Baschek2
 Justus E. E. van Beusekom3
 Arne Körtzinger4
 Wilhelm Petersen1
 Rüdiger Röttgers5
 Yoana G. Voynova1
- 1Department of Coastal Productivity, Institute of Carbon Cycles, Helmholtz Zentrum Hereon, Geesthacht, Germany
- 2Ocean Museum Germany, Stralsund, Germany
- 3Department of Aquatic Nutrient Cycles, Institute of Carbon Cycles, Helmholtz Zentrum Hereon, Geesthacht, Germany
- 4Department of Chemical Oceanography, GEOMAR Helmholtz-Zentrum für Ozeanforschung Kiel, Kiel, Germany
- 5Department of Optical Oceanography, Institute of Carbon Cycles, Helmholtz Zentrum Hereon, Geesthacht, Germany
Estuaries are typically net heterotrophic systems and a source of CO2 to the atmosphere, while continental shelves are net CO2 sinks. Yet, primary production and net ecosystem metabolism (NEM) are variable, and this has implications for nutrient and carbon processing along the land-sea interface. To resolve this variability, high-frequency dissolved oxygen and ancillary biogeochemical data from a research station (FerryBox) located at the outflow of a temperate estuary into a shelf sea, were used to quantify the gross primary production (GPP) and NEM at the land-sea interface. In early and mid-spring in the outer Elbe Estuary (Germany), we find that low GPP rates (155 ± 46 mg C m-2 d-1 in April 2020 and 74 ± 24 mg C m-2 d-1 in March to April 2021) were light limited, as a function of elevated turbidity (31 ± 9 NTU and 35 ± 7 NTU) and solar irradiance. When turbidity decreased in late spring (May), we observed elevated GPP rates, and highest GPP rates in summer (June-August), with seasonal averages of 613 ± 89 mg C m-2 d-1 in 2020 and 558 ± 77 mg C m-2 d-1 in 2021. Primary production in the outer Elbe Estuary waters was not nutrient-limited, since concentrations all year-round exceeded the expected limiting levels of 5 µM Si, 0.5 µM PO43- and 2 µM NO3-. Despite the high nutrient concentrations and estimated GPP rates, the system was in near trophic balance, with seasonally averaged NEM estimates of -2 ± 49 mg C m-2 d-1 and -149 ± 41 mg C m-2 d-1. A significant finding is that a seasonal decrease in dissolved inorganic carbon of 125 – 160 µmol kg-1 from May to September, and in total alkalinity of 116 – 128 µmol kg-1 from December to August, was likely driven by the concurrent and significant seasonal uptake of inorganic carbon by primary producers in the upper estuary and upstream regions. This highlights the heterogeneity of inorganic carbon patterns along the land-sea continuum and the continuity of biogeochemical processing in the upstream regions of a temperate estuary to sea.
1 Introduction
Primary production and remineralization are two key biological processes that can modulate carbon and nutrient dynamics in coastal ecosystems. Carbon dioxide (CO2) and inorganic nutrients are converted into labile organic matter via phytoplankton primary production, thereby releasing oxygen (Cloern et al., 2014). Microbial respiration of organic matter produces inorganic nutrients and carbon in the form of CO2. The net difference between primary production and respiration, also known as net ecosystem metabolism (NEM), can be used to assess whether aquatic ecosystems are net sources or sinks of carbon (Gattuso et al., 1998; Caffrey, 2003; Cai, 2011). Primary production can be used to assess ecosystem health (Padua et al., 2023), extent of eutrophication (Smith, 2007) and nutrient limitation (Rick et al., 2006).
Much of the biological activity varies along the coastal transition region from land to sea, with seasons, tides, turbidity levels, nutrient inputs and human interventions as the main driving factors (Cloern, 1987; Kerner, 2007; Cai, 2011; Zhao et al., 2019). Freshwater discharge transports nutrients and organic and inorganic carbon to estuaries and coastal zones and can fuel autochthonous primary production at the land-sea interface (Mallin et al., 1993; Caffrey, 2004), but allochthonous organic matter with marine origin can also be imported into estuaries, facilitated by tidal flow (van Beusekom and Brockmann, 1998; Voynova et al., 2015; Schulz et al., 2023). A change of trophic state (Dodds and Cole, 2007) has been frequently observed along an estuary-to-coastal-transition. Some rivers and shallow upstream estuarine regions with high phytoplankton biomass were autotrophic (King et al., 2014; Kamjunke et al., 2023), while globally, estuaries are typically net heterotrophic (Gattuso et al., 1998; Cai, 2011) with high turbidity, which reduces light availability and limits primary production (McSweeney et al., 2017). At the same time, strong stratification of an estuary, along with sufficient nutrient concentrations, can be favorable for elevated primary production (Humborg, 1997), and some estuaries have been reported as net autotrophic (Caffrey, 2004; Maher and Eyre, 2012). Net heterotrophy tends to continue into the adjacent coastal and inner shelf regions, but there can be shifts to autotrophic conditions in the continental shelves (Cai, 2011; Voynova et al., 2015). Estuaries worldwide are heterogeneous and vary with latitude, geomorphology and tidal regime for example, and nutrients and carbon dynamics are generally modulated by metabolic activity along an estuary before entering the coastal shelf sea as well as therein (Cai, 2011; Bauer et al., 2013). Therefore, a detailed evaluation of the mechanistic understanding of how metabolic processes control inorganic nutrients and carbon across the land-sea interface would improve the assessment of eutrophication in offshore regions and calculations of carbon budgets (Cai, 2011).
In addition to this variability, since the beginning of the 20th century, anthropogenic perturbations and land-use changes have modified the metabolic activity along the land-sea continuum and have resulted in differences to present day nutrient and carbon fluxes and processing within estuaries and coastal zones (García-Barcina et al., 2006; Sharp, 2010; Joesoef et al., 2017; Rewrie et al., 2023a). The Elbe Estuary in Germany, for example, experienced three distinctly different ecosystem states in the last four decades, a polluted, transitional and recovery state (Rewrie et al., 2023a), due to effects from heavy pollution in the 1980s (Kempe, 1988; van Beusekom et al., 2019; Rewrie et al., 2023a). European management strategies (Ehlers, 1990) and the reunification of Germany in 1990, led to the implementation of wastewater treatment plants (Netzband et al., 2002), closures in industrial and agriculture companies, and finally to the ensuing transitional and following recovery state. The major pollution and ensuing ecosystem state changes significantly impacted primary production and respiration processes over the last four decades, such that the carbon and nutrient turnover and fluxes in the estuary and at the land-sea interface near Cuxhaven, Germany, were significantly different in the 1980s compared to present day (Rewrie et al., 2023a). Since 1997, during the recovery state, primary production and respiration, and estuary function were reestablished within the estuary and particulate organic carbon (POC) produced by primary production in the upstream regions drives the generation of dissolved inorganic carbon (DIC) in the estuary (Rewrie et al., 2023b). However, the authors identified that in the lower and outer estuary, DIC generation is instead potentially linked to organic carbon produced in the coastal regions (also supported by Schulz et al. (2023)), suggesting that primary production at the land-sea interface is important to carbon cycling. To quantify primary production and net ecosystem metabolism at the land-sea interface, and their influence on carbon dynamics, this study was conducted during the current recovery state of the Elbe Estuary ecosystem, characterized by large seasonal changes in the carbonate system and in the metabolic activity, regulated by upstream and offshore primary production.
The Elbe Estuary and the adjacent coastal waters of the German Bight in the North Sea experienced significant biogeochemical and ecosystem state changes during the past 40 years, and an increase in DIC at a rate of 11 µmol L-1 yr-1 since 1997 was documented during the recovery state (Rewrie et al., 2023a). Therefore, this study focusses on a recent 2-year period in the recovery state and uses continuous high-frequency dissolved oxygen to estimate rates of gross primary production, respiration and NEM in the outer Elbe Estuary in 2020 and 2021. In an effort to quantify the role of primary producers at the outflow of the estuary to the sea, compared to upper estuary primary producers, located hundreds of kilometers upstream (Rewrie et al., 2023b). Additional biogeochemical and physical parameters were used to examine the factors that regulate the metabolic rates in this dynamic environment to identify the reasons for seasonal and inter-annual changes in metabolic rates. The metabolic rates contribution to carbon and nutrient uptake and cycling at the land-sea interface was assessed.
2 Methods
2.1 Study site
The North Sea is a large and relatively shallow shelf sea, linked to the North Atlantic Ocean, reaching depths of 150 m in the northern part and 400 m in the Norwegian Channel (Thomas et al., 2005). The German Bight is located in the shallow (10 – 43 m) southeastern part of the North Sea (Figure 1). The Wadden Sea borders the German Bight and fringes the Dutch, German and Danish coasts (van Beusekom et al., 1999; Figure 1). The Wadden Sea is a shallow intertidal region, with bathymetry in general < 10 m, containing the largest network of tidal flat areas in the world (Wang et al., 2012). A counterclockwise residual current pattern dominates the German Bight and carries Atlantic water and continental runoff, mainly from the Elbe, Rhine and additional smaller rivers, causing an inflow from the west into the German Bight and an outflow to the north (Hickel et al., 1993; van Beusekom et al., 1999). The combination of the residual circulation with nutrient influx from the Ems, Weser, and Elbe rivers (van Beusekom et al., 1999), promotes the accumulation of substances, such as organic matter and nutrients, in the German Bight (Hickel et al., 1993) and into the Wadden Sea (van Beusekom et al., 2019). The German Bight and Wadden Sea areas are mainly well-mixed due to strong tidal currents, contrasting to the seasonally stratified central North Sea (Becker et al., 1999; Voynova et al., 2017).
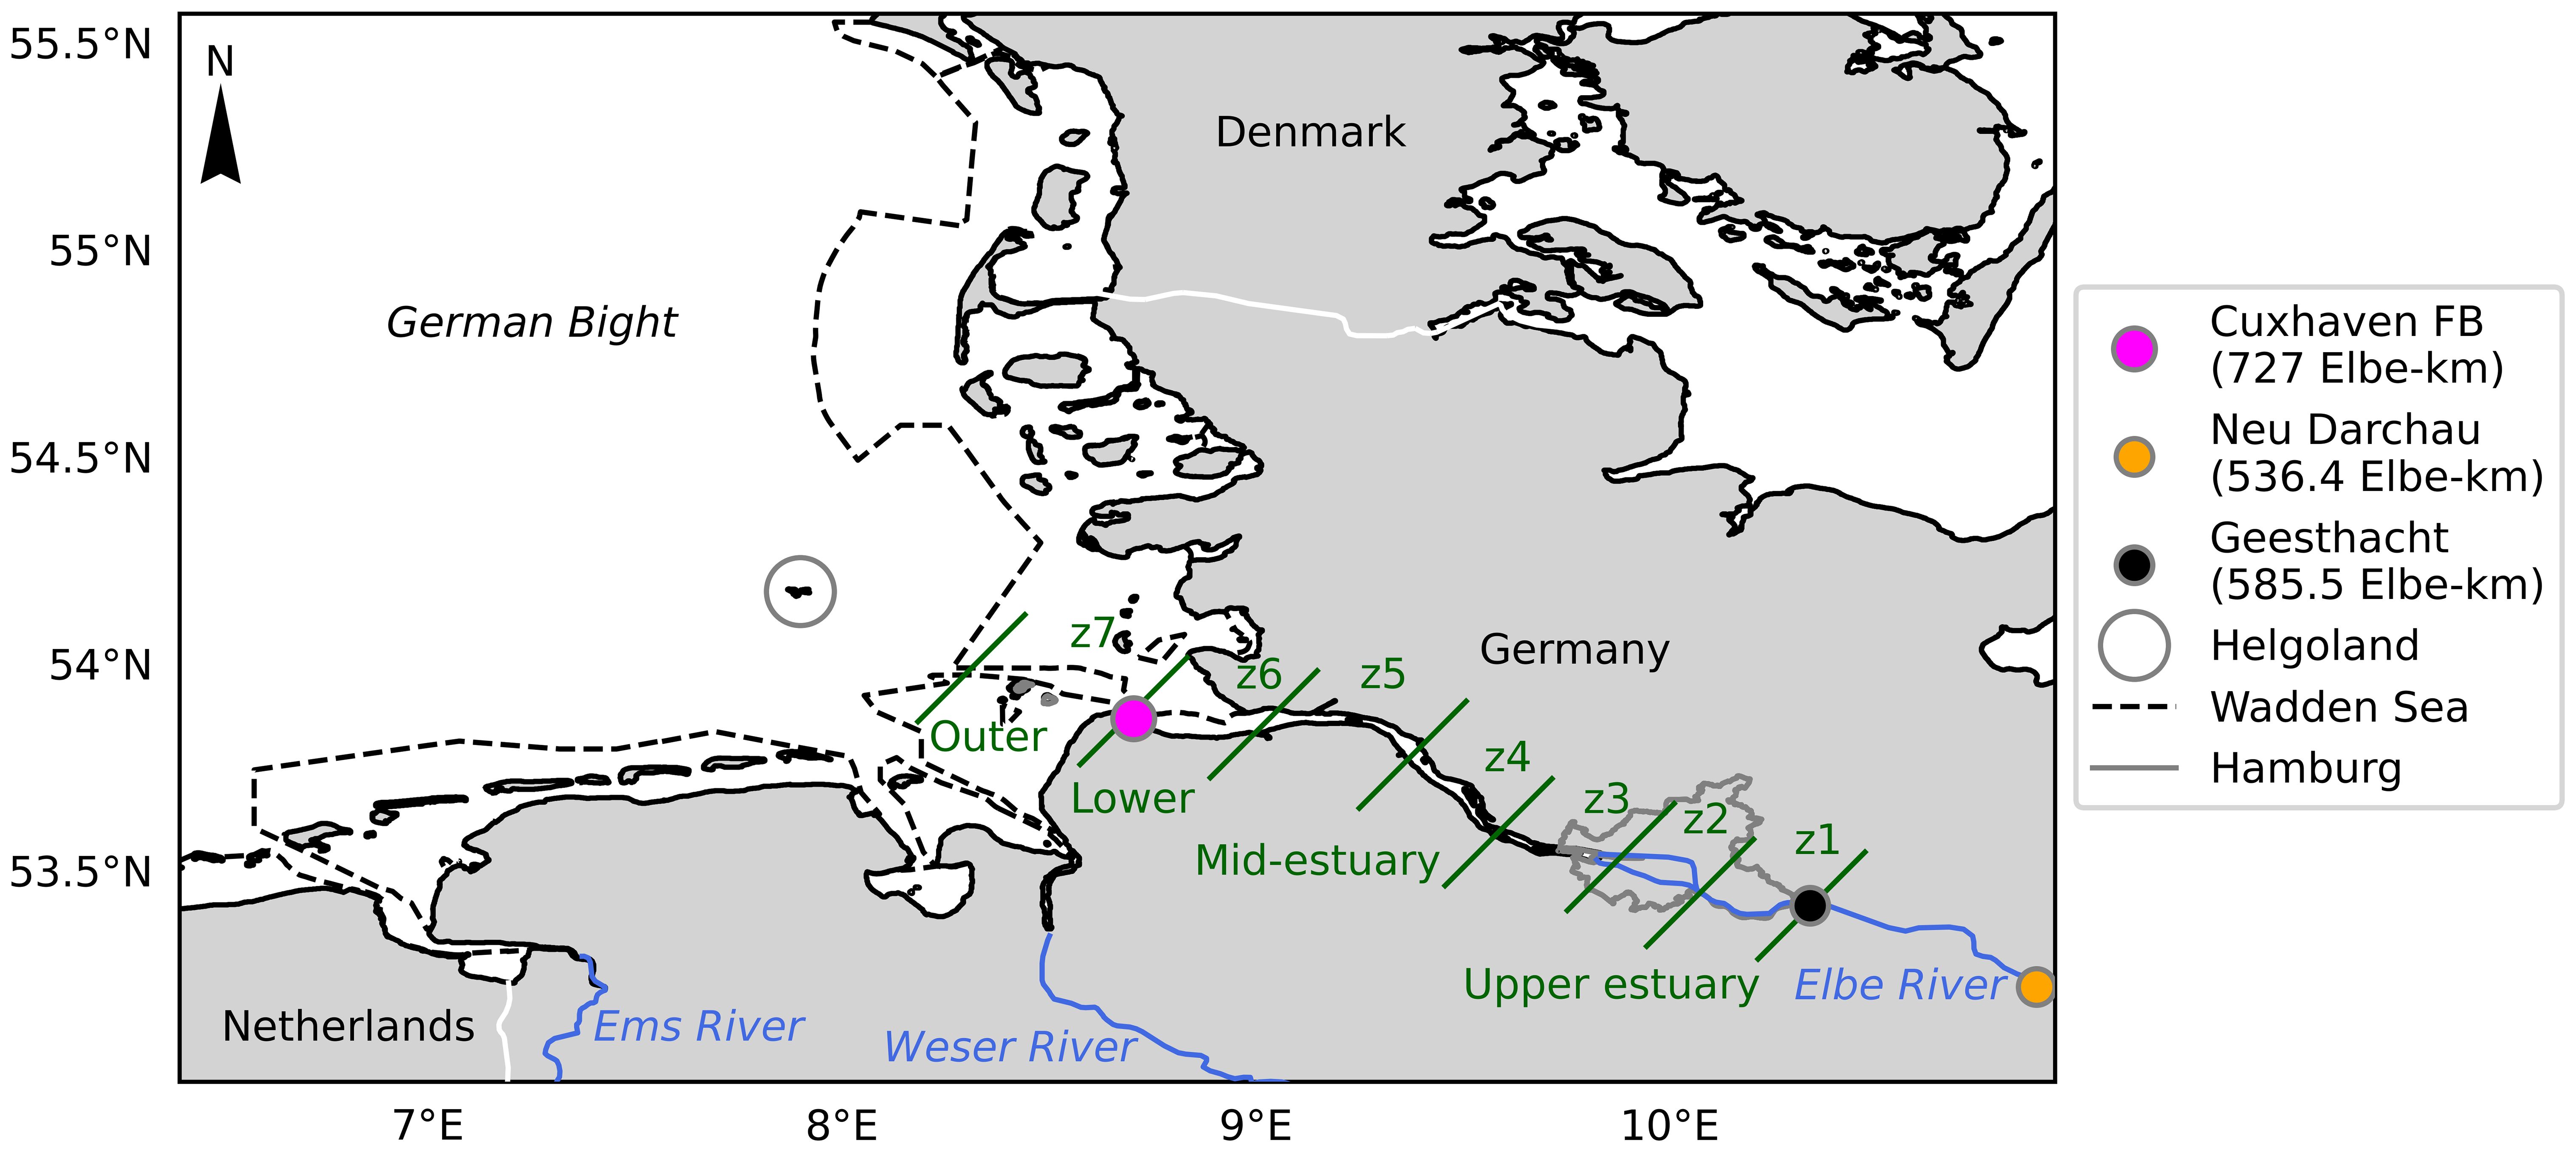
Figure 1. Map of the German Bight, Elbe River, the Elbe Estuary from Geesthacht (black circle) and the surrounding continental regions and rivers. The FerryBox (FB) measuring station at Cuxhaven (magenta circle) and the Neu Darchau gauging station (orange circle). The seven zones (z) each separated with a green diagonal line as proposed by the TIDE project (Geerts et al., 2012) and the zones are sub-grouped into four regions (Rewrie et al., 2023a; b). The Wadden Sea outline was obtained as the Wadden Sea Heritage shape file from Flanders Marine Institute (2024), and the dashed line represents its boundary.
The 1094 km long Elbe River, which has the fourth largest river basin in Central and Western Europe, discharges into the North Sea, and is the main source of freshwater to the inner German Bight (Hickel et al., 1993). Other rivers such as the Weser and Ems have smaller inputs in comparison. The source of the Elbe River is in Czechia in the Giant Mountains, flowing at Schmilka into Germany (Scheurle et al., 2005). The river section extends to a weir in Geesthacht, Germany (585.5 Elbe-km). From there, the river flows into the tidal stretch of the river, the Elbe Estuary, extending along 142 km, up to Cuxhaven, Germany (727 Elbe-km). Elbe-km is the distance from the point where the Elbe passes the border between the Czech Republic and Germany.
The estuary is typically well-mixed but can be partially mixed in summer in the port region (zone 2 in Figure 1, Pein et al., 2021) and a mesotidal coastal plain estuary (Amann et al., 2015). Based on the zonation proposed by the TIDE project (Geerts et al., 2012), in Rewrie et al. (2023a) the estuary was divided into seven zones to differentiate spatial patterns of nutrient and carbon dynamics (Figure 1). In the uppermost region, zone 1, primary production generates dissolved oxygen supersaturation, high pH levels > 9 and low concentrations of DIC (Kamjunke et al., 2023; Rewrie et al., 2023a). Along the estuary, remineralization of labile organic carbon leads to dissolved oxygen undersaturation, especially in the Hamburg Harbour, described as the oxygen minimum zone in the estuary, where nutrients are regenerated and DIC is produced in zones 2 to 5 (Amann et al., 2012; Dähnke et al., 2022; Rewrie et al., 2023a). The maximum turbidity zone (MTZ) extends from around 650 to 700 Elbe-km in zones 4 and 5 (Amann et al., 2015). Further downstream along the salinity gradient in zone 6, oxygen levels generally remain undersaturated, whereas in the adjacent coastal regions in zone 7, oxygen supersaturation and elevated pH were observed in late spring and summer (Rewrie et al., 2023a).
2.2 FerryBox in Cuxhaven
A research station hosting a stationary FerryBox (Petersen, 2014) has been recording temperature, salinity, dissolved oxygen (DO), chlorophyll a (chl-a) fluorescence, and turbidity since 2010 at a station located in Cuxhaven, Germany (8.71°E, 53.88°N), at the Elbe Estuary outflow into the German Bight. The station has also been continuously measuring coloured dissolved organic matter fluorescence, the partial pressure of CO2, pH and nutrients, and while these parameters are not discussed in this study, they contribute to the station reporting as an ICOS Pilot Estuarine Station since 2023. The near-real time 10-minute averaged data of raw one-second values, with initial checks for range and statistics, are accessible through the data portal of the Coastal Observing System for Northern and Arctic Seas (COSYNA; codm.hzg.de/codm; Baschek et al., 2017). The present study uses one-minute averaged data of raw one-second values from the sensors listed in Table 1, resampled to 15-minute intervals for data processing and analysis.
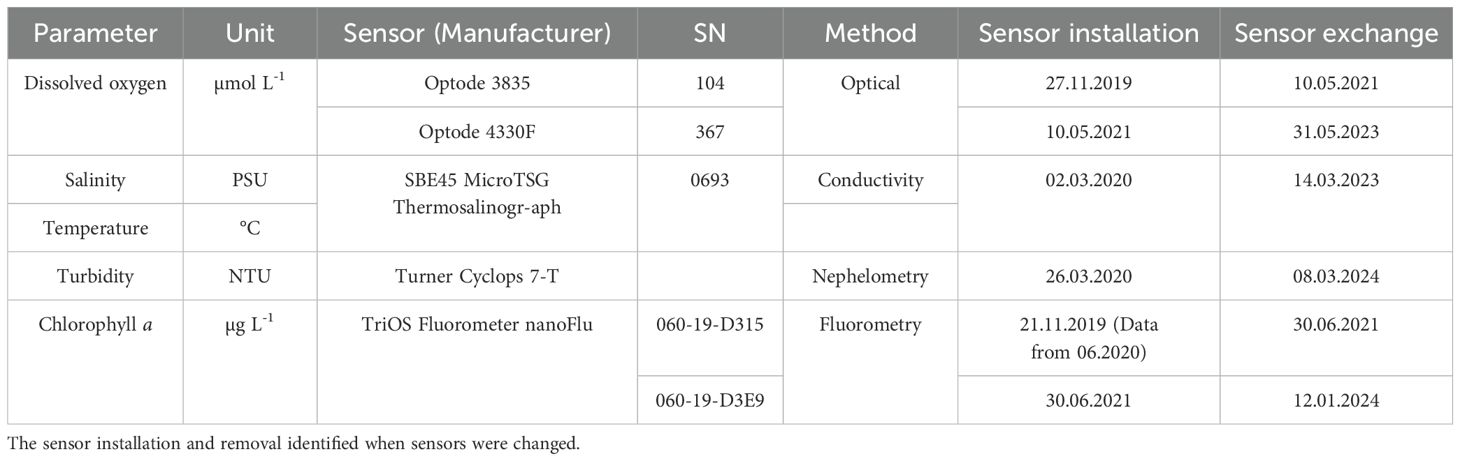
Table 1. Measured parameters, units, sensor and respective serial number (SN) equipped in the FerryBox system at Cuxhaven.
2.3 Hydrological, weather and climate data
Sea level data were recorded at the Cuxhaven Pier (724 Elbe-km; 8.72°E, 53.87°N) and obtained from the German Federal Waterways and Shipping Administration (WSV), communicated by the German Federal Institute of Hydrology (BfG) (https://www.pegelonline.wsv.de/gast/stammdaten?pegelnr=5990020; WSV, 2024a), measured every minute. The nearest location to the FerryBox at Cuxhaven that recorded water velocity was at Otterndorf (MPM) Sohle (714.02 Elbe-km; 8.87°E, 53.84°N) by WSV (https://www.kuestendaten.de/Tideelbe/DE/Service/service_node.html; WSV, 2024b), measuring every five minutes. There were no tributary influences between Otterndorf and Cuxhaven (Amann et al., 2012). Wind speed at 10 m was utilized from the E-OBS meteorological data for Europe (Cornes et al., 2018) from the Copernicus Climate Data Store (https://cds.climate.copernicus.eu) selected for the Cuxhaven region (8.65°E, 53.85°N), provided as a daily mean wind speed. The photosynthetically active radiation (PAR) was recorded at the Cuxhaven Station (8.71°E, 53.87°N) of the German Weather Service (Deutscher Wetterdienst (DWD) from https://opendata.dwd.de/), measured over every 10 minutes and data were converted from J cm-² to W m-2 (Avison, 2014). Daily freshwater discharge data from Neu Darchau gauging station (536.4 Elbe-km; 10.89°E, 53.23°N) were obtained from the FGG Elbe data portal (https://www.elbe-datenportal.de; FGG Elbe, 2023). A correction factor of 1.21 for Cuxhaven was applied to the daily river discharge to account for tributary inputs along the estuary (Amann et al., 2015).
2.4 Discrete sample collection and use for parameter quality control
Discrete samples were collected between 2020 and 2021 to verify the accuracy of the autonomous FerryBox measurements, and for additional laboratory measured parameters. The FerryBox (Petersen, 2014) works alongside a remotely controlled water sampler unit (Teledyne ISCO, U.S.A) with 24 1-liter sampling bottles. During the study period the auto-sampler was remotely programmed to fill the bottles over a 12 to 24 hour period, every half hour or every hour, capturing the tidal cycle (12 hours) typically once a month during Cuxhaven station maintenance times (Supplementary Table S1). Samples were refrigerated in the dark until processing (usually done within hours of sample collection). During four maintenance visits (20. August 2020, 20. October 2020, 11. March 2021, 12. July 2021), discrete samples were collected directly from the outlet of the FerryBox system. Subsamples were collected for turbidity and salinity in 250 mL glass bottles (Duran, Schott) and stored in the dark until analysis in the laboratory (within 1–2 days of collection). Discrete salinity and turbidity samples were measured with a high precision salinometer (Optimare, Germany) and with a Turbidimeter (2100N IS, Hach, Germany; ISO 7027), respectively.
For nutrients, samples were filtered through 47-mm GF/F glass microfiber filters for the analysis of phosphate (PO43-), silicate (Si), ammonium (NH4+), and nitrate (NO3-). Water samples were frozen until analyzed using colorimetric methods in an autoanalyzer (AA500, SEAL Analytical, Germany; Hansen and Koroleff, 1999). In 2021, the autoanalyzer’s performance was verified through analysis of QUASIMEME estuarine and seawater reference samples (Aminot et al., 1997). For all inorganic nutrients (NH4+, NO2-, PO43-, Si and NO3-), 95% of values had z-scores <2, suggesting that the autoanalyzer consistently measured accurate reference values.
Samples for DIC were collected in 20 mL scintillation vials and treated with 20 µL of saturated mercuric chloride solution (7%), transported to the laboratory and stored in the dark at 4˚C until analysis. An AIRICA DIC Analyser (Marianda, Kiel, Germany) was used to measure inorganic carbon by acidifying the sample, sparging, drying the produced CO2, and detecting it with an NDIR detector (LI-COR 7000, LI-COR, U.S.A). The instrument was calibrated using certified reference materials (CRMs) provided by Andrew Dickson’s laboratory (Scripps Institute of Oceanography), measured every 3 to 6 samples. Four measurements were made for each sample, where the outlier was rejected, and the coefficients of variation of standard measurements ranged between 0.002% and 0.281%, or 0.044 µmol kg-1 and 6.10 µmol kg-1, with a median of 0.04% and 0.77 µmol kg-1. Samples for total alkalinity (TA) were collected in 500 mL borosilicate glass flasks and treated with 500 µL of saturated mercuric chloride solution (7%), transported to the laboratory and stored in the dark at room temperature until analysis. A titrator (848 Titrino plus, Metrohm, Germany) was used to measure TA by open cell titration. The instrument was calibrated using CRMs provided by Andrew Dickson’s laboratory (Scripps Institute of Oceanography), measuring every 2 to 4 samples. Based on the measured and the expected CRM measurement a correction factor was calculated and applied to each TA sample measurement (Supplementary Table S3). For each CRM and TA sample, four measurements were made, and the largest outlier was rejected; the standard deviations for CRMs and TA samples ranged between 0 – 10 µmol kg-1 and 0 – 15 µmol kg-1, respectively, which accounts for a mean TA error of up to 0.7%. Please refer to Supplementary Table S2 in the Supplementary Online Material for additional quality control steps taken for DIC and TA samples. In 2021, a QUASIMEME proficiency testing exercise for the AIRICA DIC analyser and Titrino Metrohm titrator produced z’-scores of < 2 for 100% of the DIC and TA reference samples, suggesting that both instruments produced accurate measurements.
2.5 Processing, quality checks and verification of FerryBox and sensors
The flow rate at the main inlet (Flow In) to the FerryBox system and the flow rate within the system (Main Flow) were used to assess the stability of the water flow in the FerryBox system, using 9 L min-1 as the required minimum Main Flow rate (Supplementary Figure S1, Supplementary Table S4). The Main Flow and Flow In averages between 2020 and 2021 were 14 ± 1 L min-1 and 29 ± 4 L min-1, respectively (Supplementary Figure S1). The flow at the pump inlet of 100 L min -1 (not shown) was used to estimate that the time it takes for the water to travel the 20 m from the pump inlet to the FerryBox system that is 23 seconds, suggesting that there was no significant delay between the pump inlet and FerryBox system, with limited influence on the FerryBox measurements.
Salinity and temperature measurements recorded by the sensors were checked for anomalous data (Supplementary Table S5). The flow-through CTD sensor (SBE45, SeaBird Scientific, WA, USA) in the FerryBox was calibrated regularly (every 1 – 2 years) by the manufacturer (Table 1), with a reported temperature and salinity measurement accuracy of ± 0.002°C and ± 0.005 PSU. An additional check of the salinity measurements was conducted, resulting in no significant difference (p > 0.05) between the FerryBox measurements and the discrete samples (Supplementary Figure S2), yielding a correlation with a slope of 1 (R2 = 0.99, p < 0.05). There was no significant difference between the SBE45 and the intake temperature measurements at the pump inlet (PT100, 4H-JENA Engineering, SN 20320), on average -0.09 ± 0.09°C, which were also significantly correlated (R2 = 0.99, p < 0.05; Supplementary Figure S3), with a slope not different from 1 (1.005). This indicates that the SBE45 temperature measurements were not significantly distorted during water pumping to the FerryBox system, and no temperature offset correction needed to be applied to the dissolved oxygen measurements. This confirms that the FerryBox measurements should be representative of the in-situ conditions at the Elbe Estuary outflow into the North Sea.
Linear regression between the discrete turbidity samples and corresponding FerryBox turbidity values were used to evaluate the performance of the Turner Cyclops 7-T turbidity sensor (Supplementary Figures S4a–c). A correction was applied to the Turner Cyclops 7-T turbidity data to be consistent with discrete measurements (Supplementary Figure S5). To reduce noise, a 4-hour running average was applied to turbidity. To verify the stability and check for instrument drift in the chl-a sensors, TriOS Fluorometer nanoFlu D315 and D3E9 (Table 1), solid secondary material standards were used during maintenance visits to the FerryBox system (Supplementary Table S6), and no correction was applied to the chl-a fluorescence measurements. There was an apparent drift in chl-a measurements between 16. August 2020 and 20. August 2020, which were confirmed by maintenance records (not shown), and this period of chl-a data was removed (Supplementary Figure S6). The chl-a fluorometers were also regularly calibrated by the manufacturer every 1 – 2 years.
The model 3835 and 4330F Aanderaa Optode sensors were used to measure DO concentration between 2020 and 2021 (Table 1). The internal software of the optode sensors uses a built-in temperature sensor to measure the oxygen concentration. The optode temperature measurement should accurately represent the temperature of the sea surface measured at depths between 1 m and 8 m. To assess the performance of the temperature sensor in both optodes, the temperature measurements were compared with the SBE45 temperature measurements. Due to the average difference of -0.63 ± 0.37°C (Supplementary Figure S7) between SBE45 and the model 3835 optode temperature, the optode oxygen data were calculated using the SBE45 temperature (Equations S1, S2 in the Supplementary Material), in agreement with Thierry et al. (2021). The difference between the SBE45 and optode 4330F temperature was close to 0 (-0.01 ± 0.01°C, Supplementary Figure S7), and thus the optode 4330F temperature measurements were deemed reliable to use for the oxygen concentration calculations. The default output of the optode assumes that the salinity of the surrounding water is zero and thus the oxygen concentration for the model 3835 and 4330F optodes were corrected for salinity of the water with Equations S3, S4 in the Supplementary Material. Oxygen concentration recorded by the 3835 and 4330F optode were quality controlled and for more details please see Supplementary Materials (Supplementary Figures S8, S9, Supplementary Table S7). For instance, between June and September 2021, the 4330F optode oxygen measurements revealed abnormal patterns and the periods with anomalous oxygen concentration data were removed (Supplementary Figures S9, S10, Supplementary Table S7). After the data processing stage, to account for gaps in the data due to short (≤ 2 hours) operational changes such as the cleaning cycle, all data were linearly interpolated.
2.6 Winkler oxygen titrations and optode oxygen measurements
The optode oxygen measurements were further checked with discrete Winkler titrations (Supplementary Figure S11). Samples were collected during maintenance visits of the FerryBox and were measured with the Winkler titration method (Dickson, 1996). Per visit, three discrete samples were collected, each BOD bottle was flushed for one minute to remove bubbles and filled with sample water. Dissolved oxygen was fixed by the addition of manganous chloride and sodium iodide-sodium hydroxide solution, and carefully stoppered. The sample bottles were submerged in water collected from the FerryBox outlet in a sealed container (Zhang et al., 2002), transferred to the laboratory and measured within 1 – 4 days of the sample collection date using Titrino Metrohm titrator (848 Titrino plus, Germany). The closest two of every triplicate measurement was used to calculate a mean Winkler oxygen titration sample. The standard deviation of the averages ranged between 0.00 µmol L-1 to 2.03 µmol L-1, for samples with oxygen concentration range of 216 µmol L-1 to 337 µmol L-1.
A total of six pairs of Winkler titrations were used to quality control the 3835 and 4330F optode (Supplementary Figure S11). During the period when the model 3835 optode was installed (Table 1), a calibration equation was (Equation 1) calculated using the ordinary least squares (OLS) method between the optode oxygen concentration deviation to the Winkler oxygen concentration and time:
where m is the estimated slope of -2.7e-6, x is the time in seconds and c is the estimated y intercept of 4263 (Supplementary Figure S12a). This method was used for the 3835 optode because of an apparent linear drift in the difference between optode measurements and the Winkler titrations, as visible in the estimated deviation of the optode to Winkler oxygen concentration (Supplementary Figure S12a). In contrast, we observed a consistent average difference of 40 ± 2 µmol L-1 between the Winkler oxygen measurements and the 4330F optode (Supplementary Figure S11), which was used to correct the 4330F optode oxygen concentration. Both corrected optode oxygen measurements were re-calculated in percent saturation (Garcia et al., 2019).
2.7 Gross primary production and respiration estimates
Odum (1956) and Odum and Hoskin (1958) developed the oxygen-based open water method to quantify the diurnal oscillations in dissolved oxygen concentration to estimate daily gross primary production (GPP), respiration, and net metabolism, such that the rate of DO-change with time at a fixed position represents a function of the gain by primary production, loss by respiration, gain or loss due to air–sea exchange and gain or loss by horizontal transport of oxygen due to movement of water and mixing. More recently, Moore et al. (2009) and Collins et al. (2013) presented that the use of continuous and high frequency DO observations can be used to calculate rates of GPP and respiration in estuaries. Voynova et al. (2015) distinguished between estuarine outflow waters and the adjacent coastal waters to calculate daily oxygen fluctuations specifically in the outer estuarine productive region and this method was followed here to obtain daily oxygen changes and GPP and respiration rates in the outer Elbe Estuary waters.
The DO anomaly (DOA) was calculated as the difference between the observed DO and the DO concentration (assumed to be at equilibrium with the atmosphere) at the in situ seawater temperature and salinity recorded by the FerryBox (Table 1). A positive DOA in this case represents oxygen supersaturation with respect to the expected oxygen based on in situ temperature and salinity, when photosynthesis likely exceeds respiration and results in net DO production. A negative DOA indicates oxygen consumption, when likely respiration exceeds photosynthesis and thus net respiration. To reduce noise, a 4-hour running average was applied to DOA and salinity. A period of +3 h and -1 h of the peak mean-centered water level (i.e. around the time of high tide) was used to select the measurements associated with high salinity waters (Supplementary Figure S13a, b), representing the outer Elbe Estuary (nearshore coastal) waters (Voynova et al., 2015).
The extracted DOA and salinity data around each high tide were linearly interpolated and smoothed (Savgol filter function in Python) to obtain the daily variation between each high tide in the outer Elbe Estuary (Supplementary Figures S13c, S14c). The extracted and interpolated DOA at high tide were resampled to hourly intervals, and the DOA finite difference derivative for the timeseries was computed (Supplementary Figures S13d, S14d). The average DOA finite difference derivative for the night period was used to calculate the hourly respiration rate specific to each day (Resp) in the outer Elbe Estuary. Night periods were defined as times when the measured photosynthetically active radiation (PAR) was ≤ 1 W m−2. The respiration rates were assumed to be the same during daytime and nighttime (Odum, 1956; Voynova et al., 2015; Collins et al., 2013). Each nighttime respiration rate was then extrapolated to a 24-hour day using the fill function in Python (Harris et al., 2020) to fill the hourly respiration rate for each day, assuming these were uniform over 24 h.
To calculate hourly gross primary production (GPP), in the outer Elbe Estuary, the equation from Voynova et al. (2015) was used:
where primary production (GPPDOA (t)) is related to DOA-change with time (∂DOA/∂t), air–sea gas exchange (ka(t)DOA(t)) and respiration (RespDOA(t)). The ∂DOA/∂t was expressed as the DOA finite difference derivative for each hour of measurement in the outer Elbe Estuary (ΔDOA/Δt= (DOA(tn+1) − DOA(tn))/Δt), where ΔDOA is the difference between two consecutive DOA values, and Δt = 1 h (Supplementary Figures S13d, S14d). The respiration term, RespDOA(t), was based on the hourly respiration rate specific to each day. The air–sea gas exchange rate ka(t) was calculated using Equation 3. The DOA(t) values were the extracted, linearly interpolated and smoothed DOA between each high tide in the outer Elbe Estuary (Supplementary Figures S13c, S14c). Voynova et al. (2015) did not calculate a transport term, which was presented in Moore et al. (2009), as the study assumed that the region of the Delaware Bay was well-mixed. At the studied region, it was also not possible to calculate the horizontal gradient, but in general the German Bight waters near the outflow of the Elbe Estuary are considered to be well-mixed in areas with < 15 m water depth (Reimer et al., 1999) due to strong tidal currents (Becker et al., 1999). Mean water depth was calculated as 12 ± 4 m (GPS nautical chart, 2024; https://www.gpsnauticalcharts.com), which included the channel depth, and this depth is also representative of the outer Elbe Estuary, where water depth was shallower than 15 m, well-mixed and the salinity was mainly constant. The hourly estimates of GPP (GPPDOA (t)) and respiration (RespDOA(t)) were averaged for each day and multiplied by 24 to calculate the daily rate. This study quantifies metabolic processes in the water column, assuming that benthic processes and sediment resuspension play a minor role. In estuarine systems that are deeper than 10 m, there is the tendency for the relative rates of benthic respiration to decrease (Hopkinson and Smith, 2005). The outer estuary is on average 12 m deep, suggesting that the measurements in the pelagic zone provide a reliable approximation for ecosystem metabolism.
The results of the model used to estimate air–sea gas exchange can impact the estimates of GPP and respiration rates in estuaries (Raymond and Cole, 2001). Cerco (1989) found that the dominant source of turbulence at the air–sea interface in estuaries can be due to both wind and bottom shear, and can therefore depend on the water depth, water speed and wind speed. In the present study, air-gas exchange rates were calculated using an additive approach, in which the contributions of wind and water speed were combined (Thomann and Fitzpatrick, 1982; Moore et al., 2009; Voynova et al., 2015):
where Ut is water speed, measured by WSV at Otterndorf (MPM) Sohle (714.02 Elbe-km; 8.87°E, 53.84°N). Uw is the wind speed in m s-1 measured at 10 m height selected for the Cuxhaven region (8.65°E, 53.85°N) from E-OBS meteorological data for Europe (Cornes et al., 2018 from https://cds.climate.copernicus.eu). H is the mean water depth of 12 m from the Cuxhaven marine chart (GPS nautical chart, 2024; https://www.gpsnauticalcharts.com).
The daily GPP and respiration were converted from µmol O2 L-1 d-1 (µM) to mg O2 L-1 d-1 using the molar mass of 32.0 g O2 mol-1. The daily GPP and respiration rates were converted from mg O2 L-1 d-1 to mg C L-1 d-1 using the photosynthetic quotient (PQ), which is the molar ratio of O2 released for every CO2 assimilated during photosynthesis, 1.2 was used according to Wolfstein et al. (2000):
A respiration quotient of 1 was used, as the molar ratio of CO2 released to every O2 absorbed during respiration (Hopkinson and Smith, 2005; Voynova et al., 2015):
The GPP and respiration rates were converted to volumetric rates in mg C m-3 d-1. To obtain depth-integrated values, the daily GPP and respiration volumetric rates were multiplied by the daily averaged euphotic depth. Euphotic depth was calculated using the formula in Kirk (1994):
The Kd (PAR) is the light attenuation coefficient for photosynthetically active radiation and was estimated using a relationship with turbidity:
where Turb was turbidity measured near high tide (representing the coastal end member) and interpolated using the method described above for salinity and DOA. The empirical relationship between Kd (PAR) and turbidity is based on a North Sea database of optical and water quality properties (Röttgers et al., 2023). This data was used as input to HYDROLIGHT (Mobley, 1994) to model Kd (PAR). Euphotic depth was estimated from the 15-minute Cuxhaven turbidity data and the values were averaged for each 24-hour day.
The calculated daily GPP and respiration rates based on Equations 2–7 were expected to be positive. During the assessed days, 46% of daily GPP rates and 25% of daily respiration rates were, however, negative. Of the total negative daily GPP and respiration rates, 89% and 86%, respectively occurred in April 2020, September 2020 to April 2021 and September 2021 to November 2021, coinciding with periods when DO was undersaturated (Figure 2) and DOA was negative (Supplementary Figure S13). The negative GPP and respiration rates were set to zero as they predominantly occurred during periods with low metabolic activity (Figure 2; Supplementary Figure S13), indicating that there was a lack of strong diurnal oxygen cycles (Caffrey et al., 2014; Engel et al., 2019). Advection of different water masses can also overwhelm the weak biologically driven dissolved oxygen signal (Kemp and Boynton, 1980; Caffrey, 2003). Omitting the negative GPP and respiration rates could thus upwardly bias estimates of metabolism (Caffrey et al., 2014; Engel et al., 2019). The only significant discrepancy when negative values were included and set to zero was in GPP rates during the low metabolism periods (October 2020 to February 2021 and October to November 2021), as the mean monthly GPP rates were at near zero instead of being negative (Supplementary Table S9). Setting negative GPP rates to zero in May – August 2020 & 2021, as well as setting negative respiration rates to zero for the entire studied period, resulted in no significant difference in respective metabolic rates compared to when negative values were included (Supplementary Table S9). The inclusion of days with negative GPP rates, or setting GPP rates at these days to zero, had no influence on the patterns of metabolic rates described in this study (Supplementary Table S9). In this study, rates of GPP, respiration and NEM were based on when negative daily GPP and respiration rates were set to zero.
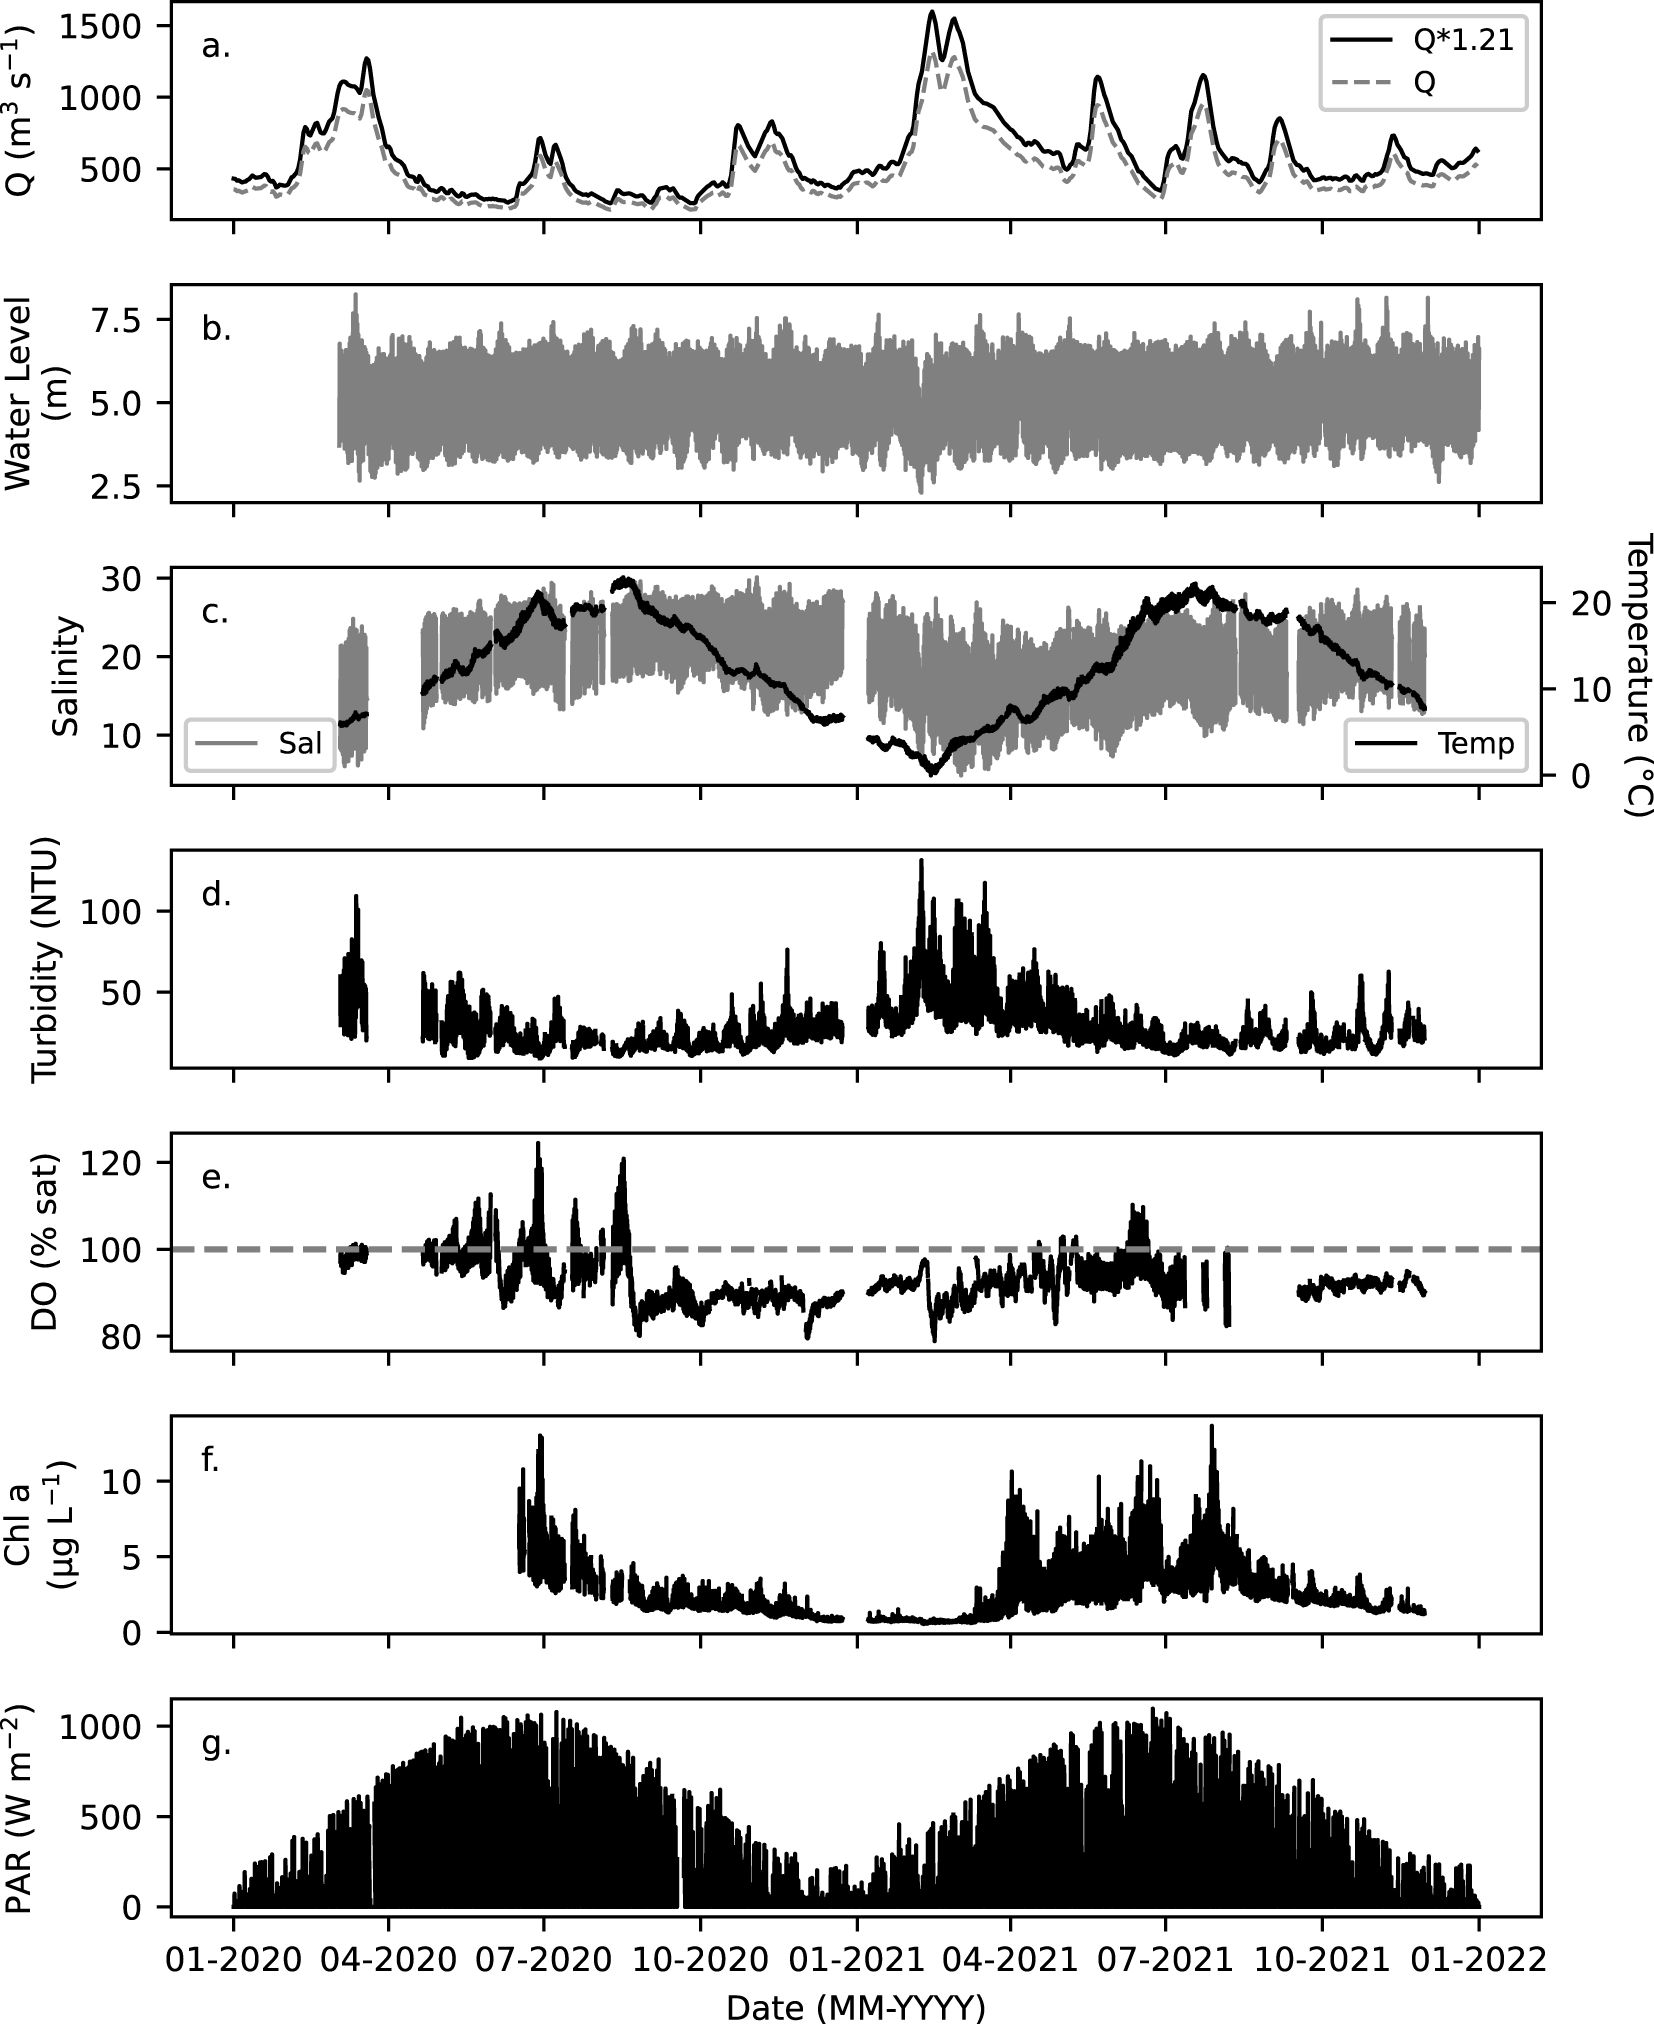
Figure 2. (a) Daily river discharge (Q) recorded from Neu Darchau gauging station (536.4 Elbe-km) with a 1.21 correction factor applied for Cuxhaven (Q*1.21) in 2020 and 2021 (Amann et al., 2015). (b) Water level recorded by WSV and BfG at Cuxhaven Pier (724 Elbe-km; 8.72°E, 53.87°N) in 15-min intervals. Quality controlled (c) salinity and temperature, (d) turbidity, (e) DO in percent saturation (% sat), and (f) chlorophyll a fluorescence (Chl a, µg L-1) measured with the FerryBox (15-min intervals) at Cuxhaven (Figure 1) in 2020 and 2021. (g) PAR in 15-min intervals recorded at the Cuxhaven Station (8.71°E, 53.87°N) by DWD in 2020 and 2021.
2.8 Data and statistical analysis
Monthly means and corresponding standard errors were obtained from daily river discharge. The Mann–Whitney U test was applied to the test the significance of the difference between respective annual and monthly river discharges in 2020 and 2021, since the datasets presented a non-normal distribution from a Shapiro–Wilk test (p < 0.05). Except August 2020 and 2021 (Shapiro–Wilk test; p > 0.05), the independent t-test was used to test the difference between the datasets.
To determine the biogeochemical characteristics of the Elbe Estuary outflow waters and the outer estuary coastal waters, the ecosystem variables (DO, salinity, temperature, turbidity, chl-a) were selected at times (+3 h and -1 h) around the lowest (trough of mean-centered water level) and highest (peak of mean-centered water level) salinity over a tidal cycle. To examine the importance of different physical, chemical, and biological factors for metabolic rates, correlations between primary production, respiration and daily mean in situ temperature, turbidity and chl-a at high tide were analyzed with an ordinary linear regression model (OLS), assuming they were relatively constant throughout the day. Using the OLS method and the coefficients of determinations (R2) the correlations were calculated in Python (Seabold and Perktold, 2010). Daily metabolic rates were correlated with the mean daily PAR using the OLS method.
To assess the monthly and seasonal dynamics in metabolic activity, the primary production, respiration, and NEM rates were averaged: March and April were used to obtain monthly rates for early and mid-spring, May for late spring, June to August for summer, September to November for autumn and December to February for winter. Spring was separated into early/mid-spring and late spring, due to the distinct change in primary production and respiration rates throughout this season, observed in relation to turbidity. To test the uncertainty of the averaged seasonal values, the standard error (SE) of the mean was calculated. The variability in GPP and respiration rates between seasons in each year (e.g. spring 2020 versus summer 2020), and in GPP and respiration rates in the same season between each year (e.g. spring 2020 versus spring 2021) were statistically assessed. In summer 2021 (June to mid-September), anomalous oxygen concentration data were observed and identified periods were removed (Supplementary Table S7) as discussed above in section 2.6, and therefore no statistical comparison with metabolic rates in summer 2021 were conducted. The Mann–Whitney U test was applied when datasets presented a non-normal distribution from a Shapiro–Wilk test (p < 0.05) and the independent t-test was used when datasets presented a normal distribution from a Shapiro–Wilk test (p > 0.05).
3 Results
3.1 Physical and biogeochemical characteristics of the Elbe Estuary and adjacent coastal waters
In 2020 and 2021, river discharge was highest in spring, with monthly averages in March of 1023 ± 29 m3 s-1 and 1032 ± 36 m3 s-1 (Figure 2a), and lowest by the end of summer and early autumn, with a monthly average of 306 ± 5 m3 s-1 in August 2020 and 438 ± 2 m3 s-1 in October in 2021. This reflects a typical seasonal river discharge pattern (Mudersbach et al., 2017). The annual river discharge in 2020 was significantly lower than in 2021, and the monthly river discharges in 2020 were significantly lower compared to the respective months in 2021, except for March, October and November (p < 0.05; Figure 2; Supplementary Table S11). Daily maximum PAR values were lowest during winter at < 280 W m-2 in December 2020 and January 2021 and were over 3 times higher in May to August, exceeding 950 W m-2 each month (Figures 2g, 3e, j). In the Elbe Estuary outflow and outer Elbe Estuary, water temperature was lowest in February 2021 (0.2°C) and highest in June and August (> 20 °C) in 2020 and 2021 (Figure 2c).
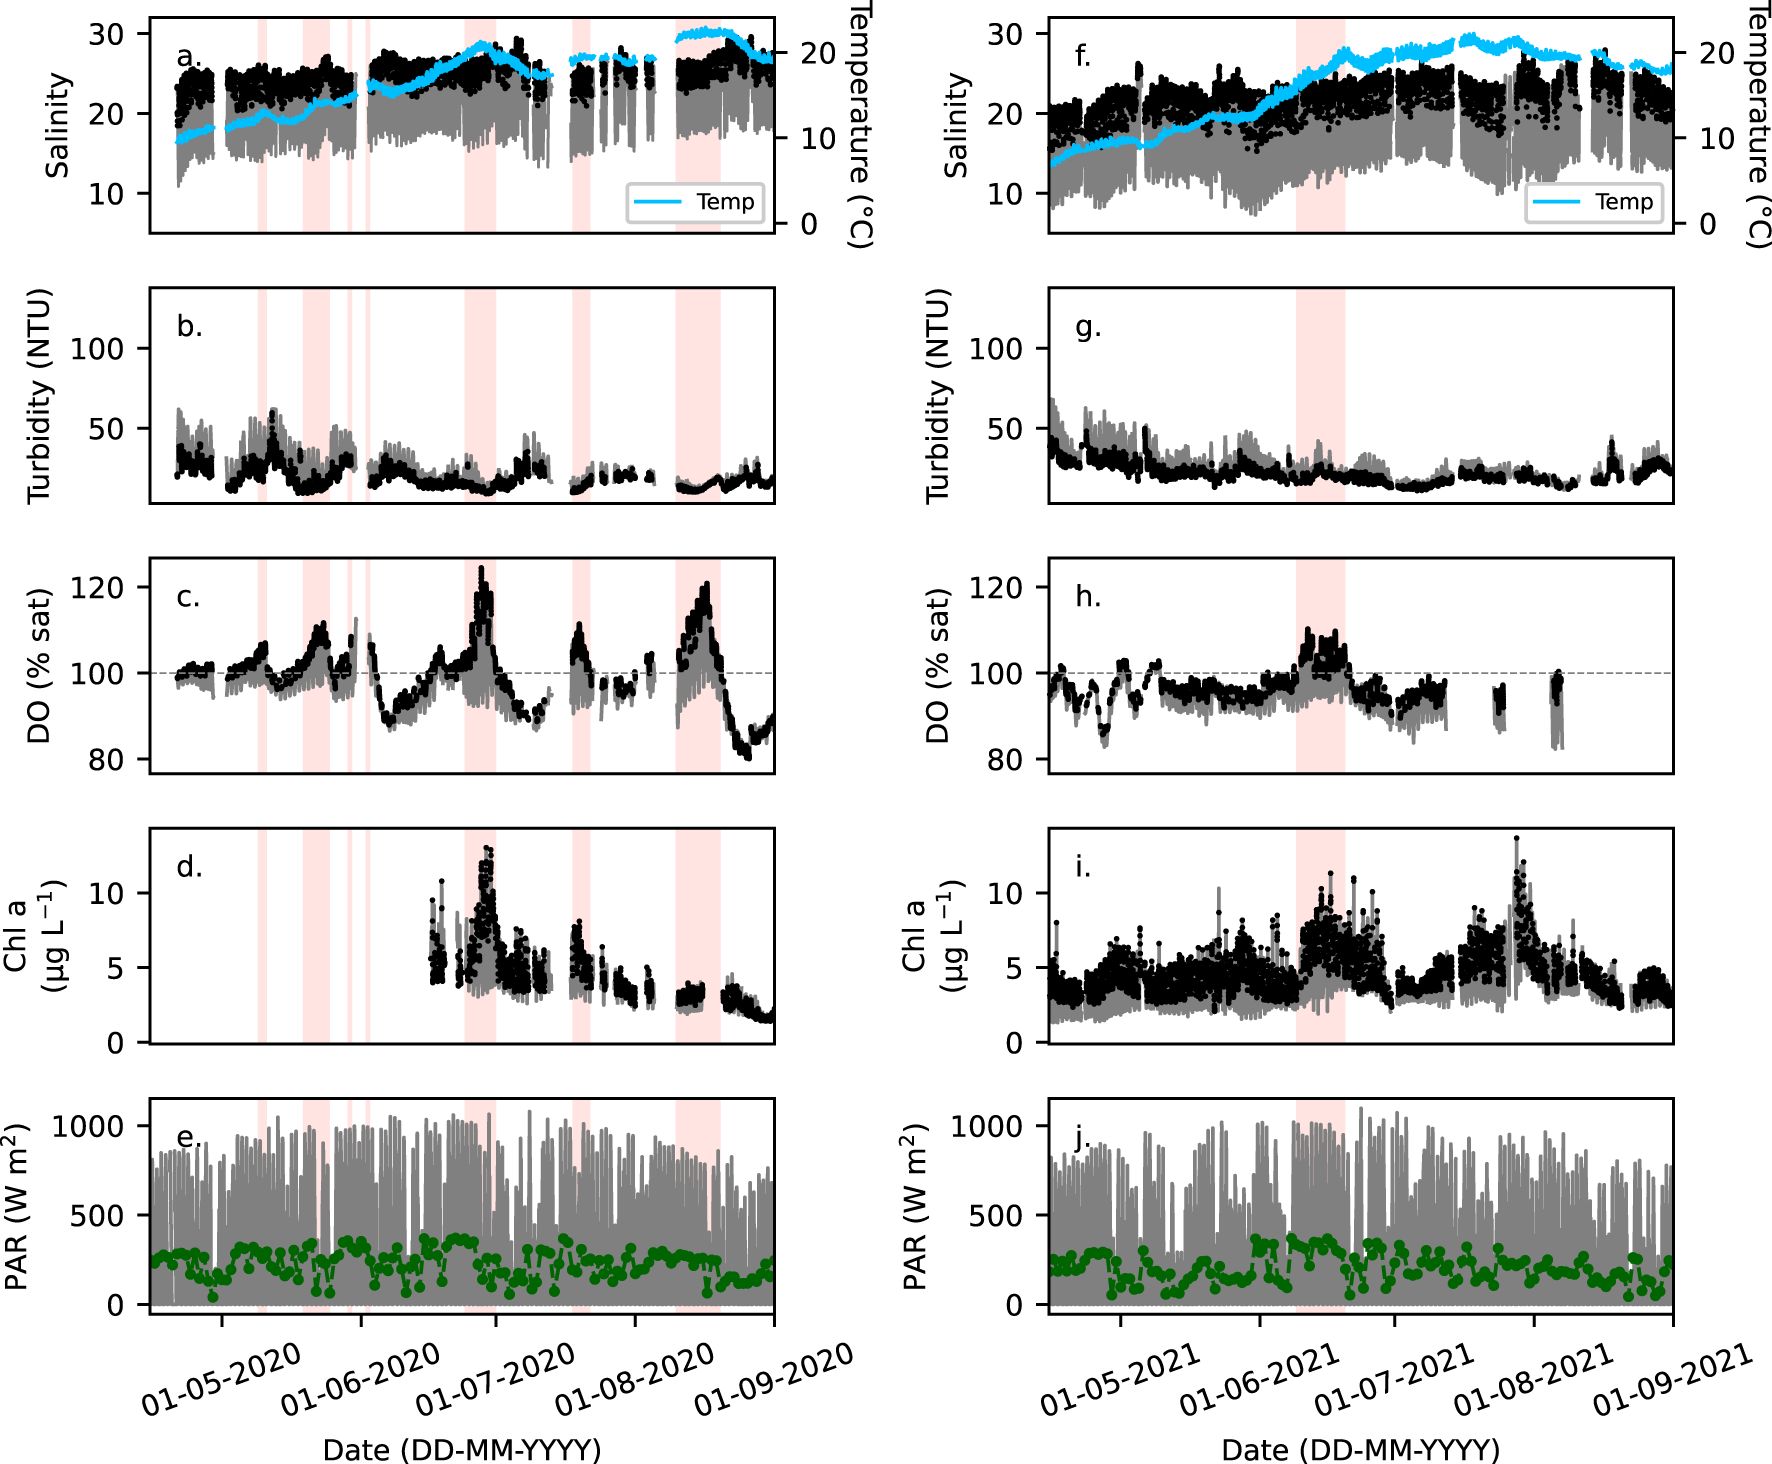
Figure 3. (a, f) Salinity (grey) and temperature (blue), (b, g) turbidity, (c, h) DO in percent saturation (% sat), and (d, i) chlorophyll a fluorescence (Chl a, µg L-1) measured with the FerryBox (15-min intervals) at Cuxhaven (Figure 1) between 15. April and 1. September in 2020 and 2021 (grey). Black dots identify the designated high tide waters representing the outer Elbe estuary waters. (e, j) PAR in 15-min intervals recorded at the Cuxhaven Station (8.71°E, 53.87°N) by DWD (grey), with the daily mean PAR (green dots). Red blocks highlight periods when DO > 105%.
Distinct biogeochemical differences between the Elbe Estuary outflow and outer Elbe Estuary water masses were reflected in salinity, chl-a, turbidity, and DO (Figures 2–4) timeseries. The Elbe Estuary outflow waters were characterized by a large salinity range between 5 and 28. At high water, the salinity ranged between 13 – 30, which was in range of nearshore region of the German Bight waters of 16 – 30 (Kamjunke et al., 2023). Therefore, the high-water waters can be used to represent the outer Elbe Estuary coastal waters (Rewrie et al., 2023a, b). In the Elbe Estuary outflow and the outer Elbe Estuary, turbidity was highest in February and March at 53 ± 20 NTU and decreased to lowest values in summer at 19 ± 6 NTU in 2020 and 22 ± 6 NTU in 2021 (Figures 2d, 3b, g). Over a tidal cycle, lower turbidity, on average by 1.4 to 1.7 times, typically characterized the outer Elbe Estuary (for example in Figures 3b, g, 4b). DO was mainly supersaturated (> 100%) within the outer Elbe Estuary waters, from May to August in 2020 and 2021 (Figures 2e, 3c, h), reaching 130% saturation on 27. June 2020 (Figure 4c). Chl-a varied with salinity and was highest in the outer Elbe Estuary waters, typically when DO was supersaturated (highlighted in red in Figures 3c, d, h, i and shown in Figures 4c, d). In summary, during flood tide, the outer Elbe Estuary waters were characterized by higher salinity (13 – 30), lower turbidity, and that in late spring to summer, DO was supersaturated and chl-a doubled, compared to the Elbe Estuary outflow waters.
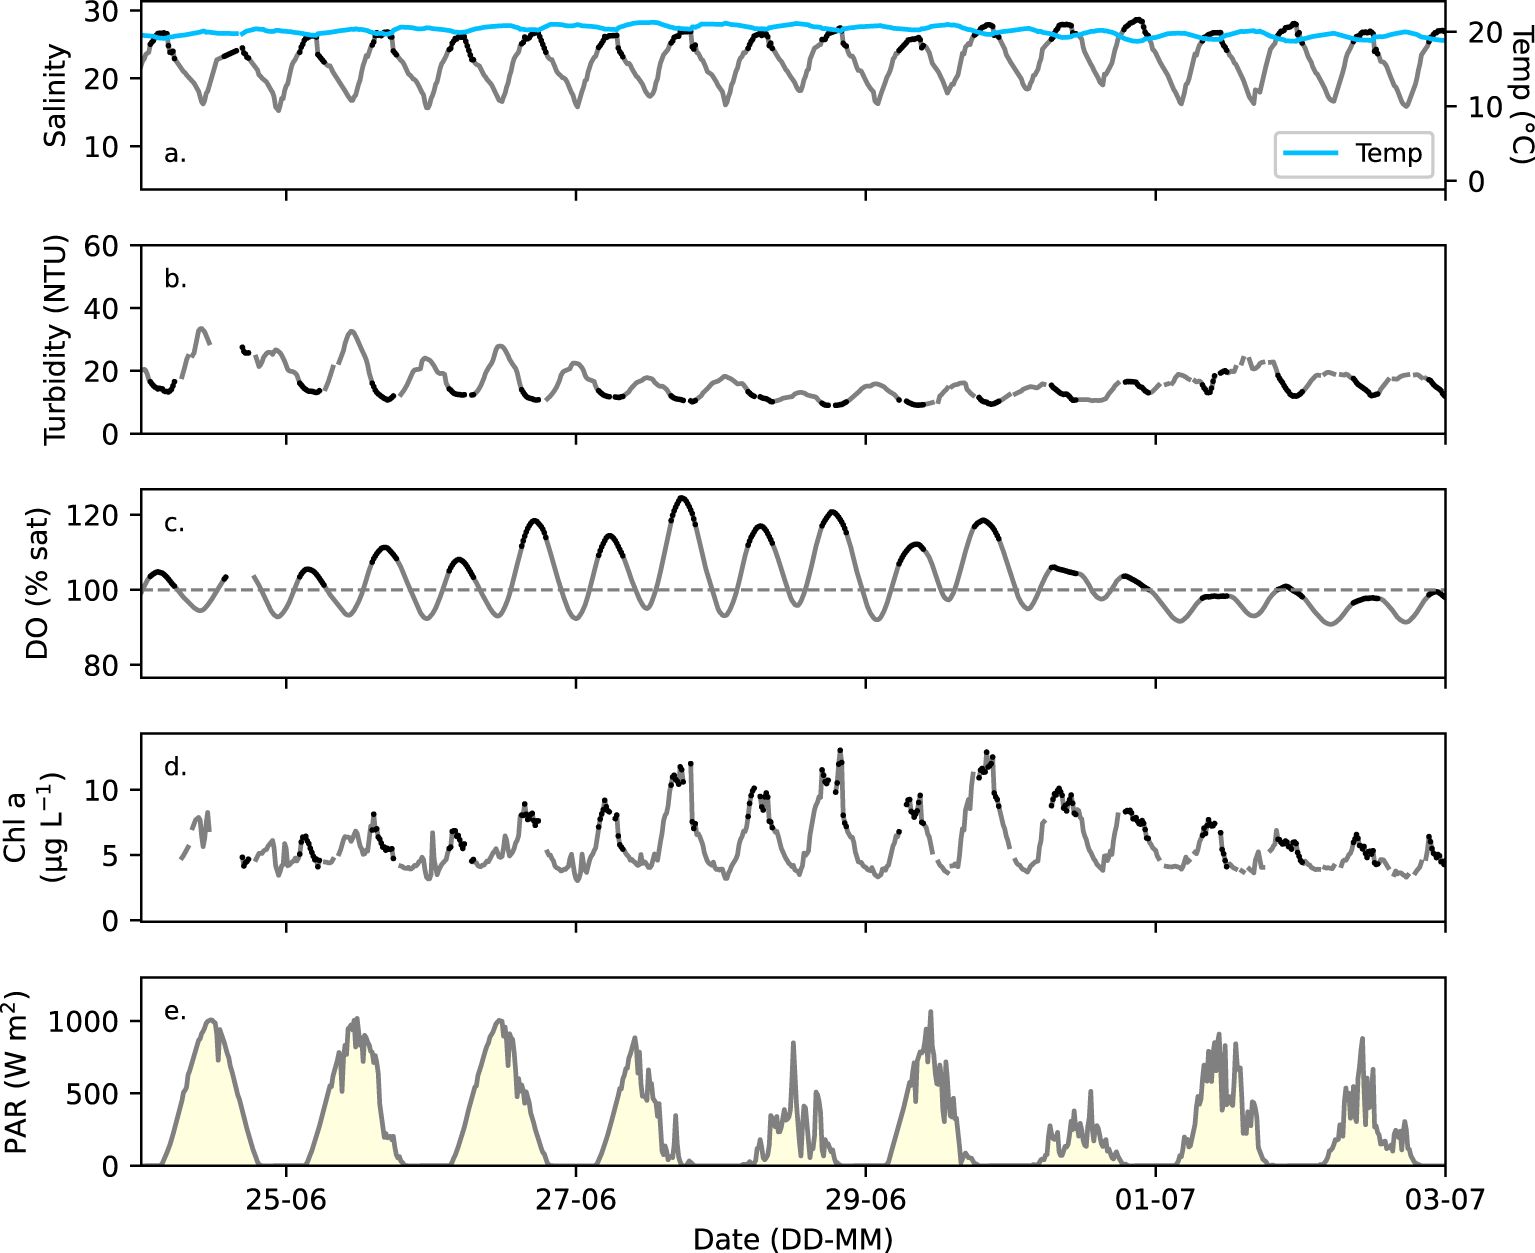
Figure 4. (a) Salinity (grey) and temperature (blue), (b) turbidity, (c) DO in percent saturation (% sat), and (d) chlorophyll a fluorescence (µg L-1) measured with the FerryBox (15 min intervals) at Cuxhaven (Figure 1) during a representative 9-day period (24. June – 2. July 2020). Black dots in a – d identify the designated high tide representing the outer Elbe Estuary waters. (e) PAR in 15-min intervals recorded at the Cuxhaven Station (8.71°E, 53.87°N) by DWD.
3.2 Primary production, respiration and NEM in the outer Elbe Estuary
The time series of GPP and respiration rates varied seasonally in the outer Elbe Estuary waters. Lowest GPP and respiration rates were found in autumn and winter during 2020 and 2021, at near zero (Table 2; Figure 5). The GPP rates were low in early spring and mid-spring, at 155 ± 46 mg C m-2 d-1 in April 2020 and 74 ± 24 mg C m-2 d-1 in March to April 2021, but significantly increased into late spring, to 461 ± 62 mg C m-2 d-1 in May 2020 (p < 0.05, Supplementary Table S12) and to 282 ± 56 mg C m-2 d-1 in May 2021 (p < 0.10, Supplementary Table S12). Highest GPP rates were observed between June and August, with summer seasonal averages of 613 ± 89 mg C m-2 d-1 and 558 ± 77 mg C m-2 d-1 in 2020 and 2021, respectively (Table 2; Figure 5). Summer GPP rates were significantly higher than late spring 2020 (p < 0.05, Supplementary Table S12). There was also an increase in respiration rates from spring to summer (Table 2; Figure 5), with a significance in 2020 (p = 0.10, Supplementary Table S12). The mean seasonal NEM rates were negative to near to zero in all seasons, ranging between -2 ± 49 mg C m−2 d−1 and -149 ± 41 mg C m−2 d−1 in 2020 and 2021 (Table 2; Figure 5c).
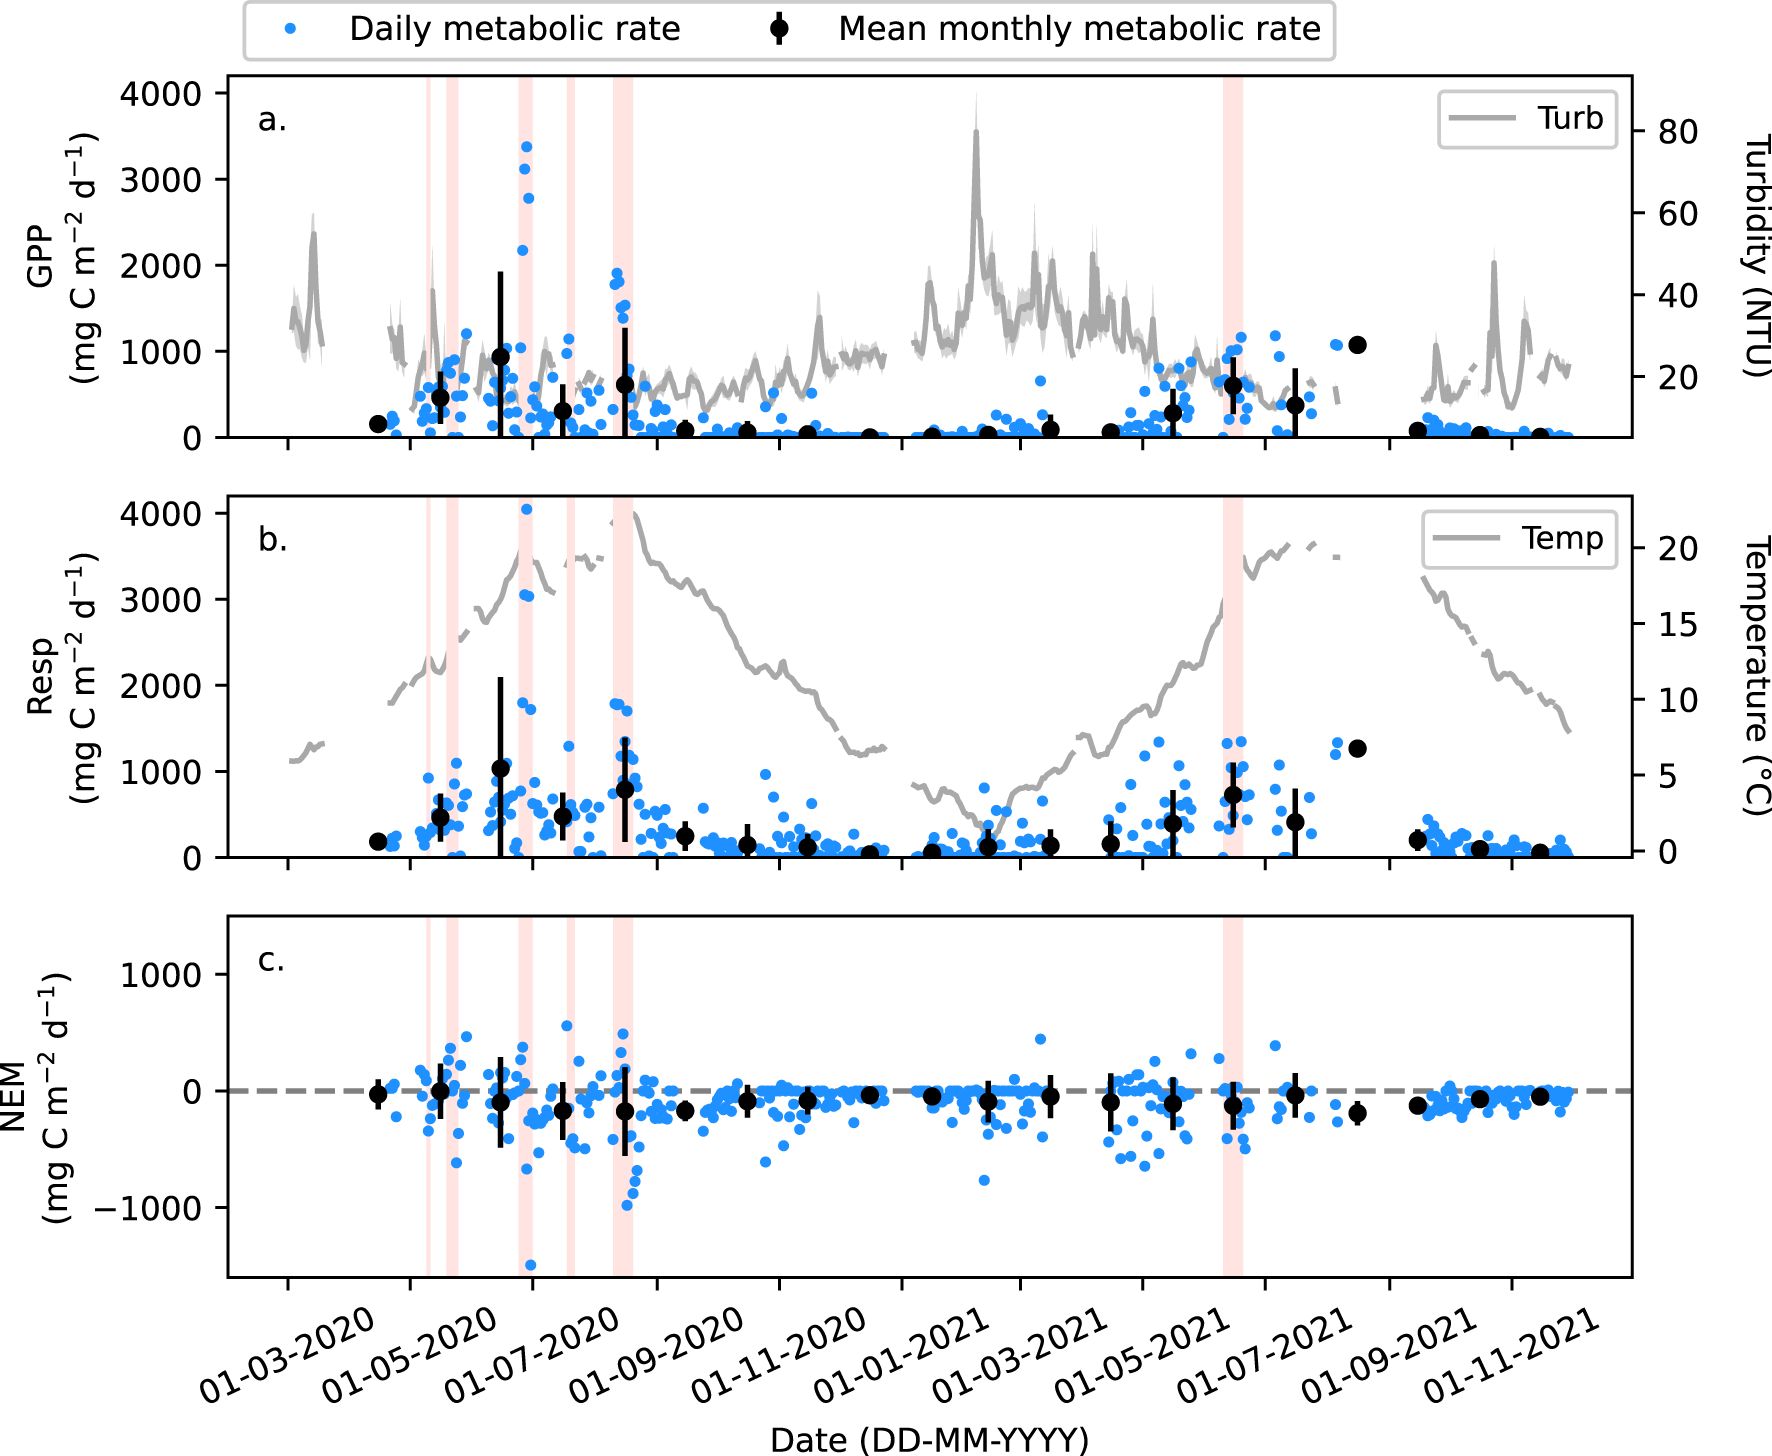
Figure 5. (a) Daily gross primary production (GPP) and turbidity in the outer Elbe Estuary waters, (b) respiration (Resp) and temperature in the outer Elbe Estuary waters, and (c) net ecosystem metabolism (NEM) in mg C m-2 d-1. Black circles (a–c) are the monthly mean for each metabolic rate (located at the mid-point of each month) with the error bars representing one standard deviation to the mean. Red blocks highlight periods when DO > 105% in Figure 3.
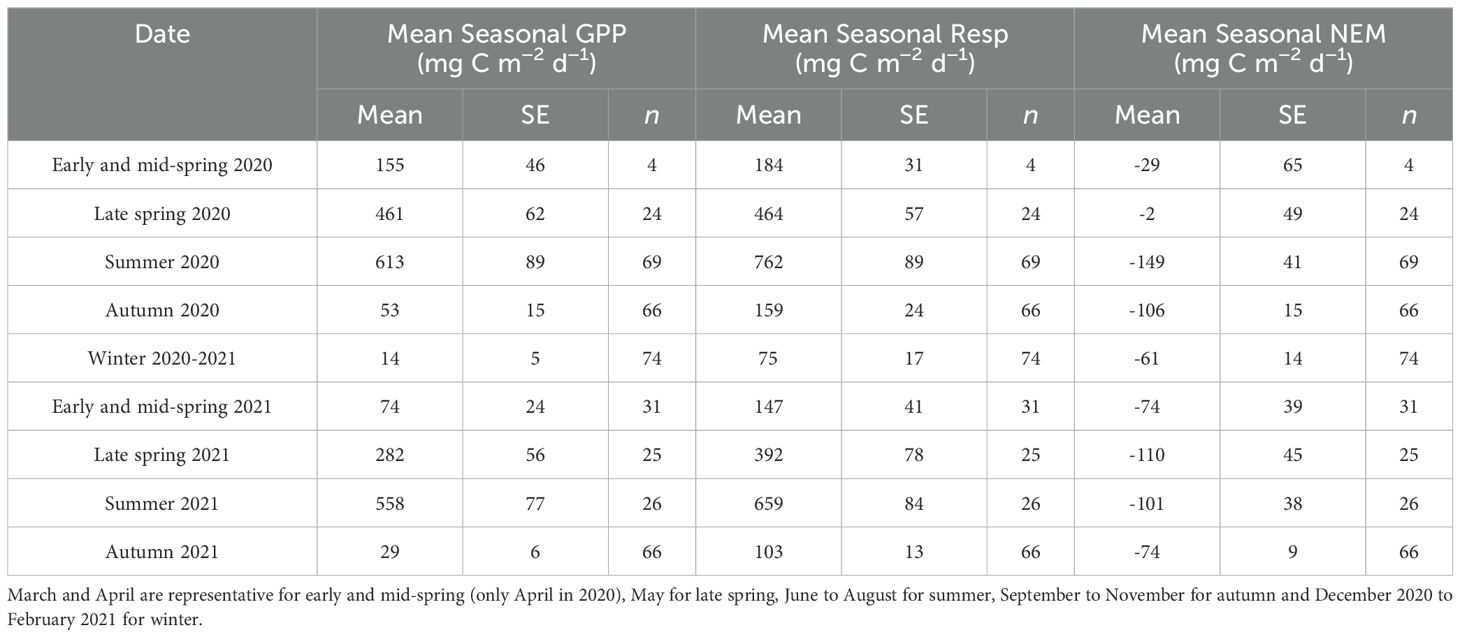
Table 2. Mean seasonal gross primary production (GPP), respiration (Resp), and net ecosystem metabolism (NEM) in mg C m−2 d−1, with one standard error (SE) to the mean and number of samples per SE assessment (n), in the outer Elbe estuary waters.
Daily GPP and respiration rates were significantly correlated during the study period (R2 = 0.81, p < 0.05), and daily GPP and respiration rates were both significantly positively correlated with temperature, chl-a, and negatively correlated with turbidity (Table 3). Daily GPP rates were significantly correlated with mean daily PAR over the study period (R2 = 0.26, p < 0.05; Table 3).
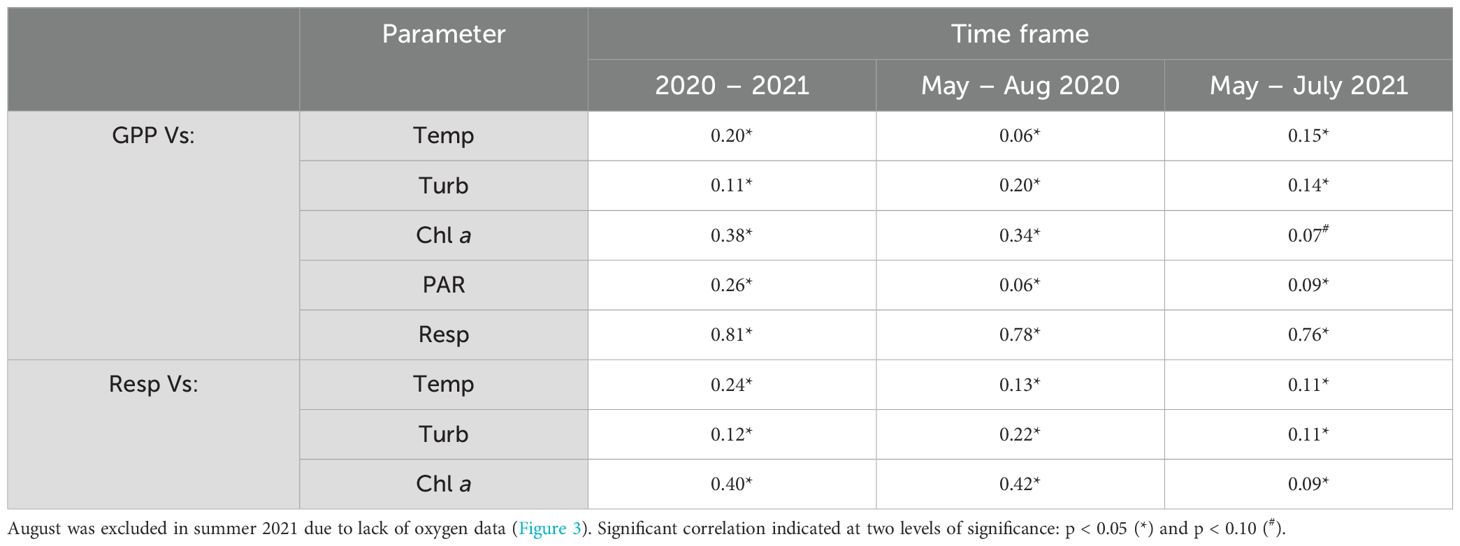
Table 3. Correlation between daily rates of gross primary production (GPP; in mg C m-2 d-1) and respiration (Resp; in mg C m-2 d-1), as well as temperature (Temp in °C), turbidity (Turb in NTU, negative correlation), chlorophyll-a fluorescence (Chl a), and daily photosynthetically active radiation (PAR in W m-2) for the studied period (2020 – 2021), and in late spring to summer in 2020 and 2021.
3.3 Seasonal nutrient cycle at the land-sea interface
Nitrate dominated dissolved inorganic nitrogen (DIN) and in this paper nitrate and nitrite will be represented by nitrate (Schulz et al., 2023). Nitrate, silicate and phosphate had an inverse, and relatively linear relationship to salinity (Figure 6). Ammonium generally did not vary with salinity, except perhaps in April and May 2021, when concentrations decreased in the high salinity region (> 15). The mean nitrate concentration increased from November 2020 (66 ± 20 µmol L-1) until April 2021 (162 ± 42 µmol L-1), followed by a decrease in concentration to 68 ± 25 µmol L-1 in August 2021. A similar seasonal pattern was observed in ammonium, except for May 2021, when ammonium concentrations were higher than in April 2021. Phosphate concentrations indicated minimal change within the study period, with slightly elevated concentrations in July and August 2021 up to 2.1 ± 1 µmol L-1 in the latter month.
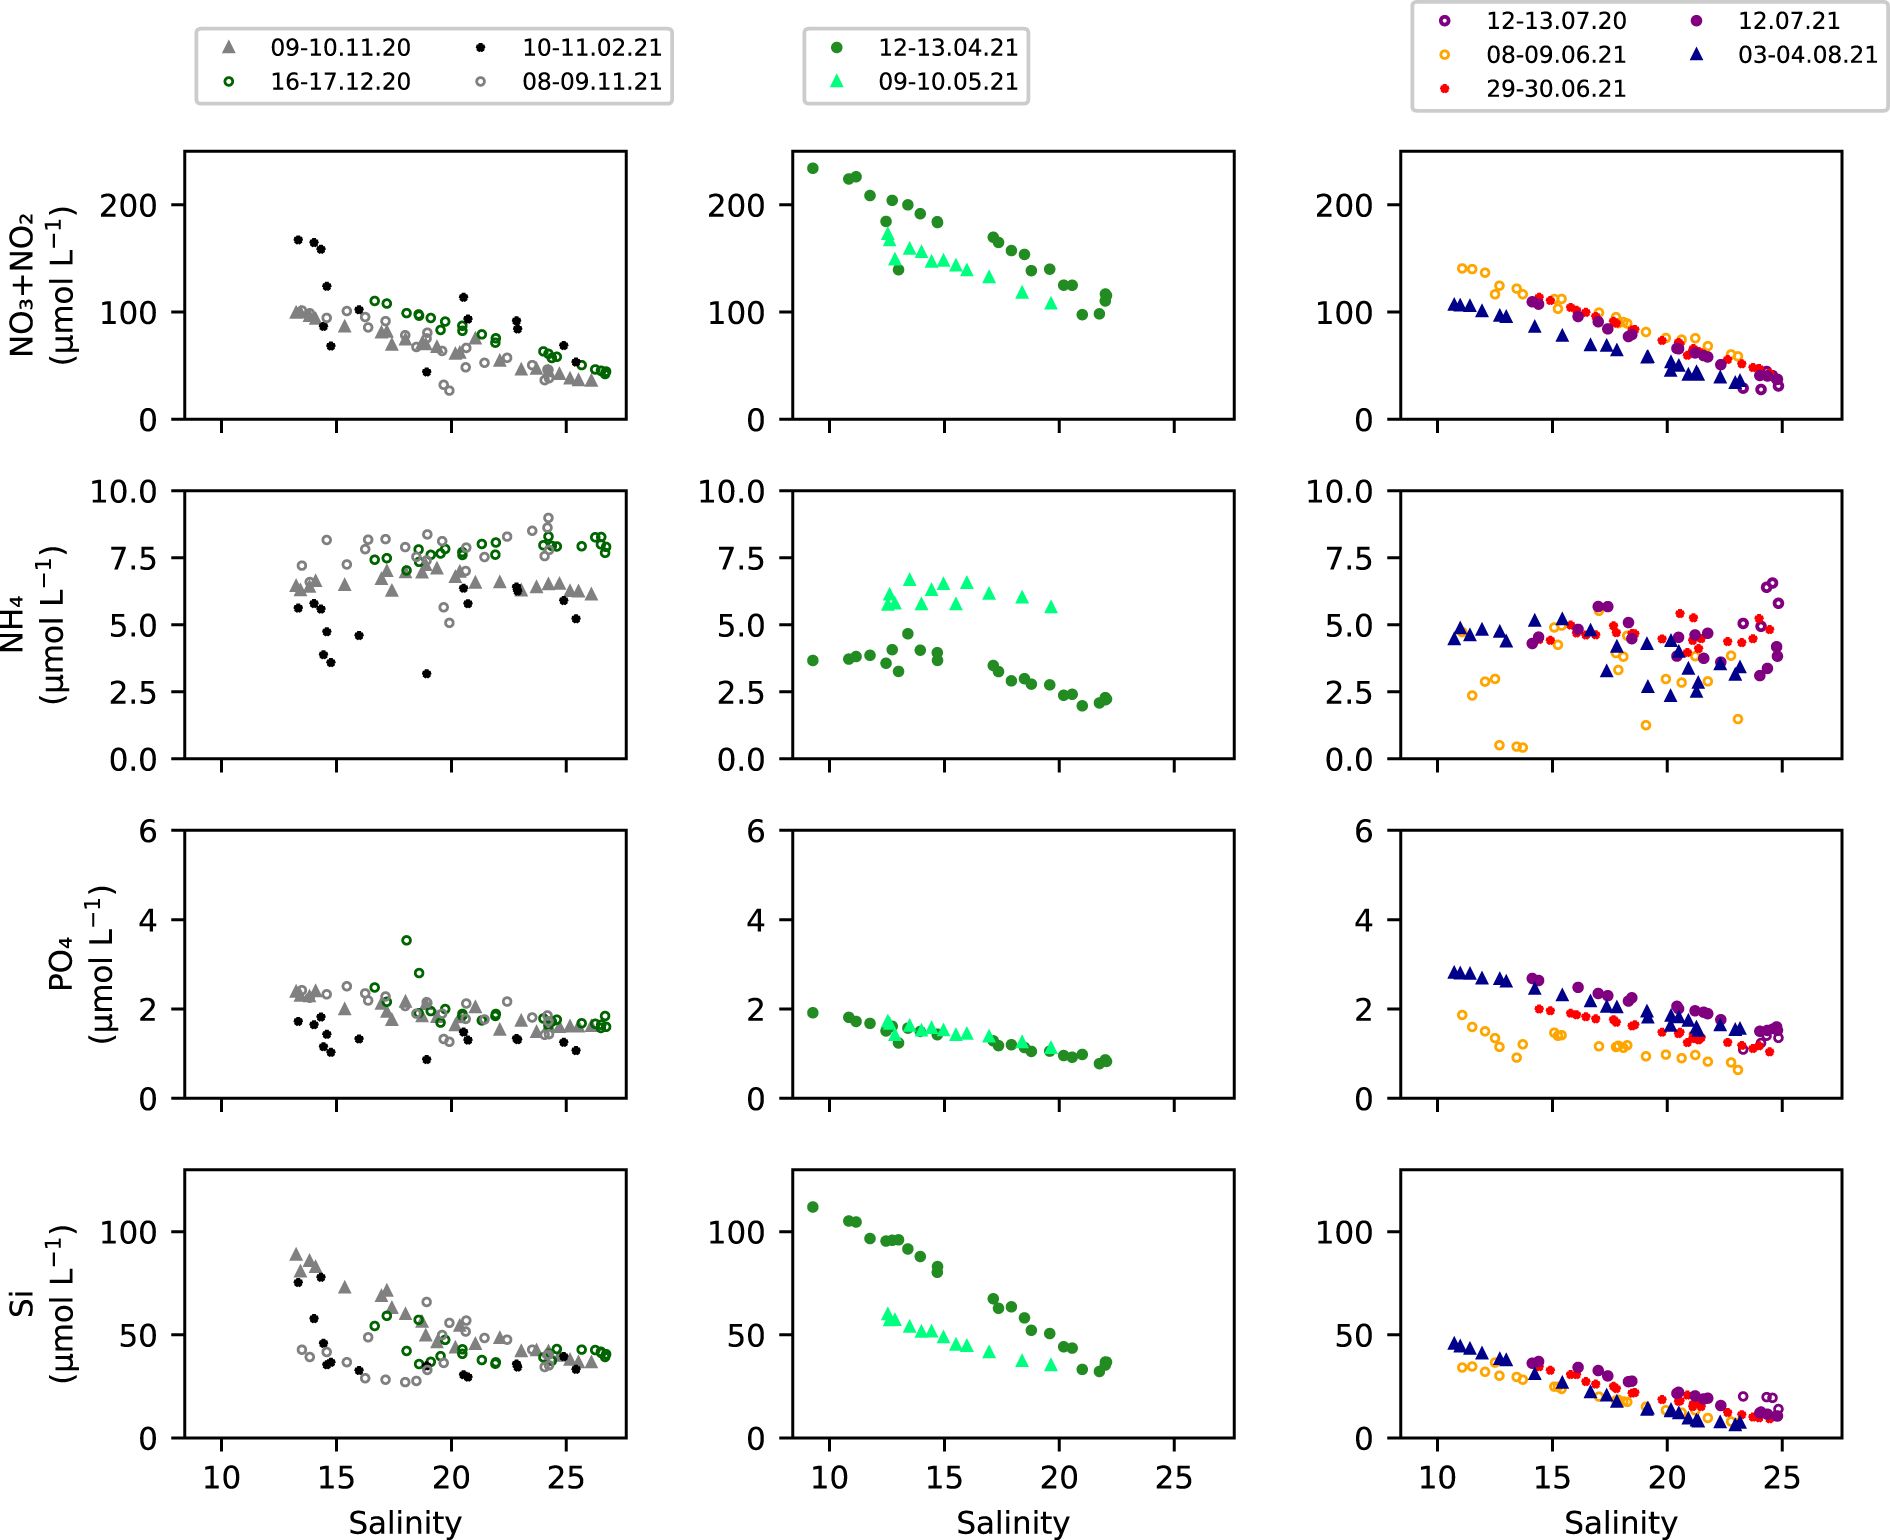
Figure 6. Nutrients versus salinity for 11 discrete tidal sampling periods from the FerryBox at Cuxhaven in 2020 and 2021. Nitrate and nitrite (NO3- + NO2-), ammonium (NH4+), phosphate (PO43-) and silicate (Si). Samples collected in autumn and winter in the left panels, in spring in the middle panels and in summer in the right panels for the study period (Supplementary Table S1).
3.4 Seasonal cycle in the estuarine carbonate system (DIC and TA)
Concentrations of DIC increased from autumn until winter 2020, then dropped in mid-spring (April 2021), followed by an increase in May to 2234 ± 5 µmol kg-1, and a large decrease through summer until end of August to 2097 ± 22 µmol kg-1 and beginning of September to 2093 ± 16 µmol kg-1 in 2021 (Figure 7). The Elbe Estuary outflow waters mainly contained lower DIC that increased along the salinity gradient, except in May and early June 2021, when the opposite occurred and DIC was lower in the high salinity region (≥ 19 psu). In autumn, winter and spring, DIC significantly correlated with salinity (R2 = 0.24 – 0.93, p < 0.05) but did not in June and July 2021 (Supplementary Table S13), when DIC was constant with salinity (Figure 7). Like DIC, TA concentrations were seasonally variable and were highest in December 2020 at 2289 ± 37 µmol kg-1 and decreased through spring and summer until the end of August 2021 to 2172 ± 43 µmol kg-1 (Figure 7). In all months, except October 2021, TA significantly correlated with salinity (R2 = 0.83 – 0.99, p < 0.05 in Supplementary Table S13). It should be noted that there were no TA measurements for May 2021 when the highest DIC concentrations were recorded. Neither DIC nor TA correlated with salinity in October 2020, and this was likely due to the low sample size (n = 3 in Supplementary Table S13).
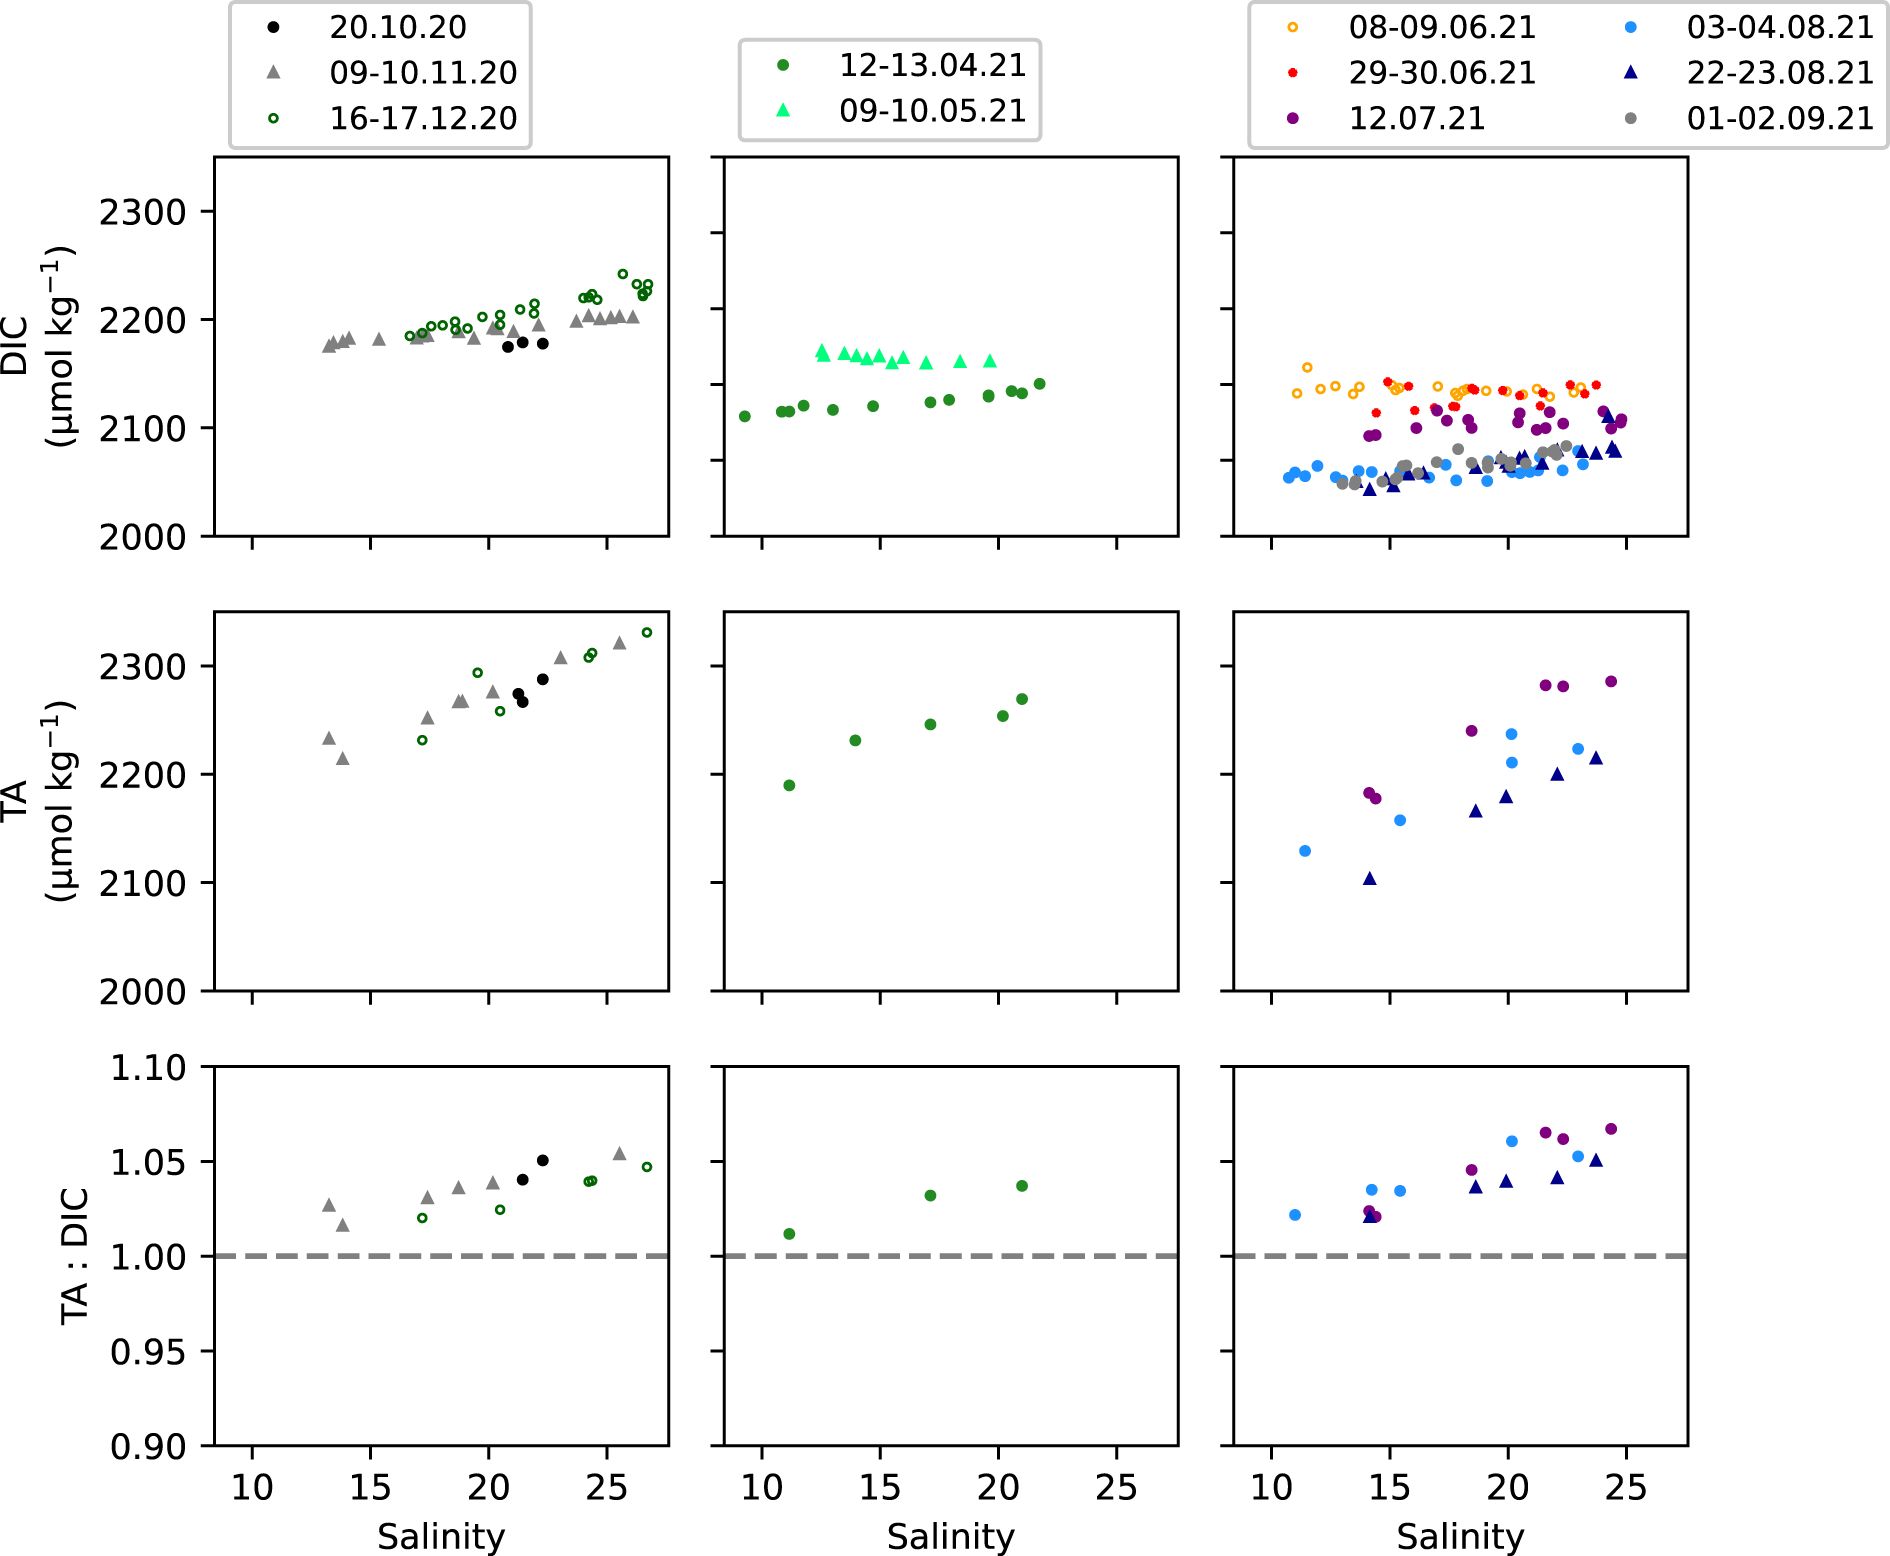
Figure 7. Dissolved inorganic carbon (DIC), Total alkalinity (TA) and the TA: DIC ratio versus salinity from the FerryBox at Cuxhaven in 2020 and 2021. Samples collected in mid to late autumn and winter in the left panels, in spring in the middle panels and in summer and the start of autumn in the right panels (Supplementary Table S1). Refer to Supplementary Table S13 for the regression between DIC, TA or TA: DIC and salinity using the ordinary least squares (OLS) method and the calculated coefficients of determination (R2).
The ratio of TA: DIC (Joesoef et al., 2017) or the difference between TA and DIC (Xue and Cai, 2020) can serve as an indicator of the source of carbonate species. For instance, CO2 drawdown from primary production and imbalances between production and respiration in the nearshore region can increase the TA: DIC ratio (Joesoef et al., 2017). Along the salinity gradient, the TA: DIC ratio was slightly above 1.0 with monthly averages ranging between 1.03 ± 0.01 and 1.05 ± 0.02 across all seasons in 2020 and 2021, which significantly increased with salinity in all months (R2 = 0.85 – 1.0, p < 0.05), except in April 2020, which was likely due to low sample size (n = 3 in Supplementary Table S13).
4 Discussion
4.1 Factors controlling GPP and respiration rates in the outer Elbe Estuary waters
In contrast to the lower Elbe Estuary, where dissolved oxygen was undersaturated throughout the study period, the outer Elbe Estuary waters adjacent to Cuxhaven were a biologically productive ecosystem, with supersaturated dissolved oxygen in May to August, in 2020 and 2021 (Figures 2–4). This was also noted in Rewrie et al. (2023a) and Rewrie et al. (2023b), where a longer time frame from 1997 to 2020 from a different dataset was examined, and dissolved oxygen supersaturation was observed in the outer Elbe Estuary frequently in spring and summer.
The magnitude of GPP rates at the outflow from the Elbe Estuary into the German Bight of the North Sea significantly increased on average by 3- and 4-fold from early and mid-spring into May 2020 and 2021, i.e. primary production rates were significantly higher in late spring (Table 2; Figure 5a). The GPP rates further increased by on average 1.3 – 2.0 times into the summer, reaching maximum rates of 613 ± 89 mg C m-2 d-1 in 2020 and 558 ± 77 mg C m-2 d-1 in 2021(Table 2; Figure 5a). A high degree of variability in the daily GPP rates was evident in spring and summer (Table 2, Figure 5a), also suggested by the high standard deviations respective to the monthly averages (Figure 5a). One explanation for the short-term peaks of the daily GPP rates (Figure 5a) could have been the 14-day spring-neap tidal cycle (Domingues et al., 2010; Flores-Melo et al., 2018). The spring-neap tidal cycle was identified as an important modulator of inorganic and organic carbon levels in the outer Elbe Estuary and adjacent coastal region (Chegini et al., 2020; Macovei et al., 2024). A detailed analysis of the different tidal impacts on daily GPP rates is, however, beyond the scope of this study. The high degree of variability in the daily GPP rates indicated a very dynamic system, where primary production, respiration and ecosystem metabolism in the outer estuary can be quantified with high frequency measurements of oxygen and ancillary ecosystem parameters.
Throughout the studied period, daily GPP rates and the phytoplankton biomass (chl-a) in the outer estuary waters were significantly correlated (Table 3), and this demonstrates that phytoplankton blooms and biomass production in the coastal zone were likely supported by in situ primary production and thus the newly produced organic matter was likely autochthonous. Organic matter of marine origin was identified in the high salinity region of the Elbe Estuary with enriched δ13C of particulate organic carbon values by Middelburg and Herman (2007). More recently, production of labile organic matter is supported by Schulz et al. (2023) who found particulate organic matter with low carbon-to-nitrogen ratios and with relatively high particulate nitrogen and carbon contents in the outer Elbe estuary during the summer. This differs from the Humber Estuary for example, where the phytoplankton biomass has been suggested to be rather allochtonous and transported into the coastal regions from upstream regions (Macovei et al., 2024). Overall, we find the highest primary production rates throughout the summer season, suggesting that this season is essential for carbon sequestration and turnover in the coastal region.
Despite the high nutrient concentrations in early and mid-spring (Figure 6) and high solar irradiance, with daily maximum PAR > 500 W m-2 during 75% of the days (Figure 2g) and with long days of 10 to 15 daylight hours, the GPP rates remained low in early to mid-spring (Figure 5a). Elevated turbidity in early and mid-spring at 31 ± 9 NTU in 2020 and 35 ± 7 NTU in 2021 (Supplementary Table S14) thus most likely limited primary production in the nearshore waters. The elevated turbidity could indicate a shift in the maximum turbidity zone (MTZ) from the typical location in the mid-region of the Elbe Estuary (Figure 1, Amann et al., 2015; Kappenberg et al., 2018) to the lower and outer estuary (Figure 1, Kappenberg and Fanger, 2007) due to higher river discharge (1023 ± 29 m3 s-1 in March 2020 and 1032 ± 36 m3 s-1 in March 2021, Figure 2a). In winter and spring, strong wind and subsequent faster surface currents, along with high wave energy, generate turbulent mixing and induce sediment resuspension enhancing turbidity levels in the coastal region (Dobrynin et al., 2010; Su et al., 2015; Tian et al., 2009), which can also contribute to the elevated turbidity in the outer estuary during winter and early to mid-spring (Figure 2, Supplementary Table S14). Only when turbidity fell to 21 ± 8 NTU in May 2020 and 23 ± 5 NTU in May 2021 (Figures 2, 3, Supplementary Table S14) did GPP rates respectively increase by on average 3 to 4 times, and thus revealing the increased light availability to phytoplankton in the water column. During summer, with highest GPP rates (Figure 5a), the low river discharge (Figure 2a) could have allowed the MTZ to shift upstream into the mid-region (Kappenberg and Fanger, 2007), and this can help explain the lower turbidity in the outer Elbe Estuary region (Figures 3b, g). Primary production in the outer Elbe Estuary waters was likely not nutrient-limited since silicate, phosphate and nitrate concentrations (Figure 6) exceeded the limiting levels of 5 µM Si, 0.5 µM PO43- and 2 µM NO3-, based on the half-saturation constants for phytoplankton uptake (Fisher et al., 1988; Rick et al., 2006), throughout the studied period. We can therefore deduce that primary production in the coastal waters of the German Bight adjacent to the Elbe Estuary was seasonally elevated in late spring and summer and was limited by light availability, as a function of a combination of turbidity and solar irradiance.
While the nutrient concentrations were above expected limiting concentrations to primary production (Figure 6; Fisher et al., 1988; Rick et al., 2006), the elevated GPP rates in late spring to summer and subsequent fixation of inorganic nutrients most likely contributed to the 58% and 68% nitrate and silicate decrease from April until August (Figure 6). This is in line with findings by Dähnke et al. (2008) who reported enrichment of δ15N and δ18O in nitrate in the high salinity Elbe Estuary, which can indicate nitrate assimilation during phytoplankton production. The highest GPP rates occurred in the summer, with daily GPP rates >1900 mg C m-2 d-1 at the end of June and in mid-August 2020 (Figure 5a), in line with highest primary production in summer observed by Rick et al. (2006) in the coastal Elbe and Weser waters between 1986 and 1996, as well as by Tillmann et al. (2000) in the coastal Wadden Sea region, who found similar magnitude of daily GPP rates of >2000 mg C m-2 d-1 in summer 1995 and 1996. The previously observed GPP rates were also associated with limiting light conditions in spring but also in summer (Tillmann et al., 2000; Rick et al., 2006). Highest total phytoplankton biomass in summer was recorded at Helgoland Roads in 2003 (refer to Figure 1 for location, Tian et al., 2009). This demonstrates a similar pattern of pronounced seasonality in primary production during the recovery state (1997 – 2020, Rewrie et al., 2023b) and likely prior (Tillmann et al., 2000; Rick et al., 2006) in the coastal region adjacent to a large estuary outflow.
Similarly to the daily GPP rates, respiration rates were elevated in late spring and increased by 1.6 – 1.7 times to highest rates in summer (Figure 5b), which are consistent with warmer temperatures promoting higher metabolic rates (Allen et al., 2005), supported also by a significant correlation (R2 = 0.24, p < 0.05; Table 3). The concurrent peaks and similar magnitudes in daily GPP and respiration rates (highlighted in red in Figure 5a, b), combined with the significant correlation between daily GPP and respiration rates over the study period (R2 = 0.81, Table 3), indicated that a large fraction of the mineralized organic matter in the outer estuary waters were most likely of autochthonous origin. The suggested contribution of autochthonous organic matter from high GPP in the outer estuary and adjacent coastal waters agrees with Reimer et al. (1999), who reported remineralization of 75 % of locally produced organic matter in the surface waters of the German Bight. Most likely, labile organic matter produced in the coastal waters adjacent to the estuary was transported into the estuary, where it was remineralized, as previously observed (Wolfstein and Kies, 1999; Schulz et al., 2023). An enrichment in δ15N-SPM from the outer to lower estuary was found during the research campaign in Schulz et al. (2023) and indicates the remineralization of organic matter in the lower region of the estuary (G. Schulz, personal communication, Feb 12, 2025). Remineralization of organic matter in the lower estuary (Figure 1) was indicated by the predominately positive excursions in DIC from conservative mixing lines throughout the recovery state in late spring and summer (Rewrie et al., 2023b), and the depletion of δ13CDIC over the modelled conservative mixing reported by Amann et al. (2015) as CO2 production by respiration favours light C.
4.2 Influence of river discharge and light on inter-annual primary production
The GPP rates were only significantly lower in late spring 2021, by on average 1.6 times, compared to late spring 2020 (p < 0.05, Supplementary Table S12). In May 2021, river discharge was significantly higher (p < 0.05, Supplementary Table S11), with a monthly average over double to that of the preceding May (Figure 2a), likely driven by the intense rainfall across Germany, as the German Weather Service (DWD, 2021) reported precipitation in May 2021 of 95 L m2 was around 33% higher than the long-term average (1961 – 1990). While in May 2020, river discharge was below 370 m3 s-1 (Figure 2a, Supplementary Table S11), and this marks the end of a period of prolonged drought between 2014 and 2020, during which lower than normal river discharge was found especially in May (Rewrie et al., 2023b). Therefore, the two examined years here represent two different regimes: 2020 as drought and 2021 as a non-drought year. While turbidity did not seem to differ between the two late spring seasons (p > 0.05; Figures 3b, g, Supplementary Table S15), the mean daily PAR and the water temperature in the outer estuary were significantly lower in May 2021 compared to May 2020 (p < 0.05; Figures 3a, f, e, j; Supplementary Table S15). This could suggest that along with the heavy rainfall there was less light available for primary producers, coupled with the reduced water temperature, in late spring 2021 contributed to the lower GPP rates compared to late spring 2020. Iriarte and Purdie (2004) showed that mean water column irradiance, which was affected by cloud cover, rainfall levels, and water turbidity, was the main factor controlling the spring bloom timing based on 5 year observations of main spring bloom events in the Southampton estuary. Our results highlight interannual changes in the weather and environmental conditions impact the spring primary production in the outer Elbe Estuary coastal zone, as has also been demonstrated previously for the adjacent coastal region by Kerimoglu et al. (2020).
In contrast to the lower GPP rates in May 2021, there was no significant difference between respiration rates in late spring of 2020 and 2021 (p > 0.05, Supplementary Table S12). This suggests that an additional allochthonous source of organic matter may have supported the sustained respiration rates in late spring 2021 and contributed to a seasonal high DIC in the outer region (Figure 7). Elevated respiration rates during late spring 2021, supported by internal remineralization processes, were indicated by elevated ammonium and highest DIC in May 2021, with respective averages of 6 ± 0.4 µmol L-1 and 2242 ± 27 µmol kg-1 along the salinity gradient with 13 to 19 (Figures 6, 7). A peak in ammonium associated with remineralization of organic matter was in line with findings by Schulz et al. (2023) and the import of marine organic matter into the Elbe Estuary and degraded therein was previously reported by van Beusekom and Brockmann (1998).
4.3 Seasonal variations in net ecosystem metabolism
Seasonally averaged NEM were slightly negative and near zero in all seasons, ranging between -2 ± 49 mg C m−2 d−1 and -149 ± 41 mg C m−2 d−1. A high degree of variability in the daily NEM values was evident during spring and summer (Figure 5c; Table 2), which reflects the large fluctuations in the daily GPP and respiration rates within each month (Figures 5a, b; Table 2). This indicated transitions in trophic status between heterotrophy and autotrophy at the sub-monthly scale (Table 2; Figure 5c). The observed variability in the metabolic processes (weekly and bi-weekly cycles) makes the seasonally averaged NEM estimates to fluctuate around zero each month (Figure 5c) and season (Table 2). This suggests that net metabolism was near balanced in the outer Elbe Estuary during 2020 and 2021.
The near trophic balance in the outer Elbe Estuary waters is located between the net autotrophic conditions that prevail in the open German Bight (Reimer et al., 1999) and the North Sea as a whole (Thomas et al., 2005). While the water column of the coastal List Tidal Basin located in the northern Wadden Sea was also net autotrophic (Loebl et al., 2007), instead the Wadden Sea as a whole (Figure 1) was reported as net heterotrophic (Poremba et al., 1999; van Beusekom et al., 1999) and so was the adjacent Elbe Estuary (Amann et al., 2015). However, some of these studies (Poremba et al., 1999; Reimer et al., 1999; van Beusekom et al., 1999) focused on periods prior to the recent recovery state in the Elbe Estuary since 1997 as defined in Rewrie et al. (2023a), and therefore such a comparison to historical estimates should be cautioned due to the shifts in ecosystem functioning in response to anthropogenic pollution and cleanup activities that estuarine systems can experience (García-Barcina et al., 2006; Sharp, 2010; Rewrie et al., 2023a). The present study covered the coastal region adjacent to the Elbe Estuary unlike larger areas covered in the previous studies (Reimer et al., 1999; van Beusekom et al., 1999; Thomas et al., 2005; Amann et al., 2015) and this highlights the spatial variability of trophic status between the Wadden Sea and German Bight, suggesting that studies trying to determine the NEM of a system should consider small-scale variability (one that can resolve tidal and daily to weekly cycles), particularly when extrapolating results to larger geographical areas.
4.4 Seasonal inorganic carbon and total alkalinity dynamics
The pronounced DIC decrease of 125 – 160 µmol kg-1 (Figure 7) from late spring to the end of summer may suggest the uptake of DIC by the elevated primary production in late spring and summer at the nearshore region adjacent to the temperate estuary. This would also suggest net autotrophy within the outer Elbe Estuary, or adjacent nearby regions, although the seasonally averaged NEM (Table 2) suggests that the system operated relatively close to a balanced net metabolism. The reduction in DIC by summer may be a function of seasonal changes in DIC concentration in the Elbe Estuary. That is, Rewrie et al. (2023a) denoted that the large seasonal changes in the estuary DIC concentrations were driven by the reestablishment of primary production in the upstream regions during the recovery state (1997 – present). In fact, Rewrie et al. (2023b) pointed out that the along-estuary DIC concentrations were a function of the DIC source concentrations in the upper estuary, where a seasonal drop in DIC was observed, with lowest concentrations < 1700 µmol kg-1 in summer was associated with a DIC drawdown by autochthonous primary production and primary producers in the Elbe River (Amann et al., 2015; Kamjunke et al., 2021; Rewrie et al., 2023b). In the mid-estuary, the POC produced upstream and imported in the estuary is predominantly composed of algal detritus originating from the upper estuary and Elbe River upstream (Geerts et al., 2017; Rewrie et al., 2023b). Remineralization of upper estuary POC was sufficient to support the mid-estuary DIC production and hence DIC concentrations are higher along the salinity gradient (Figure 7) compared to those observed in the upper estuary. As has been previously observed, the highest DIC concentrations occurred in winter along the Elbe Estuary (Amann et al., 2015; Rewrie et al., 2023b) and in the coastal waters (Figure 7).
The TA in the nearshore region decreased by 116 – 128 µmol kg-1 from winter (December 2021) to the end of summer in August 2021 (Figure 7), like DIC, and as previously observed in Amann et al. (2015). This resulted in a mean monthly TA: DIC ratio between 1.03 ± 0.01 and 1.05 ± 0.02, which significantly increased at higher salinity throughout the studied period (Figure 7, Supplementary Table S13). Surprisingly, the ratio did not change between autumn/winter and spring/summer, despite the seasonal change in DIC and TA, of up to 160 µmol kg-1. This suggests the influence of the upstream uptake of inorganic carbon and subsequent remineralization and DIC production along the estuary, coupled with the along-estuary TA increase, in part, due to a speciation shift from the added pCO2 to bicarbonate (Rewrie et al., 2023b). This can help explain the relatively stable ratio between TA and DIC along the estuary salinity gradient. A TA: DIC ratio > 1.0 in the outer Elbe Estuary region was also found by Rewrie et al. (2023b) in late spring and summer throughout the designated recovery state (1997 – present). An elevated TA: DIC ratio, of about 1.15 in June 2019, was also observed in the high salinity regions of Elbe Estuary by Norbisrath et al. (2022).
The increasing TA: DIC ratio with salinity indicates that TA increased more than DIC in the outer estuary, and this was also reflected in the significant TA increase with salinity and the absence of DIC increase with salinity specifically in summer (June & July 2021 in Supplementary Table S13). This suggests that either DIC was consumed by primary production in the coastal regions (Reimer et al., 1999), with no impact on TA, or that TA was controlled by conservative mixing along the salinity gradient (Norbisrath et al., 2022), but there was likely a TA source in the coastal regions in summer. For instance, the assimilation of nitrate by primary producers can increase TA (Wolf-Gladrow et al., 2007; Thomas et al., 2009), and this has been observed in spring in the adjacent East Frisian Islands of the Wadden Sea (Meyer et al., 2024). The seasonal decrease in TA along the salinity gradient at Cuxhaven was opposite to the seasonal TA increase of 100 to 150 μmol kg−1 from spring to autumn observed by Voynova et al. (2019) in the North Sea coastal region adjacent to the Wadden Sea. The elevated summer TA in the coastal North Sea (Voynova et al., 2019) could therefore be a source of TA to the outer Elbe Estuary and contribute to the increase in TA in the high salinity waters during summer (Figure 7). Overall, the observed seasonal decrease in DIC (late spring to summer) and TA (winter to summer) at the land-sea interface was most likely driven by biological and biogeochemical processes in the upper estuary, hundreds of kilometers upstream of the mouth of the estuary at Cuxhaven, instead of in the surrounding waters.
4.5 Evaluation of the GPP estimates
The air–sea gas exchange is an important component of metabolism calculations (Raymond and Cole, 2001). The mean daily air–sea gas exchange rate (ka) was 0.14 ± 0.01 d-1, with water velocity contributing an average of 0.08 ± 0.01 d-1 and wind speed contributing an average of 0.06 ± 0.02 d-1. In the North Sea, westerly and south-westerly winds prevail and blow along the coast and towards the Elbe Estuary (Lefebvre and Rosenhagen, 2008), and therefore the wind direction mostly aligns with the tidal phase at flood tide and opposes it at ebb tide. With the latter increasing the gas transfer velocity by up to a factor of 2 due to the increased turbulent energy (Zappa et al., 2007). Thus, to assess the impact of uncertainty in the calculations of daily GPP rates the daily ka was varied by a factor of 2, which was considered the upper and lower bound (Zappa et al., 2007; Wang et al., 2018). For the studied period, a 2-fold increase and decrease in ka resulted in an average change in the daily GPP rates with corresponding standard error of 13 ± 3 mg C m-2 d-1 and -14 ± 2 mg C m-2 d-1. This uncertainty analysis suggests that the changes in wind and tide direction has a minor influence on GPP rates during the biologically productive period, for instance when daily GPP rates exceeded 1000 mg C m-2 d-1 in late spring and summer (Figure 5a). However, ka changes may have a greater influence on daily GPP rates during periods of lower metabolic activity, such as in autumn, winter and early to mid-spring (Figure 5a), when physical processes may have dominated in the water column. Although, using the factor of two range in ka likely overestimates the uncertainty. The large difference in ka between co-current and countercurrent water flow and wind direction was observed at wind speeds > 6 m s-1 in a macrotidal estuary (Zappa et al., 2007). Here, on 96% of the total days, wind speed was < 6 m s-1 and the estuary is characterized by a mesotidal regime (Figure 2b; Pein et al., 2023). Thus, the energetic tides and stronger winds in Zappa et al. (2007) may have generated a larger contrast in turbulence and subsequently in the ka values but can be used as an upper bound estimate to determine the uncertainties. A more detailed physical modeling of the Elbe Estuary coastal system would help to constrain the air–sea gas exchange and lead to more accurate and precise estimates of ecosystem metabolic parameters, but this is beyond the focus of this study.
For comparisons with other studies that measure primary production in carbon units, or have converted oxygen to carbon units, the dissolved oxygen based GPP rates were converted to carbon using a PQ of 1.2. This PQ of 1.2 was applied for production of phytoplankton and microphytobenthos in surrounding regions of the German Wadden Sea (Asmus, 1982; Wolfstein et al., 2000) and is similar to the PQ of 1.25 used by Tillmann et al. (2000) and 1.3 applied in Loebl et al. (2007) for the surrounding region. An averaged PQ to 1.21 was determined based on various aquatic plant communities (Ryther, 1956). However, the PQ is also a function of the utilization of ammonium or nitrate during primary production (Ryther, 1956). The utilization of nitrate leads to higher PQ values of 1.3 – 1.8 (Williams et al., 1979; Cullen, 2001; Hagens et al., 2015). Alternatively, the energetically more favorable uptake of ammonium, results in a lower PQ between 1.10 and 1.25 (Williams et al., 1979; Laws, 1991; Cullen, 2001). However, nitrate assimilation by primary production in late spring and summer was indicated by the 58% decline in nitrate from April to August 2021 (Figure 6). Thus, there is a need to improve the understanding and application of the PQ in the coastal German Bight region. For example, measuring oxygen and CO2 simultaneously at the monitoring station (FerryBox system) as an ICOS Pilot Estuarine Station would provide empirical evidence of the PQ variation and obtain an accurate conversion factor applicable for the local environment.
5 Conclusion
From continuous high-frequency in situ measurements of dissolved oxygen and a range of ancillary biogeochemical and physical parameters, the present study identified a productive ecosystem in the outer Elbe Estuary coastal waters during late spring and summer in 2020 and 2021. However, with averaged NEM ranging between -2 ± 49 mg C m−2 d−1 and -149 ± 41 mg C m−2 d−1 suggested the system was close to a balanced trophic state.
Despite the high nutrient concentrations in early and mid-spring, low GPP rates of 155 ± 46 mg C m−2 d−1 and 74 ± 24 mg C m−2 d−1 occurred in April 2020 and March to April 2021, which coincided with elevated turbidity of 31 ± 9 NTU and 35 ± 7 NTU and limited primary production in the coastal waters through low light availability. The onset of elevated GPP rates started in late spring, and significantly increased to highest average rates in summer of 613 ± 89 mg C m-2 d-1 and 558 ± 77 mg C m-2 d-1 in 2020 and 2021. Summer high GPP rates were due to improved light conditions, with reduced turbidity down to 16 ± 5 NTU in 2020 and 19 ± 4 NTU in 2021, elevated PAR and longer daylight hours. Primary producers in the outer estuary waters were not limited by nutrient availability, as indicated by non-limiting nitrate, silicate, and phosphate concentrations for this region. It was found that sustained high summer GPP rates were characteristic of the nearshore regions in the German Bight at the land-sea interface to a temperate estuary, with a source of nutrients at the coast.
The GPP rates were significantly (on average 1.6 times) lower in late spring 2021, when river discharge was normal, compared to late spring 2020. The year 2020 was identified as a drought year and is part of a drought period from 2014 to 2020 (Rewrie et al., 2023b). Due to the lower PAR and water temperature in May 2021 compared to May 2020, we deduced that the reduced primary production in late spring 2021 could be attributed to poorer weather conditions with heavy rainfall, lower water temperatures, coupled with less light available for primary production during this productive season. This demonstrated that interannual changes in river discharge, driven by drought conditions and intense rainfall, and environmental conditions with repesct to temperature and light availability were important factors modulating the spring primary production in a nearshore region.
A seasonal decrease in DIC concentration of 125 – 160 µmol kg-1 from May to September, along with a TA drop of 116 – 128 µmol kg-1 from December to August, was most likely driven by their concurrent seasonal changes in the estuary observed throughout the recovery state (Amann et al., 2015; Rewrie et al., 2023b). The seasonal dynamics oppose the observed seasonal increase in TA of up to 150 μmol kg-1 in coastal waters of the North Sea. This highlights the sensitivity of inorganic carbon at the land-sea interface to the influence of seasonal changes in allochthonous primary production and biogeochemical processing in a temperate estuary.
Data availability statement
The NRT raw datasets presented in this study can be found in online repositories. The names of the repository/repositories and accession number(s) can be found below: https://hcdc.hereon.de/datasearch/.
Author contributions
LR: Conceptualization, Formal analysis, Methodology, Visualization, Writing – original draft, Writing – review & editing. BB: Supervision, Writing – original draft, Writing – review & editing. JvB: Methodology, Writing – original draft, Writing – review & editing. AK: Writing – original draft, Writing – review & editing. WP: Writing – original draft, Writing – review & editing. RR: Resources, Writing – original draft, Writing – review & editing. YV: Conceptualization, Methodology, Resources, Supervision, Writing – original draft, Writing – review & editing.
Funding
The author(s) declare that financial support was received for the research and/or publication of this article. The Helmholtz Association funding programme “Changing Earth” and the Horizon Europe LandSeaLot project, under grant agreement No 101134575. This work is supported by the BMBF project CoastGEM (#01LK2308B) that is embedded in the DLR/BMBF-led national greenhouse gas monitoring programme (ITMS).
Acknowledgments
We thank J. Faganeli and another reviewer, as well as editor M. Giani for their helpful suggestions of how to improve the manuscript. Thanks to the members of the Coastal Productivity department at Hereon, especially to Hendrik Rust, Martina Gehrung, Oliver Listing, for data and sample collection and maintenance of the FerryBox system at Cuxhaven. Thanks to Tanja Pieplow at Hereon who analyzed the discrete samples for nutrients, salinity, turbidity and dissolved oxygen, and for her support during the DIC analysis. We thank Alina Zacharzewski for measuring the total alkalinity samples. Thanks to Dr. Shun Bi for providing the empirical relationship between turbidity and the light attenuation for photosynthetically active radiation.
Conflict of interest
The authors declare that the research was conducted in the absence of any commercial or financial relationships that could be construed as a potential conflict of interest.
Generative AI statement
The author(s) declare that no Generative AI was used in the creation of this manuscript.
Publisher’s note
All claims expressed in this article are solely those of the authors and do not necessarily represent those of their affiliated organizations, or those of the publisher, the editors and the reviewers. Any product that may be evaluated in this article, or claim that may be made by its manufacturer, is not guaranteed or endorsed by the publisher.
Supplementary material
The Supplementary Material for this article can be found online at: https://www.frontiersin.org/articles/10.3389/fmars.2025.1548463/full#supplementary-material
References
Allen A. P., Gillooly J. F., Brown J. H. (2005). Linking the global carbon cycle to individual metabolism. Funct. Ecol. 19, 202–213. doi: 10.1111/j.1365-2435.2005.00952.x
Amann T., Weiss A., Hartmann J. (2012). Carbon dynamics in the freshwater part of the Elbe estuary, Germany: Implications of improving water quality. Estuar. Coast. Shelf Sci. 107, 112–121. doi: 10.1016/j.ecss.2012.05.012
Amann T., Weiss A., Hartmann J. (2015). Inorganic carbon fluxes in the inner Elbe estuary, Germany. Estuar. Coast. 38, 192–210. doi: 10.1007/s12237-014-9785-6
Aminot A., Kirkwood D., Carlberg S. (1997). The QUASIMEME laboratory performance studies, (1993–1995): overview of the nutrients section. Mar. pollut. Bull. 35, 28–41. doi: 10.1016/S0025-326X(97)80876-4
Asmus R. (1982). Field measurements on seasonal variation of the activity of primary producers on a sandy tidal flat in the northern Wadden Sea. Netherlands J. Sea Res. 16, 389–402. doi: 10.1016/0077-7579(82)90045-X
Avison J. (2014). The world of physics. 2nd Edition (Oxford UK: Nelson Thornes Ltd, Oxford University Press).
Baschek B., Schroeder F., Brix H., Riethmüller R., Badewien T. H., Breitbach G., et al. (2017). The coastal observing system for northern and arctic seas (COSYNA). Ocean Sci. 13, 379–410. doi: 10.5194/os-13-379-2017
Bauer J. E., Cai W. J., Raymond P. A., Bianchi T. S., Hopkinson C. S., Regnier P. A. (2013). The changing carbon cycle of the coastal ocean. Nature 504, 61–70. doi: 10.1038/nature12857
Becker G. A., Giese H., Isert K., König P., Langenberg H., Pohlmann T., et al. (1999). Mesoscale structures, fluxes and water mass variability in the German Bight as exemplified in the KUSTOS-experiments and numerical models. Deutsche Hydrograph. Z. 51, 155–179. doi: 10.1007/BF0276417
Caffrey J. M. (2003). Production, respiration and net ecosystemmetabolism in U.S. estuaries. Environ. Monit. Assess. 81, 207–219. doi: 10.1023/A:1021385226315
Caffrey J. M. (2004). Factors controlling net ecosystem metabolism in US estuaries. Estuaries 27, 90–101. doi: 10.1007/BF02803563
Caffrey J. M., Murrell M. C., Amacker K. S., Harper J. W., Phipps S., Woodrey M. S. (2014). Seasonal and inter-annual patterns in primary production, respiration, and net ecosystem metabolism in three estuaries in the northeast Gulf of Mexico. Estuaries Coasts 37, 222–241. doi: 10.1007/s12237-013-9701-5
Cai W. J. (2011). Estuarine and coastal ocean carbon paradox: CO2 sinks or sites of terrestrial carbon incineration? Annu. Rev. Mar. Sci. 3, 123–145. doi: 10.1146/annurev-marine-120709-142723
Cerco C. F. (1989). Estimating estuarine reaeration rates. J. Environ. Eng. 115, 1066–1070. doi: 10.1061/(ASCE)0733-9372(1989)115:5(1066
Chegini F., Holtermann P., Kerimoglu O., Becker M., Kreus M., Klingbeil K., et al. (2020). Processes of stratification and destratification during an extreme river discharge event in the German Bight ROFI. J. Geophys. Res.: Oceans 125, e2019JC015987. doi: 10.1029/2019JC015987
Cloern J. E. (1987). Turbidity as a control on phytoplankton biomass and productivity in estuaries. Continent. shelf Res. 7, 1367–1381. doi: 10.1016/0278-4343(87)90042-2
Cloern J. E., Foster S. Q., Kleckner A. E. (2014). Phytoplankton primary production in the world’s estuarine-coastal ecosystems. Biogeosciences 11, 2477–2501. doi: 10.5194/bg-11-2477-2014
Collins J. R., Raymond P. A., Bohlen W. F., Howard-Strobel M. M. (2013). Estimates of new and total productivity in central Long Island Sound from in situ measurements of nitrate and dissolved oxygen. Estuaries Coasts 36, 74–97. doi: 10.1016/S1385-1101(03)00002-9
Copernicus Climate Data Store E-OBS meteorological data for Europe. Available online at: https://cds.climate.copernicus.eu (Accessed June 1, 2024).
Cornes R., van der Schrier G., van den Besselaar E. J. M., Jones P. (2018). An ensemble version of the E-OBS temperature and precipitation datasets. J. Geophys. Res.-Atmos 123, 9391–9409. doi: 10.1029/2017JD028200
Cullen J. J. (2001). “Primary production methods,” in Encyclopedia of ocean sciences. Eds. Steele J. H., Thorpe S. A., Turekian K. K. (Cambridge, MA, USA: Academic Press), 2277–2284.
Dähnke K., Bahlmann E., Emeis K. (2008). A nitrate sink in estuaries? An assessment by means of stable nitrate isotopes in the Elbe estuary. Limnol. Oceanogr. 53, 1504–1511. doi: 10.4319/lo.2008.53.4.1504
Dähnke K., Sanders T., Voynova Y., Wankel S. D. (2022). Nitrogen isotopes reveal a particulate-matter-driven biogeochemical reactor in a temperate estuary. Biogeosciences 19, 5879–5891. doi: 10.5194/bg-19-5879-2022
Dickson A. G. (1996). “Determination of dissolved oxygen in sea water by Winkler titration. Version 1.01,” in WOCE Operations Manual—Part 3.1.3: WHP Operations and Methods. WHP Office Report WHPO 91-1. WOCE Report No. 68/91. Revision 1(Woods Hole, Massachusetts, USA: WOCE Office).
Dobrynin M., Gayer G., Pleskachevsky A., Günther H. (2010). Effect of waves and currents on the dynamics and seasonal variations of suspended particulate matter in the North Sea. J. Mar. Syst. 82, 1–20. doi: 10.1016/j.jmarsys.2010.02.012
Dodds W. K., Cole J. J. (2007). Expanding the concept of trophic state in aquatic ecosystems: it’s not just the autotrophs. Aquat. Sci. 69, 427–439. doi: 10.1007/s00027-007-0922-1
Domingues R. B., Anselmo T. P., Barbosa A. B., Sommer U., Galvão H. M. (2010). Tidal variability of phytoplankton and environmental drivers in the freshwater reaches of the Guadiana Estuary (SW Iberia). Int. Rev. Hydrobiol. 95, 352–369. doi: 10.1002/iroh.201011230
DWD Weather and climate data. Available online at: https://opendata.dwd.de (Accessed June 1, 2024).
DWD (2021). The weather in Germany in May 2021. Available online at: https://www.dwd.de/EN/press/press_release/EN/2021/20210531_the_weather_in_Germany_in_may_2021_news.html (Accessed January 20, 2024).
Ehlers P. (1990). The history of the international North Sea conferences. Int. J. Estuar. Coast. Law 5, 3.
Engel F., Attermeyer K., Ayala A. I., Fischer H., Kirchesch V., Pierson D. C., et al. (2019). Phytoplankton gross primary production increases along cascading impoundments in a temperate, low-discharge river: Insights from high frequency water quality monitoring. Sci. Rep. 9, 6701. doi: 10.1038/s41598-019-43008-w
FGG Elbe (2023). FGG Elbe data portal. Available online at: https://www.fgg-elbe.de/elbe-datenportal.html (Accessed June 1, 2024).
Fisher T. R., Harding L. W. Jr., Stanley D. W., Ward L. G. (1988). Phytoplankton nutrients turbidity Chesapeake Delaware Hudson estuaries Estuarine Coast. Shelf Sci. 27, 61–93. doi: 10.1016/0272-7714(88)90032-7
Flanders Marine Institute (2024). MarineRegions.org. Available online at: http://marineregions.org/mrgid/26877 (Accessed January 10, 2024).
Flores-Melo X., Schloss I. R., Chavanne C., Almandoz G. O., Latorre M., Ferreyra G. A. (2018). Phytoplankton ecology during a spring-neap tidal cycle in the southern tidal front of San Jorge Gulf, Patagonia. Oceanography 31, 70–80. doi: 10.5670/oceanog.2018.412
Garcia H. E., Weathers K. W., Paver C. R., Smolyar I., Boyer T. P., Locarnini M. M., et al. (2019). World Ocean Atlas 2018, Volume 3: Dissolved Oxygen, Apparent Oxygen Utilization, and Dissolved Oxygen Saturation Vol. 83 (NOAA Atlas NESDIS. Silver Spring, MD: NOAA), 38.
García-Barcina J. M., González-Oreja J. A., de la Sota A. (2006). Assessing the improvement of the Bilbao estuary water quality in response to pollution abatement measures. Water Res. 40, 951–960. doi: 10.1016/j.watres.2006.01.004
Gattuso J. P., Frankignoulle M., Wollast. R. (1998). Carbon and carbonate metabolism in coastal aquatic ecosystems. Annu. Rev. Ecol. Syst. 29, 405–434. doi: 10.1146/annurev.ecolsys.29.1.405
Geerts L., Cox T. J. S., Maris T., Wolfstein K., Meire P., Soetaert K. (2017). Substrate origin and morphology differentially determine oxygen dynamics in two major European estuaries, the Elbe and the Schelde. Estuarine Coast. Shelf Sci. 191, 157–170. doi: 10.1016/j.ecss.2017.04.009
Geerts L., Wolfstein K., Jacobs S., van Damme S., Vandenbruwaene W. (2012). Zonation of the TIDE estuaries, Tide Report. Available online at: https://www.tide-toolbox.eu/reports/zonation_of_the_tide_estuaries/?j=t (Accessed April 15, 2023).
Hagens M., Slomp C. P., Meysman F. J. R., Seitaj D., Harlay J., Borges A. V., et al. (2015). Biogeochemical processes and buffering capacity concurrently affect acidification in a seasonally hypoxic coastal marine basin. Biogeosciences 12, 1561–1583. doi: 10.5194/bg-12-1561-2015
Hansen H. P., Koroleff F. (1999). “Determination of nutrients,” in Methods of Seawater Analysis, 159–228. doi: 10.1002/9783527613984.ch10
Harris C. R., Millman K. J., van der Walt S. J., Gommers R., Virtanen P., Cournapeau D., et al. (2020). Array programming with numPy. Nature 585, 357–362. doi: 10.1038/s41586-020-2649-2
Hickel W., Mangelsdorf P., Berg J. (1993). The human impact in the German Bight: Eutrophication during three decades, (1962–1991). Helgoländer Meeresuntersuchungen 47, 243–263. doi: 10.1007/BF02367167
Hopkinson C., Smith E. M. (2005). “Estuarine respiration: an overview of benthic, pelagic, and whole system respiration,” in Respiration in Aquatic Ecosystems. Eds. Giorgio P.D., Williams P. (Oxford, UK: Oxford Univ. Press), 122–146. doi: 10.1093/acprof:oso/9780198527084.003.0008
Humborg C. (1997). Primary productivity regime and nutrient removal in the Danube estuary. Estuarine Coast. Shelf Sci. 45, 579–589. doi: 10.1006/ecss.1997.0248
Iriarte A., Purdie D. A. (2004). Factors controlling the timing of major spring bloom events in an UK south coast estuary. Estuarine Coast. Shelf Sci. 61, 679–690. doi: 10.1016/j.ecss.2004.08.002
Joesoef A., Kirchman D. L., Sommerfield C. K., Cai W. J. (2017). Seasonal variability of the inorganic carbon system in a large coastal plain estuary. Biogeosciences 14, 4949–4963. doi: 10.5194/bg-14-4949-2017
Kamjunke N., Brix H., Flöser G., Bussmann I., Schütze C., Achterberg E. P., et al. (2023). Large-scale nutrient and carbon dynamics along the river-estuary-ocean continuum. Sci. Total Environ. 890, 164421. doi: 10.1016/j.scitotenv.2023.164421
Kamjunke N., Rode M., Baborowski M., Kunz J. V., Zehner J., Borchardt D., et al. (2021). High irradiation and low discharge promote the dominant role of phytoplankton in riverine nutrient dynamics. Limnol. Oceanogr. 66, 2648–2660. doi: 10.1002/lno.11778
Kappenberg J., Berendt M., Ohle N., Riethmüller R., Schuster D., Strotmann T. (2018). Variation of hydrodynamics and water constituents in the mouth of the Elbe estuary, Germany. Civil Eng. Res. J. (CERJ) 4, 555643. doi: 10.19080/CERJ.2018.04.555643
Kappenberg J., Fanger H. (2007). Sedimenttransportgeschehen in der tidebeeinflussten Elbe, der Deutschen Bucht und in der Nordsee Vol. 20 (GKSS 2007/20 Des. GKSS Forschungzentrum, Geesthacht., Germany), 125.
Kemp W. M., Boynton W. R. (1980). Influence of biological and physical processes on dissolved oxygen dynamics in an estuarine system: Implications for measurement of community metabolism. Estuar. Coast. Mar. Sci. 11, 407–431. doi: 10.1016/S0302-3524(80)80065-X
Kempe S. (1988). “Estuaries—Their natural and anthropogenic changes,” in Scales and global change. SCOPE. Eds. Rosswall T., Woodmansee R. G., Risser P. G. (Chichester, UK: John Wiley & Sons), 251–285.
Kerimoglu O., Voynova Y. G., Chegini F., Brix H., Callies U., Hofmeister R., et al. (2020). Interactive impacts of meteorological and hydrological conditions on the physical and biogeochemical structure of a coastal system. Biogeosciences 17, 5097–5127. doi: 10.5194/bg-17-5097-2020
Kerner M. (2007). Effects of deepening the Elbe estuary on sediment regime and water quality. Estuar. Coast. Shelf Sci. 75, 492–500. doi: 10.1016/j.ecss.2007.05.033
King S. A., Heffernan J. B., Cohen M. J. (2014). Nutrient flux, uptake, and autotrophic limitation in streams and rivers. Freshw. Sci. 33, 85–98. doi: 10.1086/674383
Kirk J. T. (1994). Light and photosynthesis in aquatic ecosystems (Cambridge, UK: Cambridge University Press).
Laws E. A. (1991). Photosynthetic quotients, new production and net community production in the open ocean. Deep Sea Res. Part A. Oceanogr. Res. Papers 38, 143–167. doi: 10.1016/0198-0149(91)90059-O
Lefebvre C., Rosenhagen G. (2008). The climate in the North and Baltic Sea region. Die Küste (Heide, Holstein, Germany: Boyens) 74, 45–59.
Loebl M., Dolch T., van Beusekom J. E. (2007). Annual dynamics of pelagic primary production and respiration in a shallow coastal basin. J. Sea Res. 58, 269–282. doi: 10.1016/j.seares.2007.06.003
Macovei V. A., Rewrie L. C., Röttgers R., Voynova Y. G. (2024). Spring-neap tidal cycles modulate the strength of the carbon source at the estuary-coast interface. EGUsphere [preprint]. doi: 10.5194/egusphere-2024-2643
Maher D. T., Eyre B. D. (2012). Carbon budgets for three autotrophic Australian estuaries: Implications for global estimates of the coastal air-water CO2 flux. Global Biogeochem. Cycles 26:sGB1032. doi: 10.1029/2011GB004075
Mallin M. A., Paerl H. W., Rudek J., Bates P. W. (1993). Regulation of estuarine primary production by watershed rainfall and river flow. Mar. Ecology-Progress Ser. 93, 199–203. doi: 10.3354/meps093199
McSweeney J. M., Chant R. J., Wilkin J. L., Sommerfield C. K. (2017). Suspended-sediment impacts on light-limited productivity in the Delaware estuary. Estuaries Coasts 40, 977–993. doi: 10.1007/s12237-016-0200-3
Meyer J., Voynova Y. G., Van Dam B., Luitjens L., Daehne D., Thomas H. (2024). Intertidal regions regulate seasonal coastal carbonate system dynamics in the east Frisian Wadden sea. EGUsphere [preprint]. doi: 10.5194/egusphere-2024-3048
Middelburg J. J., Herman P. M. (2007). Organic matter processing in tidal estuaries. Mar. Chem. 106, 127–147. doi: 10.1016/j.marchem.2006.02.007
Mobley C. D. (1994). Light and Water: Radiative Transfer in Natural Waters (Cambridge, MA, USA: Academic Press), 592.
Moore T. S., Nuzzio D. B., Di Toro D. M., Luther G. W. III (2009). Oxygen dynamics in a well mixed estuary, the lower Delaware Bay, USA. Mar. Chem. 117, 11–20. doi: 10.1016/j.marchem.2009.08.003
Mudersbach C., Bender J., Netzel F. (2017). An analysis of changes in flood quantiles at the gauge Neu Darchau (Elbe River) from 1875 to 2013. Stoch Environ. Res. Risk Assess. 31, 145–157. doi: 10.1007/s00477-015-1173-7
Netzband A., Reincke H., Bergemann. M. (2002). The river elbe. J. Soils Sediments 2, 112–116. doi: 10.1007/BF02988462
Norbisrath M., Pätsch J., Dähnke K., Sanders T., Schulz G., van Beusekom J. E., et al. (2022). Metabolic alkalinity release from large port facilities (Hamburg, Germany) and impact on coastal carbon storage. Biogeosciences 19, 5151–5165. doi: 10.5194/bg-20-4307-2023
Odum H. T. (1956). Primary production in flowing waters 1. Limnol. oceanogr. 1, 102–117. doi: 10.4319/lo.1956.1.2.0102
Odum H. T., Hoskin C. M. (1958). Comparative studies on the metabolism of marine waters Vol. 5 (Texas: Publications of the Institute of Marine Science), 16–46.
Padua S., Kripa V., Prema D., Mohamed K. S., Jeyabaskaran R., Kaladharan P., et al. (2023). Assessment of ecosystem health of a micro-level Ramsar coastal zone in the Vembanad Lake, Kerala, India. Environ. Monit. Assess. 195, 95. doi: 10.1007/s10661-022-10692-7
Pein J., Eisele A., Sanders T., Daewel U., Stanev E. V., van Beusekom J. E., et al. (2021). Seasonal stratification and biogeochemical turnover in the freshwater reach of a partially mixed dredged estuary. Front. Mar. Sci. 8. doi: 10.3389/fmars.2021.623714
Pein J., Staneva J., Mayer B., Palmer M. D., Schrum C. (2023). A framework for estuarine future sea-level scenarios: Response of the industrialised Elbe estuary to projected mean sea level rise and internal variability. Front. Mar. Sci. 10. doi: 10.3389/fmars.2023.1102485
Petersen W. (2014). FerryBox systems: State-of-the-art in Europe and future development. J. Mar. Syst. 140, 4–12. doi: 10.1016/j.jmarsys.2014.07.003
Poremba K., Tillmann U., Hesse K. J. (1999). Tidal impact on planktonic primary and bacterial production in the German Wadden Sea. Helgoland Mar. Res. 53, 19–27. doi: 10.1007/PL00012133
Raymond P. A., Cole J. J. (2001). Gas exchange in rivers and estuaries: Choosing a gas transfer velocity. Estuaries 24, 312–317. doi: 10.2307/1352954
Reimer A., Brasse S., Doerffer R., Durselen C. D., Kempe S., Michaelis W., et al. (1999). Carbon cycling in the German Bight: An estimate of transformation processes andtransport. German J. Hydrogr. 51, 313–329. doi: 10.1007/BF02764179.
Rewrie L. C. V., Baschek B., van Beusekom J. E. E., Körtzinger A., Ollesch G., Voynova Y. G. (2023b). Recent inorganic carbon increase in a temperate estuary driven by water quality improvement and enhanced by droughts. Biogeosciences 20, 4931–4947. doi: 10.5194/egusphere-2023-961
Rewrie L. C. V., Voynova Y. G., Beusekom J. E. E., Sanders T., Körtzinger A., Brix H., et al. (2023a). Significant shifts in inorganic carbon and ecosystem state in a temperate estuary, (1985–2018). Limnol. oceanogr. 68, 1920–1935. doi: 10.1002/lno.12395
Rick H. J., Rick S., Tillmann U., Brockmann U., Gärtner U., Dürselen C., et al. (2006). Primary productivity in the German bight, (1994–1996). Estuaries Coasts 29, 4–23. doi: 10.1007/BF02784695
Röttgers R., Bi S., Burmester H., Heymann K., Hieronymi M., Krasemann H., et al. (2023). Water inherent optical properties and concentrations of water constituents from the German Bight and adjacent regions. PANGAEA. doi: 10.1594/PANGAEA.950774
Ryther J. H. (1956). The measurement of primary production 1. Limnol. Oceanogr. 1, 72–84. doi: 10.4319/lo.1956.1.2.0072
Scheurle C., Hebbeln D., Jones P. (2005). An 800-year reconstruction of Elbe River discharge and German Bight sea-surface salinity. Holocene 15, 429–434. doi: 10.1191/0959683605hl802r
Schulz G., Sanders T., Voynova Y. G., Bange H. W., Dähnke K. (2023). Seasonal variability of nitrous oxide concentrations and emissions in a temperate estuary. Biogeosciences 20, 3229–3247. doi: 10.5194/bg-20-3229-2023
Seabold S., Perktold J. (2010). “Statsmodels: econometric and statistical modeling with python,” in Proceedings of the 9th Python in Science Conference (SciPy 2010), Austin, TX, USA, 28 June–3 July 2010. 92–96.
Sharp J. H. (2010). Estuarine oxygen dynamics: What can we learn about hypoxia from long-time records in the Delaware Estuary? Limnol. oceanogr. 55, 535–548. doi: 10.4319/lo.2010.55.2.0535.
Smith V. H. (2007). Using primary productivity as an index of coastal eutrophication: the units of measurement matter. J. plankton Res. 29, 1–6. doi: 10.1093/plankt/fbl061
Su J., Tian T., Krasemann H., Schartau M., Wirtz K. (2015). Response patterns of phytoplankton growth to variations in resuspension in the German Bight revealed by daily MERIS data in 2003 and 2004. Oceanologia 57, 328–341. doi: 10.1016/j.oceano.2015.06.001
Thierry V., Bittig H., Gilbert D., Kobayashi T., Kanako S., Schmid C. (2021). Processing Argo oxygen data at the DAC level (Ifremer. Brest, France). doi: 10.13155/39795
Thomann R. V., Fitzpatrick J. J. (1982). Calibration and Verification of a Mathematical Model of the Eutrophication of the Potomac Estuary (Washington, D.C., USA: DC Department of Environmental Sciences).
Thomas H., Bozec Y., de Baar H. J. W., Elkalay K., Frankignoulle M., Schiettecatte L. S., et al. (2005). The carbon budget of the North Sea. Biogeosciences 2, 87–96. doi: 10.5194/bg-2-87-2005
Thomas H., Schiettecatte L. S., Suykens K. O. N. E., Koné Y. J. M., Shadwick E. H., Prowe A. F., et al. (2009). Enhanced ocean carbon storage from anaerobic alkalinity generation in coastal sediments. Biogeosciences 6, 267–274. doi: 10.5194/bg-6-267-2009
Tian T., Merico A., Su J., Staneva J., Wiltshire K., Wirtz K. (2009). Importance of resuspended sediment dynamics for the phytoplankton spring bloom in a coastal marine ecosystem. J. Sea Res. 62, 214–228. doi: 10.1016/j.seares.2009.04.001
Tillmann U., Hesse K. J., Colijn F. (2000). Planktonic primary production in the German Wadden Sea. J. Plankton Res. 22, 1253–1276. doi: 10.1093/plankt/22.7.1253
van Beusekom J. E. E., Brockmann U. H. (1998). Transformation of phosphorus in the Elbe estuary. Estuaries 21, 518–526. doi: 10.2307/1353291
van Beusekom J. E. E., Brockmann U. H., Hesse K. J., Hickel W., Poremba K., Tillmann U. (1999). The importance of sediments in the transformation and turnover of nutrients and organic matter in the Wadden Sea and German Bight. German J. Hydrogr. 51, 245–266. doi: 10.1007/BF02764176
van Beusekom J. E. E., Carstensen J., Dolch T., Grage A., Hofmeister R., Lenhart H., et al. (2019). Wadden Sea Eutrophication: long-term trends and regional differences. Front. Mar. Sci. 6. doi: 10.3389/fmars.2019.00370
Voynova Y. G., Brix H., Petersen W., Weigelt-Krenz S., Scharfe M. (2017). Extreme flood impact on estuarine and coastal biogeochemistry: the 2013 Elbe flood. Biogeosciences 14, 541–557. doi: 10.5194/bg-14-541-2017
Voynova Y. G., Lebaron K. C., Barnes R. T., Ullman W. J. (2015). In situ response of bay productivity to nutrient loading from a small tributary: The Delaware Bay-Murderkill Estuary tidally-coupled biogeochemical reactor. Estuarine Coast. Shelf Sci. 160, 33–48. doi: 10.1016/j.ecss.2015.03.027
Voynova Y. G., Petersen W., Gehrung M., Aßmann S., King A. L. (2019). Intertidal regions changing coastal alkalinity: The Wadden Sea-North Sea tidally coupled bioreactor. Limnol. Oceanogr. 64, 1135–1149. doi: 10.1002/lno.11103
Wang S. R., Di Iorio D., Cai W. J., Hopkinson C. S. (2018). Inorganic carbon and oxygen dynamics in a marsh-dominated estuary. Limnol. oceanogr. 63, 47–71. doi: 10.1002/lno.10614
Wang Z. B., Hoekstra P., Burchard H., Ridderinkhof H., De Swart H. E., Stive M. J. F. (2012). Morphodynamics of the Wadden Sea and its barrier island system. Ocean Coast. Manage. 68, 39–57. doi: 10.1016/j.ocecoaman.2011.12.022
Williams P. J., Raine R. C. T., Bryan J. R. (1979). Agreement between the 14C and oxygen methods of measuring phytoplankton primary production: Reassessment of the photosynthetic quotient. Oceanol. Acta 2, 411–416.
Wolf-Gladrow D. A., Zeebe R. E., Klaas C., Körtzinger A., Dickson A. G. (2007). Total alkalinity: The explicit conservative expression and its application to biogeochemical processes. Mar. Chem. 106, 287–300. doi: 10.1016/j.marchem.2007.01.006
Wolfstein K., Colijn F., Doerffer R. (2000). Seasonal dynamics of microphytobenthos biomass and photosynthetic characteristics in the northern German Wadden Sea, obtained by the photosynthetic light dispensation system. Estuarine Coast. Shelf Sci. 51, 651–662. doi: 10.1006/ecss.2000.0702
Wolfstein K., Kies L. (1999). Composition of suspended participate matter in the Elbe estuary: Implications for biological and transportation processes. Deutsche Hydrograph. Z. 51, 453–463. doi: 10.1007/BF02764166
WSV (2024a). PEGELONLINE hydrological information system. Available online at: https://www.pegelonline.wsv.de/gast/stammdaten?pegelnr=5990020 (Accessed June 1, 2024).
WSV (2024b). Coastal data portal system. Available online at: https://www.kuestendaten.de/Tideelbe/DE/Service/service_node.html (Accessed June 1, 2024).
Xue L., Cai W. J. (2020). Total alkalinity minus dissolved inorganic carbon as a proxy for deciphering ocean acidification mechanisms. Mar. Chem. 222, 103791. doi: 10.1016/j.marchem.2020.103791
Zappa C. J., McGillis W. R., Raymond P. A., Edson J. B., Hintsa E. J., Zemmelink H. J., et al. (2007). Environmental turbulent mixing controls on air-water gas exchange in marine and aquatic systems. Geophys. Res. Lett. 34:L10601. doi: 10.1029/2006GL028790
Zhang J. Z., Berberian G., Wanninkhof R. (2002). Long-term storage of natural water samples for dissolved oxygen determination. Water Res. 36, 4165–4168. doi: 10.1016/S0043-1354(02)00093-3
Keywords: primary production, net ecosystem metabolism, estuary, carbon cycling, land-sea interface
Citation: Rewrie LCV, Baschek B, van Beusekom JEE, Körtzinger A, Petersen W, Röttgers R and Voynova YG (2025) Impact of primary production and net ecosystem metabolism on carbon and nutrient cycling at the land-sea interface. Front. Mar. Sci. 12:1548463. doi: 10.3389/fmars.2025.1548463
Received: 19 December 2024; Accepted: 03 March 2025;
Published: 08 April 2025.
Edited by:
Michele Giani, National Institute of Oceanography and Applied Geophysics, ItalyReviewed by:
Alexandra Pavlidou, Hellenic Centre for Marine Research (HCMR), GreeceJadran Faganeli, National Institute of Biology, Slovenia
Copyright © 2025 Rewrie, Baschek, van Beusekom, Körtzinger, Petersen, Röttgers and Voynova. This is an open-access article distributed under the terms of the Creative Commons Attribution License (CC BY). The use, distribution or reproduction in other forums is permitted, provided the original author(s) and the copyright owner(s) are credited and that the original publication in this journal is cited, in accordance with accepted academic practice. No use, distribution or reproduction is permitted which does not comply with these terms.
*Correspondence: Louise C. V. Rewrie, TG91aXNlLnJld3JpZUBoZXJlb24uZGU=