 Yunqian Lu
 Lijie Wang
 Yihui Peng2
 Dajiang Meng
 Jiangnan Lin
- 1Key Laboratory of Marine Mineral Resources, Ministry of Natural Resources, Guangzhou Marine Geological Survey, Guangzhou, China
- 2East China Environmental Geotechnical Engineering Branch of China Petroleum Engineering & Construction Corporation, Qingdao, China
The Manila Trench, representing relatively young (16–36 Ma) subducting slabs, has been flexurally modeled to assess its subduction morphology. This modeling enables predictions of subduction-related earthquake locations and provides critical insights into subduction dynamics. We utilized a lithospheric flexural model controlled by trench axis flexural wavelength (W0), initial subduction dip angle (β0), and elastic thickness (Te) to quantify variations in plate flexural bending along the Manila Trench. By correcting for the effects of high resolution sediment loads and removing residual short-wavelength features from observed water depths along 40 cross-trench profiles, we obtained key flexural parameters of the subducted oceanic crust. Our results show that the width of trench valley (X0) ranges from ca. 7 to 151 km, the bulge height (Wb) varies between 0.014 and 1.15 km, and the location of the shallowest point (Xb) is 25 to 201 km from the trench axis. The effective elastic thickness (Te) of the oceanic lithosphere ranges from 5 to 25 km, while the initial subduction dip angle (β0) is 0.1–9.8°, and the trench relief (W0) ranges from 0.3 to 2.6 km. The initial subduction dip angle exhibits significant variation along the trench, with an averaged β0 of 3.42° in the southern segment, 5.68° in the central segment, and less than 0.5° in the northern segment. These variations in flexural parameters at different segments are related to the nature of the subducting crust and the oblique subduction of the Philippine Plate. The sharp increase in the initial subduction dip angle in the central segment is associated with the presence of a slab window.
1 Introduction
The subduction zone is one of the most active and complex regions of global plate interaction, accounting for approximately 90% of the world’s earthquakes and tsunamis (Moore et al., 2007; Zhang et al., 2014; Zhu et al., 2017; Hayes et al., 2018). Most of the largest earthquakes occur in the Benioff Zone, which is the seismic belt beneath the subducting plate, typically closely associated with the subduction zone (Benioff, 1964). Its formation is closely linked to plate subduction: when an oceanic or continental plate collides with a deeper plate, intense stress accumulates at the plate boundary. When this stress exceeds the frictional strength, it is released as an earthquake. As subduction continues, the earthquakes migrate to greater depths. The Benioff Zone is characterized by a tilted band of seismic activity, beginning at shallow depths near the trench and extending deeper into the plate. The tilt angle roughly aligns with the dip of the subducting plate, indicating that the subduction morphology of oceanic trenches is closely related to the Benioff Zone (Park et al., 2002; Bangs et al., 2003; Bry and White, 2007; Maksymowicz, 2015). Flexural deformation of the subducting plate often causes tilting of the seafloor toward the trench axis and significant uplift in the outer rise region of the trench (Hanks, 1971; Bodine and Watts, 1979; Harris and Chapman, 1994; Bry and White, 2007; Zhang et al., 2014) (Hyndman and Wang, 1993; Bostock et al., 2012; Smith et al., 2013; Audet and Kim, 2016; Gao, 2017). The subduction morphology along the trench can be effectively depicted by lithospheric flexural modeling (Capitanio and Morra, 2012). Previous methods for modeling oceanic lithospheric flexure often use V0, M0, and Te as independent parameters. Mcadoo and Martin (1984) found that geoid undulations can simulate the flexure of the oceanic lithosphere on the trench slope. They subsequently modeled the flexure undulations of subduction zone trenches and observed that the effective elastic thickness of the plate is approximately proportional to the square root of its age. Contreras-Reyes and Osses (2010) used a two-segment elastic plate model and, based on a variable effective elastic thickness, simulated the flexure along the trench-parallel direction of the Chile Trench. Zhang et al. (2014) employed a similar approach to model the entire flexure of the Mariana Trench, including variations in shear force (V0) and bending moment (M0). These models rely on bathy-metric data to extract flexural amplitude and half-width of uplift (Walcott, 1970; Caldwell et al., 1976; Mcadoo and Martin, 1984; McAdoo et al., 1985; Bry and White, 2007; Capitanio and Morra, 2012; Hunter and Watts, 2016; Zhang et al., 2019). The estimated flexural parameters are often influenced by topographic noise, such as sea-mounts and abyssal hills. In addition, these methods are challenging to derive the initial subduction dip angle. To address this, Eduardo and Jerernias (2018) proposed a method that uses flexural amplitude at the trench axis (W0), initial subduction dip angle (β0), and effective elastic thickness (Te) for flexure modeling. The method directly identifies flexural parameters to model the initial subduction dip angle. Peng et al. (2022) applied this method to simulate 13 profiles along the Mariana Trench, showing consistency in calculated elastic thickness compared to traditional methods.
The Manila subduction zone is an active and relatively young subduction zone formed by the passive subduction of the South China Sea Plate beneath the Philippine Plate (Figure 1). The Philippine Sea Plate is moving obliquely to the northwest at about 80 mm/yr., with much of this kinetic energy absorbed by the Manila Trench (Yu et al., 1997). The Manila subduction zone is an area of intense earthquake activity and a potential tsunami source. According to the earthquake catalog data from the United States National Earthquake Information Center, from January 1970 to August 2024, a total of 1,963 earthquakes with magnitudes above 5.0 occurred in the Manila subduction zone region (10°–22°N, 112°–126°E), including 137 earthquakes with magnitudes above 6.0 and 17 earthquakes with magnitudes above 7.0 (Figure 1). The region is dominated by frequent shallow-focus earthquakes (h ≤50 km), while intermediate-depth earthquakes are primarily distributed in the northern and southern areas. Taking 16°N as the boundary, the focal depth decreases significantly from south to north, reflecting changes in the subduction dip angle and trench morphology of the Manila Trench (Chen et al., 2015; Zhan et al., 2023).
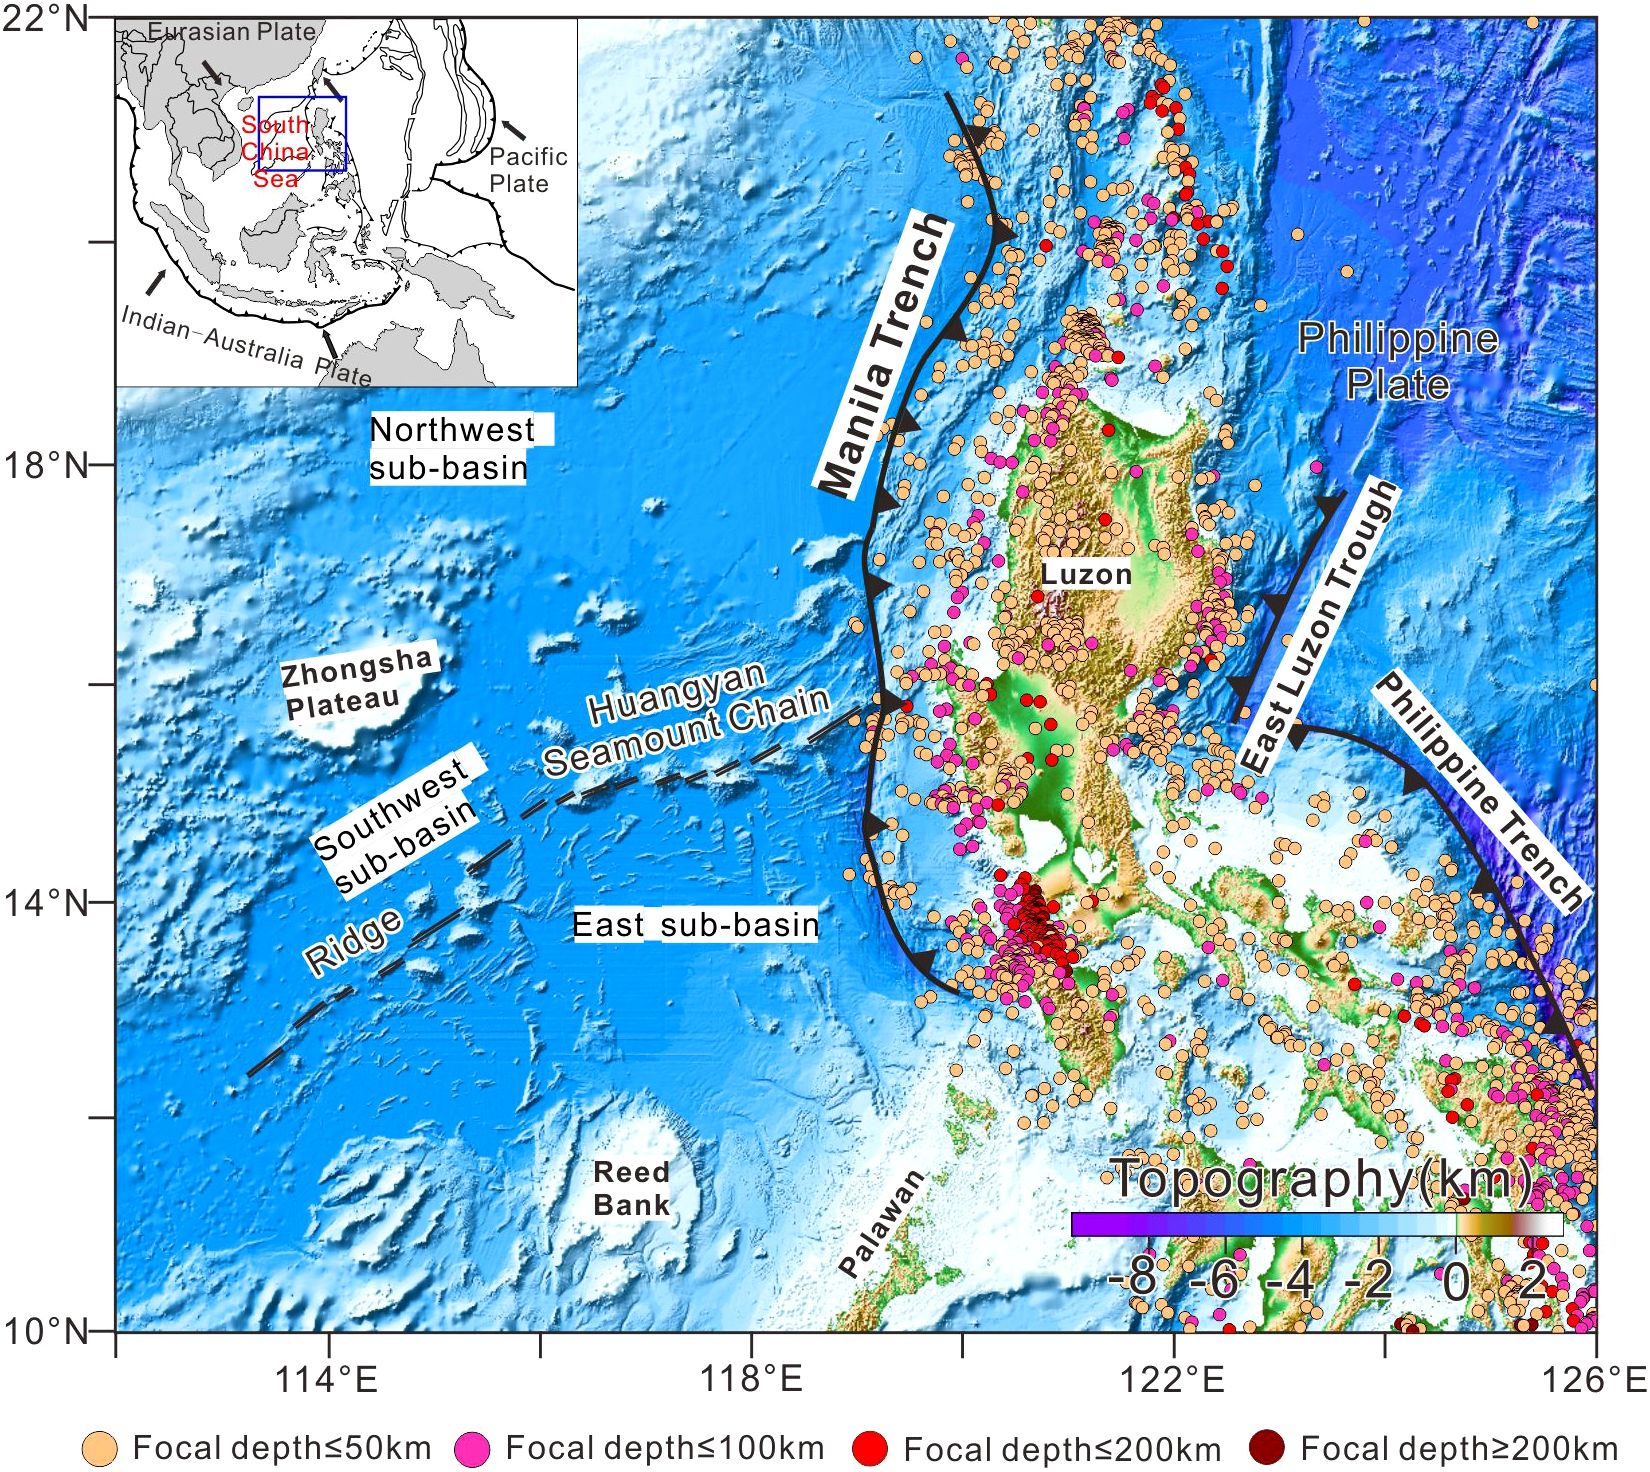
Figure 1. Submarine topographic map of the Manila subduction zone. Showing the locations and depths of earthquakes with magnitudes of 5 (Mw) and above that have occurred along the Manila Trench.
The Manila Trench, with its unique subduction characteristics and complex tectonic deformation resulting from the subduction of the transitional and oceanic crusts of the South China Sea, is crucial for understanding the evolution of the South China Sea. Zhu et al. (2017) found that sediment thickness and accretionary prism width vary along the trench, with different tectonic mechanisms controlling the northern and southern segments. Gao et al. (2018) identified significant magmatic activity and crustal thinning in the northern segment using seismic reflection profiles. Chang et al. (2012) used satellite altimetry, gravity anomaly, and seismic reflection data to plate flexural modeling, showing that the northern trench features continental crust subduction, while the southern trench features oceanic crust subduction. Zhang et al. (2018a) simulated the flexure of the subducting plate and concluded that the lithosphere elastic thickness is significantly greater in the northern trench compared to the southern section. To reduce the errors caused by the lateral slab-pulling force in 3-D, such as seamount loading, tearing of the subducting plate, or the sharp changes of the subducted continent-oceanic transition zone to the oceanic plate, Zhang et al. (2018b) conducted a 3-D finite-difference flexural bending model to simulate bending of the subducted oceanic plate at the northern Manila Trench. The results show that the Te values at the continent–oceanic transition zone from 3-D model change more sharply than 2-D model. They proposed the changes in 3-D model may result from the non-uniform deformation of the subducted plate, and/or subducted plate tearing. However, previous models neglected the impact of sedimentary deposits or used low-resolution sediment thickness data without seismic constraints (Chen et al., 2004; Contreras-Reyes and Osses, 2010; Chang et al., 2012; Eduardo and Jerernias, 2018; Zhang et al., 2018a; Peng et al., 2022). Moreover, the initial subduction dip angle (β0) has not been fully addressed in the previous flexural simulations of the Manila Trench (Chang et al., 2012; Zhang et al., 2018a), and there is insufficient understanding of the variation in subduction morphology along the strike of the Manila Trench.
In order to reduce the influence of topographic noise, such as seamounts, and improve the accuracy of the flexural simulation, as well as to obtain the initial dip angle of the trench. In this study, we modeled a total of 40 trench perpendicular profiles extracted from the Manila trench, using a method similar to Eduardo and Jerernias (2018). Focuses on studying the variation of the initial dip angle along the strike of the Manila Trench and discusses the reasons behind the changes in the subduction dip angle of the trench.
2 Geological setting
The South China Sea is situated at the convergence zone of the Eurasian Plate, Pacific Plate, and Indo-Australian Plate (Figure 1). The Manila subduction zone is located in the eastern part of the South China Sea Basin, at the westernmost edge of the Philippine Plate. The Manila Trench formed as a result of subduction between the Eurasian Plate and the Philippine Sea Plate during the Miocene. The formation of the Luzon Island Arc is closely linked to this subduction process. The K-Ar age of the oldest calc-alkaline lavas on the Luzon Island Arc is approximately 10 Ma, while the biostratigraphic age ranges from 13 to 14 Ma. These data suggest that subduction along the Manila Trench began shortly after the cessation of South China Sea Basin expansion (Hayes and Lewis, 1984; Rangin et al., 1999; Galgana et al., 2007; Lo et al., 2015). Extending primarily in a north-south direction between 14°N and 22°N, the Manila Trench connects with the Taiwan Arc-Land Collision Orogenic Belt to the north and the Mindoro Arc-Land Collision Tectonic Zone to the south (Yang et al., 1996). It extends northward in a westward-convex, “S”-shaped configuration (Figures 1, 2). The Manila subduction zone has been active since the early Miocene and represents a major dynamic convergent boundary formed by the interaction of the South China Sea Plate and the West Philippine Sea Plate (Rangin et al., 1999). The subducting South China Sea (SCS) oceanic plate formed during the early Oligocene to Middle Miocene (ca. 32–16 Ma) with two relict ridge subduction (Briais et al., 1993). Since around 5 Ma, the rapid subduction beneath the Manila Trench began, including the subduction of the Huangyan Seamount Chain, a remnant of the relict spreading ridge now extending beneath the forearc basin (Ding et al., 2018).
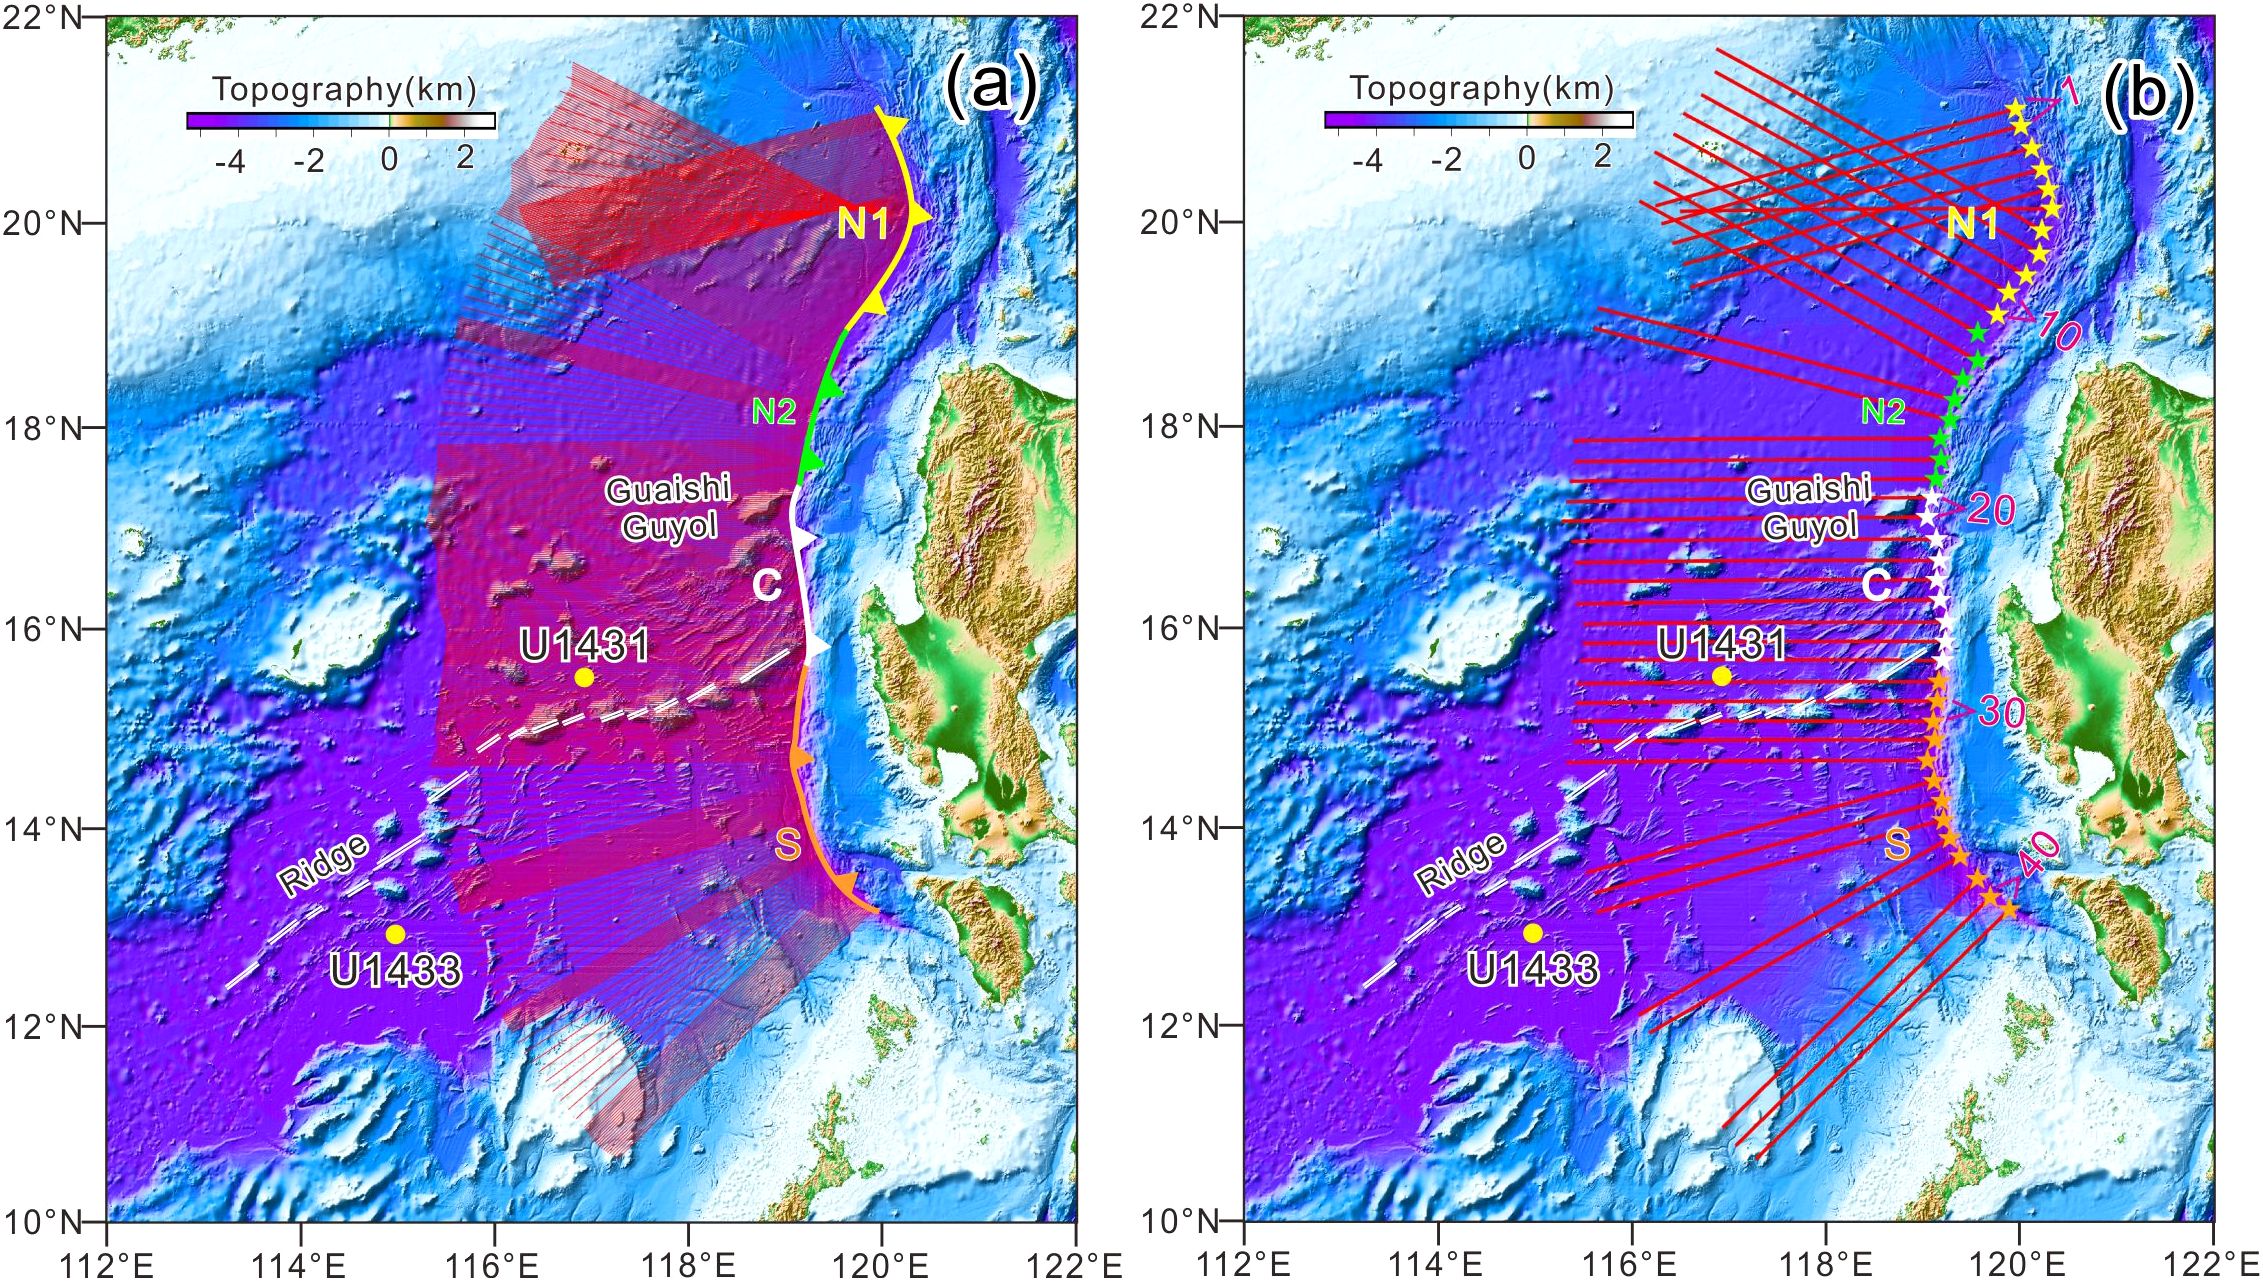
Figure 2. (a) Seafloor bathymetry of the Manila Trench and surrounding regions. The Manila Trench is segmented into the northern N1 (yellow), N2 (blue), central (white) and southern (orange star marks) segments (Zhang et al., 2018a). Yellow dots indicate the locations of IODP Expeditions 349, 367, and 368 drill sites. White double lines represent the fossil ridges within the South China Sea. (b) Profile distribution across the trench. A total of 400 across-trench profiles were taken westward of the trench axis, with the eastern ends of the profiles located at the Manila trench axis. Each profile is perpendicular to the local strike of the trench axis. Every 10 profiles were grouped into a section, with the eastern boundary of each section marked by a connecting line between adjacent dots. In total, there are 40 sections along the Manila Trench.
The Manila Trench can be divided into three main segments based on variations in sediment thickness, accretionary wedge width, seafloor deformation, and crustal velocity structure: the northern Luzon segment, the central seamount chain segment, and the southern west Luzon segment (Xue et al., 2012; Zhu et al., 2017). The northern segment is influenced by the NWW subduction of the Philippine Sea Plate, which has resulted in the formation of several basins to the west, including the southwestern Taiwan Basin, the Taiwan Strait Basin, and the Bashi Basin to the west, as well as the extension of the Luzon Trench within the arc to the east (Piao et al., 2022). The central segment is characterized by the “slab window” created by the eastward subduction of a relict spreading ridge, which has formed a series of rift basins controlled by intra-arc strike-slip faults (Cheng et al., 2019). In the southern segment, westward subduction of the Philippine Sea Plate causes seismic and volcanic activities.
Here, we adopt the segmentation scheme proposed by Zhang et al. (2018a), which divides the Manila Trench into four segments based on the nature of the subducting crust (Figure 2) (Zhang et al., 2018a). The northern region comprises the subduction of thinned continental crust in segment N1 (19.3°–21.1°N) and oceanic crust in segment N2 (17.3°–19.3°N). Meanwhile, the central (C) segment (15.8°–17.3°N) is defined by the subduction of oceanic crust, including numerous seamounts and fossil ridges. In the southern (S) segment (13°–15.8°N), oceanic crust subduction predominates (Table 1).
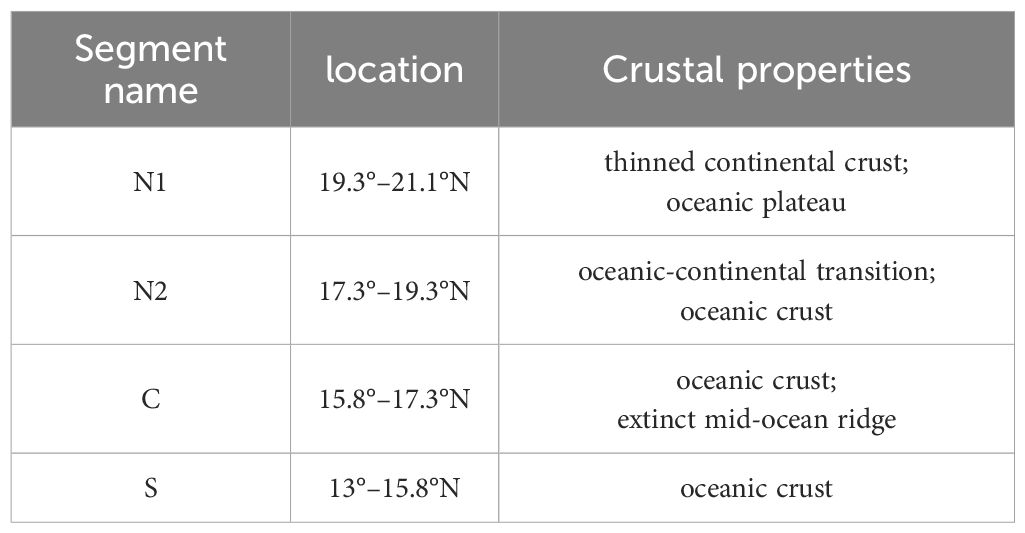
Table 1. Characteristics of the segments in Manila Trench.
3 Data and method
3.1 Observational constraints
The analysis of topography and sediment thickness data is crucial, as it provides essential observational constraints for flexural bending models (Chen et al., 2004; Zhang et al., 2014; Hoggard et al., 2017; Zhang et al., 2018a, 2018c). Bathymetric data for the Manila Trench were extracted from the General Bathymetric Chart of the Oceans (GEBCO) global depth database. The data process utilized ship-based water depth data and satellite gravity inversion measurements, with a data grid spacing of 15 seconds (Figure 2). The sediment thickness in the oceanic basin of the South China Sea was derived from a comprehensive dataset that includes 36 multi-channel seismic reflection profiles covering 15,000 km across the region (Geng et al., 2024). For time-depth conversion, the sediment thickness in the oceanic domain was calculated by the quadratic time-depth conversion functions from wells sites of U1499 and U1431 from IODP Expeditions 349 and 367 (Figure 3b) (Li et al., 2014). In regions lacking seismic profile control, sediment thickness data from the 5’×5’ global sediment thickness dataset provided by the American Geophysical Data Center were utilized (Figure 3a). These sediment thickness data were then re-meshed into a 0.5’×0.5’ grid file using the Kriging method (Figure 3c). For time-depth conversion at the continental slope in the northeast of the SCS, the function obtained from ODP Site 1148 and IODP Site U1501 are more appropriate, due to the more consolidated nature and slighter higher velocities of older sediments at depth (Li et al., 2008).
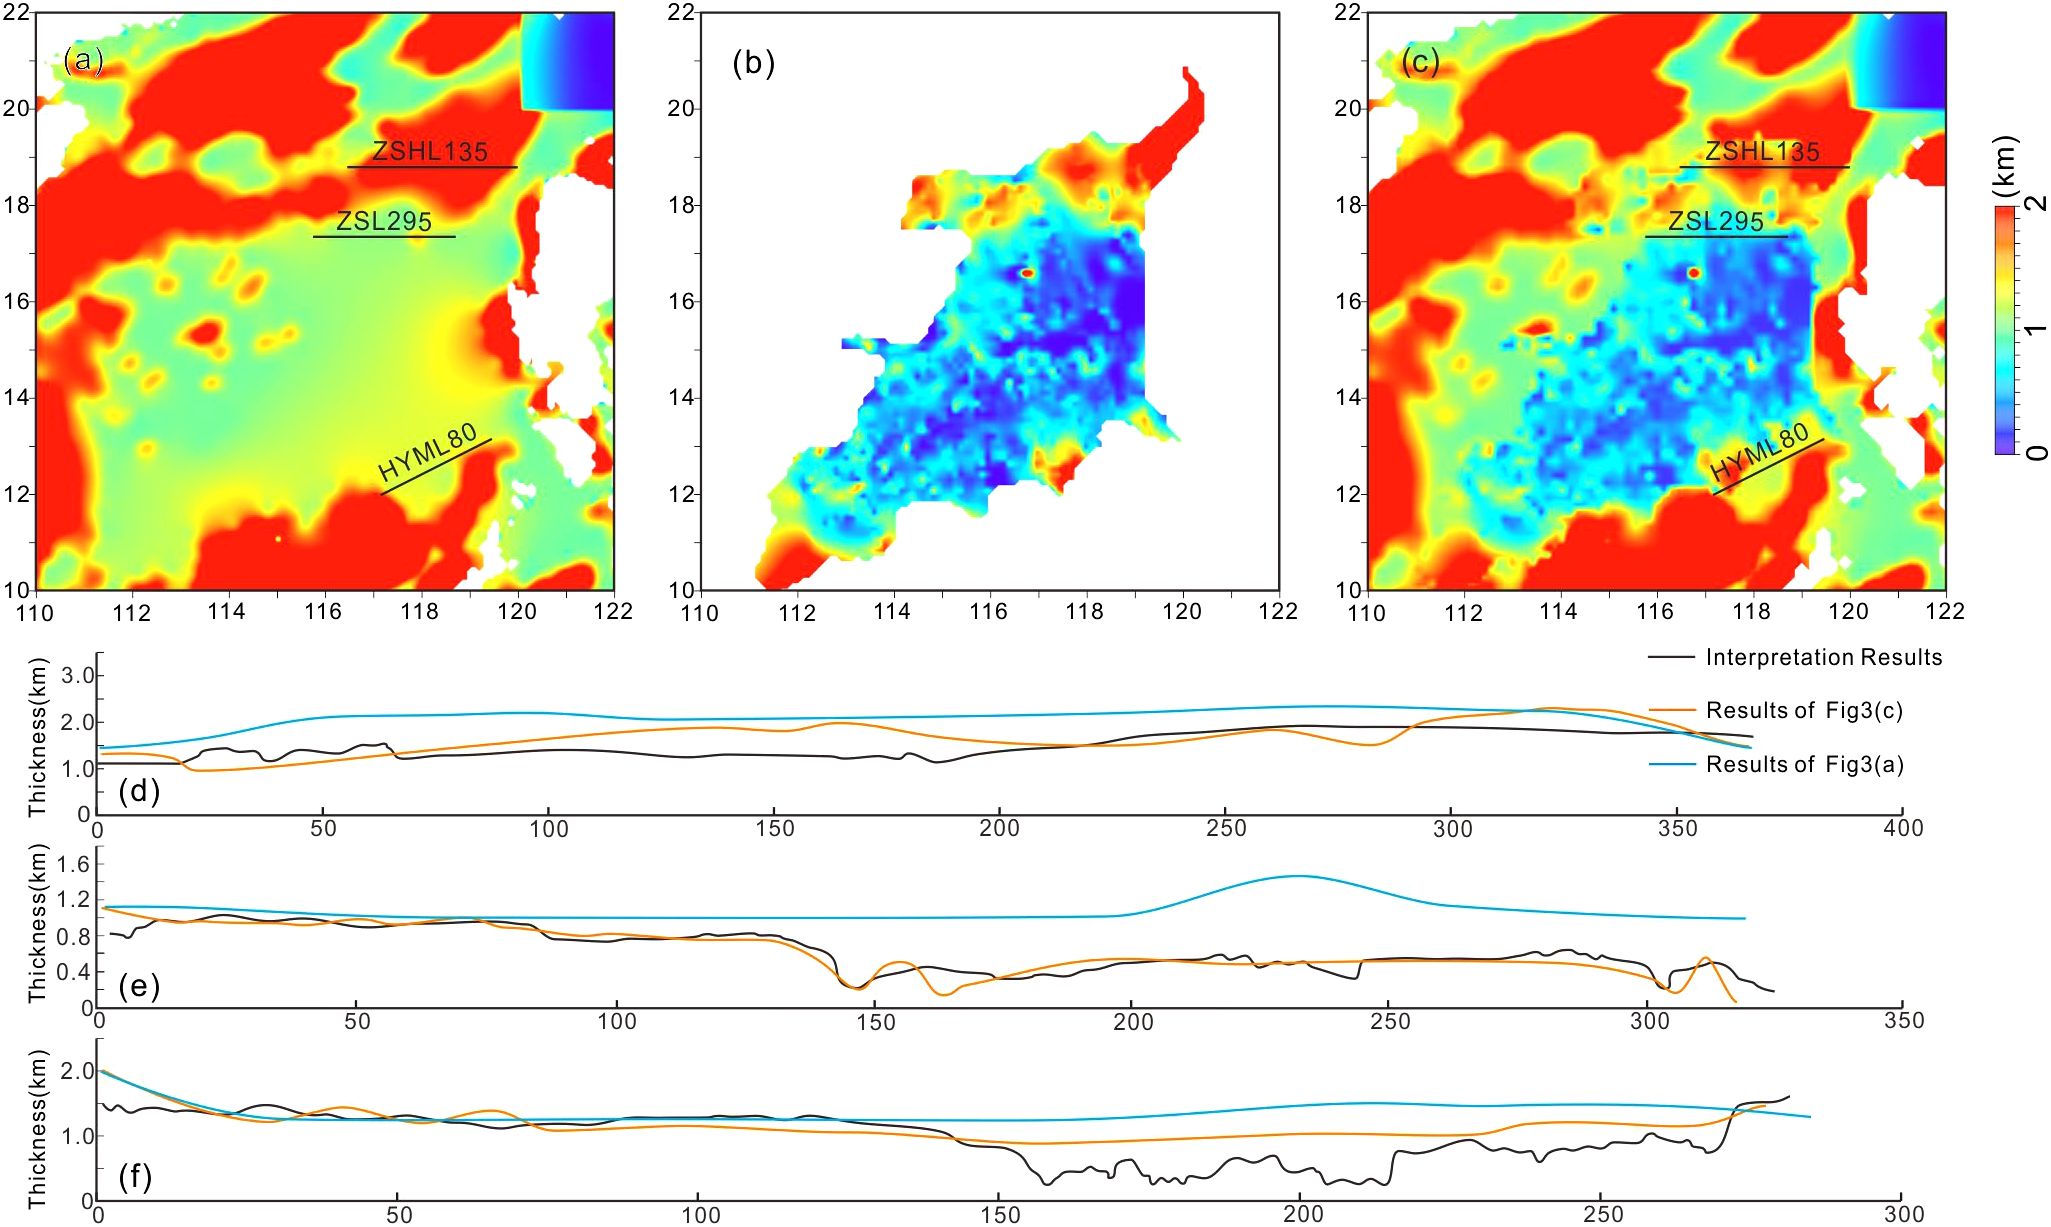
Figure 3. (a) Sediment thickness data of the study area was extracted from the American Geophysical Data Center. (b) High-resolution sediment thickness data in the sub-basin was calculated from seismic interpretation. (c) Result of merged sediment thickness data from global database and interpreted grid. (d) Comparison of the sediment thickness interpreted from the seismic profile ZSL135 with the sediment thickness data presented in (a, c). (e) Comparison of the sediment thickness interpreted from the seismic profile ZSL295 with the sediment thickness data presented in (a, c). (f) Comparison of the sediment thickness interpreted from the seismic profile HYML80 with the sediment thickness data presented in (a, c). The location of the profile is indicated in (a, c).
To assess the differences between the sediment thickness data used in this study and the American Geophysical Data Center’s data, and to validate the former’s accuracy, we incorporated three additional seismic reflections beyond the 36 multi-channel seismic reflections used in Figure 3b. These three reflections are ZSHL135, located in Segment N1; ZSL295, in Segment N2; and HYML80, in Segment S. The same time-depth conversion velocity used in Figure 3b was applied to derive sediment thickness interpretations for these reflections. These interpretations were then compared with the sediment thickness data from both the American Geophysical Data Center and this study to verify consistency and accuracy.
The comparative graphs of the three sediment thickness datasets reveal that the data from the American Geophysical Data Center significantly are greater than those derived from the seismic reflections (Figures 3d–f). In particular, the ZSL295 line in Segment N2 shows interpreted sediment thickness roughly equivalent to that of this study, and both are smaller than the publicly available data (Figure 3e). This suggests that the sediment thickness data from the American Geophysical Data Center are often overestimated. This error arises primarily because these data fail to accurately account for sediment thickness over seamounts, where sediment is thin or nearly absent. Given the prevalence of seamounts in the South China Sea basin, this contributes to an overall overestimation of sediment thickness across the entire basin.
We utilized interpreted plate deformation as a proxy for plate flexural deformation through a series of modeling procedures. Sediment buoyancy reduces plate pressure, which can hinder seafloor subduction to some extent (Keum and So, 2023). To eliminate the influence of sediments, we simulated the basement depth at the time when the plate began to subduct after seafloor spreading. At the initial stage of subduction, the seafloor had just finished spreading and had not yet accumulated sediments, so we did not consider the impact of sediment buoyancy (Equation 1). The influence of sediments on water depth data manifests in two ways: (1) sediment deposition and compaction result in shallower water depths, and (2) sediment loading leads to lithospheric adjustments, deepening the sedimentary basement. After removing sediment thickness from the observed water depth, lithospheric deformation caused by sediment loading was calculated as follows:
Where S is the change value of sediment effect (m), and Tsed is the sediment thickness (m), calibrated with DSDP data (the mean square error of the original value and the fitting value is about 0.06km), which is applicable to areas with sediment thickness less than 1.8km (Crough, 1983).
We then calculated the sediment-corrected topography (Equation 2) of the Manila Trench by subtracting the sediment thickness and accounting for the change in sediment effects (Zhang et al., 2011):
Where Ttopo is topography, and Tsedc is the sediment-correct topography.
We collected 400 profiles across the Manila Trench, with each profile extending 400 km and spaced 2 km apart (Figure 2b). The trench axis was identified as the point of maximum depth along each profile. By grouping every 10 profiles, we generated sections, resulting in a total of 40 sections, represented as dots along the trench axis (Figure 2b).
Each profile section underwent a two-step process to determine the optimal flexural bending model. First, a low-pass filter was applied to smooth the interpreted deformation profile (Figures 4a–c), which was derived by fitting the sediment-corrected topography. Secondly, a grid search employing an exhaustive method is performed within the parameter space to identify the best-fitting solution. A reasonable range is defined for the flexural parameters, including Te, β0, and W0. Using extremely small intervals, all possible combinations of these parameters within their specified ranges are systematically evaluated. For each combination, corresponding curves are generated. The curve with the smallest RMS value, indicating the highest similarity to the smoothed sediment-corrected topography, is selected as the best-fitting solution (Figure 4b). The objective was to minimize the root-mean-square (RMS) misfit between the interpreted deformation shape and the theoretical flexural bending models. Then, we obtained an optimal model (blue curves in Figure 5) that effectively captures the long-wavelength characteristics of the sediment-corrected topography (green curves in Figure 5) for each profile section.
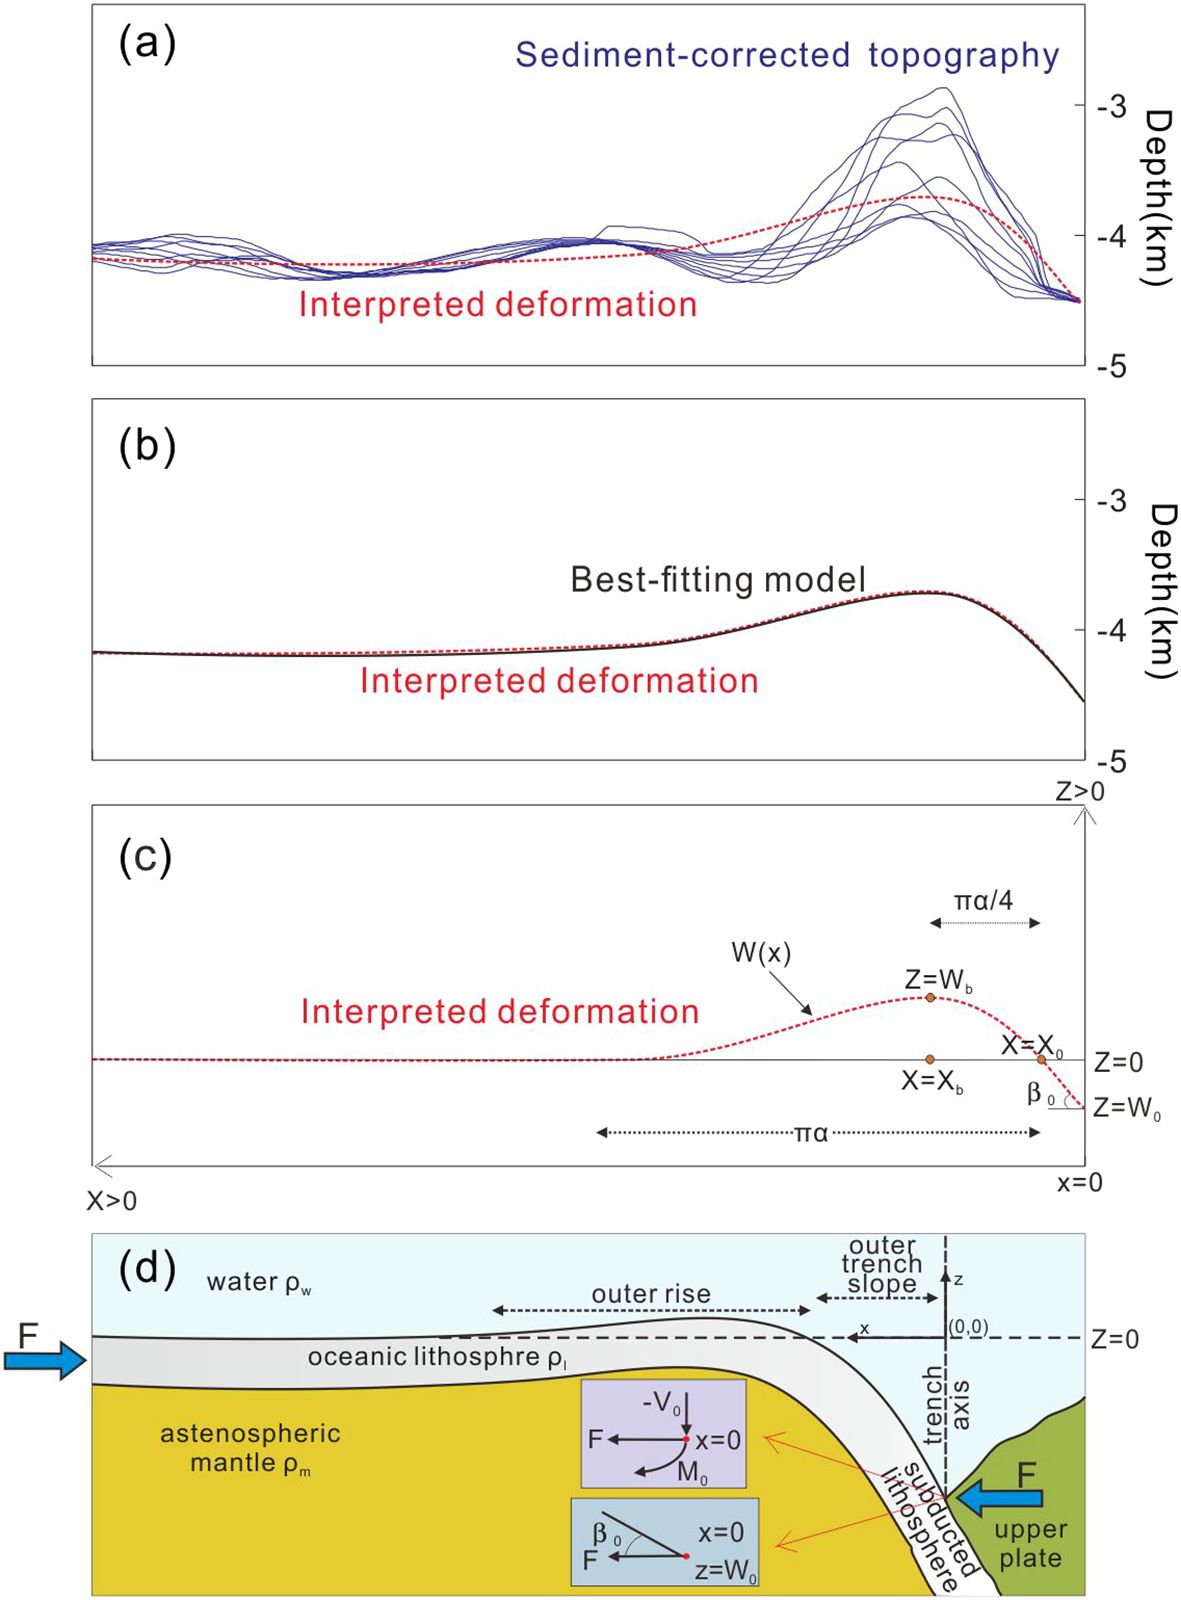
Figure 4. (a) An example of sediment-correct topography profile and the interpreted deformation. Blue curves illustrate the calculated sediment-correct topography from Section 28 of Figure 5. The red dashed line represents the interpreted deformation, which best captures the overall flexural bending deformation. (b) The interpreted deformation profile (red dashed line) compared to the calculated best-fitting model (black line). The best-fitting model was derived by inversion in flexural parameter space, providing a theoretically predicted flexural bending profile that closely matches the interpreted deformation. (c) A schematic representation of topography (X0, Xb, Wb, α) defining the deflection curve w(x). The point (Xb, Wb) represents the position of the maximum positive amplitude of w(x), or the peak of the outer rise, while (0, W0) corresponds to the maximum negative amplitude of w(x) at the trench axis. The initial subduction angle at the trench axis, β0, is related to w(x) as tanβ0 = dw/dx|x=0. (d) Bending of the lithosphere at an ocean trench occurs due to the applied vertical shear force V0, horizontal force F, and bending moment M0. Here, , , and represent the densities of the asthenosphere mantle, lithosphere and water, respectively. (d modified form Eduardo and Jerernias, 2018).
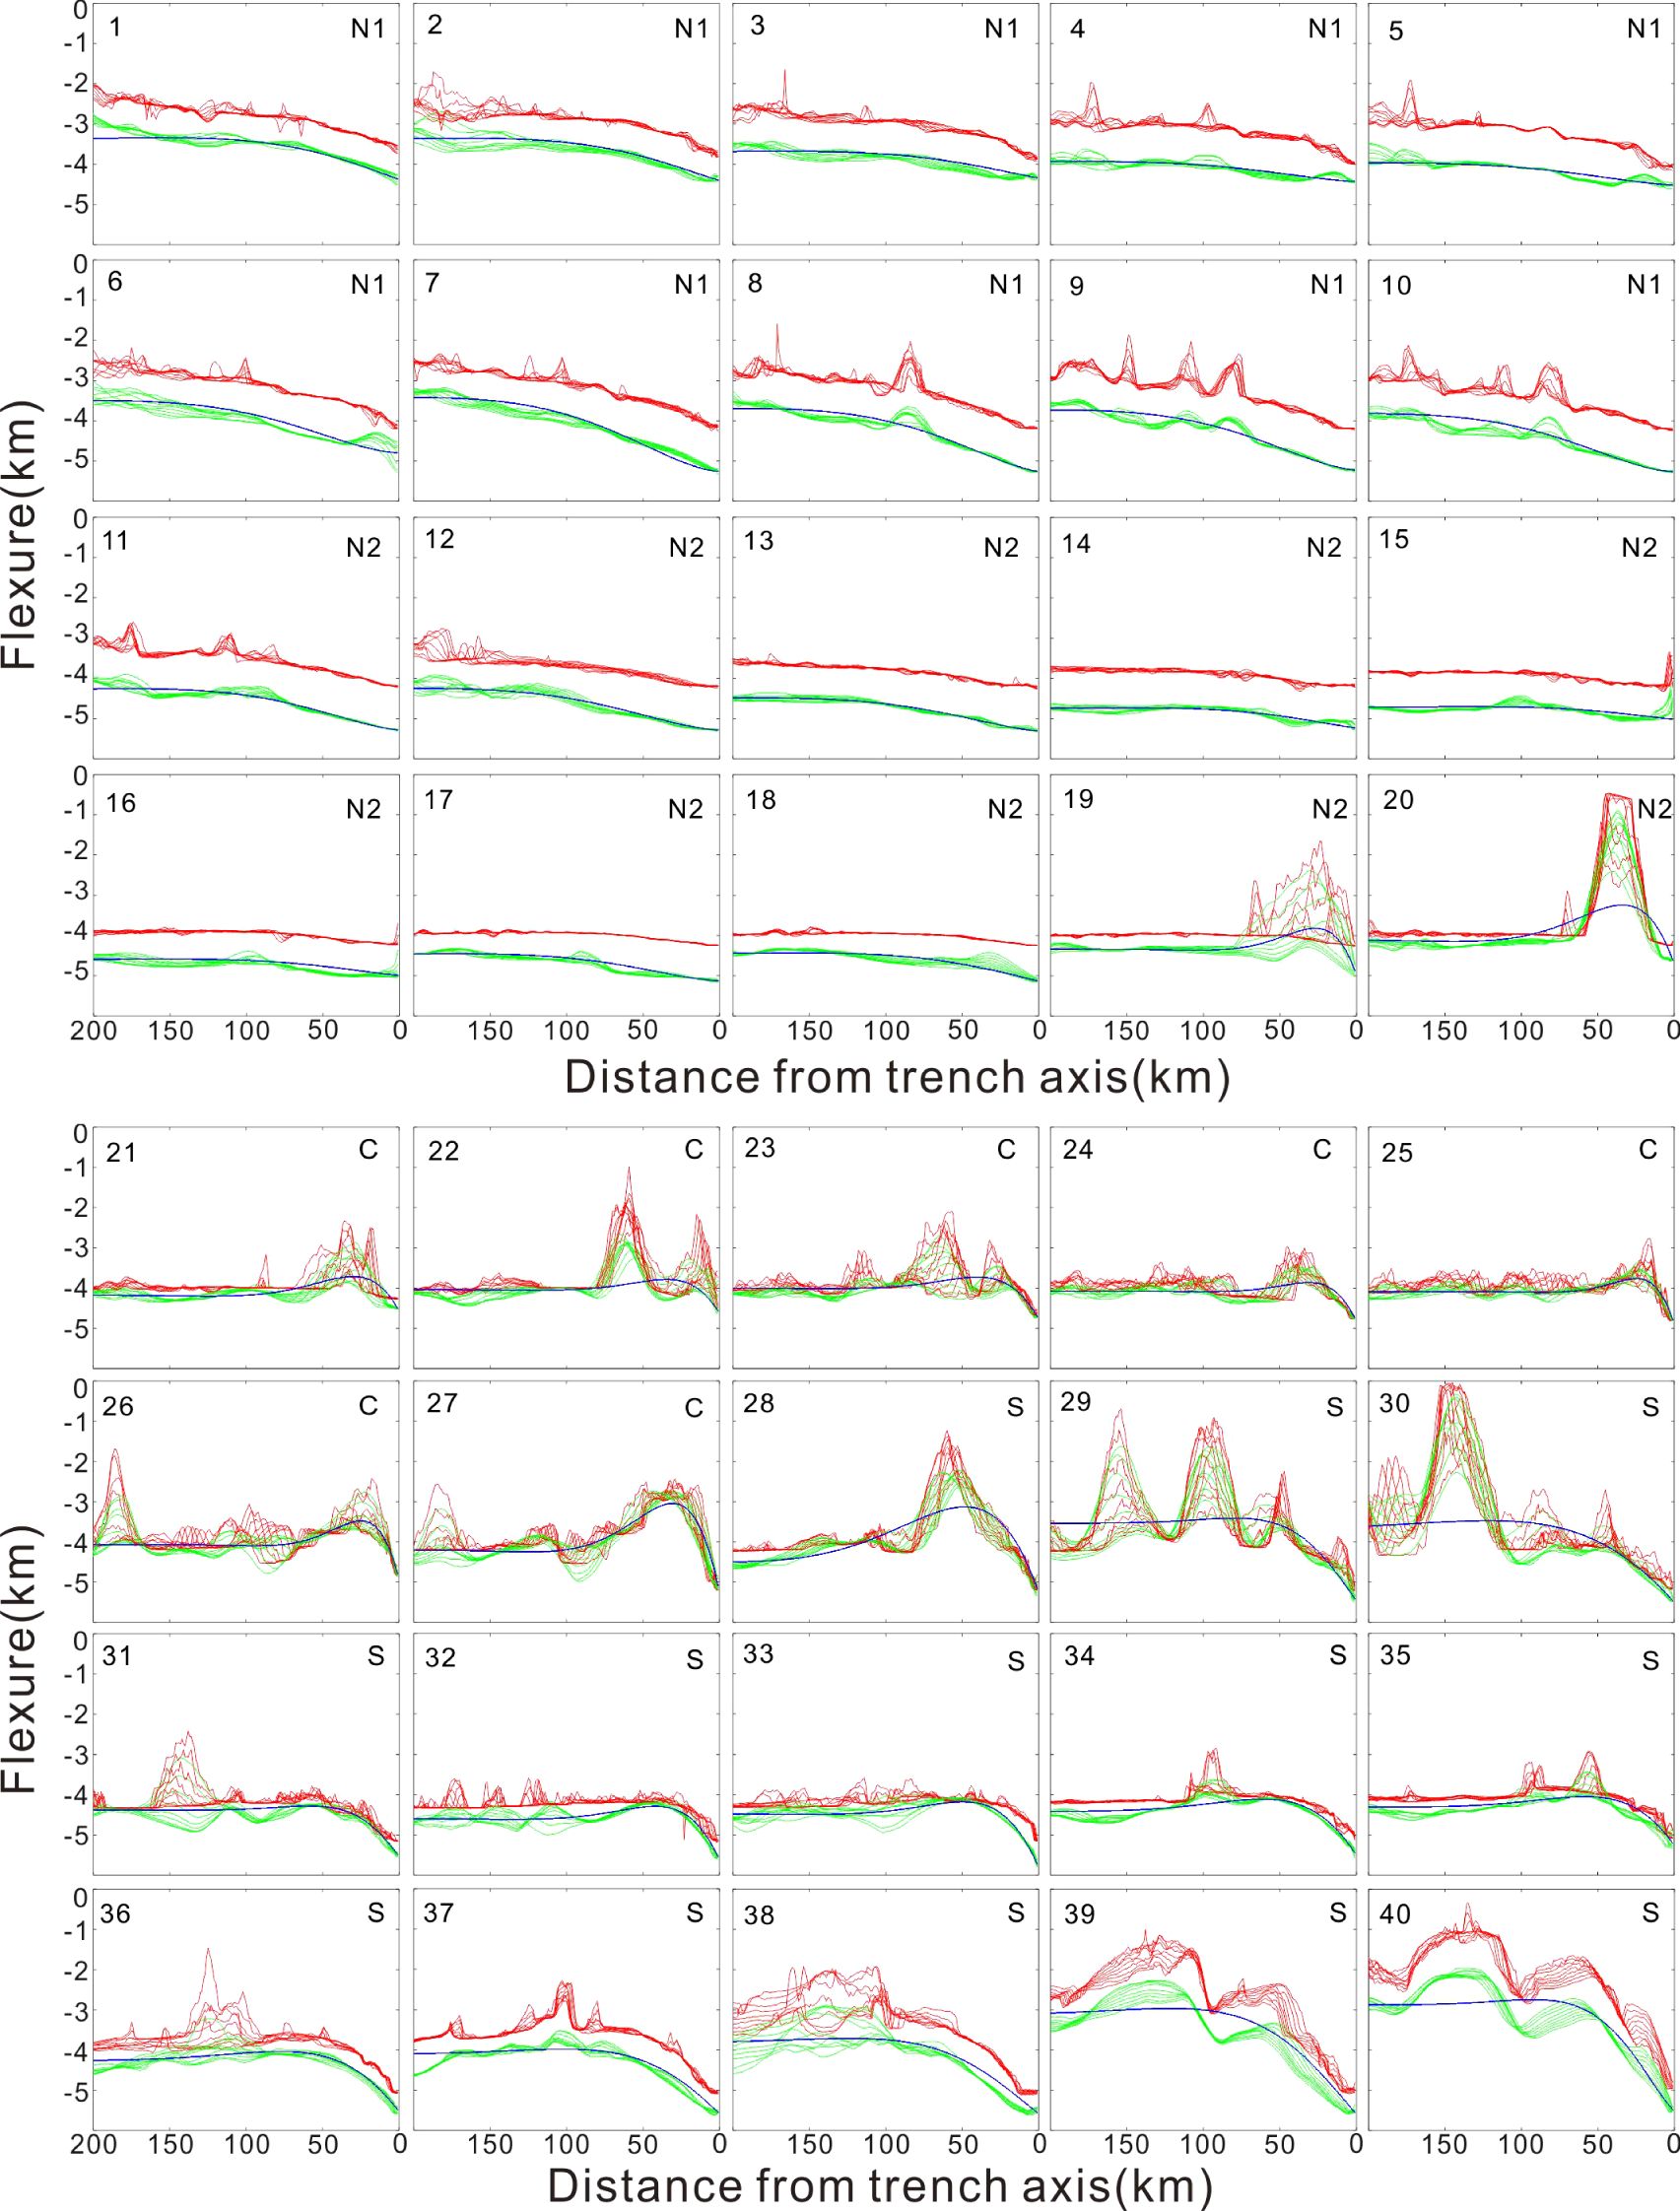
Figure 5. Across-trench profiles of the Manila Trench are displayed, with each profile extending 400-km. For simplicity, only the easternmost 200 km is shown. Ten individual profiles were averaged to construct the section. The Manila Trench is composed of the northern segment N1 (Sections 1–10), N2 (Sections 11–18), the central segment (Sections 19–27), and the southern segment (Sections 28–40) (refer Figure 2 for location). In each section, the red curves represent the original bathymetry profiles, while the green curves depict the calculated sediment-corrected topography profiles. The blue curves illustrate the interpreted deformation profiles that effectively capture the long-wavelength characteristics of the sediment-corrected topography profiles. These interpreted deformation profiles were utilized in the inversion process for determining the best-fitting flexural parameters for individual profile sections.
3.2 Flexural modeling
The flexural wavelength and amplitude of the outer rise bulge are simulated using a model where an elastic lithosphere overlays a weaker underlying layer. In this model, the lithosphere is subjected to shear stress (V0) and bending moment (M0) on the side facing the island arc (Watts and Talwani, 1974; Levitt and Sandwell, 1995; Contreras-Reyes and Osses, 2010; Hunter and Watts, 2016). The effective elastic thickness (Te) is an indicator of a plate’s resistance to flexural deformation and is directly related to its flexural rigidity(D). In this assumption, if a plate has a strong resistance to flexural deformation, Te is large; conversely, if the plate has a weak resistance to flexural deformation, Te is small.
The flexure of the oceanic lithosphere at trenches is conceptualized as a hydrostatic restoring force acting on an elastic plate. Here, W represents plate flexure, g is the average gravitational acceleration, and and denote the densities of the mantle and water, respectively (Table 2) (Caldwell et al., 1976; Levitt and Sandwell, 1995; Watts and Zhong, 2000; Bry and White, 2007; Contreras-Reyes and Osses, 2010; Hunter and Watts, 2016) (Figure 4d). Considering the boundary condition of no flexure away from the load (i.e., w→0 as x→∞), the deflection W of the plate is calculated as follows:
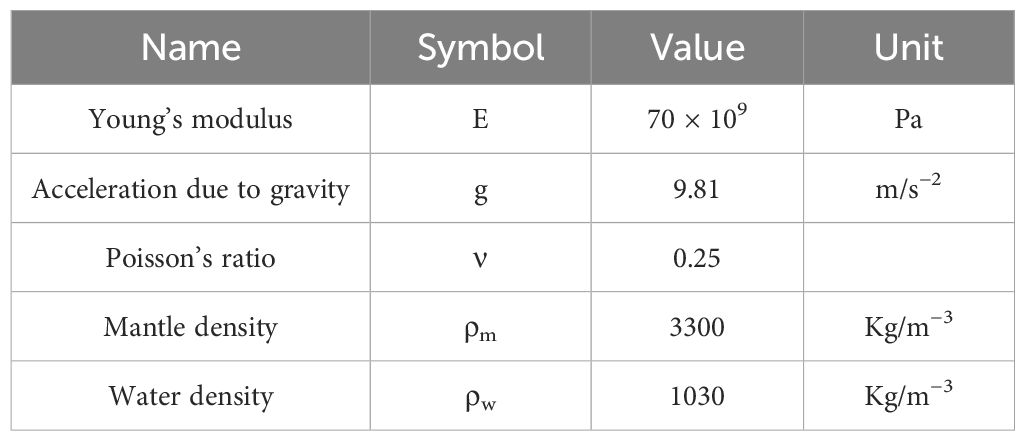
Table 2. Values of parameters and constants used in flexural modeling.
In the equation, is the flexural parameter that defines the natural wavelength of the elastic lithosphere (where a more rigid lithosphere results in a longer wavelength of the bulge).
We utilize the independent parameters: the initial dip of the subducting plate (β0) at the trench axis, the flexure at the trench axis and the elastic thickness Te (Figure 4c). This alternative approach enables the direct measurement of restricted quantities from bathymetric data. The constants and in Equation 3 are derived by considering the following boundary conditions: and Thus, C1= and C2= and the flexure of the lithosphere (Equation 4) can be expressed as (Eduardo and Jerernias, 2018).
To assess the model error, we computed the Root Mean Square (RMS) error (Equation 5) between the observed interpreted deformation and the predicted flexure using:
Where N is the number of profile points; is the calculated best-fitting model; is the interpreted deformation.
Traditional methods use V0, M0, and Te as parameters to simulate the flexure of the oceanic lithosphere. These methods predominatly depend on morphological information from the outer rise, especially the half-width of the forebulge, to identify topographic features (Zhang et al., 2018c, 2018b). However, the presence of significant features, such as seamounts and curved faults, can obscure the characteristics of both the trench and outer rise. Such extraneous features, irrelevant to the long-wavelength properties of the lithosphere, contribute to what is termed topographic noise. Sometimes, the amplitude of this noise can approach that of Wb, leading to potential inaccuracies in estimating the flexural parameters through traditional methods (Cheng et al., 2019; Zhang et al., 2019).
In this study, we employ a method that relies on data from the trench axis (β0 and W0), where W0 is typically greater (often over five times) than Wb, making it easier to identify compared to the precise half-width of the forebulge. Nonetheless, this method is highly sensitive to the initial subduction dip of the trench. When β0 takes on high values, the model predicts unrealistic heights for the fore-bulge, and W(x) becomes unstable (Eduardo and Jerernias, 2018). To assess the instability of the equation when β0 > 15°, we calculated the flexural topography of the oceanic trench for β0 = 15°. By taking the first derivative of W(x) with respect to x, we identified the positions where the slope equals zero. Substituting these positions into the W(x) function allowed us to compute the height of the outer rise (Wb), which is proportional to both Te and β0. When Te = 10 km and β0 = 15°, the height of the outer rise approaches 1 km, which is consistent with the outer rise observed in the northern Chile Trench, the highest globally. Therefore, for β0 values greater than 15°, Wb no longer matches the observed topography, leading to model instability. However, bathymetric and seismic reflection data provide no evidence for large initial dip values in subducting plates (Harris and Chapman, 1994; Maksymowicz, 2015; Hoggard et al., 2017). Instead, β0 typically maintains a low angle—usually less than 15—which gradually steepens as the oceanic plate subducts over several tens of kilometers (Contreras-Reyes and Osses, 2010). For profiles with a clearly observable, forebulge, the results from both methods display only minor differences. Conversely, in profiles lacking a distinct forebulge, traditional methods may yield significant errors. Moreover, when modeling the trenchward section of the trench, traditional approaches can result in a diminished effective elastic thickness due to plate weakening. This variability complicates comparisons of plate strength, as Te is not a constant value. In contrast, our method computes Te as a weighted average along the depth profile, resulting in a consistent value that more accurately reflects the overall strength of the plate, thus enhancing comparative analyses.
4 Results
4.1 Best-fitting flexural modeling solutions
We obtained the best-fitting models (Figure 5) and flexural bending parameters (Figure 6) for individual profile sections of the Manila Trench, as summarized in Table 3. The trench relief (W0) varies from 0.3 to 2.6 km (Figures 6b, 7a; Table 3). The bulge height (Wb) of the Manila Trench ranges from 0.014 to 1.15 km (Figures 6c, 7d). The trench width (X0) spans from 7 to 151 km (Figures 7b, d), and the distance from the trench axis to the shallowest point (Xb) ranges from 25 to 201 km (Figures 6e, 7c). The elastic thickness (Te) of the Manila Trench lies between 5 and 25 km (Figures 6f, 7e). The initial subduction dip (β0) ranges from 0.1° to 9.8° (Figures 6g, 7f). The root mean square (RMS) error between the best-fitting models and interpreted deformation profiles ranges from 0.025 to 0.88 km (Figure 6h), which broadly aligns with previous findings (Zhang et al., 2018a). Notably, calculated RMS values for Segment C are significantly higher than those of the other segments, likely due to the influence of seamount subduction.
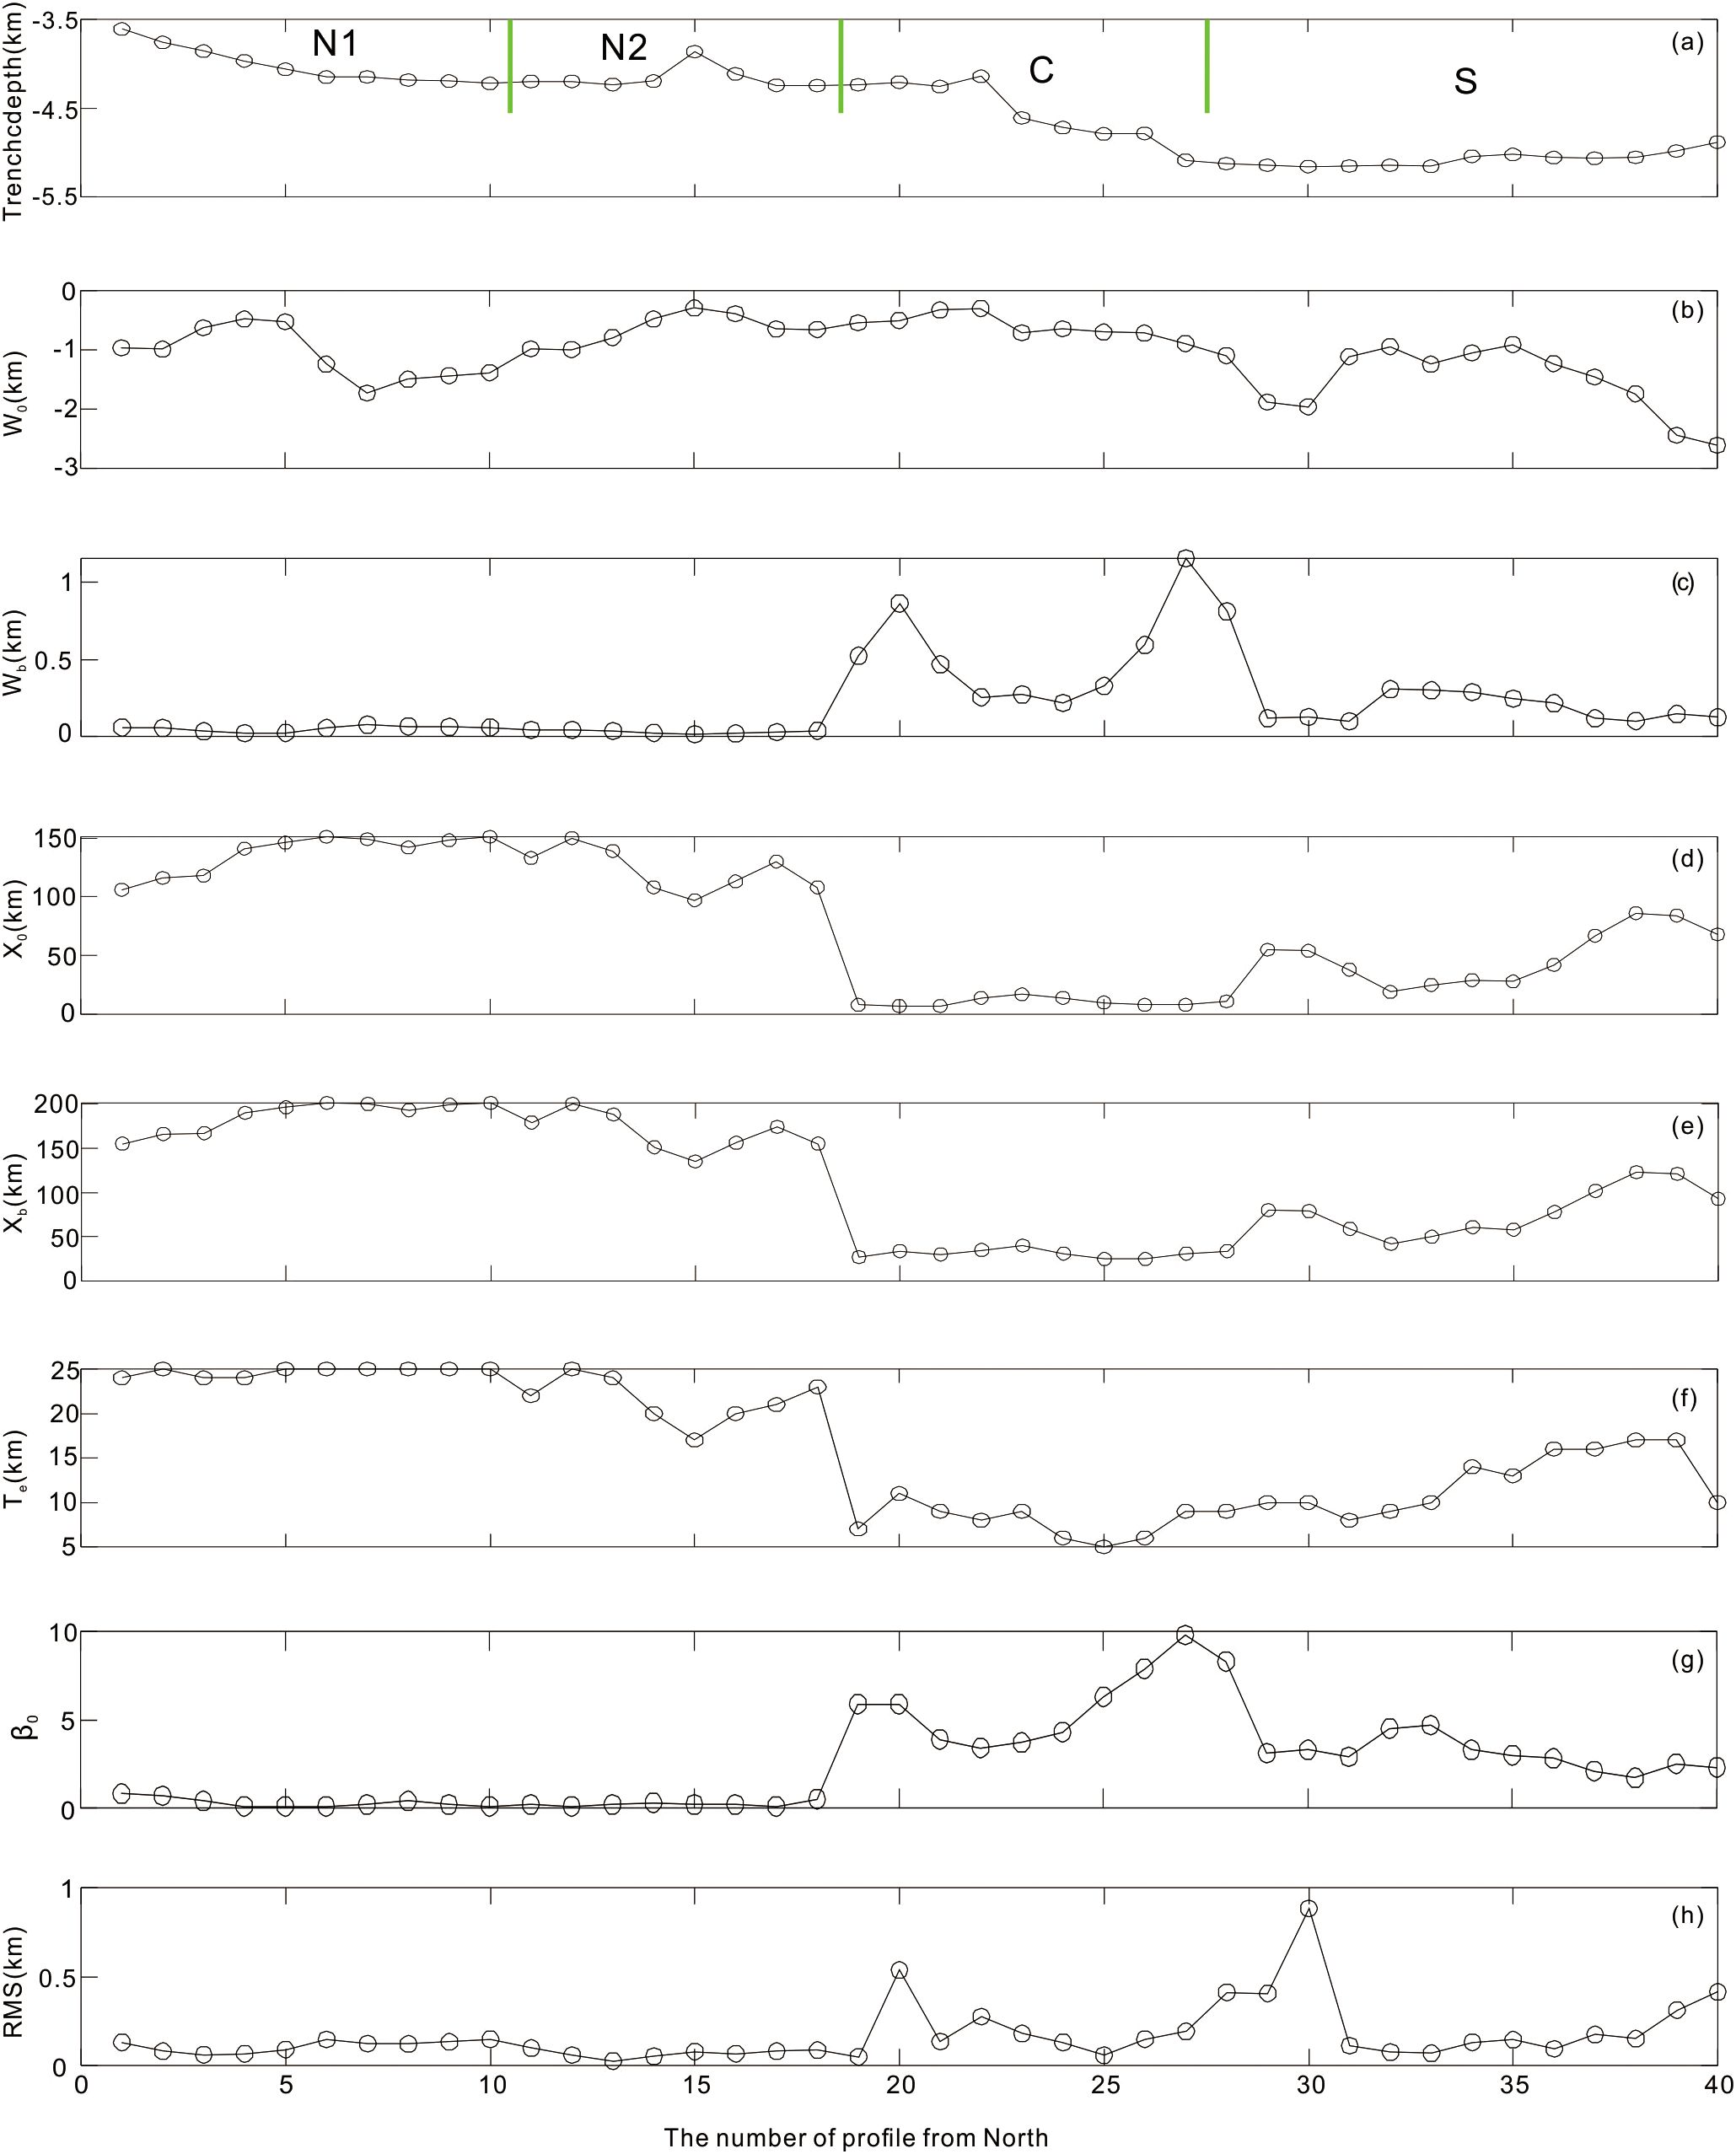
Figure 6. Calculated flexural bending parameters for individual across-trench profile sections along the Manila trench. (a) Trench depth, dividing the Manila trench into the northern (N1 and N2) segments, central (C) and southern (S). (b) Trench relief (W0), which represents the trench axis depth relative to a far-field reference seafloor depth. (c) Bulge height (Wb), indicating the depth of the shallowest point concerning the far-field reference seafloor depth. (d) Width of trench valley (X0). (e) Location of the shallowest point from the trench axis (Xb). (f) Calculated elastic thickness (Te) along the Manila Trench. (g) Initial subduction dip angle (β0) of the Manila Trench. (h) Calculated root mean square (RMS) between the best-fitting model and interpreted deformation profile.

Table 3. Best-fitting bending parameters of the Manila Trench.

Figure 7. Statistics of trench geometry and bending parameters along the northern segments N1 and N2, central segment C and southern segment S of the Manila Trench. Arrows indicate the average values. (a–f) represent the statistical data for W0, X0, Xb, Wb, Te, and β0, respectively.
The South China Sea is a relatively young tectonic plate with a heterogeneous rheological strength in its lithosphere. Previous studies have used the admittance method, based on wavelet transforms, to calculate the effective elastic thickness (Te) of the subducting South China Sea plate (Gong et al., 2021). In comparison, the Te values calculated in this study are slightly higher than those results in the previous studies (Zhang et al., 2018a; Gong et al., 2021). This discrepancy can be primarily attributed to the accumulation of reverse stress near the Manila Trench caused by subduction, which strengthens the lithosphere and increases the Te values. Additionally, factors such as dynamic topography and density compensation of the subducting plate also influence the results.
4.2 Comparisons between segments
We conducted a comparative analysis of the flexural bending parameters across different segments of the Manila Trench to clarify the variability in the characteristics of the subduction system. The results reveal significant variations along the trench (Figures 6, 7).
The trench-averaged relief values indicate that the N2 segment (0.65 km) is slightly greater than that of the C segment (0.59 km), but less than that of the N1 segment (1.09 km), and systematically smaller than the S segment (1.51 km) (Figure 7a; Table 3; refer Figure 2 for location). The variation corresponds with observed trends in trench depth changes, where the absolute value of segment-averaged W0 is greater for the S segment compared to the N1, N2, and C central segments (Figures 6a, b; refer Figure 2 for location).
The trench-averaged values for X0 in the N1 segment (136.8 km) and N2 segment (122.25 km) exceed those of the C segment (10.33 km) and S segment (46.62 km) (Figure 7b and Table 3; refer Figure 2 for location). Similarly, Xb demonstrates the same pattern. The trench-averaged Xb values are smaller for the S segment (75.38 km) and C segment (30.89 km) compared to the N1 segment (186.8 km) and N2 segment (167.25 km) (Figure 7c; Table 3; refer Figure 2 for location). Notably, the trench-averaged values of X0 and Xb values for the C segment are particularly low (Figures 7b, c). Conversely, Wb displays an opposite trend to X0 and Xb, with the trench-averaged Wb for the N1 segment (0.05 km) and N2 segment (0.03 km) being smaller than that of the S segment (0.23 km) but also systematically smaller than that of the C segment (Figure 7d; Table 3; refer Figure 2 for location).
Te and β0 exhibit opposite trends along the trench. The average Te of the N1 segment (24.7 km) and N2 segment (21.5 km) is significantly greater than the values for the C segment (7.78 km) and S segment (12.23 km) (Figure 8e; Table 3). In contrast, the trench-averaged β0 for the N1 segment (0.31°) and N2 segment (0.23°) is substantially lower than that of the C segment (5.68°) and S segment (3.42°) (Figure 7f; Table 3; refer Figure 2 for location).
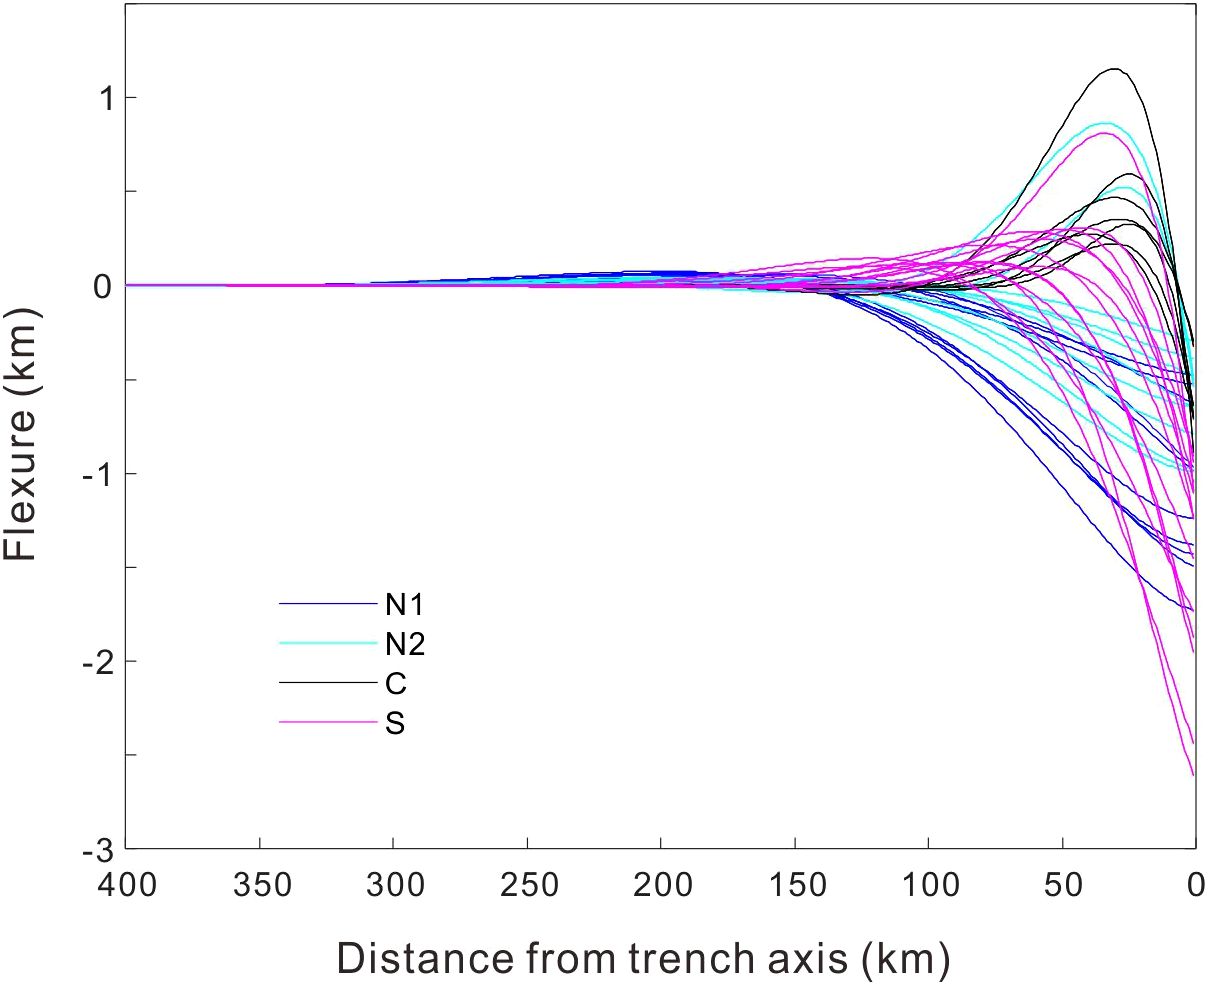
Figure 8. Flexural deformation of the northern segment N1(blue), northern segment N2 (light blue), central segment C (black) and southern segment S (purple) along the Manila trench.
4.3 The relationship between flexural parameters and initial dip of subduction
We projected the flexural parameters Te, Wb, X0, and Xb to intersect at the initial subduction dip angle (β0) (Figure 9). The results show that β0 decreases as the elastic thickness (Te) of the oceanic plate increases, demonstrating a moderate correlation with a coefficient of 0.72. In contrast, Te and β0 show a positive correlation with Wb, meaning that larger subduction dip angles correspond to greater forebulge heights. Additionally, the trench valley width (X0) and the location of the shallowest point along the bending profile (Xb) exhibit logarithmic negative correlations with β0, showing a higher correlation coefficient of 0.84. This suggests that as the flexural wavelength increases, the initial subduction dip angle decreases.
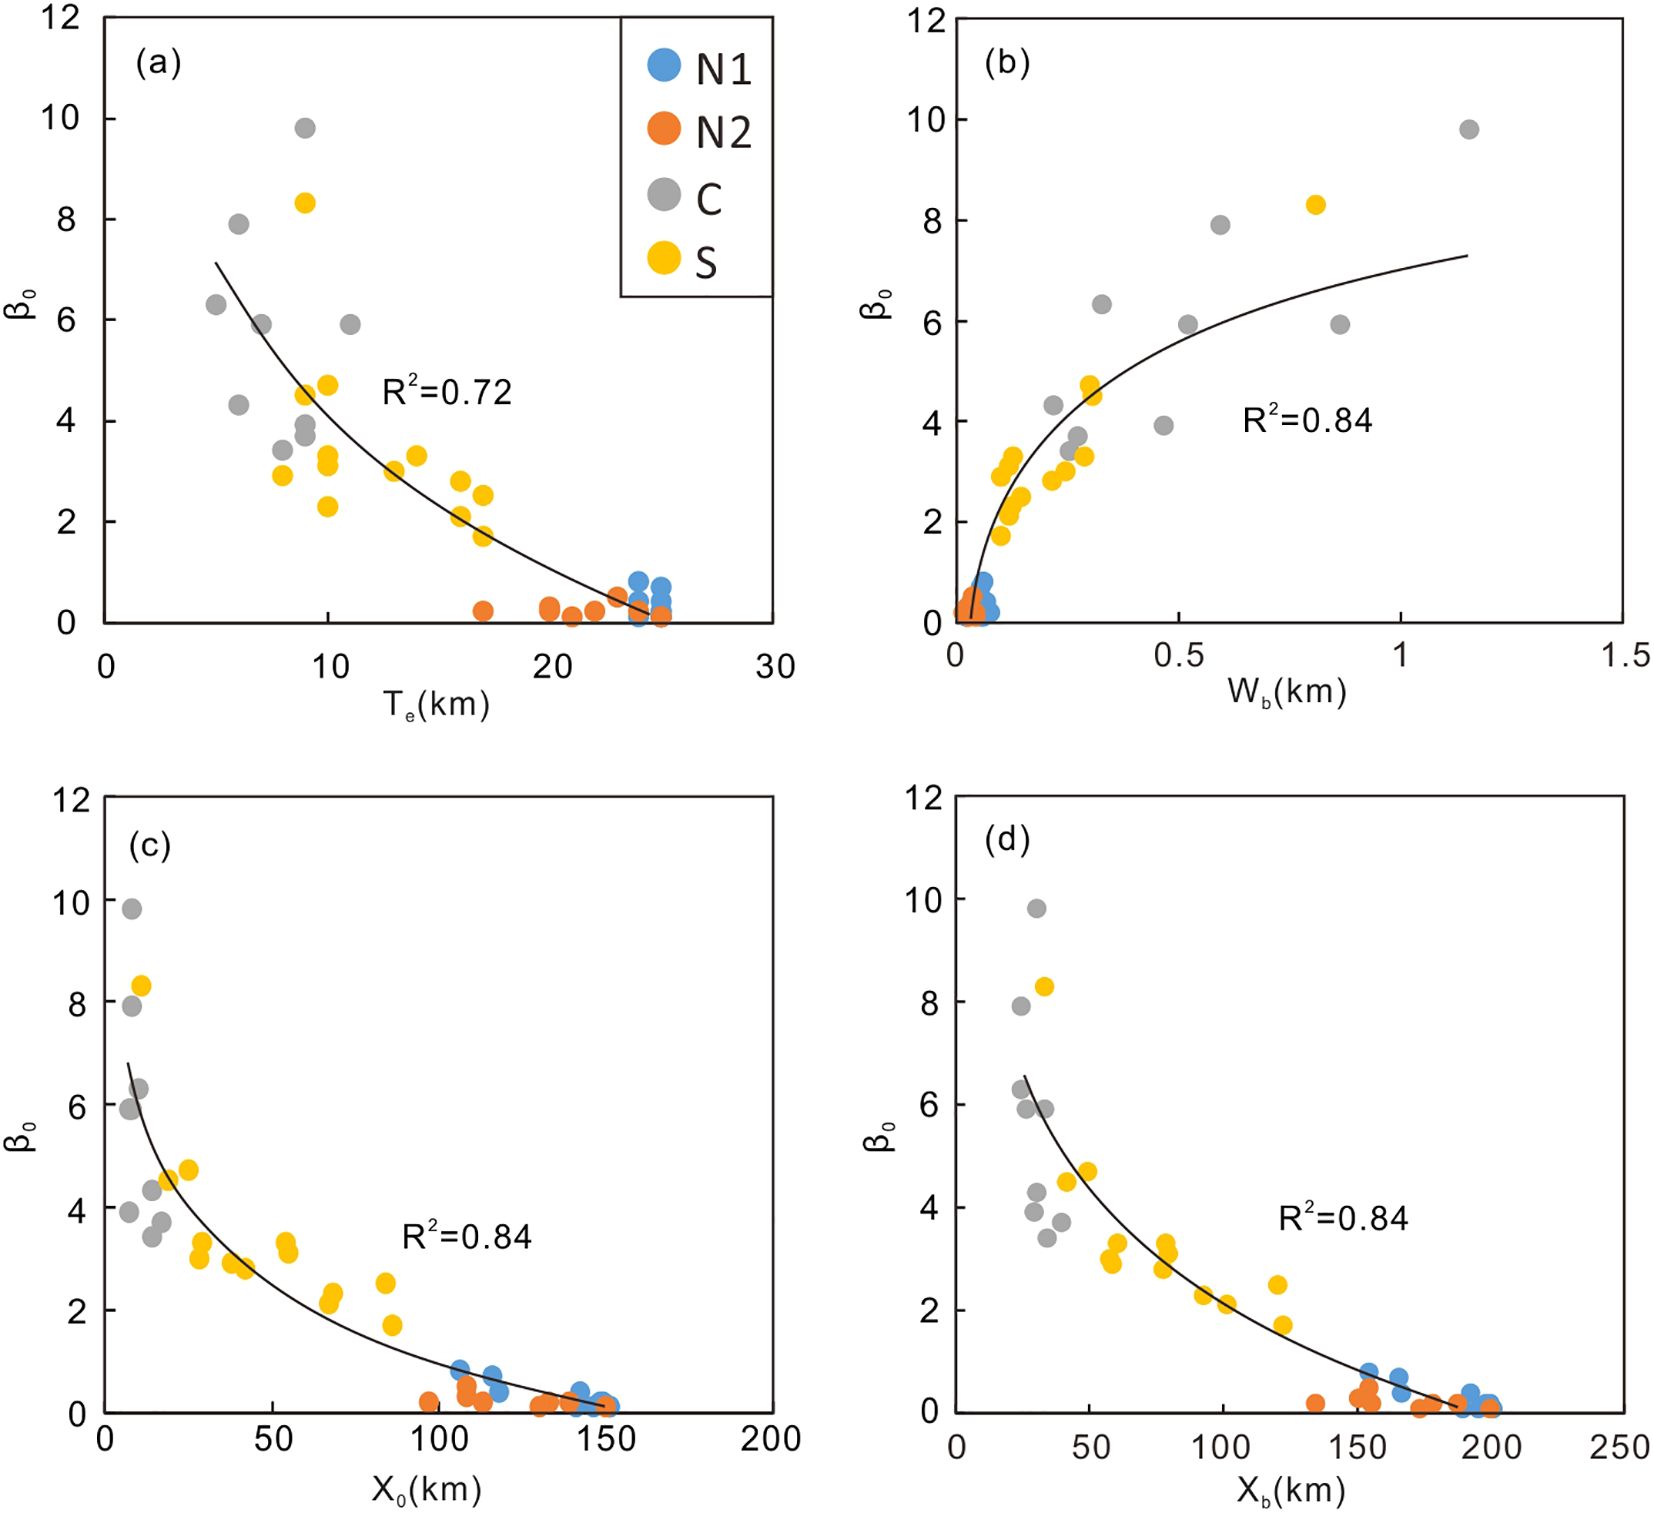
Figure 9. Calculated bending parameters of individual sections of the Manila trench. (a) Correlation between the elastic thickness (Te) and initial dip of subduction (β0). (b) Correlation between the bulge height (Wb) and initial dip of subduction (β0). (c) Correlation between the width of trench valley (X0) and initial dip of subduction (β0). (d) Correlation between the location of the shallowest point along the bending profile (Xb) and the initial dip of subduction (β0).
5 Discussion
5.1 Uncertainties in data
The uncertainties in the numerical simulation model derived stem from two sources: (1) The estimates of flexural parameters are based solely on the RMS misfit, without explicitly considering uncertainties in the bathymetric and sediment data. To address this limitation, eliminate the influence of local bathymetric and sediment on the depth of the foundation base, we extracted 10 profiles at 2 km intervals along each profile and stacked them to create an average topographic profile (Figure 4a), which was subsequently used for the forward modeling (Zhang et al., 2018a). (2) In certain regions, the sediment thickness derived from multi-channel seismic profiles is sparse. Where seismic data control is lacking, we utilized sediment thickness data from the American Geophysical Data Center. To ensure the accuracy of the model, we also selected sediment thickness interpretation from three additional seismic reflections that were not used in the initial gridding process. These data were compared with sediment thickness measurements at the same locations in both the American Geophysical Data Center and the grid used in this study. The comparison revealed that the publicly available sediment thickness data, due to its lower resolution, often overestimated sediment thickness and lost finer details. In contrast, the sediment thickness data used in this study closely aligned with the seismic interpretation results, improving the overall accuracy of the simulation. Flexural normal faults can transport water into the deep crust and even the upper mantle, promoting serpentinization of the mantle. These faults are also closely associated with earthquakes in the trench forearc (Bird et al., 2002; Boutelier and Beckett, 2018). However, since this study relies on the assumptions of the elastic thin-plate model, it does not account for faulting. Future work could incorporate fault modeling to improve the realism of the simulation.
5.2 Variation of the initial dip along the Manila subduction zone and its significance
The initial subduction dip angle plays a critical role in determining the degree of coupling between the subducting and overriding plates (Zhu et al., 2012, 2017; Eduardo and Jerernias, 2018; Peng et al., 2022). The initial subduction dip angle directly influences the contact area between the two plates, thereby affecting the strength of their coupling interaction. Figure 9 illustrates that the initial subduction dip angle is positively correlated with Wb and negatively correlated with Te, X0, and Xb. This implies that plates with smaller effective elastic thickness, which are more prone to bending, tend to have larger initial subduction dip angles, leading to greater flexural heights and narrower trench widths. A smaller initial dip angle results in stronger coupling, which reduces the likelihood of fracturing during subduction, leading to a higher Te of the subducting oceanic plate. As the initial dip angle increases, bending deformation becomes more pronounced, and the bending stress may exceed the rock’s yield strength in the most deformed regions of the lithosphere. This can cause tensile fractures in the upper part of the subducting plate. Geophysical data support this observation, showing that flexure-related normal faults, parallel to the trench, form at the frontal edge of subducting plates, such as those observed in the Middle America Trench and the Mariana Trench. These normal faults allow seawater to enter the mantle, promoting serpentinization and, in turn, reducing the Te of the subducting plate (McNutt and Menard, 1982; Christensen and Ruff, 1983; Masson, 1991; Ranalli, 1994; Ranero et al., 2005; Naliboff et al., 2013; Zhang et al., 2014). As a result, segments N1 and N2, which have a larger effective elastic thickness, show smaller flexural deformations and wider trench widths. In contrast, segment C experiences the greatest flexural deformation and has the narrowest trench, while segment S displays intermediate characteristics (Figure 8). The evolution of oceanic subduction is governed by several dynamic factors, including the buoyancy of the subducting plate, the degree of plate coupling, the convergence rate, and the rheological properties of the subduction zone. Low-angle subduction is promoted by factors such as the positive buoyancy of the subducting plate, strong coupling between the plates, a higher convergence rate of the overriding plate, and rheological conditions that facilitate plate bending.
The N1 segment, which is integral to the Taiwan Orogenic Belt (Figure 2), is formed through the collision, compression, wedging, and escape dynamics between the Luzon Arc and the Eurasian Plate (Ding et al., 2018; Gao et al., 2018; Zhang et al., 2019; Zhan et al., 2023). To the west of N1 lies the arc-shaped Manila Trench and accretionary prism, while the eastern side is characterized by the Northern Luzon Trough and Luzon Arc. Based on the OBS P-wave velocity model and the absence of the Pn seismic phase, the N1 is interpreted as thinned continental crust overlain by post-rift volcanic layers (Xia et al., 2014; Sibuet et al., 2016; Gong et al., 2021). This domain is controlled by the subduction accretion process, resulting in the formation of a wide accretionary wedge structure spanning 50 to 140 km in width (Zhu et al., 2012; Lester et al., 2013; Eakin et al., 2014; Gao et al., 2018). The N2 segment extends from the southern boundary of N1 to the Guaishi Guyol (Figure 2), north of the abandoned mid-ocean ridge associated with the end Oligocene ridge jump in the South China Sea. The boundary between N1 and N2 corresponds with the transition zone from the northern ocean to continent domain in the South China Sea. Moving southward, N2 transitions from an oceanic-continental transition zone to oceanic crust domain (Piao et al., 2022). Though N2 shares similar subduction characteristics with N1, differences in crustal thickness cause variations in effective elastic thickness.
The C segment, located on the eastern side of the Eastern Sub-basin (Figure 2), is dominated by a slow seafloor spreading zone with rough basements and syn-spreading faults. Syn-spreading and post-spreading magmatism along spreading ridges have created numerous seafloor volcanoes, seamounts, and abyssal hills. The C segment is distinguished by the subduction of seamounts, primarily influenced by the Huangyan seamount chain (Figure 1), which subducts along the relict South China spreading ridge in an almost east-west direction. The segment shows significant differences from others in terms of earthquakes, volcanic activities, topographical features, and stress conditions, largely due to the presence of a “slab window” formed during the subduction of the Huangyan seamount chain (Xue et al., 2012; Fan et al., 2015). The C segment is influenced by both subduction-accretion and erosion processes, resulting in a relatively narrow accretion wedge (Zhu et al., 2017).
The S segment refer Figure 2 for location, represents the normal oceanic crust formed under the subduction influence of the southern Manila Trench (Liu et al., 2018). Structural erosion may control the segment, producing a narrow accretion wedge. The distribution of the initial subduction dip angles in the Manila Trench shows that N1 and N2 have significantly smaller angles than the C and S segments. The C segment has the greatest variation and the largest dip angle, mainly due to the subduction of seamounts. The initial subduction dip angle of oceanic trenches is influenced by various factors, including slab age, coupling, thickness, and convergence, all of which shape the subduction process (Cruciani et al., 2005; Heuret and Lallemand, 2005; James et al., 2009; Dasgupta, 2021). Generally, older slabs tend to have higher densities, making them more likely to form larger subduction dip angles. Slab density also affects coupling; slabs with weaker coupling are more likely to produce larger initial subduction angles, as significant density differences between slabs facilitate subduction. Since oceanic crust is denser than continental crust, it typically subducts beneath the less dense continental crust. Slab thickness influences the subduction dip angle by affecting the effective elastic thickness (Te) of the subducting plate. Thicker slabs have greater Te, making them more resistant to bending.
The South China Sea, a young marginal sea (approximately 32–16 million years old), exhibits minimal variation in slab age across the segments of the Manila Trench, making the influence of age on slab flexure negligible. Instead, the initial subduction dip angle is primarily controlled by slab density and the convergence rate. In segments N1 and N2, where thinned continental crust and lower-density oceanic crust subduct, the initial dip angles are smaller. In contrast, segments C and S, where denser oceanic crust is subducted, exhibit larger initial dip angles, with segment S showing the most pronounced dip. The larger initial subduction angle in segment S results in more intense bending deformation, facilitating the formation of tensile fractures at deformation sites. These fractures reduce the effective elastic thickness of the subducting slab, further influencing trench geometry and dynamics through a positive feedback loop (Turcotte et al., 1978; Bodine and Watts, 1979; Ranero et al., 2005; Contreras-Reyes and Osses, 2010; Hunter and Watts, 2016). Slab convergence further modifies the initial dip angles in segments C and S due to “opposite subduction” at the eastern Philippine Trench, where the Philippine Sea Plate subducts westward beneath the Eurasian Plate. This interaction increases the initial subduction dip angles of segments C and S.
The initial subduction dip angle in the Manila subduction zone abruptly increases at the junction between the N2 and C segments (17.3°N), possibly due to the presence of a slab window structure. Additionally, seismic tomography evidence supports the correlation between the rapid increase in the initial subduction dip angle and the presence of the slab window (Fan et al., 2015). During the subduction, the oceanic ridge continues to spread without generating new oceanic crust, resulting in a fissure between the plates called a slab window (Snyder et al., 1976; Dickinson and Snyder, 1979). Chen et al. (2015) observed that younger, hotter subducting plates are prone to tearing, creating a gap between the plates called a plate tear or slab window. This gap allows mantle material to raise and directly contact the overlying plate. The existence of slab windows is supported by the distribution of adakites along the Luzon Arc (Sajona et al., 2000; Bellon and Yumul, 2001; Andal et al., 2005; Sun et al., 2010). Adakites, as defined by Defant and Drummond (1990), are considered to result from the partial melting of a young subducted slab (<25 Ma). In Northern Luzon, adakite enrichment has been observed since the subduction of the extinct mid-ocean ridge (MOR) of the South China Sea (SCS) slab around 2 Ma. These adakites are derived from older plates and have been influenced by the subduction buoyancy block near 20°N and the tearing of the South China Sea plate along the residual mid-ocean ridge since the Quaternary. This has affected the chemical composition of volcanic rocks, causing partial melting of gabbro layers in the oceanic crust profile and forming adakites with higher Sr content (Defant and Drummond, 1990; Mukasa et al., 1994). Yang et al. (1996) proposed a dynamic model for the subduction of the South China Sea plate. Before 6 Ma, the relict spreading ridge of the South China Sea approached the Manila Trench, forming the West Volcanic Island Chain. During 4-5 Ma, the relict spreading ridge began to subduct beneath the Manila Trench, while the Eurasian Plate collided with the northern Luzon volcanic arc. This collision, combined with the subduction of the relict spreading ridge, led to the cessation of volcanic activity in the northern part of the West Volcanic Chain. The already-subducted relict spreading ridge became a weak point in the plate, with reduced seismic activities, and the high heat flow beneath the subducting plate made it susceptible to deep-seated tearing (Chen et al., 2011). Around 2 Ma, the subducting plate tore along the relict spreading ridge, reducing the dip angle on the northern side (Figure 10). This led to the formation of the East Volcanic Island Chain, farther from the trench. Simultaneously, mantle material upwelled, interacting with lithospheric material to enrich the mantle-source component in the magma. Bautista (2001) conducted a more detailed analysis based on seismic data and topographic features and supported Yang et al.’s model. They emphasized the role of light material (oceanic plateau) around 20°N, suggesting that this material rather than the relict South China Sea spreading ridge that causes the change in subduction plate dip angle. According to Bautista (2001), north of the ancient South China Sea spreading ridge, the subducting plate’s dip angle becomes shallower due to the buoyancy of lighter material, resulting in the formation of the East Volcanic Island Chain (Figure 10). The results of our flexural modeling of the initial subduction dip angles in the Manila Trench align with previous findings derived from natural earthquake data and other geophysical methods (Yang et al., 1996; Bautista, 2001). Segments N1 and N2 consist of thinned continental crust and oceanic crust containing an ocean-continent transition zone, which has a density lower than that of normal oceanic crust. Additionally, the high buoyancy characteristics of the oceanic plateau hinder plate subduction, resulting in a relatively small initial subduction angle for segments N1 and N2 (Mason et al., 2010). In the C segment, the presence of a slab window causes a rapid increase in the initial subduction dip angle, though variations in seamount subduction affect the accuracy of the simulation. The S segment involves subduction of denser oceanic crust, characterized by significantly larger initial subduction dip angles compared to the N1 and N2 segments (Royden and Husson, 2006; Capitanio and Morra, 2012).
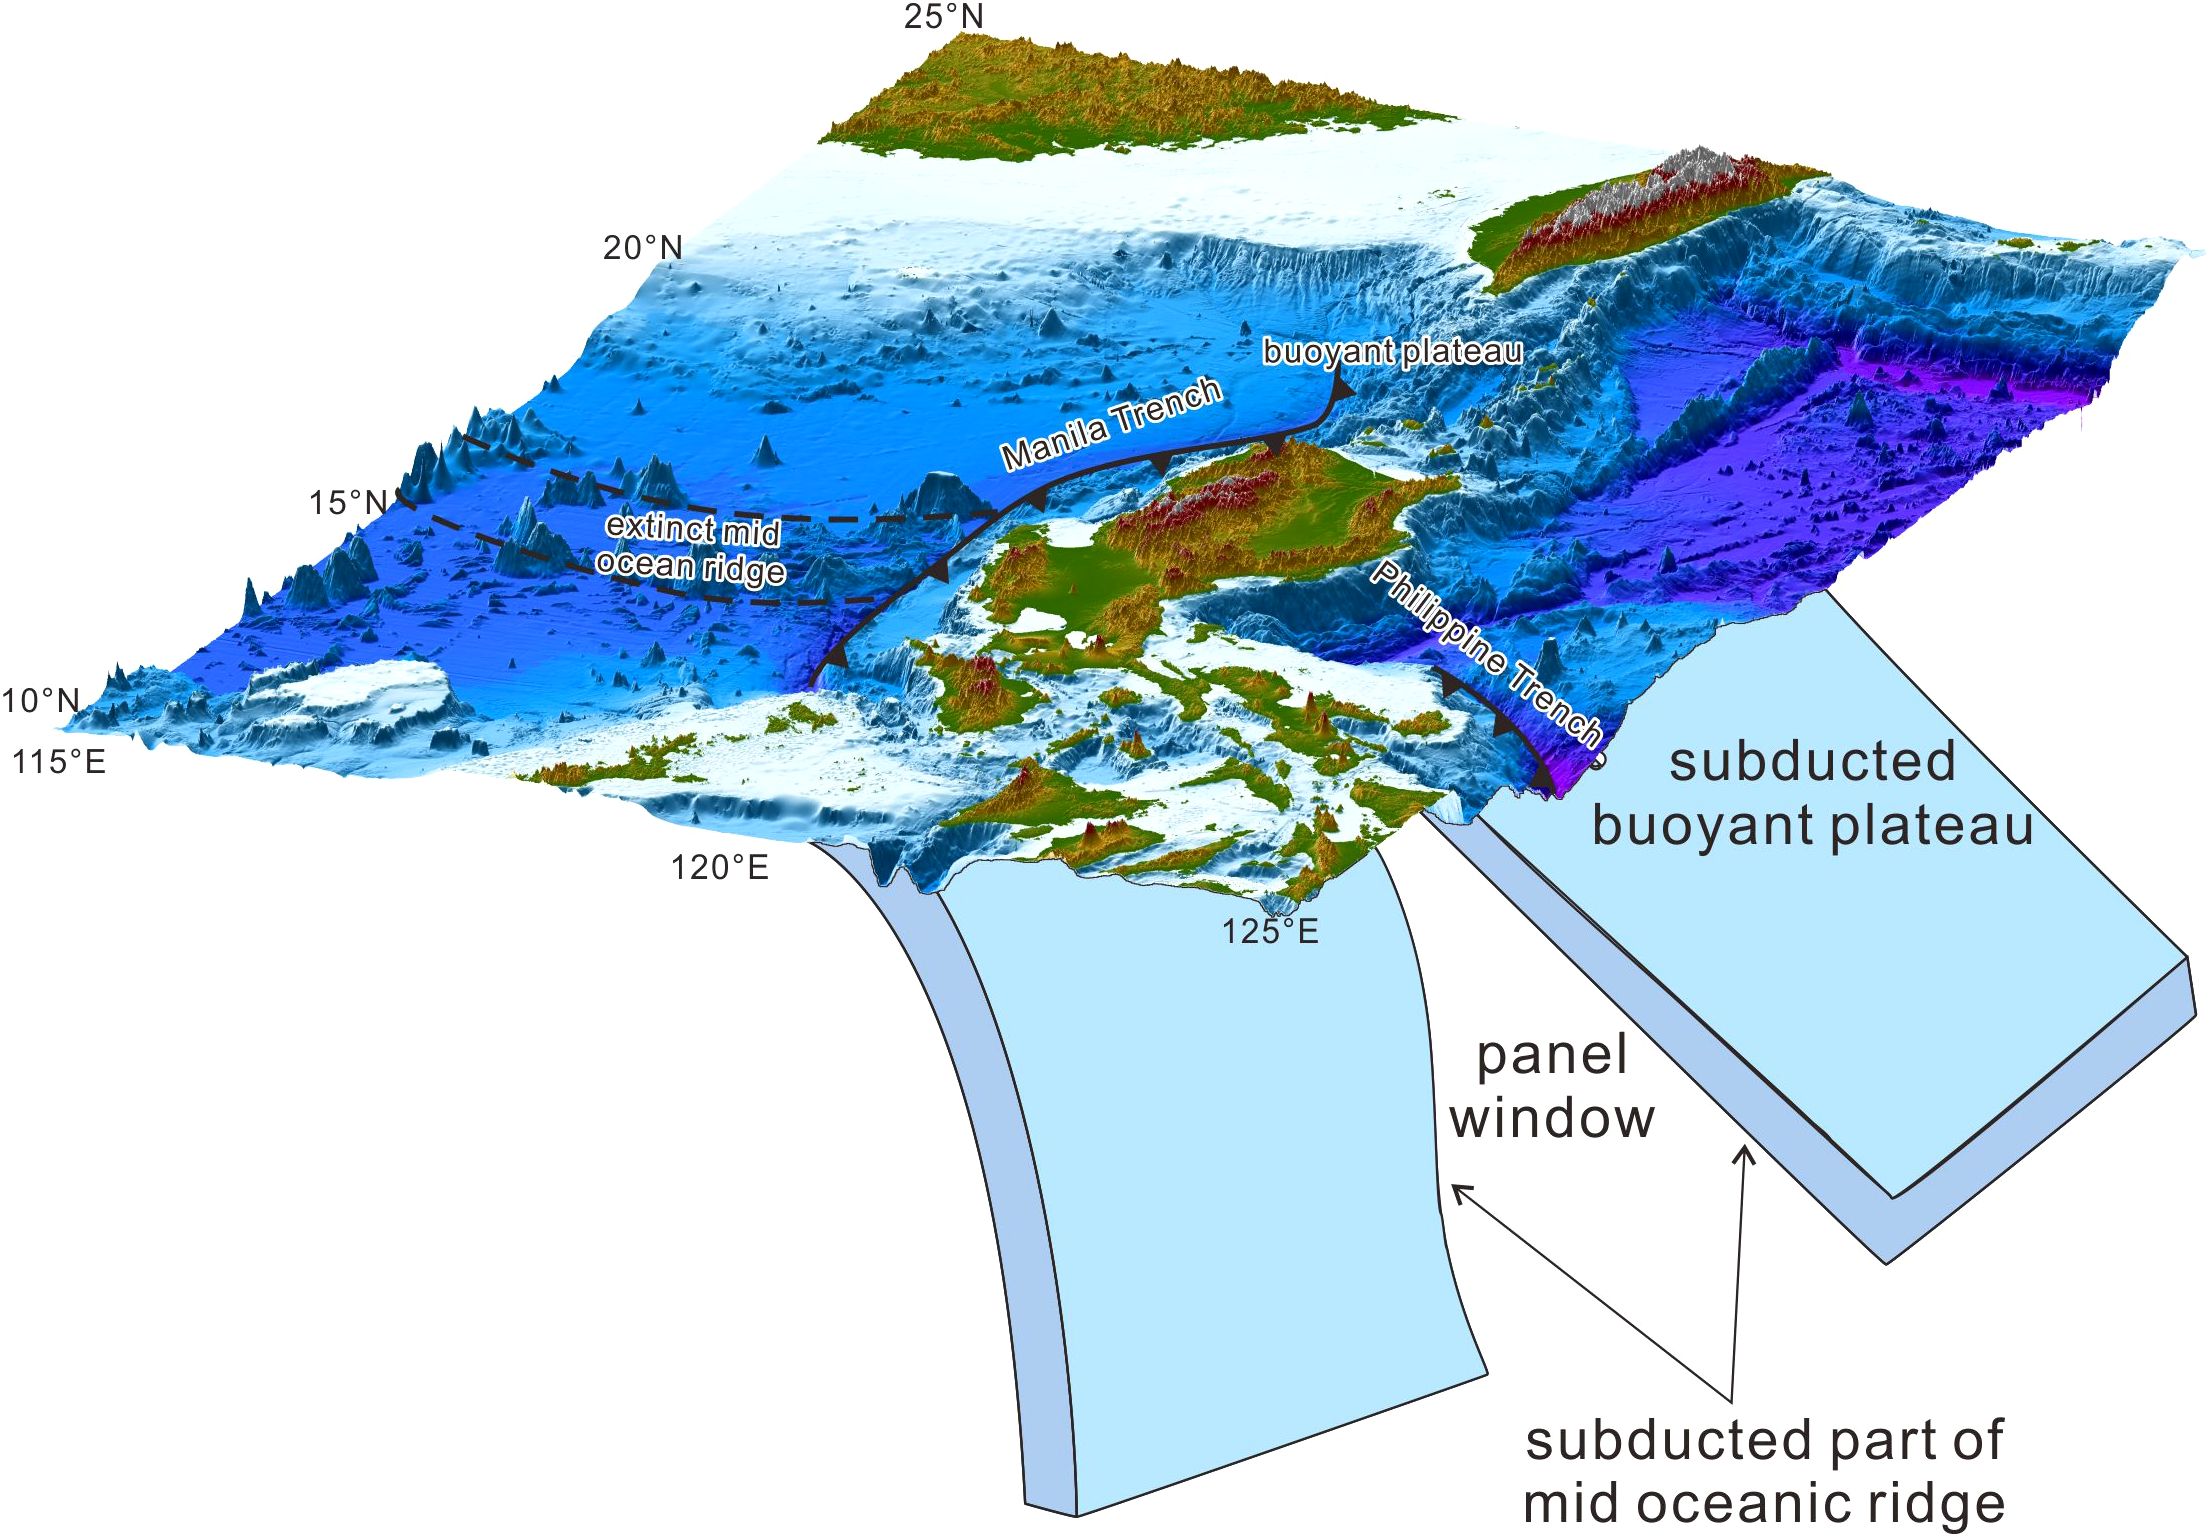
Figure 10. Proposed model of subducted slab of the South China Sea plate, modified from Bautista (2001).
6 Conclusions
Using bathymetric and sedimentary thickness data, constrained by seismic interpretation, we calculated the initial subduction dip angle and simulated the effective elastic thickness and flexural characteristics of 40 profiles along the Manila Trench. The study yields the following key conclusions:
1. The approach used in this study is effective when the trench axis is clearly identifiable, despite the presence of topographic noise around the outer rise. However, the method shows instability for high for high β0 values due to its sensitivity to the initial subduction dip angle.
2. The trench relief (W0) along the Manila Trench varies from 0.3 to 2.6 km. The effective elastic thickness ranges from 5 to 25 km, while the initial subduction dip angle varies from 0.1 to 9.8°.
3. Compared to the southern (S) segment, the northern N1 and N2 segments exhibit smaller initial subduction dip angles (β0), longer bending wavelengths (X0, Xb), and greater elastic thickness (Te). The increased dip angle in the S segment is influenced by the properties of the subducting crust and the impact of opposing subduction in the eastern Philippine subduction zone. In the C segment, the rapid increase in subduction dip angle is related to the presence of a slab window near the relict mid-ocean ridge.
4. The initial subduction dip angle is positively correlated with the bulge height (Wb) and negatively correlated with elastic thickness (Te) and bending wavelengths (X0, Xb). This suggests that plates with smaller effective elastic thickness are more prone to larger initial subduction dip angles, leading to higher flexural heights and smaller bending wavelengths.
Data availability statement
The raw data supporting the conclusions of this article will be made available by the authors, without undue reservation.
Author contributions
YL: Conceptualization, Data curation, Formal Analysis, Investigation, Methodology, Resources, Supervision, Writing – original draft, Writing – review & editing. LW: Conceptualization, Funding acquisition, Supervision, Writing – review & editing. YP: Methodology, Writing – review & editing. DM: Data curation, Software, Writing – review & editing. JL: Formal Analysis, Methodology, Software, Writing – review & editing.
Funding
The author(s) declare that financial support was received for the research and/or publication of this article. Funding for this study is provided by the China Geological Survey Projects (No. DD20201118 and DD20240090), Natural Science Foundation of China (Grant nos. U20A20100), Key Special Project for Introduced Talents Team of Southern Marine Science and Engineering Guangdong Laboratory (Guangzhou) (GML2019ZD0208), the Director General’s Scientific Research Fund of Guangzhou Marine Geological Survey, China (Grant No.: 2024GMGS-ZD-03、2023GMGSJZJJ00003), Science and Technology Program of Guangzhou, China (2024A04J3510).
Acknowledgments
We benefited from technical assistance and inspiring discussions of Zhang Jiangyang. The authors thank the editor and reviewers for their positive and constructive comments and suggestions on our manuscript.
Conflict of interest
Author YP was employed by China Petroleum Engineering & Construction Corporation.
The remaining authors declare that the research was conducted in the absence of any commercial or financial relationships that could be construed as a potential conflict of interest.
Generative AI statement
The author(s) declare that no Generative AI was used in the creation of this manuscript.
Publisher’s note
All claims expressed in this article are solely those of the authors and do not necessarily represent those of their affiliated organizations, or those of the publisher, the editors and the reviewers. Any product that may be evaluated in this article, or claim that may be made by its manufacturer, is not guaranteed or endorsed by the publisher.
References
Andal E. S., Yumul G. P., Listanco E. L., Tamayo R. A., Dimalanta C. B., Ishii T. (2005). Characterization of the pleistocene volcanic chain of the Bicol Arc, Philippines: implications for geohazard assessment. Terr. Atmospheric Ocean. Sci. 16, 865–883. doi: 10.3319/TAO.2005.16.4.865(GIG)
Audet P., Kim Y. H. (2016). Teleseismic constraints on the geological environment of deep episodic slow earthquakes in subduction zone forearcs: A review. Tectonophysics 670, 1–15. doi: 10.1016/j.tecto.2016.01.005
Bangs N. L., Christeson G. L., Shipley T. H. (2003). Structure of the Lesser Antilles subduction zone backstop and its role in a large accretionary system. J. Geophys. Res. Solid Earth 108, 2358. doi: 10.1029/2002JB002040
Bautista B. C. (2001). A new insight on the geometry of subducting slabs in northern Luzon, Philippines. Tectonophysics 339, 279–310. doi: 10.1016/S0040-1951(01)00120-2
Bellon H., Yumul G. P. (2001). Miocene to Quaternary adakites and related rocks in Western Philippine arc sequences. Comptes Rendus Acad. Sci. Ser. IIA Earth Planet. Sci. 333, 343–350. doi: 10.1016/s1251-8050(01)01644-5
Benioff H. (1964). Earthquake source mechanisms. Science 143, 1399–1406. doi: 10.1126/science.143.3613.1399
Bird P., Kagan Y. Y., Jackson D. D. (2002). Plate tectonics and earthquake potential of spreading ridges and oceanic transform faults. Plate Bound. Zones 30, 203–218. doi: 10.1029/GD030P0203
Bodine J., Watts A. (1979). On lithospheric flexure seaward of the Bonin and Mariana trenches. Earth Planet. Sci. Lett. 43, 132–148. doi: 10.1016/0012-821X(79)90162-6
Bostock M. G., Royer A. A., Hearn E. H., Peacock S. M. (2012). Low frequency earthquakes below southern Vancouver Island. Geochem. Geophys. Geosystems 13, Q11007. doi: 10.1029/2012GC004391
Boutelier D., Beckett D. (2018). Initiation of subduction along oceanic transform faults: insights from three-dimensional analog modeling experiments. Front. Earth Sci. 6. doi: 10.3389/feart.2018.00204
Briais A., Patriat P., Tapponnier P. (1993). Updated interpretation of magnetic anomalies and seafloor spreading stages in the South China Sea: Implications for the Tertiary tectonics of Southeast Asia. John Wiley Sons Ltd 98, 6299–6328. doi: 10.1029/92JB02280
Bry M., White N. (2007). Reappraising elastic thickness variation at oceanic trenches. J. Geophys. Res. 112, 1–30. doi: 10.1029/2005JB004190
Caldwell J. G., Haxby W. F., Karig D. E., Turcotte D. L. (1976). On the applicability of a universal elastic trench profile. Earth Planetscilett 31, 239–246. doi: 10.1016/0012-821X(76)90215-6
Capitanio F. A., Morra G. (2012). The bending mechanics in a dynamic subduction system: Constraints from numerical modelling and global compilation analysis. Tectonophysics 522–523, 224–234. doi: 10.1016/j.tecto.2011.12.003
Chang J. H., Yu H. S., Lee T. Y., Hsu H. H., Liu C. S., Tsai Y. T. (2012). Characteristics of the outer rise seaward of the Manila Trench and implications in Taiwan–Luzon convergent belt, South China Sea. Mar. Geophys. Res. 33, 351–367. doi: 10.1007/s11001-013-9168-6
Chen M., Gao J. Y., Jin X. L., Zhang T. (2004). Using geoid to model seaward lithospheric flexure of the Ryukyu trench. Mar. Geol. Quat. Geol. 24, 55–59. doi: 10.16562/j.cnki.0256-1492.2004.04.008
Chen Y., Li W., Yuan X., Badal J., Teng J. (2015). Tearing of the Indian lithospheric slab beneath southern Tibet revealed by SKS-wave splitting measurements. Earth Planet. Sci. Lett. Lett. J. Devoted Dev. Time Earth Planet. Syst. 413, 13–24. doi: 10.1016/j.epsl.2014.12.041
Chen A., Xu H. H., Ma H., Liu T. W. (2011). Preliminary study of the causes of absence intermediate and deep focus earthquakes in The Manila subduction zone. South China J. Seismol. 31, 98–107. doi: 10.13512/j.hndz.2011.04.013
Cheng Z., Ding W., Faccenda M., Li J. (2019). Geodynamic effects of subducted seamount at the Manila Trench: Insights from numerical modeling. Tectonophys. Int. J. Geotecton. Geol. Phys. Inter. Earth 764, 46–61. doi: 10.1016/j.tecto.2019.05.011
Christensen D. H., Ruff L. J. (1983). Outer-rise earthquakes and seismic coupling. Geophys. Res. Lett. 10, 697–700. doi: 10.1029/GL010i008p00697
Contreras-Reyes E., Osses A. (2010). Lithospheric flexure modelling seaward of the Chile trench: implications for oceanic plate weakening in the Trench Outer Rise region. Geophys. J. R. Astron. Soc 182, 97–112. doi: 10.1111/j.1365-246X.2010.04629.x
Crough S. T. (1983). The correction for sediment loading on the seafloor. J. Geophys. Res. 88, 6449–6454. doi: 10.1029/JB088iB08p06449
Cruciani C., Carminati E., Doglioni C. (2005). Slab dip vs. lithosphere age: No direct function. Earth Planet. Sci. Lett. 238, 298–310. doi: 10.1016/j.epsl.2005.07.025
Dasgupta N. L. C. (2021). Controls of subducting slab dip and age on the extensional versus compressional deformation in the overriding plate. Tectonophys. Int. J. Geotecton. Geol. Phys. Inter. Earth 801, 228716. doi: 10.1016/j.tecto.2020.228716
Defant M. J., Drummond M. S. (1990). Derivation of some modern arc magmas by melting of young subducted lithosphere. Nature 347, 662–665. doi: 10.1038/347662a0
Dickinson W. R., Snyder W. S. (1979). Geometry of subducted slabs related to San Andreas transform. J. Geol. 87, 609–627. doi: 10.1086/628456
Ding W., Sun Z., Dadd K., Fang Y., Li J. (2018). Structures within the oceanic crust of the central South China Sea basin and their implications for oceanic accretionary processes. Earth Planet. Sci. Lett. Lett. J. Devoted Dev. Time Earth Planet. Syst. 488, 115–125. doi: 10.1016/j.epsl.2018.02.011
Eakin D. H., Mcintosh K. D., Van Avendonk H. J. A., Lavier L., Lester R., Liu C. S., et al. (2014). Crustal-scale seismic profiles across the Manila subduction zone: The transition from intraoceanic subduction to incipient collision. J. Geophys. Res. Solid Earth 119, 1–17. doi: 10.1002/2013JB010395
Eduardo C.-R., Jerernias G. (2018). Flexural modeling of the elastic lithosphere at an ocean trench: A parameter sensitivity analysis using analytical solutions. J. Geodyn. 113, 1–12. doi: 10.1016/j.jog.2017.11.004
Fan J., Wu S., Spence G. (2015). Tomographic evidence for a slab tear induced by fossil ridge subduction at Manila Trench, South China Sea. Int. Geol. Rev. 57, 998–1013. doi: 10.1080/00206814.2014.929054
Galgana G., Hamburger M., Mccaffrey R., Corpuz E., Chen Q. (2007). Analysis of crustal deformation in Luzon, Philippines using geodetic observations and earthquake focal mechanisms. Tectonophysics 432, 63–87. doi: 10.1016/j.tecto.2006.12.001
Gao X. (2017). Thermo-mechanics of interplate seismicity at subduction zones. Oceanol. Limnol. Sin. 48, 1235–1243. doi: 10.11693/hyhz20170900233
Gao J., Wu S. G., Yao Y. J., Chen C. X., Song T. R., Wang J. L., et al. (2018). Tectonic deformation and fine structure of the frontal accretionary wedge, northern Manila subduction zone. Chin. J. Geophys. 61, 2845–2858. doi: 10.6038/cjg2018L0461
Geng M., Chen X., Zhang B., Zhao B., Zhang R., Bian D., et al. (2024). The characteristics and distribution of the Moho reflections in the South China Sea Oceanic Basin. Interpretation 12, 1M–T185. doi: 10.1190/INT-2023-0077.1
Gong Z., Li Z., Hu L., Xiong J., Sun C. (2021). Estimation of the effective elastic thickness of the lithosphere in the South China Sea. J. Geod. Geodyn. 41, 572–576. doi: 10.14075/j.jgg.2021.06.004
Hanks T. C. (1971). The Kuril trench - Hokkaido rise system: large shallow earthquakes and simple models of deformation. Geophys. J. R. Astron. Soc 23, 173–189. doi: 10.1111/j.1365-246X.1971.tb01811.x
Harris R. N., Chapman D. S. (1994). A comparison of mechanical thickness estimates from trough and seamount loading in the southeastern Gulf of Alaska. J. Geophys. Res. 99, 9297–9317. doi: 10.1029/93JB03285
Hayes D. E., Lewis S. D. (1984). A geophysical study of the Manila Trench, Luzon, Philippines: 1. Crustal structure, gravity, and regional tectonic evolution. J. Geophys. Res. Atmospheres 89, 9171–9195. doi: 10.1029/JB089iB11p09171
Hayes G. P., Moore G. L., Portner D. E., Hearne M., Flamme H., Furtney M., et al. (2018). Slab2, a comprehensive subduction zone geometry model. Science 362, 58–61. doi: 10.1126/science.aat4723
Heuret A., Lallemand S. (2005). Plate motions, slab dynamics and back-arc deformation. Phys. Earth Planet. Inter. 149, 31–51. doi: 10.1016/j.pepi.2004.08.022
Hoggard M. J., Winterbourne J., Czarnota K., White N. (2017). Oceanic residual depth measurements, the plate cooling model, and global dynamic topography. J. Geophys. Res. Solid Earth JGR 122, 2328–2372. doi: 10.1002/2016JB013457
Hunter J., Watts A. B. (2016). Gravity anomalies, flexure and mantle rheology seaward of circum-Pacific trenches. Geophys. J. Int. 207, 288–316. doi: 10.1093/gji/ggw275
Hyndman R. D., Wang K. (1993). Thermal constraints on the zone of major thrust earthquake failure: The Cascadia Subduction Zone. J. Geophys. Res. Solid Earth 98, 2039–2060. doi: 10.1029/92JB02279
James T. S., Gowan E. J., Wada I., Wang K. (2009). Viscosity of the asthenosphere from glacial isostatic adjustment and subduction dynamics at the northern Cascadia subduction zone, British Columbia, Canada. J. Geophys. Res. Solid Earth 114, 1–13. doi: 10.1029/2008JB006077
Keum J.-Y., So B.-D. (2023). Sediment buoyancy controls the effective slab pull force and deviatoric stress along trenches: Insights from 3D free-subduction model. Tectonophysics 862, 229970. doi: 10.1016/j.tecto.2023.229970
Lester R., McIntosh K., Van Avendonk H. J. A., Lavier L., Liu C. S., Wang T. K. (2013). Crustal accretion in the Manila trench accretionary wedge at the transition from subduction to mountain-building in Taiwan. Earth Planet. Sci. Lett. Lett. J. Devoted Dev. Time Earth Planet. Syst. 375, 430–440. doi: 10.1016/j.epsl.2013.06.007
Levitt D. A., Sandwell D. T. (1995). Lithospheric bending at subduction zones based on depth soundings and satellite gravity. J. Geophys. Res. Solid Earth 100, 379–400. doi: 10.1029/94JB02468
Li C. F., Xu X., Lin J., Sun Z. (2014). Ages and magnetic structures of the South China Sea constrained by deep tow magnetic surveys and IODP Expedition 349. Geochem. Geophys. Geosystems 15, 4958–4983. doi: 10.1002/2014GC005567
Li C. F., Zhou Z., Li J., Chen B., Geng J. (2008). Magnetic zoning and seismic structure of the South China Sea ocean basin. Mar. Geophys. Res. 29, 223–238. doi: 10.1007/s11001-008-9059-4
Liu S., Zhao M., Sibuet J.-C., Qiu X., Wu J., Zhang J., et al. (2018). Geophysical constraints on the lithospheric structure in the northeastern South China Sea and its implications for the South China Sea geodynamics. Tectonophysics 742, 101–119. doi: 10.1016/j.tecto.2018.06.002
Lo C., Lin J., Wu W. (2015). Megathrust earthquake potential of the manila subduction systems revealed by the radial component of seismic moment tensors Mrr. Tao Terrastrial Atmospheric Ocean. Sci. 26, 619–630. doi: 10.3319/TAO.2013.04.29.01(TC)
Maksymowicz A. (2015). The geometry of the Chilean continental wedge: Tectonic segmentation of subduction processes off Chile. Tectonophysics 659, 183–196. doi: 10.1016/j.tecto.2015.08.007
Mason W. G., Moresi L., Betts P. G., Miller M. S. (2010). Three-dimensional numerical models of the influence of a buoyant oceanic plateau on subduction zones. Tectonophysics 483, 71–79. doi: 10.1016/j.tecto.2009.08.021
Masson D. G. (1991). Fault patterns at outer trench walls. Mar. Geophys. Res. 13, 209–225. doi: 10.1007/BF00369150
Mcadoo D. C., Martin C. F. (1984). Seasat observations of lithospheric flexure seaward of trenches. J. Geophys. Res. Solid Earth 89, 3201–3210. doi: 10.1029/JB089iB05p03201
McAdoo D. C., Martin C. F., Poulouse S. (1985). Seasat observations of flexure: Evidence for a strong lithosphere. Tectonophysics 116, 209–222. doi: 10.1016/0040-1951(85)90209-4
McNutt M. K., Menard H. W. (1982). Constraints on yield strength in the oceanic lithosphere derived from observations of flexure. Geophys. J. Int. 71, 363–394. doi: 10.1111/j.1365-246X.1982.tb05994.x
Moore G. F., Bangs N. L., Taira A., Kuramoto S., Pangborn E., Tobin H. J. (2007). Three-dimensional splay fault geometry and implications for tsunami generation. Science 318, 1128–1131. doi: 10.1126/science.1147195
Mukasa S. B., Flower M. F. J., Miklius A. (1994). The Nd-, Sr- and Pb-isotopic character of lavas from Taal, Laguna de Bay and Arayat volcanoes, southwestern Luzon, Philippines: Implications for arc magma petrogenesis. Tectonophysics 235, 205–221. doi: 10.1016/0040-1951(94)90024-8
Naliboff J. B., Billen M. I., Gerya T., Saunders J. (2013). Dynamics of outer-rise faulting in oceanic-continental subduction systems. Geochem. Geophys. Geosystems 14, 2310–2327. doi: 10.1002/ggge.20155
Park J.-O., Tetsuro T., Shuichi K., Phil R. C., Kaneda Y. (2002). Splay fault branching along the Nankai subduction zone. Science 297, 1157–1160. doi: 10.1126/science.1074111
Peng Y., Zhao L. H., Ling Z. L., Li M. J., Hway E. S. (2022). Deflection simulation of the Mariana Trench based on subduction dip angle. Mar. Geol. Front. 38, 23–32. doi: 10.16028/j.1009-2722.2021.213
Piao Q., Zhang B. J., Zhang R. W., Geng M. H., Zhong G. F. (2022). Continent-ocean transition in the northern South China Sea by high quality deep reflection seismic data. Chin. J. Geophys. 65, 2546–2559. doi: 10.6038/cjg2022P0663
Ranalli G. (1994). Nonlinear flexure and equivalent mechanical thickness of the lithosphere. Tectonophysics 240, 107–114. doi: 10.1016/0040-1951(94)90266-6
Ranero C. R., Villaseñor A., Morgan J. P., Weinrebe W. (2005). Relationship between bend-faulting at trenches and intermediate-depth seismicity. Geochem. Geophys. Geosystems 6, 363–373. doi: 10.1029/2005GC000997
Rangin C., Le Pichon X., Mazzotti S., Pubellier M., Chamot-Rooke N., Aurelio M. A., et al. (1999). Plate convergence measured by GPS across the Sundaland/Philippine Sea Plate deformed boundary: the Philippines and eastern Indonesia. Geophys. J. Int. 139, 296–316. doi: 10.1046/j.1365-246x.1999.00969.x
Royden L. H., Husson L. (2006). Trench motion, slab geometry and viscous stresses in subduction systems. Geophys. J. Int. 167, 881–905. doi: 10.1111/j.1365-246X.2006.03079.x
Sajona F. G., Maury R. C., Prouteau G., Cotten J., Schiano P., Bellon H., et al. (2000). Slab melt as metasomatic agent in island arc magma mantle sources, Negros and Batan (Philippines). Blackwell Sci. Pty 9, 472–486. doi: 10.1111/j.1440-1738.2000.00295.x
Sibuet J. C., Yeh Y. C., Lee C. S. (2016). Geodynamics of the South China Sea. Tectonophysics 692, 98–119. doi: 10.1016/j.tecto.2016.02.022
Smith G. L., Mcneill L. C., Wang K., He J., Henstock T. J. (2013). Thermal structure and megathrust seismogenic potential of the Makran subduction zone. Geophys. Res. Lett. 40, 1528—1533. doi: 10.1002/grl.50374
Snyder W. S., Dickinson W. R., Silberman M. L. (1976). Tectonic implications of space-time patterns of Cenozoic magmatism in the western United States. Earth Planet. Sci. Lett. 32, 91–106. doi: 10.1016/0012-821X(76)90189-8
Sun W., Ling M., Yang X., Fan W., Ding X., Liang H. (2010). Ridge subduction and porphyry copper-gold mineralization: An overview. Sci. China Earth Sci. 4, 475–484. doi: 10.1007/s11430-010-0024-0
Turcotte D. L., McAdoo D. C., Caldwell J. G. (1978). An elastic-perfectly plastic analysis of the bending of the lithosphere at a trench. Tectonophysics 47, 193–205. doi: 10.1016/0040-1951(78)90030-6
Walcott R. I. (1970). Flexural rigidity, thickness, and viscosity of the lithosphere. J. Geophys. Res. 75, 3941–3954. doi: 10.1029/JB075i020p03941
Watts A., Talwani M. (1974). Gravity anomalies seaward of deep-sea trenches and their tectonic implications*. Geophys. J. Int. 36, 57–90. doi: 10.1111/j.1365-246X.1974.tb03626.x
Watts A. B., Zhong S. (2000). Observations of flexure and the rheology of oceanic lithosphere. Geophys. J. Int. 855–875. doi: 10.1046/j.1365-246x.2000.00189.x
Xia S., Guo X. W., Huang H. B., Qiu X. L. (2014). Geophysical features of lithosphere and tectonic boundaries in the South China Sea. Chin. J. Geophys. 57, 3957–3967. doi: 10.6038/cjg20141209
Xue Y., Li S. Z., Liu X., Suo Y. H., Dai L. M., Yu S., et al. (2012). Segmentation of subduction system in the eastern South China Sea and dynamics of related basin groups. Mar. Geol. Quat. Geol. 32, 129–147. doi: 10.3724/SP.J.1140.2012.06129
Yang T. F., Lee T., Chen C. H., Cheng S. N., Knittel U., Punongbayan R. S., et al. (1996). A double island arc between Taiwan and Luzon: consequence of ridge subduction. Tectonophysics 258, 85–101. doi: 10.1016/0040-1951(95)00180-8
Yu S. B., Chen H. Y., Kuo L. C. (1997). Velocity field of GPS stations in the Taiwan area. Tectonophysics 274, 41–59. doi: 10.1016/S0040-1951(96)00297-1
Zhan H., Suo Y. H., Zhu J. J., Li S. Z., Wang P. C., Wang G. Z., et al. (2023). Closure mechanism of the South China Sea: Insights from subduction initiation along the Manila Trench. Acta Petrol. Sin. 39, 2569–2582. doi: 10.18654/1000-0569/2023.09.03
Zhang T., Lin J., Gao J. (2011). Interactions between hotspots and the Southwest Indian Ridge during the last 90 Ma: Implications on the formation of oceanic plateaus and intra-plate seamounts. Sci. ChinaEarth Sci. 8, 1177–1188. doi: 10.1007/s11430-011-4219-9
Zhang F., Lin J., Zhan W. (2014). Variations in oceanic plate bending along the Mariana trench. Earth Planet. Sci. Lett. 401, 206–214. doi: 10.1016/j.epsl.2014.05.032
Zhang F., Lin J., Zhou Z. (2019). Intra-trench variations in flexural bending of the subducting Pacific Plate along the Tonga-Kermadec Trench. Acta Ocean. Sin. 38, 10. doi: 10.1093/gji/ggx488
Zhang F., Lin J., Zhou Z., Yang H., Zhan W. (2018a). Intra- and intertrench variations in flexural bending of the Manila, Mariana and global trenches: implications on plate weakening in controlling trench dynamics. Geophys. J. Int. 212, 1429–1449. doi: 10.1093/gji/ggx488
Zhang J., Sun Z., Xu M., Yang H., Zhang Y., Li F. (2018b). Lithospheric 3-D flexural modelling of subducted oceanic plate with variable effective elastic thickness along the Manila Trench. Geophys. J. Int. 215, 2071–2092. doi: 10.1093/gji/ggy393
Zhang J., Xu M., Sun Z. (2018c). Lithospheric flexural modelling of the seaward and trenchward of the subducting oceanic plates. Int. Geol. Rev. 8, 908–923. doi: 10.1080/00206814.2018.1550729
Zhu J., Li S., Sun Z., Li X., Li J. (2017). Crustal architecture and subduction processes along the Manila Trench, Eastern South China Sea. Earth Sci. Front. 24, 341–351. doi: 10.13745/j.esf.yx.2017-3-13
Keywords: flexure, elastic thickness, initial subduction dip angle, subduction zone difference, Manila Trench
Citation: Lu Y, Wang L, Peng Y, Meng D and Lin J (2025) Flexural modeling of the Manila Trench based on subduction dip: comparison of north-south subduction differences. Front. Mar. Sci. 12:1548688. doi: 10.3389/fmars.2025.1548688
Received: 20 December 2024; Accepted: 27 February 2025;
Published: 14 March 2025.
Edited by:
Eun Young Lee, University of Vienna, AustriaReviewed by:
Siti Nur Fathiyah Jamaludin, University of Technology Petronas, MalaysiaByungdal So, Kangwon National University, Republic of Korea
Darko Spahić, University of Belgrade, Serbia
Copyright © 2025 Lu, Wang, Peng, Meng and Lin. This is an open-access article distributed under the terms of the Creative Commons Attribution License (CC BY). The use, distribution or reproduction in other forums is permitted, provided the original author(s) and the copyright owner(s) are credited and that the original publication in this journal is cited, in accordance with accepted academic practice. No use, distribution or reproduction is permitted which does not comply with these terms.
*Correspondence: Lijie Wang, d2xqZTEyMzQ1QDE2My5jb20=; Jiangnan Lin, bGluamlhbmduYW5senVAMTYzLmNvbQ==