 Jipan Qiao1,2
 Guanyu Guo
 Ji An
Ji An- 1State Key Laboratory of Maritime Technology and Safety, Shanghai Ship and Shipping Research Institute Co., Ltd, Shanghai, China
- 2Key Laboratory of Marine Technology Ministry of Communications, PRC, Shanghai Ship and Shipping Research Institute Co., Ltd, Shanghai, China
- 3Shanghai Maritime University, Merchant Marine College, Shanghai, China
Intelligent ship energy efficiency online monitoring systems should possess the capability to monitor a ship’s primary energy-consuming equipment, navigation conditions, and other relevant parameters. In this study, the parameters obtained from engine test data were integrated into the system for verification purposes. The analysis focused on energy distribution and variations in the excess air coefficient under different loading conditions. The calculation results indicate that the proportions of turbocharger absorption power and shaft power increase with an increase in load, whereas the proportions of other losses decrease accordingly. Notably, the excess air coefficient exceeds 2 under each load condition and remains relatively constant after reaching 50% load. These findings suggest that the model meets the criteria for energy consumption monitoring. This methodology enables the pre-installation testing of system operation. Furthermore, this analytical approach facilitates engineers in assessing the engine’s operating state and provides insights for fault diagnosis based on changes in energy consumption distribution. It also empowers developers and managers to comprehend the direction of engine development.
1 Introduction
In accordance with the standards for intelligent ship classification, intelligent ships possess the capability to monitor and analyze energy consumption data in real time (CCS Intelligent Ship Rules, 2025). The distribution and quantitative assessment of energy consumption serve as a robust foundation for the management and optimization of ship energy efficiency. Investigating the measurement of energy consumption distribution within marine engines holds significant importance and practical worth.
Within the specifications for intelligent ship classification, the requirements for online intelligent monitoring are as follows: the energy-efficiency online intelligent monitoring system should possess the capability to monitor the primary energy-consuming equipment and navigation status of the ship. It is tasked with collecting, transmitting, storing, and analyzing data, as well as evaluating and issuing alarms for related parameters, such as energy efficiency and energy consumption. It is noteworthy that energy efficiency, energy consumption, and other pertinent indicators are not explicitly defined but are generally referenced against relevant guidelines. Furthermore, there exist multiple versions of intelligent ship products, all of which are mandated to undergo calculations as stipulated in (Xiaoxiao et al., 2020; Xu et al., 2023).
Gaber et al. (2021) proposed a hybrid system optimization strategy and established an intelligent energy management system for an all-electric ship power system based on the Adaptive Neuro-Fuzzy Inference System (ANFIS). This system effectively enhances energy efficiency (Gaber et al., 2021). Karatuğ et al. (2023) developed a data-driven ANFIS model to monitor and predict ship performance parameters, with the aim of improving ship energy efficiency (Karatuğ et al., 2023). Mateichyk et al. (2023) devised an information system for monitoring and controlling ship power plants, capable of predicting ship technical state parameters (Mateichyk et al., 2023). Cui et al. (2024) created a ship dynamic intelligence monitoring system to oversee navigational characteristics such as speed, position, and course (Cui et al., 2024). Last, Karatuğ et al. (2024) introduced a ship energy efficiency control system that integrates an optimization model with a neural network. This system employs ANN models of varying structures to estimate fuel consumption and enables real-time monitoring of key engine parameters (Karatuğ et al., 2024).
Currently, intelligent ships necessitate the installation of a substantial quantity of diverse sensors to facilitate the measurement of energy consumption (Ang et al., 2017). Consequently, this augmentation leads to an escalation in the costs associated with intelligent ship systems, resulting in a decrement in system reliability. The plethora of sensors significantly elevates the technical proficiency requirements for the crew (Sanfilippo, 2017). Therefore, the advancement of a ship energy consumption system capable of detecting ship energy consumption without an increment in sensor count has emerged as a pivotal concern in the evolution of intelligent ship energy consumption systems.
The targeted vessel employs an integrated electric propulsion system and is furnished with three identical main generators. Prior to system installation, the energy consumption distribution of each main generator under diverse load conditions is computed utilizing data derived from the prime mover test report. This computation allows for the debugging of system parameters prior to system commissioning, thereby facilitating smoother system verification during actual ship testing. The computed results offer a scientific rationale for optimizing ship energy management. Additionally, these results can be utilized by shore-based ship managers when providing management recommendations to ship managers of new vessels.
The power supply of multiple engines, akin to a power grid, necessitates the economic load dispatch of the engines (Kabeyi et al., 2020). Through real-time monitoring and optimization of the power system, the intelligent ship modifies the distribution of power load and the operational parameters of the power system to mitigate energy consumption within the power system (Accetta and Pucci, 2019).
2 Trial data
The target vessel is a novel ship. Upon completion of the system design, the test data are utilized for debugging and validating the system. This section delineates the application of test data within the system. A substantial amount of engine test information exists, and it is of paramount importance to interpret it judiciously and harness it fully.
The engine factory test report is shown in Supplementary Material (Appendix Table 1).
According to the data in Supplementary Material (Appendix Table 1), the following parameters can be extracted:
1. Ambient temperature (temperature of intake air ATE210 in Ambient Data), which can be regarded as atmospheric temperature.
2. Pressurized air temperature and pressure:
Charge air pressure.
Charge air temp. in air receiver.
3. Exhaust gas temperature before and after the supercharger:
Exh.gas temp.bef.TC, A-bank.
Exh.gas temp.aft.TC, A-bank.
4. Temperature and pressure of high-temperature freshwater.
HT water temp, jacket inlet TE401.
HT-water temp.aft.engine TE402.
HT water pressure, jacket inlet PT401.
According to these three values, the heat loss of coolant can be calculated.
3 Mathematical model establishing
This section aims to establish an energy distribution model for the engine across various operational conditions. It furnishes a foundational basis for the subsequent system to accommodate intelligent ship monitoring requirements.
3.1 Input power of the engine
The input power of the engine is
where V is the low thermal energy of heavy oil, Q is the flow rate of heavy oil, JG is a certain time interval of the measurement system.
The energy input by the engine originates from the chemical energy contained within the fuel. This chemical energy is manifested as the heat energy released subsequent to the complete combustion of the fuel. Typically, low-grade heat energy is utilized, as the water present in the exhaust gases predominantly exists in the form of water vapor.
The flow rate is determined by calculating the difference between the measured values obtained from the flowmeter over a specified time interval. The duration of this interval is contingent upon the measurement system and is denoted as JG (an abbreviation derived from the first letter of the Chinese pinyin for the interval). Varying calorific values are assigned for the utilization of heavy oil and light oil, respectively.
3.2 Engine shaft power and generator friction loss power
where Ps is shaft power, Pg is grid power of the unit, η is generator efficiency.
The measured report of the generator primarily focuses on voltage, current, temperature rise, voltage regulation, and other parameters, with less emphasis on measuring its efficiency (Yonghui et al., 2023). Typically, the efficiency of generators ranges from 0.90 to 0.96 (Jun et al., 2023; Qiang et al., 2024), and for this study, a value of 0.94 is adopted. The efficiency of the generator remains relatively constant, and an approximate estimation of one efficiency value will not result in significant errors in other efficiency values of the engine.
This issue is not present in this paper, as the shaft power value from the engine test report is directly utilized. This problem mainly arises in practical operations, specifically in determining how to calculate the engine’s running shaft power within a network.
3.3 Energy consumption calculation of each part
The heat power taken away by the cylinder liner coolant is
where Tout is outlet temperature, Tin is inlet temperature, Qc is coolant flow rate, C is specific heat capacity of coolant.
The jacket-cooling water for the engine is supplied by a centrifugal pump. The flow rate of the freshwater can be determined using the relationship between flow and pressure, allowing the flow value to be calculated based on the pressure value.
The flow rate and specific heat capacity of the exhaust gases can be ascertained. The temperatures of the exhaust gases as they enter and exit the supercharger, as well as the discharge into the atmosphere, can be measured. This facilitates the straightforward calculation of the energy consumed by these two components. Additionally, the calculation process yields the crucial parameter of excess air coefficient.
3.4 Unaccountable-for loss
where Pl is Unaccountable-for losses, Pin is input total power, Ps is engine shaft power, Pt is supercharger absorption of waste gas power, Pb is the power of waste-heat boiler to absorb waste gas energy, Pa is discharge of atmospheric loss power, Pc is coolant away from the power.
The unaccounted-for losses of the engine primarily encompass the energy radiated by the engine into the environment, among other factors.
4 Energy flow in test data
Based on the test data, an analysis and calculation of the energy input from the engine, as well as the energy flow within the engine and its auxiliary equipment, including cooling water loss, are conducted according to the specifications outlined in the ship’s requirements. Consequently, the input power flow of fuel serves as the foundation for the energy consumption analysis of intelligent ship engines. In this section, it is imperative to establish a precise calculation method for the energy input flow of the engine and delineate the functional relationship between the engine and its power output. This, in turn, provides a rationale for the power distribution among the three engines.
The schematic diagram of engine energy consumption distribution is shown in Figure 1.
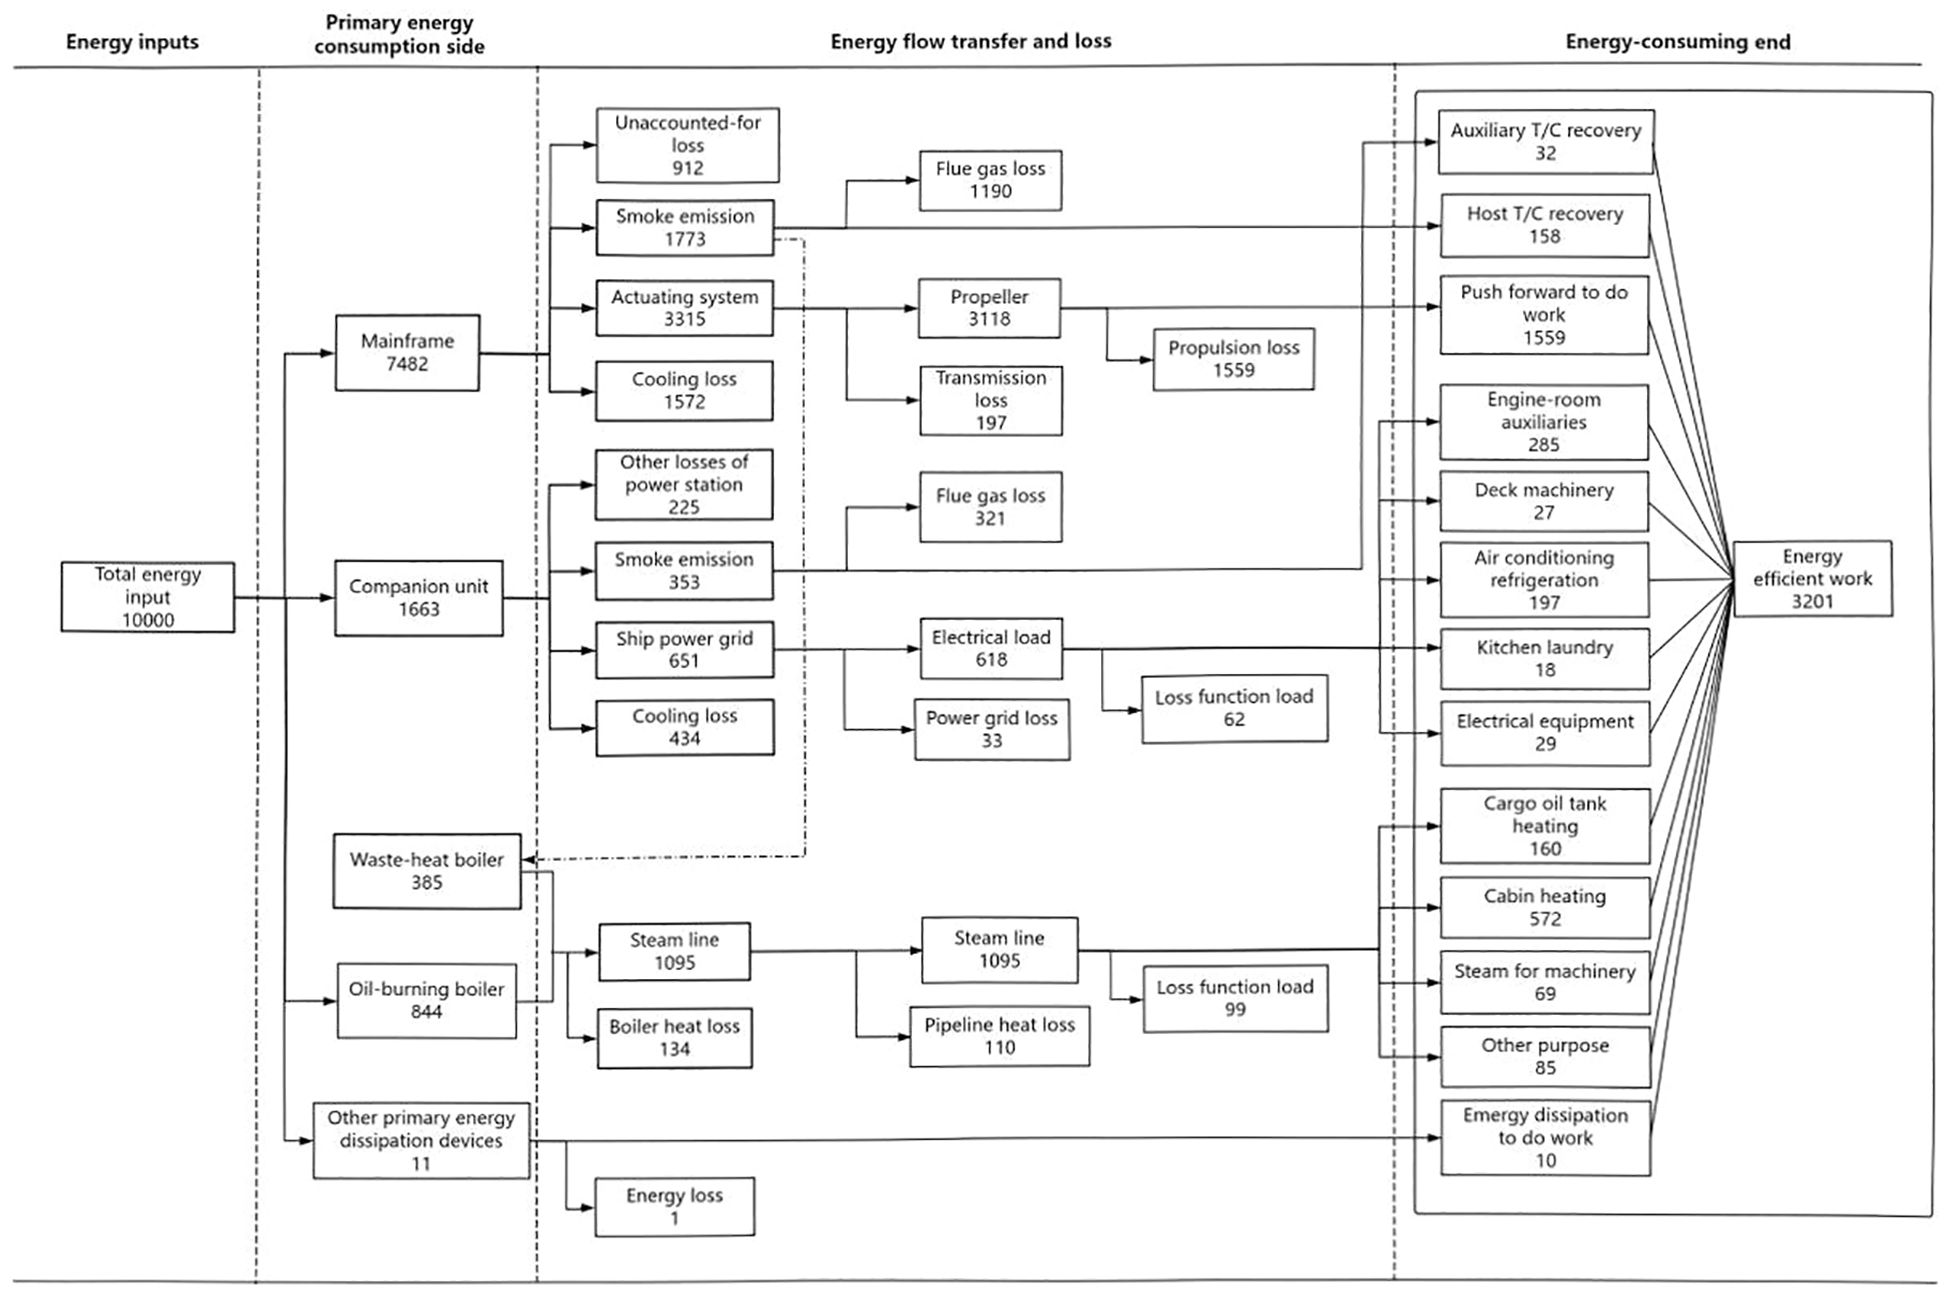
Figure 1. Engine energy consumption distribution diagram. Note: This picture is provided by CCS (China Classification Society) intelligent ship energy consumption system specification. All intelligent ship energy consumption systems should be designed according to this diagram.
According to the requirements depicted in Figure 1, within the framework of the intelligent ship energy consumption monitoring system, the energy input comprises fuel flow and engine power. These parameters facilitate the calculation of both the energy input and its effective output. The relevant values can be extracted from the pertinent information outlined in the test report. Additionally, the fuel consumption rate observed during the test run is detailed in Table 1.
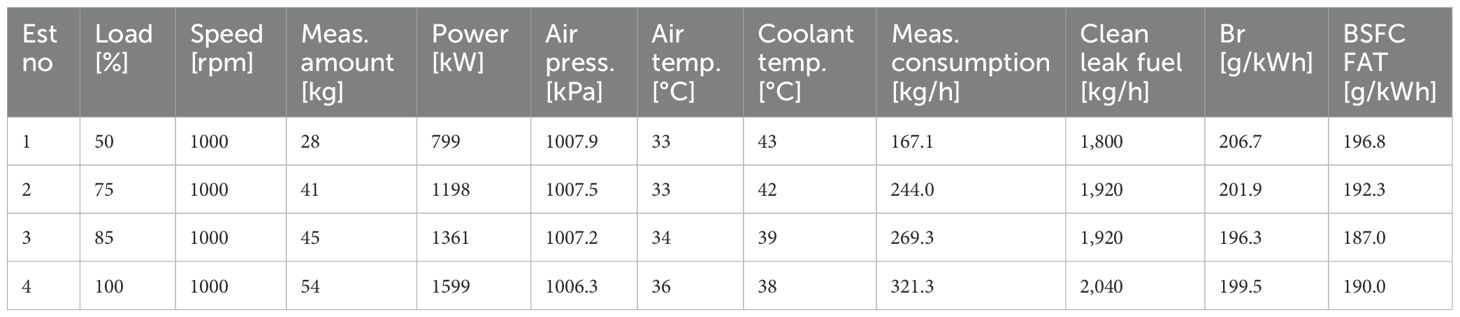
Table 1. Data record of fuel consumption rate in test run test.
There are three ways to express the fuel consumption rate, as shown in Table 2.
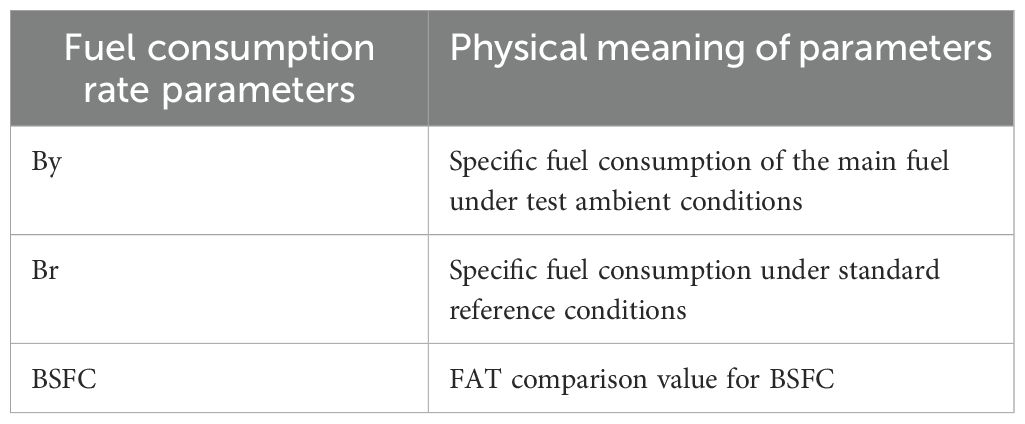
Table 2. Three representation methods of fuel consumption rate.
These three values exhibit slight variations, yet the disparity is minimal. The conversion methodology is outlined in the test report pertaining to these three consumption rate calculation methods.
In the context of diesel engine design, a design condition must be established initially, upon which the design of various flow channels is calculated. The injection timing and ventilation timing are likewise set according to the operating condition. The timing of the electronic fuel injection (EFI) system can be adjusted based on varying power outputs. Certain types of superchargers possess the capability to alter the nozzle angle in response to different loads; however, no engine exists that can modify the size and shape of the air renewal channel and the fuel injection channel. When the engine operates at its design power, the ventilation and combustion processes can attain their optimal working state, resulting in optimal emission characteristics, combustion characteristics, and economic performance. As the difference between the engine power and the design power increases, the various characteristics deteriorate. Various test results have revealed that within a certain range of the engine’s rated power, the relationship between efficiency and power follows a quadratic curve, or in other words, a parabolic curve.
As stated in the engine’s test report, the fuel consumption rate is as shown in the Table 3.
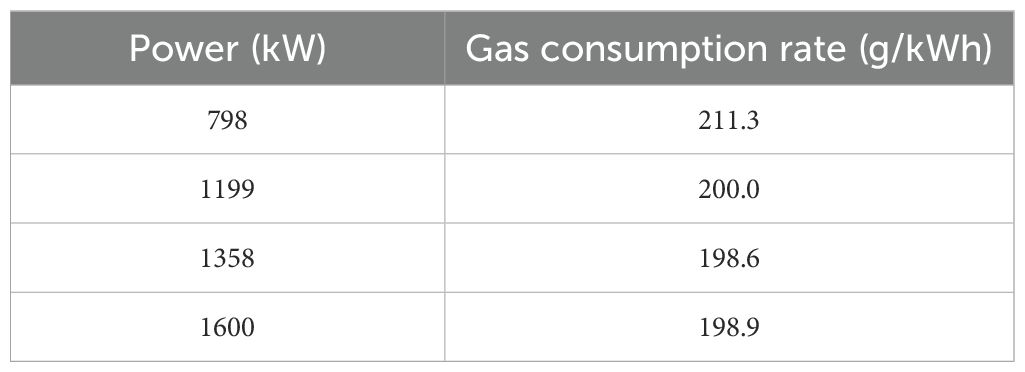
Table 3. Test fuel consumption rate.
The functional relationship between the fuel consumption rate and the power of the diesel engine is fitted as follows: If the fuel consumption rate is Y and the power is x, then
The fitting curve of the relationship between the fuel consumption rate and the power of the engine is shown in Figure 2:
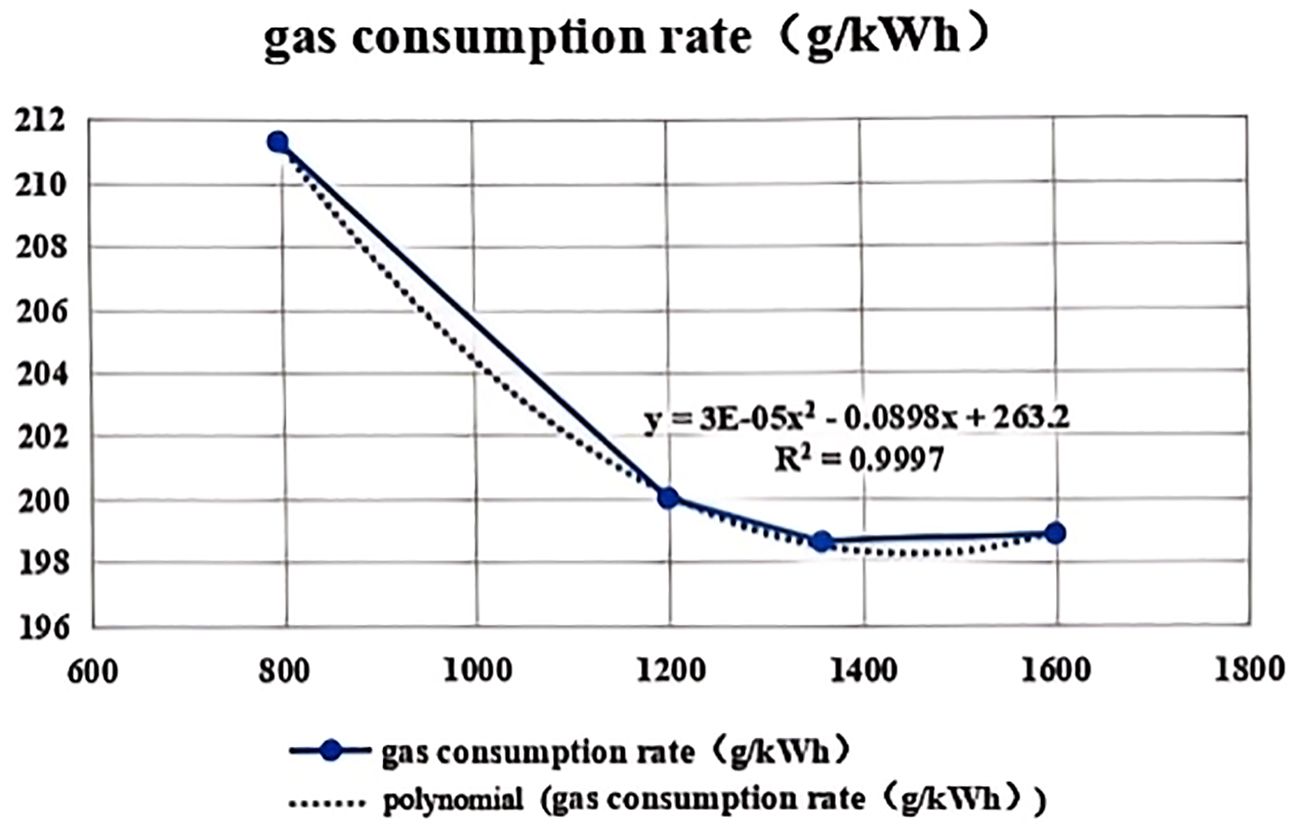
Figure 2. The fitting curve of fuel consumption rate and power of the main generator set engine.
The fitting relationship further validates the accuracy of the quadratic curve relationship hypothesis.
Based on this formulation, at a load of 25%, the engine shaft generates a power of 400 kW, with a fuel consumption rate of 232.08 g/kWh, whereas at a load of 110%, the engine shaft power increases to 1760 kW, and the fuel consumption rate decreases to 198.08 g/kWh.
The test run report delineates the characteristics of the oil, as presented in Table 4:
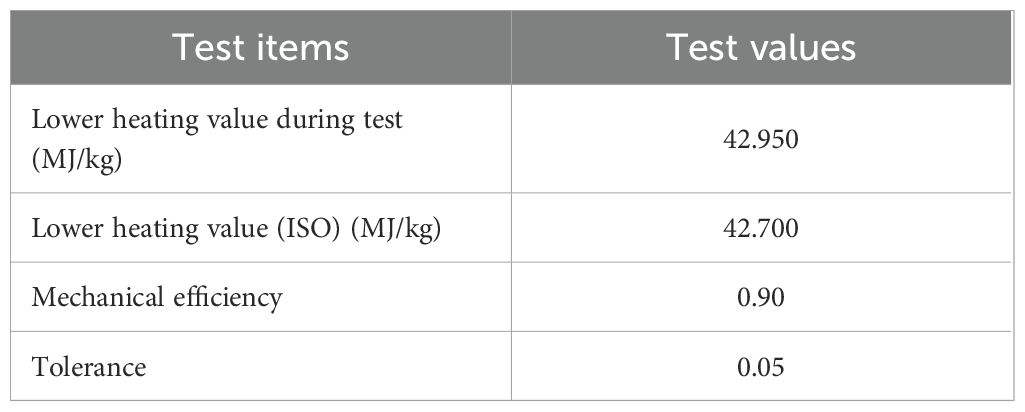
Table 4. Fuel calorific value test values.
5 Data calculation and result analysis
Based on the aforementioned findings, the test data were incorporated into the mathematical model delineated in Section 3. This facilitated the calculation of the engine’s energy consumption distribution during the test run. The resultant data not only validated the accuracy of the model but also established a benchmark for assessing data variations subsequent to a period of engine operation.
The system compares the calculated exhaust gas flow rate with the measured value of the hot wire flowmeter, and the cylinder cooling water flow rate with the measured value of the ultrasonic flowmeter. The error does not exceed 4%. The specific heat value of the exhaust gas was measured offline. The error between this value and the calculated value in this paper is not more than 2%. This shows that the accuracy of the model is acceptable. The comparison results also need to be verified by the actual measurement of multiple ships. This article only makes a qualitative description.
5.1 Calculation of energy consumption distribution
Calculate the energy consumption distribution of various working conditions, as shown in Table 5.
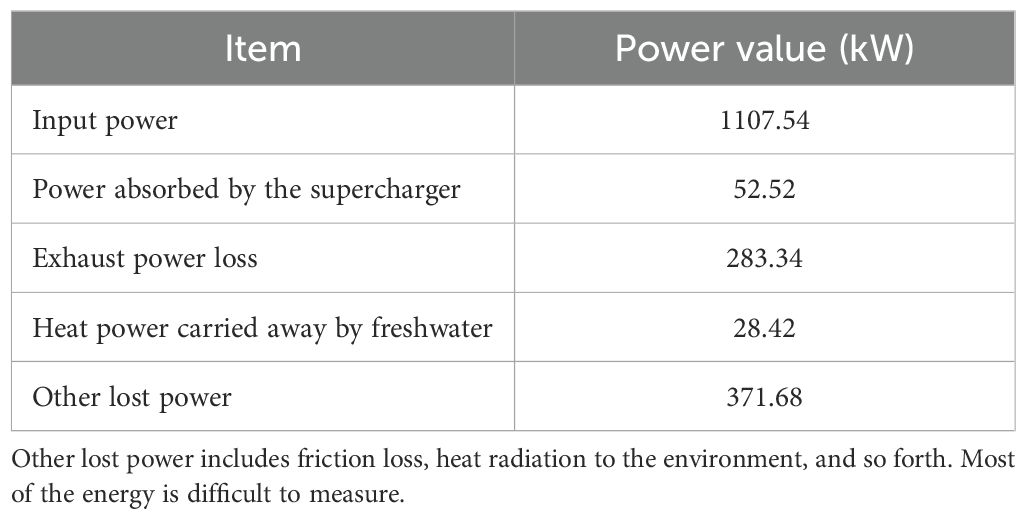
Table 5. Distribution of input power of main generator engine at 25% load.
Taking the test data of 25% load condition, that is, when the shaft power is 400 kW, as an example.
This round does not install an exhaust gas boiler, and consequently, the proportion of power loss discharged into the atmosphere is substantial.
The energy consumption distribution for each test data set at loads of 50%, 75%, 85%, 100%, and 110% is calculated using an identical methodology.
5.2 Engine energy consumption distribution analysis
The energy distribution at various loads is shown in Table 6:
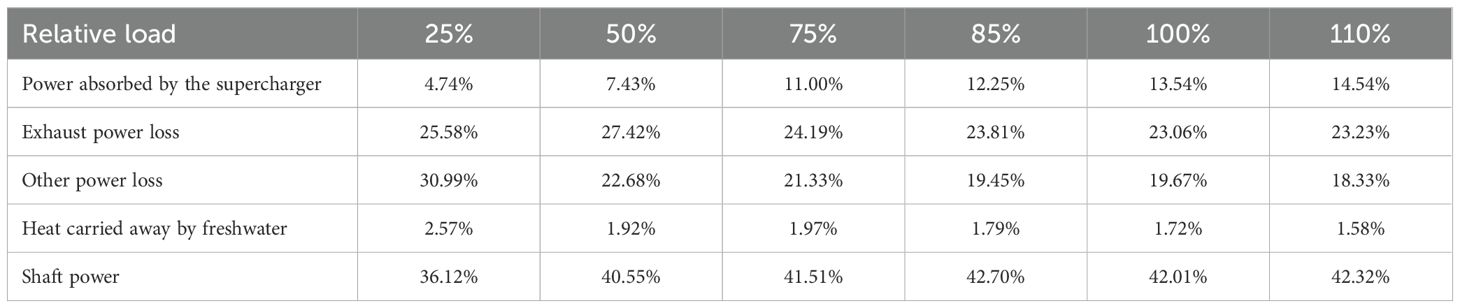
Table 6. Input power distribution table of main generator engine under different loads.
Based on the table, the energy distribution across various loads can be discerned, as illustrated in Figure 3. The allocation of power is categorized into three distinct groups:
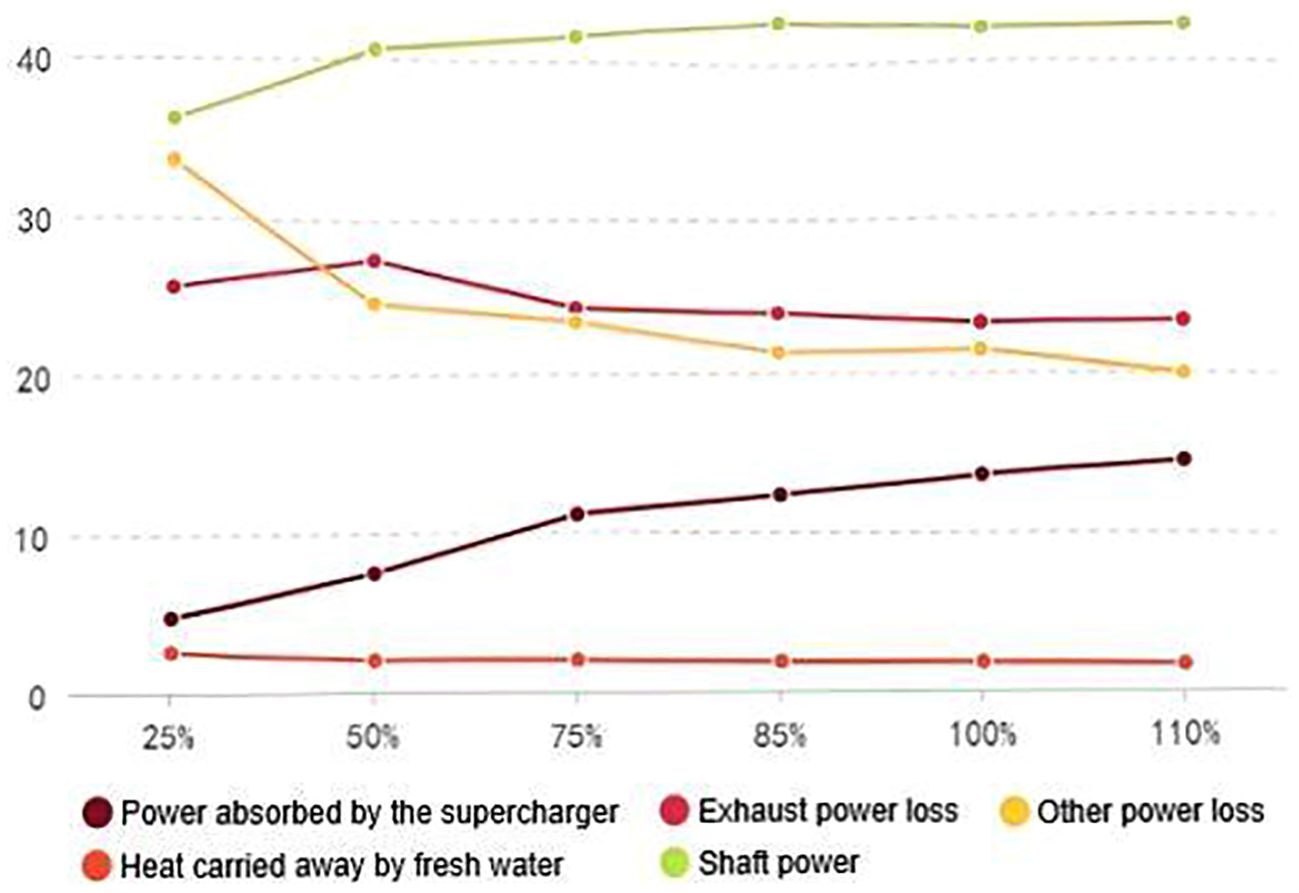
Figure 3. The energy distribution diagram of the engine at different loads.
The first group encompasses scenarios where the proportion of each load remains largely constant. Within this group, the heat carried away by freshwater serves as a typical example. Additionally, exhaust losses beyond 75% load also adhere to this pattern.
The second group comprises situations where the proportion of each load increases in tandem with the load increase. This group includes shaft power and power absorbed by the supercharger. Notably, shaft power remains relatively stable beyond 85% load.
The third category pertains to a situation where the proportion of each load diminishes as the load increases. This is categorized under other losses.
Initially, the augmentation in load is accompanied by an escalation in the proportion of supercharger absorption power, further substantiating the conclusion that supercharger absorption power correlates positively with an increase in load.
5.3 Calculation of excess air coefficient
The intake volume flow rate is calculated based on the displacement speed per revolution. Subsequently, the inlet flow is determined according to the inlet temperature and pressure. Assuming complete fuel combustion, the exhaust gas flow can be derived as the summation of the intake flow and fuel flow.
The air required for the complete combustion of fuel is intricately linked to the composition of the fuel. Depending on the flow rate and type of fuel, the airflow necessary for combustion can be ascertained. Furthermore, by analyzing the flow rate and actual air intake, the excess air coefficient of the engine can be computed.
The product resultant from the complete combustion of fuel varies based on the fuel type and can be estimated using an empirical formula. The exhaust gas consists of the products of the complete combustion of fuel oil and the residual air. The specific heat capacity of the exhaust gas is calculated using an empirical formula that corresponds to the excess air coefficient and fuel type. Additionally, the power released by the exhaust gas in the supercharger, flue, and exhaust gas boiler is calculated based on the specific heat capacity of the exhaust gas, its flow rate, and the temperature change of the exhaust gas.
This methodology eliminates the need for the installation of additional sensors. The calculation accuracy is minimal when compared to the measurement data obtained from sensors.
5.4 Analysis of excess air coefficient
The excess air coefficient of the engine at each load is shown in the Table 7.
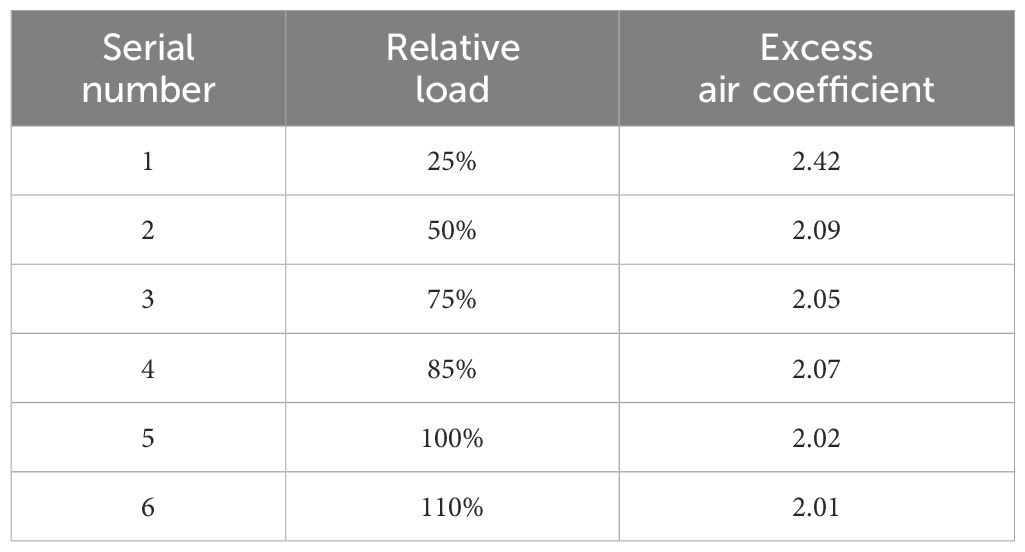
Table 7. Engine excess air coefficient at various loads.
The excess air coefficient denotes the ratio of actual air supplied to the theoretical air required for fuel combustion. It serves as a crucial parameter that mirrors the proportion of fuel to air, typically represented by the symbol “λ.” An excess air coefficient greater than 1 signifies that the actual air supplied exceeds the theoretical amount, aimed at ensuring complete combustion of the fuel. Nevertheless, an excessively large or small excess air coefficient can adversely affect combustion. Various combustion equipment possesses its optimal excess air coefficient value. Based on classical diesel engine theory, the excess air coefficient typically ranges between 0.85 and 1.2. Currently, due to heightened engine emission standards, the excess air coefficient is progressively increasing. The measured excess air coefficient in this instance has surpassed 2.
According to classical diesel engine theory, the output power of the supercharger augments with the augmentation of engine power, with the former increasing at a faster rate than the latter. This results in the output of supercharged air being greater than the air required by the engine under high load conditions. The former assertion is corroborated by the measured results from this instance. However, the latter has yet to be verified. Refer to the calculation results presented in Section 5.2, the relationship diagram of Figure 4 is obtained.

Figure 4. Excess air coefficient-relative load diagram.
Observations indicate that the excess air coefficient continues to decrease as the load increases. Specifically, at a load of 25%, the excess air coefficient is notably higher, potentially attributed to the activation of the auxiliary fan at this particular load level. Beyond 50% of the load, the excess air coefficient remains relatively stable before experiencing a slight decline.
The underlying cause of this phenomenon may lie in the optimized flow characteristics of the supercharger, resulting in improved output characteristics and better engine compatibility. Notably, the most significant improvement can be attributed to the enhancement of the impeller profile of the supercharger compressor.
6 Conclusions
The relationship between engine efficiency and power exhibits a parabolic nature. Determining the optimal number of engines to operate under varying working conditions is a crucial task for ship engine management personnel in maintaining ship efficiency. Based on the analysis presented in the second section, alongside the actual operating conditions of the ship, turbine management personnel can devise a strategy to achieve an economically conformal distribution management approach.
The amount of energy consumed by the exhaust gases within the turbocharger is intimately linked to the operating state of both the turbocharger turbine and the compressor. On vessels equipped with exhaust gas boilers, a comparison between the energy consumption and the exhaust gas energy obtained provides insights into the operational status of the exhaust gas boiler, including flue flow resistance and heat transfer thermal resistance. This relates to pollution on the flue side of the exhaust gas boiler and the structure of the water side. The excess air ratio is tightly correlated with the engine’s operating condition and efficiency. Classical textbooks often delve into these discussions, and theoretically, engineers should master the corresponding analysis methods. As engineers become more familiar with the system, their utilization of these data expands, which hinges on the accumulation of practical experience.
Drawing from engine test data and leveraging the functionality of the intelligent ship energy consumption monitoring system, an analysis is conducted on the energy consumption distribution of the new ship’s engine and the calculated results of intermediate parameters. This analysis offers a methodology for validating the intelligent ship energy consumption monitoring system. The calculation results reveal the following:
1. The mathematical model satisfies the energy consumption monitoring requirements for intelligent ships stipulated by the China Classification Society. Practical ship installation has proven the model’s robust performance.
2. The model provides intermediate variables such as the excess air coefficient, aiding ship management personnel and shore-based management in analyzing engine operating conditions.
3. As the engine load increases, the energy consumption distribution across each link undergoes changes. Marine managers should assess the engine’s running state and perform fault diagnosis based on the variation in these data and the rate of change.
4. The model is employed to compute the prime mover test data for the main generator set. It is found that the excess air coefficient exceeds 2, indicating that the machine utilizes oxygen-enriched combustion technology to enhance emission performance. Significant advancements have been made in its turbocharger output characteristics and engine matching optimization technology.
In response to this design change, engine managers should scrutinize the engine’s operating parameters. They must adapt to the management shifts resulting from the evolution of engines towards both economy and environmental friendliness. Currently, the turbine management community should consolidate experience in this field and propose management practices tailored for this type of engine.
The theoretical calculation of the system incorporates numerous assumptions. For instance, fluid leakage is not considered in flow calculations, the mixing of fresh and waste gases is overlooked, and a simplified empirical formula is adopted for waste gas composition. In the next phase, the system’s mathematical model will be upgraded through the incorporation of various precise sensors and artificial intelligence algorithms.
Data availability statement
The original contributions presented in the study are included in the article/Supplementary Material. Further inquiries can be directed to the corresponding author.
Author contributions
JQ: Writing – original draft. GG: Writing – original draft. JA: Writing – review & editing. GW: Writing – review & editing.
Funding
The author(s) declare that no financial support was received for the research and/or publication of this article.
Conflict of interest
Author JQ was employed by the company Shanghai Ship and Shipping Research Institute Co., Ltd.
The remaining authors declare that the research was conducted in the absence of any commercial or financial relationships that could be construed as a potential conflict of interest.
Generative AI statement
The author(s) declare that no Generative AI was used in the creation of this manuscript.
Publisher’s note
All claims expressed in this article are solely those of the authors and do not necessarily represent those of their affiliated organizations, or those of the publisher, the editors and the reviewers. Any product that may be evaluated in this article, or claim that may be made by its manufacturer, is not guaranteed or endorsed by the publisher.
Supplementary material
The Supplementary Material for this article can be found online at: https://www.frontiersin.org/articles/10.3389/fmars.2025.1551192/full#supplementary-material
Glossary
Pin: input total power
PS: shaft power
Pc: coolant away from the power
Pl: unaccountable-for losses
Pt: supercharger absorption of waste gas power
Pb: the power of waste-heat boiler to absorb waste gas energy
Pa: discharge of atmospheric loss power
Pg: grid power of the unit
V: the low thermal energy of heavy oil
Q: the flow rate of heavy oil
JG: a certain time interval of the measurement system
η: generator efficiency
Tout: outlet temperature
Tin: Inlet temperature
Qc: coolant flow rate
C: specific heat capacity of coolant
References
Accetta A. and Pucci M. (2019). Energy management system in DC micro-grids of smart ships: Main gen-set fuel consumption minimization and fault compensation. IEEE Trans. Industry. Appl. 55, 3097–3113. doi: 10.1109/TIA.28
Ang J. H., Goh C., Saldivar A. A. F., and Li Y. (2017). Energy-efficient through-life smart design, manufacturing and operation of ships in an industry 4.0 environment. Energies 10, 610. doi: 10.3390/en10050610
Cui B., Wang C., Wu Y., Zhu C., Lin J., and Yang T. (2024). Intelligent monitoring of marine vessel dynamics based on data mining. Ocean. Eng. 313, 119387. doi: 10.1016/j.oceaneng.2024.119387
Gaber M., El-Banna S. H., El-Dabah M., and Hamad M. S. (2021). Intelligent Energy Management System for an all-electric ship based on adaptive neuro-fuzzy inference system. Energy Rep. 7, 7989–7998. doi: 10.1016/j.egyr.2021.06.054
Jun L., Guofeng L., and Jiarui F. (2023). Field efficiency test of 500m head class pelton hydro-turbine generator unit. Northwest. Hydropower. 06), 98–103. doi: 10.3969/j.issn.1006-2610.2023.06.016
Kabeyi M. J. B., Oludolapo A. O., and Teresa H. (2020). “Performance analysis of diesel engine power plants for grid electricity supply,” in the 31st annual Southern African institute for Industrial Engineering conference, South Africa, 5th, Vol. 31. 236–250.
Karatuğ Ç., Tadros M., Ventura M., and Soares C. G. (2023). Strategy for ship energy efficiency based on optimization model and data-driven approach. Ocean. Eng. 279, 114397. doi: 10.1016/j.oceaneng.2023.114397
Karatuğ Ç., Tadros M., Ventura M., and Soares C. G. (2024). Decision support system for ship energy efficiency management based on an optimization model. Energy 292, 130318. doi: 10.1016/j.energy.2024.130318
Mateichyk V., Gritsuk I., Smieszek M., Ghita B., Chernenko V., and Polishchuk O. (2023). Information system for monitoring of a ship power plant and prediction of technical condition. Transport. Res. Proc. 74, 1179–1186. doi: 10.1016/j.trpro.2023.11.259
Qiang M., Yong-sheng J., and Guo-xiang W. (2024). The study of efficiency test for large capacity permanent magnet shaft generator system. J. Jiangsu. Shipping. Coll. 23, 20–26. doi: 10.3969/j.issn.2097-0358.2024.02.004
Sanfilippo F. (2017). A multi-sensor fusion framework for improving situational awareness in demanding maritime training. Reliabil. Eng. Syst. Saf. 161, 12–24. doi: 10.1016/j.ress.2016.12.015
Xiaoxiao S., Jipan Q., Rongzon L., Yiyan W., and Yanfei Z. (2020). Distribution of energy consumption and development of assistant computation system for marine main engine. Shipbuilding. China 61, 150–156. doi: 10.3969/j.issn.1000-4882.2020.01.015
Xu W., Qu R., Xue G., Xu M., Zhu X., Liu Z., et al. (2023). State-of-the-art and development trend of intelligent ship system. Ship. Boat. 34, 46. doi: 10.19423/j.cnki.31-1561/u.2023.04.046
Keywords: intelligent ship, energy monitoring system, excess air coefficient, energy consumption distribution, energy management
Citation: Qiao J, Guo G, An J and Wu G (2025) Research on measurement and management of energy consumption distribution of ship engines. Front. Mar. Sci. 12:1551192. doi: 10.3389/fmars.2025.1551192
Received: 24 December 2024; Accepted: 06 May 2025;
Published: 03 June 2025.
Edited by:
Ailong Fan, Wuhan University of Technology, ChinaCopyright © 2025 Qiao, Guo, An and Wu. This is an open-access article distributed under the terms of the Creative Commons Attribution License (CC BY). The use, distribution or reproduction in other forums is permitted, provided the original author(s) and the copyright owner(s) are credited and that the original publication in this journal is cited, in accordance with accepted academic practice. No use, distribution or reproduction is permitted which does not comply with these terms.
*Correspondence: Ji An, YW5qaUBzaG10dS5lZHUuY24=