Abstract
With the deepening development of the new round of technological revolution, marine new quality productive forces (MNQPF), as a key driver for promoting the high-quality development of China's marine economy, exhibit significant regional disparities in coastal areas. These disparities hold critical implications for formulating scientifically grounded regional development strategies. Based on the three constituent elements of Marxist productive forces, this study employs the Technique for Order Preference by Similarity to Ideal Solution (TOPSIS) entropy method, Gini coefficient, and kernel density estimation to analyze the spatial-temporal evolution of MNQPF levels across China's coastal provinces using panel data from 2012 to 2021. The findings reveal:(1) China's MNQPF has shown an upward trend, yet its overall level remains relatively low;(2) Regional imbalances persist, with the Eastern Marine Economic Circle outperforming the Southern and Northern counterparts. Regional disparities primarily stem from inter-regional differences and super-variable density;(3) Spatial heterogeneity characterizes MNQPF development, manifesting as "balanced growth in central regions vs. uneven development in northern and southern areas." In this regard, relevant discussion recommendations are put forward: (1) The Eastern Marine Economic Circle should leverage technological spillover effects to extend high-end marine industries northward to the Bohai Rim Economic Circle and southward to the Beibu Gulf Economic Zone;(2) The Northern Marine Economic Circle should advance green transformation of "marine + heavy industry" through port-economic belt construction under integrated land-sea development strategies;(3) The Southern Marine Economic Circle ought to enhance cross-border marine cooperation by capitalizing on its role as a "Belt and Road" hub, while strengthening Guangdong's radiating influence on neighboring provinces.
1 Introduction
In 2024, China’s gross oceanic product (GOP) reached 10.5438 trillion yuan, representing a year-on-year growth of 5.9% and accounting for 7.8% of the gross domestic product (GDP). As an integral part of China’s economic development, the marine economy has become a significant growth pole for the national economy (Li et al., 2022). The report of the 20th National Congress of the Communist Party of China emphasizes that building a strong marine country is an integral component and important task of China’s modernization (Wang H., 2024). High-quality development of the marine economy is a pattern achieved by taking innovation as the driving force in the process of marine exploitation and production, adhering to the concept of green development, reasonably exploiting marine resources, and continuously expanding the scale of opening up of coastal cities, thereby realizing balanced development of various marine systems (Sha et al., 2024). Meanwhile, the high-quality development of China’s marine economy still faces issues of regional imbalance (Xiao et al., 2024). Therefore, how to achieve high-quality development in the marine economy has become a pressing issue of our time. In September 2023, General Secretary Xi proposed the concept of “new-quality productive forces” for the first time. Centered on innovation, it aims to accelerate the transformation of the economic growth model and foster new-quality productive forces. Marine new-quality productive forces, as a subset of new-quality productive forces, not only share the common characteristics inherent in the evolutionary patterns of new-quality productive forces but also exhibit heterogeneous features stemming from the unique attributes of the marine industry. They possess both the overarching characteristics of dynamic evolution under the construction of a unified national market and the differential features arising from competitive and cooperative behaviors among coastal regions. The emergence and development of marine new-quality productive forces are inextricably linked to marine scientific and technological innovation. To expedite their development, it is imperative to adhere to the formation laws of marine new-quality productive forces, align with their evolutionary trends, and establish a long-term mechanism for nurturing them. Currently, while preliminary progress has been made in domestic academic research on new-quality productive forces, there has been relatively limited study on marine new-quality productive forces, which is mainly manifested in the following aspects:
-
Research related to the connotation of new-quality productive forces. Zhang and Pu (2023) were the first to propose a definition of new-quality productivity, arguing that new-quality productivity transcends traditional production methods, is dominated by scientific and technological innovation, better meets the requirements of high-quality development, and more fully reflects the characteristics of integrated and cross-disciplinary development. Subsequently, Zhou and Xu (2023) built upon this foundation to propose that new-quality productivity represents a leap in traditional productivity, a new type of productivity dominated by scientific and technological innovation that achieves breakthroughs in disruptive technologies to transcend traditional productivity. Yao and Zhang (2024), on the other hand, suppose that new-quality productivity refers to the reintegration and optimization of production methods, production relations, and production factors through the introduction of innovative technologies, optimization of management mechanisms, and improvement of organizational methods, with the same resource input, to achieve more efficient, flexible, and sustainable production. In marine-related fields, scholars have also made preliminary conceptual definitions of “marine new-quality productivity.” For example, Yu et al. (2024) argue that the core essence of the transformation and leap in marine new-quality productivity is concentrated in the two dimensions of “new” and “quality,” emphasizing “promoting novelty through quality” and “leading quality with novelty.” Ji et al. (2024) propose that marine new-quality productivity is a brand-new concept of productivity, referring to the construction of new marine production capacity and development models dominated by innovative technology and management models. Research on marine productivity levels abroad. Ceccaldi et al. (2015) reviewed the impacts of natural and anthropogenic factors on coastal and marine ecosystems, and explored marine productivity, disturbances, and the resilience of social-ecological systems. Currently, there are various methods used to measure and study marine productivity. Marra et al. (2020) employed 14C tracer technology to assess photosynthesis by measuring the assimilation of inorganic 14C. Additionally, Johnson and Bif (Marra et al., 2020) utilized Argo oxygen measurements to constrain the net primary productivity of the global ocean. Cook (Marra et al., 2020) applied autonomous instruments to differentiate the impacts of climate change on marine food webs. Fermepin et al. (2024) proposed that marine primary productivity is a critical yet often overlooked factor in global ocean conservation efforts. Greater consideration should be given to marine primary productivity in global ocean conservation priority assessments to maintain the functions of marine ecosystems, protect biodiversity, and address climate change.
-
Research on the measurement of China’s new-quality productivity level has been conducted. The selection of measurement indicators mainly focuses on the following two aspects. Firstly, based on the three essential components of productivity (laborers, objects of labor, and means of labor), a new-quality productivity indicator system is constructed. For example, Wang (Wang J., 2024) built an indicator system from these three components and concluded that China’s new-quality productivity generally shows an increasing trend but with significant spatio-temporal differences. Ding et al. (2024) assumed that the development levels of the three essential components of new-quality productivity all show an increasing trend, with consistent development trends among the national, eastern, and central regions. However, the new-quality means of labor in the western region peaked in 2016 and began to decline thereafter. Secondly, measurements are made from other aspects. For instance, Hu and Liu (2024)constructed an indicator system based on three indicators: new technologies, new economies, and new business forms. They held that the development level of new-quality productivity in various regions of China generally shows an upward trend, with significant differences among provinces. In terms of measurement methods, domestic scholars mostly use methods such as the entropy weight-TOPSIS (Technique for Order Preference by Similarity to Ideal Solution) method, Gini coefficient, kernel density estimation, spatio-temporal convergence model, Moran’s I, and spatial Markov chain (Gong and Liu, 2024; Jin et al., 2024; Lei, 2024; Li et al., 2024; Wang and Wang, 2024) to measure the development level of China’s marine new-quality productivity. In marine-related fields, Ye et al. (2024) also constructed an indicator system for China’s marine new-quality productivity level based on the new three essential components. They maintained that the overall level of China’s marine new-quality productivity is not high, with imbalances and differentiation characteristics. Gu et al. (2024) constructed an indicator system for marine new-quality productivity from four aspects: scientific and technological productivity, green productivity, digital productivity, and open productivity. They considered that the distribution center of China’s marine new-quality productivity development shifts towards the southwest, with a steady improvement in the overall development level, and polarization phenomena exist in all regions. Liang et al (Liang et al., 2025), based on a systematic review of the interaction mechanism between new-quality productivity and high-quality marine economic development, used multiple statistical analysis methods such as benchmark regression models, multiple mediation effect models, and spatial Durbin models to deeply analyze the mechanism and spatial effects of new-quality productivity enabling high-quality marine economic development. Zhao et al. (2022) employed the entropy weight method and the TOPSIS model to assess the sustainable development of Chinese islands. Du and Gao (2020) evaluated the ecological security of marine ranches in Yantai City, based on the AHP (Analytic Hierarchy Process)-entropy weight method and the TOPSIS approach.
This study posits that marine new-quality productive forces can be defined as advanced productive forces spurred by revolutionary breakthroughs in marine resource development and utilization technologies, innovative allocation of production factors, and in-depth transformation and upgrading of marine industries. They are characterized by highly skilled laborers in the marine sector, advanced technologies and tools for marine resource development and utilization, superior marine resources, and efficient coordination among various elements, aiming to promote high-quality development of marine industries. In recent years, what has been the development trend of the overall marine new-quality productive forces in China? And what about the development trend of marine new-quality productive forces in various coastal regions? Can the development of marine new-quality productive forces in China’s coastal regions achieve balanced growth? If not, what are the sources of regional disparities, and what are the spatiotemporal characteristics of these disparities? In summary, based on panel data from 2012 to 2021 across 11 coastal provinces (autonomous regions, and municipalities) in China, this study constructs a comprehensive evaluation index system aligned with the characteristics of marine new-quality productive forces. It conducts an in-depth analysis of the spatiotemporal evolution characteristics of marine new-quality productive forces in different coastal regions of China and explores the underlying causes of regional disparities along the coast. The study aims to provide valuable insights for narrowing regional gaps and promoting coordinated development among coastal regions, thereby contributing to the realization of high-quality development of China’s marine economy.
2 Methods and data
2.1 Measurement methods
2.1.1 Measurement of China’s marine new quality productivity level
2.1.1.1 Marine new quality productivity index construction
The new quality productivity in the marine sector fundamentally encompasses the leap in optimization and combination of laborers, means of labor, and objects of labor. Firstly, as the most critical element in productivity, the new quality productivity sets higher requirements for the skills and knowledge of laborers. Secondly, the means of labor serve as the core driving force for the new quality productivity in the marine sector. Thirdly, the expanding scope of objects of labor broadens the impact of the new quality productivity in the marine sector (Xie and Li, 2024). Drawing on the research results of Wang (Wang J., 2024) and Ye et al (Ye et al., 2024), and based on the Marxist theory of the three essential components of productivity and the connotative characteristics of marine new-quality productivity, this study constructs an evaluation indicator system for China’s marine new-quality productivity level from three dimensions: new-type laborers, new-type objects of labor, and new-type means of labor, as shown in Table 1.
Table 1
| Target level | First-level indicator | Second-level indicator | Third-level indicator | Instruction for indicator calculation | Attribute |
|---|---|---|---|---|---|
| New Forms of Marine Productivity | New Type of Laborers | Skills of Laborers | Education Level | Years of Education per Capita in Coastal Areas | + |
| Structure of Human Capital | Number of University Students Majoring in Marine-related Fields/Total Population | + | |||
| Labor Productivity | Per Capita Output Value | GDP of Coastal Areas/Total Population of the Regions | + | ||
| Per Capita Income | Per Capita Wage in Coastal Areas | + | |||
| New Type of Labor Objects | New Forms of Industries | Proportion of Strategic Emerging Industries | Value-added of Emerging Strategic Industries/GDP | + | |
| Future Industries | Number of Robots/Total Population | + | |||
| Ecological Environment | Green and Environmental Protection | Forest Coverage Rate | + | ||
| Expenditure on Environmental Protection/Government Public Finance Expenditure | + | ||||
| Pollutant Emission | Sulfur Dioxide Emissions/GDP | – | |||
| Wastewater Discharges/GDP | – | ||||
| Generation of General Industrial Solid Waste/GDP | – | ||||
| Industrial Waste Treatment | Industrial Wastewater Treatment Facilities | + | |||
| Industrial Waste Gas Treatment Facilities | + | ||||
| New Type of Means of Labor | Means of Material Production | Proportion of Revenue from Information Technology Services in Coastal Areas | Revenue from Information Technology Services in Coastal Areas/GDP | + | |
| Length of Long-distance Optical Cable per Unit in Coastal Areas | Length of Long-distance Optical Cable per Unit in Coastal Areas | + | |||
| Intangible Means of Material Production | Number of Patents per Capita | Number of Authorized Marine Patents/Total Population | + | ||
| R&D (Research and Development) Investment | Expenditure on R&D by Marine Scientific Research Institutions/GDP | + | |||
| Enterprise Digitization | The Level of Enterprise Digitization in Coastal Areas1 | + |
Evaluation indicator system for marine new-quality productivity.
Based on the indicator system listed in Table 1, the construction of a comprehensive evaluation indicator system for China’s marine new-quality productivity level is elaborated as follows:
-
New-type laborers are the core driving force behind the development of marine new-quality productivity. This study selects four indicators to measure new-type laborers from the dimensions of laborer skills and labor productivity: education level, human capital structure, per capita output value, and per capita income. Specifically, the education level is measured by calculating the average years of education per capita in coastal areas, the human capital structure is measured by the proportion of college students majoring in marine-related fields to the total population, the per capita output value is assessed by the proportion of coastal area GDP to the total regional population, and the per capita income is measured by the average wage in coastal areas.
-
New-type objects of labor are directly related to the enhancement of new-quality productivity (Zhang and Wang, 2025). This study selects five indicators from the dimensions of new-quality industries and ecological environment: the proportion of strategic emerging industries, future industries, green environmental protection, pollutant emissions, and industrial waste treatment. Among them, the added value of new strategic industries and the number of robots are important criteria for judging the transformation of traditional industries into new-quality industries. Therefore, the proportion of strategic emerging industries is measured by the ratio of their added value to GDP, and future industries are measured by the ratio of the number of robots to the total population. Green environmental protection is measured by forest coverage rate and the proportion of environmental protection expenditures to government public financial expenditures. Sulfur dioxide, wastewater, and industrial solid waste emissions are important perspectives for assessing the quality of ecological environment development. Pollutant emissions are measured by the ratios of sulfur dioxide emissions, wastewater emissions, and general industrial solid waste generation to GDP, respectively. Industrial waste treatment is measured by two indicators: industrial wastewater treatment facilities and industrial waste gas treatment facilities.
-
New-type means of labor serve as the primary driving force for the development of new-quality productivity. This study selects five indicators from the dimensions of material means of production and immaterial (or intangible) means of production: the proportion of information technology service revenue in coastal areas, the length of long-distance optical fiber cables per unit in coastal areas, the number of patents per capita, Research and Development (R&D) investment, and enterprise digitization. Specifically, the level of material means of production in a region is reflected by the proportion of information technology service revenue to GDP in coastal areas and the length of long-distance optical fiber cables per unit in coastal areas. R&D expenditure and the level of enterprise digitization, along with the number of marine patents, help to understand the degree of technological innovation activity and the efficiency of innovation conversion. Therefore, this study uses three indicators to measure immaterial means of production: the proportion of authorized marine patents to the total population, the proportion of R&D expenditure by marine scientific research institutions to GDP, and the level of enterprise digitization in coastal areas.
2.1.1.2 Weight determination - TOPSIS-entropy weight method
The combination of the Analytic Hierarchy Process (AHP) and the entropy weight method can integrate both subjective experiences and objective data, thereby enhancing the scientific rigor of weight determination. The entropy method is a multi-criteria decision-making approach that ranks options based on their relative proximity to the ideal solution (optimal solution) and the negative ideal solution (worst solution). Weighting through the entropy method involves progressively identifying solutions closest to the optimal solution (Sun et al., 2019). To avoid interference from subjective factors, this study employs the TOPSIS-entropy method to determine the weights of indicators. Unlike the aforementioned entropy weight method, this study first constructs a weighted matrix using the “specific calculation of entropy” via the entropy method, and then applies the TOPSIS model to analyze the level of marine new-quality productive forces. The detailed calculation steps are as follows:
Step 1: Standardize the raw data of each indicator in the evaluation system using the range standardization method to eliminate differences in scale and measurement units among the indicators. The specific processing method is as Equations 1 and 2:
In the formula: represents the standardized value of the i-th indicator for the j-th region, denotes the original value of the i-th indicator for the j-th region, is the maximum value of the i-th indicator among all regions, is the minimum value of the i-th indicator among all regions.
Step 2: Calculate the indicator proportion. Compute the proportion of the i-th indicator for the j-th region, as Equation 3:
Step 3: Calculate the entropy value , as Equation 4:
In the formula: In the traditional information entropy formula, the entropy value ranges within [0, ], where m is the number of possible event states. The entropy reaches its maximum value when all events occur with equal probability (i.e., ). Introducing the coefficient aims to standardize the entropy value to the fixed interval [0,1] (i.e., ), which is a common normalization approach in “A mathematical theory of communication”. By dividing the maximum entropy value , this normalization preserves the mathematical properties of entropy. Other methods (e.g., linear transformations) may compromise the original statistical significance of entropy, whereas retains the physical interpretation of entropy while fulfilling standardization requirements (Shannon, 1948).
Step 4: Calculate the deviation coefficient , as Equation 5:
Step 5: Calculate the entropy weight , as Equation 6:
Step 6: Obtain the weighted matrix R by utilizing the weights calculated from Equation 6, as Equation 7:
In the formula: R represents the weighted matrix based on entropy weights, where denotes the entropy weight, and represents the proportion of the value of the i-th indicator in region j.
Step 7: Determine the optimal scheme and the worst-case (or least favorable) scheme based on the weighted matrix R, as Equation 8:
Step 8: Calculate the Euclidean distances and between each evaluation alternative and the positive ideal solution and the negative ideal solution , as Equation 9:
Step 9: Calculate the closeness coefficient for each evaluation alternative to the ideal solutions, as Equation 10:
It can be concluded that the value of ranges between 0 and 1. A higher indicates a higher level of marine new quality productivity, while a lower value corresponds to a lower level.
2.1.2 Measurement methods for the spatiotemporal evolution of china’s marine new quality productivity
2.1.2.1 Dagum Gini coefficient and decomposition method
This study uses the Dagum Gini coefficient (Dagum, 1997) to measure the regional disparities in China’s marine new-quality productivity, providing an effective explanation for studying the development disparities and clustering degrees between the overall and subgroup regions. The calculation formulas are as , as Equation 11:
In the formula: ( ) represents the development level of marine new-quality productivity in the j(r)province of the i(m) region; ni(nj) is the number of provinces in the i(j) region; represents the average development level of marine new-quality productivity. n represents the number of provinces, and k represents the number of divided regions.
Furthermore, the overall Gini coefficient(G)is decomposed into the contribution of intra-regional disparities(Gw), the contribution of inter-regional disparities(Gnb), and the contribution of hypervariable density (Gl). The calculation formulas are as follows:
2.1.2.1.1 Intraregional Gini coefficient ()
where is the mean value for the i-th region, as Equation 12.
Contribution of intraregional differences to the overall Gini coefficient, as Equation 13:
: The proportion of the number of provinces in the i-th region;
: The proportion of the economic scale of the i-th region.
2.1.2.1.2 Interregional Gini coefficient ()
Interregional Gini Coefficient is shown as Equation 14
Contribution of interregional differences, as Equation 15:
: The relative economic influence difference between regions and , reflecting the relative gap in development levels between regions.
2.1.2.1.3 Transvariation density contribution ()
Transvariation density in the Equation 16 reflects the interaction effects of interregional distributions, such as the overlapping areas between high-income regions and low-income regions.
2.1.2.2 Kernel density estimation method
Kernel Density Estimation (KDE) is a non-parametric estimation method (Plackett, 1971). In this study, KDE is employed to examine the overall morphological distribution of marine neomorphic productivity levels and explore the evolutionary characteristics of its distribution. The specific formula is as Equation 17:
In the formula: represents the density function of the variable x at period t, n denotes the number of observations, k(∗) is the kernel density function, and h indicates the bandwidth.
2.2 Data sources
This study takes the period from 2012 to 2021 as the time window and focuses on 11 coastal regions in China, which are divided into the Northern Marine Economic Circle, the Eastern Marine Economic Circle, and the Southern Marine Economic Circle based on their geographical location2. The data are primarily sourced from publications such as the “China Marine Statistical Yearbook,” the “China Statistical Yearbook,” the “China Environment Statistical Yearbook,” and the statistical yearbooks of various provinces. To minimize sample loss, this study employs interpolation methods to complement some of the missing data.
3 Results
3.1 Evaluation of the development level of China’s marine new quality productivity
Based on the constructed indicator system for marine new-quality productivity, this study obtains the calculation results of China’s marine new-quality productivity development level from 2012 to 2021, as shown in Table 2.
Table 2
| Region | 2012 | 2013 | 2014 | 2015 | 2016 | 2017 | 2018 | 2019 | 2020 | 2021 | Mean value | Growth rate |
|---|---|---|---|---|---|---|---|---|---|---|---|---|
| National mean value | 0.220 | 0.224 | 0.254 | 0.247 | 0.259 | 0.277 | 0.289 | 0.306 | 0.318 | 0.346 | 0.274 | 5.81% |
| Hebei | 0.158 | 0.174 | 0.184 | 0.213 | 0.218 | 0.245 | 0.263 | 0.283 | 0.280 | 0.270 | 0.229 | 6.30% |
| Liaoning | 0.170 | 0.186 | 0.186 | 0.199 | 0.218 | 0.232 | 0.241 | 0.251 | 0.265 | 0.287 | 0.224 | 6.03% |
| Shandong | 0.211 | 0.224 | 0.232 | 0.248 | 0.257 | 0.277 | 0.290 | 0.308 | 0.340 | 0.363 | 0.275 | 6.23% |
| Tianjin | 0.236 | 0.244 | 0.248 | 0.255 | 0.269 | 0.292 | 0.290 | 0.320 | 0.297 | 0.324 | 0.278 | 3.72% |
| Northern mean value | 0.194 | 0.207 | 0.213 | 0.229 | 0.241 | 0.262 | 0.271 | 0.291 | 0.296 | 0.311 | 0.252 | 5.41% |
| Jiangsu | 0.249 | 0.259 | 0.273 | 0.290 | 0.296 | 0.320 | 0.334 | 0.351 | 0.370 | 0.412 | 0.315 | 5.78% |
| Zhejiang | 0.241 | 0.249 | 0.255 | 0.262 | 0.302 | 0.288 | 0.301 | 0.326 | 0.335 | 0.380 | 0.294 | 5.35% |
| Shanghai | 0.264 | 0.267 | 0.282 | 0.291 | 0.295 | 0.313 | 0.326 | 0.341 | 0.375 | 0.417 | 0.317 | 5.26% |
| Eastern mean value | 0.251 | 0.258 | 0.270 | 0.281 | 0.298 | 0.307 | 0.320 | 0.339 | 0.360 | 0.403 | 0.309 | 5.43% |
| Fujian | 0.193 | 0.203 | 0.449 | 0.230 | 0.241 | 0.255 | 0.250 | 0.259 | 0.264 | 0.287 | 0.263 | 11.16% |
| Guangdong | 0.295 | 0.300 | 0.307 | 0.329 | 0.336 | 0.372 | 0.404 | 0.441 | 0.473 | 0.542 | 0.380 | 7.07% |
| Hainan | 0.257 | 0.203 | 0.207 | 0.211 | 0.219 | 0.234 | 0.250 | 0.254 | 0.258 | 0.267 | 0.236 | 0.78% |
| Guangxi | 0.148 | 0.158 | 0.174 | 0.185 | 0.196 | 0.222 | 0.228 | 0.235 | 0.237 | 0.254 | 0.204 | 6.25% |
| Southern mean value | 0.223 | 0.216 | 0.284 | 0.239 | 0.248 | 0.271 | 0.283 | 0.297 | 0.308 | 0.338 | 0.271 | 5.37% |
Calculation results of China’s Marine new-quality productivity level from 2012 to 2021.
As seen from Table 2, the average level of marine new-quality productivity nationwide ranged between 0.220 and 0.346 during the period from 2012 to 2021. In terms of the mean values, there are significant regional differences in the development of marine new-quality productivity in China. Guangdong Province has the highest level of marine new-quality productivity (0.380), while Guangxi Province has the lowest (0.204). In terms of growth rates, all coastal provinces in China have achieved a certain level of growth in marine new-quality productivity. Fujian Province has the highest growth rate, reaching 11.16%, while Hainan Province has the lowest growth rate of marine new-quality productivity, at 0.78%. From the perspective of different marine economic circles, the Eastern Marine Economic Circle has an average marine new-quality productivity of 0.309 with a growth rate of 5.43%, the Southern Marine Economic Circle has an average of 0.271 with a growth rate of 5.37%, and the Northern Marine Economic Circle has an average of 0.252 with a value-added rate of 5.41%. The average levels of marine productivity indicate that the Eastern Marine Economic Circle is the highest, followed by the Southern Marine Economic Circle, and then the Northern Marine Economic Circle. However, in terms of the growth rate of marine new-quality productivity, the Southern Marine Economic Circle has the fastest growth, while the growth rates of the Eastern and Northern Marine Economic Circles are similar.
As shown in Figure 1, the development levels and rankings of marine new-quality productivity in various coastal regions of China in 2021 are presented. From an overall perspective, in 2021, the levels of marine new-quality productivity in China’s coastal regions ranged from 0.254 to 0.542, with an average of 0.345 and a standard deviation of 0.088. This indicates that there are significant differences in the development levels of marine new-quality productivity among various regions in China.
Figure 1
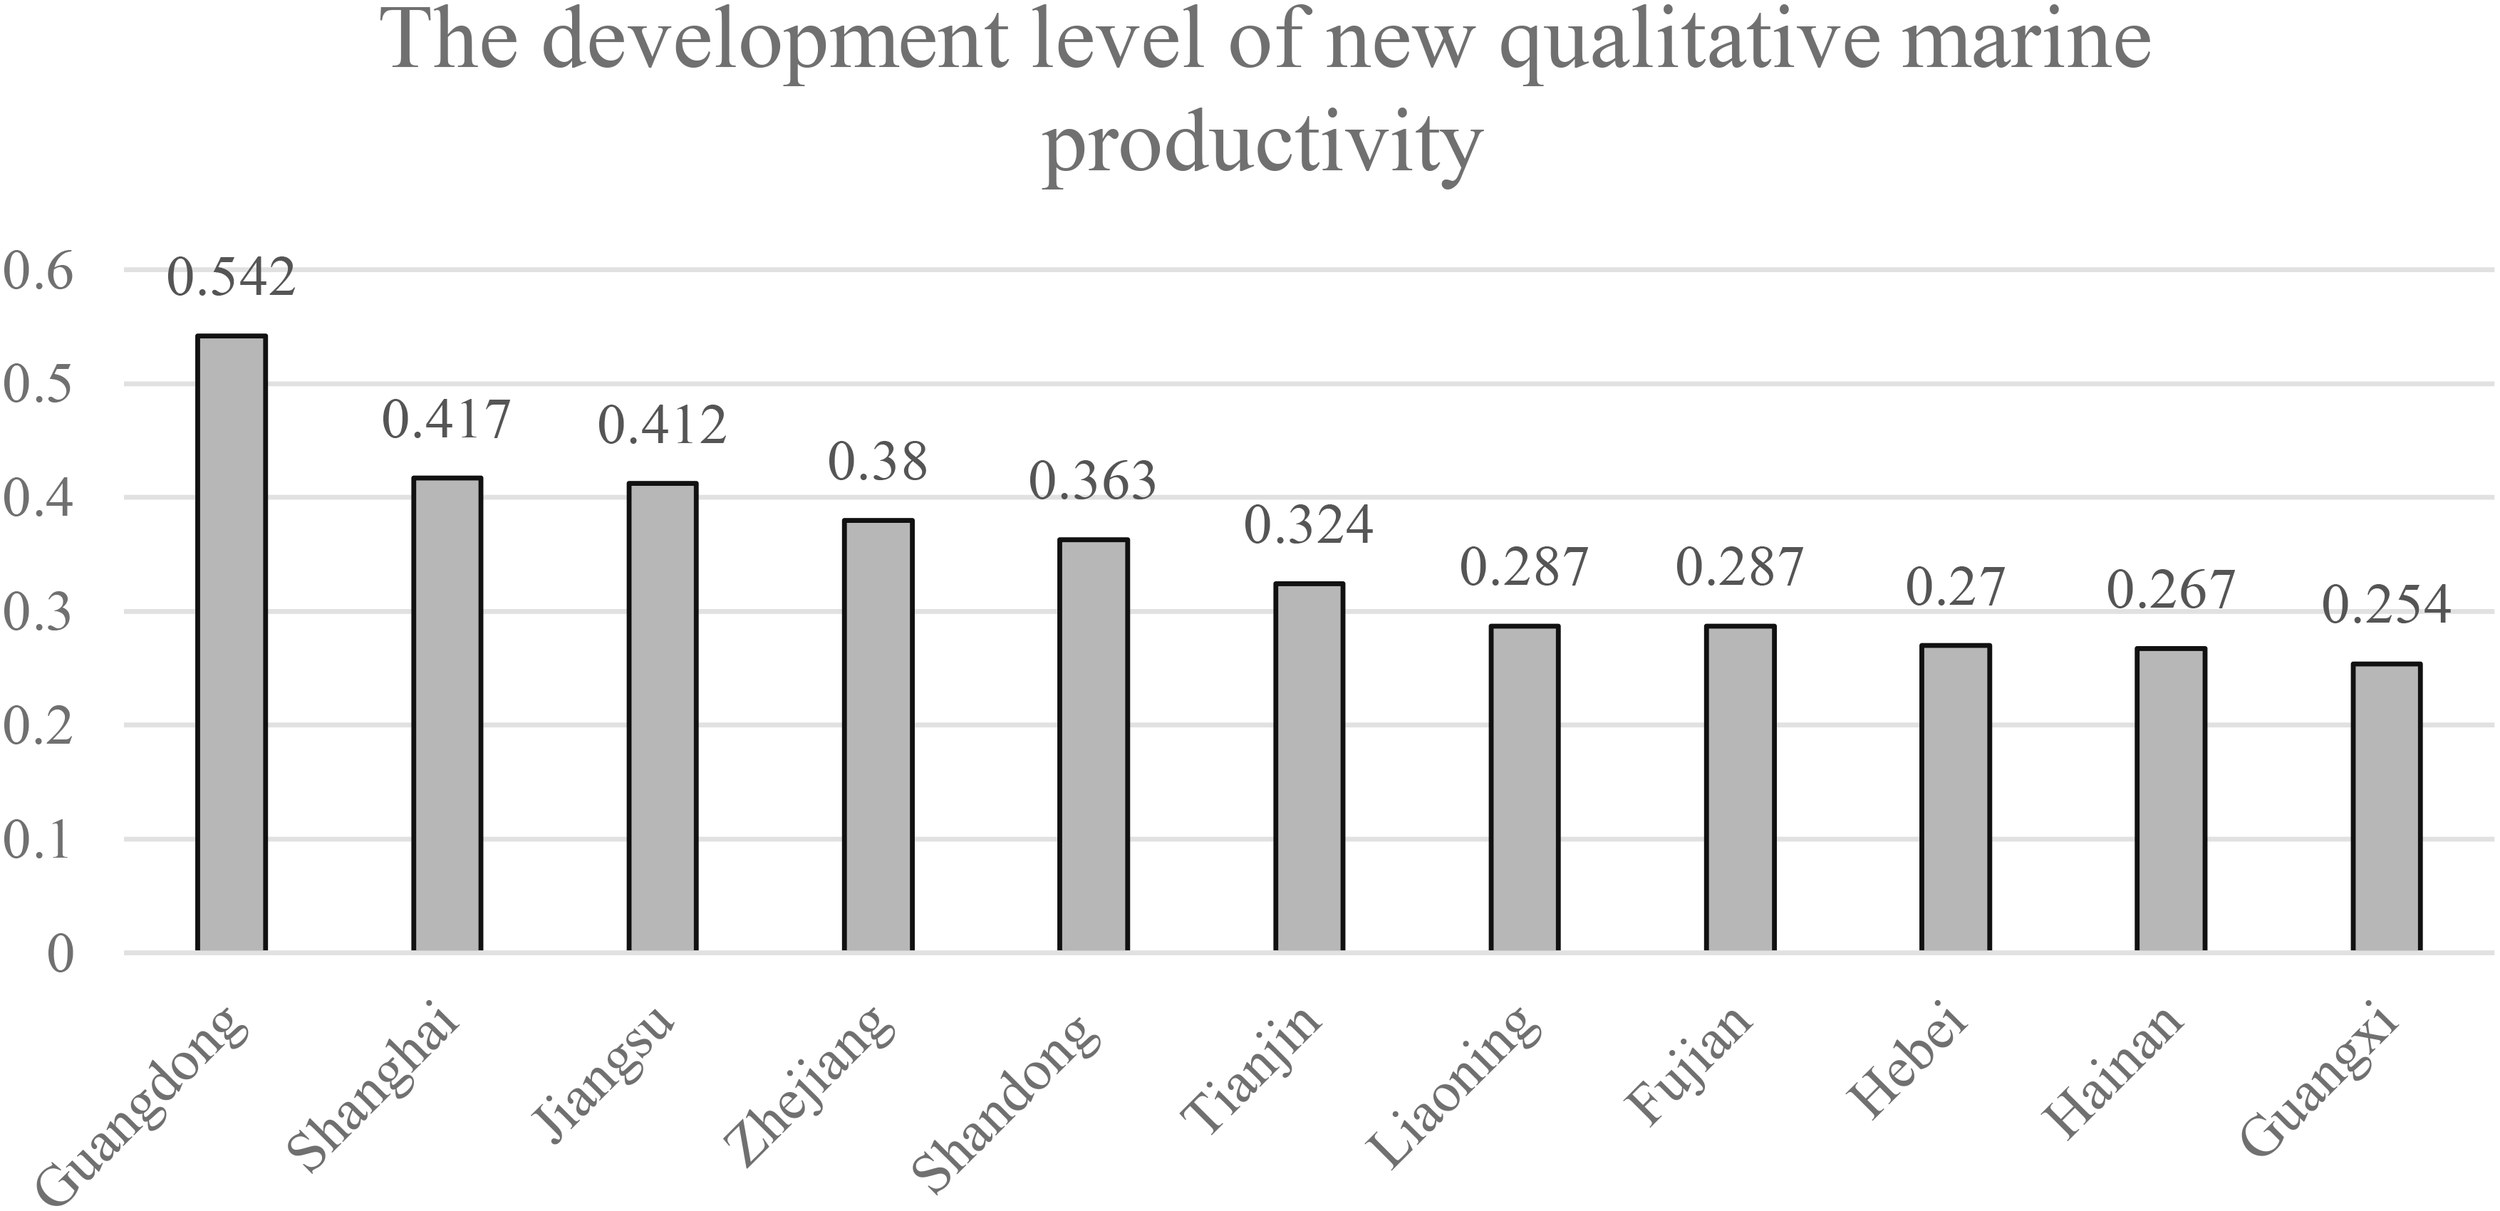
Development levels and rankings of China’s marine new-quality productivity in 2021.
3.2 Temporal evolution and regional disparities of China’s marine new quality productivity
3.2.1 Temporal evolution of the overall level of China’s marine new quality productivity
As can be seen from Figure 1, the levels and rankings of marine new-type productivity in various coastal regions of China in 2021 are presented. From an overall perspective, in 2021, the marine new-type productivity levels of various coastal regions in China ranged from 0.254 to 0.542, with an average of 0.345 and a standard deviation of 0.088. This leads to the conclusion that there are significant differences in the development levels of marine new-type productivity among various regions in China.
Drawing on the research by Wei and Li (2018) and others, this study classifies coastal provinces in China based on the relationship between the mean (M) and standard deviation (sd) of the marine new-quality productivity composite index. Provinces with an index greater than 0.389 (M+0.5sd) are designated as “high-level provinces”; those with an index between 0.301 and 0.389 are designated as “medium-level provinces”; and those with an index less than 0.301 (M-0.5sd) are designated as “low-level provinces”. Observation of Figure 1 reveals that there are three high-level provinces in terms of marine new-quality productivity development in China, namely Guangdong (0.543), Shanghai (0.417), and Jiangsu (0.412), accounting for 27.27% of the sample regions examined in this study. These regions have steadily promoted the development of marine new-quality productivity due to abundant marine resources, a solid marine economic foundation, innovative marine technology, and other factors. The medium-level regions in terms of marine new-quality productivity development include Zhejiang (0.380), Shandong (0.363), and Tianjin (0.324), accounting for 27.27% of the regions examined in this study. The development of marine new-quality productivity in these regions still needs to continue to advance. There are five low-level regions in terms of marine new-quality productivity development in China, namely Liaoning (0.287), Fujian (0.287), Hebei (0.270), Hainan (0.267), and Guangxi (0.254), accounting for 45.46% of the regions examined in this study These regions have poor levels of marine new-quality productivity development and should accelerate marine technological innovation to promote the improvement of marine new-quality productivity levels.
3.2.2 Regional differences in the development levels of new-quality productivity among China’s three major marine economic circle
To deeply explore the regional differences in the development levels of China’s marine new-quality productivity, this study calculates the Dagum Gini coefficient for the whole country and for the three major marine economic Circle—Northern, Eastern, and Southern—and conducts a decomposition of the differences. The Dagum Gini coefficient and its decomposition results for the marine new-quality productivity levels from 2012 to 2021 are presented in Table 3.
Table 3
| Year | Overall Gini coefficient | Intra-region Gini coefficient | Inter-region Gini coefficient | Contribution rate % | ||||||
|---|---|---|---|---|---|---|---|---|---|---|
| North | East | South | North-East | North-South | East-South | Within the region (Gw) | Between region (Gb) | Superimposed over density (Gt) | ||
| 2012 | 0.117 | 0.089 | 0.020 | 0.141 | 0.095 | 0.130 | 0.104 | 26.440 | 48.015 | 25.544 |
| 2013 | 0.106 | 0.075 | 0.015 | 0.123 | 0.080 | 0.108 | 0.106 | 24.756 | 44.212 | 31.032 |
| 2014 | 0.150 | 0.070 | 0.022 | 0.203 | 0.085 | 0.173 | 0.154 | 26.342 | 43.485 | 30.173 |
| 2015 | 0.097 | 0.055 | 0.023 | 0.118 | 0.072 | 0.095 | 0.104 | 24.586 | 44.682 | 30.732 |
| 2016 | 0.093 | 0.050 | 0.005 | 0.111 | 0.069 | 0.088 | 0.097 | 22.345 | 48.345 | 29.310 |
| 2017 | 0.087 | 0.051 | 0.023 | 0.109 | 0.060 | 0.087 | 0.097 | 25.477 | 38.506 | 36.016 |
| 2018 | 0.092 | 0.040 | 0.023 | 0.117 | 0.058 | 0.091 | 0.105 | 23.866 | 38.285 | 37.850 |
| 2019 | 0.100 | 0.050 | 0.016 | 0.131 | 0.057 | 0.105 | 0.116 | 24.302 | 32.197 | 43.502 |
| 2020 | 0.113 | 0.051 | 0.025 | 0.145 | 0.070 | 0.113 | 0.130 | 23.860 | 36.803 | 39.337 |
| 2021 | 0.130 | 0.064 | 0.020 | 0.164 | 0.087 | 0.128 | 0.144 | 23.350 | 42.412 | 34.238 |
Dagum Gini coefficient and its decomposition results for marine new-quality productivity levels from 2012 to 2021.
3.2.2.1 Analysis of overall differences
The Gini coefficient for the development level of China’s marine new-quality productivity ranged between 0.087 and 0.150 from 2012 to 2021. It can be observed that there was a fluctuating downward trend from 2012 to 2017, decreasing from 0.117 to 0.087, indicating a gradual narrowing of the development gap in marine new-quality productivity. Notably, in 2014, the Gini coefficient reached its peak of 0.150 during the period investigated in this study. This may be attributed to the fact that 2014 marked the first year of China’s comprehensive deepening of reforms, during which China’s economy bid farewell to high-speed growth and “the new normal” became the overarching logic for economic development. Against this backdrop, differing national development policies for coastal regions led to significant variations in the development levels of marine new-quality productivity among coastal areas in China in 2014. From 2018 to 2021, there was an upward trend, increasing from 0.092 to 0.130, suggesting that the overall differences in the development levels of China’s marine new-quality productivity have been widening year by year. This increasing trend reflects the expansion of extreme differences in China’s marine new-quality productivity levels and uneven growth, indicating that the rapid growth in some coastal regions has not been evenly distributed across all coastal areas, resulting in productivity development in some coastal regions far surpassing that of others.
3.2.2.2 Analysis of intra-region differences
The Gini coefficient for the Eastern Marine Economic Circle was relatively low during the study period, with little variation, hovering around 0.020. This reflects a relatively stable development gap in marine new-quality productivity within the Eastern Marine Economic Circle, indicating a balanced development of marine new-quality productivity. Notably, the Gini coefficient for the Eastern Marine Economic Circle reached its lowest point of 0.005 in 2016. This may be attributed to the comprehensive advancement of supply-side structural reforms in the eastern marine sector in 2016, which led to breakthroughs in optimizing structures, enhancing growth drivers, resolving contradictions, and addressing weaknesses in the development of the eastern marine economy. In contrast, the intra-region Gini coefficients for the Northern and Southern Marine Economic Circle exhibited more significant changes, particularly for the Southern Marine Economic Circle. The Gini coefficient for the Southern Marine Economic Circle fluctuated and increased from 0.141 in 2012 to 0.164 in 2021, reflecting an expanding trend in the development gap of marine new-quality productivity within the Southern Marine Economic Circle. Additionally, the absolute difference in the Gini coefficient for the Northern Marine Economic Circle remained relatively stable throughout the study period, ranging from 0.040 to 0.089. However, there were larger fluctuations in the relative differences. Although the overall gap did not significantly widen, localized or temporal imbalances may pose challenges to the development of marine new-quality productivity in the Northern Marine Economic Circle.
3.2.2.3 Analysis of inter-region differences
In terms of inter-region differences, the Gini coefficients between the Northern and Eastern Marine Economic Circle, as well as between the Northern and Southern Marine Economic Circles, fluctuated slightly during the study period but showed an overall stable trend, maintaining within the ranges of 0.057 to 0.095 and 0.087 to 0.130, respectively. This indicates that the development gap in marine new-quality productivity between these two pairs of marine economic zones is gradually narrowing. However, the Gini coefficient between the Eastern and Southern Marine Economic Circles was relatively high, ranging from 0.097 to 0.144, suggesting that the development gap in marine new-quality productivity between these two Circles is gradually widening. The relatively large inter-regional Gini coefficient reflects that the dividends related to marine economic growth and technological progress in the Eastern and Southern Marine Economic Circles have not been equally distributed across all regions within these Circles, leading to relatively lagging levels of marine new-quality productivity in some areas of the Eastern and Southern Marine Economic Circles.
3.2.2.4 Analysis of regional disparity contribution rates
The intra-region disparity contribution rate (GW) in China’s coastal areas exhibits a gradual declining trend, decreasing from 26.440% in 2012 to 23.350% in 2021, with a reduction rate of 11.69%. In contrast, the inter-region disparity contribution rate (Gb) in China’s coastal areas shows a fluctuating downward trend, fluctuating from 48.015% in 2012 to 42.412% in 2021, with a reduction rate of 11.65%. The contribution rate of the generalized entropy index (Gt) displays a completely different trend from both intra-region and inter-region disparity contribution rates over time, increasing from 25.544% in 2012 to 34.328% in 2021, with a growth rate of 25.59%. From 2012 to 2021, the primary source of the contribution rate to regional disparity in marine new-quality productivity in China was inter-region disparity (Gb), followed by generalized entropy disparity (Gt), and lastly intra-region disparity contribution rate (GW). The average contribution rates of these three factors were approximately 41.694%, 33.773%, and 24.532%, respectively.
3.3 Spatiotemporal evolution characteristics of marine economy’s new quality productivity
3.3.1 Spatial heterogeneity of China’s marine new quality productivity level
Based on the natural breaks classification method, this study divides the level of marine new-quality productivity in China into five grades: high-value development zones (0.4171-0.542), medium-high-value development zones (0.3631-0.417), medium-level development value (0.2871-0.363), medium-low-value development zones (0.1481-0.287), and low-value development zones (0.125-0.148). To more intuitively reflect the development level of marine new-quality productivity in various coastal regions of China, this study selects four time points: 2012, 2017, and 2021, and uses ArcGIS software to visualize the results of the natural breaks classification, as shown in Figure 2.
Figure 2
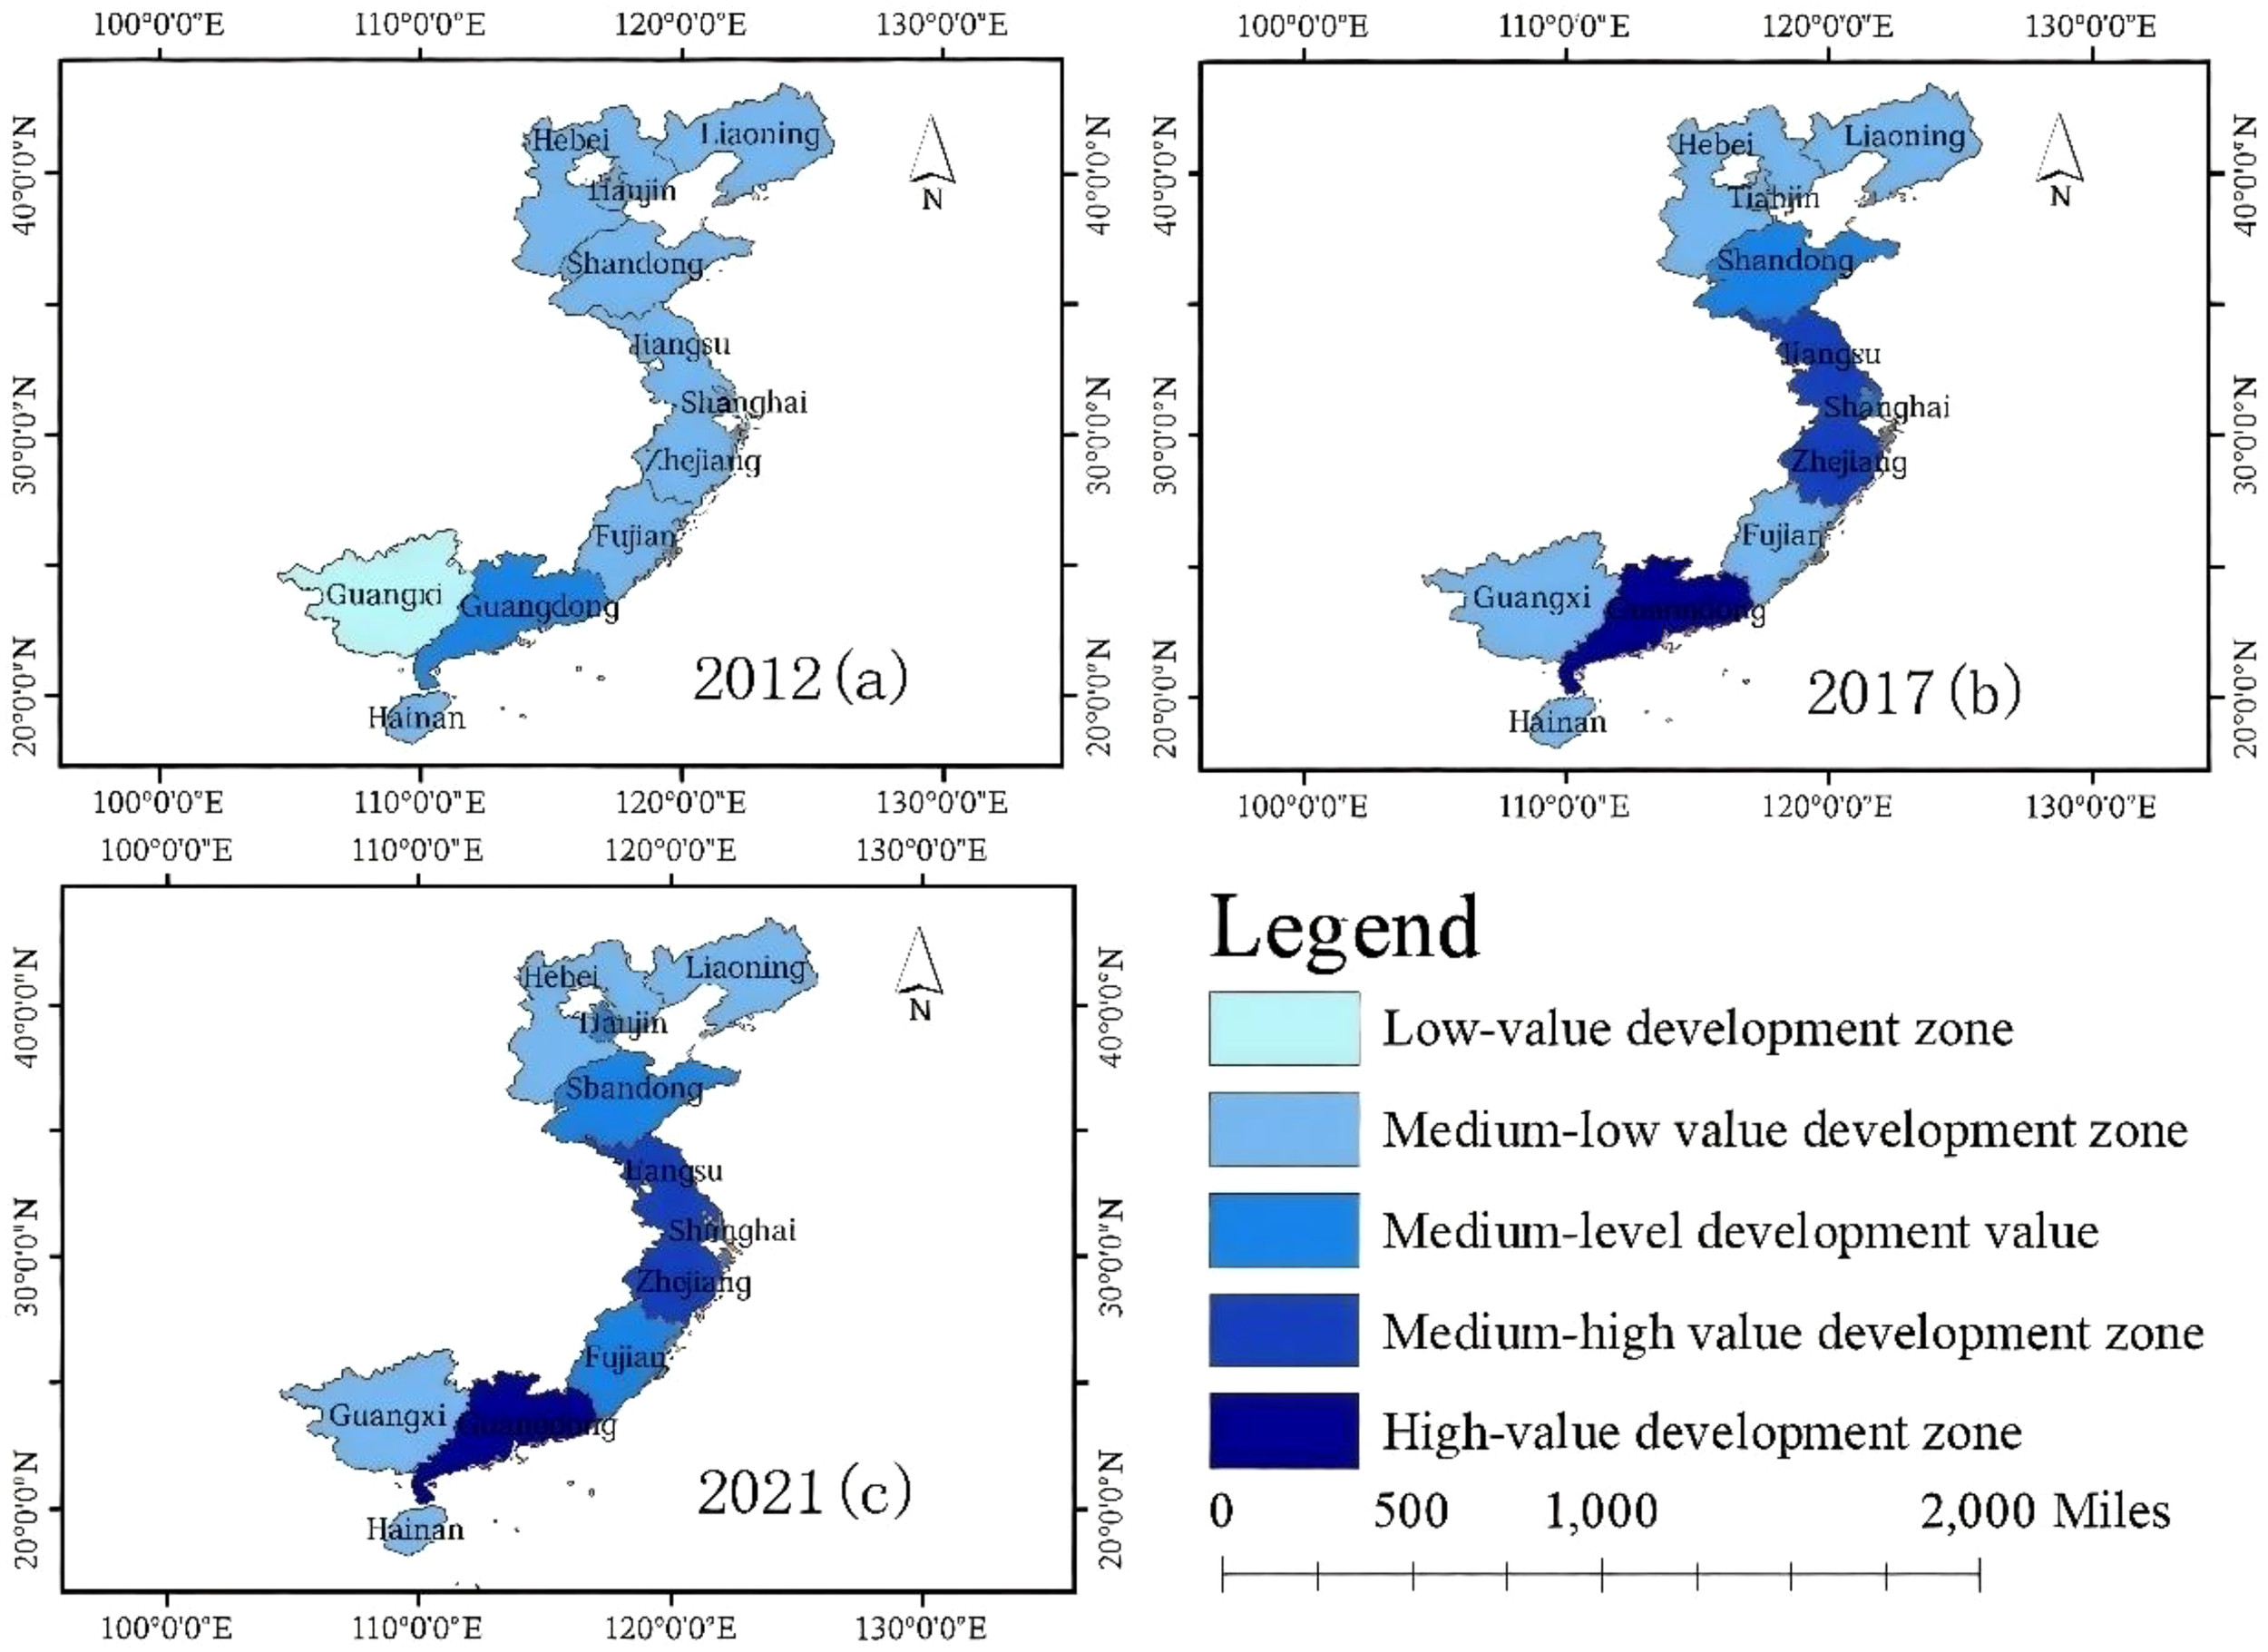
Spatial distribution of marine new-quality productivity development level from 2012 to 2021. This map is created based on the standard map with the approval number GS(2024)0650 downloaded from the Standard Map Service Website of the Map Technology Review Center of the Ministry of Natural Resources.
As shown in Figure 2, from 2012 to 2021, the development level of marine new-quality productivity in China has shown an overall upward trend, but there is still room for improvement. In 2012, only Guangdong Province was in the medium-value development zone for marine new-quality productivity, while nine provinces and municipalities, namely Liaoning, Tianjin, Hebei, Shandong, Jiangsu, Shanghai, Zhejiang, Fujian, and Hainan, were in the medium-to-low-value development zone. Guangxi Zhuang Autonomous Region was in the low-value development zone. By 2021, Guangdong Province had moved into the high-value development zone, with Jiangsu, Shanghai, and Zhejiang in the medium -high-value development zone. Shandong and another municipality (Tianjin) were in the medium-level development value zone, while Liaoning, Hebei, Fujian, Guangxi Zhuang Autonomous Region, and Hainan were in the medium -low-value development zone. There were no regions in the low-value development zone. Furthermore, Figure 2 illustrates that the development focus of marine new-quality productivity in China has shifted towards economically developed areas, exhibiting spatial heterogeneity characterized by “relatively balanced development in the central regions and more imbalanced development in the northern and southern regions.”
From the perspective of different marine economic circles, Shandong Province Municipality in the Northern Marine Economic Circle have transitioned from three-to-medium value development zones to medium value development zones since 2017. As regions with a solid economic foundation and well-developed infrastructure within the Northern Marine Economic Circle, Shandong have significant advantages in developing marine new-type productivity compared to the other three provinces. In the Eastern Marine Economic Circle, the levels of marine new-type productivity in Shanghai, Jiangsu, and Zhejiang have consistently shown an upward trend. The reasons for this may lie in the fact that Shanghai, Jiangsu, and Zhejiang, as part of the Yangtze River Delta region, boast a vibrant marine foreign trade economy, numerous marine research institutions and talents, the ability to produce marine knowledge, as well as well-established infrastructure for river-sea intermodal transportation and rail-water intermodal transportation. Furthermore, they possess strong industrial manufacturing capabilities. In the Southern Marine Economic Circle, Guangdong Province has led the development of marine new-type productivity from 2012 to 2021, significantly driving the development level of marine new-type productivity in the entire circle. As an economic core area of China, Guangdong Province possesses a complete set of high-tech industries and an integrated electronic industry chain, making it the leader in the development of marine new-type productivity in China. However, the levels of marine new-type productivity in Fujian Province, Guangdong Province Guangxi Zhuang Autonomous Region, and Hainan Province within the Southern Marine Economic Circle are not high, falling into the medium-low-value development zones.
3.3.2 Dynamic evolution of China’s marine economy’s new quality productivity
This study employs the kernel density estimation method to analyze the dynamic evolution trends of marine new-quality productivity development in China as a whole and within the three major marine economic circles. Figure 3 presents the three-dimensional kernel density distribution of China’s overall marine new-quality productivity development from 2012 to 2021.
Figure 3
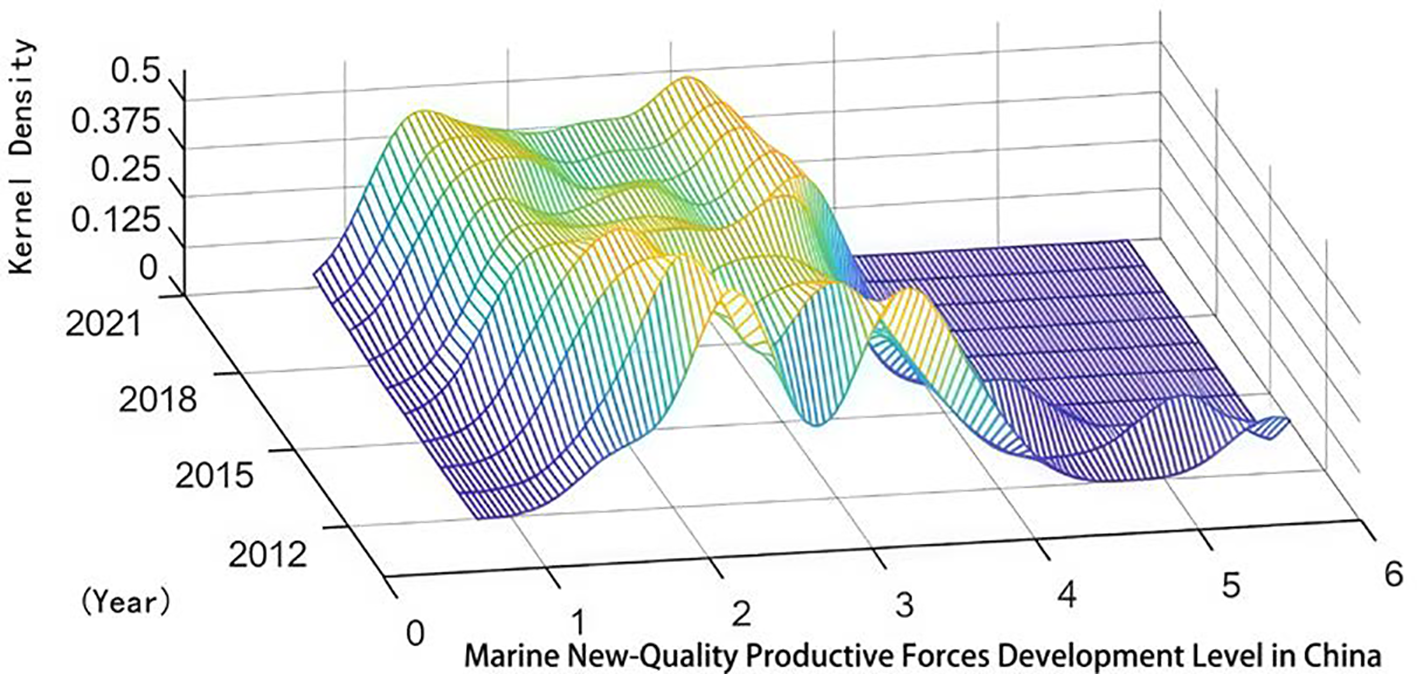
Kernel density of marine new quality productive forces in China.
From Figure 3, we can draw the following conclusions:(1) From the perspective of distribution location, during the period examined in this study, the three-dimensional kernel density curve of China’s marine new-quality productivity shows a trend of moving to the right. This indicates that the overall level of China’s marine new-quality productivity is on an upward trend, which is basically consistent with the conclusions drawn earlier. (2) From the perspective of polarization, the three-dimensional kernel density curve of China’s marine new-quality productivity exhibits a bimodal characteristic. This phenomenon reflects significant regional differences and a clear multipolarization trend in China’s marine new-quality productivity. (3) From the perspective of distribution extensibility, the three-dimensional kernel density curve of China’s marine new-quality productivity displays a right-trailing tail morphology, and there is a trend of the right-trailing tail gradually extending as time progresses. This phenomenon indicates that there are certain differences in the development level of marine new-quality productivity among coastal regions in China, and these differences are gradually expanding over time.
From a regional perspective, Figures 4–6 present the three-dimensional kernel density distributions of marine new-quality productivity development in China’s Northern, Eastern, and Southern marine economic circles from 2012 to 2021.
Figure 4
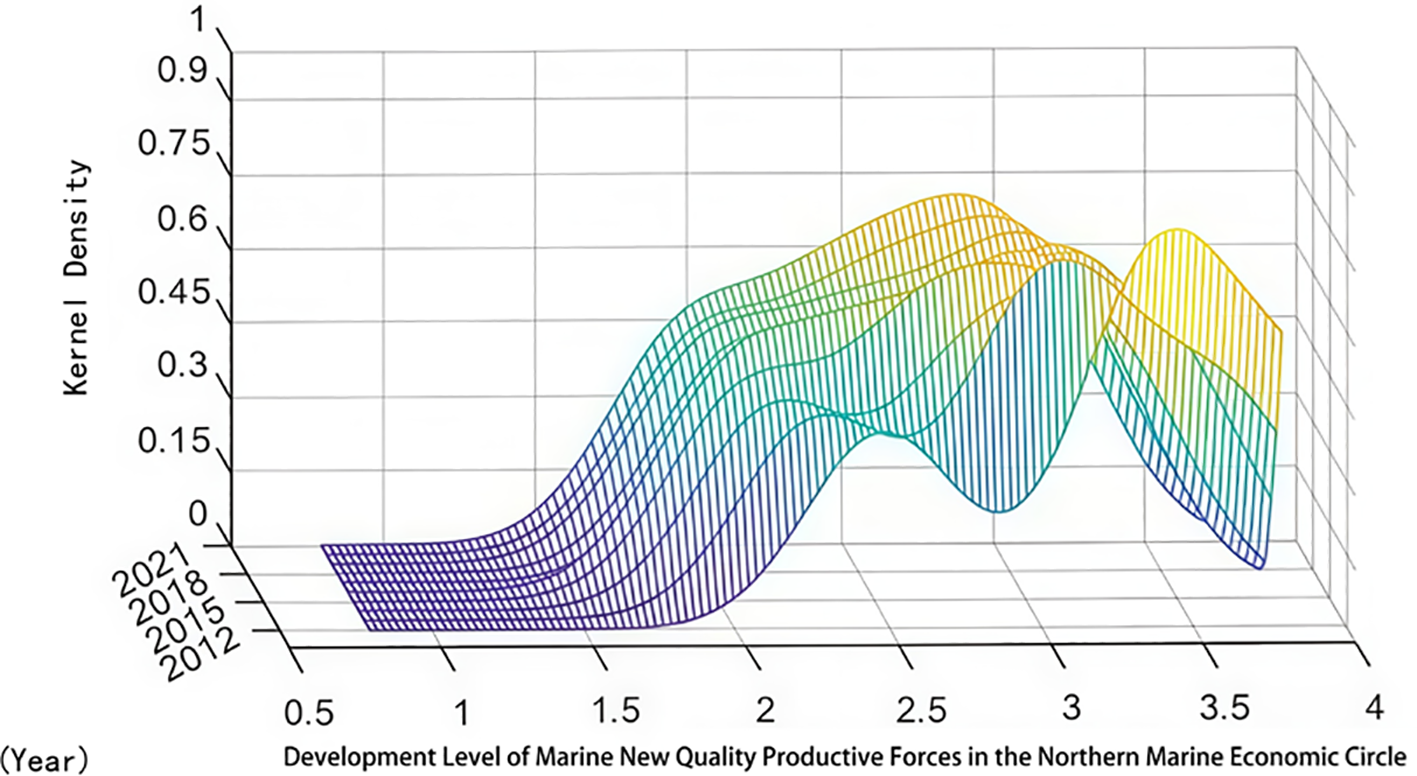
Kernel density plot of marine new quality productive forces in the northern marine economic circle.
Figure 5
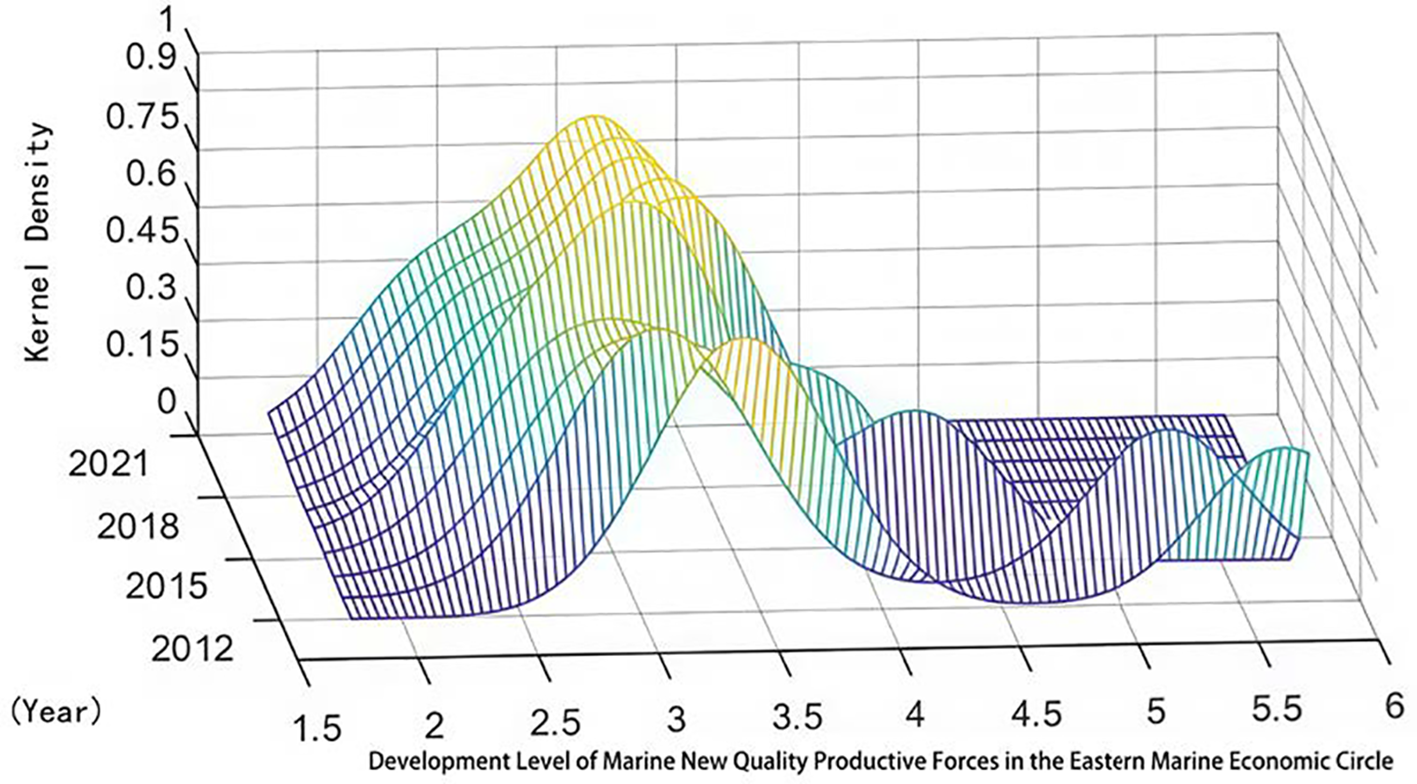
Kernel density plot of marine new quality productive forces in the eastern marine economic circle.
Figure 6
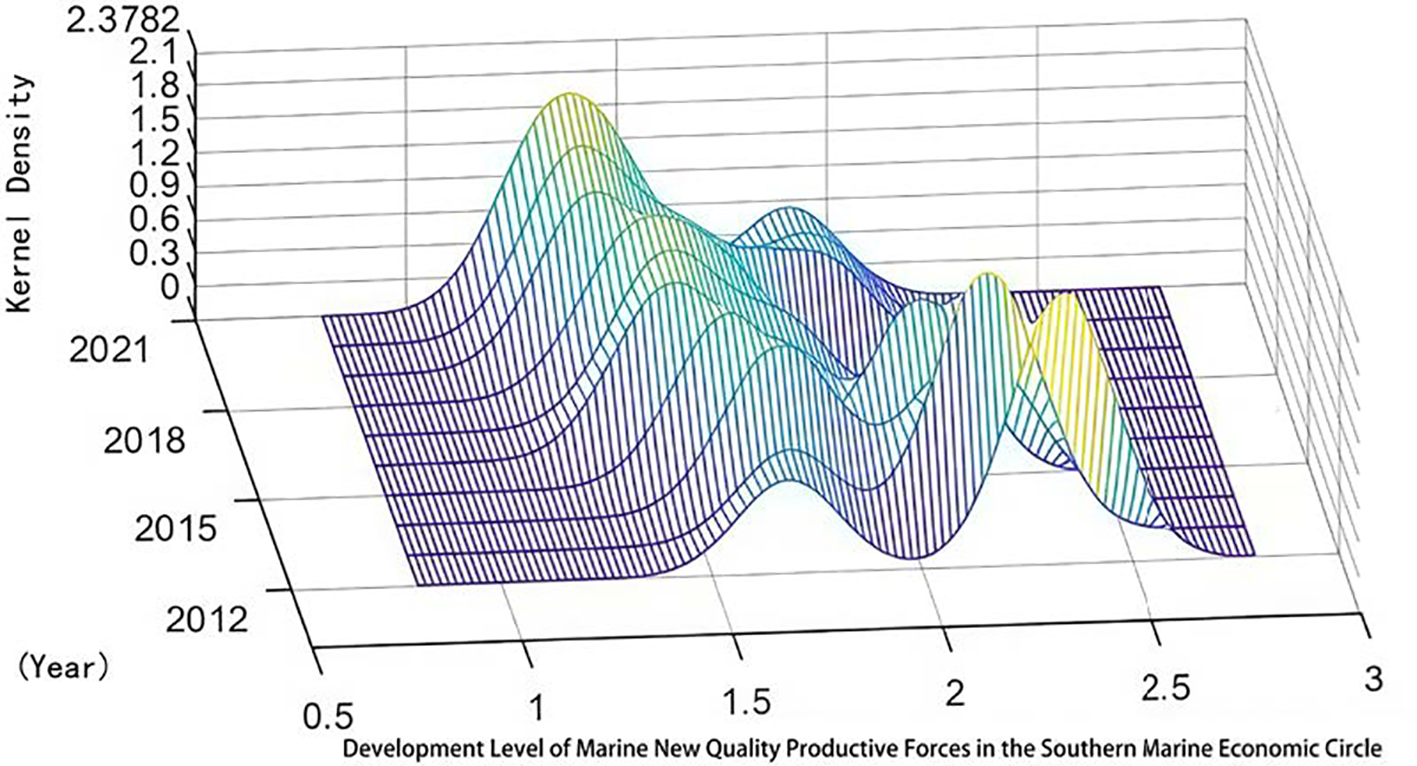
Kernel density plot of marine new quality productive forces in the southern marine economic circle.
From Figures 4–6, we can observe the following:(1) From the perspective of distribution location, the kernel density curves of marine new-quality productivity in China’s Northern, Eastern, and Southern marine economic circles all show varying degrees of rightward shifts. This trend indicates that the development levels of marine new-quality productivity in these three marine economic circles have increased to varying degrees over time. (2) From the perspective of polarization, the kernel density curves of marine new-quality productivity in China’s Northern and Southern marine economic circles basically exhibit bimodal shapes, indicating uneven development within these two marine economic circles. In particular, the side peaks of the kernel density curves for marine new-quality productivity in these two circles are relatively high, suggesting significant internal differences and polarization phenomena in the development of marine new-quality productivity. (3) From the perspective of distribution extensibility, the kernel density curves of marine new-quality productivity in China’s Eastern and Southern marine economic circles both show varying degrees of right-trailing tail characteristics, and the tail gradually grows over time. This indicates that there are relative differences among regions within these two circles, and these differences are showing an increasing trend. However, the trailing tail phenomenon in the kernel density curve of marine new-quality productivity in China’s Northern marine economic circle is less pronounced compared to the other two circles, suggesting that the development level differences of marine new-quality productivity in the Northern marine economic circle are relatively smaller. (4) From the perspective of peak height, the peak values of the kernel density curves of marine new-quality productivity in China’s Eastern and Southern marine economic circles are gradually rising. This phenomenon indicates that the development levels of marine new-quality productivity in various regions within these two marine economic circles are converging towards a common level.
4 Discussion
Currently, research on marine new productive forces is still in its nascent stage, with its fundamental theoretical definitions and measurement methods still under exploration, and relevant quantitative analyses and empirical studies being relatively scarce. Based on the three elements of productive forces in Marxist theory (laborers, labor objects, and labor tools), this study constructs a theoretical framework for marine new productive forces and provides quantitative indicators for evaluating it by integrating data from 11 coastal provinces across three major marine economic zones. Meanwhile, by comprehensively employing the TOPSIS entropy weight method (which combines subjective and objective weighting approaches), the Dagum Gini coefficient decomposition (to analyze the sources of regional disparities), and kernel density estimation (to capture spatiotemporal dynamics), this study offers a multidimensional analytical method for researching regional heterogeneity. However, despite achieving preliminary results in exploring marine new productive forces in China, future research directions for this study will include how to deepen the integration of land and sea planning theories and practices, construct a “land-sea integrated evaluation framework” that integrates marine new productivity indicators with land-based economic indicators, simulate the regulatory effects of different policy scenarios on regional disparities, and conduct enterprise-level micro-surveys to analyze the formation mechanisms and technology transfer bottlenecks of marine new productive forces. These future research directions will further refine the theoretical system for the development of marine new productive forces and provide scientific foundations for promoting high-quality development of marine economy in China.
This study proposes the following recommendations to advance marine new quality productive forces in China based on its research results: (1) To promote coordinated regional development and narrow developmental disparities. (2) cross-regional collaboration mechanisms should be established. Addressing the current pattern of “the Eastern Marine Economic Circle leading while the Northern and Southern Marine Economic Circles lag,” the Eastern Circle should leverage technological spillover effects through models such as “enclave economy” and “cross-regional industrial chain layout” to extend high-end marine industries northward to the Bohai Rim Economic Circle and southward to the Beibu Gulf Economic Zone. (3) For the Northern Marine Economic Circle, which faces overreliance on traditional industries, a green transformation of “marine + heavy industry” should be accelerated by aligning with port economic belt development under the integrated land-sea development strategy. Meanwhile, the Southern Marine Economic Circle should capitalize on its role as a Belt and Road node to foster cross-border marine cooperation while enhancing Guangdong’s radiating influence on neighboring provinces. Strengthening infrastructure connectivity through improved land-sea intermodal transport networks and the deployment of new marine infrastructure systems will further underpin these regional synergies.
5 Conclusions
Regional disparities in marine new-quality productive forces pose both challenges to the implementation of the “land-sea integration” strategy and opportunities for optimizing regional coordination mechanisms. Guided by the three major orientations of strengthening “land-sea linkage,” “ecological-economic symbiosis,” and “differentiated governance,” this study advocates for promoting interdisciplinary research to refine the theoretical framework of land-sea coordinated development, providing sustainable marine impetus for Chinese-style modernization, and achieving the dual goals of “becoming a strong maritime nation” and “regional coordination.” Based on the TOPSIS-entropy method model, this study measures the development level of new quality marine productive force in China’s coastal regions from 2012 to 2021. It further divides these regions into three major marine economic circles: the northern, eastern, and southern marine economic circles. The Dagum Gini coefficient is employed to examine their relative regional disparities, ArcGIS geographic software is used to depict their spatial heterogeneity, and Kernel density estimation is applied to characterize their dynamic evolution features. The research conclusions of this study are as follows:
-
Marine new quality productive forces in China exhibit a growing developmental trajectory, but the overall level is not high. The evolution of these forces demonstrates regional heterogeneity, characterized by uneven development across marine economic circles, with a tiered ranking: the Eastern Marine Economic Circle leads, followed by the Southern Marine Economic Circle, and lastly the Northern Marine Economic Circle.
-
Marine new quality productive forces in China demonstrate a development pattern characterized by “relatively balanced growth in central regions contrasted with imbalanced progress in northern and southern zones.” Examining regional disparities, the Eastern and Southern Marine Economic Circles exhibit notable relative disparities in marine new quality productive forces, with these gaps showing a growing trend. In contrast, the Northern Marine Economic Circle displays comparatively smaller developmental disparities in this domain.
Statements
Data availability statement
The original contributions presented in the study are included in the article/supplementary material. Further inquiries can be directed to the corresponding author.
Author contributions
XS: Writing – original draft, Writing – review & editing. HT: Writing – original draft, Writing – review & editing. YW: Writing – original draft, Writing – review & editing.
Funding
The author(s) declare that financial support was received for the research and/or publication of this article. This paper is one of the phased research achievements of the Basic Scientific Research Project of Liaoning Provincial Department of Education (JYTMS20230512)
Conflict of interest
The authors declare that the research was conducted in the absence of any commercial or financial relationships that could be construed as a potential conflict of interest.
Generative AI statement
The author(s) declare that no Generative AI was used in the creation of this manuscript.
Publisher’s note
All claims expressed in this article are solely those of the authors and do not necessarily represent those of their affiliated organizations, or those of the publisher, the editors and the reviewers. Any product that may be evaluated in this article, or claim that may be made by its manufacturer, is not guaranteed or endorsed by the publisher.
Footnotes
1.^By utilizing keywords appearing in the annual reports of listed companies, we categorize enterprises into different provinces based on their locations in coastal regions, sum the word frequencies, and then calculate the average value to assess the level of enterprise digitization in those regions.
2.^According to the division of the three major marine economic circles in the "China Marine Statistical Yearbook", the Northern Marine Economic Circle includes Liaoning, Hebei, Tianjin, and Shandong; the Eastern Marine Economic Circle encompasses Jiangsu, Shanghai, and Zhejiang; and the Southern Marine Economic Circle comprises Fujian, Guangdong, Guangxi, and Hainan.
References
1
Ceccaldi H.-J. Hénocque Y. Koike Y. Komatsu T. Stora G. Tusseau-Vuillemin M.-H. (Eds.) (2015). Marine productivity: Perturbations and resilience of socio-ecosystems (Cham, Switzerland: Springer International Publishing). doi: 10.1007/978-3-319-13878-7
2
Dagum C. A. (1997). A new approach to the decomposition of the Gini income inequality ratio. Empirical Econ.22, 515–531. doi: 10.1007/BF01205777
3
Ding S. Wei Y. Zhang F. (2024). China’s new quality productivity: Development level and dynamic evolution characteristics. Stat Decision40, 5–11. doi: 10.13546/j.cnki.tjyjc.2024.10.001
4
Du Y.-W. Gao K. (2020). Ecological security evaluation of marine ranching with AHP-entropy-based TOPSIS: A case study of Yantai, China. Marine Policy122, 104223. doi: 10.1016/j.marpol.2020.104223
5
Fermepin S. Watson J. E. M. Grantham H. S. Mendez M. (2024). Global marine conservation priorities for sustaining marine productivity, preserving biodiversity and addressing climate change. Marine Policy161, 106016. doi: 10.1016/j.marpol.2024.106016
6
Gong Y. Liu H. (2024). The theoretical implications, statistical measurement, and spatiotemporal differentiation characteristics of new quality productive forces. J. Hubei Minzu Univ. (Philosophy Soc. Sciences)42, 69–79. doi: 10.13501/j.cnki.42-1328/c.20240709.001
7
Gu B. Peng Y. Chen F. (2024). Evaluation of China’s marine new quality productivity and identification of key influencing factors. J. Ocean Univ. China (Social Sciences)5, 13–25. doi: 10.16497/j.cnki.1672-335X.202405002
8
Hu H. Liu C. (2024). Statistical measurement and dynamic evolution of China’s new quality productivity development level. Stat Decision40, 5–10. doi: 10.13546/j.cnki.tjyjc.2024.14.001
9
Ji J. Chi Y. Cao S. (2024). The research on the logic, multidimensional connotation and evaluation framework of marine new quality productivity. J. Ocean Univ. China (Social Sciences)5, 1–12. doi: 10.16497/j.cnki.1672-335X.202405001
10
Jin X. Wang Y. Yin K. (2024). Research on the measurement and spatiotemporal evolution characteristics of new quality productive forces in China’s marine economy. Front. Marine Sci.11, 1497167. doi: 10.3389/fmars.2024.1497167
11
Lei X. (2024). Measuring the level of new quality productivity, decomposing regional differences, and dynamic evolution in China. J. Industrial Technol. Econ.43, 30–39. doi: 10.3969/j.issn.1004-910X.2024.06.004
12
Li Y. Chen H. Tian M. (2024). Construction and empirical measurement of new quality productive force evaluation index system. Stat Decision40, 11–17. doi: 10.13546/j.cnki.tjyjc.2024.09.002
13
Li X. He J. Yan H. (2022). Study on regional differentiation, distribution dynamics and influencing factors of marine economic development in three major marine economic circles of China. J. Natural Resour.37, 966–984. doi: 10.31497/zrzyxb.20220409
14
Liang C. Zhang J. Chen X. Di Q (2025). Mechanism and effect of new productivity empowering high marine economy from the perspective of Chinese modernization. Marine Sci. Bull. Available at: http://kns.cnki.net/kcms/detail/12.1076.P.20240822.1121.002.html (Accessed August 23,2024).
15
Marra J. F. Barber R. T. Barber E. Bidigare R. R. Chamberlin W. S. Goericke R. et al . (2020). A database of ocean primary productivity from the14C method. Limnol. Oceanogr. Lett.6, 107–111. doi: 10.1002/lol2.10175
16
Plackett R. L. (1971). An introduction to the theory of statistics (Edinburgh, UK: Oliver and Boyd).
17
Sha X. Tang H. Wang Y. (2024). Evaluation and spatio-temporal characteristic analysis of high-quality development level of marine economy in the northern marine economic circle of China. J. Guangxi Univ. Finance Econ.37, 1–11. doi: 10.3969/i.issn.1673-5609.2024.06.001
18
Shannon C. E. (1948). A mathematical theory of communication. Bell Sys. Tech. J.27, 379–423. doi: 10.1002/j.1538-7305.1948.tb01338.x
19
Sun Z. Chen W. Lan Z. (2019). Research on regional green innovation capability based on entropy weight TOPSIS method. Enterprise Econ.38, 20–26. doi: 10.13529/j.cnki.enterprise.economy.2019.02.003
20
Wang H. (2024). Promote Chinese-style modernization with the new action of building a maritime power. Flag1, 53–55. doi: 10.3969/i.issn.2096-6336.2024.01.016
21
Wang J. (2024). New productive forces: A theoretical frame and index system. J. Northwest Univ. (Philosophy Soc. Sci. Ed.)54, 35–44. doi: 10.16152/j.cnki.xdxbsk.2024-01-004
22
Wang J. Wang R. (2024). New quality productivity: Index construction and spatiotemporal evolution. J. Xi’an Univ. Finance Econ.37, 31–47. doi: 10.19331/j.cnki.jxufe.20231124.001
23
Wei M. Li S. (2018). Study on the measurement of economic high-quality development level in the new era. J. Quantitative Technological Econ.35, 3–20. doi: 10.13653/j.cnki.jqte.2018.11.001
24
Xiao J. Hu Q. Xiao H. (2024). Regional differences and convergence of high-quality development of China’s marine economy. J. Wuyi Univ. (Natural Sci. Ed.)38, 70–78. doi: 10.3969/i.issn.1006-7302.2024.01.010
25
Xie B. Li Q. (2024). The logic and path for high-quality development of marine economy with new quality productive forces. Southeast Acad. Res.3, 107–118 + 247. doi: 10.13658/j.cnki.sar.20240507.005
26
Yao S. Zhang X. (2024). Era connotation, strategic value and realization path of new quality productivity. J. Chongqing Univ. (Social Sci. Ed.)1, 112–128. doi: 10.11835/j.issn.1008-5831.pj.2023.12.002
27
Ye F. Wang G. Shi Y. Guo Y. Gao P . (2024). Measurement of the level of marine new quality productive forces in China, regional differences and convergence studies. Marine Sci. Bull.43, 639–651. doi: 10.11840/j.issn.1001-6392.2024.05.007
28
Yu H. Lu B. Li D. (2024). The connotative characteristics, development path, and policy recommendations of marine new quality productivity. J. Ocean Univ. China (Social Sciences)4, 11–18. doi: 10.16497/j.cnki.1672-335X.202404002
29
Zhang L. Pu Q. (2023). The connotation characteristic, theoretical innovation and value implication of new quality productivity. J. Chongqing Univ. (Social Sci. Ed.)6, 137–148. doi: 10.11835/j.issn.1008-5831.pj.2023.10.001
30
Zhang T. Wang Y. (2025). The development path for marine new quality productivity driven by marine technology innovation. Environ. Prot.53, 12–16. doi: 10.14026/j.cnki.0253-9705.2025.03.002
31
Zhao D.-Y. Ma Y.-Y. Lin H.-L. (2022). Using the entropy and TOPSIS models to evaluate sustainable development of islands: A case in China. Sustainability14, 3707. doi: 10.3390/su14063707
32
Zhou W. Xu L. (2023). On new quality productivity: Connotative characteristics and important focus. Reform10, 1–13. doi: 10.3969/.issn.1003-7543.2023.10.001
Summary
Keywords
marine new-quality productivity, regional differences, TOPSIS entropy method, spatio-temporal evolution, marine economy
Citation
Sha X, Tang H and Wang Y (2025) Research on the measurement and spatio-temporal evolution of marine new-quality productivity in China. Front. Mar. Sci. 12:1551481. doi: 10.3389/fmars.2025.1551481
Received
25 December 2024
Accepted
22 April 2025
Published
14 May 2025
Volume
12 - 2025
Edited by
Phoebe Koundouri, Athens University of Economics and Business, Greece
Reviewed by
Kianann Tan, Beibu Gulf University, China
Fivos Papadimitriou, University of Tübingen, Germany
Updates
Copyright
© 2025 Sha, Tang and Wang.
This is an open-access article distributed under the terms of the Creative Commons Attribution License (CC BY). The use, distribution or reproduction in other forums is permitted, provided the original author(s) and the copyright owner(s) are credited and that the original publication in this journal is cited, in accordance with accepted academic practice. No use, distribution or reproduction is permitted which does not comply with these terms.
*Correspondence: Xiujuan Sha, shaxiujuan@dlou.edu.cn; Huimin Tang, 19811803015@163.com
Disclaimer
All claims expressed in this article are solely those of the authors and do not necessarily represent those of their affiliated organizations, or those of the publisher, the editors and the reviewers. Any product that may be evaluated in this article or claim that may be made by its manufacturer is not guaranteed or endorsed by the publisher.