Abstract
An analysis of long-term (over-100-year) continuous catch data at local to regional scales (tens to hundreds of kilometres) is needed to deepen our understanding of the interaction between regime shifts of multiple fish species and marine environmental change. To this end, we retrieved century-scale timeseries of catches of sardines, mackerels, and horse mackerel, which are typical pelagic migratory fishes in the waters around Japan, from fishery statistical books for coastal Japanese prefectures and examined their spatiotemporal characteristics by applying a wavelet transform. We obtained the following key results: (1) Based on statistically significant wavelet power spectra of fish catches, regime shifts around Japan over the past 120 years occurred in the order of sardines (composed of Japanese sardine, Japanese anchovy, and red-eye round herring) in the 1930s, horse mackerel around 1960, mackerels in the 1970s, Japanese sardine in the 1980s, and horse mackerel in the 1990s. (2) Based on statistically significant wavelet coherences and phases between the North Pacific Index (NPI) in winter and fish catches, winter NPI was related to catches of Japanese sardine in the 1980s in the Northern Pacific (NP), Southern Pacific (SP), Central Sea of Japan (CSJ), and Southern Sea of Japan (SSJ) as well as to catches of mackerels in the CSJ and SSJ and catches of horse mackerel in the NP and SP. Despite the huge time and effort required to retrieve printed statistical books mainly held in library collections, we conclude that analogue catch data are invaluable for understanding the spatiotemporal variability of multiple fish species at 100-year scales.
Introduction
Long-term monitoring of the distribution and abundance of various fish species is essential for a deep understanding of the effects of climate and anthropogenic factors on marine ecosystems. One common type of decadal variability in marine ecosystems is a regime shift (e.g., fish species replacement), which can be caused by various factors such as marine and atmospheric decadal oscillations, fishing activity, non-native species invasions, and streamflow fluctuations (Jiao, 2009; Auber et al., 2015; Inoue et al., 2023). Well-known examples of marine ecosystem regime shifts include shifts among sardines (Sardinops spp.) in California (Kawasaki, 2002; Yatsu and Kawabata, 2017; Nishikawa et al., 2019), the North and Baltic seas (Alheit et al., 2012), the North Pacific (Kawasaki, 2002; Sakurai, 2007; Qiu, 2015; Yatsu and Kawabata, 2017), Peru (Kawasaki, 2002; Chavez et al., 2003; Yatsu and Kawabata, 2017), and the Sea of Japan (Yasuda et al., 1999; Tian et al., 2008; Inoue et al., 2023); anchovies (Engraulis spp.) in California (Nishikawa et al., 2019), the North and Baltic seas (Alheit et al., 2012), the North Pacific (Sakurai, 2007), Peru (Chavez et al., 2003), and the Sea of Japan (Tian et al., 2008; Inoue et al., 2023); Atlantic salmon (Salmo salar) in the Northeast Atlantic (Vollset et al., 2022) and North Pacific (Hare and Mantua, 2000; Irvine and Fukuwaka, 2011); Pacific cod (Gadus macrocephalus) in the Sea of Japan (Tian et al., 2008); mackerels (Scomber japonicus and S. australasicus) in the Sea of Japan (Sakurai, 2007); grey mullet (Mugil cephalus) in the Taiwan Strait (Lan et al., 2014); horse mackerel (Trachurus trachurus) in the North Sea (Reid et al., 2001) and Sea of Japan (Tian et al., 2008); and Japanese common squid (Todarodes pacificus) in the Sea of Japan (Sakurai, 2007; Tian et al., 2008; Kidokoro et al., 2010).
These previous reports were based on fishery statistical data recorded mainly during the past few decades (ranging from 19 to 52 years; Hare and Mantua, 2000; Reid et al., 2001; Tian et al., 2008; Alheit et al., 2012; Lan et al., 2014; Inoue et al., 2023). However, each study suffers from two uncertainties. First, ocean temperatures and currents strongly affect the distribution and abundance of fish species (Sakurai, 2007; Tian et al., 2008; Yatsu et al., 2013). For this reason, statistical data collated at national and regional scales (i.e., across thousands of kilometres) or focusing on specific sampling points do not allow accurate evaluation of the spatiotemporal variability of species distribution and abundance under environmental change. One way to address this uncertainty would be to examine long-term continuous catch data of target fish species at a broad scale across environmental gradients (Jung et al., 2014; Watari et al., 2024). The second source of uncertainty is that only one or two regime shifts have generally occurred during the past few decades. For this reason, it is difficult to use several-decade-long datasets to distinguish between the effects of natural environmental changes and human activities such as changes in fishery policy and consumer demand. To examine regime shifts at 100-year scales, it would be useful to retrieve catch records from old documents (e.g., of sardines [Ito, 1961; Kikuchi, 1977; Yasuda et al., 1999; Kuroda, 2007; Takei, 2022], herring (Clupea pallasii) [Ito, 1961; Takei, 2022], yellowtail (Seriola quinqueradiata) [Takei, 2022], and bluefin tuna (Thunnus orientalis) [Ito, 1961]) in Japanese waters. However, these records contain non-numerical qualitative data at a point scale. To address this, we sought to examine the available numerical data across a broad spatial scale.
Very few previous studies have examined catch data for periods of over 100 years and over broad spatial scales (Sakurai, 2007; Irvine and Fukuwaka, 2011; Qiu, 2015; Watari et al., 2024). This likely reflects several challenges. First, the availability of digitized open-access numerical data is limited. Many fishery statistical records are only available in printed form. Collection and manual digitization of these data is labour intensive and time consuming. In other words, huge amounts of fishery statistical data have long been shelved as “historical dark data” (Easterday et al., 2018; Kelly et al., 2022; Shin et al., 2024). Second, catch data in administrative papers and reports (e.g., Fishery Agency, 2022) are mainly reported for the whole country or for certain prefectures. This is because the aim of administrative papers and reports is generally to provide a scientific basis for national and prefectural fisheries policies. However, for instance, in the waters near Japan, the distribution of fish species differs between the Pacific and Sea of Japan coasts because of differences in environmental gradients and currents (Sakurai, 2007; Tian et al., 2008; Yatsu et al., 2013). Therefore, the boundaries of fish species distributions and administrative regions do not match. For these reasons, we cannot accurately evaluate the variability of distribution and abundance of fish species by only examining catch data for the whole country or for specific prefectures.
In this study, we first retrieved century-scale timeseries of catches of sardines (mainly Japanese sardine [Sardinops sagax]*1), mackerels (chub mackerel [Scomber japonicus] and blue mackerel [S. australasicus]), and horse mackerel (Trachurus japonicus) from statistical books for each Japanese coastal prefecture. There are four reasons for selecting these species. First, these species are typical of pelagic migratory fishes in the waters near Japan (Kurota et al., 2019). Second, they are less affected by international fisheries policies such as the establishment of exclusive economic zones. Third, the catch of these species is regulated under a total allowable catch system (Ministry of Agriculture, Forestry and Fisheries, 2021a). Finally, these species have been extensively harvested for fertilizer and food since the pre-statistical era (Kurota et al., 2019; Takei, 2022). The typical life histories of Japanese sardine, mackerels, and horse mackerel in Japan are described in the Appendix.
We then examined the spatiotemporal characteristics of these catches by applying a wavelet transform. An advantage of wavelet analysis is the ability to extract both temporal trends and local frequency information from a timeseries (Grinsted et al., 2004). In contrast, Fourier transforms, which are a common method of timeseries analysis, can only be used to extract frequency information. Previous studies have used wavelet transforms to examine the relationships between catch data and climate indices for various species, such as tuna (Thunnus albacares, T. obesus, and T. alalunga) and swordfish (Xiphias gladius) in the Indian Ocean (Corbineau et al., 2008); yellowfin tuna (T. albacares), bigeye tuna (T. obesus), swordfish (X. gladius), and blue marlin (Makaira mazara) in the Indian and Atlantic oceans (Corbineau et al., 2010); octopus (Octopus vulgaris) in the Canary Islands (Polanco et al., 2011); grey mullet (M. cephalus) in the Taiwan Strait (Lan et al., 2014); and inland water fishes in the Lower Amazon (Furtado et al., 2024). However, these previous studies did not examine relationships among catches of multiple species. For this reason, our understanding of the interaction between regime shifts of multiple fish species and marine environmental change remains insufficient.
The aims of the present study are to (1) assess the spatiotemporal variability of catches of sardines, mackerels, and horse mackerel at 100-year scales and (2) discuss the advantages and limitations of using analogue printed records of fish catch data, which are an important type of historical dark data.
Footnote *1: FishBase (https://www.fishbase.se/search.php, accessed April 25, 2025) follows the valid name Sardinops sagax, which covers the haplotypic divergence lineages, i.e., southern Africa (ocellatus) and Australia (neopilchardus); Chile (sagax) and California (caeruleus); and Japan (melanostictus) (see Grant et al., 1998).
Material and methods
Target area
We selected 16 representative prefectures with the highest catches of sardines, mackerels, and horse mackerel in Japan for analysis (Figure 1). All of the selected prefectures are located along the pathway of the Oyashio Cold Current, Kuroshio Warm Current, and Tsushima Warm Current. We classified the prefectures into four areas: (1) Northern Pacific (NP), characterized by the presence of the southerly Oyashio Cold Current and comprising the prefectures of Aomori, Iwate, Ibaraki, and Chiba; (2) Southern Pacific (SP), characterized by the presence of the northerly Kuroshio Warm Current and comprising the prefectures of Kanagawa, Shizuoka, Mie, Wakayama, and Kagoshima; (3) Central Sea of Japan (CSJ), characterized by the convergence of the southerly Liman Cold Current and the northerly Tsushima Warm Current and comprising the prefectures of Niigata, Toyama, Ishikawa, and Fukui; and (4) Southern Sea of Japan (SSJ), characterized by the presence of the northerly Tsushima Warm Current and comprising the prefectures of Tottori, Shimane, and Nagasaki. In these four areas, annual mean sea-surface temperatures have increased by 1.02–1.94°C over the past 100 years (Japan Meteorological Agency, 2024).
Figure 1
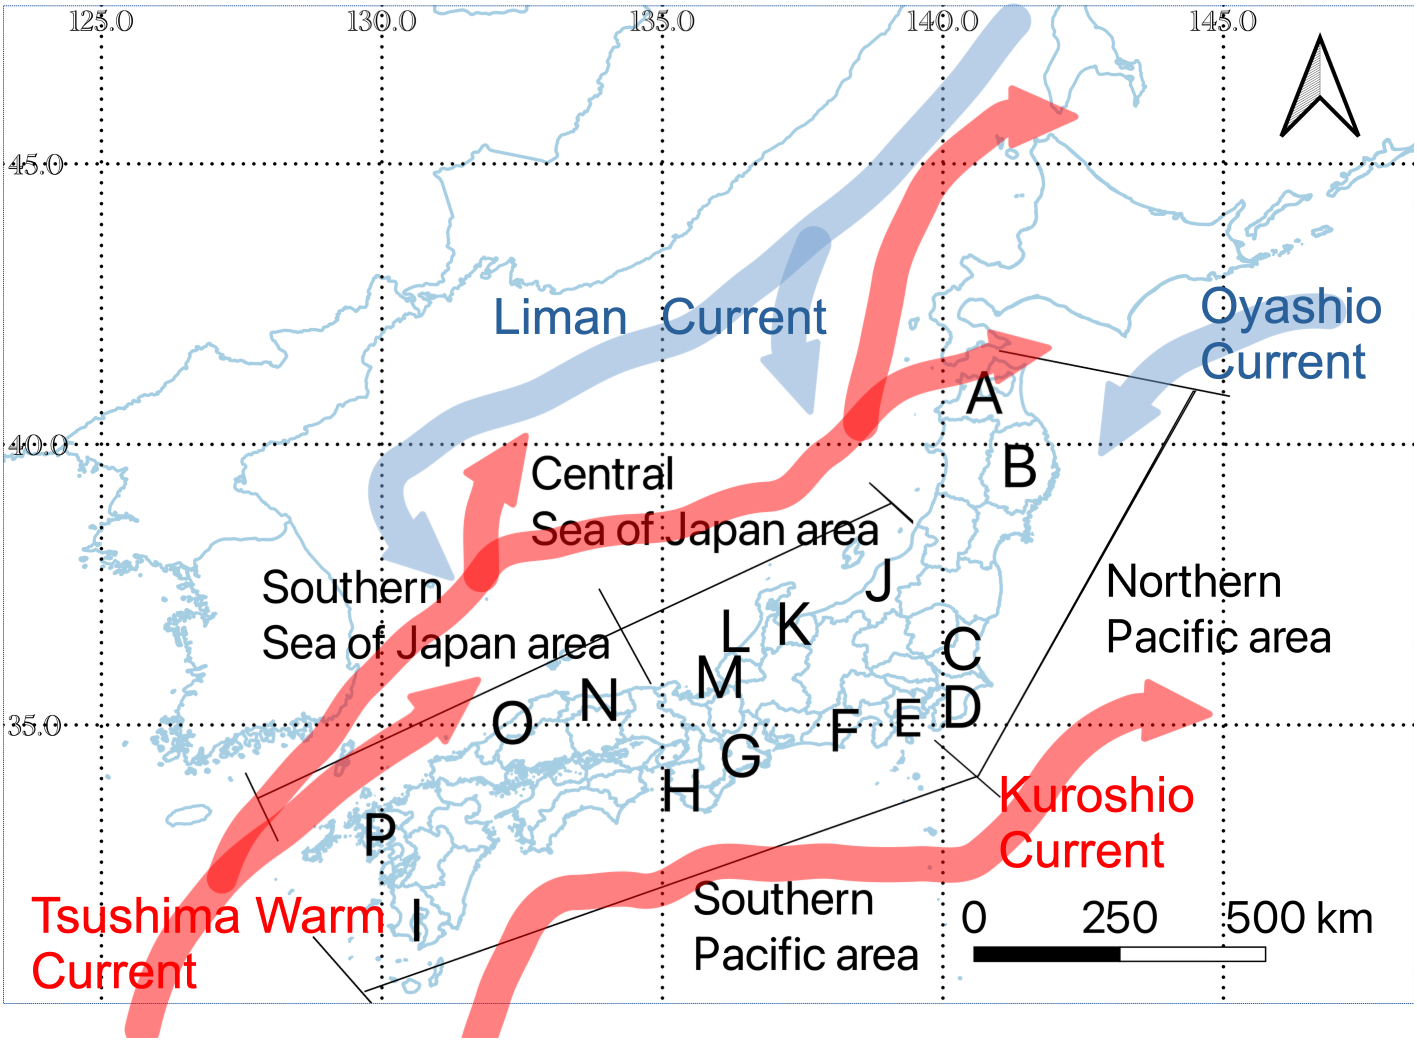
Map of the study area showing the locations of the studied prefectures (letters) and areas (line segments). (A) Aomori Prefecture; (B) Iwate Prefecture; (C) Ibaraki Prefecture; (D) Chiba Prefecture; (E) Kanagawa Prefecture; (F) Shizuoka Prefecture; (G) Mie Prefecture; (H) Wakayama Prefecture; (I) Kagoshima Prefecture; (J) Niigata Prefecture; (K) Toyama Prefecture; (L) Ishikawa Prefecture; (M) Fukui Prefecture; (N) Tottori Prefecture; (O) Shimane Prefecture; (P) Nagasaki Prefecture.
Statistical data
We collected statistical books for each target prefecture, going as far back in time as possible, by accessing the archives of the National Diet Library, the Ministry of Agriculture, Forestry, and Fisheries Library, and local government libraries as well as by searching the internet. The oldest statistical book identified in our search includes data from 1873 in Shimane Prefecture. The statistical books include digital data such as PDFs and Microsoft Excel files downloaded from online sources as well as copies and printouts of pages from physical paper books.
To align the years for analysis, we limited our analysis to catch data from 1901 to 2022. For the years 1901–1975, we used the summary of catches for each fish species as reported in Fisheries Annual Statistics Vol. 3 Prefectural Statistics (Agricultural and Forestry Statistics Research Society, 1978). For the years 1976–2022, we used catch data from the Statistical Yearbook of Agriculture and Forestry Japan (1951–1955; Statistics and Survey Division, Ministry of Agriculture and Forestry, 1952–1956), as well as online e-Stat data (2003–2022; Statistics of Japan, 2024). To validate missing or unusual data such as abnormally large values, we partially cross-checked among catch data in Fisheries Annual Statistics Vol. 3 Prefectural Statistics, Statistical Yearbook of Agriculture and Forestry Japan, e-Stat, and printed or online statistical handbooks, yearbooks, and guides (hereafter referred to as “statistical books”) for each prefecture (see details in the Supplementary Files: statistical_books_1_csv.zip). For the prefectures of Chiba, Kanagawa, Shizuoka, Niigata, Toyama, Ishikawa, and Nagasaki from approximately 1953–2007, we used catch data from printed Agriculture, Forestry and Fisheries Statistics Books, which contain more detailed fishery statistical data than the statistical books (Chiba Prefecture, 1952–2006; Niigata Prefecture, 1953–2006; Toyama Prefecture, 1953–2010; Ishikawa Prefecture, 1953–2007; Nagasaki Prefecture, 1953, 1955–2007; Kanagawa Prefecture, 1954–2006; Shizuoka Prefecture, 1954–2006; see details in the Supplementary Files: statistical_books_2_csv.zip). Catch data from 1946 to 1956 were drawn from the category “Regional fisheries statistics,” which are grouped by the location of landings, but catch data from 1901 to 1945 and from 1957 to 2022 were drawn from the category “Personal fisheries statistics,” which are grouped by the location of the person who landed the catch at any port around Japan (Yamamoto, 1960; Agricultural and Forestry Statistics Research Society, 1978; Ministry of Agriculture, Forestry and Fisheries, 2024).
We assigned a value of 0 to entries marked “No data” (1903 in Tottori Prefecture for sardines; 1912−1917 in Aomori Prefecture for horse mackerel; 1922 in Kanagawa Prefecture for sardines, mackerels, and horse mackerel; and 1983−1985 and 2014 in Iwate Prefecture for horse mackerel). We assumed that these data would only have a marginal effect on the wavelet analysis, which extracts periodic components from localized timeseries.
In some years and prefectures, the catch of Japanese sardine was grouped together in the statistical books with those of two other species, Japanese anchovy (Engraulis japonicus) and red-eye round herring (Etrumeus sadina). This was the case from 1901 to 1904 in all prefectures except Kanagawa Prefecture (from 1901 to 1903); from 1905 to 1925 in the prefectures of Aomori, Iwate, Ibaraki, Wakayama, Niigata, and Toyama; from 1926 to 1950 in all prefectures except for Aomori, Iwate, and Wakayama (from 1926 to 1951); 1968 in Aomori Prefecture; 2013 and 2016 in Iwate Prefecture; 2013 and 2014 in Kanagawa Prefecture; and 2017 in Niigata Prefecture. One regime shift that has been previously reported is a fluctuation between Japanese anchovy and Japanese sardine from around 1950 to 2000 (Oozeki et al., 2007; Takasuka et al., 2008a, b). This suggests that the data we compiled could be confounded by regime shifts of Japanese anchovy or Japanese sardine from 1901 to 1951. Despite the difficulty of identifying the species caught, we chose data that were a mix of the three species in periods or years for which specific data for Japanese sardine were unavailable. For this reason, in the present study, we have taken care to clearly state where the results apply to “sardines” (a grouping of all three species) as opposed to only Japanese sardine.
Wavelet transforms
A wavelet transform is a method of time–frequency analysis that represents a timeseries by the combination, scaling, and translation of wavelets, which are small waves that are not described by specific functions such as trigonometric or logarithmic functions (Morlet et al., 1982a, b; Torrence and Compo, 1998; Sakakibara, 1999). A continuous wavelet transform of timeseries is defined as follows (Sakakibara, 1999; Corbineau et al., 2008; Hamori, 2017) (Equations 1, 2):
where , ψ*, a, and b are the wavelet function, conjugate complex number, scaling parameter, and shifting parameter, respectively.
First, to examine the spatiotemporal variability of catches of sardines, mackerels, and horse mackerel in our study area, we calculated wavelet power spectra for the areas NP, SP, CSJ, and SSJ, and for the study area overall. A wavelet power spectrum is the squared value of . For the mother wavelet, we used the Morlet wavelet (Torrence and Compo, 1998; Grinsted et al., 2004; Lan et al., 2014) defined as (Equation 3)
where is angular frequency.
Second, to examine interactions among catches of sardines, mackerels, and horse mackerel in the study area, we calculated the wavelet coherence () and wavelet phase () between catches of sardines and mackerels, between catches of sardines and horse mackerel, and between catches of mackerels and horse mackerel (Grinsted et al., 2004; Lan et al., 2014; Hamori, 2017; Detto et al., 2018; Dippner et al., 2019). Given a cross wavelet transform
, where and are wavelet transforms of the timeseries and , respectively, is defined as (Equation 4)
Similarly, is defined as (Equation 5)
where ℑ and ℜ are imaginary and real numbers, respectively.
The analysis was mainly conducted in R ver. 3.6.3 (R Core Team, 2024). We used the “biwavelet” package for wavelet analysis (Gouhier et al., 2024).
Results
Sardines
In the 1930s, peak catches of sardines were recorded in Aomori, Iwate, Ibaraki, and Chiba in the NP (131−261 kilotonnes; Figure 2A); in Shizuoka and Kagoshima in the SP (8−40 kilotonnes; Figure 2D); in Niigata, Toyama, and Ishikawa in the CSJ (33−80 kilotonnes; Figure 2G); and in Nagasaki in the SSJ (131 kilotonnes; Figure 2J). Peak catches of sardines were also observed in the NP (633 kilotonnes) and in the study area overall (944 kilotonnes; Figure 2M). In the 1980s, peak catches of Japanese sardine were observed in all prefectures except Kanagawa and Wakayama in the SP and Toyama and Fukui in the CSJ (53−930 kilotonnes). Peak catches were also observed in the NP (1650 kilotonnes), SP (275 kilotonnes), CSJ (234 kilotonnes), SSJ (1161 kilotonnes), and in the study area overall (3247 kilotonnes; Figures 2A, D, G, J, M). Peak catches of Japanese sardine in the 1980s were 3−4 times larger than those of sardines in the 1930s (Figure 2M). Catches were higher in the NP and SSJ than in the SP and CSJ (Figure 2M). In the NP, SP, CSJ, and SSJ and in the study area overall, statistically significant wavelet power at periods of around 1 to 32 years was observed around the 1980s, corresponding to the observation of peak catches of Japanese sardine during this decade (Figures 3A, D, G, J, M).
Figure 2
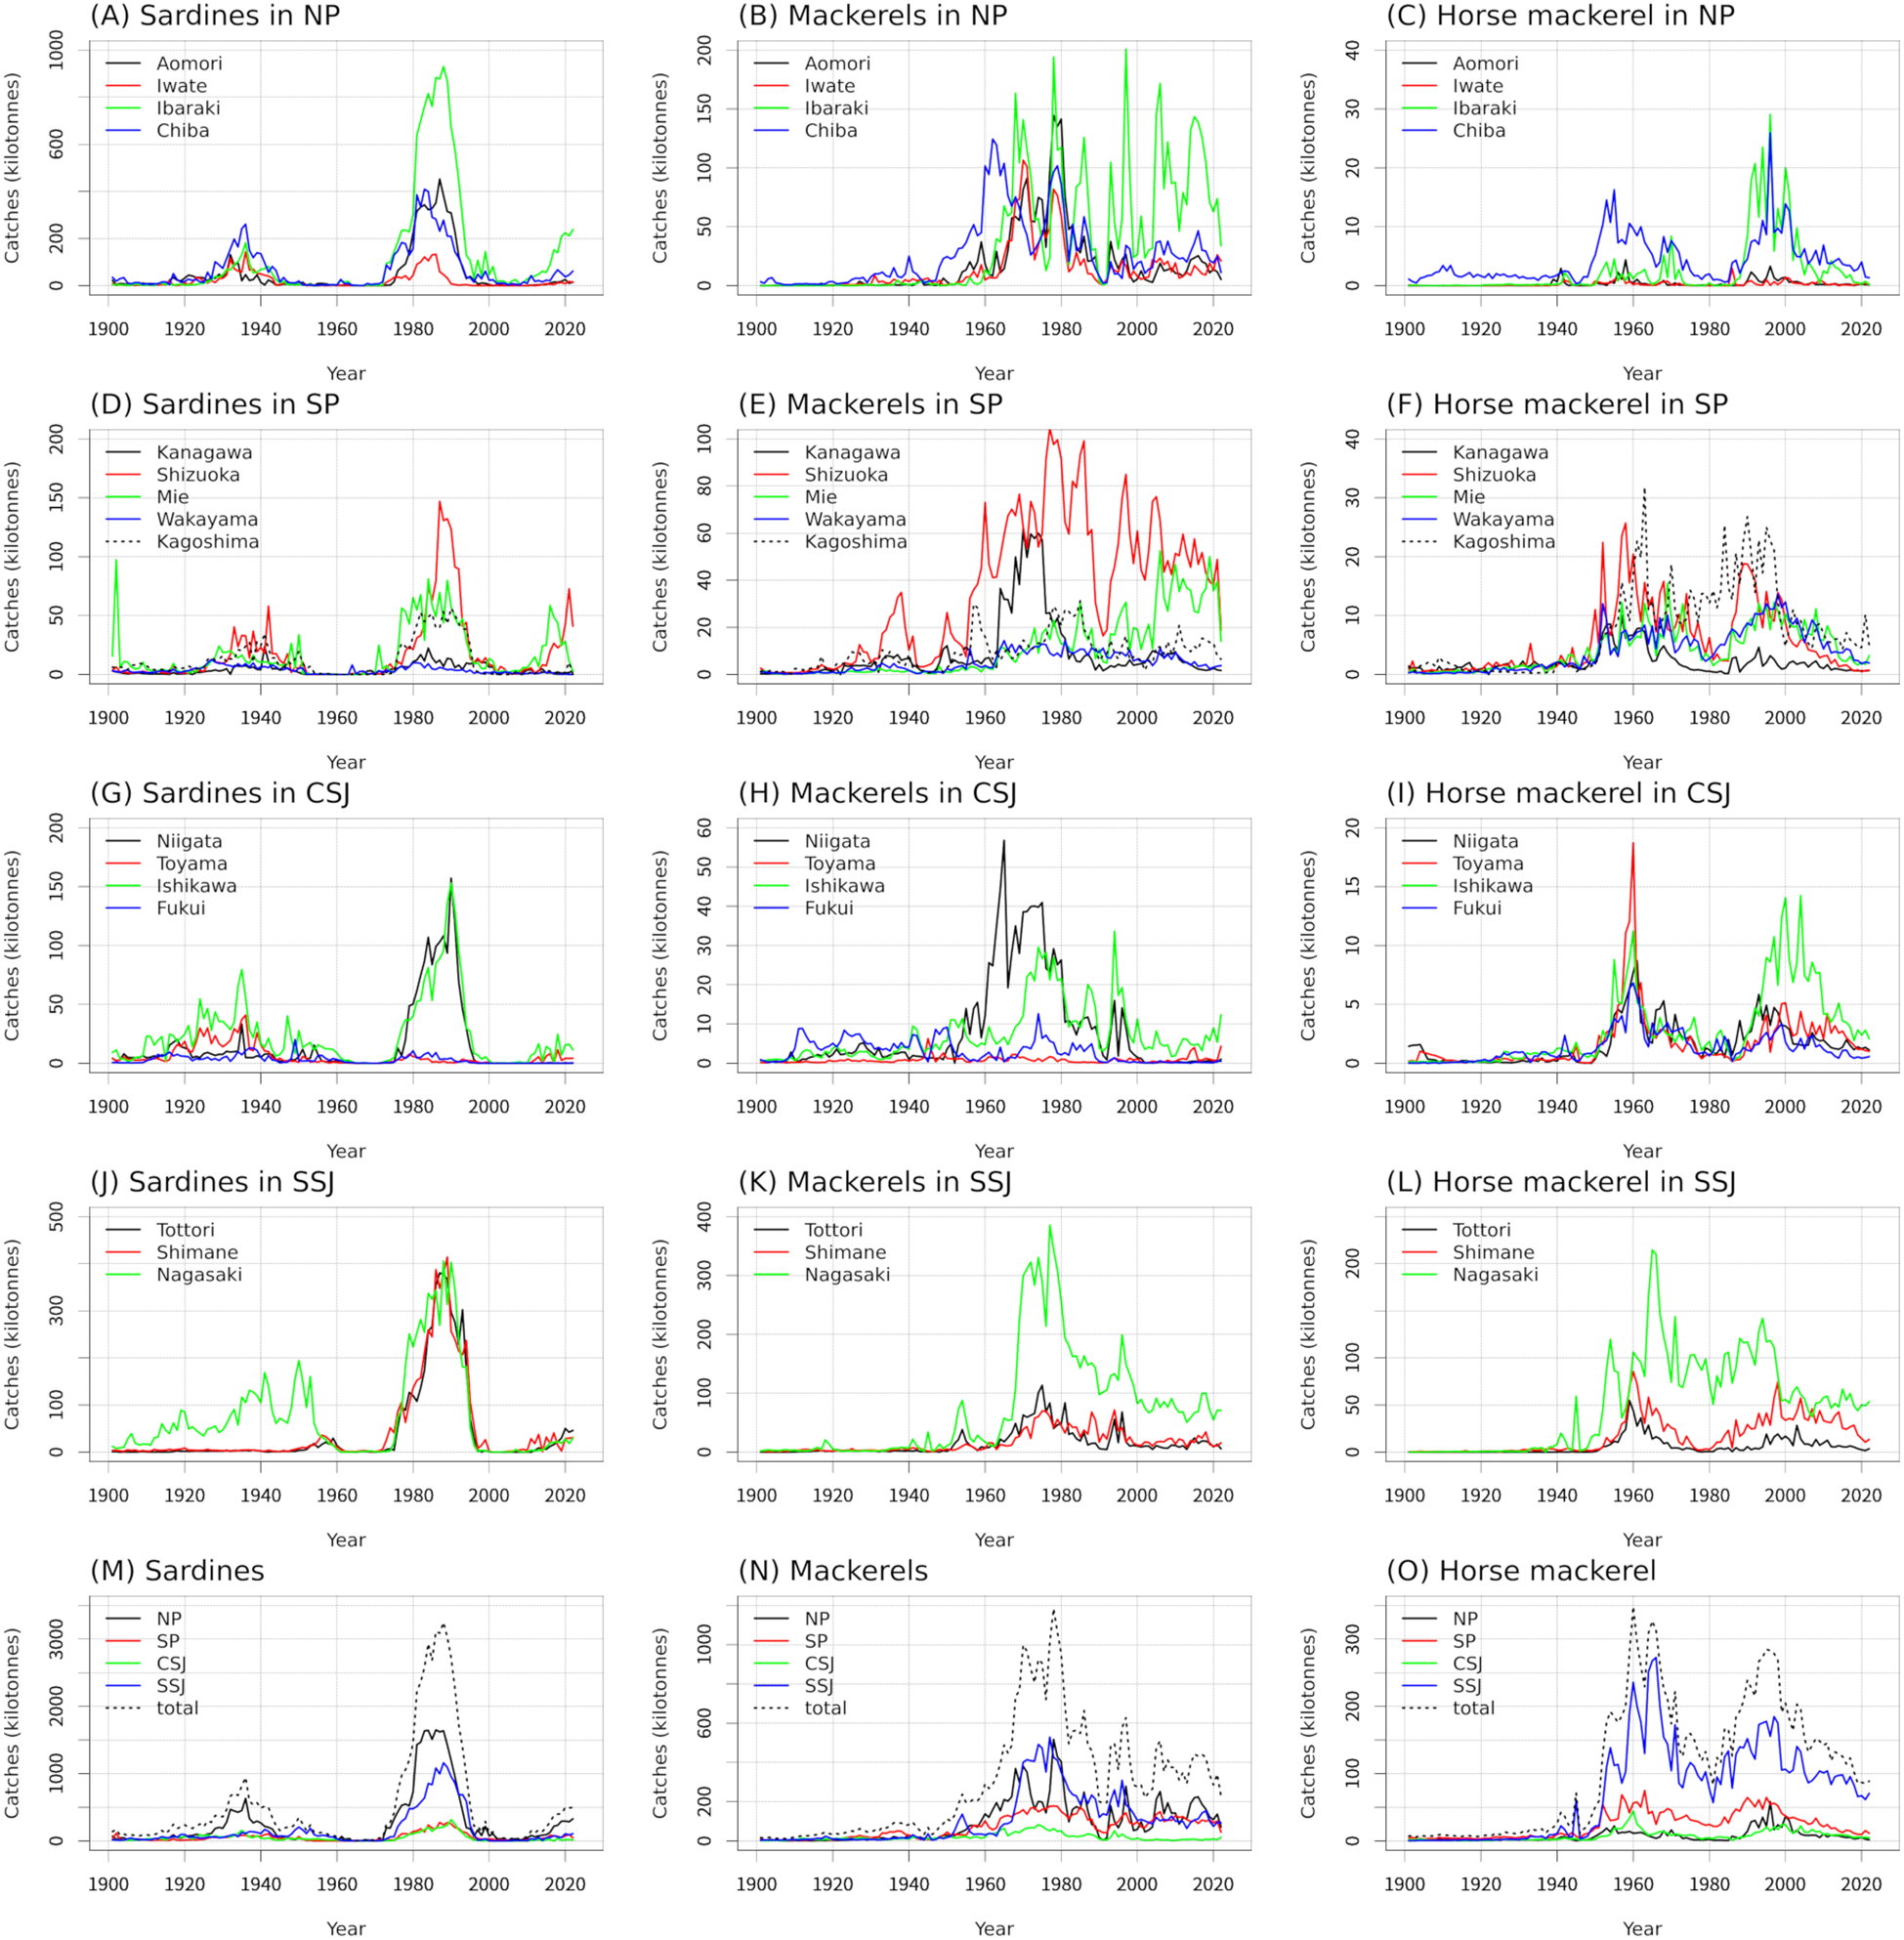
Timeseries of catches of sardines (A, D, G, J, M), mackerels (B, E, H, K, N), and horse mackerel (C, F, I, L, O) in each area. NP, Northern Pacific; SP, Southern Pacific; CSJ, Central Sea of Japan; SSJ, Southern Sea of Japan.
Figure 3
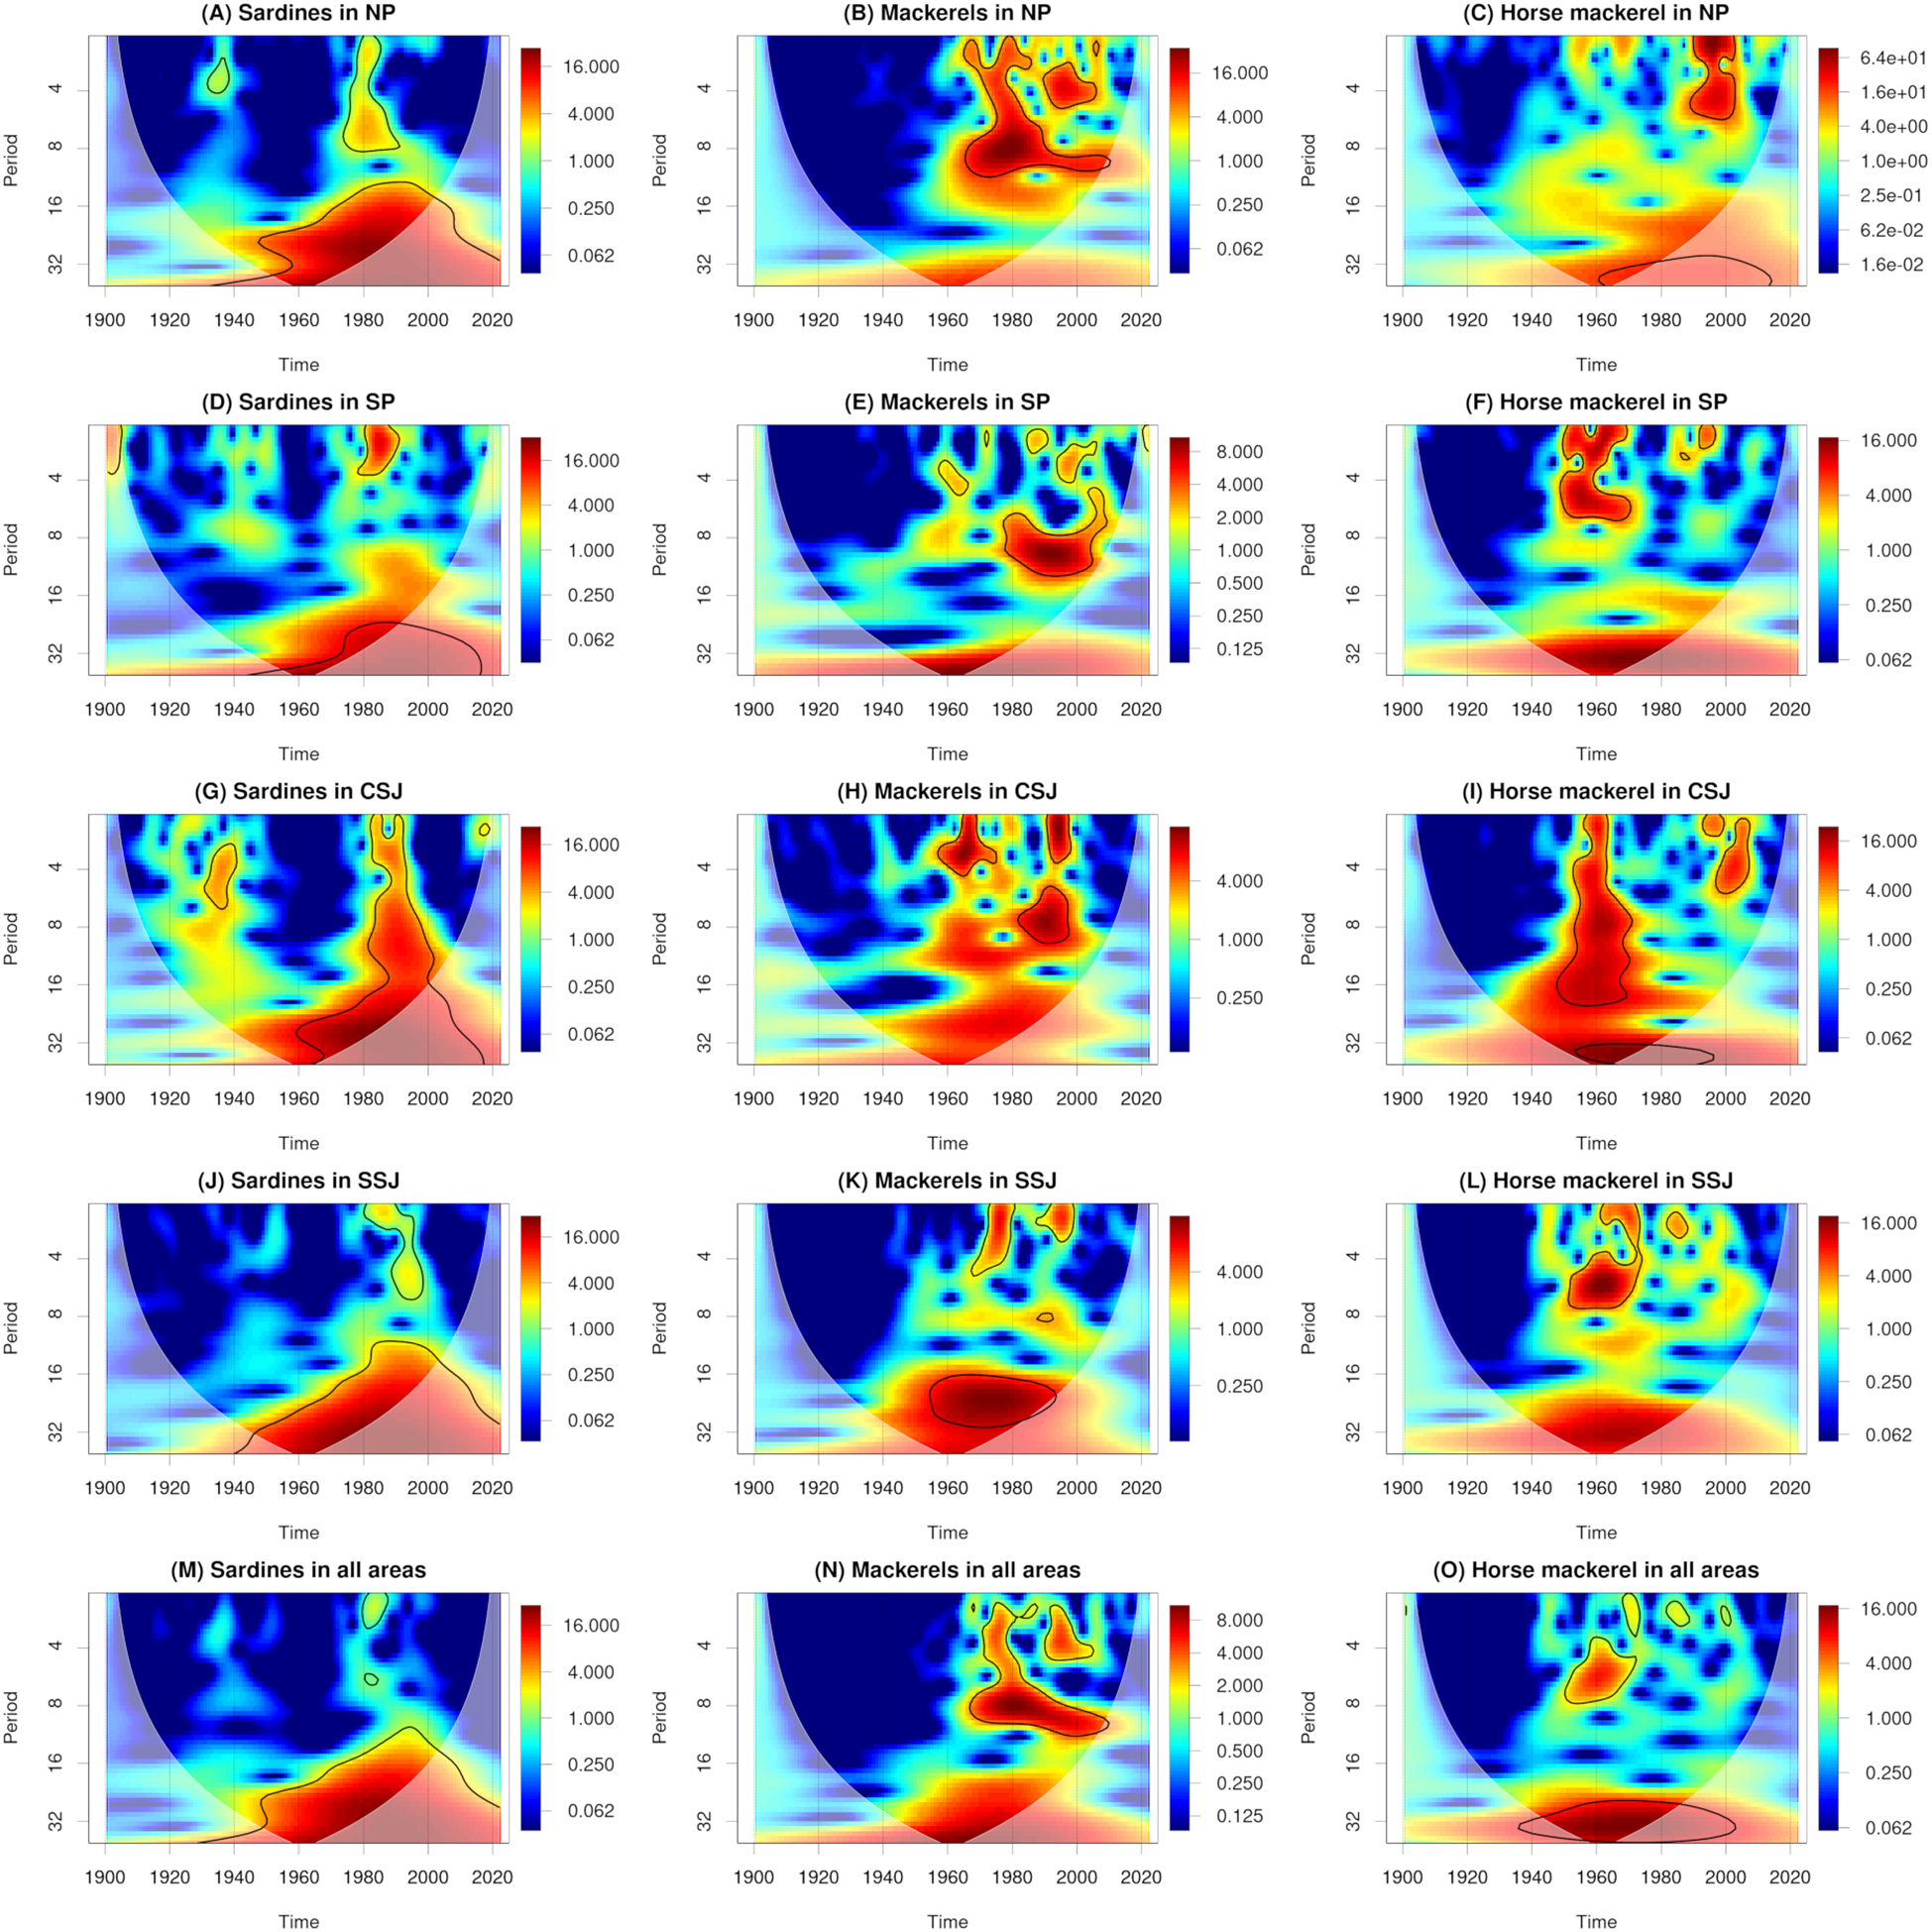
Wavelet power spectra of catches of sardines (A, D, G, J, M), mackerels (B, E, H, K, N), and horse mackerel (C, F, I, L, O). Solid black lines and white shading show statistically significant values (95% confidence interval) and cones of interference, respectively.
Mackerels
In the 1950s, peak catches of mackerels were observed in Kagoshima in the SP (30 kilotonnes; Figure 2E). In the 1960s, peak catches were observed in Chiba in the NP (124 kilotonnes) and in Niigata in the CSJ (57 kilotonnes; Figure 2H). In the 1970s, peak catches were observed in Aomori, Iwate, and Ibaraki in the NP (107−194 kilotonnes; Figure 2B); in Kanagawa in the SP (62 kilotonnes; Figure 2E); in Niigata and Ishikawa in the CSJ (30−41 kilotonnes; Figure 2H); and in Tottori, Shimane, and Nagasaki in the SSJ (70−385 kilotonnes; Figure 2K). Peak catches were also observed in the NP (517 kilotonnes), SP (178 kilotonnes), CSJ (83 kilotonnes), and SSJ (529 kilotonnes), and in the study area overall (1184 kilotonnes; Figure 2N). In Ibaraki in the NP (126 kilotonnes) and Shizuoka and Mie in the SP (31−99 kilotonnes), significant decadal fluctuations in catches were observed beginning in the 1980s (Figures 2B, E). In the 1990s, peak catches were observed in Ishikawa in the CSJ (34 kilotonnes; Figure 2H), in Nagasaki in the SSJ (199 kilotonnes; Figure 2K), and in the study area overall (627 kilotonnes; Figure 2N). Catches were higher in the NP and SSJ than in the SP and CSJ (Figure 2N). In the NP and SSJ and in the study area overall, statistically significant wavelet power at periods of around 1–24 years was observed around the 1970s, corresponding to the observation of peak catches during this decade (Figures 3B, K, N).
Horse mackerel
Around 1960, peak catches of horse mackerel were observed in all prefectures except Aomori, Iwate, and Ibaraki in the NP (9−215 kilotonnes). Peak catches were also observed in the SP (75 kilotonnes), CSJ (44 kilotonnes), and SSJ (273 kilotonnes) and in the study area overall (348 kilotonnes; Figures 2C, F, I, L, O). In the 1990s, peak catches were observed in Ibaraki and Chiba in the NP (26−29 kilotonnes; Figure 2C); in Mie, Wakayama, and Kagoshima in the SP (12−27 kilotonnes; Figure 2F); in Ishikawa in the CSJ (12 kilotonnes; Figure 2I); and in Shimane and Nagasaki in the SSJ (75−142 kilotonnes; Figure 2L). Peak catches were also observed in the NP (58 kilotonnes), SP (65 kilotonnes), CSJ (24 kilotonnes), and SSJ (185 kilotonnes) and in the study area overall (285 kilotonnes; Figure 2O). The peak catches in the 1960s were larger than those in the 1990s (Figure 2O). Catches were higher in the SSJ than in the NP, SP, and CSJ (Figure 2O). In the SP, CSJ, and SSJ and in the study area overall, statistically significant wavelet power at periods of around 1 to 32 years was observed around 1960, corresponding to the timing of peak catches (Figures 3F, I, L, O). In the NP and CSJ, statistically significant wavelet power at periods of around 1 to 4 years was observed in the 1990s, corresponding to the observation of peak catches in this decade (Figures 3C, I).
Relationship between catches of sardines and mackerels
In the NP, statistically significant wavelet coherence of periods of around 4–8 years was observed from the 1960s to the 1980s. There was an anti-phase coherence (i.e., the period was off by 180°) during this time (Figure 4A). In the SP, statistically significant wavelet coherence of periods of around 8–32 years was observed from the 1970s to the 2000s. There was a phase where catches of mackerels led catches of Japanese sardine (Figure 4D). In the CSJ, statistically significant wavelet coherences for periods of around 6–8 years and around 24 years were observed from the 1980s to the 2000s and from the 1940s to the 2010s, respectively. There was a phase where catches of mackerels led catches of Japanese sardine, and a phase where catches of sardines or Japanese sardine led catches of mackerels (Figure 4G). In the study area overall, statistically significant wavelet coherence for periods of around 16–32 years was observed from the 1940s to the 2010s. There was an anti-phase coherence and a phase where catches of mackerels led catches of sardines or Japanese sardine (Figure 4M).
Figure 4
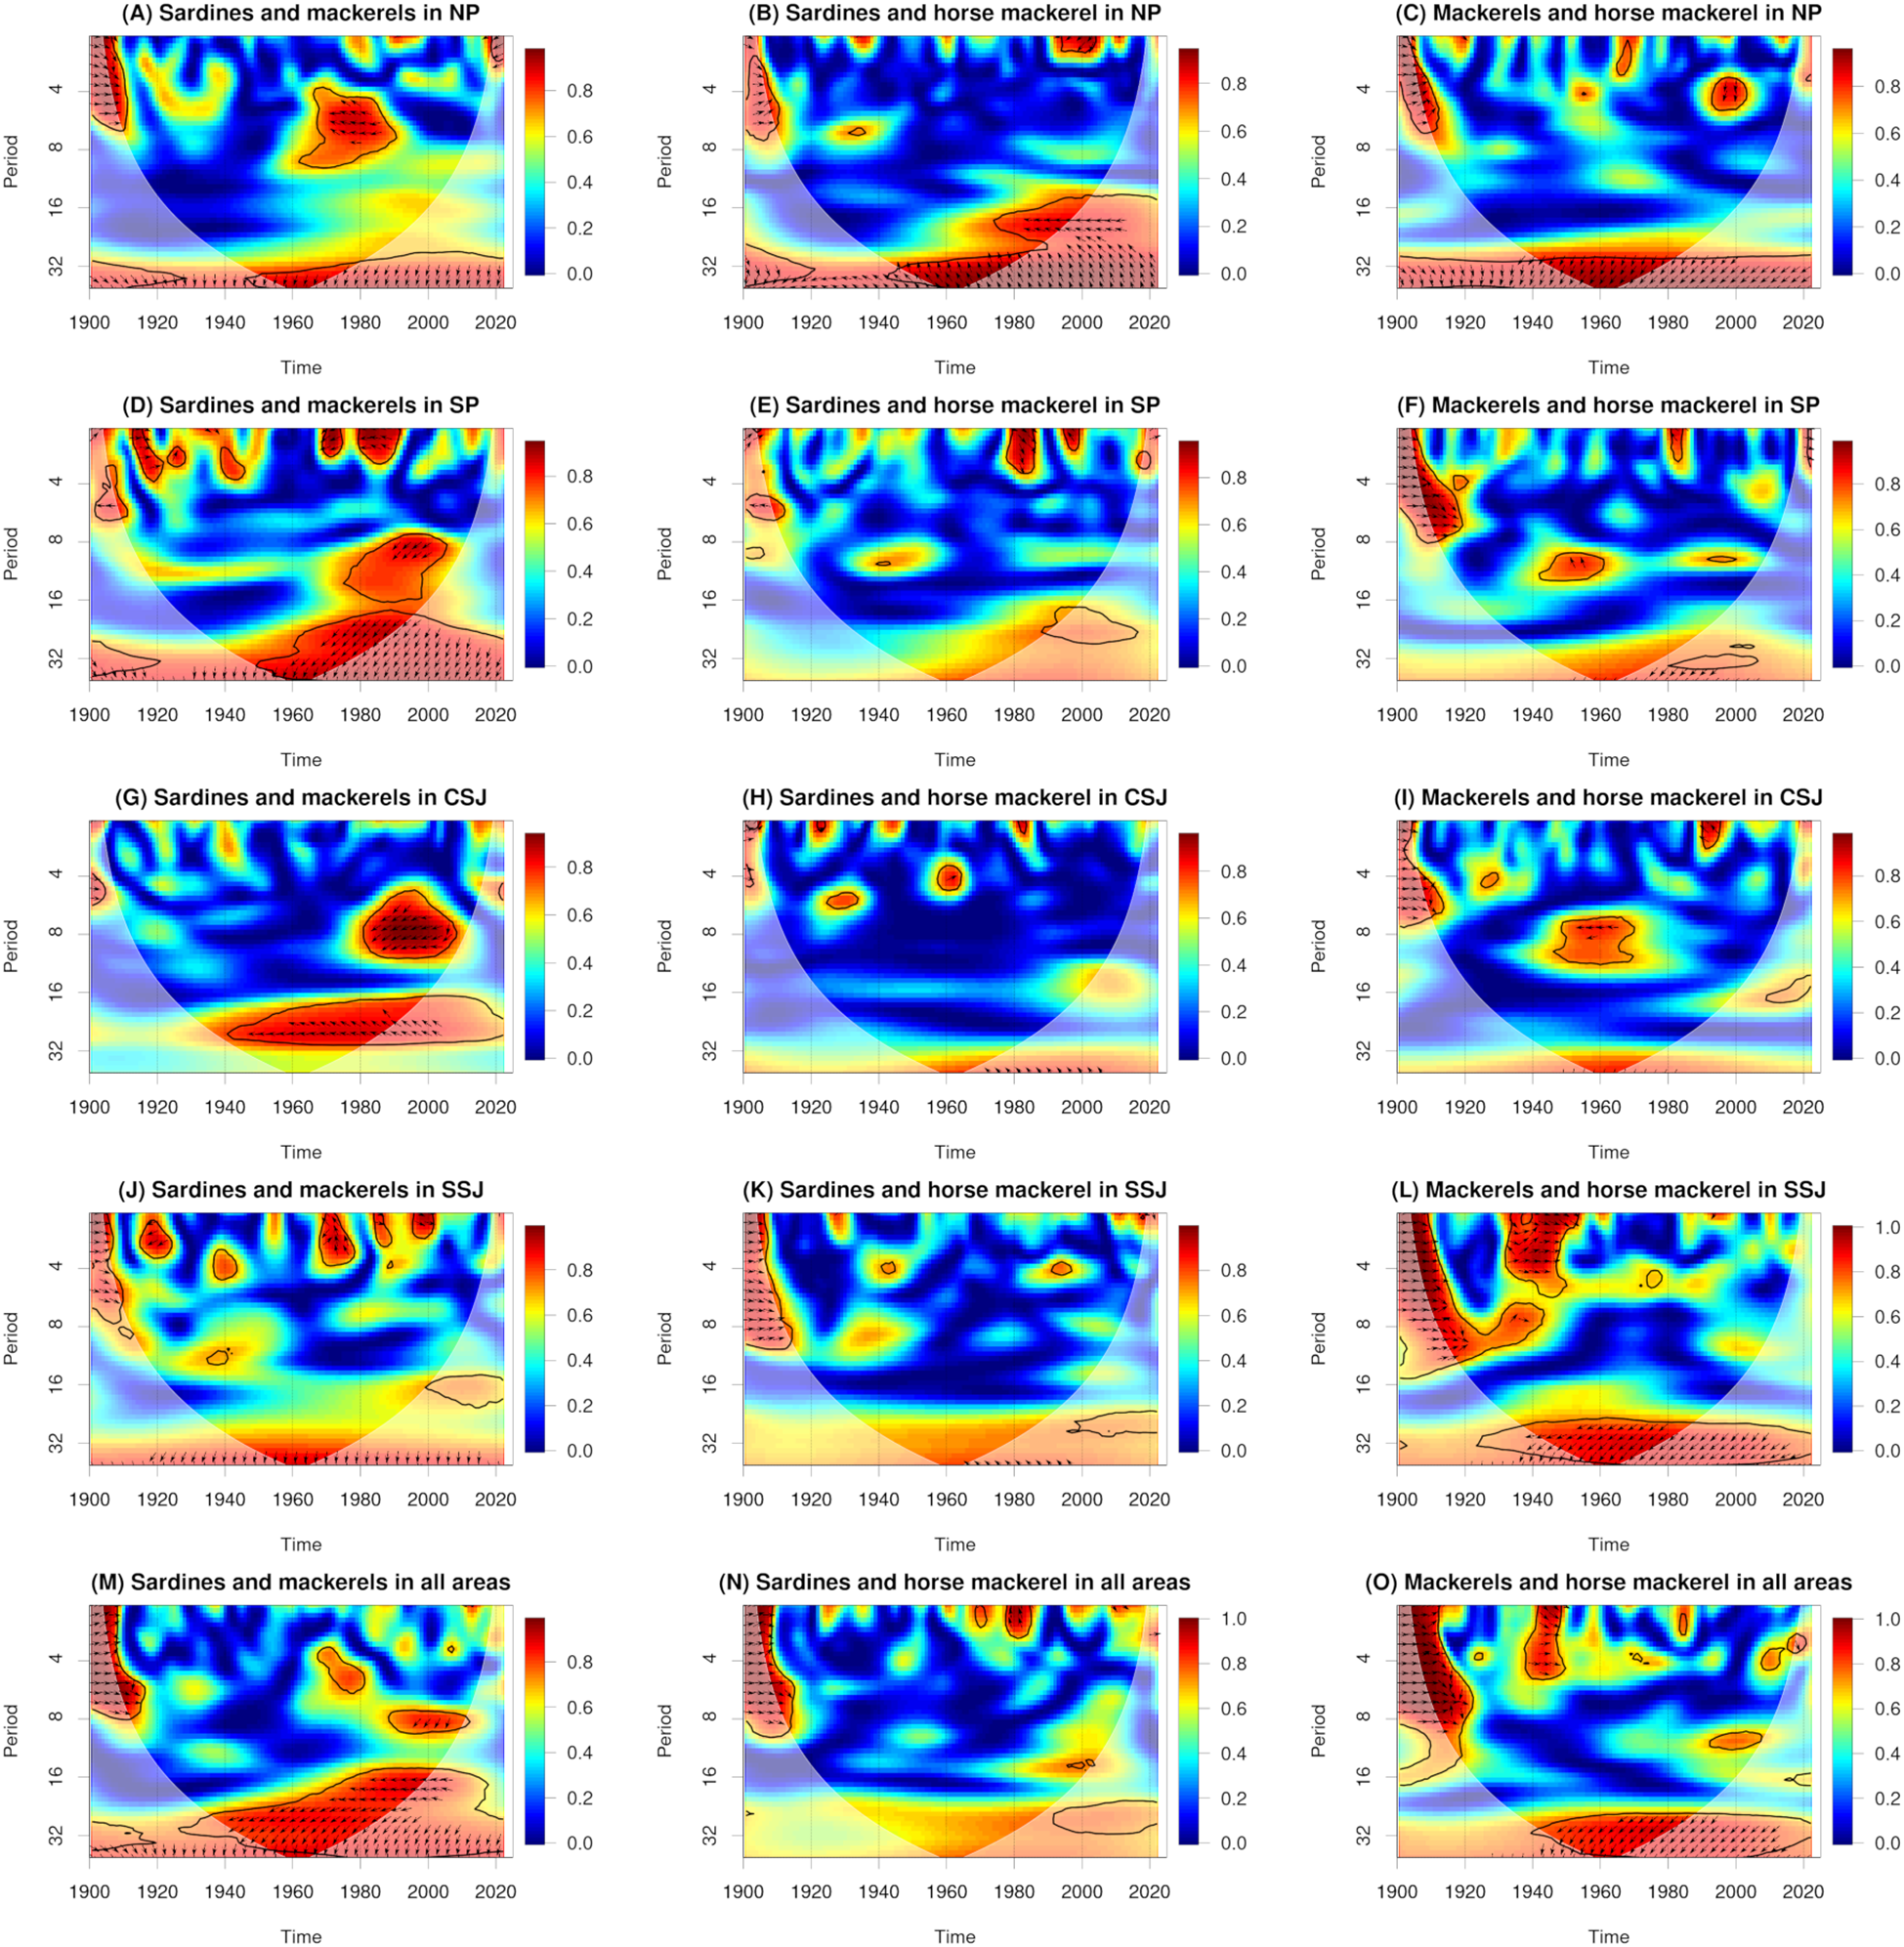
Wavelet coherences and phases between catches of sardines and mackerels (A, D, G, J, M), sardines and horse mackerel (B, E, H, K, N), and mackerels and horse mackerel (C, F, I, L, O). Solid black lines, arrows, and white shading show statistically significant values (95% confidence interval), phase directions, and cones of interference, respectively. A right-facing arrow indicates that the first and second parameters are in phase. A left-facing arrow indicates that the first and second parameters are in anti-phase. An up-facing arrow indicates that the first parameter leads the second by π/2. A down-facing arrow indicates that the second parameter leads the first by π/2.
Relationship between catches of sardines and horse mackerel
In the NP, statistically significant wavelet coherence for periods of around 16–32 years was observed from the 1950s to the 2010s. There was an anti-phase coherence and a phase where catches of Japanese sardine led catches of horse mackerel (Figure 4B).
Relationship between catches of mackerels and horse mackerel
In the NP and SSJ and in the study area overall, statistically significant wavelet coherence for periods of around 32 years was observed from the 1940s to the 2010s. There was a phase where catches of horse mackerel led catches of mackerels (Figures 4C, L, O).
Discussion
Spatiotemporal variability of sardines, mackerels, and horse mackerel at 100-year scale
In many of the studied prefectures, peak catches of sardines were observed in the 1930s, of Japanese sardine in the 1980s, of mackerels in the 1970s, and of horse mackerel around 1960 and in the 1990s (Figure 2). This result is consistent with a previously reported regime shift identified from catch data both across all Japanese waters and only along Japan’s Pacific coast (Kawasaki, 2002; Oozeki et al., 2007; Takasuka, 2007; Watanabe, 2007; Yatsu and Kawabata, 2017; Yatsu, 2019). Corresponding to these peaks, statistically significant wavelet power spectra were identified over periods of several years to several decades (Figure 3). In addition, wavelet coherences and phases were identified (Figure 4). These results indicate that regime shifts occurred once for sardines, once for Japanese sardine, once for mackerels, and twice for horse mackerel over the past 120 years in the waters near Japan.
One mechanism that has been hypothesized to explain changes in fish catches over time is termed the “optimal growth temperature” (Takasuka, 2007, 2009; Takasuka et al., 2008a, b). Because the optimum water temperature for spawning and early-life-stage growth differs among fish species, changes of temperature caused by climate change could affect survivorship (Takasuka, 2007, 2009; Takasuka et al., 2008a, 8b). In the North Pacific, the optimum temperatures for spawning and alevins are 13.2–20.2°C and 13.8–20.4°C, respectively, for Japanese sardine and 15.5–21.9°C and 15.5–22.1°C, respectively, for mackerels (Takasuka et al., 2008b). Similarly, the optimum temperatures for alevins of jack mackerels (T. japonicus) are 17.1–28.0°C (Takasuka et al., 2008b). This suggests that decadal changes of water temperature caused by ocean–atmosphere interactions could have changed the favourability of the environment for spawning and alevins and triggered regime shifts among Japanese sardine, mackerels, and horse mackerel.
Catch data can reflect regime shifts caused by natural environmental changes as well as those triggered by human activity. For instance, Yatsu (2019) suggested that overfishing in the 1990s and early 2000s could have prevented the recovery of Pacific sardines and mackerels. In the present study, we examined the numbers of fishers and vessels in the NP, SP, CSJ, and SSJ as well as in the study area overall from 1901 to 2022 (data are from the same statistics books as those used to obtain catch data; Figure 5). Although data are missing for some time periods, the data that are available suggest that the number of fishers remained nearly constant from the 1900s to the 1930s, reached a maximum in the 1950s, and gradually decreased until around 2000 (Figure 5A). The number of fishing vessels peaked in the 1900s and again in the 1950s, and gradually decreased from the 1980s to 2020 (Figure 5B). Although these data do not reflect the fishing effort or number of fishing days, nevertheless, large increases or reductions in the numbers of fishers and vessels were not observed during periods when there were clear increases or reductions in the catches of sardines, mackerels, or horse mackerel (Figure 2). This is consistent with the contention by Yatsu (2019) that regime shifts are mainly caused by natural factors despite some influence of human activities.
Figure 5
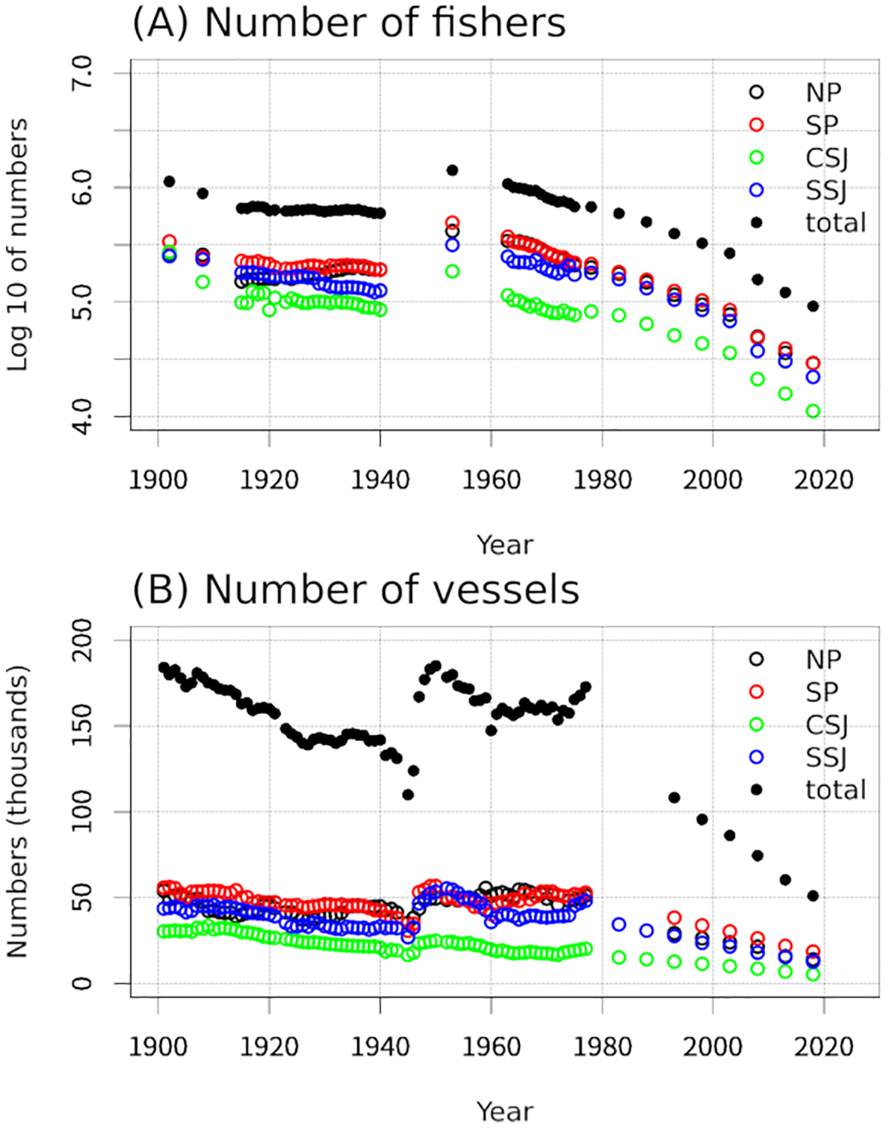
Timeseries of the number of fishers (A) and fishing vessels (B).
Relationship between regime shifts and a climate index
Many previous studies have reported correlations between food resources of pelagic migratory fish near Japan and wintertime values of climate and ocean indices such as the North Pacific Index (NPI; Trenberth and Hurrell, 1994), Pacific Decadal Oscillation (Zhang et al., 1997; Mantua and Hare, 2002), North Pacific Gyre Oscillation (Di Lorenzo et al., 2008), Arctic Oscillation (Thompson and Wallace, 2000), and Monsoon Index (Yasuda and Hanawa, 1999; Yatsu, 2019). The mechanism for increased catches of Pacific sardines, in particular, has been described in Takasuka (2007) and Watanabe (2007). In the NP and SP, when the Aleutian Low and the Oyashio Cold Current in winter are strong, water temperatures drop and the mixed layer deepens in the Kuroshio Extension area. During such times, negative anomalies in the wintertime NPI are observed. The deep mixed layer enables an increase in the biomass of phytoplankton and zooplankton, which provide food for sardines during their early life stages. This increase in the early survival probability of sardines in turn boosts reproductive success. As a result, the biomass of sardines increases.
Compared with the catches of sardines in the Pacific, our understanding of the relationships between catches of sardines, mackerels, and horse mackerel along the Tsushima Warm Current and climatic and oceanic environmental factors remains insufficient (Tian et al., 2008). Our study provides some insights into these relationships. For example, our results for NPI in winter show wavelet coherences between the NPI in winter (November−March; Supplementary Figure 1) and catches of sardines, mackerels, and horse mackerel (Figure 6). For Japanese sardine, a statistically significant wavelet coherence for periods of about 16 years was observed from the 1970s to the 2010s for the NP, SP, CSJ, and SSJ. There was a phase where catches of Japanese sardine led the NPI in winter (Figure 6A, D, G, J, M). For mackerels, statistically significant wavelet coherences for periods of around 4–6 years and 16 years were observed in the CSJ around 1940 and from the 1980s to the 2000s, respectively. In the former case, there was a phase where catches of Japanese sardine led the NPI in winter, and in the latter case, there was a phase where the NPI in winter led catches of mackerels (Figure 6H). In the SSJ, statistically significant wavelet coherences for periods of around 4–10 years and around 20 years were observed from the 1950s to the 1990s and from the 1950s to the 2010s, respectively. In the former case, there was a phase where catches of mackerels led the NPI in winter, whereas in the latter case, there was a phase where the NPI in winter led catches of mackerels (Figure 6K). In the study area overall, statistically significant wavelet coherences for periods of around 8 years and around 16 years were observed from the 1980s to the 1990s and from the 1950s to the 2010s, respectively. In the former case, there was a phase where catches of mackerels led the NPI in winter, whereas in the latter case, there was a phase where the NPI in winter led catches of mackerels (Figure 6N). For horse mackerel, a statistically significant wavelet coherence for periods of around 12–20 years was observed in the NP from the 1940s to the 2010s. There was a phase where the NPI in winter led catches of horse mackerel (Figure 6C). In the SP, a statistically significant wavelet coherence for periods of around 1–6 years was observed around 1960. There was a phase where the NPI in winter led catches of horse mackerel (Figure 6F).
Figure 6
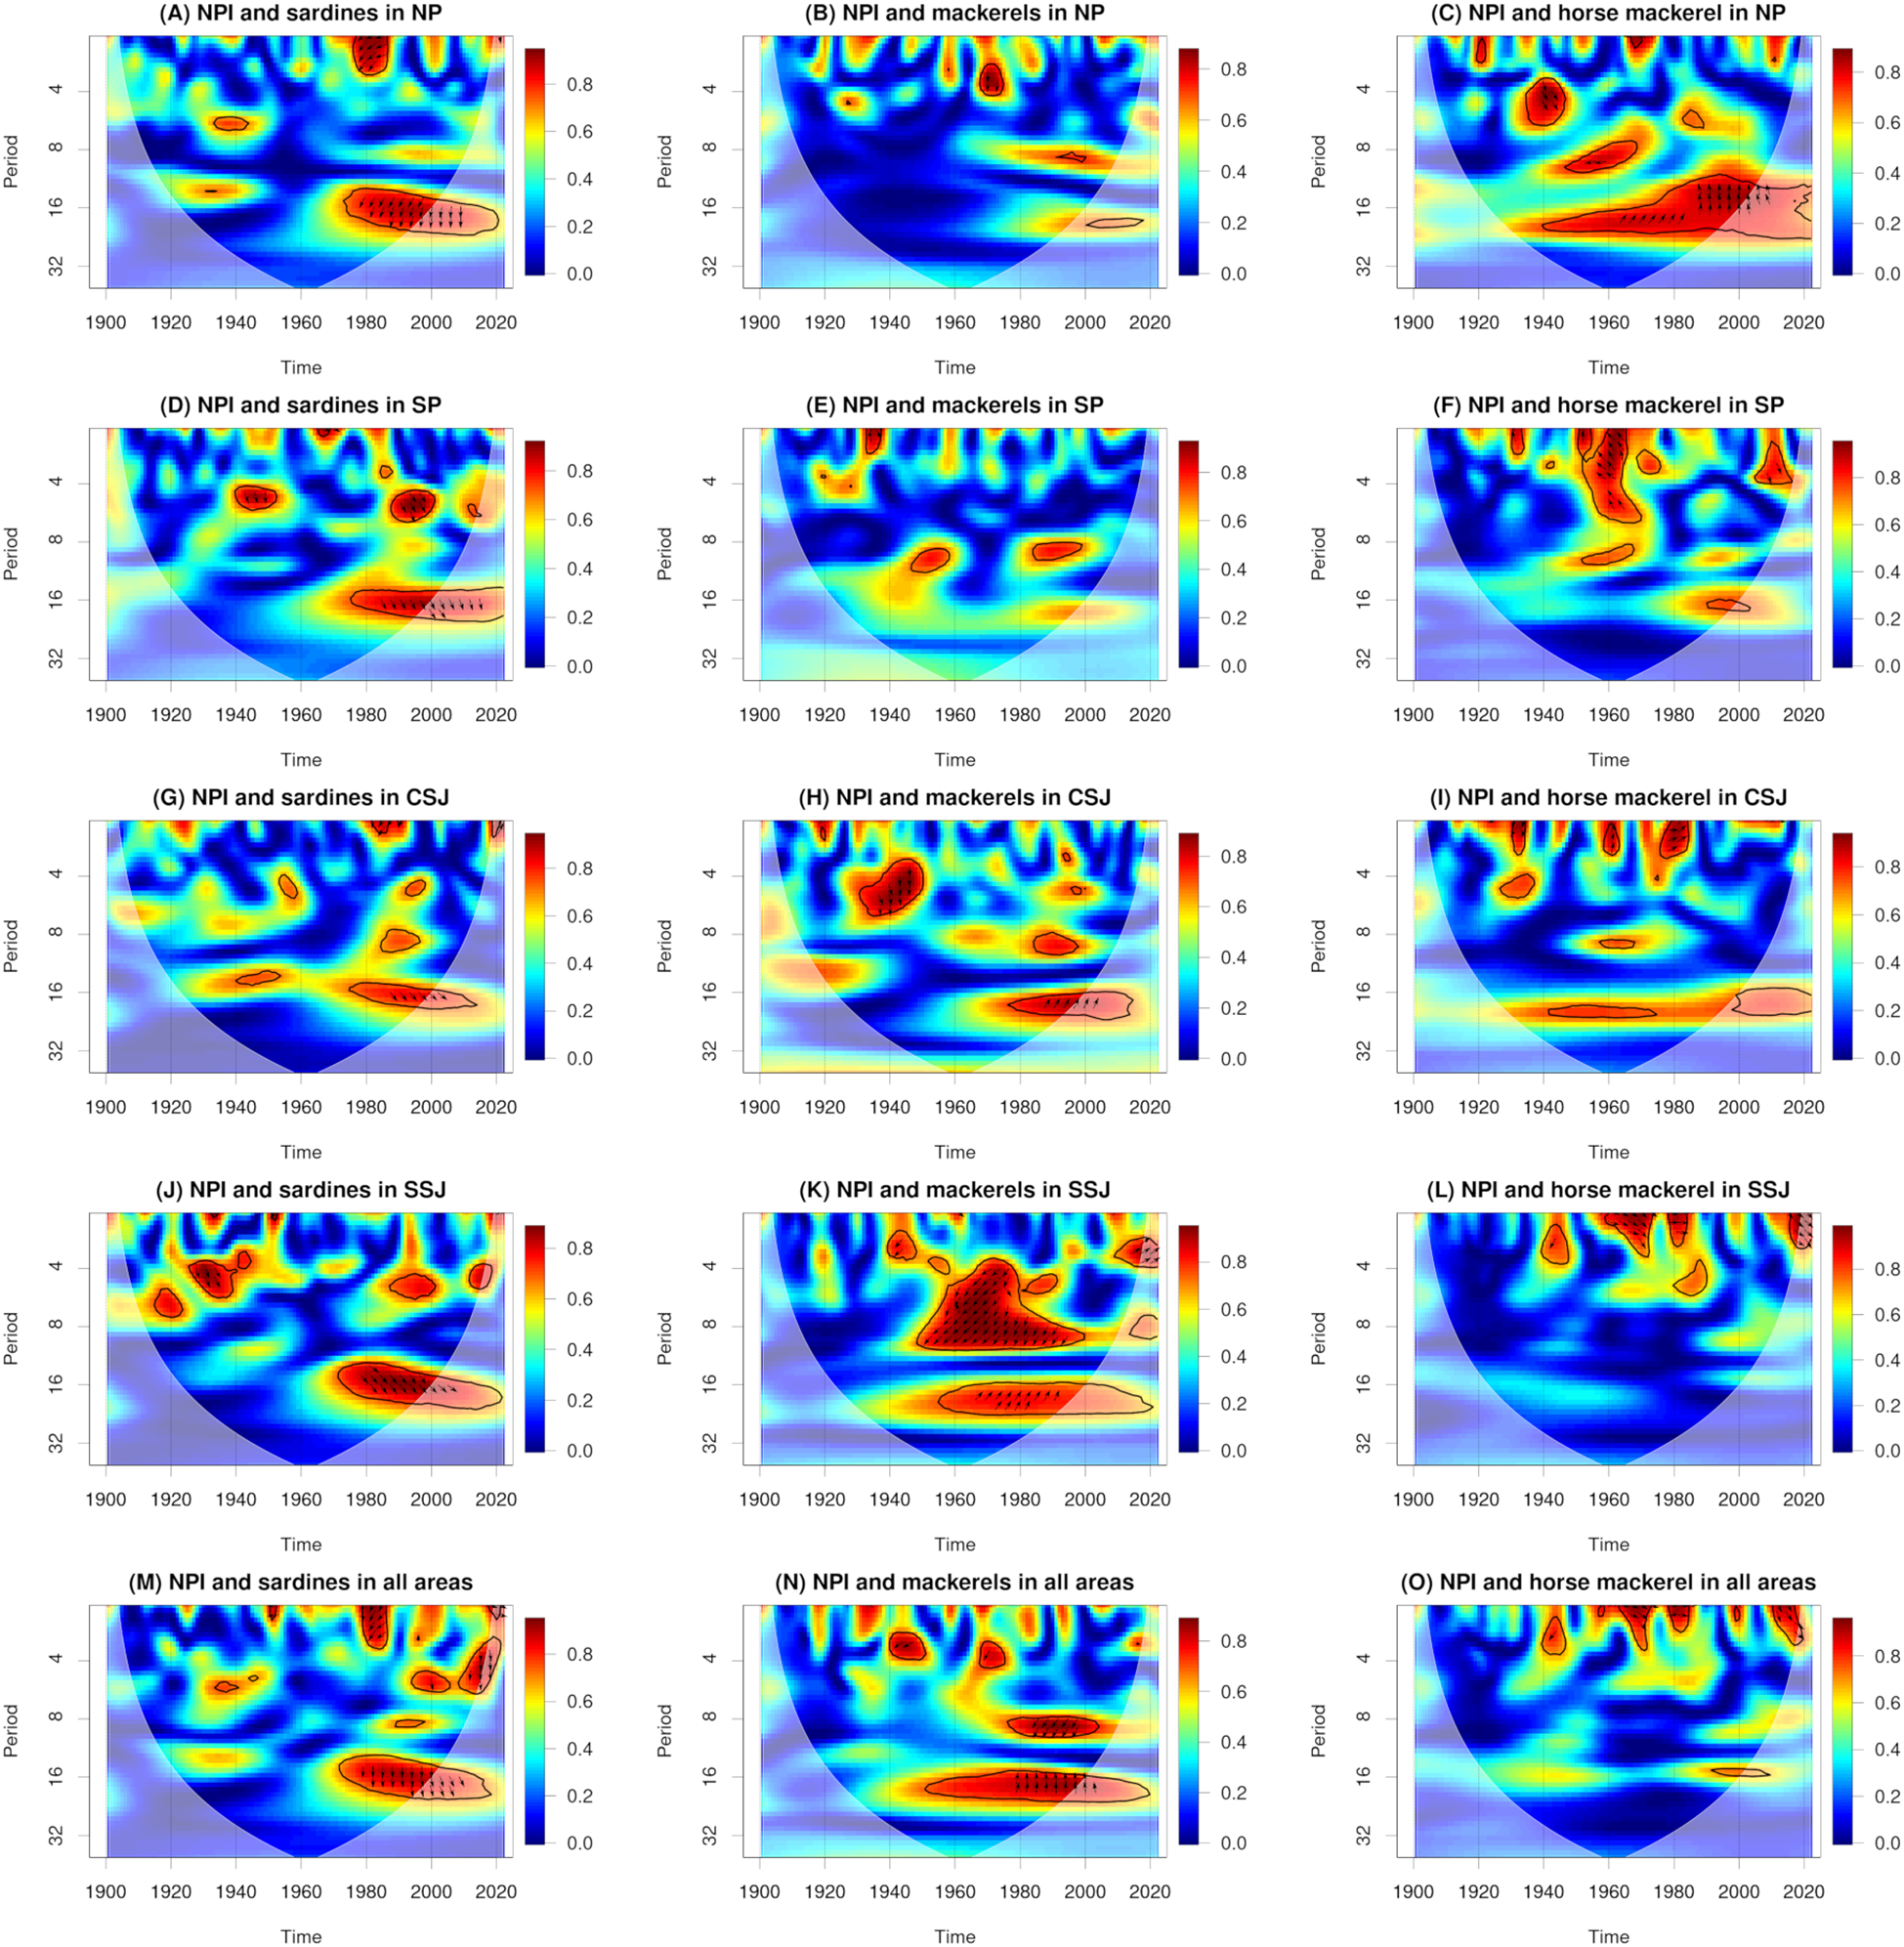
Wavelet coherences and phases between the North Pacific Index (NPI) in winter (November−March) and catches of sardines (A, D, G, J, M), mackerels (B, E, H, K, N), and horse mackerel (C, F, I, L, O). Solid black lines, arrows, and white shading show statistically significant values (95% confidence interval), phase directions, and cones of interference, respectively. A right-facing arrow indicates that the first and second parameters are in phase. A left-facing arrow indicates that the first and second parameters are in anti-phase. An up-facing arrow indicates that the first parameter leads the second by π/2. A down-facing arrow indicates that the second parameter leads the first by π/2.
These results indicate that in the NP, SP, CSJ, and SSJ, there was a connection between the NPI in winter and catches of Japanese sardine in the 1980s but no connection to catches of sardines in the 1930s. This differs from a previous study that found a connection between the NPI in winter and catches of sardines in the 1930s (Watanabe, 2007). Our results also show connections between the NPI in winter and catches of mackerels in the CSJ and SSJ and of horse mackerel in the NP and SP. In the Sea of Japan, previous studies have suggested a connection between water temperature variability in summer and winter and fish community compositions during the early 1970s and mid-1990s (Tian et al., 2008; Tian, 2014). More work is needed to examine the relationship between water temperature variability and catch data to clarify the factors underlying wavelet coherences between the NPI in winter and catches of mackerels and horse mackerel.
Limitations and perspectives
Despite detection of regime shifts among sardines, Japanese sardine, mackerels, and horse mackerel by analysing catch data at a 100-year scale, our approach suffers from at least four limitations.
First, we could not simultaneously access all statistical books in a single library collection. Recent advances in digital transformation allowed us to easily find the location of each statistical book by searching for bibliographic information online. However, the contents of the statistical books were not standardized by era or prefecture. For this reason, visual inspection of each statistical book was essential. Recently, in Japan, the online publication of digitally archived books and journals (as PDF files) is gradually being carried out by the National Diet Library (National Diet Library, 2011). By accessing these data published online, we could reduce the necessity of in-person library visits. However, not all statistical books were available online. In addition, several volumes of statistical books were missing because of the effects of war and natural disasters. For these reasons, our method required a huge investment of time and effort to conduct the literature survey, which is the first step in retrieving historical dark data.
Second, almost all numerical data in the statistical books were printed in analogue form. Despite recent advances in optical character recognition, it remains quite difficult to scan and digitize large amounts of numerical data at once. Moreover, this type of large-scale scanning and digitization can raise ethical issues concerning copyright and data-use policy. Additionally, documents that have been digitized in this way require visual inspection to identify obvious misprints and improve data quality. For these reasons, further time and effort were required for the digitization of numerical data, which is the second step in retrieving historical dark data.
Third, the number of fish species included in the statistical books was limited. In addition, some statistical books grouped multiple fish species (e.g., sea breams and flatfish) into a single category. The volume of catches appears to be an important criterion for the inclusion of fish species in statistical books in Japan. However, socially, economically, and culturally important fish species should be examined regardless of their catch volume to understand changes in fish catches under climatic and societal change. A deep understanding of the interactions among various fish species is needed to evaluate the spatiotemporal variability of biodiversity and nature’s contributions to people (Díaz et al., 2018). For these reasons, more work should be done to examine the spatiotemporal variability of as many fish species as possible at 100-year scales.
Fourth, the catch data used in this study include uncertainties caused by differences in aggregation methods among time periods. Yamamoto (1960) indicated that catch data published before 1957 include various kinds of systematic errors such as inconsistencies in the number of surveys per year, human error (regarding the fish species and amount), and a lack of classification of coastal and farmed fishes. The difference between catch data based on “Regional fisheries statistics” (1946−1956) and “Personal fisheries statistics” (1901−1945 and 1957−2022) is expected to have been small during the era of coastal fisheries (before 1945), but large in the era of coastal and offshore fisheries because of the diversification of fishing gear and enlargement of fishing vessels. Additionally, the difference is small for coastal fishes, but large for offshore fishes such as sardines, tunas, and common squid (Inoue, 2013). Despite the importance of this difference for regional economic evaluation and analysis, we assumed that this difference was small relative to the magnitude of stock variability for sardines, Japanese sardine, mackerels, and horse mackerel in each area at the 100-year scale.
At least until a few decades ago, readers of statistical books were likely to be concerned primarily with fishery economics instead of environmental sciences. However, regardless of the field of inquiry, the catch data contained in statistical books are invaluable for assessing interactions among the atmosphere and ocean, human activities, and marine ecosystems at 100-year scales. In other words, these records should be considered a common intellectual property for all humanity. Because of this, one difficult but important task is the removal of language barriers (Amano et al., 2016; Shin et al., 2024) by retrieving and analysing statistical books published in languages other than English. Despite the requirement of a huge amount of time and effort to do this work, examining catch data contained in statistical books from the perspective of the social sciences, including analyses of economics, folklore, and dietary culture, is likely to prove highly useful. Further work is needed to apply this methodology to other species and prefectures.
Statements
Data availability statement
The original contributions presented in the study are included in the article/Supplementary Material. Further inquiries can be directed to the corresponding author.
Author contributions
NS: Conceptualization, Data curation, Formal analysis, Funding acquisition, Investigation, Methodology, Validation, Visualization, Writing – original draft, Writing – review & editing. YS: Conceptualization, Data curation, Investigation, Validation, Writing – review & editing. CK: Data curation, Investigation, Validation, Writing – review & editing. HN: Data curation, Investigation, Validation, Writing – review & editing. HM: Formal analysis, Investigation, Methodology, Validation, Writing – review & editing.
Funding
The author(s) declare that financial support was received for the research and/or publication of this article. Japan Society for the Promotion of Science supported (will) our travel expenses, printing charge, fee of English correction service, and publication fee. This study was supported by grants from JSPS KAKENHI (grant numbers JP21H05178, JP22H05244, JP24H00935, and JP24K21357).
Acknowledgments
We are grateful to all the librarians consulted, especially those at the National Diet Library, the Ministry of Agriculture, Forestry, and Fisheries Library, and the Japan Agency for Marine-Earth Science and Technology Library, for their support during the retrieval of fisheries statistical books. We are also grateful to Dr. Taku M. Satoh for providing constructive comments. We are grateful to the editors and two reviewers for their constructive comments.
Conflict of interest
The authors declare that the research was conducted in the absence of any commercial or financial relationships that could be construed as a potential conflict of interest.
Generative AI statement
The author(s) declare that no Generative AI was used in the creation of this manuscript.
Publisher’s note
All claims expressed in this article are solely those of the authors and do not necessarily represent those of their affiliated organizations, or those of the publisher, the editors and the reviewers. Any product that may be evaluated in this article, or claim that may be made by its manufacturer, is not guaranteed or endorsed by the publisher.
Supplementary material
The Supplementary Material for this article can be found online at: https://www.frontiersin.org/articles/10.3389/fmars.2025.1552708/full#supplementary-material
Supplementary Figure 1Timeseries of the North Pacific Index (NPI) in winter (November−March) (A; NP index data provided by the Climate Analysis Section, NCAR, Boulder, USA, Trenberth and Hurrell, 1994; https://climatedataguide.ucar.edu/climate-data/north-pacific-np-index-trenberth-and-hurrell-monthly-and-winter; accessed April 8, 2025, currently not freely accessible on April 25, 2025) and a wavelet power spectrum of the NPI in winter (B). Solid black lines and white shading show statistically significant values (95% confidence interval) and cones of interference, respectively.
Supplementary file statistical_books_1_csv.zipSummary of printed or online statistical books for 16 prefectures. * : This item was collected by using the remote copy service through the Japan Agency for Marine-Earth Science and Technology Library.
Supplementary file statistical_books_2_csv.zipSummary of printed Agriculture, Forestry and Fisheries Statistics Books for seven prefectures.
References
1
Agricultural and Forestry Statistics Research Society (1978). Fisheries Annual Statistics vol. 3 Prefectural Statistics (Japanese: Agricultural and Forestry Statistics Research Society).
2
Alheit J. Pohlmann T. Casini M. Greve W. Hinrichs R. Mathis M. et al . (2012). Climate variability drives anchovies and sardines into the North and Baltic Seas. Progr. Oceanogr.96, 128–139. doi: 10.1016/j.pocean.2011.11.015
3
Amano T. González-Varo J. P. Sutherland W. J. (2016). Languages are still a major barrier to global science. PloS Biol.14, e2000933. doi: 10.1371/journal.pbio.2000933
4
Auber A. Travers-Trolet M. Villanueva M. C. Ernande B. (2015). Regime shift in an exploited fish community related to natural climate oscillations. PloS One10, e0129883. doi: 10.1371/journal.pone.0129883
5
Chavez F. P. Ryan J. Lluch-Cota S. E. Ñiquen C. M. (2003). From anchovies to sardines and back: multidecadal change in the Pacific Ocean. Science299, 217–221. doi: 10.1126/science.1075880
6
Chiba Prefecture (1952–2006). Agriculture, Forestry and Fisheries Statistics Annual Report of Chiba Prefecture (Japanese).
7
Corbineau A. Rouyer T. Cazelles B. Fromentin J.-M. Fonteneau A. Ménard F. (2008). Time series analysis of tuna and swordfish catches and climate variability in the Indian Ocean, (1968-2003). Aquat. Living Resour.21, 277–285. doi: 10.1051/alr:2008045
8
Corbineau A. Rouyer T. Fromentin J.-M. Cazelles B. Fonteneau A. Ménard F. (2010). Patterns of variations in large pelagic fish: A comparative approach between the Indian and the Atlantic Oceans. Progr. Oceanogr.86, 276–282. doi: 10.1016/j.pocean.2010.04.019
9
Detto M. Wright S. J. Calderón O. Muller-Landau H. C. (2018). Resource acquisition and reproductive strategies of tropical forest in response to the El Niño–Southern Oscillation. Nat. Commun.9, 913. doi: 10.1038/s41467-018-03306-9
10
Díaz S. Pascual U. Stenseke M. Martín-López B. Watson R. T. Molnár Z. et al . (2018). Assessing nature’s contributions to people. Science359, 270–272. doi: 10.1126/science.aap8826
11
Di Lorenzo E. Schneider N. Cobb K. M. Franks P. J. S. Chhak K. Miller A. J. et al . (2008). North Pacific Gyre Oscillation links ocean climate and ecosystem change. Geophys. Res. Lett.35, L08607. doi: 10.1029/2007GL032838
12
Dippner J. W. Fründt B. Hammer C. (2019). Lake or sea? The unknown future of Central Baltic Sea herring. Front. Ecol. Evol.7. doi: 10.3389/fevo.2019.00143
13
Easterday K. Paulson T. DasMohapatra P. Alagona P. Feirer S. Kelly M. (2018). From the field to the cloud: a review of three approaches to sharing historical data from field stations using principles from data science. Front. Environ. Sci.6. doi: 10.3389/fenvs.2018.00088
14
Fishery Agency (2022). FY2022 trend in fisheries, FY2023 fisheries policy. Available online at: https://www.jfa.maff.go.jp/j/kikaku/wpaper/attach/pdf/index-9.pdf (Accessed April 25, 2025).
15
Furtado M. S. C. Queiroz J. C. B. Bentes B. Gouveia N. A. de Lima. M. J. A. Ruffino M. L. et al . (2024). How does climate change affect small scale fisheries? A case study of the Lower Amazon in Brazil. Fisheries Manage. Ecol.31, e12654. doi: 10.1111/fme.12654
16
Gouhier T. Grinsted A. Simko V. (2024). biwavelet: Conduct univariate and bivariate wavelet analyses. Available online at: https://cran.r-project.org/web/packages/biwavelet/index.html (Accessed April 25, 2025).
17
Grant W. S. Clark A.-M. Bowen B. W. (1998). Why restriction fragment length polymorphism analysis of mitochondrial DNA failed to resolve sardine (Sardinops) biogeography: insights from mitochondrial DNA cytochrome b sequences. Can. J. Fish. Aquat. Sci.55, 2539–2547. doi: 10.1139/f98-127
18
Grinsted A. Moore J. C. Jevrejeva S. (2004). Application of the cross wavelet transform and wavelet coherence to geophysical time series. Nonlinear Process. Geophys.11, 561–566. doi: 10.5194/npg-11-561-2004
19
Hamori S. (2017). Interdependence between stock returns: Application of continuous wavelet transform. J. Economics Kwansei Gakuin Univ.71, 39–57.
20
Hare S. R. Mantua N. J. (2000). Empirical evidence for North Pacific regime shifts in 1977 and 1989. Progr. Oceanogr.47, 103–145. doi: 10.1016/S0079-6611(00)00033-1
21
Inoue K. (2013). Using local statistics on fishery products: the case of Tohoku district. J. Center Regional Affairs Fukushima Univ.25, 3–18.
22
Inoue H. Watari S. Sawada H. Lavergne E. Yamashita Y. (2023). Impacts of regime shift on the fishery ecosystem in the coastal area of Kyoto prefecture, Sea of Japan, assessed using the Ecopath model. Fish. Sci.89, 573–593. doi: 10.1007/s12562-023-01691-9
23
Irvine J. R. Fukuwaka M. (2011). Pacific salmon abundance trends and climate change. ICES J. Marine Sci.68, 1122–1130. doi: 10.1093/icesjms/fsq199
24
Ishikawa Prefecture (1953–2007). Agriculture, Forestry and Fisheries Statistics Annual Report of Ishikawa Prefecture (Japanese).
25
Ito S. (1961). Fishery biological research on sardines in Japanese coastal waters. Bull. Jap. Sea Regional Fish. Res. Lab.9, 1–227.
26
Japan Meteorological Agency (2024). Long-term trend of sea surface temperature (the sea near Japan). Available online at: https://www.data.jma.go.jp/kaiyou/data/shindan/a_1/Japan_warm/Japan_warm.html (Accessed April 25, 2025).
27
Jiao Y. (2009). Regime shift in marine ecosystems and implications for fisheries management, a review. Rev. Fish Biol. Fisheries19, 177–191. doi: 10.1007/s11160-008-9096-8
28
Jung S. Pang I.-C. Lee J. Choi I. Cha H. K. (2014). Latitudinal shifts in the distribution of exploited fishes in Korean waters during the last 30 years: a consequence of climate change. Rev. Fish Biol. Fisheries24, 443–462. doi: 10.1007/s11160-013-9310-1
29
Kanagawa Prefecture (1954–2006). Agriculture, Forestry and Fisheries Statistics Annual Report of Kanagawa Prefecture (Japanese).
30
Kawasaki T. (2002). Climate change, regime shift and stock management. Fish. Sci.68, 148–153. doi: 10.2331/fishsci.68.sup1_148
31
Kelly J. A. Farrell S. L. Hendrickson L. G. Luby J. Mastel K. L. (2022). A critical literature review of historic scientific analog data: uses, successes, and challenges. Data Sci. J.21, 1–11. doi: 10.5334/dsj-2022-014
32
Kidokoro H. Goto T. Nagasawa T. Nishida H. Akamine T. Sakurai Y. (2010). Impact of a climate regime shift on the migration of Japanese common squid (Todarodes pacificus) in the Sea of Japan. ICES J. Marine Sci.67, 1314–1322. doi: 10.1093/icesjms/fsq043
33
Kikuchi T. (1977). Big and poor catch of sardine along Kujukuri Coast. Water Sci.20, 44–69. doi: 10.20820/suirikagaku.20.6_44
34
Kuroda K. (2007). Population increasing processes of Japanese sardine. Nippon Suisan Gakkaishi73, 750–753. doi: 10.2331/suisan.73.750
35
Kurota H. Kitajima S. Goto T. Sassa C. Tanaka S. Hiramatsu K. et al . (2019). Fisheries biology and population dynamics of Tsushima Warm Current stock of chub mackerel Scomber japonicus. Bull. Jpn. Soc Fish. Oceanogr.83, 237–251. Available at: https://www.jsfo.jp/archives/contents/pdf/83-4/83-4_237.pdf (Accessed April 25, 2025).
36
Lan K.-W. Lee M.-A. Zhang C. I. Wang P.-Y. Wu L.-J. Lee K.-T. (2014). Effects of climate variability and climate change on the fishing conditions for grey mullet (Mugil cephalus L.) in the Taiwan Strait. Clim. Change126, 189–202. doi: 10.1007/s10584-014-1208-y
37
Mantua N. J. Hare S. R. (2002). The pacific decadal oscillation. J. Oceanogr.58, 35–44. doi: 10.1023/A:1015820616384
38
Ministry of Agriculture, Forestry and Fisheries (2021a). “Chapter 3 trends in fisheries resources and the fishing ground environment,” in White paper on fisheries (summary) (FY 2021 trends in fisheries, FY 2022 fisheries policy). Ministry of Agriculture, Forestry and Fisheries; Tokyo, Japan. Available at: https://www.maff.go.jp/e/data/publish/attach/pdf/index-214.pdf.
39
Ministry of Agriculture, Forestry and Fisheries (2021b). Information related to the opinion exchange meetings regarding TAC settings. Available online at: https://www.jfa.maff.go.jp/j/suisin/s_koukan/attach/pdf/index-115.pdf (Accessed April 25, 2025).
40
Ministry of Agriculture, Forestry and Fisheries (2023). Information related to the opinion exchange meetings regarding TAC settings. Available online at: https://www.jfa.maff.go.jp/j/suisin/s_koukan/attach/pdf/index-214.pdf (Accessed April 25, 2025).
41
Ministry of Agriculture, Forestry and Fisheries (2024). Overview of the marine fisheries production statistics survey. Available online at: https://www.maff.go.jp/j/tokei/kouhyou/kaimen_gyosei/gaiyou/ (Accessed April 25, 2025).
42
Morlet J. Arens G. Fourgeau E. Giard D. (1982a). Wave propagation and sampling theory–Part I: Complex signal and scattering in multilayered media. Geophysics47, 203–221. doi: 10.1190/1.1441328
43
Morlet J. Arens G. Fourgeau E. Giard D. (1982b). Wave propagation and sampling theory–Part II: Sampling theory and complex waves. Geophysics47, 222–236. doi: 10.1190/1.1441329
44
Nagasaki Prefecture (1953, 1955–2007). Agriculture, Forestry and Fisheries Statistics Annual Report of Nagasaki Prefecture (Japanese).
45
National Diet Library (2011). National diet library digital collections. Available online at: https://dl.ndl.go.jp/en/ (Accessed April 25, 2025).
46
Niigata Prefecture (1953–2006). Agriculture, Forestry and Fisheries Statistics Annual Report of Niigata Prefecture (Japanese).
47
Nishikawa H. Curchitser E. N. Fiechter J. Rose K. A. Hedstrom K. (2019). Using a climate-to-fishery model to simulate the influence of the 1976–1977 regime shift on anchovy and sardine in the California Current System. Prog. Earth Planet. Sci.6. doi: 10.1186/s40645-019-0257-2
48
Oozeki Y. Takasuka A. Kubota H. (2007). Characterizing spawning habitats of Japanese sardine (Sardinops melanostictus), Japanese anchovy (Engraulis japonicus), and Pacific round herring (Etrumeus teres) in the northwestern Pacific. California Cooperative Oceanic Fisheries Investigations Rep.48, 191–203. Available at: https://calcofi.org/downloads/publications/calcofireports/v48/CalCOFI_Rpt_Vol_48_2007 (Accessed April 25, 2025).
49
Polanco J. Ganzedo U. Sáenz J. Caballero-Alfonso A. M. Castro-Hernández J. J. (2011). Wavelet analysis of correlation among Canary Islands octopus captures per unit effort, sea-surface temperatures and the North Atlantic Oscillation. Fisheries Res.107, 177–183. doi: 10.1016/j.fishres.2010.10.019
50
Qiu Y. (2015). Iron fertilisation by Asian dust influences North Pacific sardine regime shifts. Progr. Oceanogr.134, 370–378. doi: 10.1016/j.pocean.2015.03.011
51
R Core Team (2024). The R project for statistical computing. Available online at: https://www.r-project.org/ (Accessed April 25, 2025).
52
Reid P. C. Borges M. F. Svendsen E. (2001). A regime shift in the North Sea circa 1988 linked to changes in the North Sea horse mackerel fishery. Fisheries Res.50, 163–171. doi: 10.1016/S0165-7836(00)00249-6
53
Sakakibara S. (1999). Wavelet beginner’s guide (Tokyo, Japan: Tokyo Denki University Press), 225.
54
Sakurai Y. (2007). An overview of the Oyashio ecosystem. Deep-Sea Res. II54, 2526–2542. doi: 10.1016/j.dsr2.2007.02.007
55
Shin N. Saitoh T. M. Kotani A. Miura T. Nakagawa H. Katsumata C. et al . (2024). Perspective and review: how to develop our understanding of temporal changes in the relationship between people and the landscape under societal and climate change in Northeast Asia? Front. Environ. Sci.12. doi: 10.3389/fenvs.2024.1236664
56
Shizuoka Prefecture (1954–2006). Agriculture, Forestry and Fisheries Statistics Annual Report of Shizuoka Prefecture (Japanese).
57
Statistics and Survey Division, Ministry of Agriculture and Forestry (1952–1956). Statistical yearbook of agriculture and forestry Japan in 1951–1955 (Japanese: Digital Library on the Ministry of Agriculture, Forestry, and Fisheries Library). Available at: https://www.library-archive.maff.go.jp/.
58
Statistics of Japan (2024). e-Stat (portal site of official Statistics of Japan). Available online at: https://www.e-stat.go.jp/en (Accessed April 25, 2025).
59
Takasuka A. (2007). Biological processes linking climate changes to sardine population dynamics. Nippon Suisan Gakkaishi73, 758–762. doi: 10.2331/suisan.73.758
60
Takasuka A. (2009). Studies on early life ecology and species alternation mechanism of small pelagic fish. Nippon Suisan Gakkaishi75, 640–643. doi: 10.2331/suisan.75.640
61
Takasuka A. Oozeki Y. Kubota H. (2008b). Multi-species regime shifts reflected in spawning temperature optima of small pelagic fish in the western North Pacific. Mar. Ecol. Prog. Ser.360, 211–217. doi: 10.3354/meps07407
62
Takasuka A. Oozeki Y. Kubota H. Lluch-Cota S. E. (2008a). Contrasting spawning temperature optima: Why are anchovy and sardine regime shifts synchronous across the North Pacific? Progr. Oceanogr.77, 225–232. doi: 10.1016/j.pocean.2008.03.008
63
Takei K. (Ed.) (2022). Sardines and herring in the Edo era (Yoshikawa Kobunkan. Tokyo, Japan), 200.
64
Thompson D. W. J. Wallace J. M. (2000). Annular modes in the extratropical circulation. Part II: trends. J. Climate13, 1018–1036. doi: 10.1175/1520-0442(2000)013<1018:AMITEC>2.0.CO;2
65
Tian Y. (2014). Impacts of climate and marine environmental changes on the long-term variability in the fish populations around Japan. Nippon Suisan Gakkaishi80, 327–330. doi: 10.2331/suisan.80.327
66
Tian Y. Kidokoro H. Watanabe T. Iguchi N. (2008). The late 1980s regime shift in the ecosystem of Tsushima warm current in the Japan/East Sea: Evidence from historical data and possible mechanisms. Prog. Oceanogr.77, 127–145. doi: 10.1016/j.pocean.2008.03.007
67
Torrence C. Compo G. P. (1998). A practical guide to wavelet analysis. Bull. Am. Meteorol. Soc79, 61–78. doi: 10.1175/1520-0477(1998)079<0061:APGTWA>2.0.CO;2
68
Toyama Prefecture (1953–2010). Agriculture, Forestry and Fisheries Statistics Annual Report of Toyama Prefecture (Japanese).
69
Trenberth K. E. Hurrell J. W. (1994). Decadal atmosphere-ocean variations in the Pacific. Clim. Dyn.9, 303–319. doi: 10.1007/BF00204745
70
Vollset K. W. Urdal K. Utne K. Thorstad E. B. Sægrov H. Raunsgard A. et al . (2022). Ecological regime shift in the Northeast Atlantic Ocean revealed from the unprecedented reduction in marine growth of Atlantic salmon. Sci. Adv.8, eabk2542. doi: 10.1126/sciadv.abk2542
71
Watanabe Y. (2007). Two aspects of the sardine population decline. Nippon Suisan Gakkaishi73, 754–757. doi: 10.2331/suisan.73.754
72
Watari S. Takemura S. Oyaizu H. (2024). Charting and analyzing the catch distribution of Japan’s coastal fisheries resources based on centennial statistics. Front. Mar. Sci.11. doi: 10.3389/fmars.2024.1265907
73
Yamamoto T. (1960). On the history of catch statistics and its utilization. Bull. Jpn. Soc Sci. Fish.26, 1050–1058. doi: 10.2331/suisan.26.1050
74
Yasuda T. Hanawa K. (1999). Composite analysis of North Pacific subtropical mode water properties with respect to the strength of the wintertime East Asian monsoon. J. Oceanogr.55, 531–541. doi: 10.1023/A:1007843525069
75
Yasuda I. Sugisaku H. Watanabe Y. Minobe S. Oozeki Y. (1999). Interdecadal variations in Japanese sardine and ocean/climate. Fish. Oceanogr.8, 18–24. doi: 10.1046/j.1365-2419.1999.00089.x
76
Yatsu A. (2019). Review of population dynamics and management of small pelagic fishes around the Japanese Archipelago. Fish. Sci.85, 611–639. doi: 10.1007/s12562-019-01305-3
77
Yatsu A. Chiba S. Yamanaka Y. Ito S. Shimizu Y. Kaeriyama M. et al . (2013). Climate forcing and the Kuroshio/Oyashio ecosystem. ICES J. Mar. Sci.70, 922–933. doi: 10.1093/icesjms/fst084
78
Yatsu A. Kawabata A. (2017). Reconsidering trans-Pacific “synchrony” in population fluctuations of sardines. Bull. Jpn. Soc Fish. Oceanogr.81, 271–283.
79
Zhang Y. Wallace J. M. Battisti D. S. (1997). ENSO-like interdecadal variability: 1900–93. J. Climate10, 1004–1020. doi: 10.1175/1520-0442(1997)010<1004:ELIV>2.0.CO;2
Appendix
Life history of Japanese sardine, mackerels, and horse mackerel in Japan
The Pacific stock of Japanese sardine spawns in the Kuroshio coastal area as well as in an expanded range offshore of southern Kyushu mainly during February to April. Subsequently, individuals continue to grow and feed along the Kuroshio coast and the Kuroshio–Oyashio transition zone as well as in an expanded range extending to the Oyashio and beyond 180°E (Table 1 in Yatsu, 2019). The Tsushima Warm Current stock of Japanese sardine spawns in coastal waters of the Noto Peninsula as well as from the south coast of South Korea to western Kyushu and in an expanded range extending to the East China Sea and southern Kyushu during January to June. Subsequently, individuals continue to grow in the southern Sea of Japan, eastern East China Sea, and Yellow Sea and feed in the southern Sea of Japan and north-eastern East China Sea and in an expanded range extending to the northern Sea of Japan and the Yellow Sea (Yatsu, 2019).
The Pacific stock of chub mackerel mainly spawns along northern Izu Island and in the Kuroshio coastal area during March to May. Subsequently, individuals continue to grow in the Kuroshio coastal area and the Kuroshio–Oyashio transition zone and feed in the Kuroshio–Oyashio transition zone and in an expanded range extending to the Oyashio Current and beyond 170°E (Yatsu, 2019). The Tsushima Warm Current stock of chub mackerel spawns in the central and southern East China Sea during January to May and off western Kyushu and the San-in region during March to June. Subsequently, individuals continue to grow in the East China Sea and southern Sea of Japan and feed in the East China Sea, Sea of Japan, Yellow Sea, and Bohai Sea (Yatsu, 2019).
The Pacific stock of horse mackerel spawns in the East China Sea and the Kuroshio coastal area during winter and early summer. Subsequently, individuals continue to grow in the Kuroshio–Oyashio transition zone and feed in the Kuroshio coastal area and the Kuroshio–Oyashio transition zone (Ministry of Agriculture, Forestry and Fisheries, 2023). The Tsushima Warm Current stock of horse mackerel spawns in the East China Sea and the Sea of Japan during January to June. Subsequently, individuals grow and feed in the East China Sea and Sea of Japan (Ministry of Agriculture, Forestry and Fisheries, 2021b).
Summary
Keywords
climate change, coherence, horse mackerel, mackerel, regime shift, sardine, wavelet transform
Citation
Shin N, Sasai Y, Katsumata C, Nakagawa H and Morimoto H (2025) Analysis of historical dark data shows multiple regime changes among pelagic migratory fishes around Japan over 120 years. Front. Mar. Sci. 12:1552708. doi: 10.3389/fmars.2025.1552708
Received
06 January 2025
Accepted
28 April 2025
Published
23 May 2025
Volume
12 - 2025
Edited by
Maria Lourdes D Palomares, University of British Columbia, Canada
Reviewed by
Rui Saito, Japan Fisheries Research and Education Agency (FRA), Japan
Yoshioki Oozeki, Japan Fisheries Research and Education Agency (FRA), Japan
Updates
Copyright
© 2025 Shin, Sasai, Katsumata, Nakagawa and Morimoto.
This is an open-access article distributed under the terms of the Creative Commons Attribution License (CC BY). The use, distribution or reproduction in other forums is permitted, provided the original author(s) and the copyright owner(s) are credited and that the original publication in this journal is cited, in accordance with accepted academic practice. No use, distribution or reproduction is permitted which does not comply with these terms.
*Correspondence: Nagai Shin, nagais@jamstec.go.jp
Disclaimer
All claims expressed in this article are solely those of the authors and do not necessarily represent those of their affiliated organizations, or those of the publisher, the editors and the reviewers. Any product that may be evaluated in this article or claim that may be made by its manufacturer is not guaranteed or endorsed by the publisher.