Abstract
In recent decades, episodic extreme meteorological events have occurred frequently worldwide. Extreme drought and flood events have notably impacted on the evolution of large estuarine deltas, affecting estuarine geomorphology, human settlements, and infrastructure. However, understanding the impact of these extreme hydrological events on estuarine geomorphic evolution is hampered due to the lack of knowledge about event-based hydrodynamic mechanisms. Lingdingyang Estuary (LE), which is located in the central and southern part of the Pearl River Delta, southern China and has large number of records in extreme drought and catastrophic flood disasters from 1960s to 2010s, provides an opportunity to examine variations in estuarine deposition regime caused by such extreme hydrological events. A state-of-the-art modeling tool (TELEMAC-2D), was used to simulate geomorphic evolution in six scenarios, accounting for low upstream runoff (i.e. extreme drought) and high upstream runoff (i.e. catastrophic flood). This results revealed that: i) The deposition regime in the Inner-lingdingyang Estuary (ILE) altered from an erosion pattern under low upstream runoff conditions to a strong deposition pattern under high upstream runoff conditions, where the scale of upstream runoff and sediment delivery was of key importance. The deposition regime shift may occur at the upstream runoff conditions between 3120 m3/s and 6831 m3/s. ii) Under high upstream runoff conditions, large area of strong depocenters were easily formed outside the outlets, causing flood discharge block from outlets, which increased the risk of flooding. iii) The most prominent morphologic response to changes in upstream runoff was observed in the Western Shoal, i.e. a medium erosion pattern in the MQ1scenario (Extreme drought) and an extremely strong deposition pattern in the MQ5 scenario (Normal drought). The geomorphic balance (i.e., the state of net deposition volume approaching equilibrium) between the Western Shoal and the Western Channel requires critical consideration. iv) The sudden and substantial sedimentation was detected in the navigation channels, i.e. a net deposition volume of 1.22×10⁶ m3 in the Eastern Channel under catastrophic flood conditions. During catastrophic flood, bathymetric monitoring should be implemented to guide mitigation measures, such as emergency necessary dredging operations. Finally, large-scale sand mining should be avoided in the whole Middle Shoal owing to its limited sediment deposition capacity (For example, the net deposition volume in the Middle shoal was found to be less than 10% of that in the Western Shoal and 65% of that in the Eastern Shoal under catastrophic flood). However, appropriate sand mining scheme can be performed in the Eastern Shoal due to the net deposition pattern under upstream various hydrological conditions. My findings are valuable to improve the scientific comprehensive management of LE and promote the high-quality development of the Guangdong-Hong Kong Macao Greater Bay Area. The insights obtained from this study can be comprehensively understand the morphological transition in LE and benefit other estuaries that are subject to similar experiences.
1 Introduction
Estuaries are crucial transition zones connecting river system and ocean systems (Pritchard, 1967), and they displayed complicated progradation and degradation (Leonardi et al., 2013). The runoff and fluvial sediment injects into the estuary, and the sea fills the estuary with salty water and marine sediment (Devon et al., 2018). Thus, estuarine systems are extreme sensitive to the flow and sediment supply both in upstream rivers and adjacent coasts (Zhu et al., 2016). With the sediment supply reduction, rapid changes have taken place. Among them are sediment transport adjustments, coastal retreat, slowdown of accumulation, and even onset of erosion (Xie et al., 2017; He et al., 2020). For instance, drought events resulted in severe saltwater intrusion in the Yangtze River estuary, which in turn affected sediment transport and deposition processes (Wu et al., 2021). Similarly, in the upper Qiantang Estuary, the flood dominance was increased during the high flow periods, explaining the fast sediment input and bed recovery in the post high flow periods (Xie et al., 2022). Chen et al. (2020a) reported that the reductions in coarse sediment supply entering the Ayeyarwady Delta coastal plain induced the erosion of the major channels in the lowermost delta and the western delta coast. Two-thirds of the Brazos River subaqueous delta presented little net accumulation, and most of the sediment in this area actively resuspended and transported by waves and currents (Carlin and Dellapenna, 2014). A similar phenomenon also occurred at the Nile subaqueous delta (Stanley, 1996), Yellow River subaqueous delta (Fu et al., 2021) and Modaomen Estuary subaqueous delta (He Y. et al., 2022). In contrast, even with a 70% reduction in the upstream sediment load, the distal upstream sediment source had little effect on the Yangtze over the longer term (Dai et al., 2014). Therefore, it is still debatable to what degree the estuarine morphology has responded to changes in upstream runoff and sediment load, and there is no consensus on any persistent evolution pattern.
Estuaries were prone to drought and flood events, which varied in frequency and intensity depending on water management and climate change (Dittmann et al., 2015). Extreme hydrological event was one of the most catastrophic natural hazards in the estuarine regions, affecting the geomorphic stability of the estuary and the associated human livelihoods (Blott et al., 2006; Wang et al., 2021). High-magnitude flood events (i.e., large or catastrophic floods), which transported exceptionally large volumes of runoff and sediment fluxes (Rickenmann et al., 2016), had the potential to notably alter estuarine geomorphic evolution (i.e. pronounced erosion and deposition processes in channels, rivers, and floodplains) (Liu et al., 2019a). For instance, turbid water was discharged in repeated pulses from the Yangtze Estuary and penetrated the East China Sea during the Yangtze extreme flood in 1998 (Watanabe, 2007), causing the subaqueous delta to prograde outward remarkably (Zhao et al., 2022). Maillet et al. (2006) reported that the mouth-bar in the Grand Rhône River (southern France) had prograded 200 m induced by the December 2003 flood event. In contrast, drought events could result in mouth closures of estuaries and lagoons owing to insufficient riverine sediment supply, causing hypersalinity, estuarine erosion, and degeneration of tidal flat (Wu et al., 2021). For example, on the decrease of sediment delivery in the interannual and dry seasons, the Gudong littoral area in the Yellow River Estuary had experienced erosion with a net vertical erosion rate of 0.1 m/yr (Ji, 2021), and the Yellow River subaqueous delta was also believed to transition from the accretion into net erosion since 2000 (Fu et al., 2021). The Mississippi River estuary by comparison experienced a retreat of the old subaqueous delta due to the sharp decrease of runoff and sediment delivery after channel switching (Tornqvist et al., 2006). In addition, some previous studies had stressed the importance of the bathymetric changes on the estuarine hydrodynamics (Xie and Wang, 2021;Xie et al., 2022). For instance, the inner estuary was eroded, the tidal range could be doubled. However, little attention has been paid to the underlying mechanisms of geomorphic response and regime transition to change in upstream runoff and sediment delivery, and they are crucial for estuarine management.
Lingdingyang Estuary (LE) in the central and southern part of the Pearl River Delta, southern China, has a unique hydrodynamic and geomorphic pattern with three shoals (Eastern, Middle, and Western Shoals) and two channels (Eastern and Western Channels) (Figure 1). Historically, substantial water discharge and sediment loads came into LE from upstream through four outlets (Humen, Jiaomen, Hongqili, and Hengmen outlets), accounting for 53.4% and 47.7% of the gross from the Pearl River to the sea, respectively (Yu et al., 2010; Luo, 2010). In the past few decades, flood and drought frequently occurred in the entire Pearl River Basin (i.e. catastrophic flood in 1998 and 2008; extreme drought in 1963) (Figure 1d). Most previous studies have focused on the impacts of upstream runoff and sediment change on salinity intrusion (Zou, 2010; Wang, 2011), plume front (Zheng et al., 2014; Gong et al., 2019), and long-term geomorphic evolution of LE (Wu et al., 2018; Chen et al., 2022). However, the geomorphic response and the mechanism of regime transition during extreme hydrological events remain unclear in this multi-input outlets estuary. Importantly, as LE has frequently experienced major hydrological disasters with relatively clear records of upstream runoff and tidal level changes, it serves as a valuable target area for providing insights on these aspects. Additionally, there is an urgent need to obtain a systematic understanding of geomorphic response and shift mechanism to variation in upstream runoff of LE, as it is one of the most vulnerable estuaries to flooding worldwide (Hallegatte et al., 2013).
Figure 1
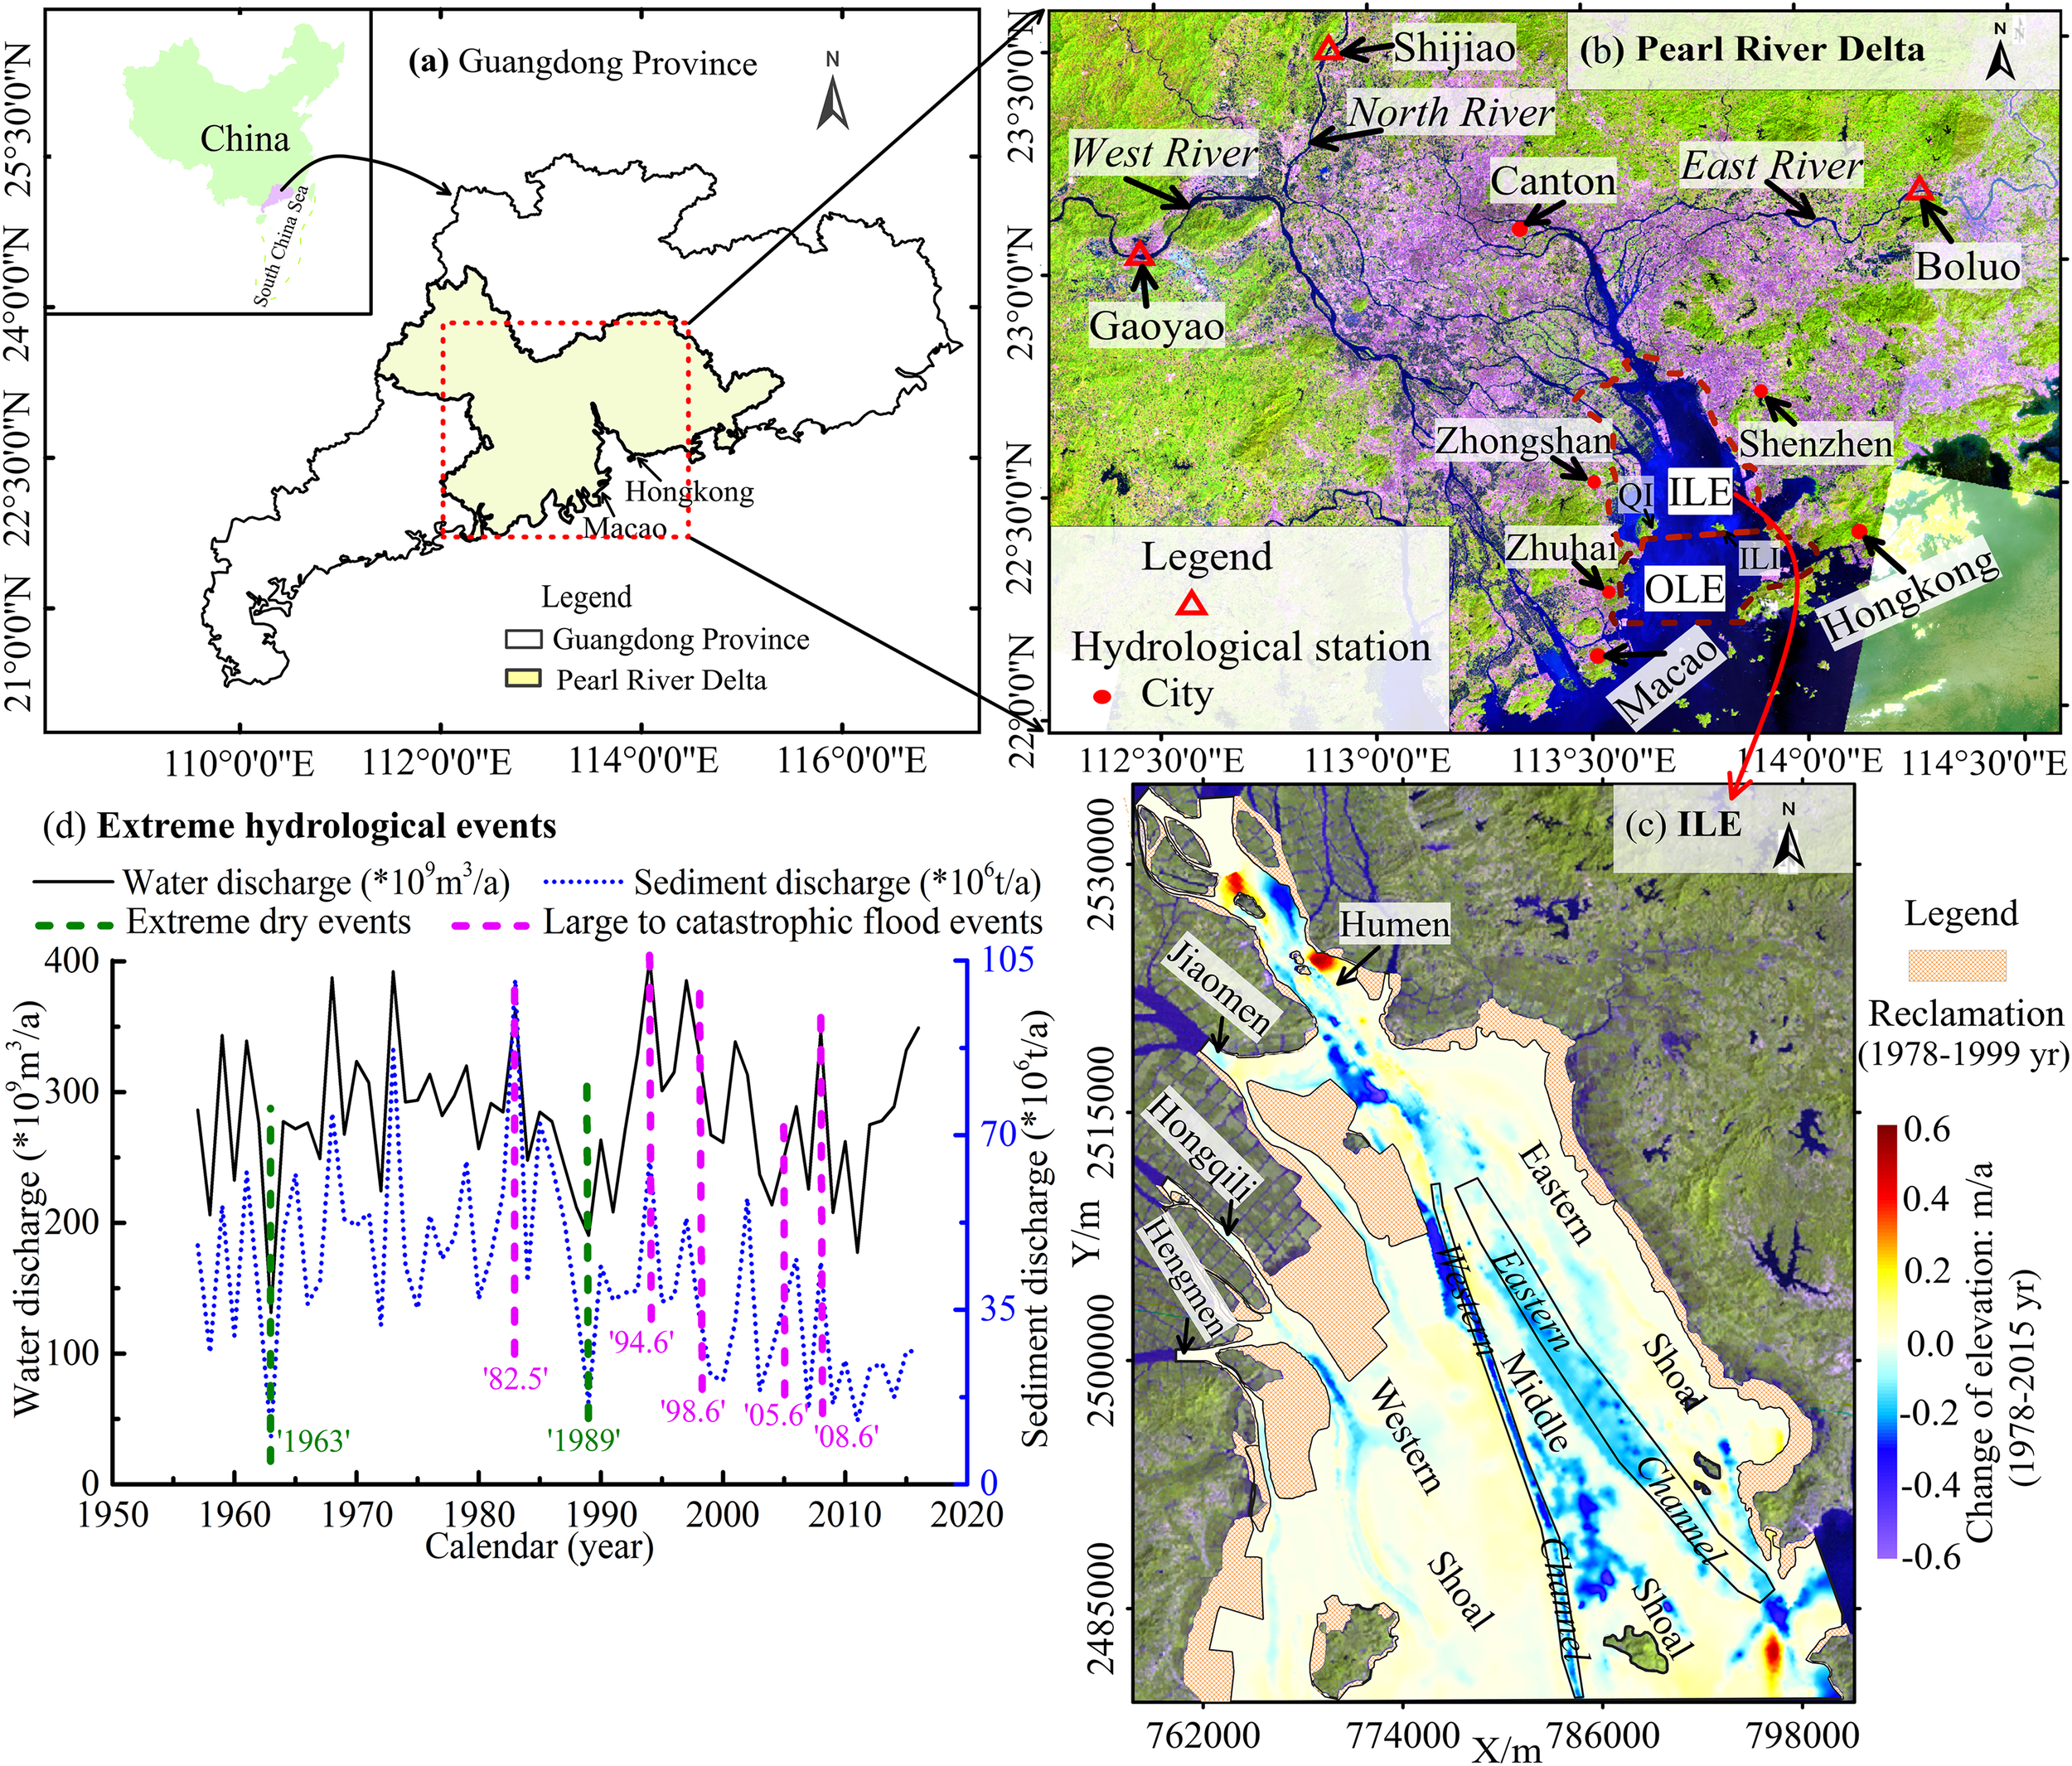
(a–c) Location and variation of shoreline and bathymetry in the Inner-lingding Estuary (ILE), and (d) extreme hydrological events in the Pearl River from 1950s to 2010s. The variation of river and sediment discharge from the Pearl River, calculated as the sum from the Boluo, Shijiao and Gaoyao hydrological stations. ILE: Inner-lingding Estuary; OLE: Outer-lingding Estuary. QI: Qi'ao Island; LE: Inner-lingding Island.
The primary objectives of this study are as follows: 1) to explore if sedimentation regime shifts can occur in multi-input outlets estuaries such as LE under upstream runoff variations; 2) to evaluate what are the upstream runoff conditions that triggering deposition transition if they do occur; 3) to reveal the mechanism of the sedimentation regime shifts if they do occur; 4) to provide implications for estuarine comprehensive management in the future. In this study, a state-of-the-art numerical model (TELEMAC-MASCARET (TELEMAC-2D)) was employed to investigate the geomorphic response to change in upstream runoff and the possible variations in the sedimentation regime in LE. To fully depict the estuarine morphology, the model was composed of rivers, outlets, and estuarine bays. It was validated using tidal level, velocity, and SSC data obtained at multiple stations within the bay. Subsequently, a series of numerical experiments was designed to explore the response of i) volume of deposition and erosion; ii) sedimentation pattern; and iii) intensity and distribution of erosion center and deposition center influenced by upstream runoff variations under six typical hydrological conditions in LE. Finally, the effects of various runoff levels are quantified following the hydrological events.
2 Regional setting
The LE, a funnel-shaped estuary-bay system in China’s Pearl River Delta (Figure 1b), spans 1180 km² and extends 60 km between the narrow Humen outlet in the north and the wide southern mouth. It receives 50-55% of the Pearl River’s runoff and ~45% of its sediment via four outlets (Chen et al., 2024), with Humen dominated by tides (runoff-to-tidal discharge ratio: 0.25) and the others by river flow (Zhang et al., 2010). Morphologically, LE features three shoals (western, middle, eastern) and two channels (eastern, western) (Figure 1c), divided into Inner-Lingding Estuary (ILE) and Outer-Lingding Estuary (OLE) by Qi’ao and Inner-Lingding Islands (Figure 1b). Salinity in ILE varies seasonally, with flood-season runoff pushing the zero-salt line seaward beyond Inner-Lingding Island, while dry-season low-salinity water concentrates near outlets (Chen et al., 2024). Tides are irregular semi-diurnal/mixed, with annual ranges of 1.0–1.6 m (spatial) and 0.7–2.0 m (temporal, neap-spring cycles). Southeasterly waves dominate (29% frequency), averaging 0.41 m in height and 4.50 s in period (Yin et al., 2017), though wave energy in ILE is attenuated by OLE’s islands. Surface sediments are primarily cohesive silt and clay (mean grain size: 6–8 φ, 0.004–0.016 mm) (Xiao, 2012), with spatial compositional variability.
3 Modelling approach
Numerical simulations were performed using the TELEMAC-MASCARET modeling system (www.opentelemac.org), a package that includes modules for modeling free-surface hydrodynamics, sediment transport, water quality, waves, and groundwater flows. The system was developed by the Laboratoire National d’Hydraulique et Environnement (LNHE), a research department of Électricité de France (EDF). The TELEMAC-MASCARET system is based on an unstructured grid with finite element or finite volume numerical schemes, and is suitable for estuaries with irregular and complex geometries. Hydrodynamics were computed using the TELEMAC-2D module, and sediment transport and bed evolution were calculated using the SISYPHE module. Additional details of the TELEMAC-2D model are provided in relevant studies (Chen, 2021; He X. Z. et al., 2022).
3.1 Model configuration
3.1.1 Model domain and offshore salinity boundary
The hydrodynamic and sediment transport model of LE (LEM) was constructed by using the TELEMAC-2D system coupled with hydrodynamic and sediment transport modules. The model grid and computational domain are presented in Figure 2. The unstructured grids had spatial resolutions ranging from 1,200 m in the offshore region to 100 m in the upper outlet area, comprising a total of 320,676 gird elements and 163,222 grid nodes. The model domain of LEM was defined with Sisheng, Dasheng, Huangpu, Sanshakou, Nansha, Fengmamiao and Hengmen as its upstream boundary (Figure 2b), and an open boundary extending offshore approximately to the -40 m isobath. The model used the topography measured in 1999 and the actual shoreline in 1999. The topographic data of 1999 was obtained from Pearl River Water Resources Commission of the Ministry of Water Resources, with the average density of 16–25 survey points/km², so the accuracy of the bathymetric survey exceeded 90% (Chen et al., 2020b). The Universal Transverse Mercator (UTM) coordinate system and the Pearl River datum were used for modeling, and the terrain was based on the Pearl River datum.
Figure 2
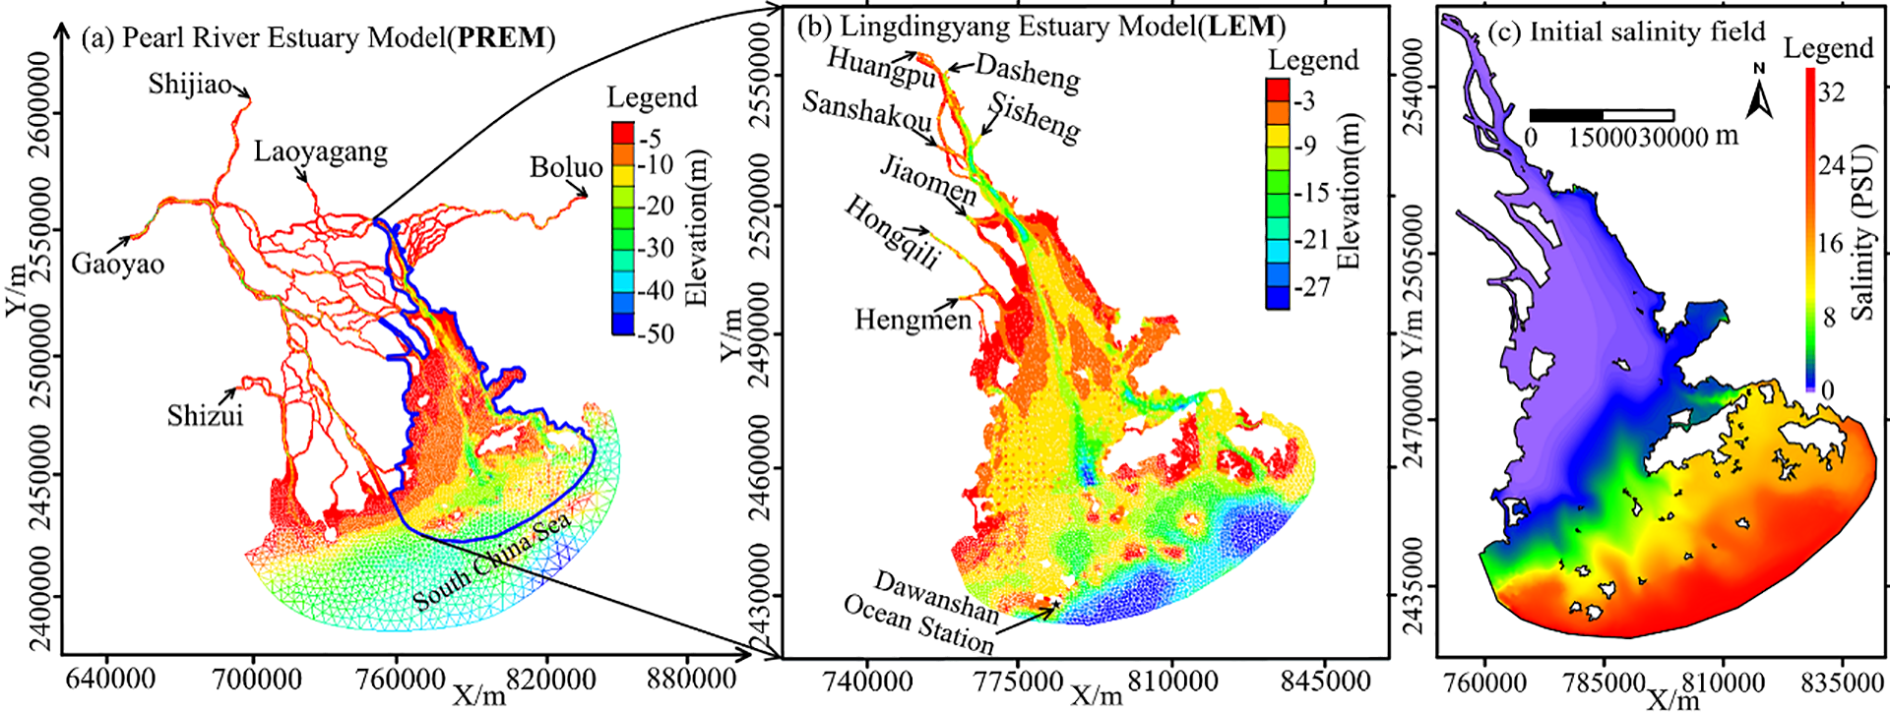
(a–c) The hydrodynamic and sediment transport model of LE.
The Pearl River Estuary Model (PREM) has been fully verified by a large number of tidal level stations, hydrological stations and synchronous observation data of the Pearl River network (Figure 2a). For additional details on the parameter setting and validation of the PREM, the reader is referred to (He et al., 2017). The stable salinity field pattern of the PREM provided the initial salinity field for the LEM (Figure 2c), as well as the hourly salinity of the downstream boundary input during different simulation stages.
3.1.2 Main parameter settings
The mean particle size of surficial sediments in LE varies from 1.5φ to 7.7φ, with an average of 6.5φ (Zhao, 1981; Xiao, 2012). According to the seasonal variation, the sediment particle size of the LEM were set as 0.03 mm (flood season) and 0.025 mm (dry season). The Strickler’s law was used to calculate bottom friction, and the friction coefficients for the outlets, estuary, and the offshore sea were set as 60 m1/3/s, 65 m1/3/s, 70 m1/3/s, and 80 m1/3/s, respectively. In previous in situ studies, we obtained τce (the critical erosion shear stress of the mud) of the mud values of 0.05–0.45 N/m2 for LE using the UMCES-Gust Erosion Microcosm System (Dong et al., 2020). The Partheniades constant is 2.0×10⁻⁵ kg/m2/s. Thus, the τce in various areas was in various areas was defined based on the surface sediment particle size distribution in this study. Higher τce values were assigned to coarse-grained sediment zones (e.g., estuarine sandbar), whereas lower τce values were applied to fine-grained sediment areas. The bottom sediment was divided into four layers, and τce values for these layers were set as 0.10 N/m2, 0.25 N/m2, 0.38 N/m2, and 1.05 N/m2, with the bottom layer set at 1.05 N/m2 to suppress unrealistic scour in the model. Only cohesive sediment was considered in the LEM.
Model performance was tested at different time scales. Three simulation periods were set in this study: July 1 to July 31, 1999 (31 days in total), from January 1 to January 31, 2000 (31 days in total), and from February 1 to February 28, 2001 (28 days in total) (Table 1). The time steps in the TELEMAC-2D and SISYPHE modules were 30 s and 10 s, respectively, and the model parameters during both simulation periods were identical. For the downstream boundary input, the tidal level and flow velocity of the corresponding period were obtained using the TPXO tidal prediction system.
Table 1
| Hydrologic station | Period | Data types |
|---|---|---|
| Sisheng; Dasheng; Huangpu; Sanshakou; Nansha; Fengmamiao and Hengmen | 1999.07.01˜07.31 | (Tidal level; flow velocity; SSC) |
| 2000.01.01˜01.31 | (Tidal level; flow velocity; SSC) | |
| 2001.02.01˜02.28 | (Tidal level; flow velocity; SSC) |
The hydrological data of seven hydrologic stations in upstream.
The data were selected from the simultaneous hydrologic observation data of the network river in the Pearl River Delta in July 1999, January 2000, and February 2001. SSC: Suspended Sediment Concentration.
3.2 Model validation
3.2.1 Verification points
There were ten verification points in 1999, 2000, and 2001, consisting of three types of tidal level, flow velocity, and suspended sediment concentration (SSC) each. These validation points were primarily located in the inner bay and the upstream channel of LE (Figure 3). The tidal levels, flow velocities, and SSC were derived from the synchronized hydrological surveys conducted in July 1999 in the lower reaches of the Xijiang and Beijiang rivers and the Pearl River Delta network channels, and supplemented by the archival records of the Guangdong Provincial Hydrographic Bureau.
Figure 3
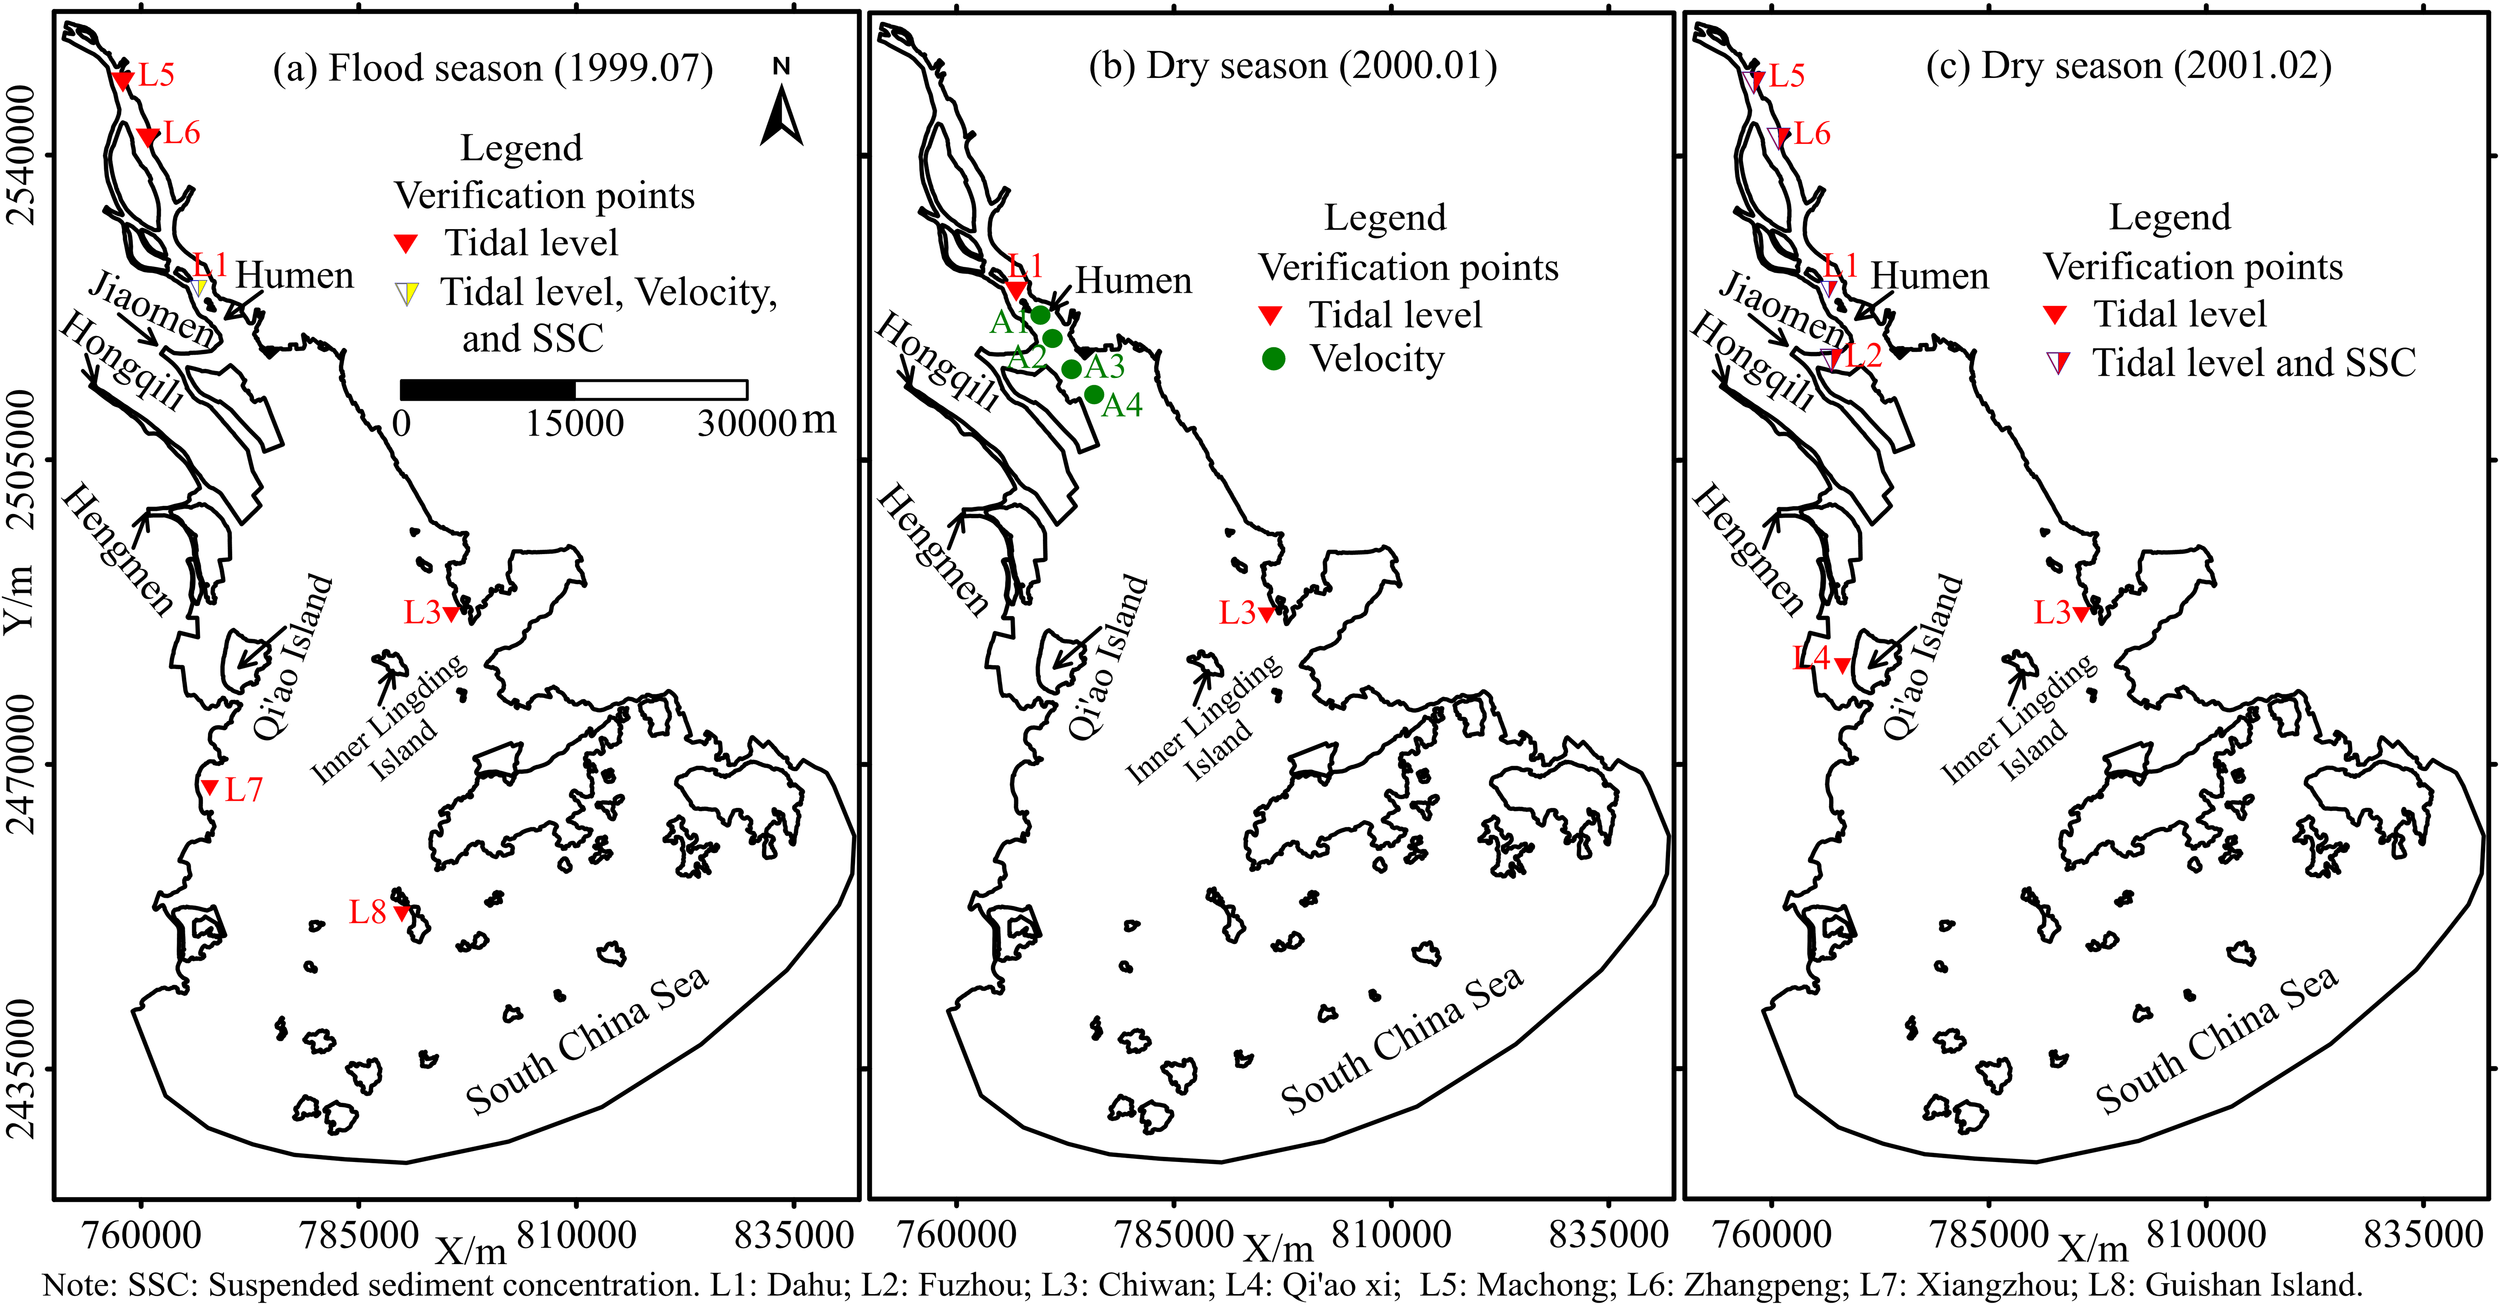
(a–c) The pattern of verification points in 1999, 2000, and 2001.
3.2.2 Model validation
Simulation results for tidal level, flow velocity and depth-averaged SSC in 1999, 2000, and 2001 were compared against measured data. The Nash Sutcliffe efficiency (NSE) coefficient (Equation 1) and coefficient of determination (R2) (Equation 2) were used to evaluate the modelling results. NSE values range from -∞ to 1, with values closer to 1 indicating a higher model accuracy (Sun and Su, 2020). R2 values range from 0 to 1, with high values indicating that the independent variable can explain the variance in the dependent variable to a high degree. In this work, , , ,and represent the observed, simulated, averaged observed, and averaged simulated values, respectively. n represents the time series, such that the equations are written as follows:
The difference between the simulated and observed tidal levels was small (Table 2). The and values for the tidal level evaluation were 0.915 and 0.932 in 1999, those in 2000 were 0.875 and 0.9, and those in 2001 were 0.897 and 0.897, respectively (Table 2). The NSE and R2 of the tidal level at Xiangzhou station and Guishan Island station beyond 0.9 (Table 2), indicating that the model results in the OLE are reasonable. In general, the flow velocity evaluation in 1999 and 2000 were good, with the values of and exceeding 0.78. The low validation effect of SSC is a common problem in the evaluation of the hydrodynamic and sediment transport model, but the value of SSC in the LEM also exceeded 0.65 in 1999 (Table 2).
Table 2
| Sites | Flood season (1999.07) | Dry season (2000.01) | Dry season (2001.02) | |||||||||||||
|---|---|---|---|---|---|---|---|---|---|---|---|---|---|---|---|---|
| Tidal level | Flow velocity | SSC | Tidal level | Flow velocity | Tidal level | SSC | ||||||||||
| NSE | R 2 | NSE | R 2 | Ob | Mo | R 2 | NSE | R 2 | NSE | R 2 | NSE | R 2 | Ob | Mo | R 2 | |
| L1 | 0.943 | 0.948 | 0.871 | 0.904 | 0.065 | 0.063 | 0.676 | 0.910 | 0.911 | – | – | 0.869 | 0.848 | 0.074 | 0.062 | 0.461 |
| L2 | – | – | – | – | – | – | – | – | – | – | – | 0.925 | 0.952 | 0.043 | 0.042 | 0.438 |
| L3 | 0.935 | 0.953 | – | – | – | – | – | 0.840 | 0.841 | – | – | 0.903 | 0.906 | – | – | – |
| L4 | – | – | – | – | – | – | – | – | – | – | – | 0.833 | 0.880 | – | – | – |
| L5 | 0.905 | 0.940 | – | – | – | – | – | – | – | – | – | 0.916 | 0.952 | 0.044 | 0.041 | 0.527 |
| L6 | 0.900 | 0.913 | – | – | – | – | – | – | – | – | – | 0.934 | 0.840 | 0.043 | 0.042 | 0.514 |
| L7 | 0.907 | 0.921 | ||||||||||||||
| L8 | 0.902 | 0.915 | ||||||||||||||
| A1 | – | – | – | – | – | – | – | – | – | 0.714 | 0.777 | – | – | – | – | – |
| A2 | – | – | – | – | – | – | – | – | – | 0.741 | 0.841 | – | – | – | – | – |
| A3 | – | – | – | – | – | – | – | – | – | 0.808 | 0.892 | – | – | – | – | – |
| A4 | – | – | – | – | – | – | – | – | – | 0.861 | 0.900 | – | – | – | – | – |
| AV | 0.915 | 0.932 | 0.871 | 0.904 | 0.065 | 0.063 | 0.676 | 0.875 | 0.876 | 0.781 | 0.853 | 0.897 | 0.897 | 0.051 | 0.047 | 0.485 |
Evaluation parameters for model at each observation site in 1999, 2000, and 2001.
Ob, Observation value; Mo, Model value; AV, Average value. – indicates no data.
As can be seen from Table 2, some sites had relatively low values for model evaluation. Therefore, the validation curves for these sites are shown in Figure 4. Although the values of SSC at sites L1 and L2 are below than 0.5, the variation curves of SSC at sites L1 and L2 are consistent with the measured values, and the average SSC has the same order of magnitude (Figure 4c, d). For example, the average simulated and measured SSC values at site L2 are 0.042 kg/m3 and 0.043 kg/m3, respectively. In general, the simulation results of the LEM in 1999, 2000, and 2001 were good, indicating that the deposition changes in LE were well represented.
Figure 4
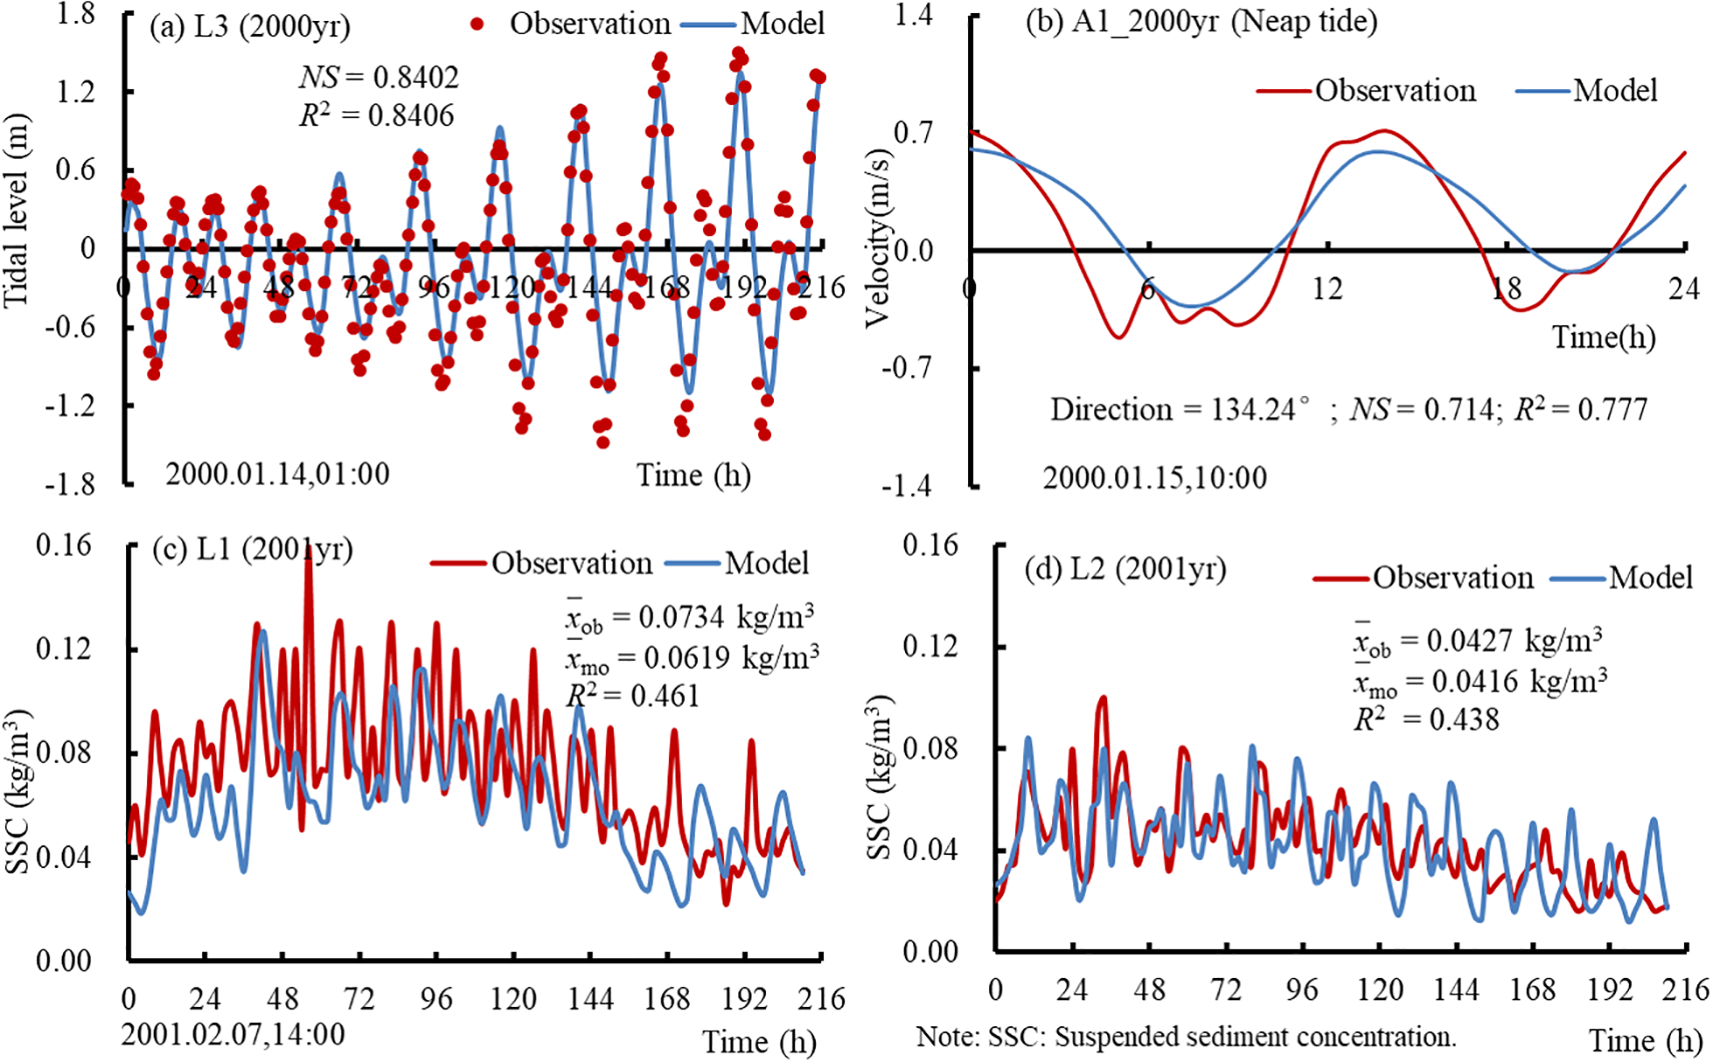
(a–d) Evaluation parameters for 4 stations of the LE in 2000 and 2001.
To verify the model’s ability to simulate morphological patterns, the morphological evolution for 1999 was simulated and compared with historical bathymetric data. As shown in Table 3, the simulated and observed average deposition/erosion rates are comparable in magnitude. Specifically, the observed deposition rate in the ILE was 0.1079 m/yr, while the simulated rate was 0.0983 m/yr, and these two values showed good agreement. Similar agreement was found between the observed and simulated rates for shoal deposition and channel erosion. This confirms that the hydrodynamic and sediment transport model described in Section 3.1 is well-validated and meets the morphological simulation requirements of this study.
Table 3
| Region | ILE | OLE | Shoals | Channels | ||||
|---|---|---|---|---|---|---|---|---|
| Ob | Mo | Ob | Mo | Ob | Mo | Ob | Mo | |
| Deposition rate (m/yr) | 0.1079 | 0.0983 | 0.0695 | 0.0632 | 0.1282 | 0.1127 | – | – |
| Erosion rate (m/yr) | -0.0949 | -0.0828 | -0.0658 | -0.0587 | – | – | -0.1140 | -0.1269 |
| Net deposition rate (m/yr) | 0.0130 | 0.0156 | 0.0037 | 0.0045 | – | – | – | – |
Comparison between simulated and observed deposition/erosion rates for 1999.
Ob, Observation value; Mo, Model value; ILE, Inner-lingdingyang Estuary; OLE, Outer-lingdingyang Estuary. Shoals (including Eastern Shoal, Middle Shoal, and Western Shoal) and channels (including Eastern Channel and Western Channel). Simulated period: January 1, 1999, to December 31, 1999. The bathymetric data (observation values) for 1999 and 2000 were obtained from historical chart - derived topographic data. Note: “–” indicates no data.
3.3 Scenarios with various upstream runoff conditions
Historically, runoff and sediment came mainly from the upstream flow into the LE through the four outlets, and ~90% of the sediment in the Pearl River came from Xi River (Wu et al., 2016). According to the hydrological statistics, the annual average flow and sediment discharge from four eastern outlets into LE during 1950–1980 were ~174.2 billion m3 and ~33.89 million tons, respectively. Furthermore, ~80% of runoff and sediment pouring into the LE will be deposited in the OLE, and ~20% will be transported to the open sea (Yuan et al., 2013). Then, what are the response of deposition regime to changes in river discharge in LE? In order to better reveal the impact of upstream runoff changes on the geomorphological evolution, five typical upstream runoff conditions were selected in this study (Table 4). As can be seen in Table 4, the monthly flow and monthly SSC of the multi-year flood season during 1960–2017 were basically comparable to the measured flow and SSC in July 1999. Similarly, the monthly flow and SSC of the multi-year dry season during 1960–2017 were basically comparable to the measured flow and SSC in February 2001. Therefore, based on the well validated model (LEM) during the flood season (July 1999) and the dry season (February 2001), this study focuses on the changes of geomorphologic evolution patterns in LE under various upstream runoff conditions.
Table 4
| Typical runoff conditions | Multi-year dry season average runoff | Flood season in extremely dry year | Multi-year flood season average runoff | Large flood | Catastrophic flood | Observation | |
|---|---|---|---|---|---|---|---|
| Flood season | Dry season | ||||||
| Date | 1960-2017 | 1963.06-08 | 1960-2017 | 2008.06 | 2005.06 | 1999.07 | 2001.02 |
| Monthly flow (m3/s) | 3120 | 6831 | 17184 | 29630 | 34367 | 16490 | 2787 |
| Monthly SSC (kg/m3) | 0.037 | 0.098 | 0.103 | 0.105 | 0.108 | 0.102 | 0.041 |
The hydrological characteristics of typical event conditions in upstream of Pearl River Estuary from 1960 to 2017.
The data were obtained from “Guangdong Provincial Hydrological Statistical Yearbook”. SSC, Suspended sediment contraction. Water discharge and SSC from the Pearl River calculated as the sum from the Boluo, Shijiao and Gaoyao hydrological stations. Large flood means the flood frequency less than 2%; Catastrophic flood means the flood frequency less than 1%.
In this study, MQ1 and MQ3 were set based on actual conditions, and four computational scenarios of the LEM, namely MQ0 and MQ2 were set based on MQ1, MQ4 and MQ5 were set based on MQ3 (Table 5). MQ0 was the scenario without considering upstream runoff and sediment, and its upstream flow and SSC input value were both set as 0. MQ1was the scenario considering multi-year dry season average flow and SSC, and its upstream flow and SSC input value were set as measured in February 2001. MQ2 was the scenario considering the flow and SSC of flood season in extremely dry year, and its upstream flow and SSC input value were set as measured in July 1963. MQ3 was the scenario considering multi-year flood season average flow and SSC, and its upstream flow and SSC value were set as measured in July 1999. MQ4 was the scenario considering the flow and SSC of large flood (Flood frequency less than 2%), and its upstream flow and SSC input value were set as measured in June 2008. MQ5 was the scenario considering the flow and SSC of Catastrophic flood (Flood frequency less than 1%), and its upstream flow and SSC input value were set as measured in June 2005. Other than the conditions specific to each scenario, all conditions of the MQ0 and MQ2 computational models were in line with those of the MQ1 scenario, and all conditions of the MQ4 and MQ5 computational models were in line with those of the MQ3 scenario.
Table 5
| Scenarios | Boundary | Terrain | Hourly flow and SSC input in upstream | Monthly flow (m3/s) | Monthly SSC (m3/s) | Tidal level and velocity in downstream | Flood conditions |
|---|---|---|---|---|---|---|---|
| MQ0 | 1999yr | 1999yr | 0 | 0 | 0.000 | In July 1999 | – |
| MQ1 | In February 2001 | 1659 | 0.041 | Extreme drought | |||
| MQ2 | In July 1963 | 4238 | 0.084 | Normal drought | |||
| MQ3 | In July 1999 | 11417 | 0.156 | Normal flood | |||
| MQ4 | In June 2008 | 18392 | 0.207 | Large flood | |||
| MQ5 | In June 2005 | 22384 | 0.228 | Catastrophic flood |
Scenarios of various upstream runoff and SSC conditions in LEM.
MQ1 and MQ3 are the baseline scenarios for comparative analysis; Except for the consideration factor of different scenarios, the other conditions of the model were consistent. The data were obtained from “Guangdong Provincial Hydrological Statistical Yearbook”. Water discharge and SSC conditions in LEM calculated as the sum from the Sisheng, Dasheng, Huangpu, Sanshakou, Jiaomen, Hongqili, and Hengmen hydrological stations. SSC, Suspended Sediment Concentration.
In addition, for each scenario, a 30-day simulation was conducted using monthly flow and monthly SSC as upstream input conditions. The specific values for each scenario were listed in Table 5.
3.4 The classification method of deposition and erosion centers
The intensity of deposition center or erosion centers was a relative concept, similar to the urban heat island. A large number of previous studies had been reported on the intensity of urban heat island (Wu, 2010; Chen et al., 2017), but few studies on the intensity of sediment deposition center or erosion center. Therefore, the classification of sediment deposition centers or erosion centers were carried out according to the classification method of urban heat island intensity. The above processing involved three steps as follows:
-
Based on the previous studies in this area (Chen et al., 2020b), a deposition center of the LE was defined as a region with an annual sedimentation rate > 0.15 m/yr (corresponding to a monthly sedimentation rate > 0.0125 m/month) and a deposition area > 0.5 km2, while an erosion center of the LE was defined as a region with an annual erosion rate< -0.15 m/yr (corresponding to a monthly erosion rate< -0.0125 m/month) and an erosion area > 0.5 km2. Thus, the patches of sedimentary and erosional centers could be identified across varying hydrodynamic scenarios.
-
In this study, was an index used to describe the intensity of bed elevation change (i.e., intensity of deposition center or erosion center), and its formula was as follows:
whereas, represented the intensity of bed elevation change; represented the rate of bed elevation change in the i patch; represented the defined rate of the bed elevation change of ± 0.0125 m/month (Positive values signify deposition centers, and negative values indicate erosion centers).
-
3. The intensity of bed elevation change was calculated by Equation 3, and the classification of deposition center or erosion center could be divided into four grades (Table 6). For example, Weak deposition center, Medium deposition center, Strong deposition center, and Extremely strong deposition center.
Table 6
| index | >0.75 | 0.50~0.75 | 0.25~0.50 | 0.00~0.25 | −0.25~0.00 | −0.50~−0.25 | −0.75~−0.50 | <−0.75 |
|---|---|---|---|---|---|---|---|---|
| Types | Deposition center | Erosion center | ||||||
| Classification | Extremely strong | Strong | Medium | Weak | Weak | Medium | Strong | Extremely strong |
Classification of sediment deposition center and erosion center.
4 Results
4.1 Variation in volume of deposition and erosion
4.1.1 Change in volume of the ILE and OLE
The volume of deposition and erosion in LE differed notably under six typical hydrological scenarios (Figure 5). The major variations in volume of deposition and erosion were as follows: i) Overall, the volume of deposition and net deposition in LE showed an upward trend with the gradual increase of upstream runoff (Figure 5a). For example, the volume of deposition increased by 1.63 times from 1.57 ×10⁷ m3 in the MQ0 scenario to 4.12 ×10⁷ m3 in the MQ5 scenario. Correspondingly, the volume of net deposition increased significantly by 5.40 times from 0.54 ×10⁷ m3 in the MQ0 scenario to 2.85 ×10⁷ m3 in the MQ5 scenario. However, under the MQ1 scenario, the LE exhibited a dynamic equilibrium between deposition and erosion volumes, resulting in a comparatively lower net deposition of approximately2.52 ×106 m3 than other scenarios. ii) In the ILE, it showed a net erosion situation in the MQ0 and MQ1 scenarios, and the volume of net erosion were 2.78 ×10⁶ m3 and 9.43 ×10⁶ m3, respectively. However, it showed a net deposition situation in the MQ2-MQ5 scenarios, and the volume of net deposition increased from 0.93×10⁷ m3 to 2.38×10⁷ m3 with the gradual increase of upstream runoff (Figure 5b). iii) In the OLE, the volume of deposition altered slightly, and the net deposition volume showed a trend of “first increasing and then decreasing” with the increase of upstream runoff. Moreover, the maximum net deposition volume in the MQ1 scenario was 1.20×10⁷ m3, which was 3 times of that in the MQ3 scenario.
Figure 5
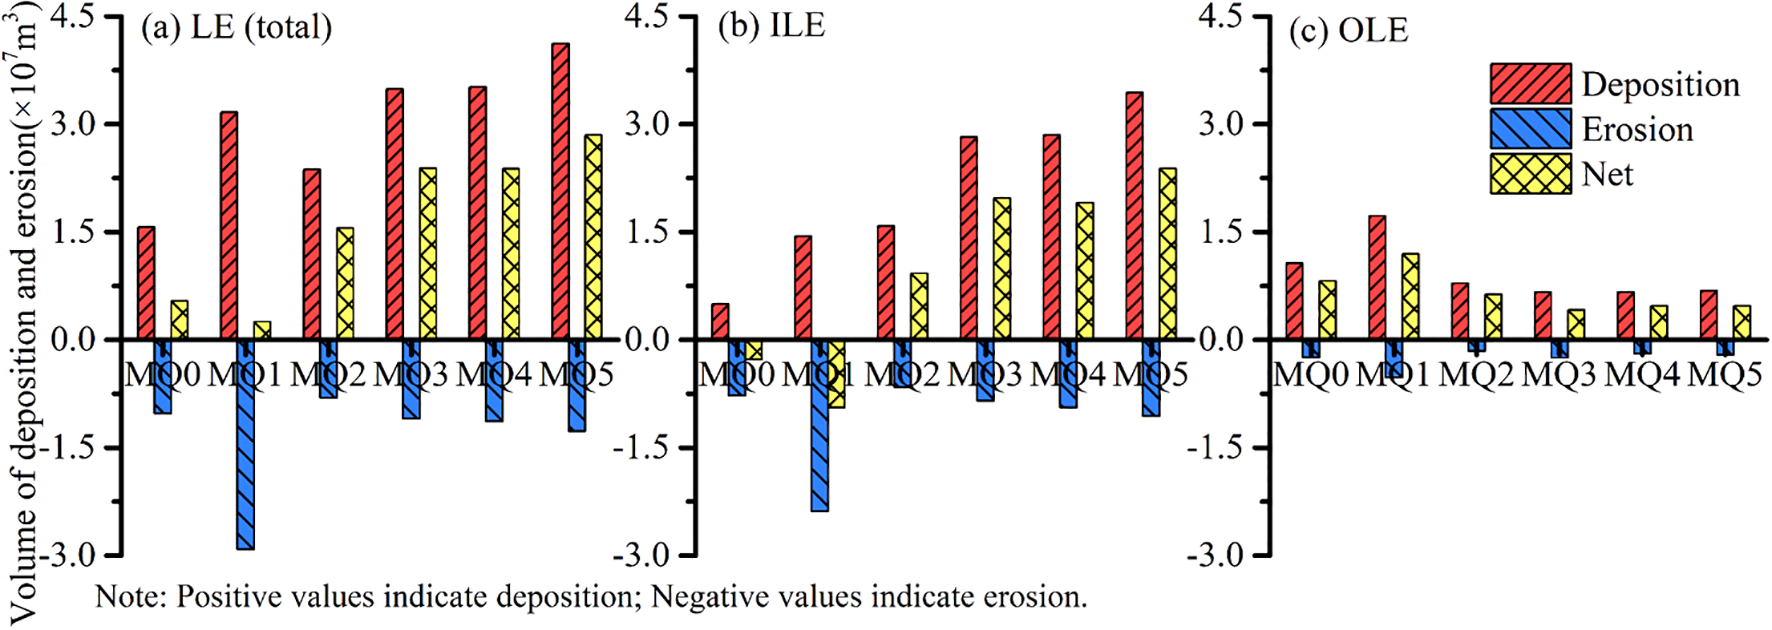
(a–c) The volume of deposition and erosion in LE under six typical hydrological scenarios.
As can been see in Figure 6, the percentage of deposition and erosion area in LE changed slightly, and the overall percentage of deposition area was ~75%, except for the MQ1 scenario. However, the average percentage of erosion area increased slightly to 35% in the ILE and up to 45% in the MQ1 scenario (Figure 6b). In addition, the OLE was dominated by deposition, and the average percentage of deposition area was more than 85% (Figure 6c).
Figure 6
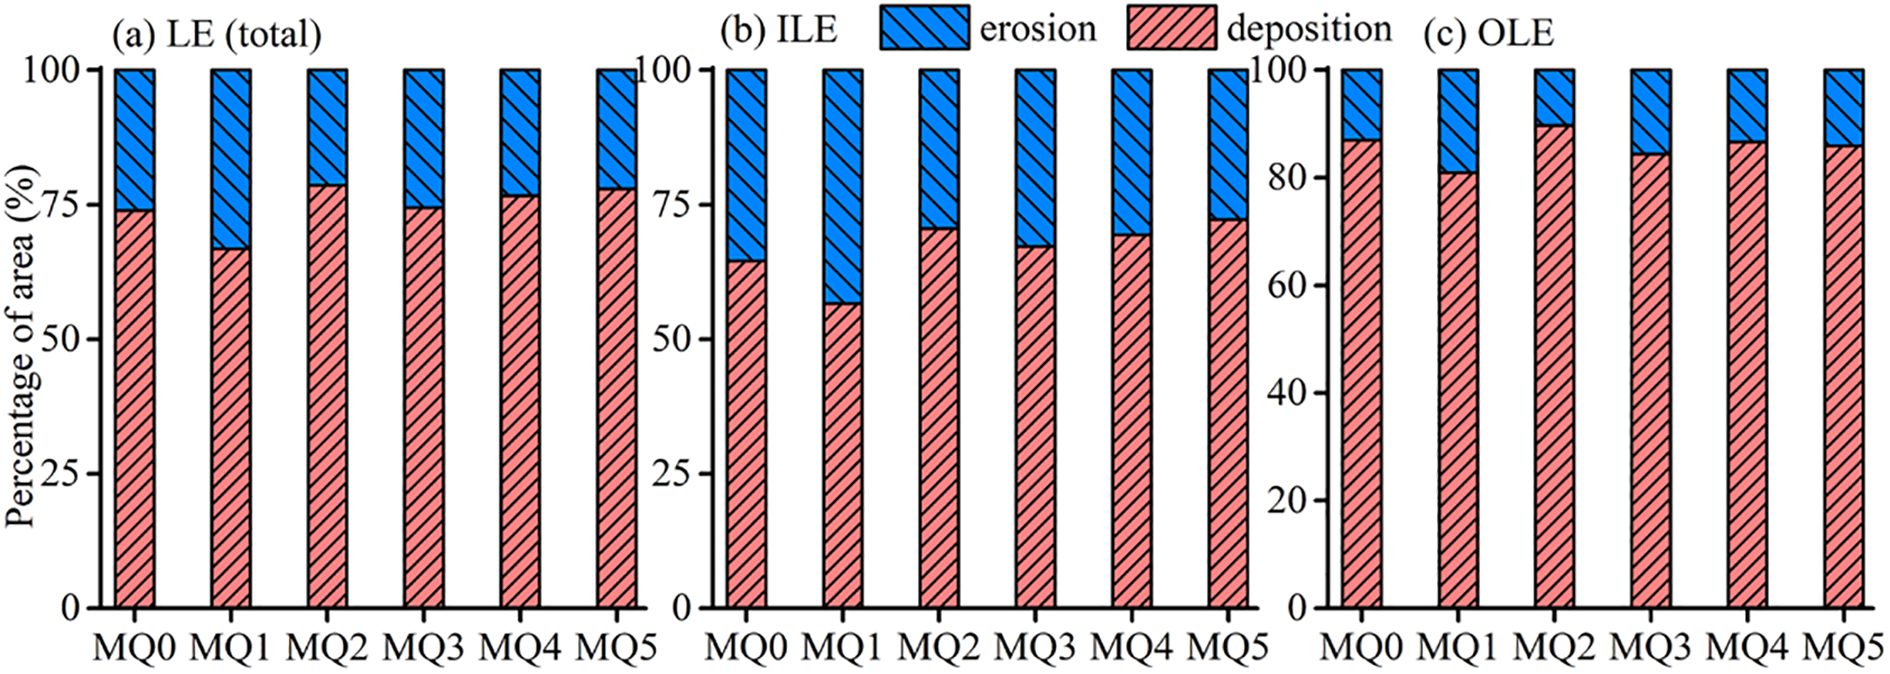
(a–c) The percentage of deposition and erosion areas in LE under six typical hydrological scenarios.
4.1.2 Variation in volume of the five geomorphic units
With the increase of upstream runoff, the volume of deposition and erosion in the five geomorphic units (namely, Eastern Shoal, Eastern Channel, Middle Shoal, Western Channel, and Western Shoal (Figure 1c)) differed significantly (Figure 7). The main variations were as follows: i) In the channels, the Western Channel had always maintained the pattern of net erosion, and the maximum net erosion volume was 2.87 ×10⁶ m3 in the MQ1 scenario (Figure 7a). In contrast, the net erosion pattern in the Eastern Channel was observed at low upstream runoff (MQ0 and MQ1 scenarios), while the net deposition pattern was observed at high upstream runoff (MQ2-MQ5 scenarios). ii) In the shoals, the Eastern Shoal had always kept the pattern of net deposition, the net deposition volume generally increased with the increase of upstream runoff, expect for MQ1 scenario (Figure 7b). In contrast, the net erosion patterns in the Middle Shoal and Western Shoal were observed at low upstream runoff, while the net deposition patterns were observed at high upstream runoff. The volume of net erosion or net deposition in the Western Shoal was 18 times larger than that in the Middle shoal (Figure 7b).
Figure 7
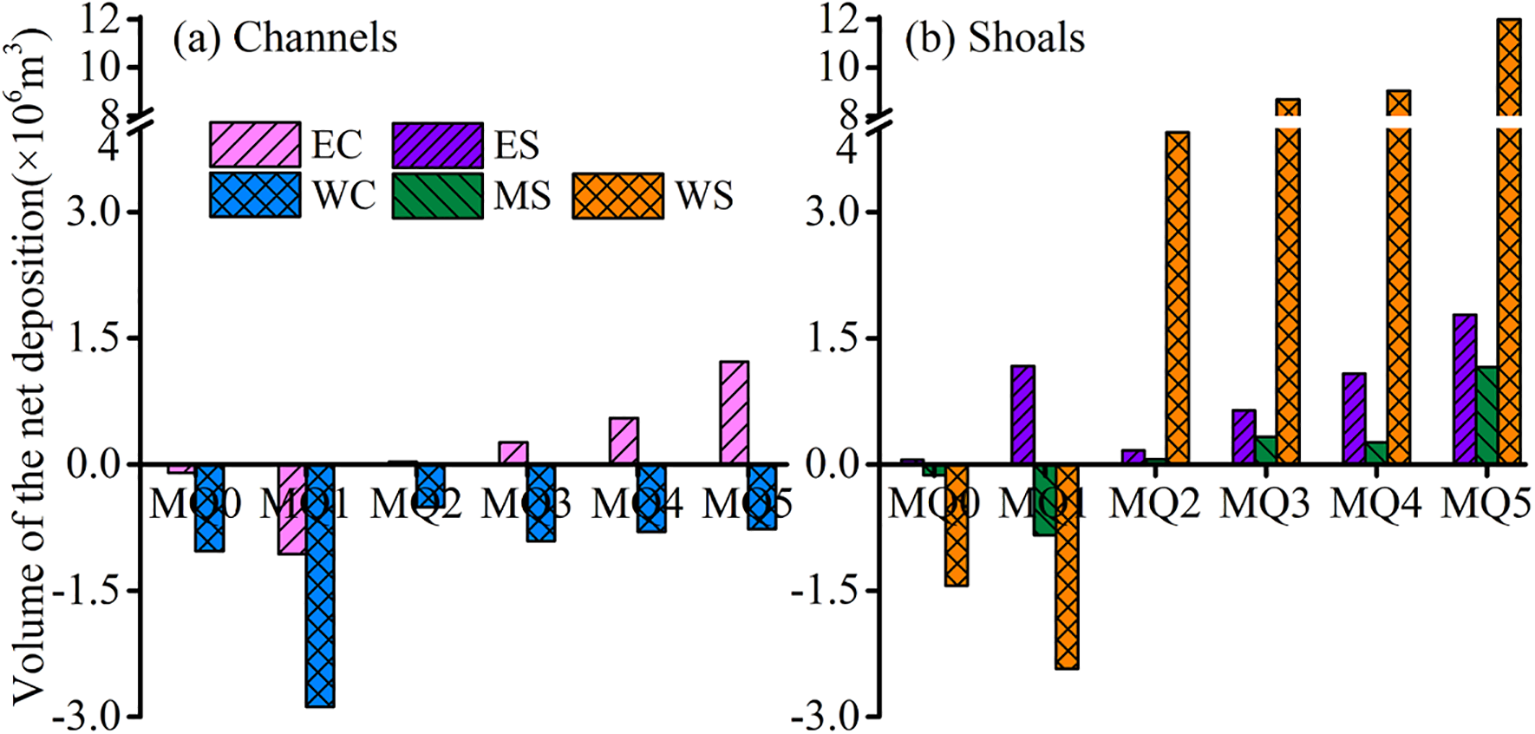
(a, b) The volume of deposition and erosion in channels and shoals under six typical hydrological scenarios. Positive values indicate deposition; Negative values indicate erosion. EC, Eastern Channel; WC, Western Channel; ES, Eastern Shoal; MS, Middle Shoal; WS, Western Shoal.
The preceding analysis revealed that the overall net erosion pattern was observed in LE at low upstream runoff (especially the net erosion volume of the Western Channel and Western Shoal in the MQ1 scenario were 2.87 ×10⁶ m3 and 2.43 ×10⁶ m3, respectively), while the net deposition pattern was observed at high upstream runoff (especially the net deposition volume of the Western Shoal in the MQ5 scenario was up to 1.2×10⁷ m3). Therefore, the Western Shoal could be regarded as a major sediment sink at high upstream runoff and an important source for downstream sediment supply at low upstream runoff. In addition, the back siltation trend in the Eastern Channel increased significantly with the increase of upstream runoff, especially in the MQ5 scenario.
4.2 Variation in deposition and erosion pattern
The response of deposition and erosion pattern to change in upstream runoff varied greatly (Figure 8). The main variations were as follows: i) In the MQ0 scenario, a general pattern of slight erosion was observed in the ILE, while an overall pattern of deposition was observed in the OLE. ii) The deposition and erosion pattern in the MQ1 scenario was similar to that in the MQ0 scenario, but the range of deposition and erosion in the former scenario was large than that in the latter scenario. Moreover, the strong erosion zone appeared in the area between Qi’ao Island, Inner-lingding Island, and the mouth of Shenzhen Bay (Figure 8b). iii) In the MQ2 scenario, the high-deposition centers were scattered outside the Humen outlet and Hengmen Eastern Channel “artificial outlet”. In addition, high-erosion areas were distributed inside the Hengmen Eastern Channel and Fuzhou Channel (Figure 8c). iv) With the increase of upstream runoff from MQ2 scenario to MQ5 scenario, the situation of deposition and erosion in the ILE and OLE were quit similar, but the area of the mouth bar outside the Humen outlet, Longxue Southern Channel “artificial outlet”, and Hengmen Eastern Channel “artificial outlet” widened seaward by 3−6 km, 2−3.5 km, and 4−5 km, respectively (Figures 8c-f). In contrast, the deposition in the OLE was generally weaker than that in the MQ1 scenario.
Figure 8
![Six-panel map series showing sediment thickness across a region, labeled MQ0 to MQ5. Each map displays variations in thickness using a color gradient from blue to red. Notable areas include OLE, ILI, and Shenzhen Bay, with a consistent scale bar of zero to sixteen thousand meters, and a legend indicating thickness in meters. Major geographical features and annotations like H[uM], WQSI, and ILE are present throughout all maps. North is oriented upwards.](https://www.frontiersin.org/files/Articles/1553631/xml-images/fmars-12-1553631-g008.webp)
(a–f) Variation of elevation in LE under six typical hydrological scenarios. HuM, Humen; JM, Jiaomen; HQL, Hongqili; HM, Hengmen; LXI, Longxue Island; WQSI, Wanqinsha Island; HMI, Hengmen Island; QI Qi'ao Island; ILI, Inner Lingding Island; ILE, Inner-lingding Estuary; OLE, Outter-lingding Estuary; LXSC, Longxue Southern Channel; HMEC, Hengmen Eastern Channel; ILI, Inner-lingding Island.
The preceding analysis in the volume and pattern of deposition and erosion revealed that the ILE was a critical site for sediment deposition at high upstream runoff (large to Catastrophic floods). However, the sediment in the ILE was eroded at low upstream runoff (multi-year dry season runoff), and then transported to the OLE for deposition.
4.3 Change in deposition and erosion centers
4.3.1 Characteristics of deposition and erosion centers
A sediment deposition center was a region with a high sediment concentration, a rapid deposition rate, and a large amount of deposition (Zhang et al., 2016). Several previous studies reported that the deposition rate in the Pearl River estuary (PRE), South China, was generally lower than 0.05–0.06 m/year due to high runoff and a low sediment load (Xiao, 2012; Liu et al., 2017). In the previous study, a deposition center in LE was defined as a region with an annual sediment deposition rate >0.15 m/year and a deposition area >0.50 km2 (Chen et al., 2020b). Therefore, this definition of deposition center was also adopted in this study. In addition, the definition of erosion center could refer to the definition of deposition center. The average erosion rate in LE was 0.07–0.09 m/year (Wu et al., 2016; Chen et al., 2020b). Through the comparison of the rates and areas of sediment erosion in LE, an erosion center in LE was defined as a region with an annual sediment erosion rate<-0.15 m/year and an erosion area >0.50 km2.
The number, area, and average rate of deposition and erosion centers changed notably under six typical hydrological scenarios (Figure 9). The main variations were as follows: i) In general, the number and area of deposition centers were relatively small at low upstream runoff (in the MQ0-MQ2 scenarios), while those at high upstream runoff (in the MQ3-MQ5 scenarios) were large, which were 6−11 patches and 50.93−62.53 km2 (Figures 9a, b), respectively. ii) The number and area of erosion centers in the MQ1 scenario were the largest, which were 8 patches and 14.53 km2. iii) The average rate of deposition and erosion centers increased obviously with the increase of upstream runoff, except for MQ4 scenario. The average rate of deposition and erosion centers in the MQ5 scenario were the largest, which were 0.215 m/year and −0.235 m/year (Figure 9c), respectively.
Figure 9
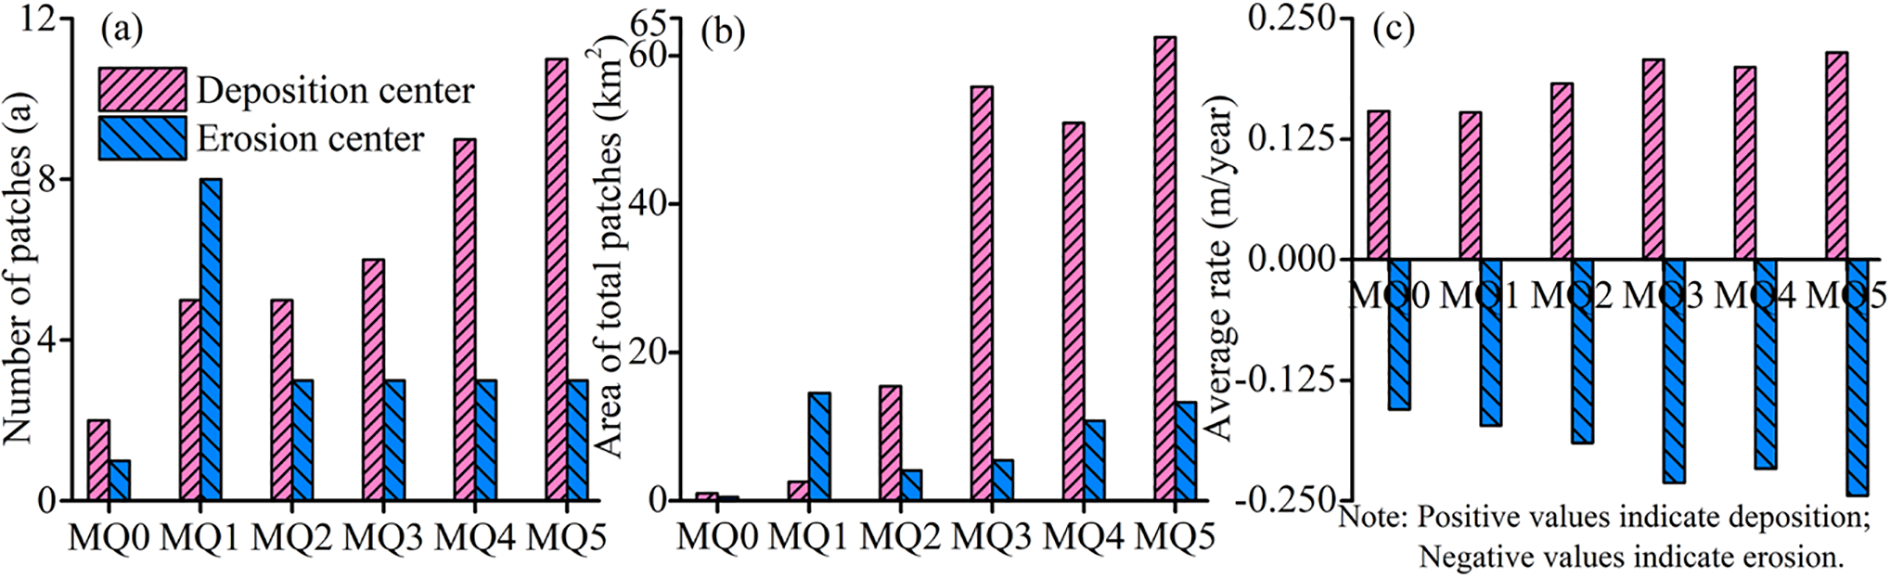
(a–c) The number, area, and average rate of deposition and erosion centers under six typical hydrological scenarios.
4.3.2 Classification and location of deposition and erosion centers
The intensity of sediment deposition or erosion was calculated by Equation 3, and the classification of sediment center or erosion center could be divided into four grades (Table 6). For example, Weak deposition center, Medium deposition center, Strong deposition center, and Extremely strong deposition center.
Based on the classification of deposition center and erosion center in Table 6, the map of deposition center and erosion center under different upstream runoff scenarios were drawn (Figure 10). The intensity and location of deposition or erosion center varied notably, and the main variations were follows: i) In the MQ0 and MQ1 scenarios, a few and small weak deposition centers were observed in the southern part of the OLE, in the northern side of ILE, and near the Humen outlet. However, a large number of weak to medium erosion centers were located in the Hengmen Eastern Channel, Fuzhou Channel, and in the zone between Qi’ao Island, Inner-lingding Island, and the mouth of Shenzhen Bay (Figure 10b). ii) In the MQ2 scenarios, a few weak to medium deposition centers appeared in the Humen outlet, Longxue Southern Channel, and outside the Hengmen Eastern Channel “artificial outlet”. iii) With the increase of upstream runoff, the area of deposition center formed outside the outlets widen seaward, and the intensity of deposition centers increased. For example, the deposition center outside the Hengmen Eastern Channel was changed from the weak deposition center in the MQ2 scenario, to the medium deposition center in the MQ3 and MQ4 scenarios, and to the strong deposition center in the MQ5 scenario. Moreover, the area of deposition center outside the Humen outlet and the Hengmen Eastern Channel “artificial outlet” widen outward by 9.62 km and 5.43 km from the MQ2 scenario to the MQ5 scenario, respectively (Figure 10f). iv) Strong to extremely strong deposition centers were easy to form inside the Longxue Southern Channel (Figures 10d-f). In addition, medium to strong erosion centers were observed in the Fuzhou Channel and Hengmen Eastern Channel (Figures 10e, f).
Figure 10
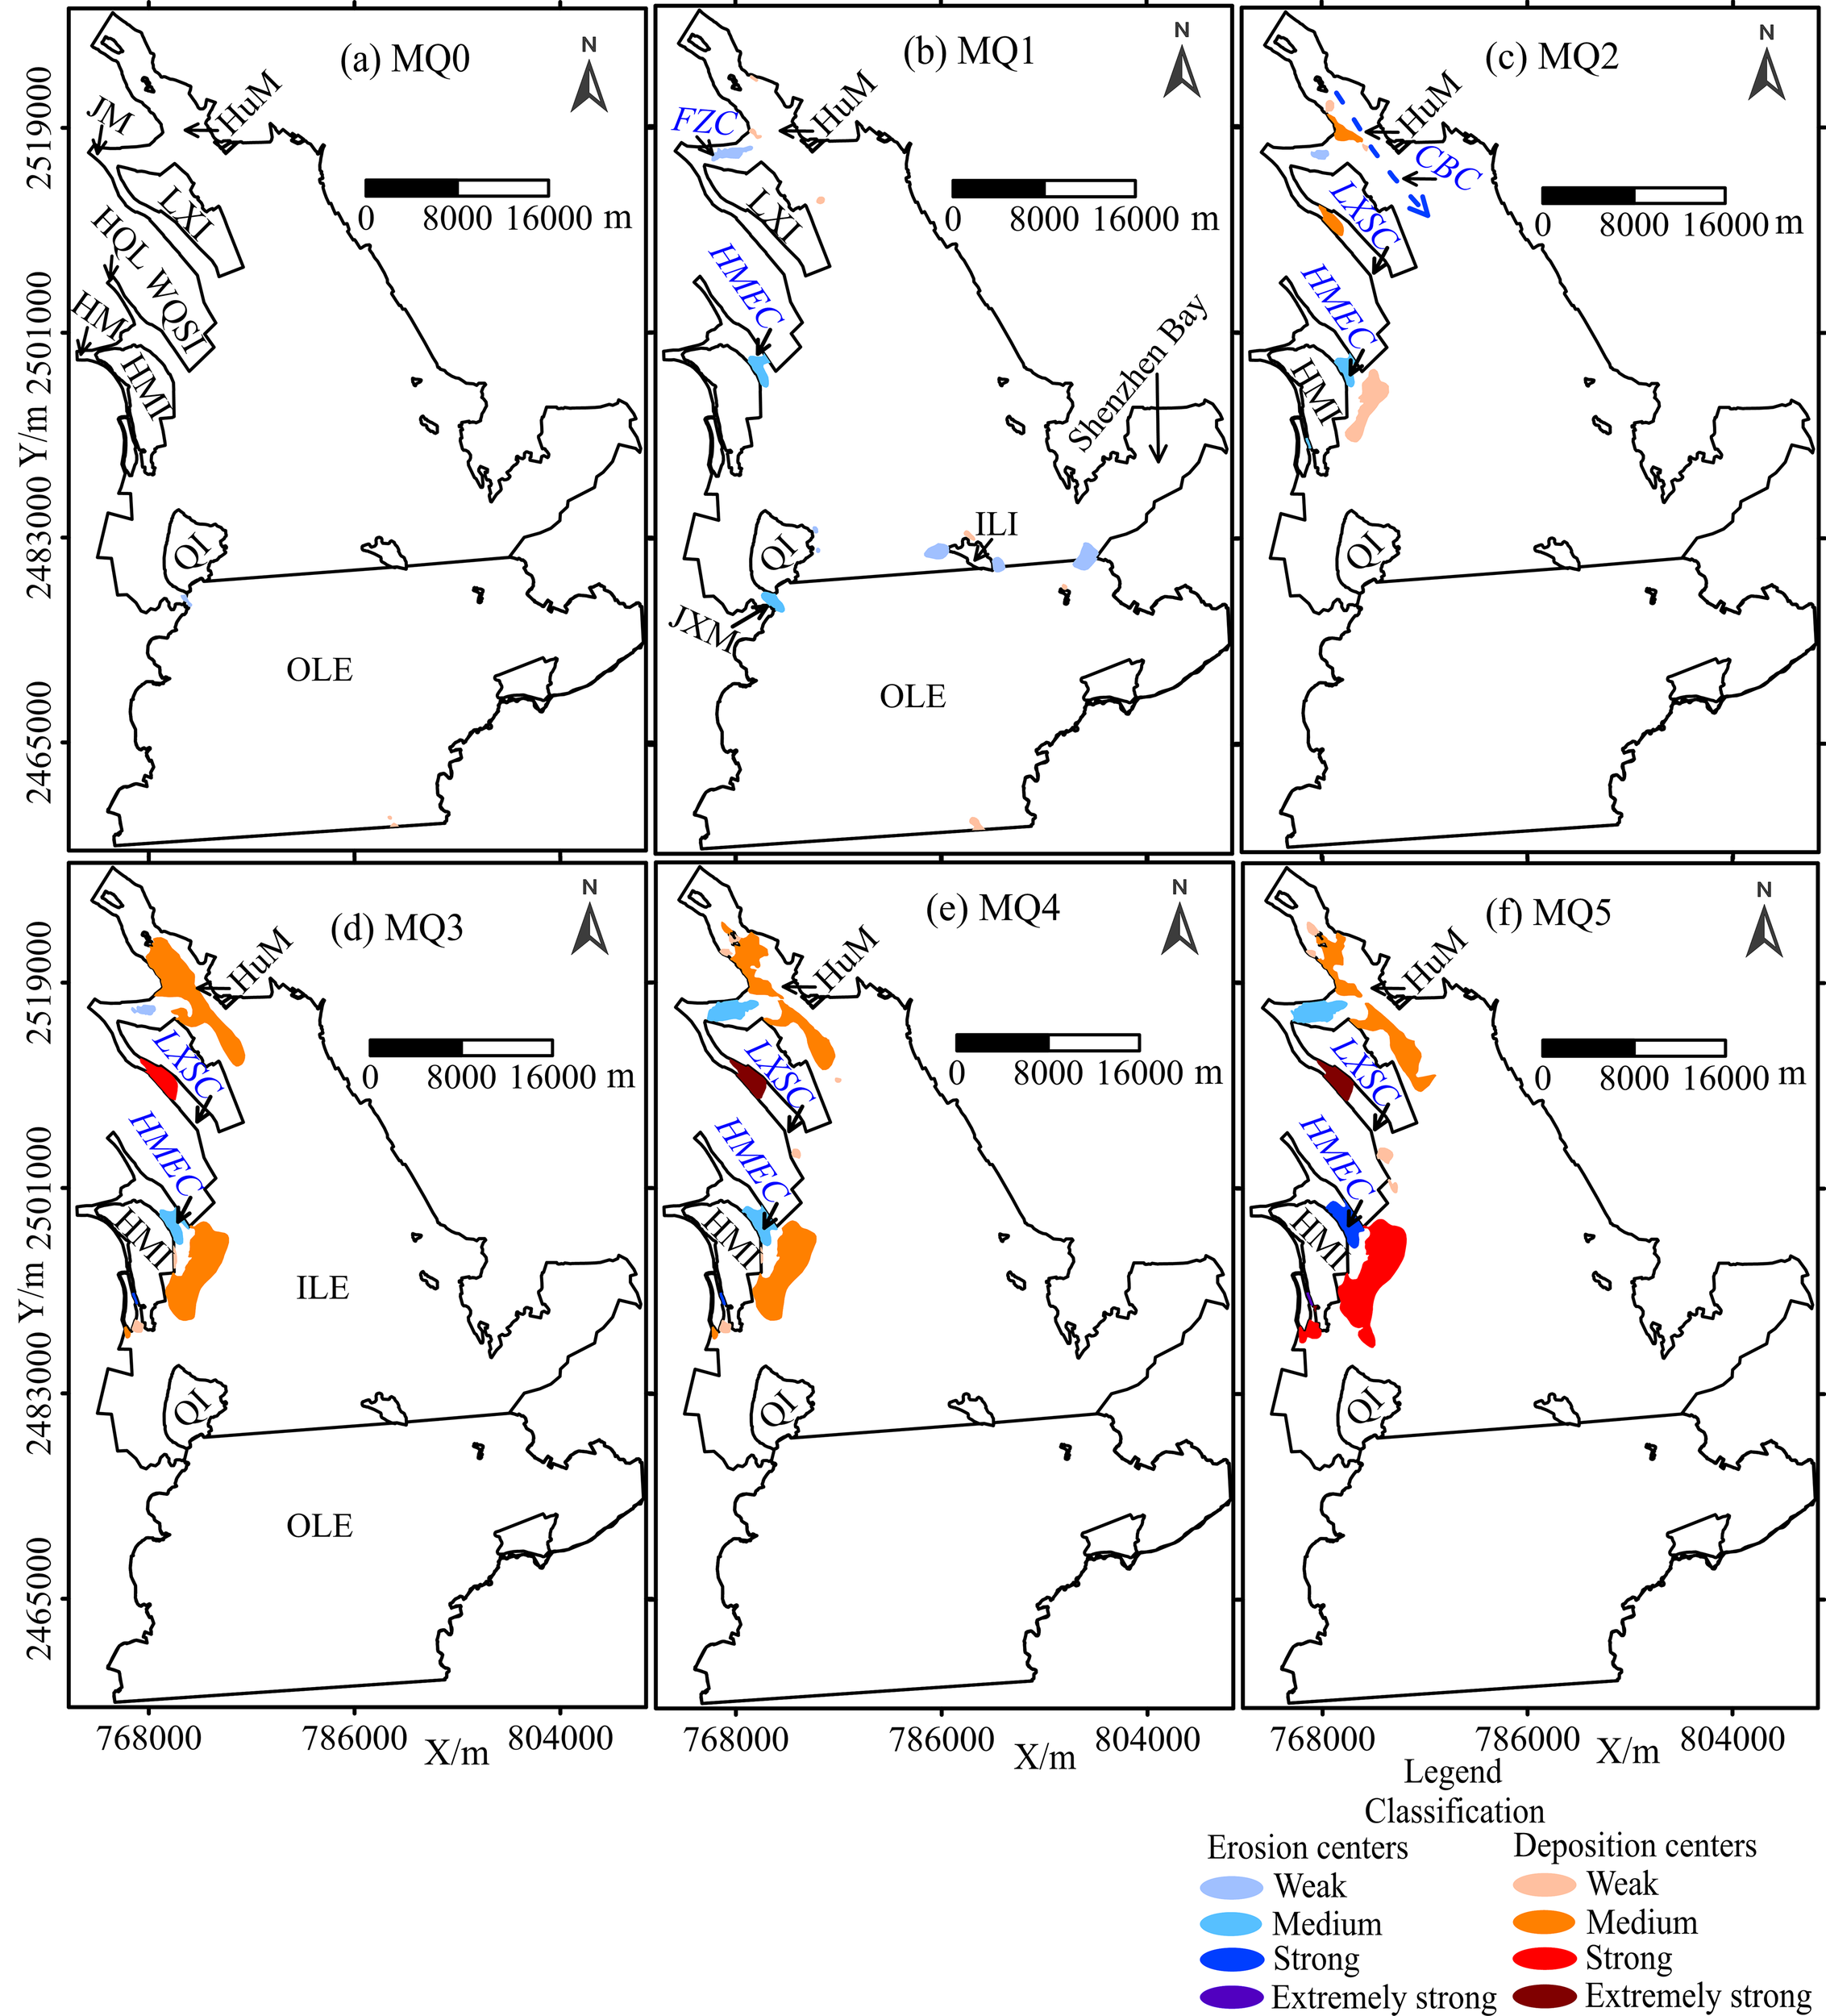
(a–f) The intensity and distribution of deposition centers and erosion centers under six typical hydrological scenarios. HuM, Humen; JM, Jiaomen; HQL, Hongqili; HM, Hengmen; LXI, Longxue Island; WQSI, Wanqinsha Island; HMI, Hengmen Island; QI, Qiao Island; ILI, Inner Lingding Island; ILE, Inner-lingding Estuary; OLE, Outter-lingding Estuary; LXSC, Longxue Southern Channel; HMEC, Hengmen Eastern Channel; FZC, Fuzhou Channel; JXM, Jinxingmen; ILI, Inner-lingding Island; CBC, Chuanbi Channel.
The preceding analysis revealed that the upstream runoff discharge in the MQ2 scenario was regarded as the basic runoff condition for the formation of the deposition center outside the outlets. With the increase of upstream runoff, the intensity and range of deposition centers increased significantly. Likewise, the intensity of erosion centers also increased. In addition, the strong to extremely strong deposition center was easy to form inside the Longxue Southern Channel.
5 Discussion
5.1 Variations in the dynamic contrast between runoff and tide
The unique dynamic characteristics of estuarine regions are shaped by the interaction between runoff and tide (Shi, 2001). With the increase of runoff dynamics, the stagnation zone of runoff and tide moved downstream (Xu, 2014). On the contrary, the stagnation zone of runoff and tide moved upstream, and the range of salinity intrusion increased (Wu et al., 2006). The change of the dynamic contrast between runoff and tide was an important factor for causing the variation of suspended sediment concentration in the estuary (Fan, 2016), which could alter the sediment transport and deposition pattern.
The spatial pattern of stagnation points (the equilibrium of the dynamic contrast between runoff and tide) in LE was as follows: i) In the MQ1 scenario, the equilibrium zone of the dynamic contrast between runoff and tide was distributed to the south of ILI (Figure 11c, pink dotted line). The stagnation point A in the Eastern Channel was located near the mouth of Shenzhen Bay, and the stagnation point B in the Western Channel was located on the southwest side of ILI. ii) Compared with the MQ1 scenario, the equilibrium zone of the dynamic contrast between runoff and tide in the MQ3 and MQ5 scenarios moved southward, by ~3.5 km and ~5.4 km, respectively. The stagnation point in the Eastern Channel moved southward from point A to point A’ by 3.1 km, to point A’’ by 5.3 km. The stagnation point in the Western Channel moved southward from point B to point B’ by 6.5 km, to point B’’ by 9.1 km. The zone near the equilibrium of the dynamic contrast between runoff and tide deposited notably, so in the MQ1 scenario, the deposition zone was observed in the northern part of OLE (Figure 8b). Furthermore, the equilibrium zone between runoff and tide moved around north and south with the change of the dynamic contrast between runoff and tide, thus affecting the geomorphological evolution pattern in LE. Owing to the southern shift of the equilibrium zone between runoff and tide in LE, the range of deposition center in the MQ5 scenario extended outward by 6−10 km (Figures 10c-f).
Figure 11
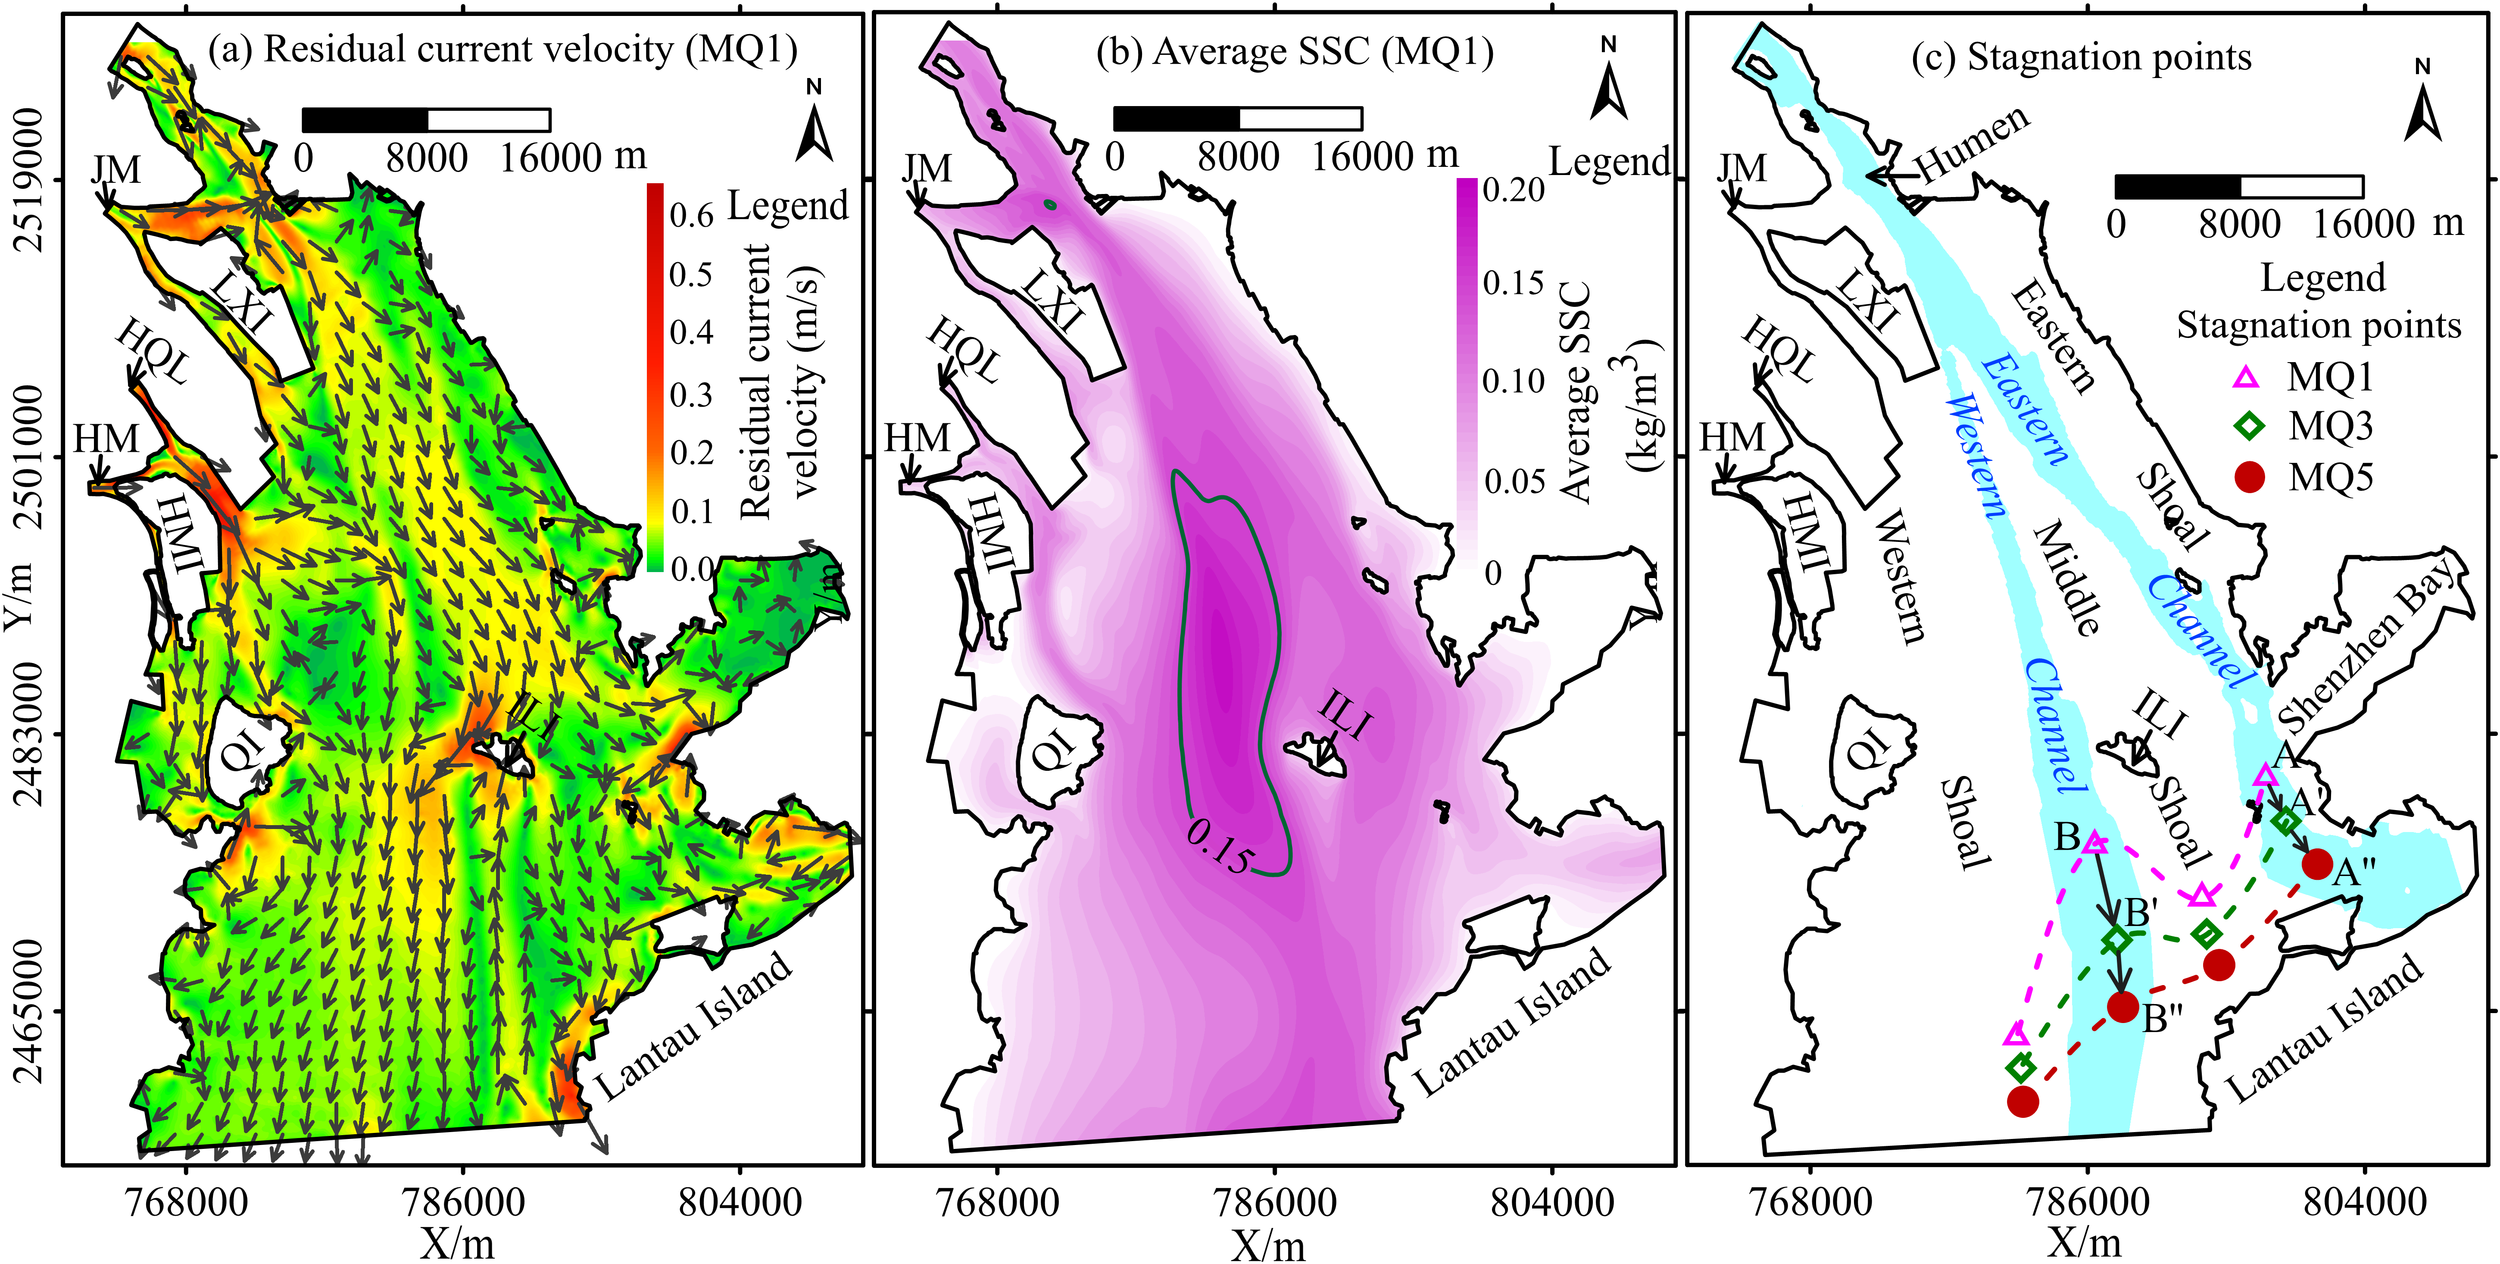
The pattern of residual current velocity and average SSC in the MQ1 scenario (a, b), and the stagnation points in the MQ1, MQ3, and MQ5 scenarios (c). stagnation point in the MQ1, MQ3, and MQ5 scenarios. SSC, Suspended sediment concentration; JM, Jiaomen; HQL, Hongqili; HM, Hengmen; LXI, Longxue Island; HMI, Hengmen Island; ILI, Inner-lingding Island; Qf, Qiao Island.
5.2 Mechanism of the deposition regime shift
5.2.1 Mechanism of the deposition regime shift in the ILE and OLE
A large flood referred to the natural phenomenon when water discharge and water levels increased rapidly. During flood period, a large amount of sediment could be transported to estuaries. Liu et al. (2019b) reported that a high flood stage was a principal factor accounting for an acceleration of floodplain sedimentation induced by large to catastrophic flood in the middle and lower Yangtze River. Similarly, the Pearl River basin was also a region prone to frequent flooding, and it had experienced several large to catastrophic flood events over the past four decades (Chen et al., 2020b). The annual water and sediment discharges in the downstream became relatively larger in the year of the flood events. He et al. (2020) reported that the sediment loads under catastrophic flood into the LE from the Humen, Jiaomen, Hongqili, and Hengmen outlets reached 1.67 ×10⁷ t in total, compared with 4.54 ×10⁶ t under usual flood. Under the high upstream runoff conditions, LE presented an overall deposition pattern (Figure 12a), in which strong deposition pattern was observed in the ILE with a net deposition volume of 1.91−2.38 ×10⁷ m3 (Figure 5b), while OLE showed a slight deposition pattern with a net deposition volume of 4.68−4.73 ×10⁶ m3 (Figure 5c). Moreover, a pattern of multiple strong to extreme deposition centers exists in LE because of unique multiple outlets (Figures 10d-f), and the water and sediment discharge at different outlets varied greatly. In this study, ~60% of sediment load deposited notably outside the outlets during large to catastrophic flood events. As a result, two large and strong deposition centers were formed outside the Humen outlet, Longxue Southern Channel “artificial outlet”, and Hengmen Eastern Channel “artificial outlet” (Figure 12a). In addition, the sediment in the OLE was favored to be transported to the South China Sea due to the southern shift of the equilibrium zone between runoff and tide by 3−5 km during large to catastrophic flood events. In consequence, a slight deposition pattern was detected in the OLE (Figure 12a).
Figure 12
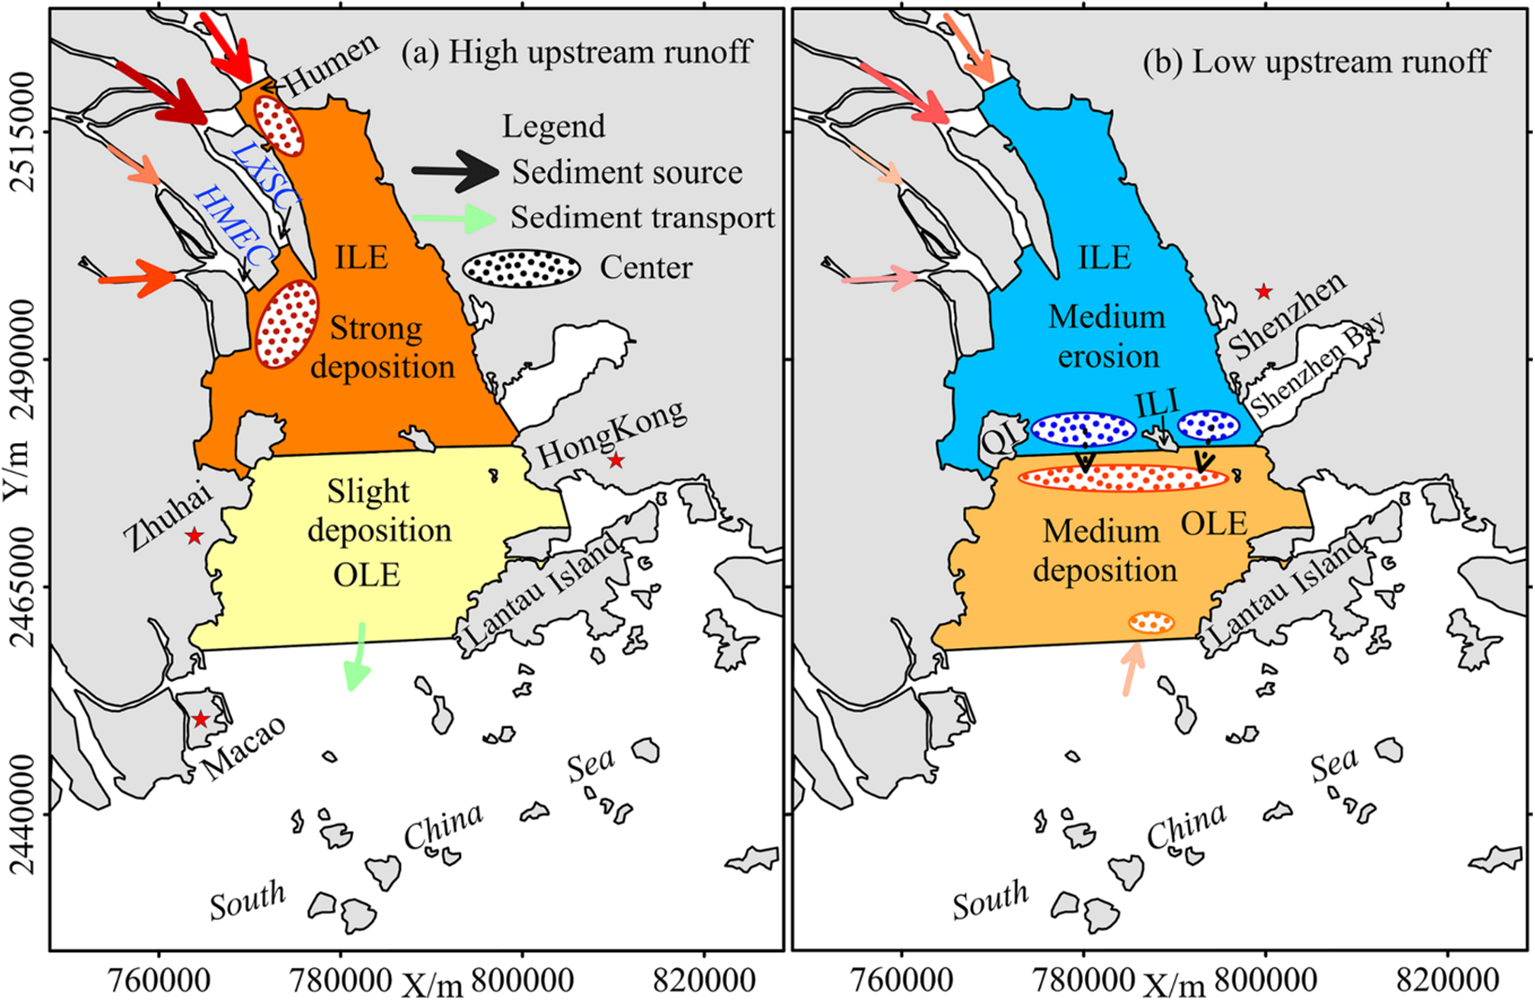
(a, b) Schematic maps of the deposition regime shift in the ILE and OLE. High upstream runoff referred to the water discharge was more than the multi-year flood season average runoff; Low upstream runoff referred to the water discharge was less than the multi-year dry season average runoff. LXSC, Longxue Southern Channel; HMEC, Hengmen Eastern Channel; QI, Qi'ao Island; ILI, Inner-lingding Island.
Compared with the high upstream runoff conditions, the deposition regime in LE altered significantly under the low upstream runoff conditions. The main variations were as follows: i) Owing to the lack of upstream sediment loads at the low upstream runoff conditions, a medium erosion pattern was observed in the ILE with a net deposition volume of -9.43×10⁶ m3 (Figure 5b), while a medium deposition pattern was detected in the OLE with a net deposition volume of 1.19×10⁷ m3 (Figure 5c). ii) Two large and medium erosion zones were observed in the area between Qi’ao Island, Inner-lingding Island, and the mouth of Shenzhen Bay at the low upstream runoff conditions (Figure 8b). However, the sediment from these erosion zones was transported by tidal current to deposit in the northern part of the OLE (Figure 12b). Moreover, iii) a small and weak deposition center was appeared in the southern part of the OLE (near the western side of Lantau Island) because of sediment from the sea (Figures 11a, b). iv) The sediment from the sea and the sediment erosion in the ILE were the major factor for causing the enhancement of deposition in the OLE.
The preceding analysis revealed that the deposition regime in the ILE shifted from erosion pattern in the MQ1 scenario to deposition pattern in the MQ2 scenario (Figure 5b), corresponding to the upstream runoff conditions of 3120 m3/s (the sum of water discharge from Boluo, Shijiao and Gaoyao hydrological stations) and 6831 m3/s (Table 4), respectively. Therefore, the dynamic equilibrium pattern of sediment erosion and deposition in the ILE might be appear at the upstream runoff conditions between 3120 m3/s and 6831 m3/s.
5.2.2 Mechanism of the deposition regime shift in the channels and shoals
The ILE showed a unique geomorphic pattern of “three shoals and two channels”, and the response of deposition regime to changes in upstream runoff varied greatly in the shoals and channels. Under the high upstream runoff conditions, the main variations were as follows: i) In the shoals, they generally showed a strong sediment deposition pattern, and an extremely strong deposition pattern was observed in the Western Shoal with a net deposition volume of 1.21×10⁷ m3 (Figure 13b). ii) In the channels, a weak sediment erosion pattern was detected in the Western Channel with a net deposition volume of -7.69×10⁵ m3 (Figure 7a), while a weak sediment deposition pattern was observed in the Eastern Channel with a net deposition volume of 1.22×10⁶ m3 (Figure 7a).
Figure 13
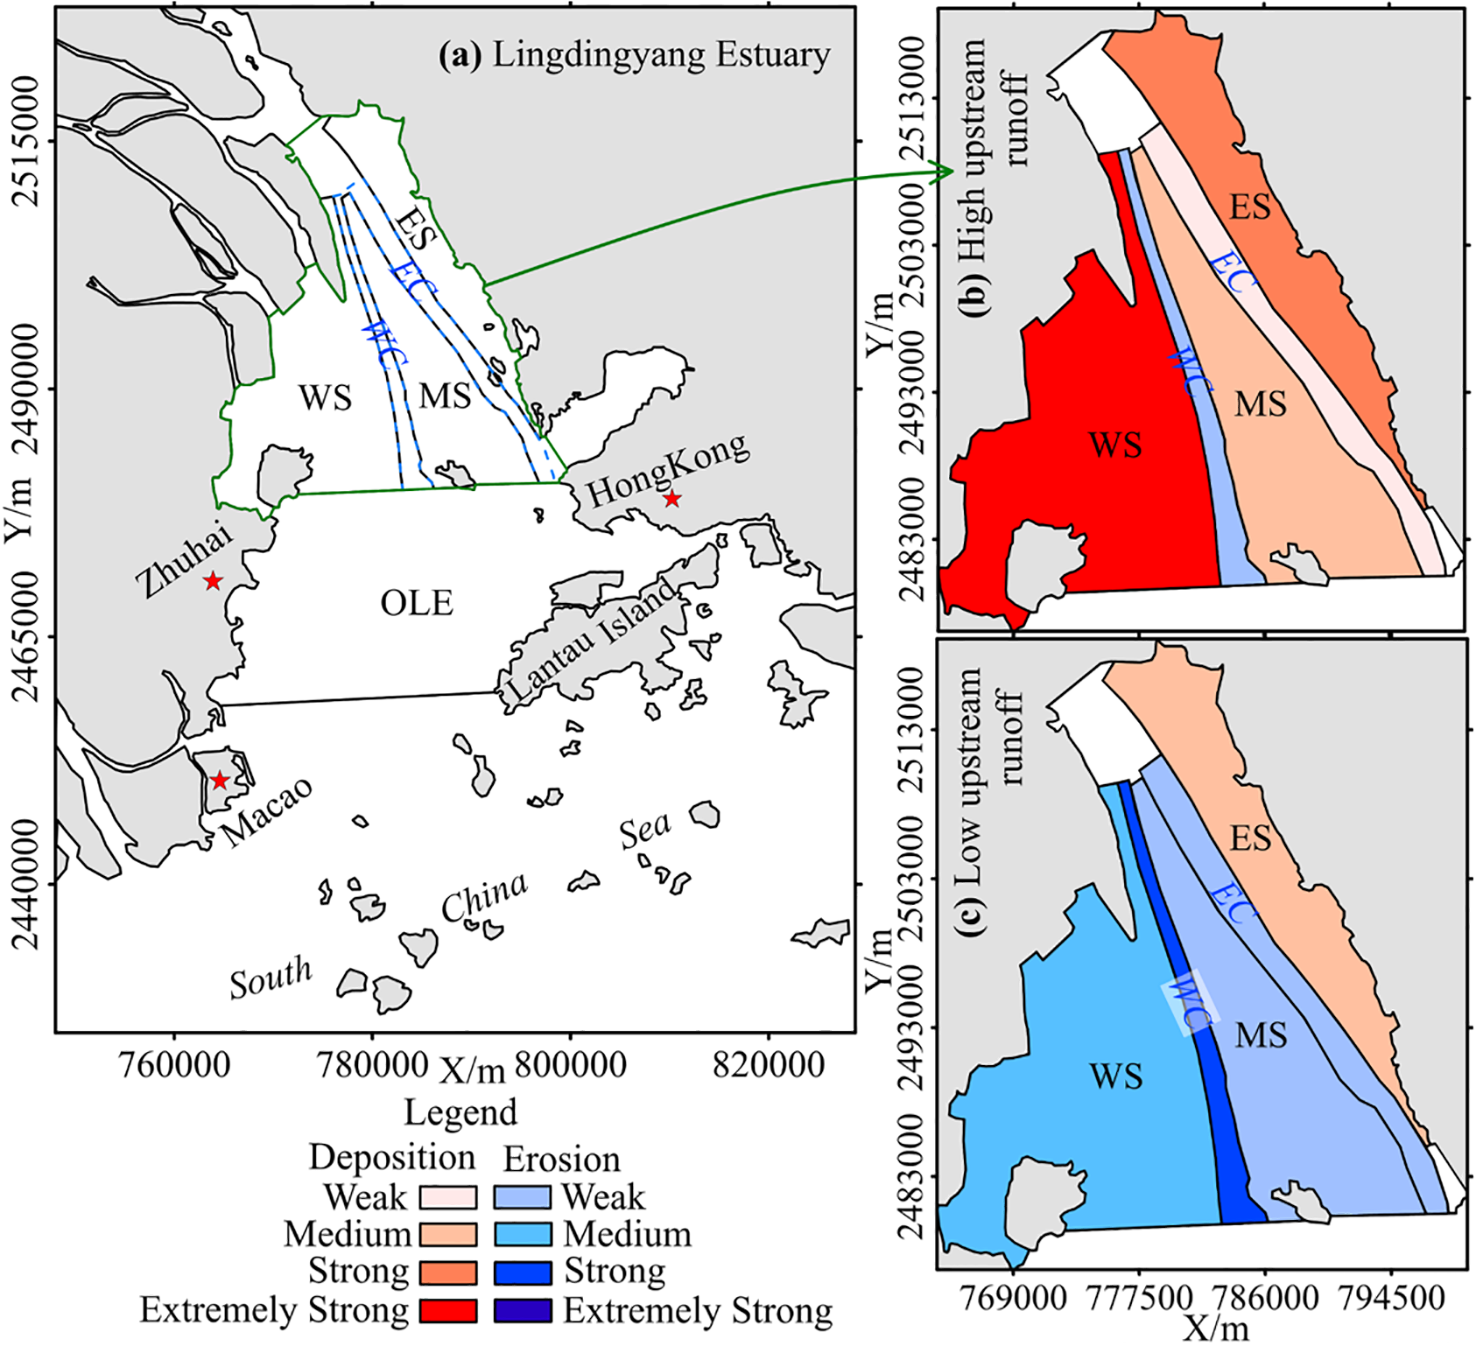
(a–c) Schematic maps of the deposition regime shift in the shoals and channels. High upstream runoff referred to the water discharge was more than the multi-year flood season average runoff. Low upstream runoff referred to the water discharge was less than the multi-year dry season average runoft. ES, Eastern Shoal; MS, Middle Shoal; WS, Western Shoal; EC, Eastern Channel; WC, Western Channel.
Compared with the high upstream runoff conditions, the deposition regime in the different geomorphic units altered significantly under the low upstream runoff conditions. The main variations were as follows: i) Owing to the lack of upstream sediment loads at the low upstream runoff conditions, an overall sediment erosion pattern was showed in the shoals and channels, except for the Eastern Shoal (Figure 13c). ii) In the shoals, a medium sediment erosion pattern was observed in the Western Shoal with a net deposition volume of -2.48×10⁶ m3 (Figure 7b) and a weak sediment erosion pattern was detected in the Middle Shoal. In addition, a medium sediment deposition pattern was observed in the Eastern Shoal with a net deposition volume of 1.17×10⁶ m3 (Figure 7b). iii) In the channels, an extremely strong sediment erosion pattern was observed in the Western Channel with a net deposition volume of -2.88×10⁶ m3 (Figure 7b), while the Eastern Channel showed the weak sediment erosion pattern (Figure 13c).
The preceding analysis revealed that the deposition regime in the Western Shoal shifted from a medium sediment erosion pattern at low upstream runoff condition to an extremely strong sediment deposition pattern at high upstream runoff condition. This indicated that the Western Shoal played a key role in the regulation of sediment “source and sink” in the ILE. Similarly, the phenomenon occurred in the Middle Shoal, and the dynamic equilibrium pattern of sediment erosion and deposition in the Middle Shoal might be appear in the MQ2 scenario with a slight net deposition volume of 6.21×10³ m3 (Figure 7b). In the channels, with the increase of upstream runoff, the sediment erosion pattern weakened notably, even altered in the Western Channel. And these morphology variations in the Western Channel of LE are in-line with He et al. (2020).
5.3 Comparison of sediment regime responses to upstream runoff and sediment discharge conditions across estuaries
This study demonstrates that increasing upstream runoff magnitude significantly alters the sediment regime in LE, driving distinct shifts in erosion-deposition patterns across geomorphic units. Similar runoff-driven sediment regime changes have been reported globally, exemplified by: enhanced deposition in California’s Cache Creek (Tu et al., 2017), rapid channel widening during extreme floods in the Yangtze Estuary (Mei et al., 2018), and sediment redistribution in the Modaomen Estuary (Liu et al., 2023). Moreover, under extreme flood conditions, the upstream sediment transport rates in the LE increase significantly, and a large amount of sediment is exported into the LE through the four eastern outlets (Humen, Jiaomen, Hongqili, and Hengmen) (He et al., 2020). Similar phenomena have been found in the Rhone River delta (Boudet et al., 2018) and the Qiantang Estuary (Xie et al., 2017). In addition, the 1998 Yangtze River catastrophic flood removed accumulated sediments deposited around the channel openings during the preceding years and redeposited them on the shelf (Dai et al., 2014).
However, unlike other alluvial estuaries, the LE’s multi-outlet sediment delivery system results in a distinct set of sedimentary response mechanisms. Multiple depocenters were observed near the outlets of the LE, with both the depositional thickness and area correlating positively with upstream runoff magnitude (Figures 10c-f). In contrast, the Misa River channel experienced slight erosion, while the estuary was subject to severe erosion during the flood season (Brocchini et al., 2017). In addition, under flood conditions, the ILE functions as a major sediment sink for upstream-derived materials (Figure 12a), particularly in shoal regions (Figure 13b). Conversely, during drought conditions, the ILE transitions to a sediment source, while the OLE becomes the dominant depositional sink (Figure 12b). Obviously, the intrinsic link between the variations in upstream runoff and sediment discharge and the estuarine sediment regime is unique and complex among the world’s major estuaries.
5.4 Implications for future estuary management
This study showed that the deposition regime in LE responded to upstream runoff variation in a complex fashion. During the high upstream runoff conditions, a large amount of sediment load was prone to be deposited in the ILE (Figure 5b), and the strong sediment deposition centers were formed outside the Humen outlet and Hengmen Eastern “artificial outlet” (Figures 10d-f), which may lead to the decrease of flood discharge capacity at the “Four Eastern Outlets” in LE. The weakening of regulation function in the outlets may lead to the flood disasters in the upstream cities, including tide overflow, wharf safety and so on. Due to the combined influence of the flood discharge from Xijiang River and Liuxi River and astronomical spring tides, the high tidal level of several river channels in the Pearl River exceeded the warning level during the catastrophic flood from June 15 to 16, 2022 (Reported by Pearl River Water Resources Commission of the Ministry of Water Resources). For example, the highest tidal level of Zhongda hydrometric station exceeded the warning level by 0.79 m. Consequently, the tide overflow was observed in the Yanjiang Road (Figure 14b), and the infrastructure of the Xiti Wharf was damaged (Figure 14c). Therefore, the impacts of strong sediment depocenter outside the outlets on flood discharge capacity cannot be overlooked during catastrophic flood and mitigation measures such as flood control and dredging should be taken (He et al., 2020). In addition, the relative tidal forcing of LE may increase by massive estuarine engineering (Chu et al., 2022), which means stronger saltwater intrusion and higher risk of flooding.
Figure 14
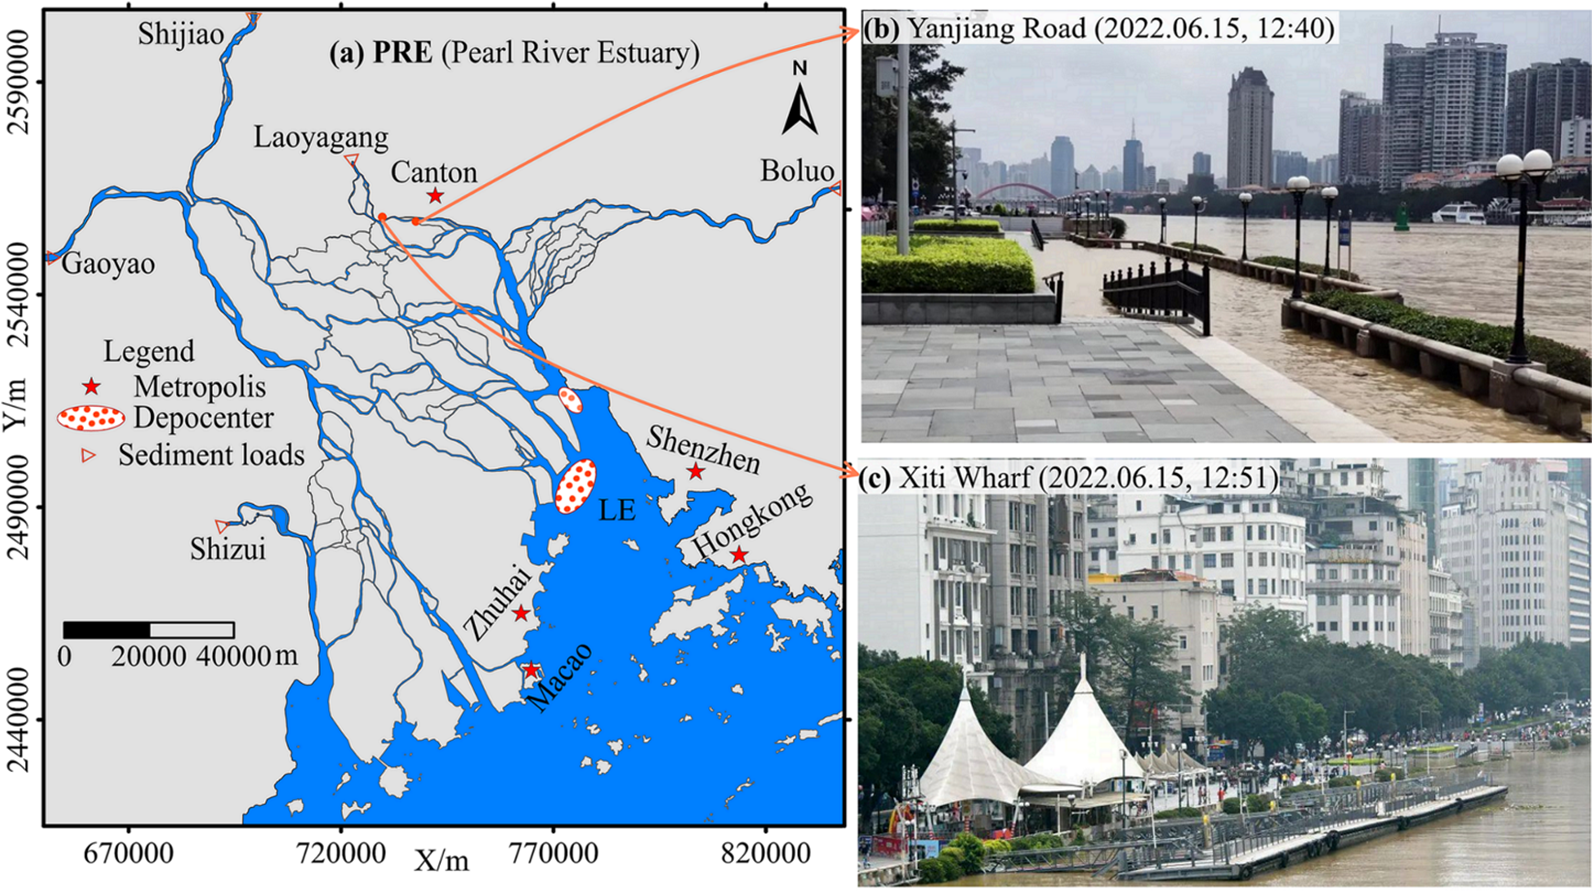
(a) Tidal overflow in the upstream reaches of LE during the catastrophic flood (June2022). LE, Lingdingyang Estuary. (b, c) The highest tidal level of Zhongda Hydrometric station was 2.69 m At 11:45 on June 15, 2022, exceeding the warning level by 0.79 m. and are revised from Southcn.com.
Secondly, the ILE presented an erosion pattern at the low upstream runoff conditions, and strong erosion zones were detected in the area between Qi’ao Island, Inner-lingding Island and the mouth of Shenzhen Bay (Figure 8b). The deposition regime of the Western Shoal was change from strong deposition at high upstream runoff condition to strong erosion at low upstream runoff condition (Figures 13b, c). So, the Western Shoal played an important role in sediment source and sink of LE. Moreover, owing to the deposition regime change, the morphologic equilibrium between shoals and channels may be altered (Hu et al., 2018). According to the comparison of net deposition volume in section 3.1.2, the morphologic equilibrium of the Eastern Channel may occur in the MQ2 scenario (Fig7). Additionally, due to large amount of sediment discharge under large to extreme flood conditions, heavy deposition was observed in the channels, especially in the Eastern Channel with a net deposition volume of 1.22×10⁶ m3 in the MQ5 scenario (Figure 7a). And these morphology changes are in-line with Wu et al. (2014). The influences of catastrophic floods on the navigation channels should raise wide attention and it also seems reasonable to assume that maintenance of shipping channels will necessitate ever-deeper dredging owing to greater displacement of large ships.
Thirdly, an erosion pattern was observed in the Middle Shoal at low upstream runoff conditions. Although under catastrophic floods condition, the net deposition volume of the Middle Shoal was 1.16×10⁶ m3, less than 10% of the net deposition volume in the Western Shoal and 65% of the net deposition volume in the Eastern Shoal (Figure 7b). Moreover, Li (2017) and Chen et al. (2020b) had reported that a large number of massive sand mining projects had been detected in the Middle Shoal of LE. Owing to large-scale sand mining after 2008, a huge sand pit with a volume of 7.0×10⁸ m3 had been formed in the Middle Shoal (Ying et al., 2019), which was basically equivalent to the net deposition volume of the Middle Shoal from 1955 to 2008 (Yang et al., 2019). Once the Middle Shoal is hollowed by massive sand mining, its recovery is quite difficult with sharp decrease of sediment in upstream. Therefore, large-scale sand mining in the Middle Shoal should be more cautious and limited in the future. In contrast, the Eastern Shoal always showed a net deposition pattern, even if the net deposition volume was 5.97×10⁴ m3 in the MQ0 scenario. A net deposition volume of 1.78×10⁶ m3 was observed in the Eastern Shoal under catastrophic floods condition (Figure 7b). Furthermore, the total net deposition volume of the Eastern Shoal was ~ 1.53×10⁸ m3 from 1955 to 2015 (Chen et al., 2020b). It seems reasonable to assume that appropriate sand mining in the Eastern Shoal of LE is desirable.
This research highlights the importance of understanding the deposition regime and its possible response to upstream runoff variations. Based on these results, we could provide specific guidelines for estuarine management. i) The impacts of strong sediment depocenter outside the outlets should conduct more thorough analysis under large to catastrophic flood conditions to minimize the increase of flood risk; ii) Mitigation measures such as bathymetric monitoring and dredging should be taken in the channels (i.e., Eastern Channel) during extreme flood condition. iii) The strong erosion of the Western Shoal and Middle Shoal cannot be overlooked at low upstream runoff and large-scale sand mining should be prohibited at locations that may alter the morphologic balance between shoals and channels, such as the Middle Shoal in LE. iv) Appropriate sand mining in the Eastern Shoal of LE is desirable that may not only maintain the tidal dynamic in the Eastern Shoal, but also promote the social and economic development. The modeling developed in the current study can help predict the possible disturbances of extreme upstream runoff events on LE in the future.
5.5 Limitations and future studies
While this study provides valuable insights into the response of sediment regime in LE to upstream runoff variations, the following limitations should be acknowledged: (1) Validation data primarily relied on historical reports, lacking high-resolution in-situ measurements of sediment flux during extreme flood/drought events; (2) The LEM exclusively considered cohesive sediments, neglecting the role of non-cohesive sediments in shaping estuarine deposition patterns; (3) Constrained by limited access to recent bathymetric and shoreline data, the LEM was constructed using 1999 bathymetric and shoreline data. While this approach effectively reveals the fundamental response patterns of LE’s deposition regime to upstream variations, the scenario simulations did not incorporate recent environmental changes such as sand mining activities and sea-level rise– a critical gap for future research.
Furthermore, future research should prioritize in-depth analysis of recent topographic and shoreline changes, combined with improved morphological modeling, to advance our understanding of estuarine sedimentation mechanisms.
6 Conclusions
Over the past half-century, the Pearl River Basin has experienced frequent extreme hydrological events, leading severe challenges in LE, including navigation channel sedimentation, estuarine blockage, and urban waterlogging. This study employs an internally coupled TELEMAC-2D and SISYPHE model to examine the influence of upstream runoff variability on the sedimentation regime of LE. The main conclusions can be summarized as follows.
Persistent net deposition occurs in LE across all hydrological regimes, intensifying with higher runoff (> 6831 m3/s) and forming prominent depocenters near outlets. The ILE shifts from erosion (low runoff:< 3120 m3/s) to strong deposition (high runoff), with a morphologic equilibrium pattern likely between 3120 m3/s and 6831 m3/s. The Western Shoal exhibits medium erosion pattern (a net deposition volume of -2.43×10⁶ m3 in the MQ1) under low runoff but extreme deposition (a net deposition volume of 1.20×10⁷ m3 in the MQ5) during high runoff, while the Western Shoal approaches equilibrium in MQ2 (a slight net deposition volume of 6.21×10³ m3). Catastrophic floods drive abrupt navigation channel sedimentation (i.e. a net deposition volume of 1.22×10⁶ m3 in the Eastern Channel), necessitating dredging and bathymetric monitoring. Sustainable sand mining requires avoiding large-scale extraction in the marginally depositing/eroding Middle Shoal, but permits regulated activity in the consistently depositing Eastern Shoal.
These findings show that deposition regime in LE can be altered by the changes of upstream runoff and sediment. Such mechanistic understanding holds strategic importance for adaptive management strategies to address future extreme hydrological events. Furthermore, the results of this study enrich our understanding of the variations in deposition regime of LE in response to changes in upstream runoff and sediment, which could benefit other estuaries facing similar influences.
Statements
Data availability statement
The original contributions presented in the study are included in the article/supplementary material. Further inquiries can be directed to the corresponding author/s.
Author contributions
KC: Conceptualization, Formal Analysis, Funding acquisition, Methodology, Software, Supervision, Validation, Visualization, Writing – original draft, Writing – review & editing, Data curation, Investigation, Project administration, Resources.
Funding
The author(s) declare that financial support was received for the research and/or publication of this article. This study is funded by the Natural Science Foundation of China (Grant No. 42201104) and China Postdoctoral Research Foundation (Grant No.2023M730758).
Acknowledgments
I acknowledge the Guangdong Provincial Department of Hydrology Bureau for providing hydrological data on runoff and sediment discharge for the upstream boundary input. I am grateful to the Editor and reviewers for their invaluable and constructive suggestions, which significantly enhanced the scientific quality of the original manuscript. Special thanks to Professor Jia Liangwen’s research team at the School of Marine Engineering and Technology, Sun Yat-sen University, for their essential contributions to this study.
Conflict of interest
The author declares that the research was conducted in the absence of any commercial or financial relationships that could be construed as a potential conflict of interest.
Generative AI statement
The author(s) declare that no Generative AI was used in the creation of this manuscript.
Publisher’s note
All claims expressed in this article are solely those of the authors and do not necessarily represent those of their affiliated organizations, or those of the publisher, the editors and the reviewers. Any product that may be evaluated in this article, or claim that may be made by its manufacturer, is not guaranteed or endorsed by the publisher.
References
1
Blott S. J. K. van der Wal P. D. Neal A. (2006). Long-term morphological change and its causes in the Mersey Estuary, NW England. Geomorphology81, 185–206. doi: 10.1016/j.geomorph.2006.04.008
2
Boudet L. Sabatier F. Radakovitch O. (2018). Modelling of sediment transport pattern in the mouth of the Rhone Delta: role of storm and flood events. Estuar. Coast Shelf Sci.198, 568582. doi: 10.1016/j.ecss.2016.10.00
3
Brocchini M. Calantoni J. Postacchini M. Sheremet A. Staples T. Smith J. et al . (2017). Comparison between the wintertime and summertime dynamics of the Misa River estuary. Mar. Geol.385, 27–40. doi: 10.1016/j.margeo.2016.12.005
4
Carlin J. A. Dellapenna T. M. (2014). Event-driven deltaic sedimentation on a lowgradient, low-energy shelf: the Brazos River subaqueous delta, northwestern Gulf of Mexico. Mar. Geol.353, 31–30. doi: 10.1016/j.margeo.2014.03.017
5
Chen K. L. (2021). Study on long-term morphological evolution and depocentres transfer mechanism of the Lingdingyang estuary (Guangzhou: Sun Yat-sen University), 37–44.
6
Chen K. L. Dong H. Y. Jia L. W. He Z. X. (2020b). Depocentre transfer in the Lingdingyang estuary: Interferences from natural and anthropogenic forcings. Ocean Coast. Manage.185, 1–15. doi: 10.1016/j.ocecoaman.2019.105064
7
Chen K. L. Gong J. Z. Chen X. Y. (2017). Spatial pattern and differentiation characteristics of urban heat island intensity in Guangzhou City. Chin. J. Ecol.36, 792–799. doi: 10.13292/j.1000-4890.201703.018
8
Chen K. L. He Z. X. Liu J. Lin Y. T. Jia L. W. (2022). Long-term morphological evolution and its mechanism of Lingdingyang Estuary: Interferences from anthropogenic forcings. Mar. Geol.450, 1–20. doi: 10.1016/j.margeo.2022.106856
9
Chen D. Li X. Saito Y. S. K. Liu J. P. Duan Y. Q. Liu S. A. et al . (2020a). Recent evolution of the Irrawaddy (Ayeyarwady) Delta and the impacts of anthropogenic activities: a review and remote sensing survey. Geomorphology365, 1–23. doi: 10.1016/j.geomorph.2020.107231
10
Chen K. L. Lin Y. T. Liu J. He Z. X. Jia L. W. (2024). Combined effects of massive reclamation and dredging on the variations in hydrodynamic and sediment transport in Lingdingyang Estuary, China. Front. Earth Sci.18, 127–147. doi: 10.1007/s11707-022-1050-x
11
Chu N. Y. Yao P. Ou S. Y. Wang H. Yang H. Yang Q. S. (2022). Response of tidal dynamics to successive land reclamation in the Lingding Bay over the last century. Coast. Eng.173, 1–15. doi: 10.1016/j.coastaleng.2022.104095
12
Dai Z. J. Liu J. T. Wen W. Chen J. Y. (2014). Detection of the three Gorges dam influence on the Changjiang (Yangtze River) submerged delta. Sci. Rep.4, 1–7. doi: 10.1038/srep06600
13
Devon O. E. Reide C. D. Walsh J. P. (2018). Shoreline erosion and decadal sediment accumulation in the TarPamlico estuary, North Carolina, USA: A source-to-sink analysis. Estuar. Coast. Shelf. Sci.202, 246–258. doi: 10.1016/j.ecss.2017.10.011
14
Dittmann S. Baring R. Baggalley S. Cantin A. Earl J. Gannon R. et al . (2015). Drought and flood effects on macrobenthic communities in the estuary of Australia’s largest river system. Estuar. Coast. Shelf. Sci.165, 36–51. doi: 10.1016/j.ecss.2015.08.023
15
Dong H. Y. Jia L. W. He Z. X. Yu M. D. Shi Y. H. (2020). Application of parameters and paradigms of the erosion and deposition for cohesive sediment transport modelling in the Lingdingyang Estuary, China. Appl. Ocean Res.94, 1–19. doi: 10.1016/j.apor.2019.101999
16
Fan Y. Y. (2016). The interaction machanism of tide and runoff and its influence on suspended sediment transportation in Yangtze Estuary (Wuhan: Wuhan University), 1–3.
17
Fu Y. T. Chen S. L. Ji H. Y. Fan Y. S. Li P. (2021). The modern Yellow River Delta in transition: Causes and implications. Mar. Geol.436, 1–14. doi: 10.1016/j.margeo.2021.106476
18
Gong W. P. Chen L. H. Chen Z. Y. Zhang H. (2019). Plume-to-plume interactions in the Pearl River Delta in winter. Ocean Coast. Manage.175, 110–126. doi: 10.1016/j.ocecoaman.2019.04.001
19
Hallegatte S. Green C. Nicholls R. J. Corfee-Morlot J. (2013). Future flood losses in major coastal cities. Nat. Clim. Change3, 802–806. doi: 10.1038/nclimate1979
20
He Z. X. Jia L. W. Jia Y. H. He J. W. (2020). Effects of flood events on sediment transport and deposition in the waterways of Lingding Bay, Pearl River Delta, China. Ocean Coast. Manage.185, 1–15. doi: 10.1016/j.ocecoaman.2019.105062
21
He J. W. Jia L. W. Wei X. G. Jia Y. H. Cheng C. (2017). The 2D distribution characteristics and formation mechanism of suspended sediment concentration during the flood season in the Lingdingyang Estuary. Haiyang Xuebao39, 26–39. doi: 10.3969/j.issn.0253-4193.2017.09.003
22
He Z. X. Liang M. E. Jia L. W. Dong H. Y. Chen K. L. Liu J. et al . (2022). Long-term morphological modeling and implication for estuarine regulation of the Modaomen Estuary, Pearl River Delta, China. Appl. Ocean Res.123, 1–14. doi: 10.1016/j.apor.2022.103184
23
He Y. Liu X. J. Duan Z. H. Liu C. Hou P. Lu C. et al . (2022). Long-term morphodynamic evolution in the Modaomen Estuary of the Pearl River Delta, South China. Geomorphology398, 1–15. doi: 10.1016/j.geomorph.2021.108057
24
Hu Z. van der Wal D. Cai H. Y. van Belzen J. Bouma T. J. (2018). Dynamic equilibrium behaviour observed on two contrasting tidal flats from daily monitoring of bed-level changes. Geomorphology311, 114–126. doi: 10.1016/j.geomorph.2018.03.025
25
Ji H. Y. (2021). Morphological variability of the Yellow River Delta and its dynamic mechanism under the new regime of river delivery (Shanghai: East China Normal University), 4–6.
26
Leonardi N. Canestrelli A. Sun T. Fagherazzi S. (2013). Effect of tides on mouth bar morphology and hydrodynamics. J. Geophys. Res. Oceans118, 4169–4183. doi: 10.1002/jgrc.20302
27
Li T. J. (2017). Analysis of Lingding Bay Landform Stage Evolution and trends (Wuhan: China University of Geoscience), 84–85.
28
Liu W. Carling P. A. Hu K. Wang H. Zhou Z. Zhou L. et al . (2019a). Outburst floods in China: a review. Earth Sci. Rev.197, 102895. doi: 10.1016/j.earscirev.2019.102895
29
Liu X. L. Deng R. R. Xu J. H. Gong Q. H. (2017). Spatiotemporal evolution characteristics of coastlines and driving ForceAnalysis of the Pearl River estuary in the past 40 Years. J. Geo Inf. Sci.19, 1336–1345.
30
Liu X. J. Min F. Y. Kettner A. J. (2019b). The impact of large to extreme flood events on floodplain evolution of the middle and lower reaches of the Yangtze River, China. CATENA176, 394–409. doi: 10.1016/j.catena.2019.01.027
31
Liu J. Lin Y. T. He Z. X. Liu F. Jia L. W. Wei W. (2023). Flood-driven jet flow and sedimentary regime in a river-dominated estuary. Front. Mar. Sci.10, 1186371. doi: 10.3389/fmars.2023.1186371
32
Luo J. (2010). Study on morphological evolution and genesis of Huangmaohai bay in ten-year to centennial scales (Guangzhou: Sun Yat-sen University).
33
Maillet G. M. Vella C. Berné S. Friend P. L. Amos C. L. Fleury T. J. et al . (2006). Morphological changes and sedimentary processes induced by the December 2003 flood event at the present mouth of the Grand Rhône River (southern France). Mar. Geol.234, 159–177. doi: 10.1016/j.margeo.2006.09.025
34
Mei X. F. Dai Z. J. Wei W. Li W. H. Wang J. Sheng H. (2018). Secular bathymetric variations of the north channel in the Changjiang (Yangtze) estuary, China 1880-2013: causes and effects. Geomorphology303, 30–40. doi: 10.1016/j.geomorph.2017.11.014
35
Pritchard D. W. (1967). “What is an estuary: physical viewpoint,” in Estuaries. Ed. LanffG. H. (AAAS Pub.83, Washington, D.C.), 3–5.
36
Rickenmann D. Badoux A. Hunzinger L. (2016). Significance of sediment transport processes during piedmont floods: the 2005 flood events in Switzerland. Earth Surf Process Landforms41, 224–230. doi: 10.1002/esp.3835
37
Shi Z. (2001). Studies on hydrodynamic processes, (1979-1999) in the Changejiang River Estuary. Mar. Sci.25, 54–57. doi: CNKI:SUN:HYKX.0.2001-06-017
38
Stanley D. J. (1996). Nile delta: extreme case of sediment entrapment on a delta plain and consequent coastal land loss. Mar. Geol.129, 189–195. doi: 10.1016/0025-3227(96)83344-5
39
Sun H. Su F. G. (2020). Evaluation of multiple precipitation datasets and their potential utilities in hydrologic modeling over the Yarlung Zangbo River Basin. Prog. Geogr.39, 1126–1139. doi: 10.18306/dlkxjz.2020.07.006
40
Tornqvist T. E. Bick S. J. van der Brog K. de Jong A. F. M. (2006). How stable is the Mississippi delta? Geology34, 697–700. doi: 10.1130/G22624.1
41
Tu T. B. Carr K. J. Ercan A. Trinh T. Kavvas M. L. Nosacka J. (2017). Assessment of the effects of multiple extreme floods on flow and transport processes under competing flood protection and environmental management strategies. Sci. Total Environ.607–608, 613–622. doi: 10.1016/j.scitotenv.2017.06.271
42
Wang B. (2011). Salt intrusion in the Pearl River Estuary (Shanghai: East China Normal University), 123–126.
43
Wang Y. H. Cai S. L. Yang Y. D. Zhong Z. Y. Liu F. (2021). Morphological consequences of upstream water and sediment changes and estuarine engineering activities in Pearl River Estuary channels over the last 50 years. Sci. Total Environ.765, 1–16. doi: 10.1016/j.scitotenv.2020.144172
44
Watanabe M. (2007). Simulation of temperature, salinity and suspended matter distributions induced by the discharge into the East China Sea during the 1998 flood of the Yangtze River. Estuar. Coast. Shelf. Sci.71, 81–97. doi: 10.1016/j.ecss.2006.08.019
45
Wu P. F. (2010). Study on urban heat island and its influence in Beijing city base on TM images (Beijing: Beijing Forestry University), 21–23.
46
Wu Z. Y. Milliman J. D. Zhao D. N. Cao Z. Y. Zhou J. Q. Zhou C. Y. (2018). Geomorphologic changes in the lower Pearl River Delta 1850-2015, largely due to human activity. Geomorphology314, 42–54. doi: 10.1016/j.geomorph.2018.05.001
47
Wu Z. Milliman J. D. Zhao D. Zhou J. Yao C. (2014). Recent geomorphic change in LingDing bay, China, in response to economic and urban growth on the Pearl River delta, southern China. Global Planet. Change123, 1–12. doi: 10.1016/j.gloplacha.2014.10.009
48
Wu Z. Y. Saito Y. S. K. Zhao D. N. Zhou J. Q. Cao Z. Y. Li S. J. et al . (2016). Impact of human activities on subaqueous topographic change in Lingding Bay of the Pearl River estuary, China, during 1955–2013. Sci. Rep.6, 1–10. doi: 10.1038/srep37742
49
Wu W. T. Yang Z. Q. Zhang X. J. Zhou Y. X. Tian B. Tang Q. H. (2021). Integrated modeling analysis of estuarine responses to extreme hydrological events and sea-level rise. Estuar. Coast. Shelf. Sci.261, 1–13. doi: 10.1016/j.ecss.2021.107555
50
Wu H. Zhu J. R. Chen B. R. Chen Y. Z. (2006). Quantitative relationship of runoff and tide to saltwater spilling over from the North Branch in the Changjiang Estuary: A numerical study. Estuar. Coast. Shelf. Sci.69, 125–132. doi: 10.1016/j.ecss.2006.04.009
51
Xiao Z. J. (2012). Characteristics and transport trend of surface sediments in Pearl River Estuary and the adjacent sea area (in Chinese). Mar. Sci. Bull.31, 481–488. doi: 10.11840/j.issn.1001-6392.2012.5.001
52
Xie D. F. Pan C. H. Wu X. G. Gao S. Wang Z. B. (2017). Local human activities overwhelm decreased sediment supply from the Changjiang River: Continued rapid accumulation in the Hangzhou Bay-Qiantang Estuary system. Mar. Geol.392, 66–77. doi: 10.1016/j.margeo.2017.08.013
53
Xie D. F. Wang Z. B. (2021). Seasonal tidal dynamics in the Qiantang Estuary: the importance of morphological evolution. Front. Earth Sci.9, 782640. doi: 10.3389/feart.2021.782640
54
Xie D. F. Wang Z. B. Huang J. B. Zeng J. (2022). River, tide and morphology interaction in a macro-tidal estuary with active morphological evolutions. Catena212, 106131. doi: 10.1016/j.catena.2022.106131
55
Xu T. (2014). Numerical study of suspended sediment transport and diffusion of Dagu River estuary coupling with Runoff and tidal current Vol. 2015 (Qingdao: Ocean University of China).
56
Yang L. Z. Liu F. Gong W. P. Cai H. Y. Yu F. H. Pan H. Z. (2019). Morphological response of Lingding Bay in the Pearl River Estuary to human intervention in recent decades. Ocean Coast. Manage.176, 1–10. doi: 10.1016/j.ocecoaman.2019.04.011
57
Yin Y. Jiang L. F. Zhang Z. X. Yu H. B. Wang H. L. (2017). Statistical analysis of wave characteristics in the Pearl River Estuary (in Chinese). J. Trop. Oceanogr.36, 60–66. doi: 10.11978/2016099
58
Ying Q. He J. Xin W. J. (2019). Influence of giant artificial sand pits on the natural evolution of Lingding Bay. Adv. Water Sci.30, 915–922. doi: 10.14042/j.cnki.32.1309.2019.06.016
59
Yu F. H. Ding X. Y. Yu S. C. Yang L. Z. Xu F. D. (2010). Remote sensing monitoring and analysis of suspended sediment distribution and sand mining impact in Lingdingyang Bay. Chin. Conf., 105–110.
60
Yuan L. R. Yang Q. S. Xie L. L. Cui X. (2013). Geomorphological evolution trend of the Lingdingyang Estuary under human disturbance. In: Proceedings of the Sixteenth (16th) Chinese Ocean and Coastal Engineering Symposium (Vol. II). Guangzhou: Institute of Estuarine and Coastal Research, School of Marine Sciences, Sun Yat-sen University; 447–452.
61
Zhang W. Y. Cui Y. S. Santos A. I. Hanebuth T. J. J. Till J. J. (2016). Storm-driven bottom sediment transport on a high-energy narrow shelf (NW Iberia) and development of mud depocenters. J. Geophys. Res.: Oceans121, 5751–5772. doi: 10.1002/2015JC011526
62
Zhang W. Ruan X. Zheng J. Zhu Y. Wu H. (2010). Long-term change in tidal dynamics and its cause in the Pearl River Delta, China. Geomorphology120, 209–223. doi: 10.1016/j.geomorph.2010.03.031
63
Zhao H. T. (1981). Bottom relief of lingdingyang in the Zhujiang River Estuary. Acta Oceanol. Sin.3, 255–274. doi: CNKI:SUN:SEAC.0.1981-02-006
64
Zhao L. H. Xin P. Cheng H. F. Chu A. (2022). Combined effects of river discharge regulation and estuarine morphological evolution on salinity dynamics in Yangtze Estuary, China. Estuar. Coast. Shelf. Sci.276, 1–12. doi: 10.1016/j.ecss.2022.108002
65
Zheng S. Guan W. B. Cai S. Q. Wei X. Huang D. J. (2014). A model study of the effects of river discharges and interannual variation of winds on the plume front in winter in Pearl River Estuary. Continent. Shelf. Res.73, 31–40. doi: 10.1016/j.csr.2013.11.019
66
Zhu L. He Q. Shen J. Wang Y. (2016). The influence of human activities on morphodynamics and alteration of sediment source and sink in the Changjiang Estuary. Geomorphology273, 52–62. doi: 10.1016/j.geomorph.2016.07.025
67
Zou H. Z. (2010). A river network-estuary coupled numrical modeling system and its applocation on Pearl River Estuary (Qingdao: Ocean University of China), 94–96.
Summary
Keywords
variations in upstream runoff, geomorphic response, shift of deposition regime, influence mechanism, Lingdingtang estuary
Citation
Chen K (2025) The response of sedimentation regime to changes in upstream runoff, based on modelling scenarios analysis in Lingdingyang Estuary, China. Front. Mar. Sci. 12:1553631. doi: 10.3389/fmars.2025.1553631
Received
31 December 2024
Accepted
15 July 2025
Published
04 August 2025
Volume
12 - 2025
Edited by
Nicholas Dodd, University of Nottingham, United Kingdom
Reviewed by
Dongfeng Xie, Zhejiang Institute of Hydraulics & Estuary, China
Wenhong Pang, Beibu Gulf University, China
Shuwei Zheng, Shandong Normal University, China
Updates
Copyright
© 2025 Chen.
This is an open-access article distributed under the terms of the Creative Commons Attribution License (CC BY). The use, distribution or reproduction in other forums is permitted, provided the original author(s) and the copyright owner(s) are credited and that the original publication in this journal is cited, in accordance with accepted academic practice. No use, distribution or reproduction is permitted which does not comply with these terms.
*Correspondence: Kanglin Chen, chenkanglin68@163.com
Disclaimer
All claims expressed in this article are solely those of the authors and do not necessarily represent those of their affiliated organizations, or those of the publisher, the editors and the reviewers. Any product that may be evaluated in this article or claim that may be made by its manufacturer is not guaranteed or endorsed by the publisher.