Abstract
The South Shetland Islands, a critical area for primary productivity within the Southern Ocean, are significantly affected by global climate change. Seabirds and marine mammals, highly sensitive to ecological changes, are considered sentinel species within the ecosystem. Monitoring top predators and identifying Areas of Ecological Significance (AES) are essential for enhancing biodiversity conservation effectiveness and addressing future climate changes. This study employed the MaxEnt model and Zonation method to predict the distribution of suitable habitats and AES for 14 top predators in the South Shetland Islands under current and future climate scenarios. Key findings include: 1) The spatial distribution of top predators in the South Shetland Islands is predominantly influenced by bathymetry, mixed layer thickness (Mlotst), and sea ice concentration (SIC). 2) The highly suitable habitats for the Gentoo Penguin (Pygoscelis papua), Humpback Whale (Megaptera novaeangliae), and Light-mantled Albatross (Phoebetria palpebrata) are expected to decrease under various future scenarios. 3) The AES in the South Shetland Islands are predominantly concentrated along the southern coastal areas. 4) The AES on the western side of the islands are projected to undergo significant fluctuations, while those on the eastern side are likely to exhibit minor changes, with the central area remaining relatively stable.
1 Introduction
The Southern Ocean is a key region for global oceanic carbon cycling and climate regulation. Its unique biogeographical characteristics and significant environmental diversity render it of utmost importance for global climate change (Convey et al., 2014; Huguenin et al., 2022). Seabirds and marine mammals, as top predators within the Southern Ocean, exhibit high visibility, acute sensitivity, and rapid responses to ecosystem changes. These attributes enable them to act as indicators or respond to shifts in ecosystem structure and function that are often challenging to observe directly. Therefore, they are frequently regarded as sentinel species. Monitoring these sentinel species is essential for advancing ecological research and guiding conservation efforts (Bestley et al., 2020; Boersma, 2008; Hazen et al., 2019). Given the variability of marine and terrestrial environments across regions, the responses of identical species to environmental changes differ by locality. Thus, understanding how top predators react to local environmental changes is vital (Ainley et al., 2010, 2005; Constable et al., 2014).
Utilizing survey data on top predators to identify biodiversity hotspots and priority conservation zones in the Southern Ocean is key to optimizing conservation efficiency (Epele et al., 2021; Tan et al., 2023). Areas frequently utilized by top predators within the Southern Ocean are termed Areas of Ecological Significance (AES), characterized by high biomass of lower trophic levels and elevated biodiversity. Accurate identification of AES is fundamental for marine spatial planning, biodiversity conservation, and addressing environmental challenges, such as climate change (Handley et al., 2021, 2020; Johnson et al., 2019).
Species distribution models (SDMs) integrate species distribution with environmental variables to determine species’ ecological requirements and predict potential habitats (Phillips et al., 2006). The MaxEnt model applies the principle of maximum entropy with machine learning techniques, utilizing presence-only data and various environmental variables to predict species’ potential distributions across specific temporal and spatial contexts. Notably, MaxEnt provides high predictive accuracy even with limited distribution points, restricted distribution areas, or narrow environmental adaptability (Khadka and James, 2017). Recent studies have also indicated that MaxEnt models can capture authentic effects of environmental variables on species distribution shifts, though such effects tend to be relatively small (Venne and Currie, 2021). In recent years, this method has been extensively applied in marine research (Lin et al., 2022).
The South Shetland Islands, located in the Atlantic sector of the Southern Ocean, are known for high biomass and productivity, making them a focal point for Antarctic marine biological research. This area is also a significant fishing ground for Antarctic krill (Kawaguchi and Nicol, 2020) and one of the most profoundly impacted regions by global climate change (Turner and Overland, 2009).
Current research on top predators distributions in the South Shetland Islands and surrounding waters primarily focus on individual species (Dias et al., 2018; Gil-Delgado et al., 2013; Lumpe and Weidinger, 2000; Trivelpiece et al., 2007; Viquerat et al., 2022), with limited research addressing AES based on multiple species. To strengthen conservation measures and understand the impacts of climate change on the ecosystems of the South Shetland Islands and adjacent waters, it is critical to conduct in-depth studies on top predator distributions and the potential effects of future climate scenarios on their distribution.
This study employed the MaxEnt model to assess habitat suitability for top predators within the South Shetland Islands and surrounding waters, identifying key environmental factors that influence their distributions. Additionally, the Zonation method was applied to determine priority ecological areas. Using data from the Coupled Model Intercomparison Project Phase 6 (CMIP6), the study further evaluated the potential impacts of future climate change on top predators habitats and Areas of Ecological Significance.
2 Materials and methods
2.1 Study area
The South Shetland Islands, located in the northwestern part of the Antarctic Peninsula, were selected as the study area. The geographical coordinates were defined as: longitude: -63° to -57° and latitude: -64° to -61.5°, as illustrated in Figure 1.
Figure 1
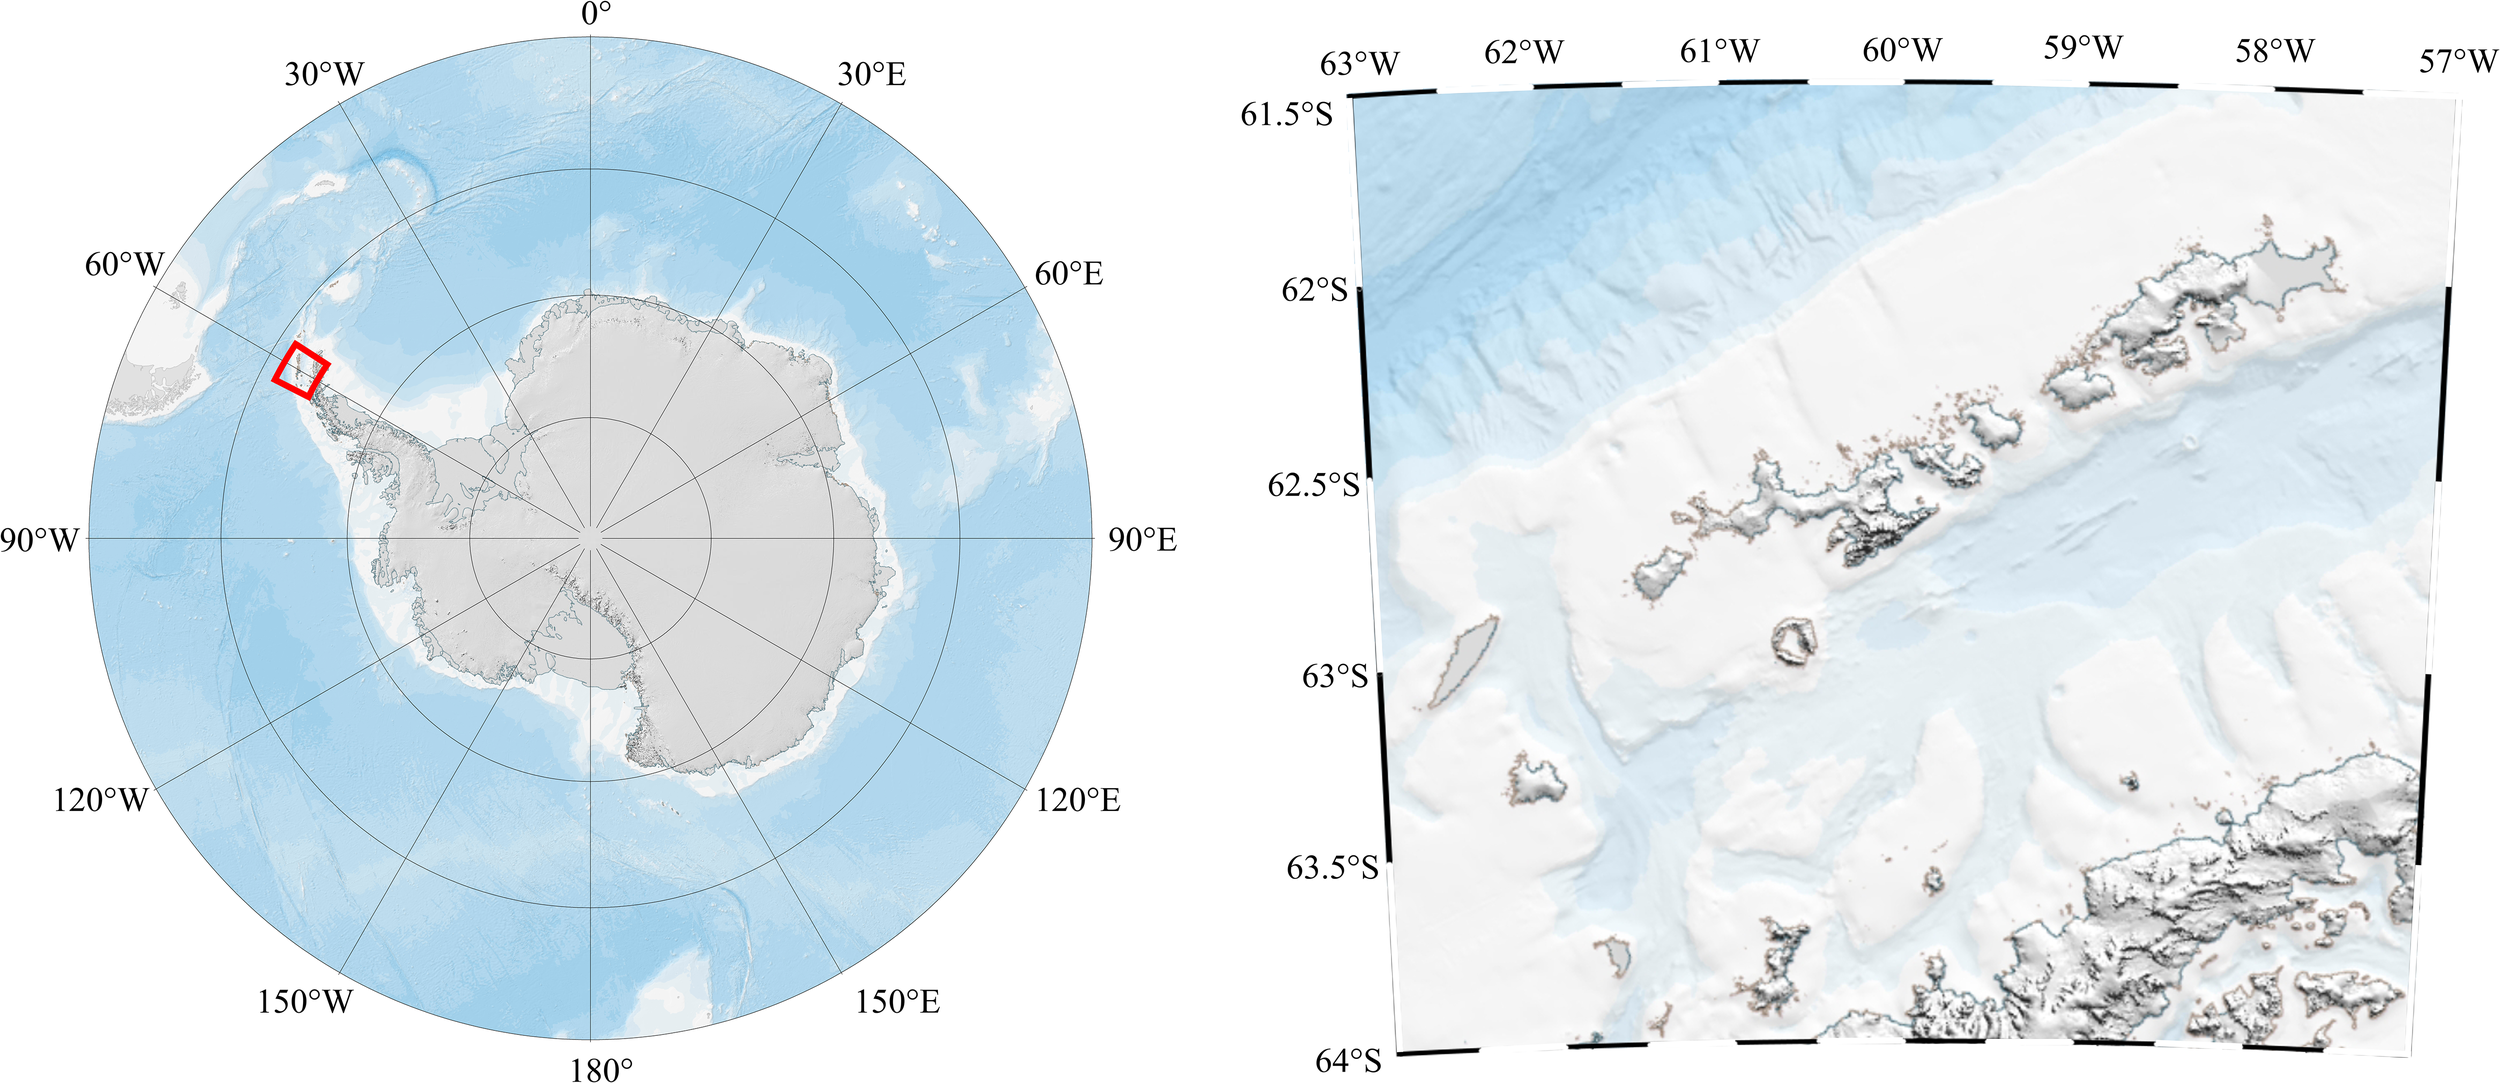
Location of study area.
2.2 Species data
We initially utilized survey data on Weddell seals, Antarctic fur seals, and leopard seals, collected during the 36th Chinese Antarctic Expedition along the coast of Fildes Peninsula on King George Island (December 2019 to February 2020). Additionally, during the 38th Chinese Antarctic Scientific Expedition, transect observations were conducted around King George Island, resulting in a comprehensive seabird species list (From January 1 to 8, 2022.). Based on these surveys, we retrieved seabird and marine mammal distribution data within the study area from the Global Biodiversity Information Facility (GBIF, https://www.gbif.org/), constrained to the summer months of December, January, February, and March from 2014 to 2024. Only human-observed data were included, excluding erroneous or uncertain records, and each unique coordinate and date was limited to one record. To mitigate spatial autocorrelation, one of any two data points within 0.1° was randomly removed for each species. In total, species distribution modeling was conducted for 14 target species.
2.3 Current and future environmental variables
Monthly averaged data for sea ice thickness, sea ice concentration, sea surface salinity, sea surface temperature, sea surface height, mixed layer thickness, northward sea water velocity, and eastward sea water velocity were obtained from Copernicus’ Global Ocean Physics Reanalysis (GLORYS12V1) (https://copernicus.eu/), with a resolution of 0.083°. Monthly averaged chlorophyll concentration data, with a resolution of 4 km (measured in mg/m³), were sourced from NASA Ocean Color’s Aqua MODIS. Bathymetric data were retrieved from the GEBCO (https://www.gebco.net/) at a resolution of 15 arc-seconds, measured in meters, from which slope data were also derived. All environmental variables were resampled to a 1 km resolution to align with the temporal scale of the species data. Pearson correlation analysis was conducted in R, to reduce multicollinearity among environmental variables, retaining the variable with higher significance when the Pearson correlation coefficient between two variables exceeded 0.8. Ultimately, nine environmental variables were selected for analysis (Table 1).
Table 1
| Code | Statistics | Name | Unit |
|---|---|---|---|
| Slope | Mean | Slope | ° |
| Chl-a | Mean | Chlorophyll-a | mg/m3 |
| SIC | Mean | Sea ice concentration | |
| SO | Mean | Sea water salinity | psu |
| SST | Mean | Sea surface temperature | °C |
| Mlotst | Mean | Mixed layer thickness | m |
| UO | Mean | Eastward sea water velocity | m/s |
| VO | Mean | Northward sea water velocity | m/s |
| Bathymetry | Mean | Bathymetry | m |
Environmental variables.
To evaluate the potential future distribution of top predators in the South Shetland Islands and surrounding waters, we utilized three Shared Socioeconomic Pathways (SSPs) from the CMIP6 database: SSP1-2.6, SSP2-4.5, and SSP5-8.5, corresponding to global radiative forcing levels stabilizing at 2.6 W/m², 4.5 W/m², and 8.5 W/m² by 2100, respectively (Riahi et al., 2017).
Environmental variable data under both historical and future scenarios were obtained from the high-resolution global coupled climate model MPI-ESM1-2-HR, provided by the German Climate Computing Center. Historical data encompassed the period from 1993 to 2014, while future data corresponded to the years 2029 to 2050 and 2079 to 2100 across three SSP scenarios. Initially, differences in environmental variables future SSP scenarios and historical data were calculate, to identify potential changes under future climate conditions. Bilinear interpolation was then applied to resample these calculated differences, ensuring consistency in spatial resolution with the current environmental variables. Finally, by integrating these resampled change values with existing environmental variables, a comprehensive dataset was created to predict future environmental conditions (Tabor and Williams, 2010).
2.4 Model parameters
This study employed the Maxent model to evaluate the potential habitat distribution of top predators. We used 75% of the data as the training set, with the remaining 25% for validation. The model executed 500 iterations and was run 10 times using the Bootstrap method. The contribution of each environmental variable was evaluated using a jackknife test. Based on the Maxent model output, habitat suitability was categorized into four levels: unsuitable (values below 0.4), moderately suitable (values between 0.4 and 0.6), moderately suitable (values between 0.6 and 0.8), and highly suitable (values 0.8 and above). Model performance was assessed using the area under the receiver operating characteristic curve (AUC), where a higher AUC values indicate greater predictive accuracy and robustness (Gonzalez et al., 2011).
The species richness index was used to identify potential priority areas within the South Shetland Islands and surrounding waters. A threshold maximizing training sensitivity and specificity was applied to model predictions for each species, with values above this threshold to 1 (predicted presence) and those below set to 0 (predicted absence). Summing these presence (1) and absence (0) values for all species at each pixel allowed for calculation of the species richness index for each pixel (Ballard et al., 2012; Wiens et al., 2009).
Zonation5 software were used to identify important ecological areas. Zonation is a tool that prioritizes ecological conservation by maximizing biodiversity value across spatial units, preserving adjusted feature richness. This software creates a comprehensive prioritization sequence by iteratively removing spatial units with minimal biodiversity impact and reordering the remaining areas, thereby producing a prioritized map for biodiversity conservation (Lehtomäki and Moilanen, 2013; Moilanen et al., 2022; Tan et al., 2023). In this study, the CAZ1 marginal loss rule was selected to calculate feature richness curves and formulating spatial conservation priority maps. This rule is designed to optimize average coverage across all features, ensuring comprehensive protection of biodiversity and ecosystem services (Moilanen et al., 2022). This study emphasized regions of high conservation value, identified by the top 1% and 5% distribution thresholds, which correspond to 99% and 95% protection levels, respectively (Krüger et al., 2017; Pereira et al., 2018).
3 Result
3.1 Current results
3.1.1 MaxEnt modeling results for top predators
The accuracy of the MaxEnt model and the contribution of all environmental variables are presented in Table 2. ROC analysis indicated that the AUC values for each top predator in the study area exceed 0.8, with standard deviations below 0.056 and an average AUC value of 0.859. Among the species, the Chinstrap Penguin (Pygoscelis antarcticus) had the lowest AUC value at 0.800, while the Leopard Seal (Hydrurga leptonyx) showed the highest at 0.930. These results demonstrated that the MaxEnt model had high predictive accuracy and reliability, establishing a robust foundation for further analysis. Overall, bathymetry, mixed layer thickness, and sea ice concentration emerged as the primary environmental variables influencing species distribution.
Table 2
| Species | AUC | Bathymetry | Chl-a | Mlotst | SIC | SSH | Slope | UO | VO | SST |
|---|---|---|---|---|---|---|---|---|---|---|
| Antarctic Fur Seal | 0.832 ± 0.056 | 11.4142 | 0.7374 | 0.9433 | 23.1427 | 0.0086 | 5.6207 | 26.5573 | 19.4587 | 12.1169 |
| Blue Petrel | 0.907 ± 0.024 | 1.2234 | 14.9799 | 29.7484 | 4.5066 | 23.184 | 16.7514 | 5.3843 | 3.7001 | 0.5218 |
| Leopard Seal | 0.930 ± 0.029 | 33.1871 | 9.3342 | 14.4897 | 11.4283 | 1.2524 | 3.8997 | 7.2631 | 5.6434 | 13.5019 |
| Weddell Seal | 0.924 ± 0.032 | 22.0163 | 14.9358 | 13.8502 | 10.2476 | 2.095 | 22.2024 | 6.4872 | 3.2262 | 4.9393 |
| Northern Giant Petrel | 0.830 ± 0.020 | 1.0024 | 10.5799 | 25.7344 | 12.401 | 27.7569 | 8.1285 | 7.7762 | 5.1917 | 1.429 |
| Humpback Whale | 0.807 ± 0.012 | 18.79 | 2.8488 | 40.2577 | 11.4007 | 1.8768 | 5.6861 | 7.3766 | 3.5211 | 8.2422 |
| Antarctic Prion | 0.880 ± 0.022 | 2.5404 | 9.6496 | 41.5827 | 12.1308 | 5.563 | 5.8088 | 16.7574 | 5.4391 | 0.5282 |
| Snow Petrel | 0.897 ± 0.032 | 7.3103 | 10.3122 | 29.0114 | 9.7691 | 4.3039 | 12.7142 | 3.338 | 12.3085 | 10.9324 |
| Light-mantled Albatross | 0.833 ± 0.029 | 7.045 | 2.3382 | 32.4322 | 12.7498 | 14.0394 | 14.9289 | 7.1531 | 5.5238 | 3.7896 |
| White-chinned Petrel | 0.822 ± 0.017 | 5.9546 | 1.4313 | 33.0414 | 14.3801 | 12.8456 | 3.9044 | 16.5559 | 4.3761 | 7.5106 |
| Adélie Penguin | 0.882 ± 0.033 | 14.934 | 14.2255 | 30.1465 | 6.4169 | 11.9192 | 9.6201 | 8.3524 | 2.9536 | 1.4318 |
| Chinstrap Penguin | 0.800 ± 0.014 | 20.7162 | 3.1367 | 30.5251 | 16.5482 | 12.5907 | 5.2543 | 4.3192 | 4.3806 | 2.529 |
| Gentoo Penguin | 0.853 ± 0.012 | 0.4248 | 3.9822 | 60.4723 | 13.1494 | 4.0617 | 6.8666 | 7.0075 | 2.224 | 1.8116 |
| Antarctic Petrel | 0.824 ± 0.041 | 20.0284 | 19.2013 | 10.1052 | 12.8483 | 6.4267 | 10.4696 | 4.6274 | 7.2129 | 9.0802 |
MaxEnt performance (mean AUC ± standard deviation for 10 bootstrapped runs) and contribution of each variable.
The contribution of each variable to the species distribution model is expressed as a percentage, where higher values reflect a greater contribution. The top three contributing variables are highlighted in bold.
The potential suitable areas of top predators are shown in Figure 2. MaxEnt modeling results revealed four distinct habitat distribution patterns for top predators in the South Shetland Islands and surrounding waters: 1. Predominantly distributed in the northern waters of the South Shetland Islands; 2. Primarily concentrated in the Bransfield Strait to the south of the islands; 3. Primarily concentrated near coastal areas; 4. Widespread distribution. Species predominantly found in the northern waters included the Antarctic Prion (Pachyptila desolata), Blue Petrel (Halobaena caerulea), Light-mantled Albatross (Phoebetria palpebrata), Northern Giant Petrel (Macronectes halli), and White-chinned Petrel (Procellaria aequinoctialis) (Figures 2D, E, J, K, N). Those mainly distributed within the Bransfield Strait were the Chinstrap Penguin (Pygoscelis antarcticus) and Humpback Whale (Megaptera novaeangliae) (Figures 2F, H). Species found predominantly near the coast included the Adélie Penguin (Pygoscelis adeliae), Gentoo Penguin (Pygoscelis papua), Leopard Seal (Hydrurga leptonyx), Snow Petrel (Pagodroma nivea), and Weddell Seal (Leptonychotes weddellii) (Figures 2A, G, I, L, M). Species with widespread distributions included the Antarctic Fur Seal (Arctocephalus gazella) and Antarctic Petrel (Thalassoica antarctica) (Figures 2B, C). Among all top predators, the Antarctic Fur Seal had the largest total habitat area, approximately 39,625.11 km² (Figures 2B, 3), while the Northern Giant Petrel (Macronectes halli) had the smallest habitat area, approximately 7,622.94 km² (Figures 2K, 3). The Light-mantled Albatross (Phoebetria palpebrata) had the largest area of highly suitable habitat, approximately 4,434.49 km² (Figures 2J, 3), whereas the Antarctic Petrel (Thalassoica antarctica) had the smallest highly suitable habitat, about 386.10 km² (Figures 2C, 3).
Figure 2
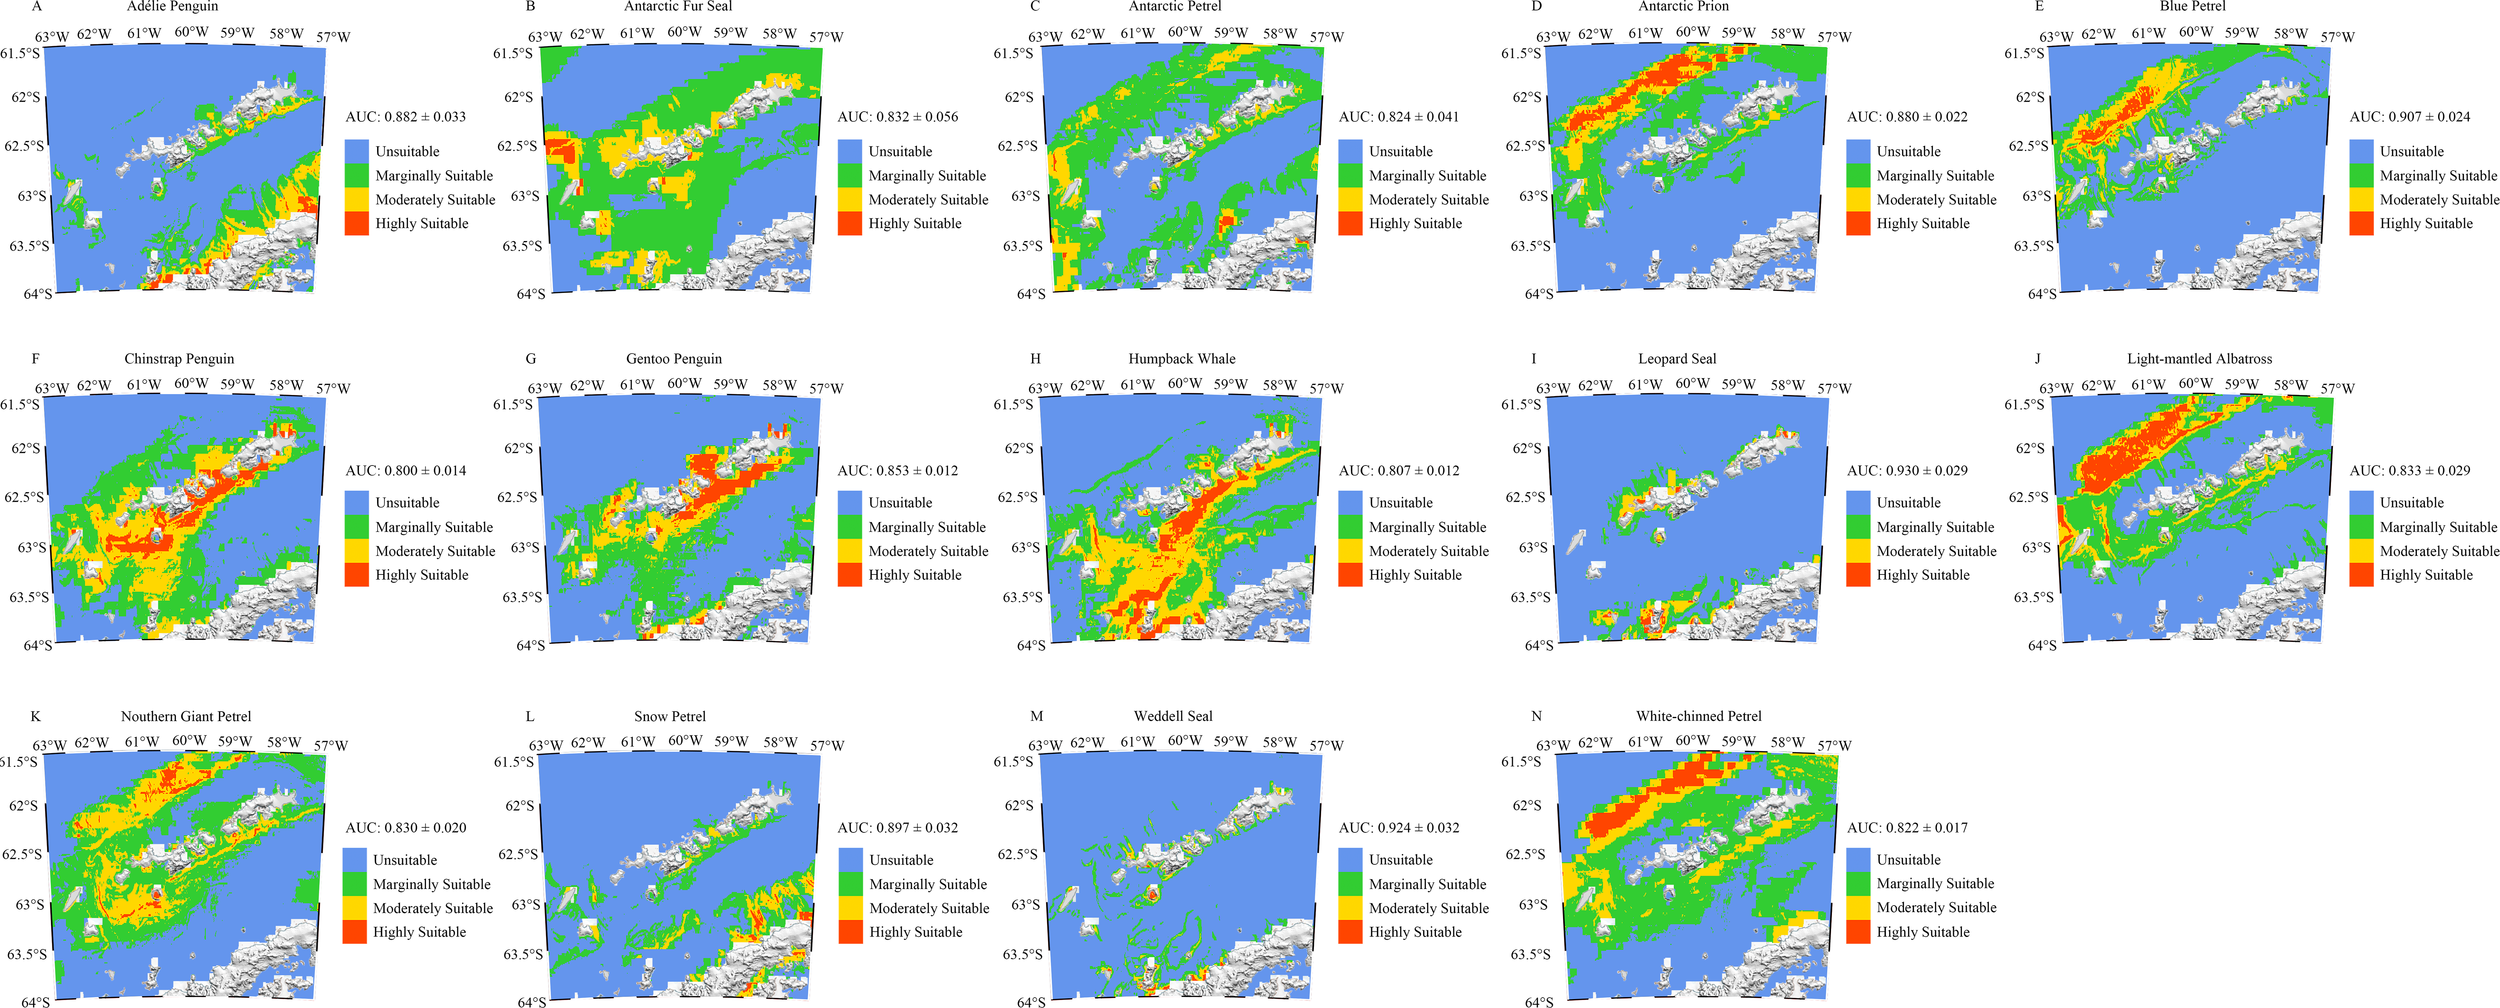
(A–N) Potential suitable areas for top predators in the South Shetland Islands. Blue represents unsuitable areas, green represents marginally suitable habitats, yellow represents moderately suitable habitats, and red represents highly suitable habitats.
Figure 3
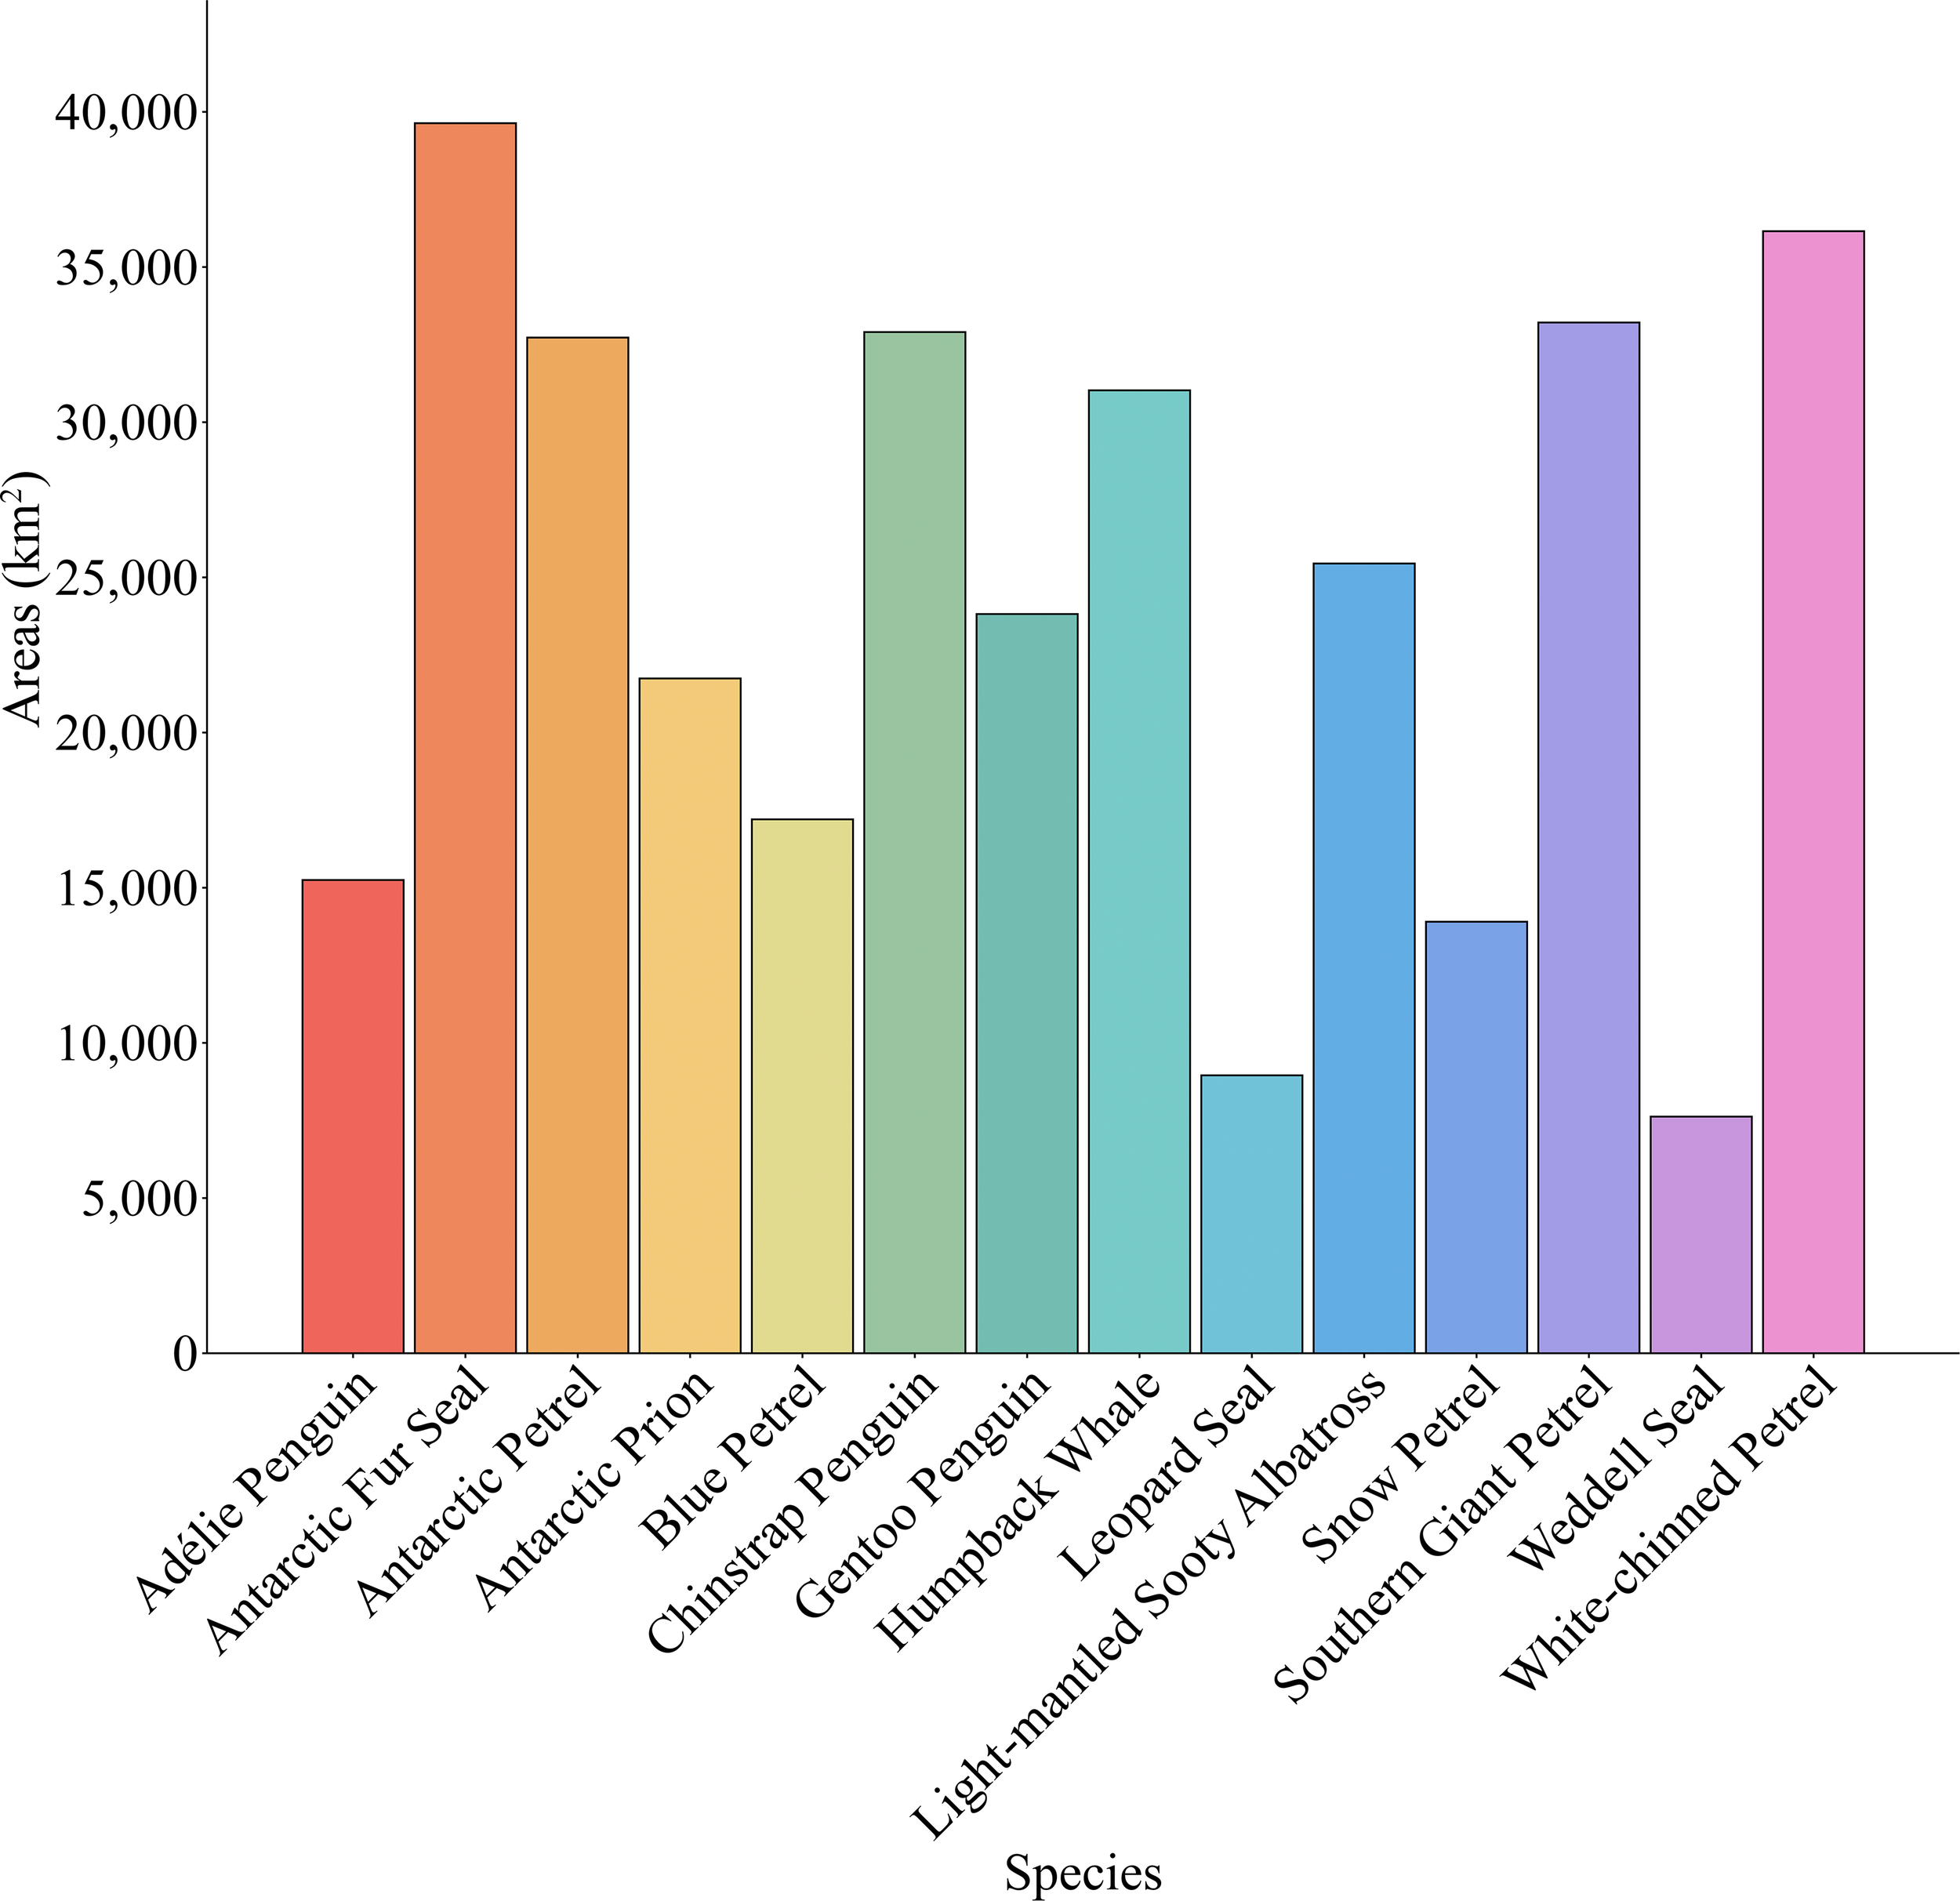
Overall habitat areas for top predators in the South Shetland Islands.
3.1.2 Species richness
The modeled distribution of the species richness index across the South Shetland Islands is illustrated in Figure 4. Overall, regions with high species richness were concentrated along the southern coastal areas of the South Shetland Islands, as well as around Smith Island and Low Island on the western side. In contrast, extensive low-density areas were evident in the northwestern part of the study area and along the eastern side of the Bransfield Strait, indicating that these regions were less frequented by top predators.
Figure 4
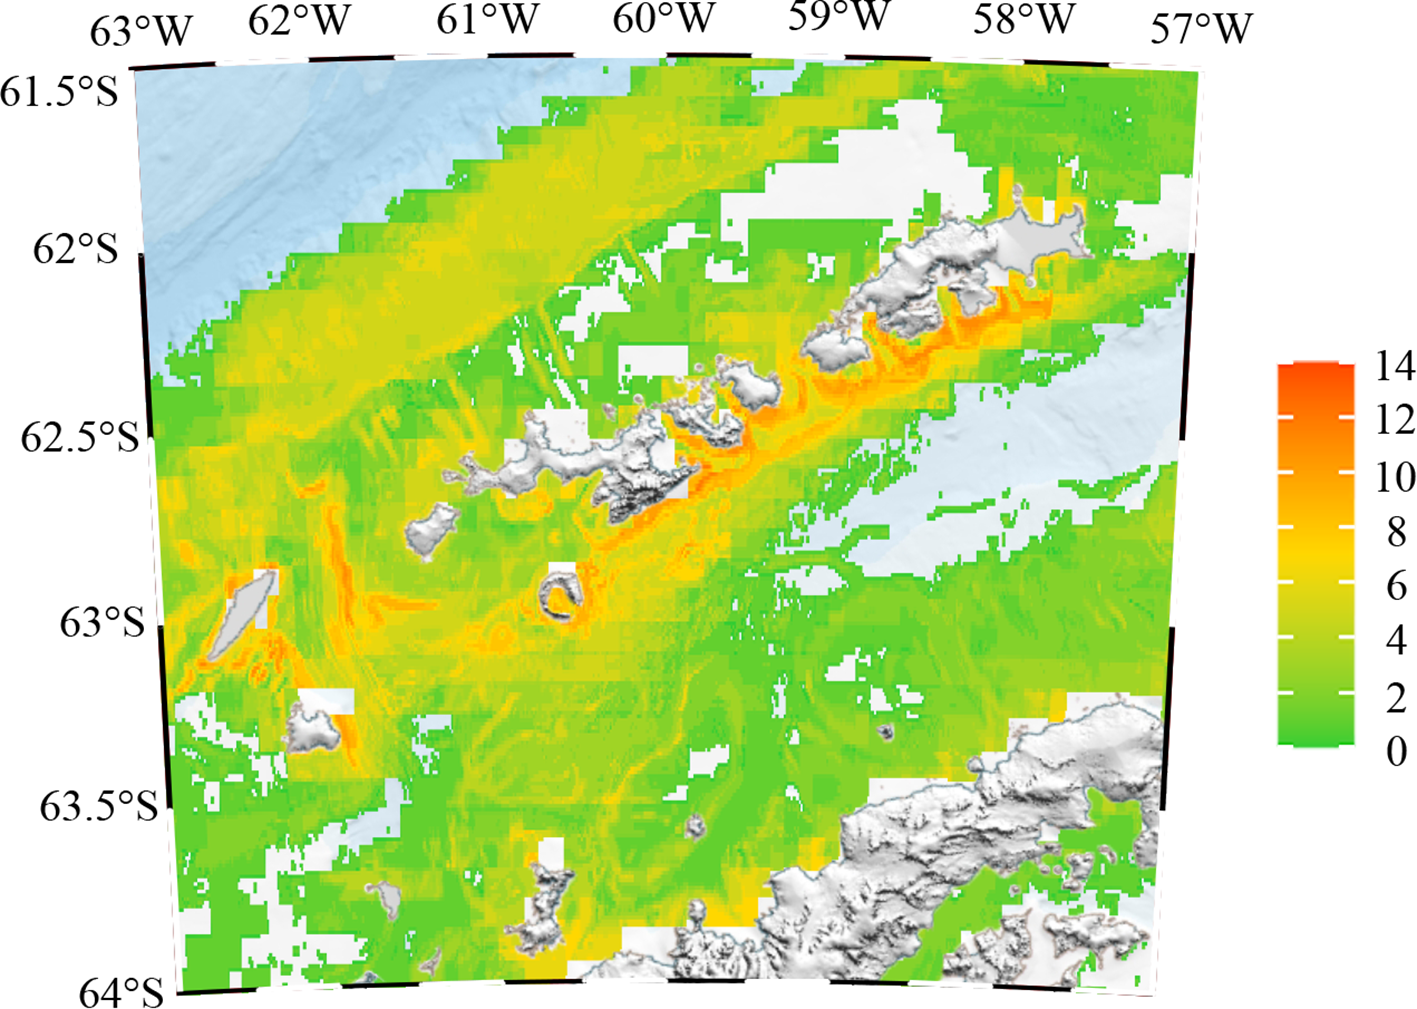
Modeled species richness of top predators in the South Shetland Islands.
3.1.3 Location of Areas of Ecological Significance (AESs)
This study emphasized regions of high conservation value, identified by the top 1% and 5% distribution thresholds, which correspond to 99% and 95% protection levels, respectively (Krüger et al., 2017; Pereira et al., 2018). In the South Shetland Islands and surrounding waters, AES were primarily distributed along the southern coastal regions of the islands. Based on geographical features, the AES were subdivided into three sections: A, B, and C. Area A included Smith Island, Low Island, and their adjacent waters; Area B included Snow Island, Rugged Island, Deception Island, Livingston Island, Halfmoon Island, Greenwich Island, and Robert Island and surrounding waters; Area C included Nelson Island, George Island, and Penguin Island, and adjacent waters. Within areas designated for 95% protection, Area A contained approximately 796.54 km² of AES, Area B approximately 1705.18 km², and Area C approximately 1166.23 km², respectively. For regions with 99% protection, Area A encompassed approximately 96.24 km² of AES, Area B approximately 408.18 km², and Area C approximately 234.94 km², respectively (Figure 5).
Figure 5
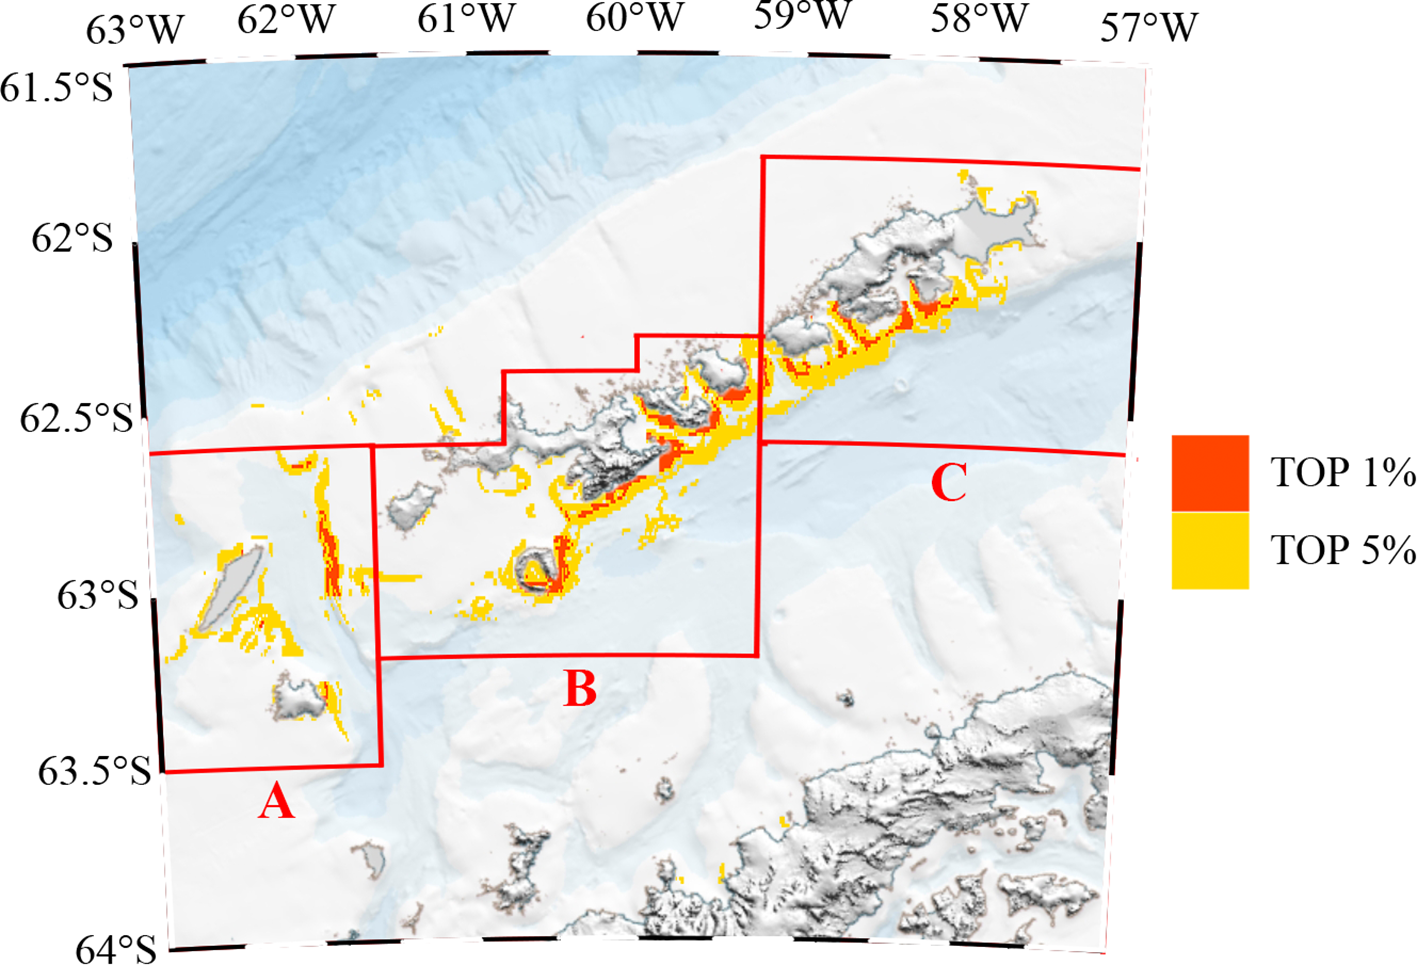
(A–C) AESs of the top 5% and top 1% importance. Red represents the Areas of Ecological Significance (AES) in the top 1%, and yellow represents the i Areas of Ecological Significance (AES) in the top 5%.
3.2 Results under future climate conditions
3.2.1 Future suitable habitat fluctuations
The accuracy of the MaxEnt model under various future scenarios and the contributions of environmental variables are presented in Supplementary Tables S1-S6. ROC analysis indicated that AUC values for each top predator in the study area exceed 0.792, with standard deviations below 0.075 and an average AUC of 0.8535. The highest AUC value was observed for the Weddell Seal under the SSP5-8.5 scenario at the end of this century, with an AUC of 0.951, while the lowest AUC was recorded for the Chinstrap Penguin under the SSP126-29 scenario at the end of this century, with an AUC of 0.792. These results demonstrated the high predictive accuracy and robustness of the MaxEnt model, providing a solid foundation for subsequent analyses.
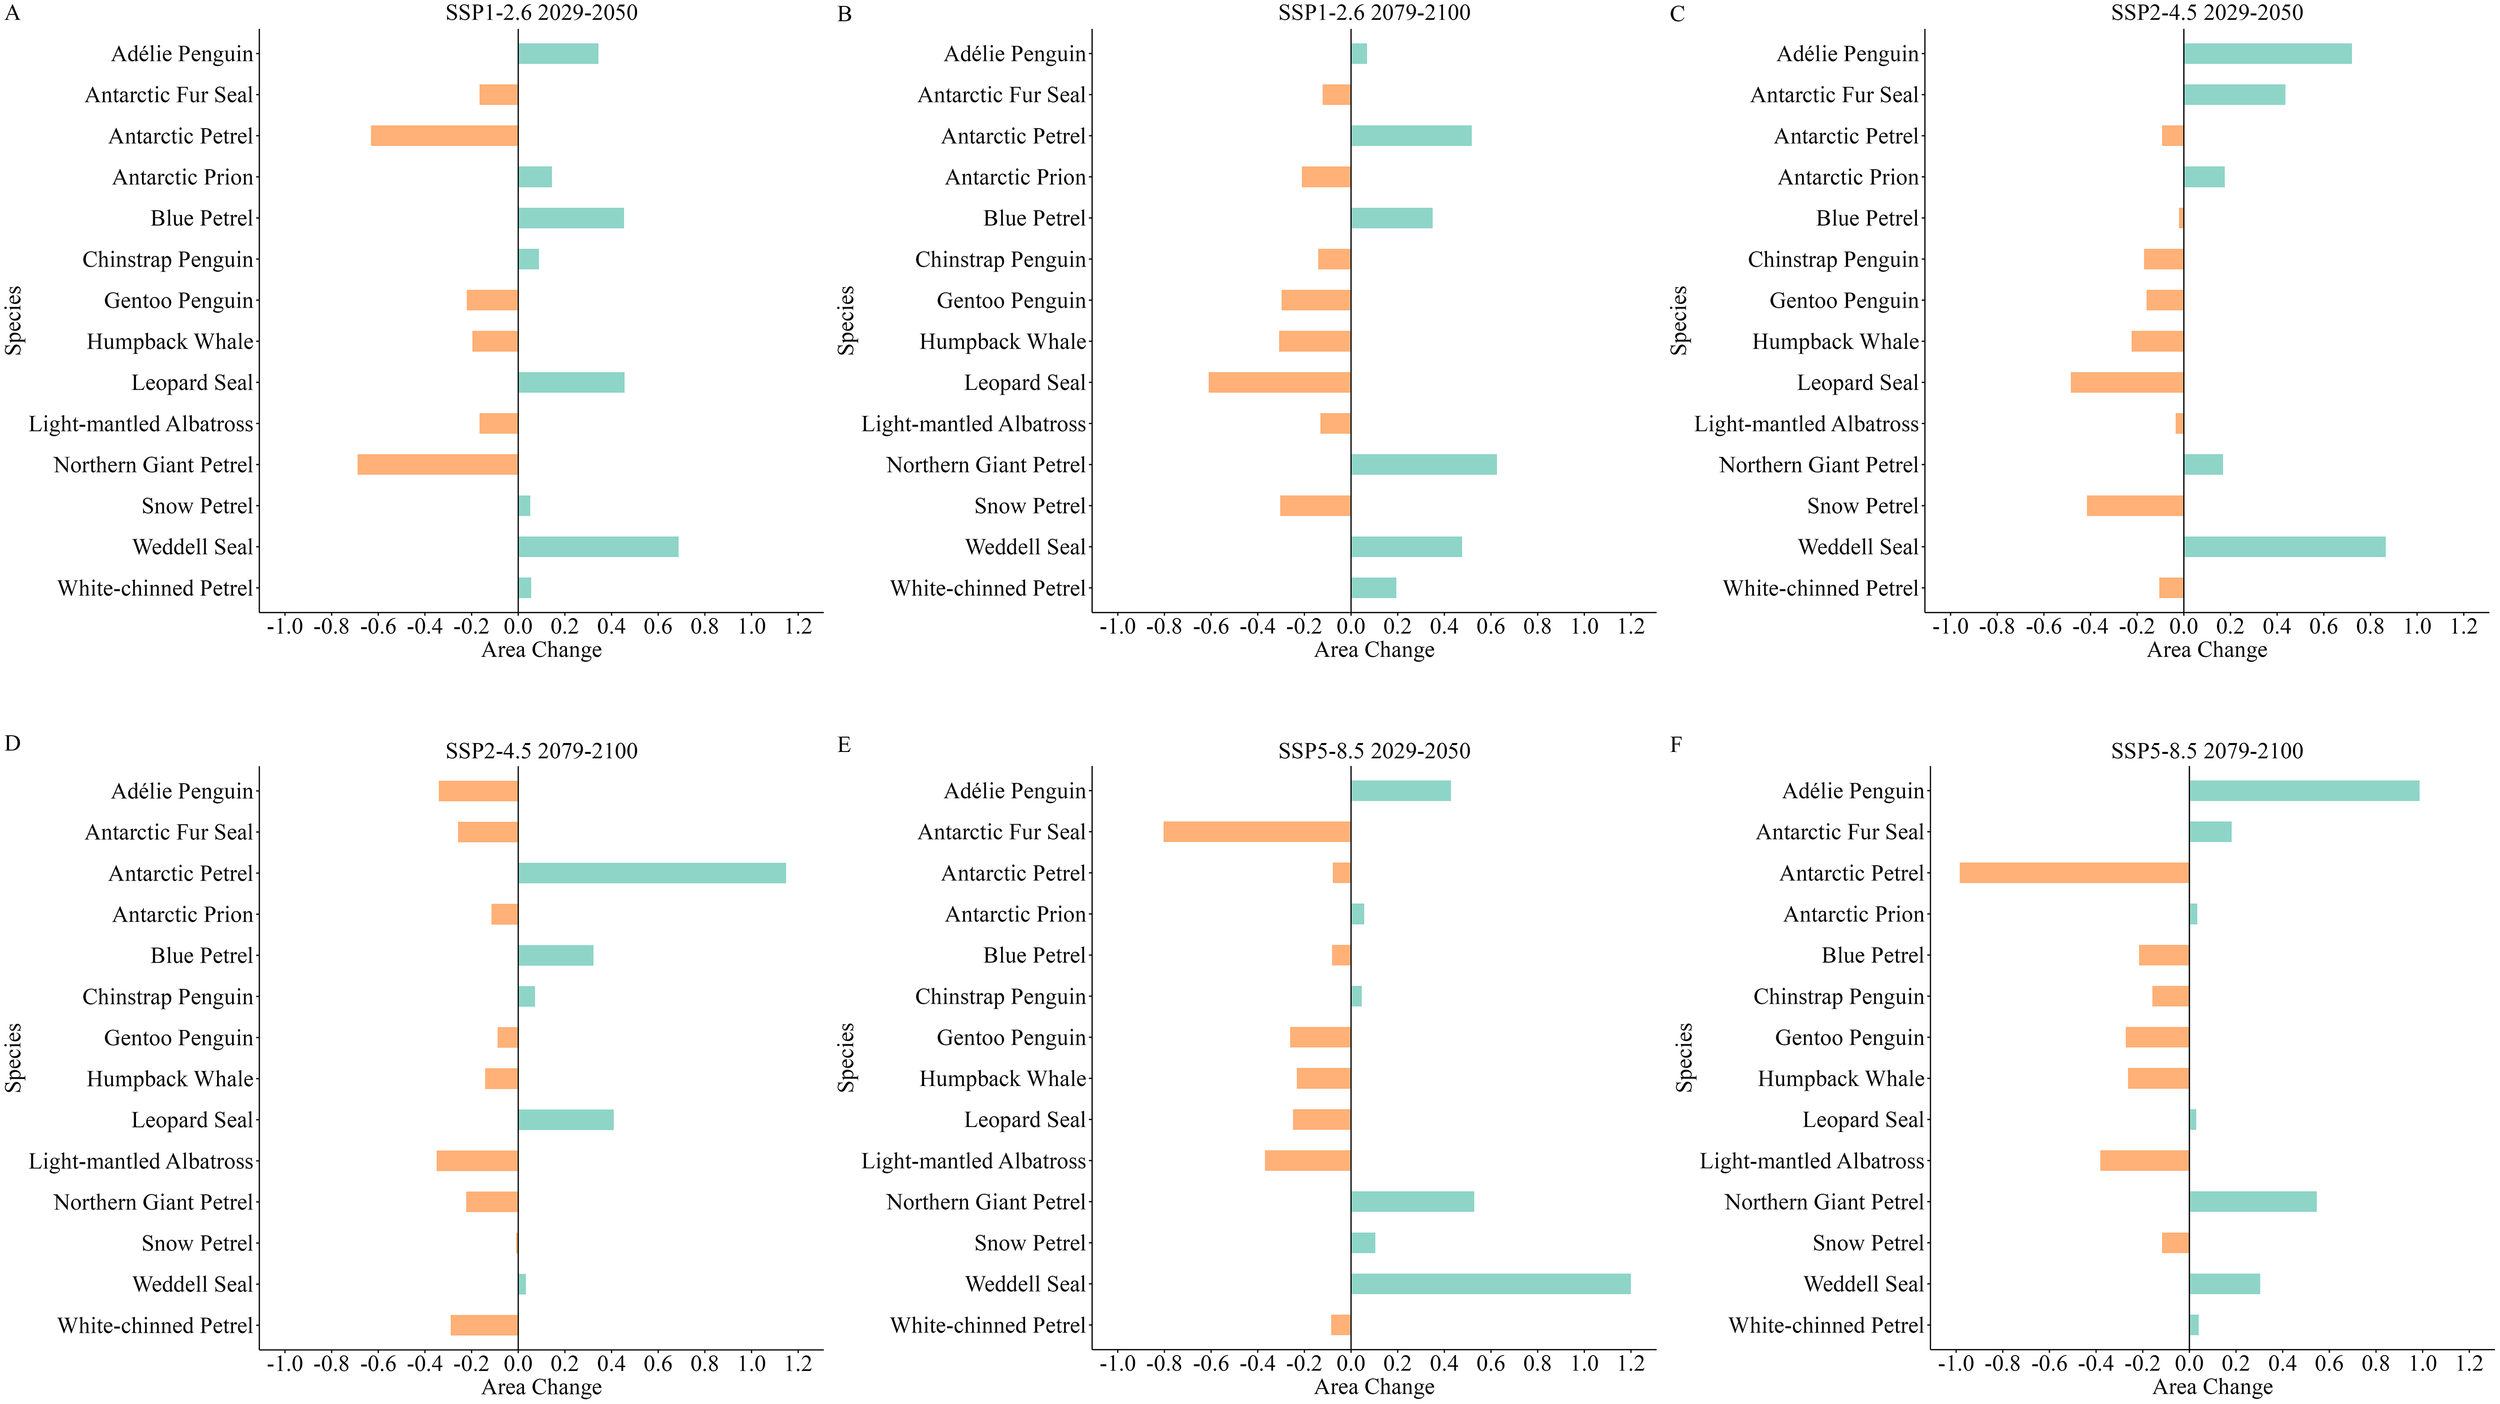
As shown in Figure 6, the extent of highly suitable habitats for top predators, including the Gentoo Penguin, Humpback Whale, and Light-mantled Albatross were projected to decrease across various future scenarios. Among these, the Light-mantled Albatross would experience the most significant decline under the SSP5-8.5 scenario by the end of this century, with a decline of 38.25%, representing approximately 1696.12 km² (Figure 6F). The smallest decline across all top predators occurred for the Light-mantled Albatross during the mid-century under the SSP2-4.5 scenario, at 3.47%, or approximately 153.99 km² (Figure 6C). Notably, the Antarctic Petrel was projected to undergo severe reductions in highly suitable habitat area under the SSP5-8.5 scenario, with a 98.82% decrease (approximately 381.57 km²) by mid-century (Figure 6E) and 98.39% reduction (approximately 379.87 km²) by the end of the century (Figure 6F). In contrast, highly suitable habitats for the Weddell Seal were expected to increase under various scenarios, with the largest increase occurring mid-century under the SSP5-8.5 scenario reaching 120%, approximately 759.18 km² (Figure 6E). The smallest increase for the Weddell Seal occurred by the end of this century under the SSP2-4.5 scenario, at 3.22%, approximately 20.38 km² (Figure 6D).
Figure 6
(A–F) Changes in the highly suitable habitat areas for top predators across various climate scenarios in the South Shetland Islands. Green represents an increase in habitat area, and orange represents a decrease in habitat area.
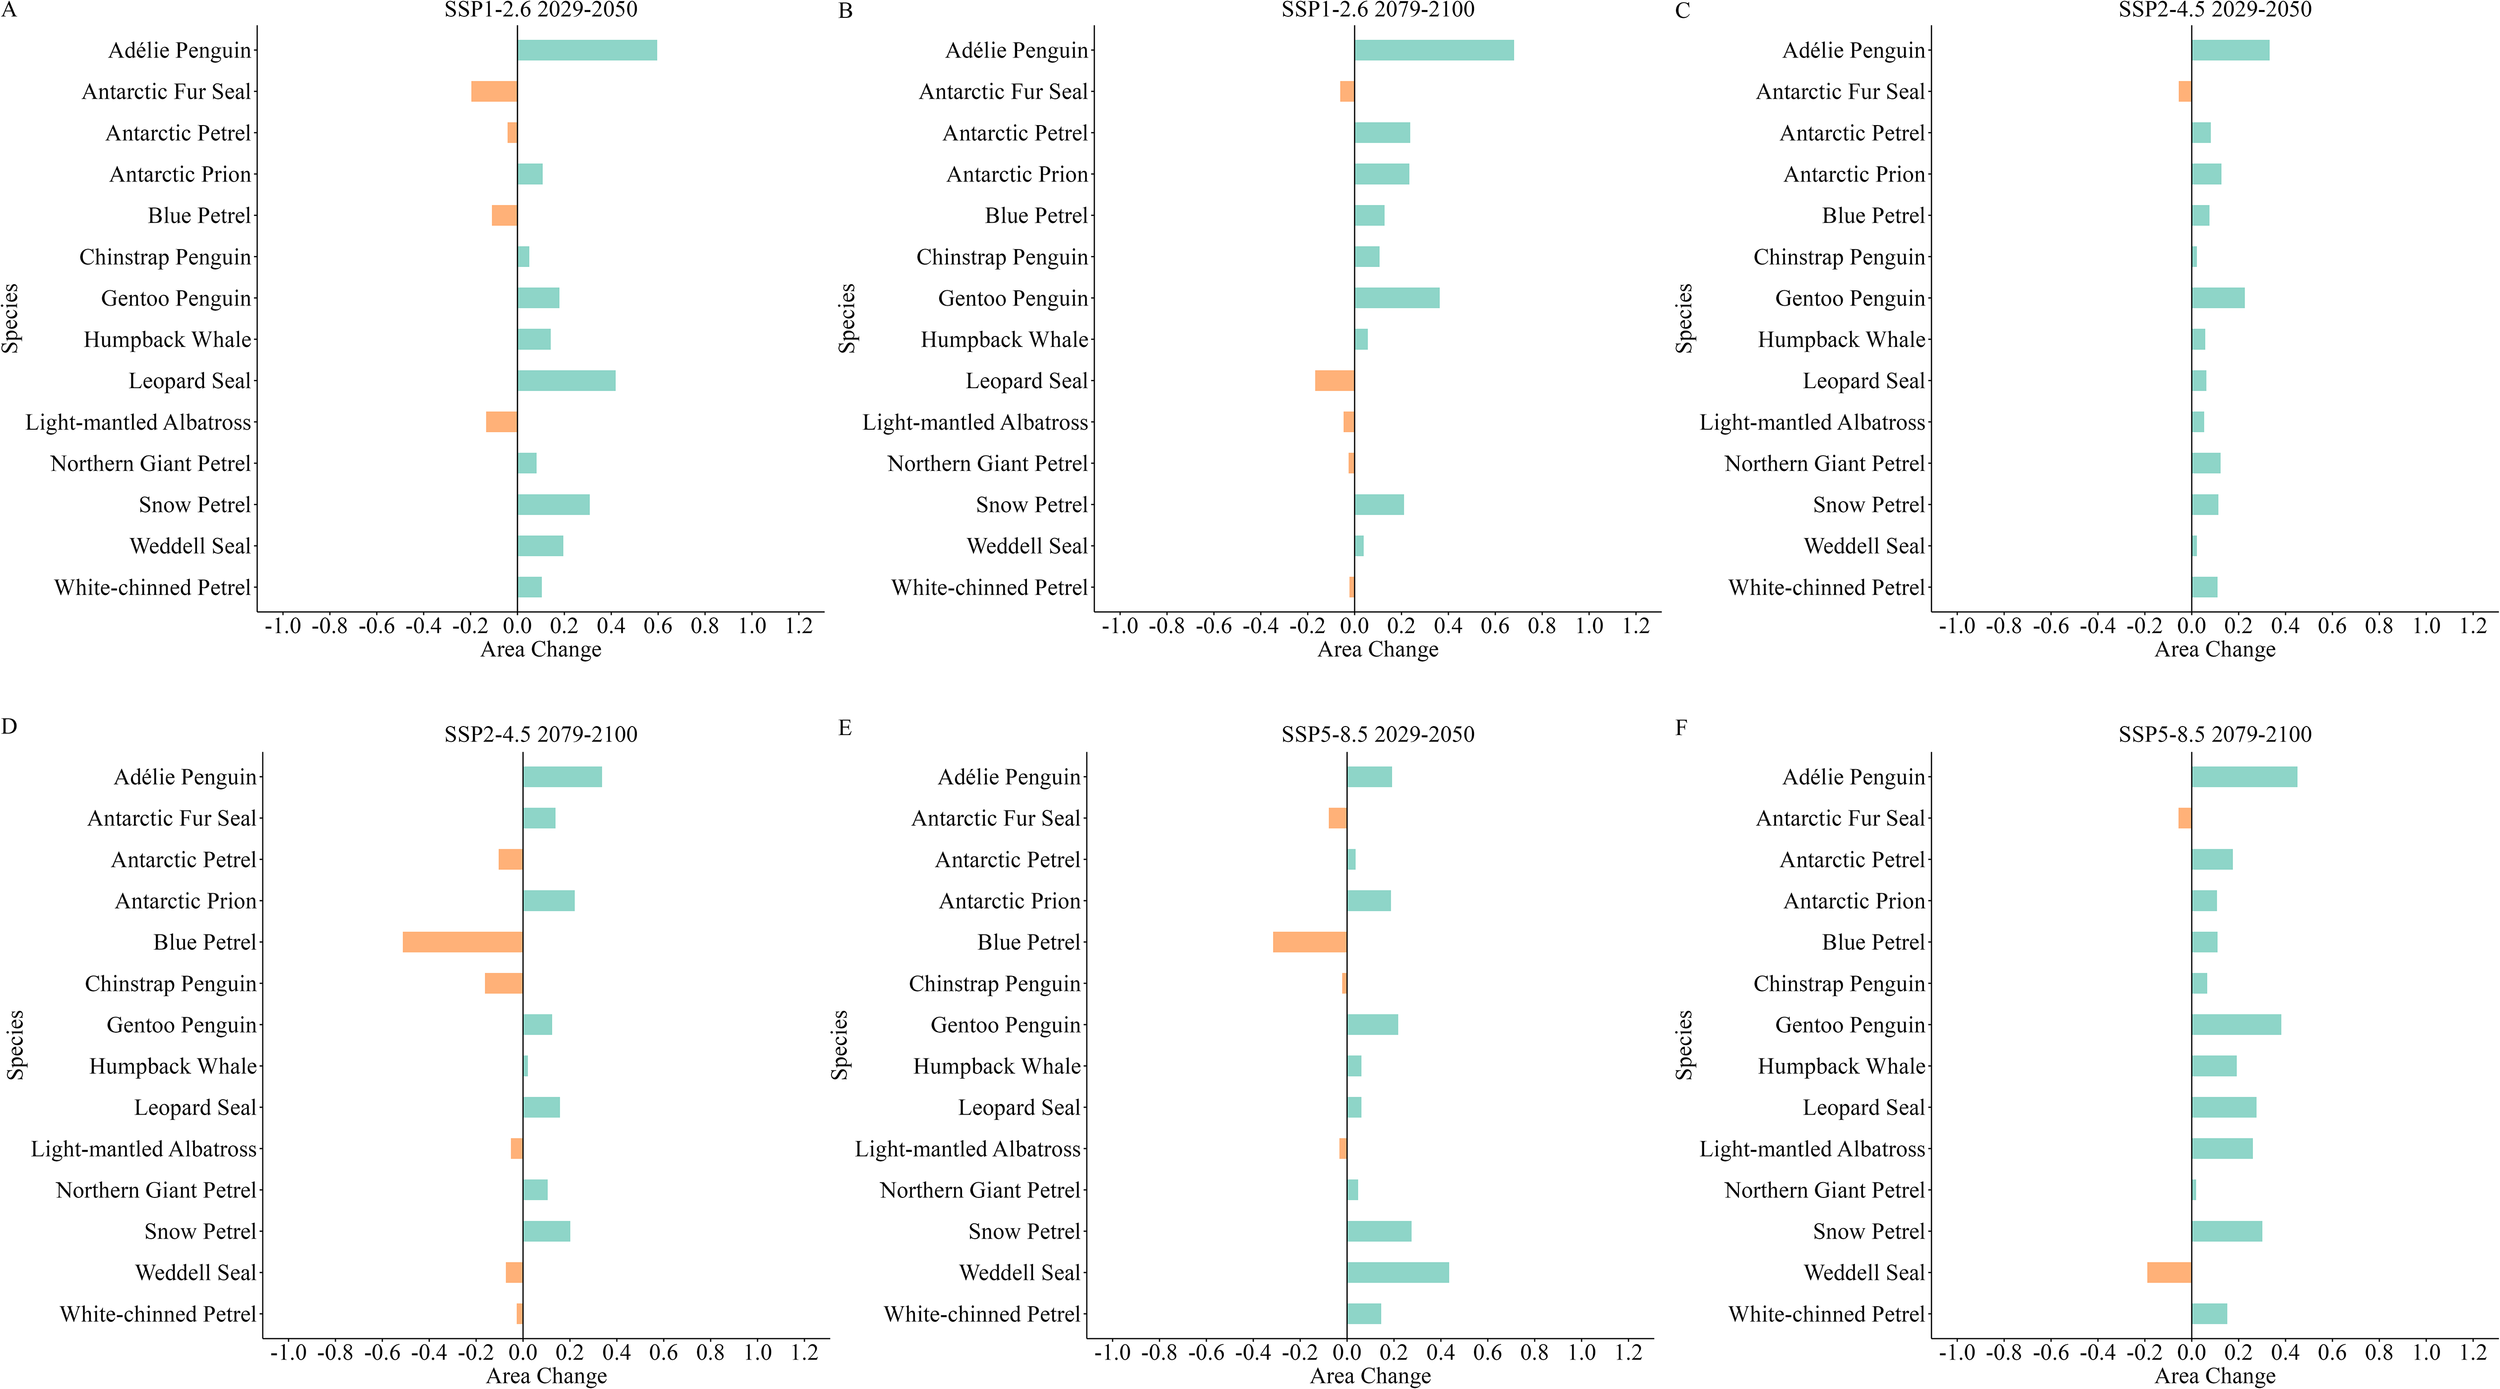
Changes in the total habitat area for top predators in the South Shetland Islands and surrounding waters are depicted in Figure 7. Total habitat areas for species such as the Adélie Penguin, Antarctic Prion, Gentoo Penguin, Humpback Whale, and Snow Petrel all showed an increase under various future scenarios. Specifically, the Adélie Penguin exhibited the largest increase in total habitat area under the SSP1-2.6 scenario by the end of this century, at 67.99%, approximately 10,364.7 km² (Figure 7B). The Humpback Whale showed the smallest increase under the SSP2-4.5 scenario by the end of this century, at 2.09%, approximately 648.22 km² (Figure 7D). The total habitat area for the Antarctic Fur Seal showed a 13.89% increase by the end of this century under the SSP2-4.5 scenario (Figure 7D). However, other future scenarios revealed a trend of decline for this species, with the largest reduction occurring mid-century under the SSP1-2.6 scenario, at 19.65%, approximately 7785.41 km² (Figure 7A), and the smallest decline occurring mid-century under the SSP2-4.5 scenario, at 5.53%, approximately 2189.79 km² (Figure 7C).
Figure 7
(A–F) Changes in the overall habitat areas for top predators across various climate scenarios in the South Shetland Islands. Green represents an increase in habitat area, and orange represents a decrease in habitat area.
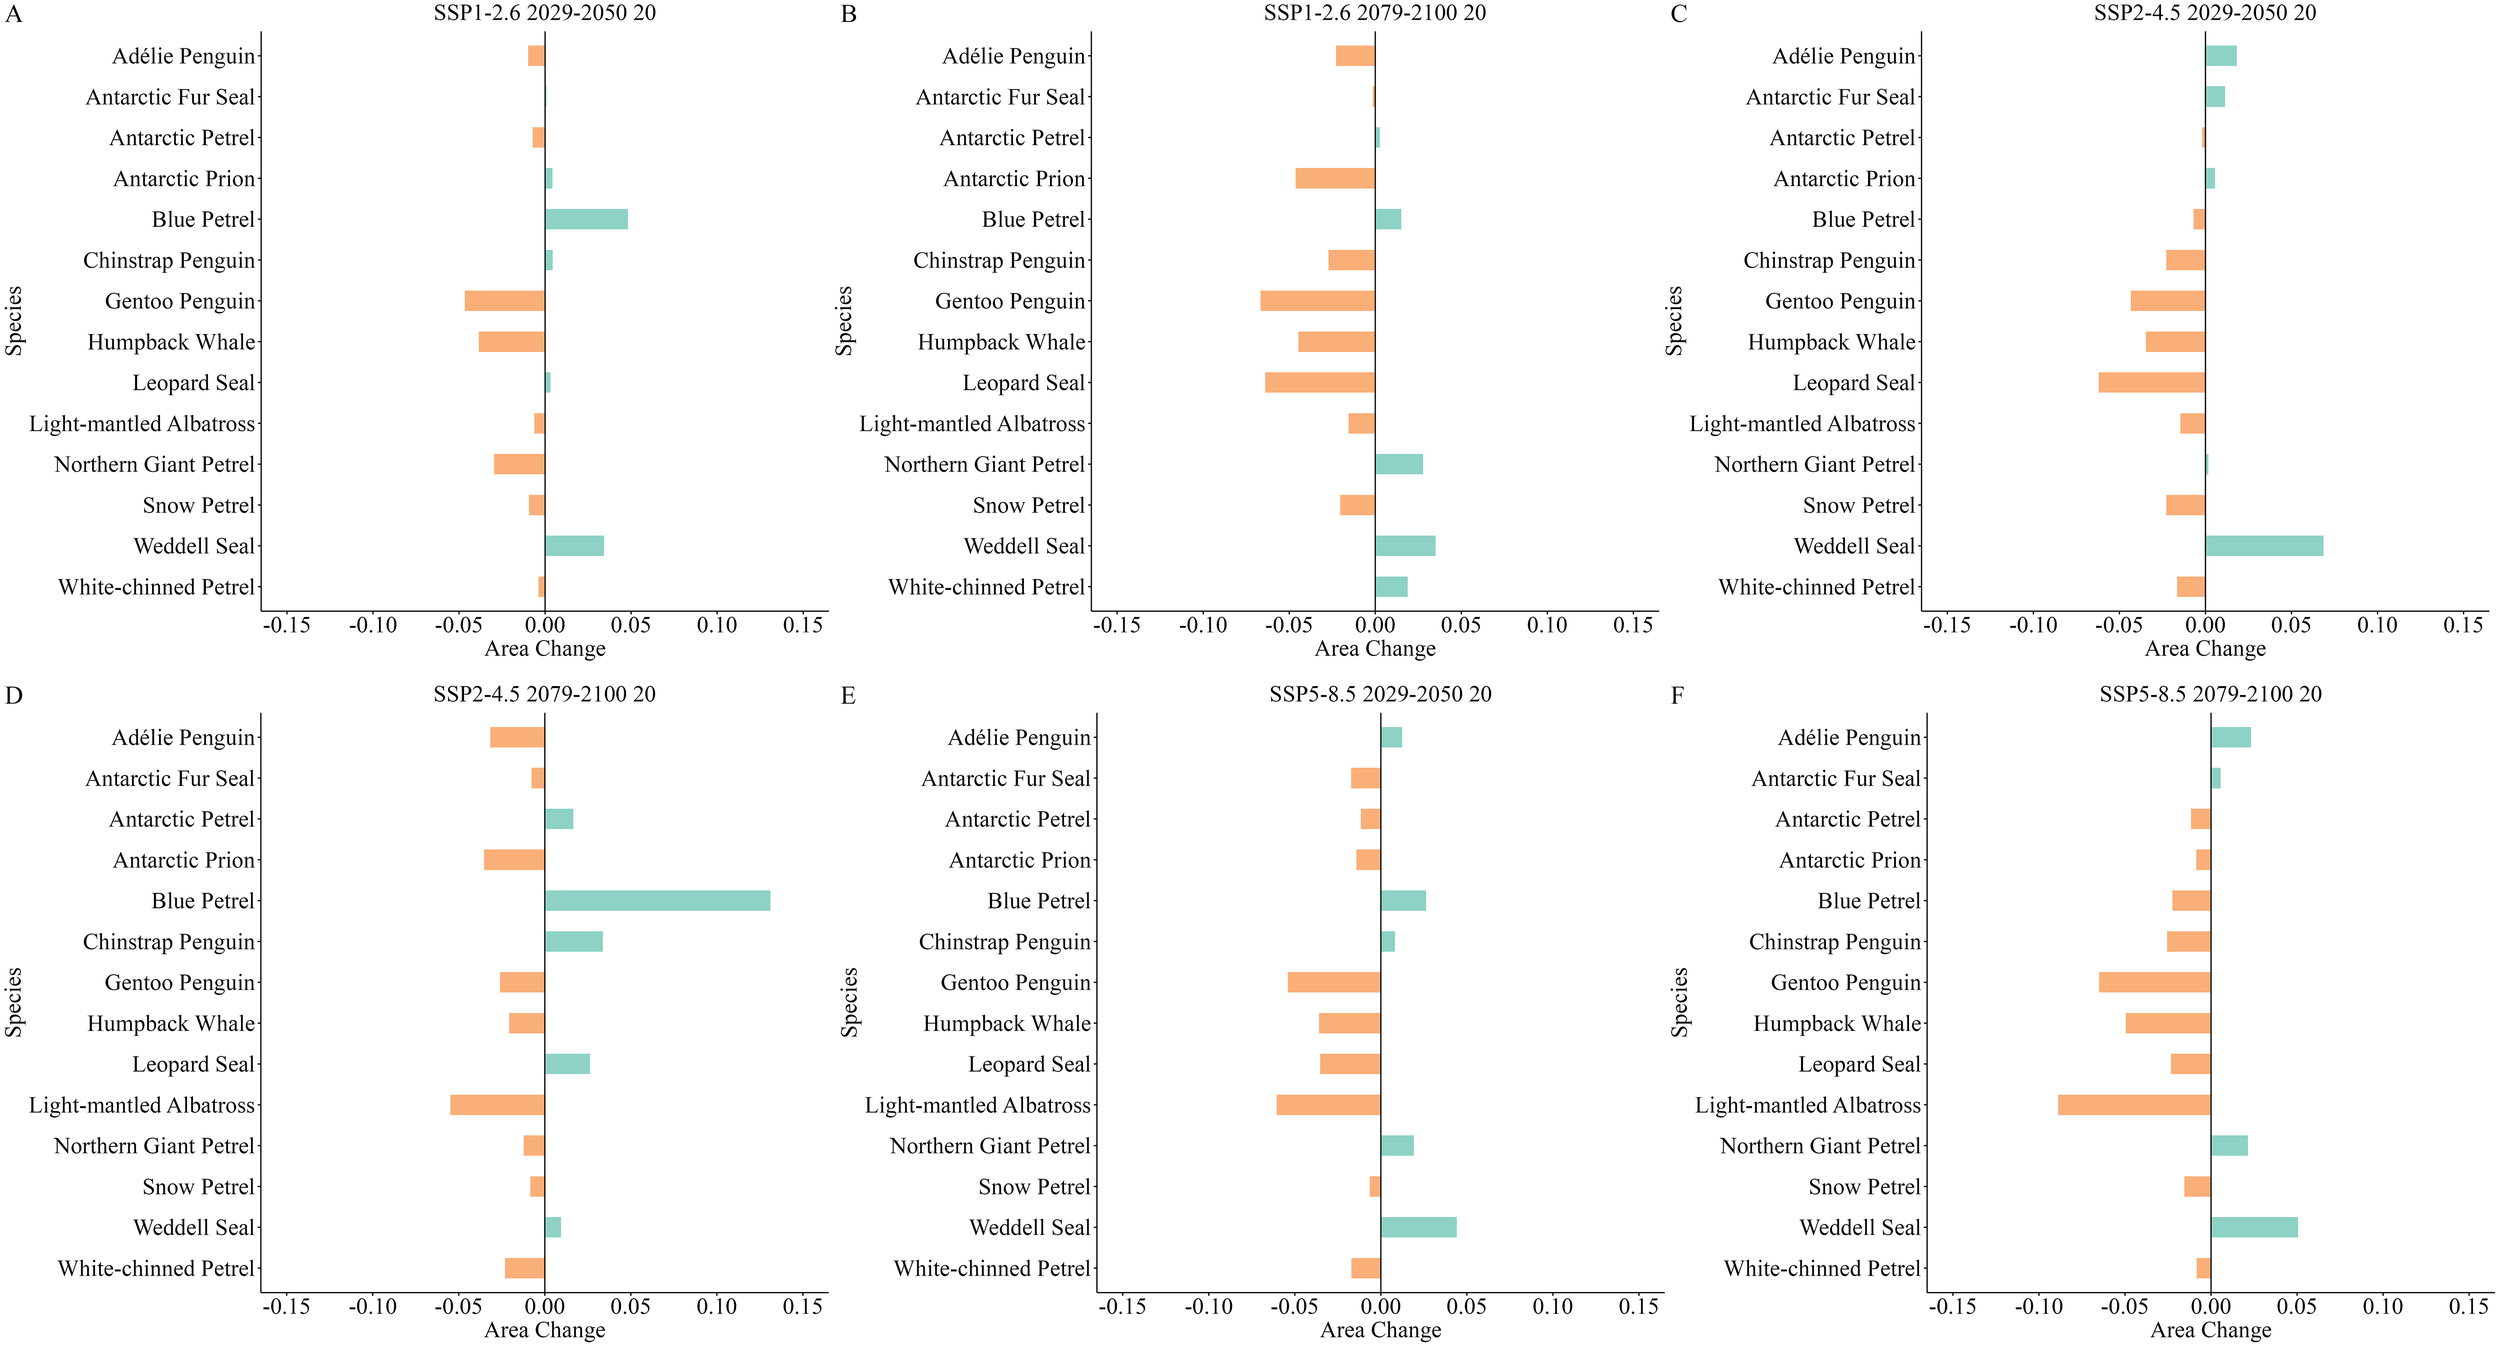
Regarding the proportion of highly suitable habitats, species such as the Gentoo Penguin, Humpback Whale, Light-mantled Albatross, and Snow Petrel consistently exhibited declines across future scenarios (Figure 8). The Light-mantled Albatross showed the most significant proportional decrease under the SSP5-8.5 scenario by the end of this century, with an 8.89% reduction (Figure 8F), while the smallest decline for this species occurred mid-century under the SSP1-2.6 scenario, at 0.63% (Figure 8A). In contrast, the proportion of highly suitable habitats for the Weddell Seal consistently increased, with the most significant rise occurring mid-century under the SSP2-4.5 scenario, at 6.86% (Figure 8C), and the smallest rise by the end of this century under the SSP2-4.5 scenario, at 0.94% (Figure 8D).
Figure 8
(A–F) Changes in the proportion of highly suitable habitat area relative to the total habitat area under different future scenarios in the South Shetland Islands. Green represents an increase in the proportion of highly suitable habitat area relative to the overall habitat area, and orange represents a decrease in this proportion.
3.2.2 Future AES fluctuations
In the analysis of future scenarios, we observed that the area of AESs within the top 5% key regions exhibited varying degrees of change across different areas. Specifically, Area A showed an expansion during the mid-century under the SSP2-4.5 scenario and at the end of the century under the SSP5-8.5 scenario. However, it generally declined across other scenarios, particularly at the end of the century under SSP2-4.5, where the reduction was significant, amounting to 56.57% (approximately 450.64 km²; Figures 9D, 10A, 11A). In contrast, Area B experienced relatively minor changes, with the most substantial fluctuation being an increase of 19.73% (approximately 336.28 km²) at the end of the century under SSP2-4.5 (Figures 9D, 10A, 11A). Area C showed the most considerable decrease during the mid-century under SSP2-4.5, reaching 33.64% (approximately 392.33 km²; Figures 9C, 10A, 11A).
Figure 9
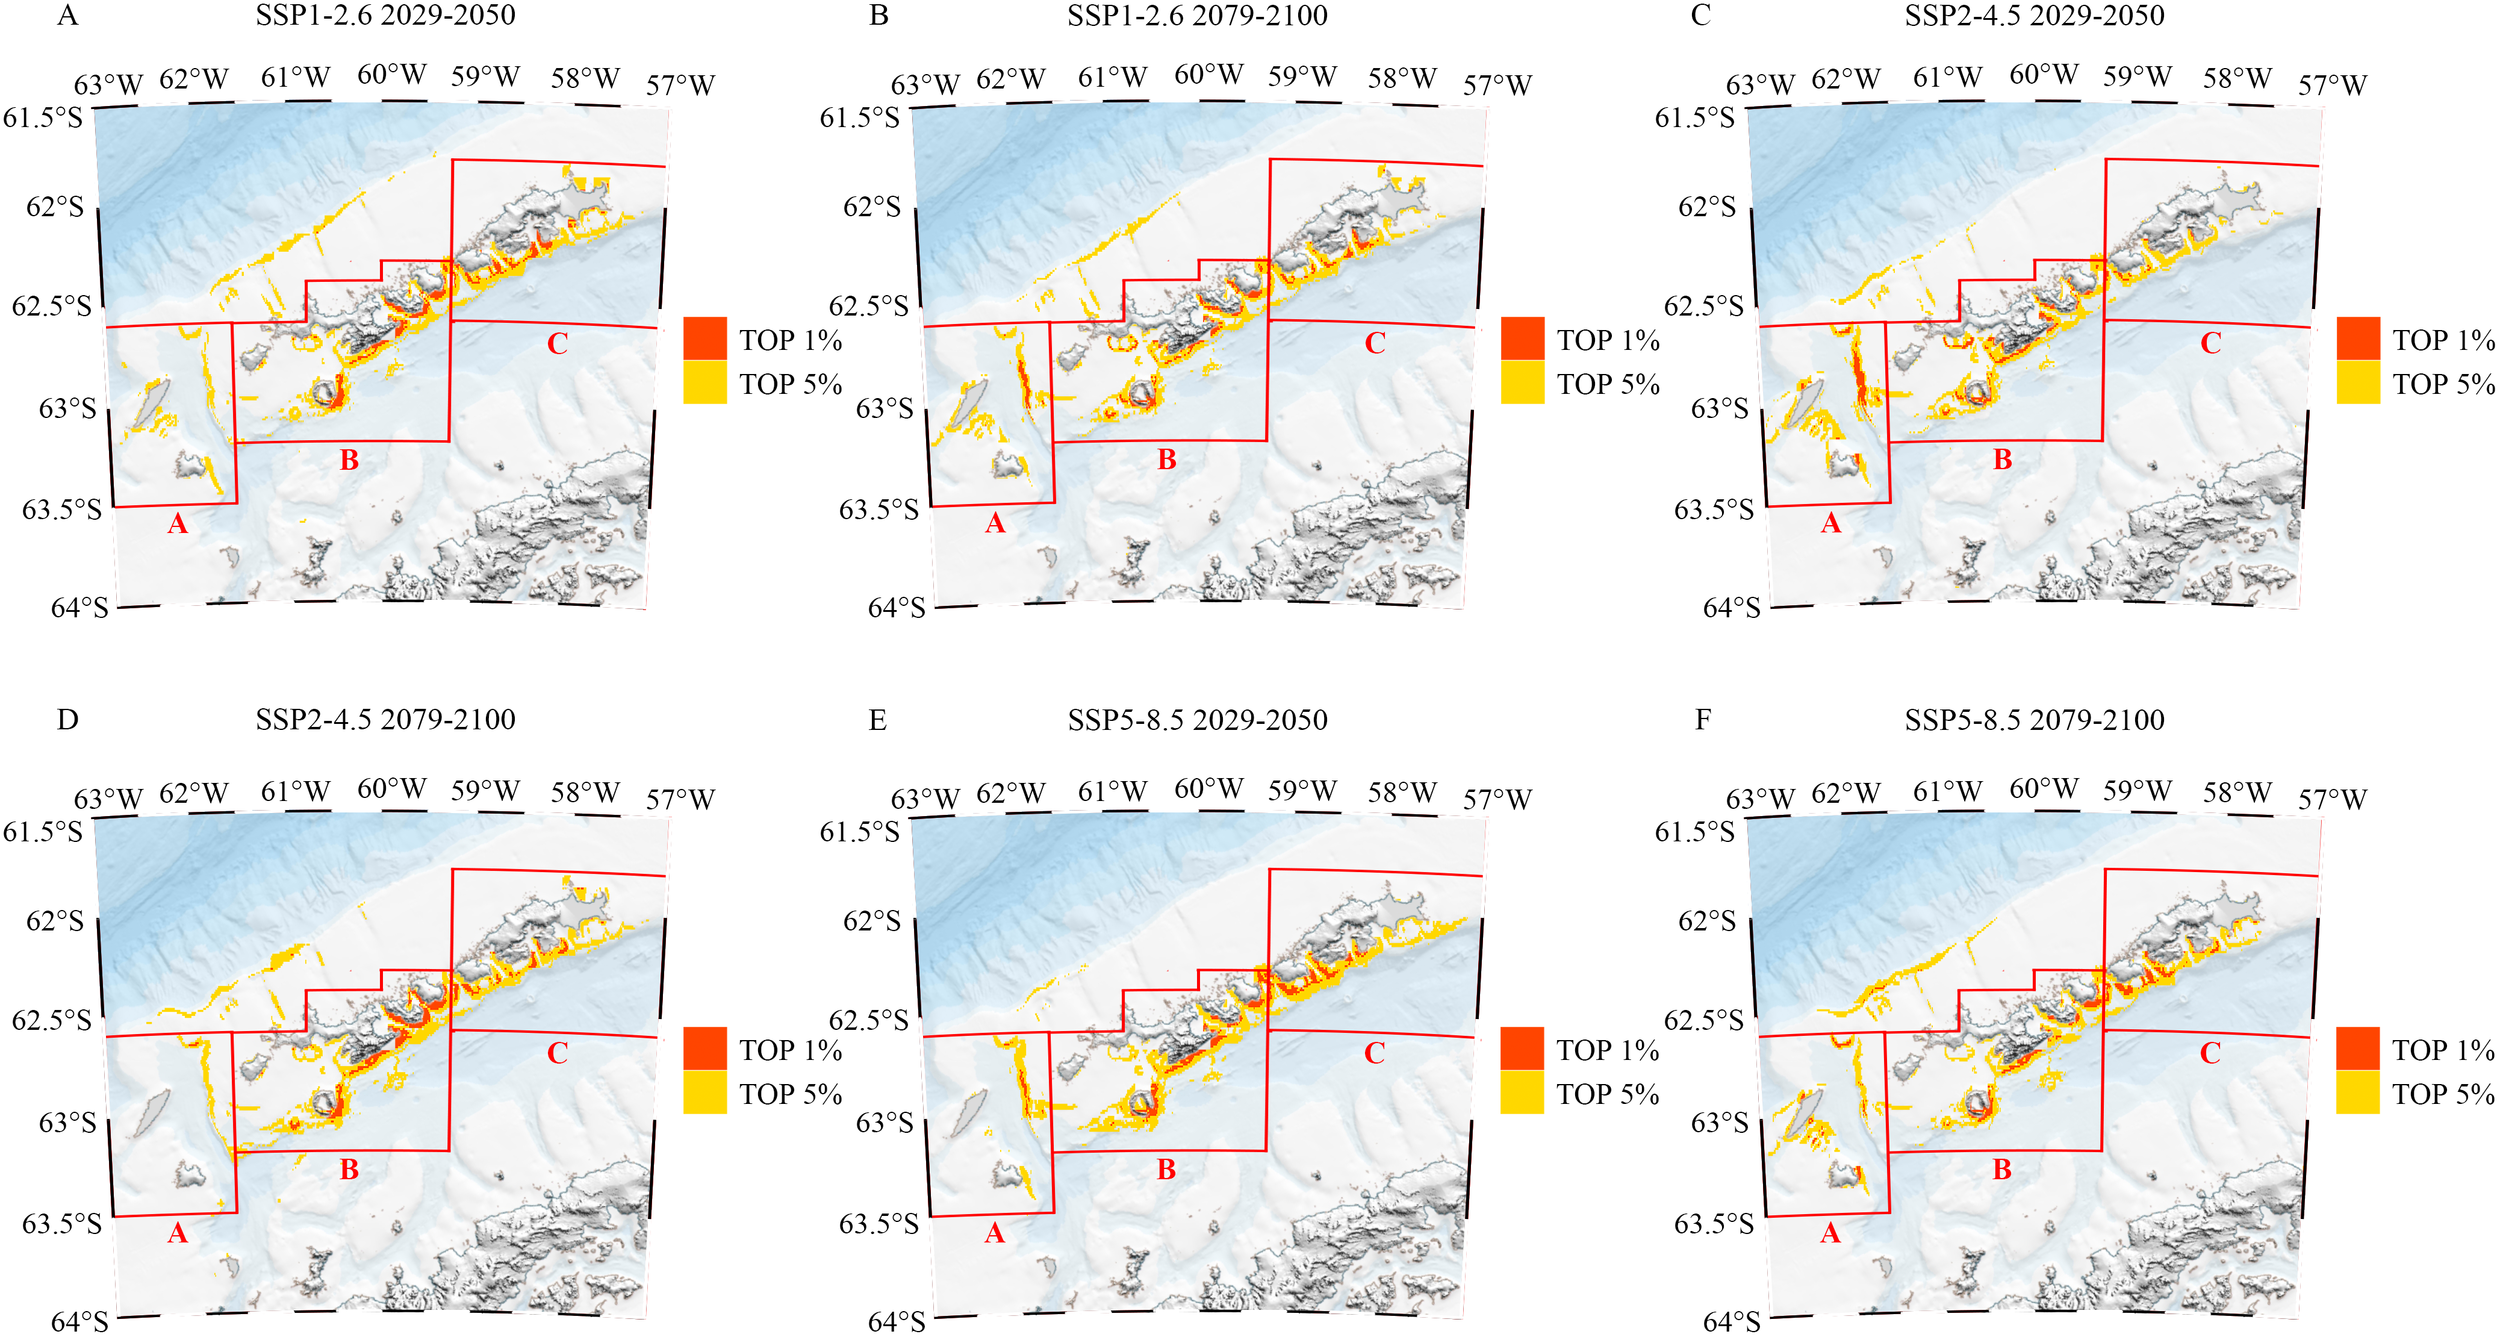
(A–F) AESs of top 5% and top 1% importance under different scenarios. Red represents the Areas of Ecological Significance (AES) in the top 1%, and yellow represents the i Areas of Ecological Significance (AES) in the top 5%.
Figure 10
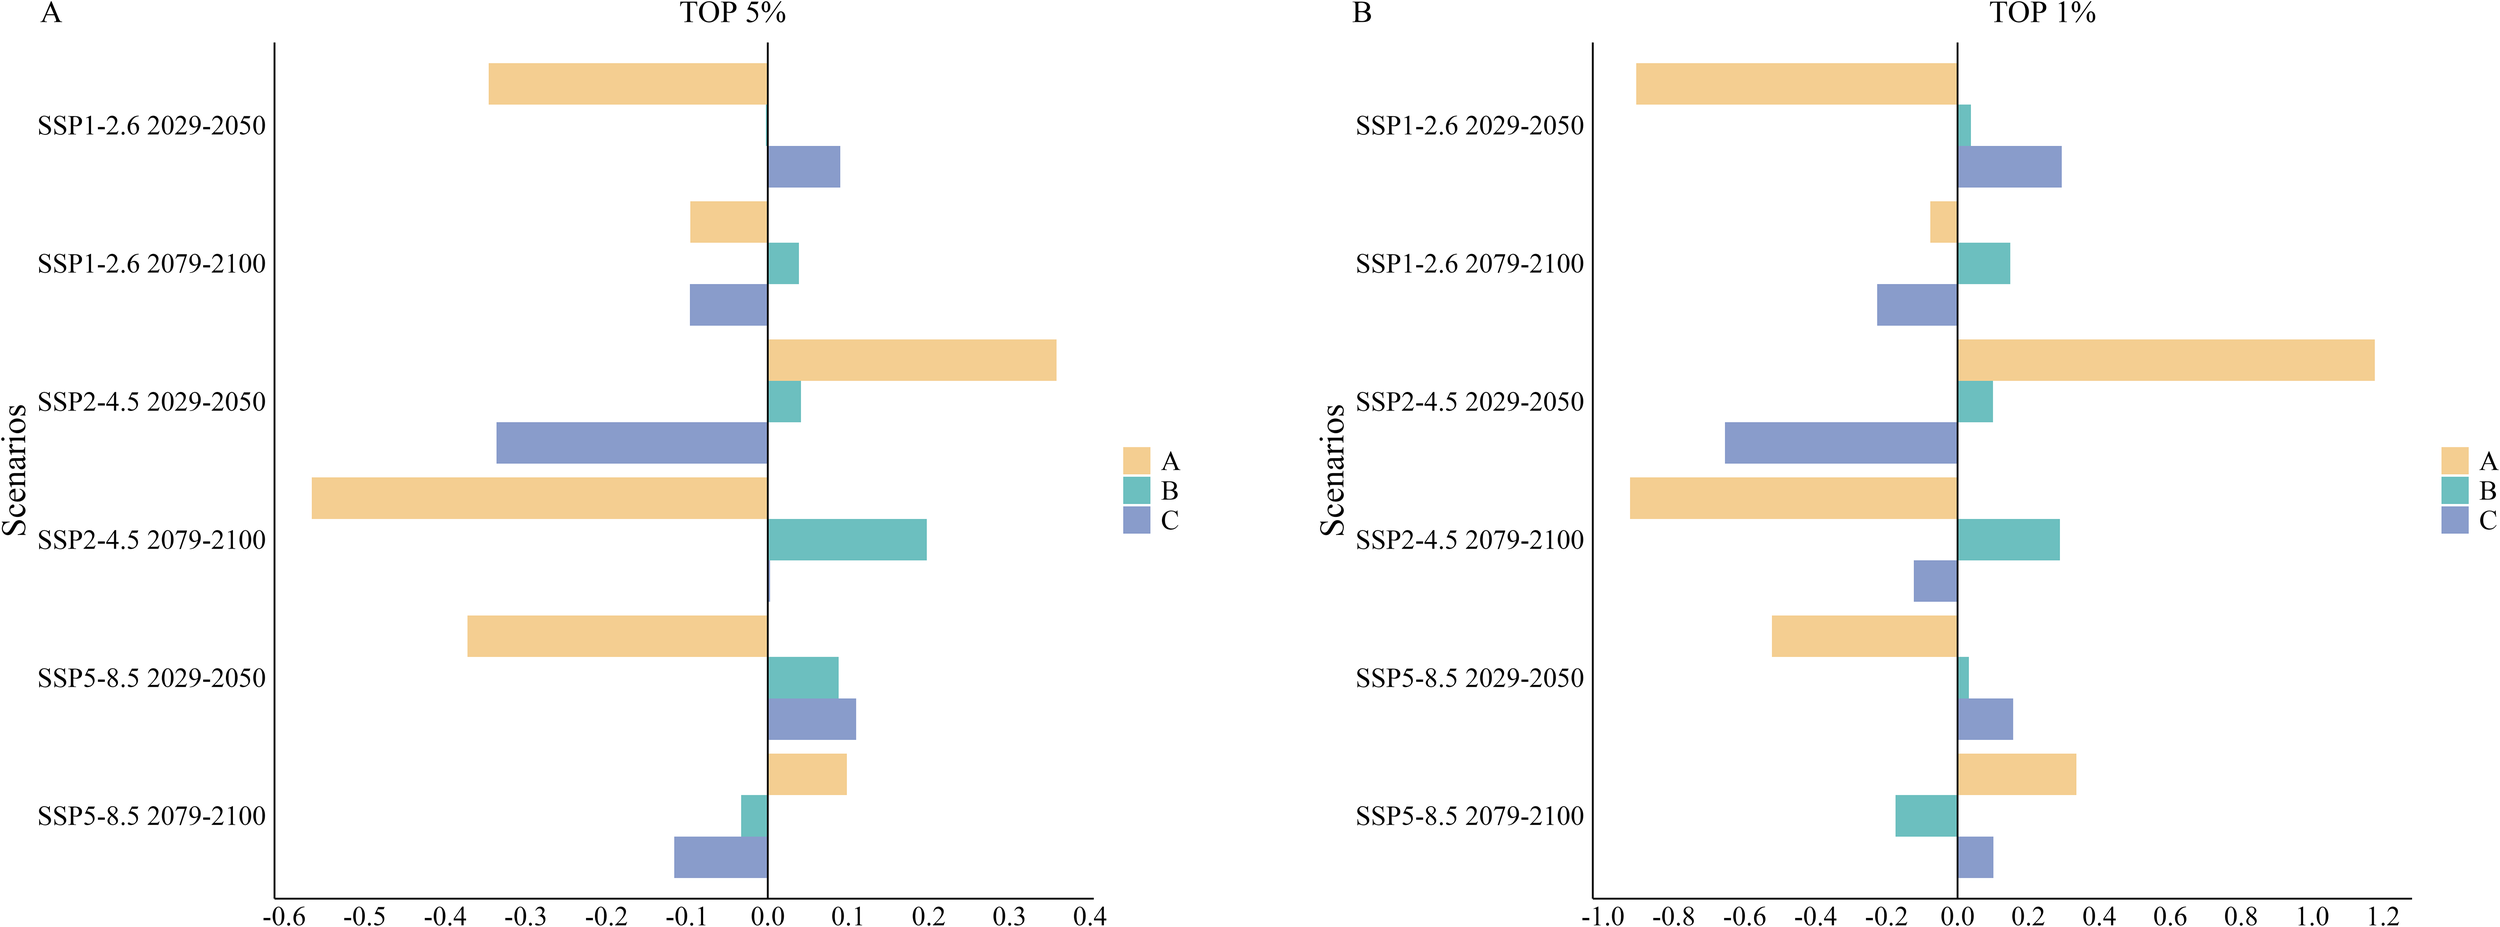
(A, B) Percentage area changes in Areas of Ecological Significance (AES) in the South Shetland Islands under different future scenarios. Yellow represents Area A, green represents Area B, and blue represents Area C.
Figure 11
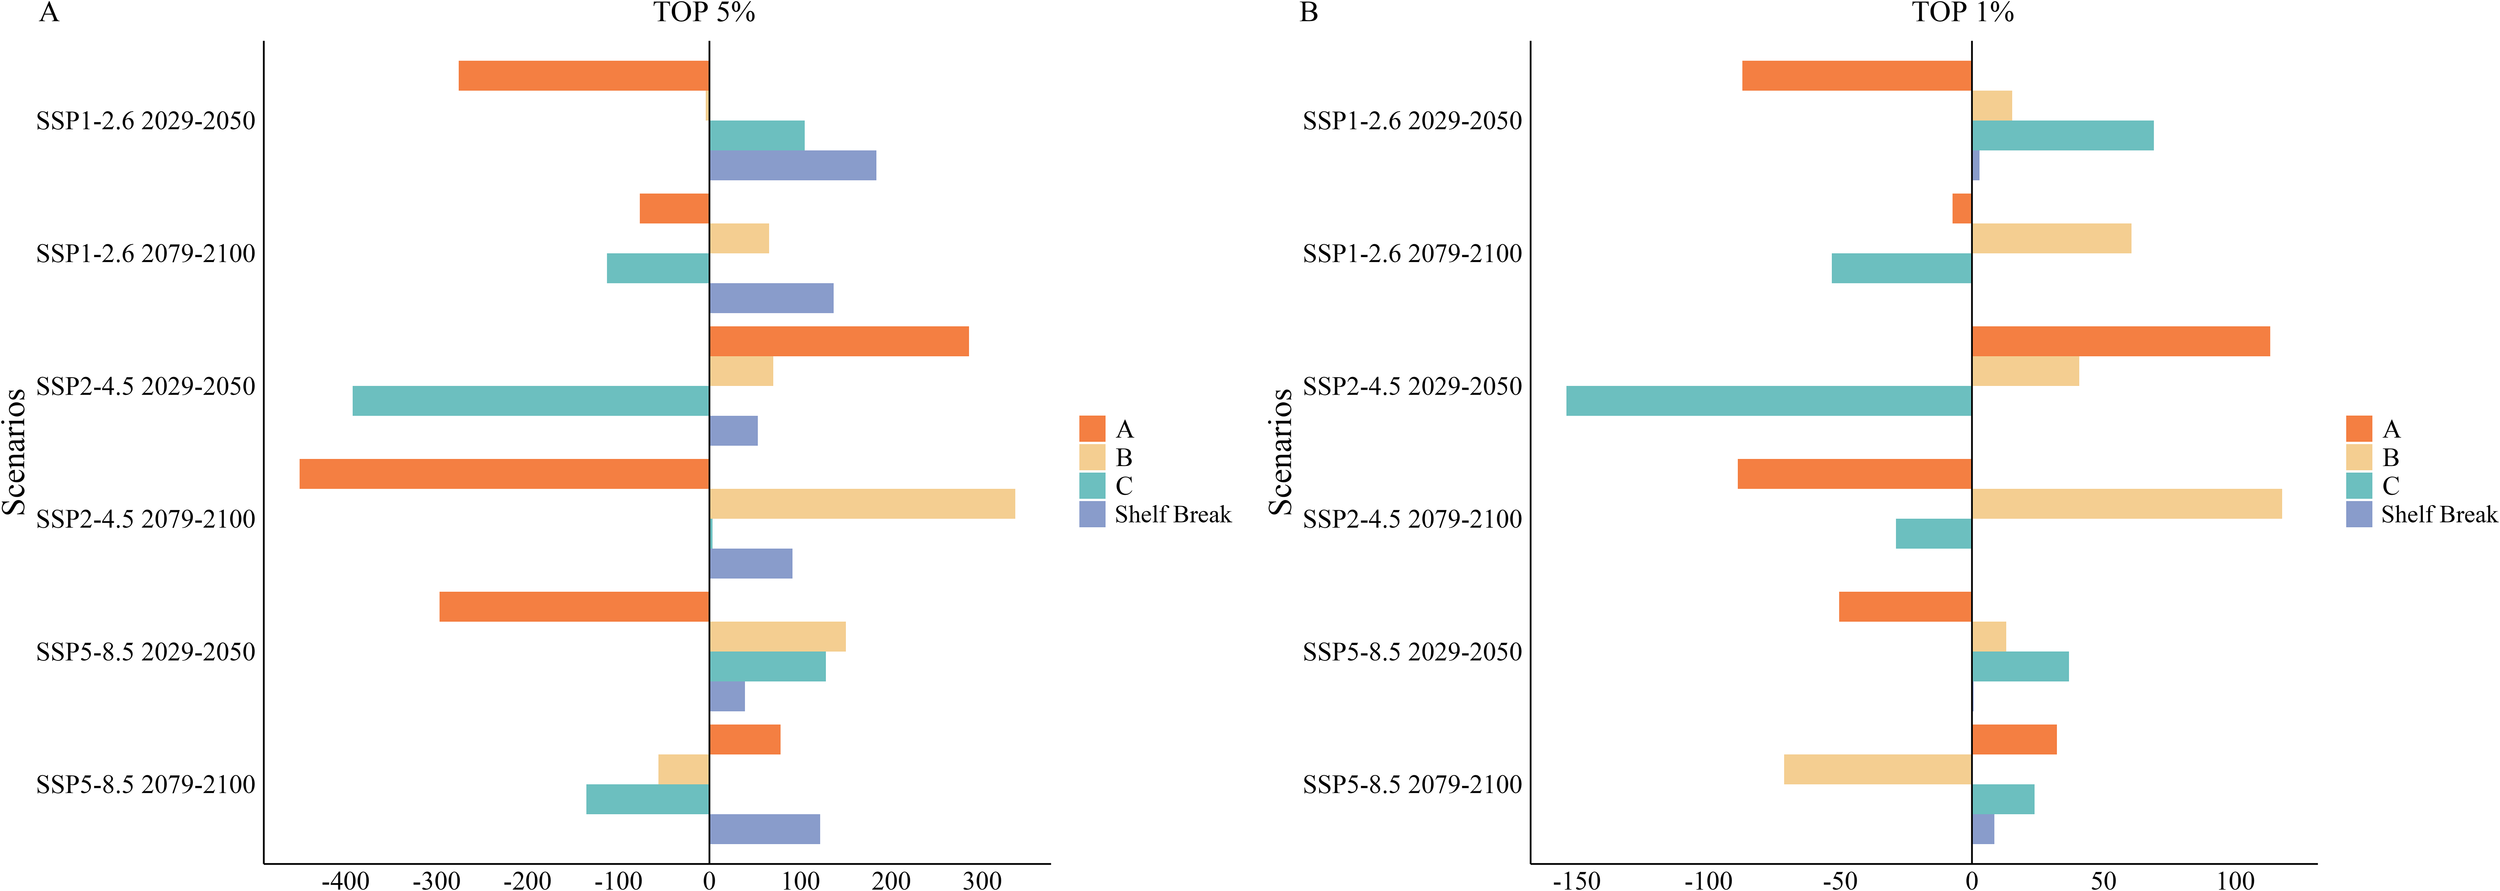
(A, B) Area changes in Areas of Ecological Significance (AES) in the South Shetland Islands Under Different Future Scenarios. Red represents Area A, yellow represents Area B, green represents Area C, and blue represents shelf break region.
Additionally, significant expansion of the AES area was projected on the northern side of Areas A and B, particularly within the shelf break region north of the South Shetland Islands. Currently, the AES area in this region measured only 5.66 km². However, it was anticipated to undergo rapid expansion under various future scenarios. Notably, during the mid-century under the SSP1-2.6 scenario, the area is expected to increase substantially, reaching 189.09 km² (Figures 9A, 11A).
Under future scenarios analyses, the AES area within the top 1% key regions exhibited significant fluctuations in Areas A and C. In Area A, growth was observed during the mid-century under the SSP2-4.5 scenario and at the end of the century under the SSP5-8.5 scenario. However, substantial declines occurred in all other scenarios, particularly at the end of the century under SSP2-4.5, where the reduction reached a staggering 92.35% (approximately 88.88 km²; Figures 9D, 10B, 11B). Area C also experienced a dramatic decrease during the mid-century under SSP2-4.5, with a reduction of 65.54% (approximately 153.99 km²; Figures 9C, 10B, 11B), marking the second-largest decline after Area A. In other periods and scenarios, fluctuations in Area C were relatively minor. In contrast, Area B showed more moderate changes within the 1% key regions. Although a decrease of 17.48% (approximately 71.33 km²; Figures 9F, 10B, 11B) was observed at the end of the century under SSP5-8.5, the area generally showed increases under other scenarios. The most significant growth occurred at the end of the century under SSP2-4.5, with an increase of 28.85% (approximately 117.75 km²; Figures 9D, 10B, 11B).
In the shelf break region north of the South Shetland Islands, there are currently no AESs within the top 1% key areas. Future increase in AES area within this region is minimal, occurring only during the mid-century under the SSP1-2.6 scenario and across all time points under the SSP5-8.5 scenario (Figures 9, 11B).
4 Discussion
4.1 Interpretation of the MaxEnt model
Our results indicate that bathymetry, mixed layer thickness, and sea ice concentration are the primary environmental variables influencing the distribution of top predators in the South Shetland Islands and surrounding waters. Previous studies have demonstrated that the distribution of marine top predators is associated with bathymetric features, though this relationship varies among species and taxonomic groups (Amélineau et al., 2016; Cox et al., 2018; Serratosa et al., 2020; Yen et al., 2004).
According to the response curve for bathymetry, top predators in the study area can be divided into two groups based on bathymetric preferences. The first group exhibits a preference for shelf break zones, with optimal habitat suitability at bathymetry values ranging from -1000 m to -3000 m. This group includes species such as Antarctic Prion, Blue Petrel, Humpback Whale, Light-mantled Albatross, Southern Giant Petrel, and White-chinned Petrel. The second group prefers the coastal areas of the South Shetland Islands, with peak habitat suitability occurring at bathymetry values near or above 0 m. This group includes the Adelie Penguin, Antarctic Fur Seal, Antarctic Petrel, Chinstrap Penguin, Gentoo Penguin, Leopard Seal, Weddell Seal, and Snow Petrel.
Mixed layer thickness is another crucial variable influencing seabird distributions, primarily driven by coastal upwelling (Ainley et al., 2005b). Changes in mixed layer thickness, resulting from the ascent of nutrient-rich cold water to the surface, significantly affect local primary productivity and thus influence the food sources for seabirds (Ballance et al., 1997; Serratosa et al., 2020).
In our study, mixed layer thickness demonstrates a notable gradient increase from south to north, which is mirrored in the habitat distribution of top predators. According to the response curve for mixed layer thickness, species such as the Antarctic Prion, Blue Petrel, Light-mantled Albatross, Northern Giant Petrel, and White-chinned Petrel show a preference for the regions with higher mixed layer thickness, with their habitats concentrated in the northern part of the South Shetland Islands. In contrast, other top predators favor areas with lower mixed layer thickness, consistent with their preference for southern habitats.
Variations in ecology and life history strategies lead different top predators to adopt distinct foraging strategies within sea ice regions, resulting in diverse preferences for sea ice use and varied responses to changes in sea ice conditions (Bestley et al., 2020; Constable et al., 2014; Jenouvrier et al., 2005; Massom and Stammerjohn, 2010; Southwell et al., 2015). Response curves for sea ice concentration indicate that species such as the Adélie Penguin, Gentoo Penguin, and Snow Petrel are more inclined towards areas with relatively high sea ice concentration, aligning with their highly suitable habitats in the southern part of the study area, primarily around the Antarctic Peninsula. In contrast, other species display higher habitat suitability in areas with lower sea ice concentration, suggesting a preference for ice-free, open waters.
Moreover, responses of different top predators to environmental changes in the Southern Ocean vary according to species-specific traits, such as dietary flexibility, environmental sensitivity, and dispersal ability (Younger et al., 2016). Additionally, behavioral diversity and physiological plasticity may result in varied responses to environmental factors like sea ice changes among different species or even among individuals within a species (Bestley et al., 2020). These differences should be considered in future management and conservation plans for the Southern Ocean.
4.2 Habitat fluctuations of top predators
Overall, the habitat quality for top predators in the South Shetland Islands and surrounding waters is projected to decline in the future. Across various scenarios, the total area of habitats for most top predators shows an increasing trend. During Mid-century under the SSP2-4.5 scenario, the number of top predators with an expanded total habitat area reaches its peak, with 13 species, accounting for 92.86%. However, by the end of the century under the same scenario, the number of species with increased habitat area is at its lowest, with only 8 species, representing 57.14%. Despite the increase in total habitat area, the proportion of highly suitable habitats for most top predators declines. At the end of the century under the SSP5-8.5 scenario, the number of top predators experiencing a reduction in the proportion of highly suitable habitats is the highest, with 11 species, representing 78.57%. Across all other scenarios and time points, this proportion of highly suitable habitats decreases for 10 top predators, representing 71.43%. Therefore, it is imperative to strengthen the conservation efforts for top predators in this region, particularly focusing on the highly suitable habitats.
4.3 Areas of Ecological Significance
Previous studies have identified Important Bird Areas (IBAs) in the South Shetland Islands based on habitat data for Adélie and Emperor penguins, indicating that IBAs are primarily located in the northern coastal regions of the South Shetland Islands (Handley et al., 2021). Our study is the first to utilize the distribution of top predators in marine environments to identify AES around the South Shetland Islands and adjacent maritime zones, incorporating a broader range of top predators and extending further into offshore areas.
In Area A, the AES surface area within the top 5% and top 1% critical regions exhibits significant fluctuations, with many scenarios indicating a reduction in AES coverage. This suggests that Area A may experience substantial environmental pressures in the future, potentially leading to instability in its AES extent. In contrast, Area B shows notable stability in AES surface area within both the top 5% and top 1% critical regions, with only minor changes observed. Similarly, AES surface area within Area C remains relatively stable in the top 5% critical regions but exhibits more pronounced fluctuations within the top 1% scenarios. Furthermore, expansions in AES area on the northern side of the shelf break near the South Shetland Islands are primarily observed within the top 5% critical regions. In contrast, increases in the top 1% critical areas are minimal and remain largely concentrated around the southern coastal regions of the South Shetland Islands.
Future conservation efforts should prioritize protecting these identified AESs. Areas expected to experience significant fluctuations or reductions in habitat size should receive enhanced monitoring and ongoing assessment to track ecological changes closely. For instance, AES in Region A is anticipated to face considerable environmental pressures leading to significant area fluctuations and thus requires intensive monitoring. Conversely, AES in the continental shelf break region north of the South Shetland Islands is projected to expand. Such potentially expanding areas should have proactive conservation plans developed in advance to ensure timely and effective protection during their growth.
5 Conclusion
This study employed the MaxEnt model and Zonation method to predict the current and future distributions of suitable habitats and Areas of Ecological Significance for 14 top predators in the South Shetland Islands under various scenarios. The key findings are as follows: 1) The primary environmental variables affecting the distribution of top predators in the South Shetland Islands are bathymetry, mixed layer thickness, and sea ice concentration. 2) The area of highly suitable habitats for the Gentoo Penguin, Humpback Whale, and Light-mantled Albatross is projected to decrease steadily under different future scenarios. 3) AES are predominantly concentrated =along the southern coastal areas of the South Shetland Islands. 4) In the future, AES areas on the western side of the South Shetland Islands are projected to experience significant fluctuations, followed by those on the eastern side, while AES within the central region is anticipated to remain relatively stable.
Statements
Data availability statement
The raw data supporting the conclusions of this article will be made available by the authors, without undue reservation.
Author contributions
DY: Data curation, Investigation, Software, Validation, Writing – original draft. YD: Conceptualization, Data curation, Investigation, Writing – original draft. YL: Data curation, Investigation, Writing – review & editing. MZ: Data curation, Writing – review & editing. MG: Data curation, Writing – review & editing. HC: Data curation, Writing – review & editing. WD: Conceptualization, Supervision, Writing – review & editing. FW: Conceptualization, Resources, Supervision, Writing – review & editing.
Funding
The author(s) declare that financial support was received for the research and/or publication of this article. This work was supported by “the National Key Research and Development Program of China (No. 2024YFC2813602 and 2023YFF0611803)” and “Impact and Response of Antarctic Seas to Climate Change, IRASCC2020-2024-NO.01-02-02 & 02-02”.
Acknowledgments
We appreciate Haitao Ding, Hui Shao, Mengguang Wang, Ronghui Wang and all the members at Great Wall station for their generous help and support during the 36th Chinese National Antarctic Research Expedition. We also extend our heartfelt thanks to Ning Xu, Zhimin Xiao, Xiaodong Chen, Hao Xing, Tieyuan Li, Xian Su, Hua Deng, and all members aboard the XUE LONG 2 Icebreaker for their great help and support during the 38th Chinese National Antarctic Research Expedition.
Conflict of interest
The authors declare that the research was conducted in the absence of any commercial or financial relationships that could be construed as a potential conflict of interest.
Generative AI statement
The author(s) declare that no Generative AI was used in the creation of this manuscript.
Publisher’s note
All claims expressed in this article are solely those of the authors and do not necessarily represent those of their affiliated organizations, or those of the publisher, the editors and the reviewers. Any product that may be evaluated in this article, or claim that may be made by its manufacturer, is not guaranteed or endorsed by the publisher.
Supplementary material
The Supplementary Material for this article can be found online at: https://www.frontiersin.org/articles/10.3389/fmars.2025.1554232/full#supplementary-material
References
1
Ainley D. G. Clarke E. D. Arrigo K. Fraser W. R. Kato A. Barton K. J. et al . (2005a). Decadal-scale changes in the climate and biota of the Pacific sector of the Southern Ocean 1950s to the 1990s. Antarctic Sci.17, 171–182. doi: 10.1017/S0954102005002567
2
Ainley D. Russell J. Jenouvrier S. Woehler E. Lyver P. O. B. Fraser W. R. et al . (2010). Antarctic penguin response to habitat change as Earth’s troposphere reaches 2 C above preindustrial levels. Ecol. Monogr.80, 49–66. doi: 10.1890/08-2289.1
3
Ainley D. G. Spear L. B. Tynan C. T. Barth J. A. Pierce S. D. Ford R. G. et al . (2005b). Physical and biological variables affecting seabird distributions during the upwelling season of the northern California Current. Deep Sea Res. Part II: Topical Stud. Oceanogr.52, 123–143. doi: 10.1016/j.dsr2.2004.08.016
4
Amélineau F. Grémillet D. Bonnet D. Le Bot T. Fort J. (2016). Where to forage in the absence of sea ice? Bathymetry as a key factor for an Arctic seabird. PloS One11, e0157764. doi: 10.1371/journal.pone.0157764
5
Ballance L. T. Pitman R. L. Reilly S. B. (1997). Seabird community structure along a productivity gradient: importance of competition and energetic constraint. Ecology78, 1502–1518. doi: 10.1890/0012-9658(1997)078[1502:SCSAAP]2.0.CO;2
6
Ballard G. Jongsomjit D. Veloz S. D. Ainley D. G. (2012). Coexistence of mesopredators in an intact polar ocean ecosystem: the basis for defining a Ross Sea marine protected area. Biol. Conserv.156, 72–82. doi: 10.1016/j.biocon.2011.11.017
7
Bestley S. Ropert-Coudert Y. Bengtson Nash S. Brooks C. M. Cotté C. Dewar M. et al . (2020). Marine ecosystem assessment for the Southern Ocean: birds and marine mammals in a changing climate. Front. Ecol. Evol.8, 566936. doi: 10.3389/fevo.2020.566936
8
Boersma P. D. (2008). Penguins as marine sentinels. Bioscience58, 597–607. doi: 10.1641/B580707
9
Constable A. J. Melbourne-Thomas J. Corney S. P. Arrigo K. R. Barbraud C. Barnes D. K. et al . (2014). Climate change and Southern Ocean ecosystems I: how changes in physical habitats directly affect marine biota. Global Change Biol.20, 3004–3025. doi: 10.1111/gcb.12623
10
Convey P. Chown S. L. Clarke A. Barnes D. K. Bokhorst S. Cummings V. et al . (2014). The spatial structure of Antarctic biodiversity. Ecol. Monogr.84, 203–244. doi: 10.1890/12-2216.1
11
Cox S. Embling C. B. Hosegood P. J. Votier S. C. Ingram S. N. (2018). Oceanographic drivers of marine mammal and seabird habitat-use across shelf-seas: a guide to key features and recommendations for future research and conservation management. Estuar. Coast. Shelf Sci.212, 294–310. doi: 10.1016/j.ecss.2018.06.022
12
Dias M. P. Carneiro A. P. B. Warwick-Evans V. Harris C. Lorenz K. Lascelles B. et al . (2018). Identification of marine important bird and biodiversity areas for penguins around the South Shetland Islands and South Orkney Islands. Ecol. Evol.8, 10520–10529. doi: 10.1002/ece3.2018.8.issue-21
13
Epele L. B. Grech M. G. Manzo L. M. Macchi P. A. Hermoso V. Miserendino M. L. et al . (2021). Identifying high priority conservation areas for Patagonian wetlands biodiversity. Biodivers. Conserv.30, 1359–1374. doi: 10.1007/s10531-021-02146-2
14
Gil-Delgado J. A. González-Solís J. Barbosa A. (2013). Populations of breeding birds in Byers Peninsula, Livingston Island, South Shetland Islands. Antarctic Sci.25, 303–306. doi: 10.1017/S0954102012000752
15
Gonzalez S. C. Soto-Centeno J. A. Reed D. L. (2011). Population distribution models: species distributions are better modeled using biologically relevant data partitions. BMC Ecol.11, 1–10. doi: 10.1186/1472-6785-11-20
16
Handley J. M. Pearmain E. J. Oppel S. Carneiro A. P. Hazin C. Phillips R. A. et al . (2020). Evaluating the effectiveness of a large multi-use MPA in protecting Key Biodiversity Areas for marine predators. Diversity Distribut.26, 715–729. doi: 10.1111/ddi.13041
17
Handley J. Rouyer M.-M. Pearmain E. J. Warwick-Evans V. Teschke K. Hinke J. T. et al . (2021). Marine important bird and biodiversity areas for penguins in Antarctica, targets for conservation action. Front. Mar. Sci.7, 602972. doi: 10.3389/fmars.2020.602972
18
Hazen E. L. Abrahms B. Brodie S. Carroll G. Jacox M. G. Savoca M. S. et al . (2019). Marine top predators as climate and ecosystem sentinels. Front. Ecol. Environ.17, 565–574. doi: 10.1002/fee.v17.10
19
Huguenin M. F. Holmes R. M. England M. H. (2022). Drivers and distribution of global ocean heat uptake over the last half century. Nat. Commun.13, 4921. doi: 10.1038/s41467-022-32540-5
20
Jenouvrier S. Barbraud C. Weimerskirch H. (2005). Long-term contrasted responses to climate of two Antarctic seabird species. Ecology86, 2889–2903. doi: 10.1890/05-0514
21
Johnson D. Barrio Froján C. Bax N. Dunstan P. Woolley S. Halpin P. et al . (2019). The global ocean biodiversity initiative: promoting scientific support for global ocean governance. Aquat. Conserv.: Mar. Freshw. Ecosyst.29, 162–169. doi: 10.1002/aqc.v29.S2
22
Kawaguchi S. Nicol S. (2020). Krill fishery. Fisheries Aquacult.9, 137–158. doi: 10.1093/oso/9780190865627.003.0006
23
Khadka K. K. James D. A. (2017). Modeling and mapping the current and future climatic-niche of endangered himalayan musk deer[J]. Ecol. Inf.40, 1–7. doi: 10.1016/j.ecoinf.2017.04.009
24
Krüger L. Ramos J. Xavier J. Grémillet D. González-Solís J. Kolbeinsson Y. et al . (2017). Identification of candidate pelagic marine protected areas through a seabird seasonal-, multispecific-and extinction risk-based approach. Anim. Conserv.20, 409–424. doi: 10.1111/acv.12339
25
Lehtomäki J. Moilanen A. (2013). Methods and workflow for spatial conservation prioritization using Zonation. Environ. Model. Softw.47, 128–137. doi: 10.1016/j.envsoft.2013.05.001
26
Lin S. Zhao L. Feng J. (2022). Predicted changes in the distribution of antarctic krill in the cosmonaut sea under future climate change scenarios[J]. Ecol. Indic.142, 109234. doi: 10.1016/j.ecolind.2022.109234
27
Lumpe P. Weidinger K. (2000). Distribution, numbers and breeding of birds at the northern ice-free areas of Nelson Island, South Shetland Islands, Antarctica 1990_1992. Mar. Ornithol.28, 41–46.
28
Massom R. A. Stammerjohn S. E. (2010). Antarctic sea ice change and variability–physical and ecological implications. Polar Sci.4, 149–186. doi: 10.1016/j.polar.2010.05.001
29
Moilanen A. Lehtinen P. Kohonen I. Jalkanen J. Virtanen E. A. Kujala H. (2022). Novel methods for spatial prioritization with applications in conservation, land use planning and ecological impact avoidance. Methods Ecol. Evol.13, 1062–1072. doi: 10.1111/2041-210X.13819
30
Pereira J. M. Krüger L. Oliveira N. Meirinho A. Silva A. Ramos J. A. et al . (2018). Using a multi-model ensemble forecasting approach to identify key marine protected areas for seabirds in the Portuguese coast. Ocean Coast. Manage.153, 98–107. doi: 10.1016/j.ocecoaman.2017.12.014
31
Phillips S. J. Anderson R. P. Schapire R. E. (2006). Maximum entropy modeling of species geographic distributions[J]. Ecol. Model.190 (3-4), 231–259. doi: 10.1016/j.ecolmodel.2005.03.026
32
Riahi K. Van Vuuren D. P. Kriegler E. Edmonds J. O’neill B. C. Fujimori S. et al . (2017). The Shared Socioeconomic Pathways and their energy, land use, and greenhouse gas emissions implications: An overview. Global Environ. Change42, 153–168. doi: 10.1016/j.gloenvcha.2016.05.009
33
Serratosa J. Hyrenbach K. D. Miranda-Urbina D. Portflitt-Toro M. Luna N. Luna-Jorquera G. (2020). Environmental drivers of seabird at-sea distribution in the Eastern South Pacific Ocean: assemblage composition across a longitudinal productivity gradient. Front. Mar. Sci.6, 838. doi: 10.3389/fmars.2019.00838
34
Southwell C. Emmerson L. McKinlay J. Newbery K. Takahashi A. Kato A. et al . (2015). Spatially extensive standardized surveys reveal widespread, multi-decadal increase in East Antarctic Adélie penguin populations. PloS One10, e0139877. doi: 10.1371/journal.pone.0139877
35
Tabor K. Williams J. W. (2010). Globally downscaled climate projections for assessing the conservation impacts of climate change. Ecol. Appl.20, 554–565. doi: 10.1890/09-0173.1
36
Tan C. Ma J. Yan Y. Hong G. Wu X. (2023). Identifying priority wetlands for the conservation of waterbirds in Wuhan, China. Ecol. Indic.157, 111240. doi: 10.1016/j.ecolind.2023.111240
37
Trivelpiece W. Z. Buckelew S. Reiss C. Trivelpiece S. G. (2007). The winter distribution of chinstrap penguins from two breeding sites in the South Shetland Islands of Antarctica. Polar Biol.30, 1231–1237. doi: 10.1007/s00300-007-0283-1
38
Turner J. Overland J. (2009). Contrasting climate change in the two polar regions. Polar Res.28, 146–164. doi: 10.1111/j.1751-8369.2009.00128.x
39
Venne S. Currie D. J. (2021). Can habitat suitability estimated from MaxEnt predict colonizations and extinctions? Diversity Distribut.27, 873–886. doi: 10.1111/ddi.13238
40
Viquerat S. Waluda C. M. Kennedy A. S. Jackson J. A. Hevia M. Carroll E. L. et al . (2022). Identifying seasonal distribution patterns of fin whales across the Scotia Sea and the Antarctic Peninsula region using a novel approach combining habitat suitability models and ensemble learning methods. Front. Mar. Sci.9, 1040512. doi: 10.3389/fmars.2022.1040512
41
Wiens J. A. Stralberg D. Jongsomjit D. Howell C. A. Snyder M. A. (2009). Niches, models, and climate change: assessing the assumptions and uncertainties. Proc. Natl. Acad. Sci.106, 19729–19736. doi: 10.1073/pnas.0901639106
42
Yen P. P. Sydeman W. J. Hyrenbach K. D. (2004). Marine bird and cetacean associations with bathymetric habitats and shallow-water topographies: implications for trophic transfer and conservation. J. Mar. Syst.50, 79–99. doi: 10.1016/j.jmarsys.2003.09.015
43
Younger J. L. Emmerson L. M. Miller K. J. (2016). The influence of historical climate changes on Southern Ocean marine predator populations: a comparative analysis. Global Change Biol.22, 474–493. doi: 10.1111/gcb.2016.22.issue-2
Summary
Keywords
South Shetland Island, climate change, top predators, suitable habitat, Areas of Ecological Significance (AESs)
Citation
Dai Y, Yan D, Liu Y, Zhong M, Gao M, Cheng H, Deng W and Wu F (2025) Predicted habitat and areas of ecological significance shifts of top predators in the South Shetland Islands under climate changes. Front. Mar. Sci. 12:1554232. doi: 10.3389/fmars.2025.1554232
Received
01 January 2025
Accepted
24 March 2025
Published
22 April 2025
Volume
12 - 2025
Edited by
Simon Morley, British Antarctic Survey (BAS), United Kingdom
Reviewed by
Periyadan K. Krishnakumar, National Center for Wildlife, Saudi Arabia
Ajit Kumar Mohanty, Indira Gandhi Centre for Atomic Research (IGCAR), India
Updates
Copyright
© 2025 Dai, Yan, Liu, Zhong, Gao, Cheng, Deng and Wu.
This is an open-access article distributed under the terms of the Creative Commons Attribution License (CC BY). The use, distribution or reproduction in other forums is permitted, provided the original author(s) and the copyright owner(s) are credited and that the original publication in this journal is cited, in accordance with accepted academic practice. No use, distribution or reproduction is permitted which does not comply with these terms.
*Correspondence: Yufei Dai, daiyufei@pric.org.cn; Fuxing Wu, wufuxing@tio.org.cn
†These authors have contributed equally to this work and share first authorship
Disclaimer
All claims expressed in this article are solely those of the authors and do not necessarily represent those of their affiliated organizations, or those of the publisher, the editors and the reviewers. Any product that may be evaluated in this article or claim that may be made by its manufacturer is not guaranteed or endorsed by the publisher.