 Isabel M. Moyer
 Adrienne Copeland
 Katharine Egan
 Allen G. Collins
- 1Department of Marine Science, Eckerd College, St. Petersburg, FL, United States
- 2National Oceanic and Atmospheric Administration Ocean Exploration, Silver Spring, MD, United States
- 3National Oceanic and Atmospheric Administration Regional Collaboration Network, Key West, FL, United States
- 4National Systemics Lab, National Oceanic and Atmospheric Administration Marine Fisheries Research Service, Washington, DC, United States
- 5Smithsonian National Museum of Natural History, Department of Invertebrate Zoology, Washington, DC, United States
The midwater ocean (200 m depth to the seafloor) is the largest biome on the planet, supporting a large percentage of global ocean biomass. Difficulties in midwater exploration constrain knowledge about the organisms and ecology of the critical ecosystems it contains. Pacific Ocean expeditions by NOAA Ocean Exploration explored the faunal distributions of many water column taxa, including continued characterization of a zone of aggregated midwater fauna known as the deep scattering layer (DSL). In 2016, NOAA Ocean Exploration conducted a series of remotely operated vehicle (ROV) dives in and around the Marianas Trench. Four of these dives included midwater transects, ranging in depths from 275 to 4000 m. These were the first midwater explorations conducted in the Marianas region. These dives included a deep dive in the trench (482–4000 m) and one dive centered around a hydrothermal vent cloud (275–408 m). Taxonomic annotations of video footage were used to calculate organismal abundances and Shannon-Weiner diversity indices for each transect, partitioned by depth. Higher diversity and richness levels were found in transects within the deep scattering layer (DSL) than in transects outside of the DSL; however, there was no difference in abundance between transects within, above, and below the DSL. Lower levels of diversity were found inside a hydrothermal vent cloud versus outside. This novel exploration furthers current understanding of the diversity and abundance of deep-ocean species in the Marianas region, provides a baseline for faunal distribution trends that can be referenced in future exploration, and enables predictions of midwater ecosystem diversity in global deep-sea trench environments.
1 Introduction
Functionally, the midwater refers to the volume of the pelagic ocean between 200 meters and the seafloor interface and accounts for more than 90% of the global biosphere, making up a large portion of global biomass (Drazen et al., 2020; Haddock and Choy, 2024). The midwater spans over many pelagic depth zones, encompassing the mesopelagic (200–1000 m), bathypelagic (1000–4000 m), abyssopelagic (4000–6000 m), and hadopelagic (6000+ m) in some regions. Some surveys estimate that the biomass of fish living in the midwater is hundreds of times larger than the annual global fish catch (Drazen et al., 2020); this does not include the other organisms that live in the water column (such as crustaceans, gelatinous organisms, and other non-fish plankton). A ubiquitous feature of midwater organism distribution is the presence of at least one deep scattering layer (DSL), or area of concentrated biomass that can be seen on acoustic imaging software (Song et al., 2021). The base of the DSL food web is an aggregation of micronekton, including small fishes, crustaceans, gelatinous organisms, and free-swimming molluscs such as cephalopods (Brodeur et al., 2005; Song et al., 2021). Because these layers represent an abundance of food in an otherwise oligotrophic environment, larger organisms can also be observed within the layer boundaries (Barham, 1966; Thys et al., 2015). The boundaries of DSL movement are often controlled by environmental conditions including dissolved oxygen, light intensity, chlorophyll concentration, and temperature. In addition, the observed depths of migrating organisms can differ geographically (Song et al., 2022). Many species found in the DSL also exhibit diel vertical migration, a phenomenon where smaller prey species ascend in the water column to feed in the epipelagic (0–200 m) at night and descend to the mesopelagic (200–1000 m) to hide from predators during the day (Barham, 1966; Song et al., 2021).
The DSL plays an important role in fisheries management and climate change mitigation. Vertically migrating fauna are often economically important, either directly being harvested for food or indirectly as components of the food web supporting other fishery species; the micronekton in the DSL supports many commercial fishes (e.g. tuna, billfish, sharks) (Song et al., 2021). The vertically migrating species of the DSL can also play a role in nutrient cycling and carbon sequestration, following the same processes of the mesopelagic species (Song et al., 2021; Tinta et al., 2021; Burd and Thomson, 2022). Midwater and benthopelagic fishes have been shown to play a large role in the global carbon cycle. The feeding behaviors of these fish are key in capturing carbon from the shallower levels of the midwater and retaining it below the remineralization zone (the threshold where carbon in dead cells can re-dissolve into the water) (Trueman et al., 2014). This carbon will then sink to the bottom of the ocean, where it is added to long-term seafloor storage and eventually sequestered into the sediment. Carbon is also sedimented when midwater organisms die and their carcasses sink to the seafloor; recent studies have indicated that gelatinous zooplankton alone could contribute more than 500 million metric tons of carbon to the seafloor annually (Turner, 2015; Luo et al., 2020).
Despite its functional importance and critical role as one of the largest marine habitats on Earth, the midwater and deep sea are relatively unexplored and not well understood due to their inaccessibility (Webb et al., 2010). The challenges of midwater exploration may result in limited understanding of midwater organisms. Acoustic technologies can give an idea of total biomass in these regions but cannot distinguish between types of organisms. Water column net transects often produce high numbers of robust organisms such as fish and crustaceans; however, this sampling method often destroys more delicate gelatinous fauna. Since most of the biomass seen in the water column is made up of gelatinous organisms such as cnidarians and ctenophores (Lindsay and Hunt, 2005; Haddock and Choy, 2024), damage during collection may lead to severe under-calculations of the diversity in the water column.
Previous ROV studies in the Marianas Trench and other deep-sea trenches have established trends in deep-sea faunal communities based on benthic observations (Gallo et al., 2015; Levin et al., 2016). One commonality is the dominance of species such as Actinaria, Polychaeta, Isopoda, Amphipoda, and Holothuria, especially in the hadopelagic (6000+ m). In the bathypelagic (1000–4000 m), the dominant taxa on the seafloor tend to be Porifera, Anthozoans (Hexacorallia and Octocorallia), Crinoidea, and Holothuria; there is typically a lack of fish, decapod crustaceans, and echinoderms that are not holothurians (Gallo et al., 2015). Notable topographical features such as hydrothermal vents may also impact the faunal diversity seen in these trenches. Despite these descriptions of seafloor communities, very little midwater exploration has been done in deep-sea trenches, particularly around active venting sites.
In 2016, ocean exploration missions conducted by NOAA Ocean Exploration in the Marianas region sought to bridge some of the knowledge gaps in this deep-sea environment. In this unprecedented study, our objective was to characterize organisms (primarily macroplankton and nekton) throughout the midwater in the Marianas region from data collected on these missions and analyze patterns of faunal diversity and abundance.
2 Methods
NOAA Ocean Exploration was founded in 2001 as a United States federal program dedicated to exploring the deep ocean through mapping and exploration. One method of doing this uses remotely operated vehicles (ROVs) and the capabilities of NOAA Ship Okeanos Explorer. In 2016, NOAA and a community of scientific partners explored the Marianas region as part of the Campaign to Address Pacific monument Science, Technology, and Ocean Needs (CAPSTONE) (Kennedy et al., 2019). During one expedition (EX1605L3, Deepwater Exploration of the Marianas; Cantwell and Newman, 2016; Cantwell et al., 2021), the dual-bodied ROV Deep Discoverer conducted 22 dives, spanning a variety of different locations and depths throughout the Marianas region. Four of these dives included midwater transects: Daikoku Hydrothermal Vent, Maug Volcano, Petite Spot Volcano, and Subducting Guyot 1 (Ford and Netburn, 2017; Supplementary Figure S1).
During these dives, the ROV descended to a predetermined depth for preliminary benthic exploration followed by midwater exploration conducted on the ascent. Transect depths were predetermined based on features of interest in the midwater, time available for exploration, and the location of DSLs. The ROV first proceeded to the deepest predetermined midwater depth and conducting further transects in an ascending stepwise fashion (Supplementary Table S1). Acoustic data, collected with a hull-mounted Simrad EK60 echosounder calibrated according to standard methods (Foote et al., 1987; Demer et al., 2015; Copeland and Lobecker, 2021), were utilized to target the DSL depth on each dive. Upon completion of the transect, the ROV ascended to the next shallower depth to conduct another transect. Further transect depths were selected during the dive using the live echosounder data. The transect times were variable and decided by dividing the time left in the ascent of the ROV dive between the planned number of midwater transects. The nine transects at Daikoku (Dive 9) were conducted in a stepladder fashion through a hydrothermal vent cloud with increasing distance from the vent source. The Maug (Dive 3), Petite Spot (Dive 18), and Guyot 1 transects (Dive 16) were conducted laterally as opposed to stepwise, with one forward track per dive (dive depths and transect times are summarized in Supplementary Table S1).
During transects, an Insite Pacific “Zeus Plus” HD video camera with a ROS tilt rotator was utilized to capture 1920 x 1080 pixel resolution video at a 29.97i frame rate. For close-up views of organisms, an Insite Pacific “Titan Plus” HD Pan/Tilt/Zoom camera was used. A light bar with 144,000 total lumens, which could be dimmed for better viewing, was used to illuminate the transects (Ford et al., 2020). Dive footage from the main ROV Deep Discoverer’s camera was uploaded and annotated in real-time and post-expedition with SeaTube V2 (Ocean Networks Canada, Victoria, Canada) (video data access links included in Supplementary Table S1). The midwater transect footage was annotated further and quality-checked by the authors in June 2022. Through this quality-checking process, each organism (primarily macroplankton and nekton, due to the sensitivity of the camera array) was annotated to the lowest possible taxonomic level at the first appearance in the video recording using the World Register of Marine Species (WoRMS) database (for examples, see Figure 1). If an organism could not be visually identified by the authors, video screenshots and SeaTube links with timestamps were provided to relevant subject matter experts with NOAA Ocean Exploration and the Smithsonian National Museum of Natural History. Organism annotations to the lowest possible taxonomic level were used in the diversity and abundance analysis.
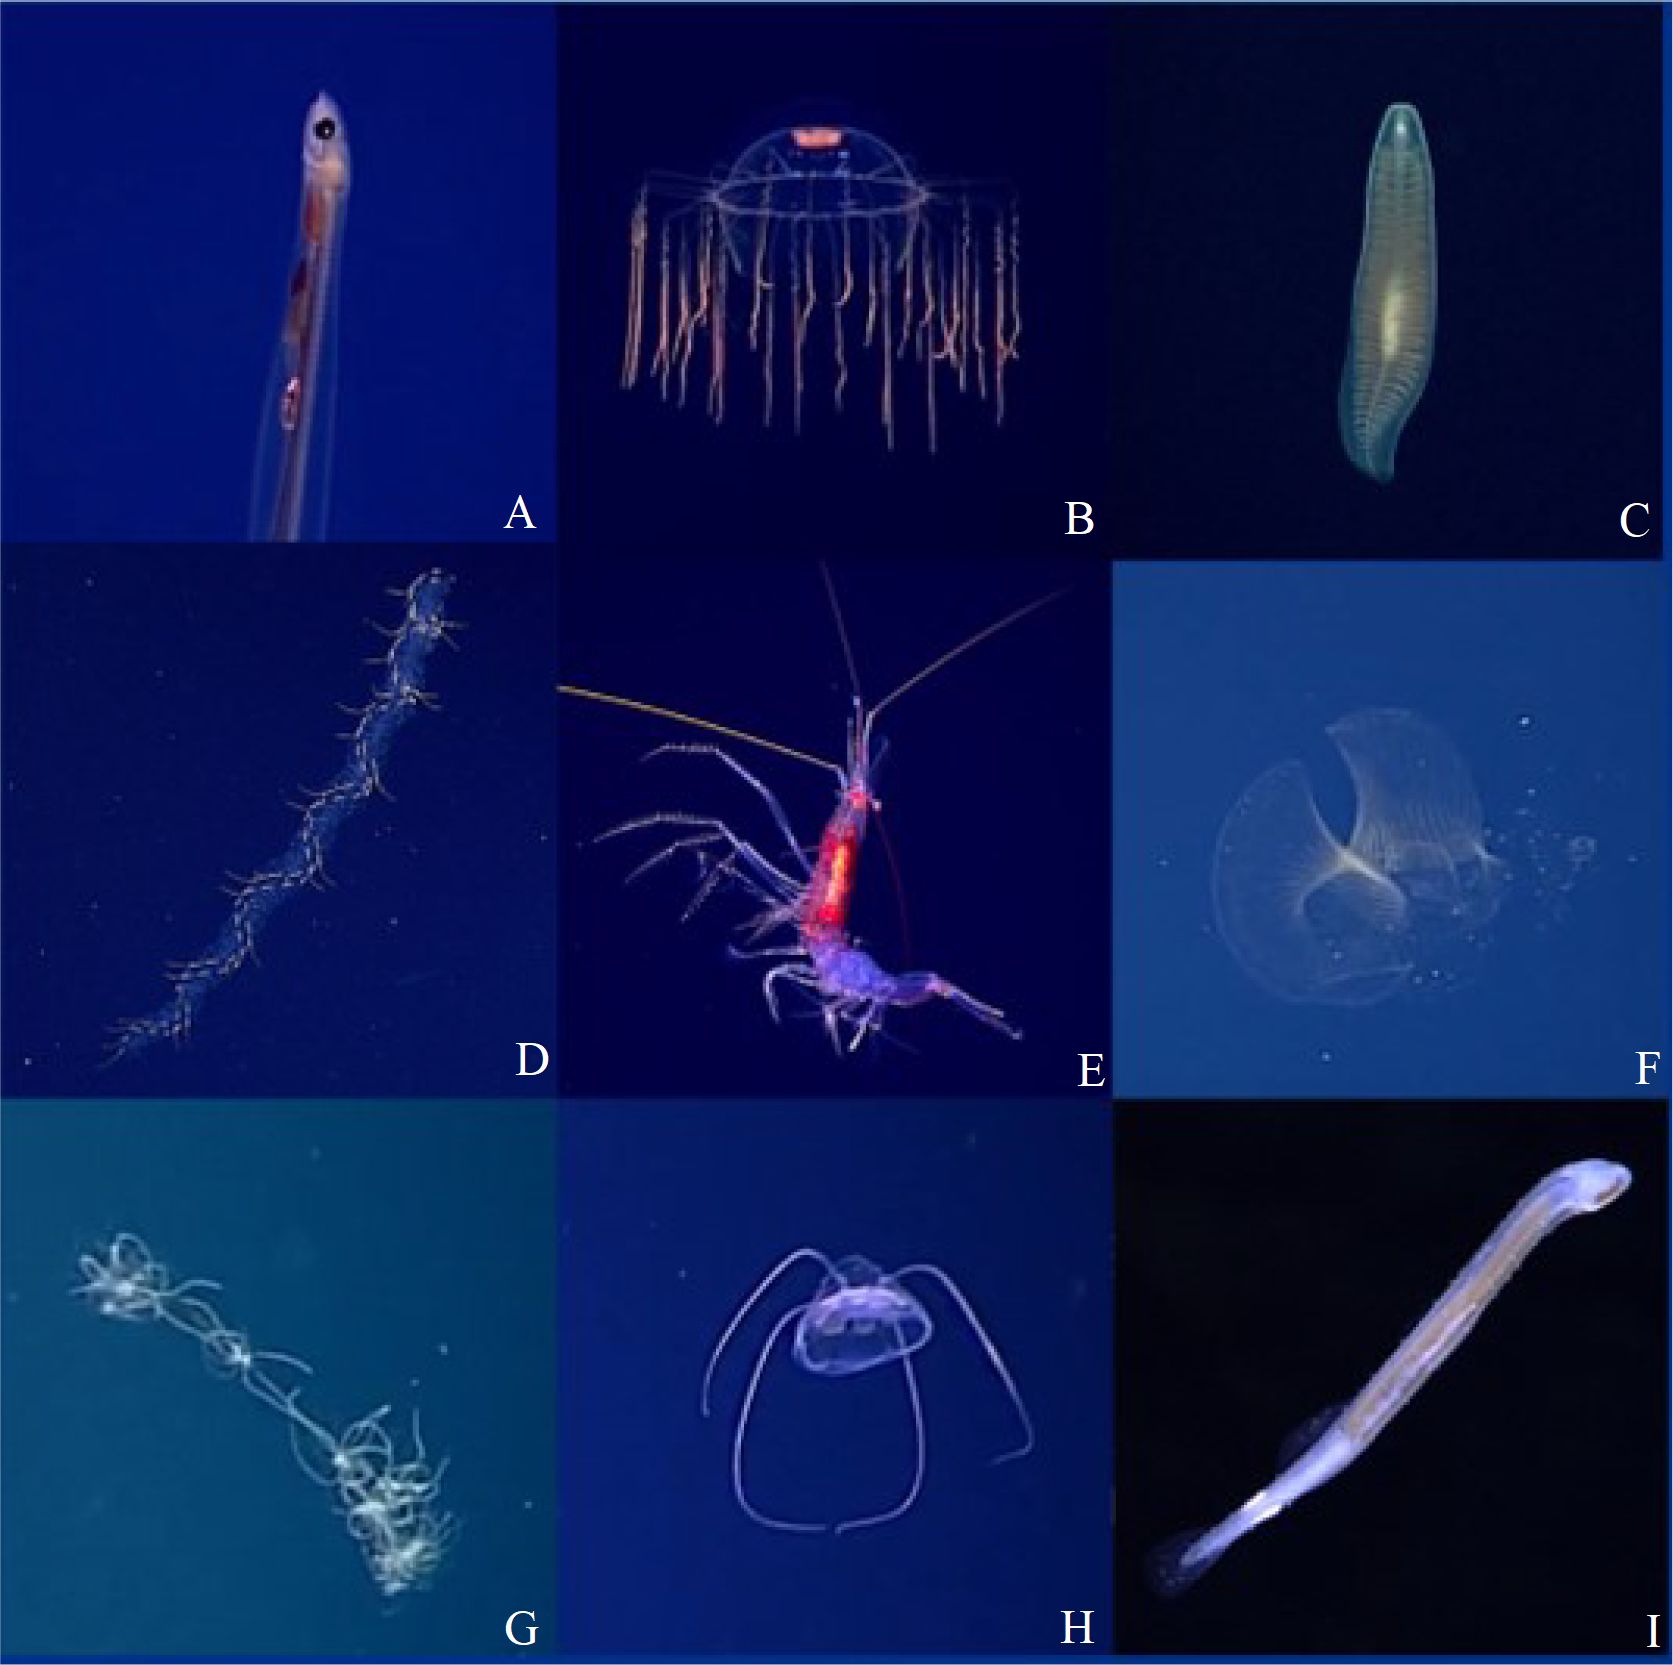
Figure 1. Organisms observed on ROV footage during the midwater exploration portions of EX1605, Deepwater Exploration of the Marianas. (A) a ray-finned fish (Actinopterygii); (B) a hydrozoan jellyfish; (C) a pelagonemertean worm, most likely genus Dinonemertes; (D) a siphonophore; (E) an eucarid shrimp; (F) a larvacean house (Appendicularia); (G) a group of coelodendridae; (H) a narcomedusid jellyfish; (I) a chaetognath.
Organismal diversity was calculated with the Shannon-Wiener diversity index, with s being the number of taxa present, and representing the proportion of individuals belonging to any one taxon. Once the diversity (H) was found for each transect, it was divided by the time in minutes per transect to standardize the diversity values across variable transect times. The result was one standardized value (H/min) per transect. An H value of 0.00 indicated there were no organisms seen, or all of the organisms seen were of the same species; therefore, having no diversity on that transect. The abundance (or number of individuals found in a certain area) of organisms present was also calculated for each transect using , the total number of organisms seen on camera divided by the total time on transect. This resulted in one standardized abundance number (A/min) per transect.
To perform statistical analysis, dives 3, 16, and 18 were combined into one dataset to compare diversity and abundance indices as a function of depth across all three sites. Each transect was then categorized as being above (n=2), below (n=10), or within (n=3) the DSL across the three dives using Echoview hydroacoustic processing software (Echoview software, Hobart, Australia). For both diversity and abundance data, a Shapiro-Wilk test of normality was performed to evaluate for normality. The diversity dataset was determined to have a normal distribution (p = 0.235). Levene’s test was also used to test the assumption of homoscedasticity, with the data having equal variances (p = 0.603). A one-way repeated-measures ANOVA was chosen due to the normality of the dataset and the repeated location of the dive transects, which potentially allowed for overlap in data collection between transects. Three one-way repeated-measures ANOVA tests were run; the first categorized the transects as “within” or “outside” of the DSL, and the second categorized the transects as “above,” “within,” or “below” the DSL. This transect reclassification was done to compare diversity based on the position of the DSL and the relative depth. To ensure that epipelagic fauna would not impact the test results, the third one-way repeated measures ANOVA was performed to compare diversity indices of dives “within” and “below” the DSL, with the dives “above” the DSL excluded. The same analysis process was applied to the abundance data. However, a Kruskal-Wallace test was applied for abundance instead of the ANOVA test because the data were found to be non-normal (p = 0.00018). In order to gain a more complete understanding of faunal trends in and around the DSL, a species richness analysis was run. Dives were categorized as “above,” “within,” or “below” the DSL and the data were rarefied in order to gain a standardized value for species richness. Species accumulation curves were then calculated separately for each “site” (location relative to DSL position).
Dive 9 (Daikoku Hydrothermal Vent) was considered separately due to the unique nature of exploring the midwater in a vent environment. A qualitative assessment of organismal diversity and abundance was performed at this location as the data collected were insufficient to perform a statistical test. All statistical analyses were conducted using R v 4.2.0 (R software, Vienna, Austria), and statistical test results were considered significant at α = 0.05 (R Core Team, 2022).
3 Results
Across all 78 transects, 501 organisms in 22 unique taxa were observed and annotated (Supplementary Table S2). The organisms observed on the ROV video footage were categorized into 37 groups based on their taxonomic organization (Table 1; for abundance of respective taxa seen on each transect, see Supplementary Table S2). The most common genera observed on camera were crustaceans (335 individuals – 67%, including Sergestidae, Caridea, and Copepoda), hydrozoans (hydromedusae and siphonophores, 37 individuals – 7%), and Actinopterygii (ray-finned fishes, 32 individuals – 6%). Four taxonomic groups were seen across all four dive sites: Appendicularia (larvaceans), Hydrozoa, Chaetognatha (arrow worms), and Salpidae (pelagic tunicate salps) (Supplementary Table S2).
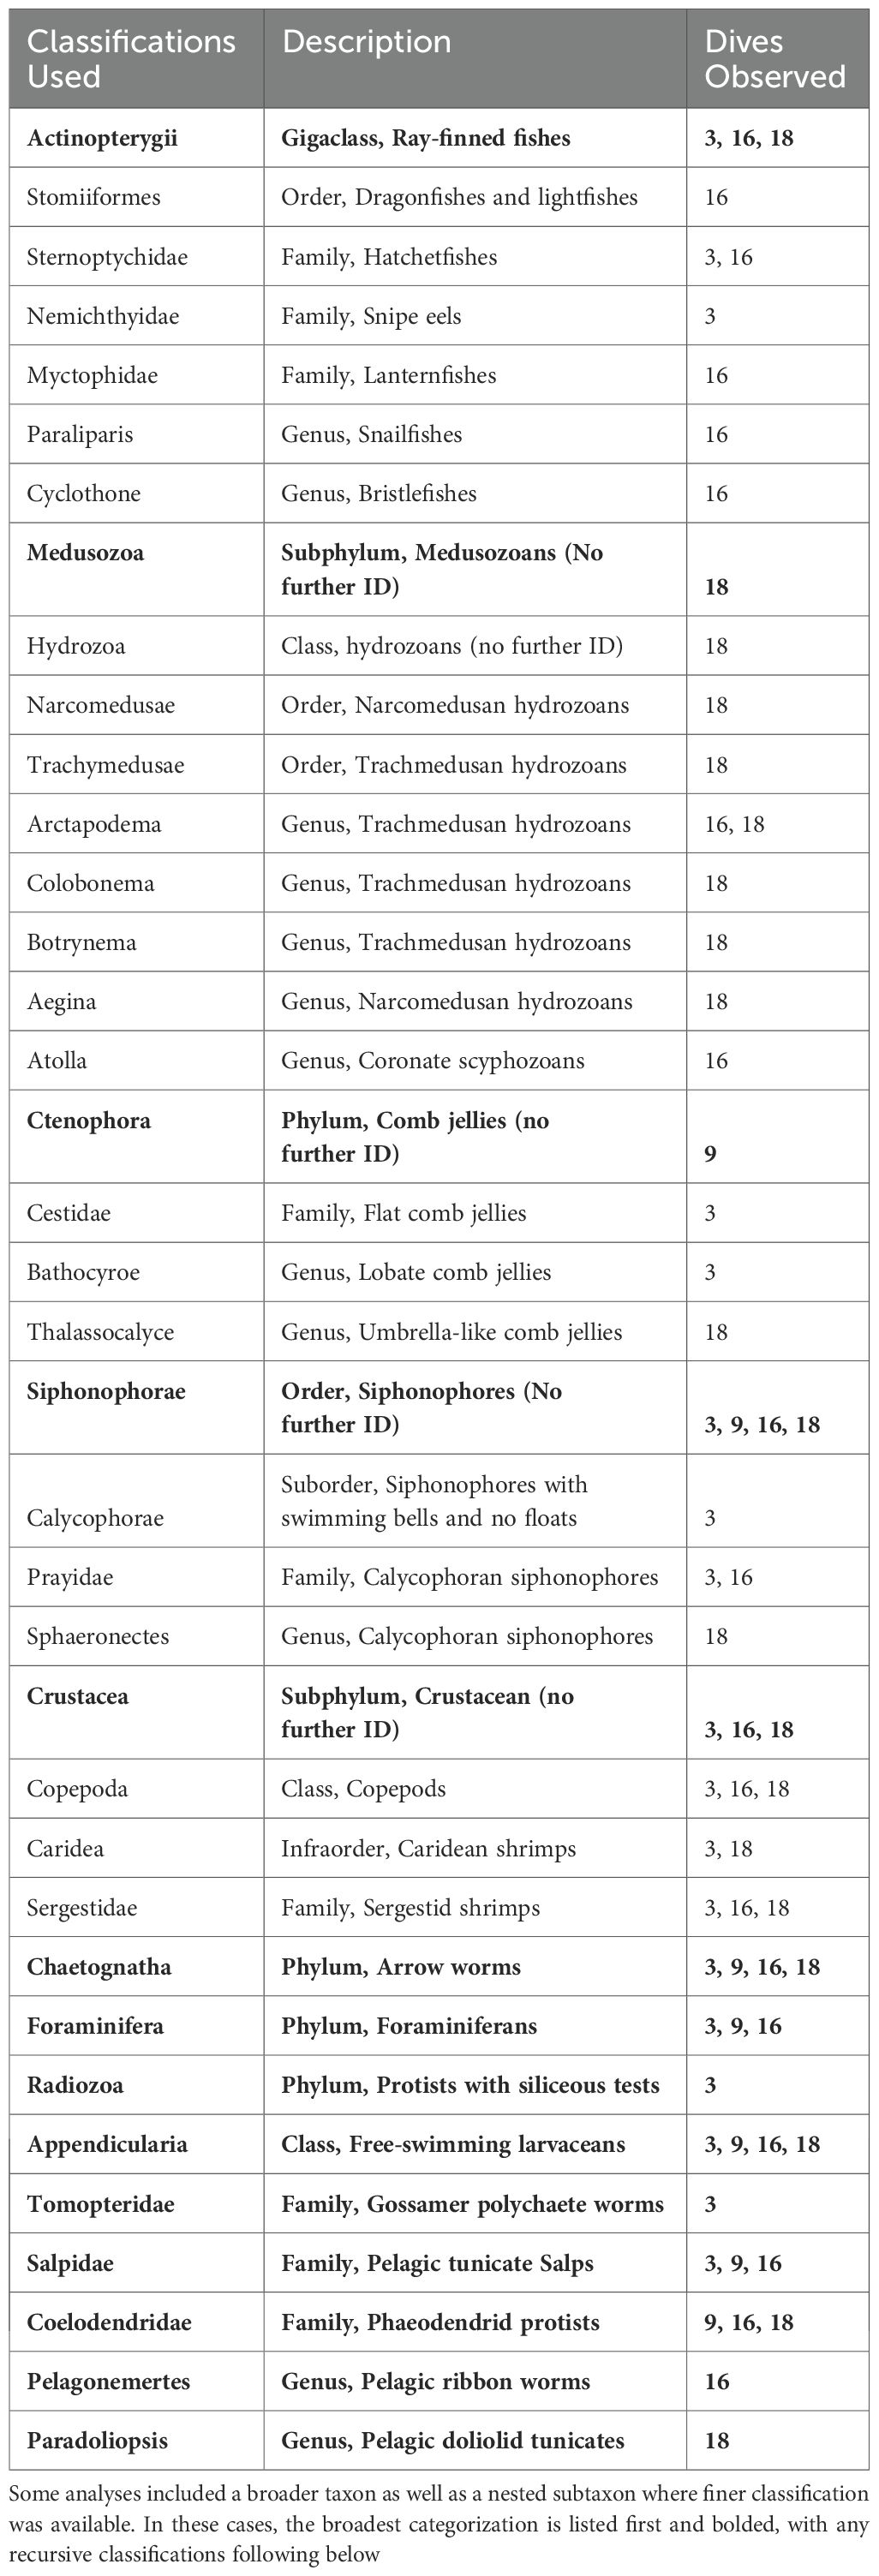
Table 1. Organismal taxa used to calculate the Shannon-Wiener Diversity Index of each transect, as well as a description of each organismal taxon and on which dives each taxon was observed.
Overall, diversity (H) ranged from 0.000 to 0.338 H/min. The transect with the highest H value (0.338 H/min, dive 9) included four different taxa in four minutes (Supplementary Table S2). The diversity value ranged between 0.023 – 0.197 for dive 3, 0.000 – 0.338 for dive 9, 0.000 – 0.427 for dive 16, and 0.064 – 0.230 for dive 18, with dive 9 having the highest single-transect diversity and dive 16 having the lowest (Figure 2; Supplementary Table S4). The overall abundance (A) ranged from 0.000 to 14.69 organisms per minute (A/min). For dive 3, the abundance ranged from 1.50 – 3.77, dive 9 ranged from 0.00 – 1.75, dive 16 ranged from 0.11 – 3.50, and dive 18 ranged from 0.38 – 14.69, with dive 9 also having the highest abundance and dive 16 having the lowest (Figure 2; Supplementary Table S4).

Figure 2. Diversity and abundance indices of 15 midwater transects at depths between 450–4000 m in the Marianas region during dives 3, 16, and 18 for EX1605L3. The symbols represent where the transects were collected compared to the deep scattering layer (DSL) location (within or outside). The colors represent the transect dive number (blue = dive 3, red = dive 16, green = dive 18). There was a statistically higher level of diversity found on transects inside the DSL, but no significant difference in abundance within and outside the DSL.
3.1 DSL analysis
The transects taken inside of the DSL had a significantly higher level of diversity than the transects outside of the DSL (F = 5.281, p = 0.039). However, placement of the transect “above” or “below” the DSL had no effect; when dives were classified as “within,” “above,” or “below” the DSL, no statistically significant differences were found (F = 2.507, p = 0.123). This same process was applied to the calculated abundance values for each transect and no significant difference was found in the abundance data when classified as within and outside of the DSL (χ2 = 0.52177, df = 1, p = 0.4701; Figure 2). During the species richness analysis, it was found that the transects within the DSL had the highest richness, followed by the transects below the DSL; transects taken above the DSL had the lowest species richness (Figure 3). The correction for time applied to the organismal observations lends robusticity to these results; however, none of the curves indicated that the sampling effort was sufficient to reach an asymptotic species richness for any of the transect positions.

Figure 3. Species accumulation curves calculated for transects positioned “above,” “within,” or “below” the deep scattering layer (DSL). The highest species richness was found within the DSL transects, followed by transects taken below the DSL; the lowest species richness was found in transects above the DSL.
3.2 Hydrothermal vent analysis
Dive 9 at the Daikoku Hydrothermal Vent had nine transects of increasing distance (0–133 m) from the vent source (Supplementary Table S3). For transects within the vent cloud, there was no apparent diversity (either no organisms spotted or only one taxon spotted); however, there was diversity seen in two transects that extended outside of the vent cloud (0.148 H/min at 350 m and 0.338 H/min at 275 m). The transects at 400, 396, 395, and 325 meters had no organisms spotted (no abundance). The transect at 408 m had an abundance of 0.17 A/min, 390 m had 0.38 A/min, 350 m had 1.27 A/min, 300 m had 0.25 A/min, and 275 m had 1.75 A/min (Supplementary Table S3).
4 Discussion
This study is among the first published explorations of the diversity and abundance of midwater fauna in the Marianas region. We found that the position of the DSL may have some significant effect on organismal diversity in the water column, but not on abundance. Our analyses detected significantly greater diversity within the DSL, but no significant difference in abundance. In addition, we found that midwater organismal diversity and abundance may be influenced by the presence of an active hydrothermal vent cloud.
For future research, it will be important to continue to perform midwater ROV transects with a focus on features of interest such as hydrothermal vents, methane seeps, sulfur lakes, and non-venting seamounts. Repeating this study using the advanced ocean exploration technology developed since the 2016 expedition would also be advantageous. For example, acoustically-derived abundance estimates and environmental DNA (eDNA) may be able to give clarity on the distribution patterns of this region (Laroche et al., 2020; Govindarajan et al., 2021). eDNA metabarcoding, which allows for the community analysis of an area using cellular debris taken from water samples, is now used in deep-sea studies (Laroche et al., 2020). These environmental sampling methods are often faster, more cost-effective, and less invasive than traditional surveying methods (Burian et al., 2021). However, they are also dependent on having reliable genetic reference datasets associated with well identified specimens (McElroy et al., 2020; Govindarajan et al., 2021; Dan et al., 2024). eDNA sampling may also include DNA that has cascaded from epipelagic depths (Govindarajan et al., 2021); relying solely on this sampling method may be unsuitable for a study focusing strictly on deep-sea ecology. At the time of surveying for this study, eDNA was not yet being utilized on the Okeanos Explorer. By integrating eDNA investigation into future studies, we may be able to gain a better understanding of midwater diversity by filling in knowledge gaps present in ROV survey studies (such as avoidance behavior or camera limitations) (Laroche et al., 2020). We recommend a holistic approach that integrates multiple approaches (such as eDNA, ROV video transects, organismal sampling, and acoustic sampling) to estimate abundance and diversity in the midwater.
It is crucial to continue integrative midwater exploration, as these findings may establish interest in future research as well as set a baseline for further surveys in similar environments. Midwater research has topical, pressing implications for current issues, such as global overfishing and climate change mitigation. We must continue exploration into this region to further human understanding of this pivotal ecosystem and how it impacts other life on Earth.
4.1 DSL analysis
Overall, the most abundant faunal taxa observed on camera were crustaceans, hydrozoans, and Actinopterygii. Appendicularia (larvaceans), Hydrozoa (hydromedusae and siphonophores), Chaetognatha (arrow worms), and Salpidae (pelagic tunicate salps) were seen at all four dive sites. These findings align with benthic surveys done in the region, which found high abundances of Actinopterygii, medusae, and Salpidae in deep-sea trench environments (Vinogradov and Shushkina, 2002; Tunnicliffe et al., 2013). There was a notable lack of phyonect siphonophores seen during this study; historical sources suggest that DSL stratification may be at least partially credited to these organisms due to the gases present in their swimming bells (Barham, 1963; Davison et al., 2015). Perhaps more noteworthy are the taxa that were only observed once during surveying: Polychaeta (polychaete worms), Radiozoa (Radiolarians), Schyphozoa (true jellyfishes), and Hoplonemertea (nemertean worms). One notable finding was the pelagonemertean worm seen on Dive 16, most likely belonging to the genus Dinonemertes; currently, there are no records of Dinonemertes in the Marianas region (Figure 1). This organism may be related to Dinonemertes shinkaii, which was first identified in the Japan Trench (Kajihara and Lindsay, 2010). New expeditions that include collection of specimens should be conducted to determine if this is a novel species and/or range extension of a currently known species for the region. Such work would likely detect other new pelagic species and range extensions into the Marianas region.
The DSL is typically characterized by a high density of organisms (Vinogradov and Shushkina, 2002; Stefanoudis et al., 2019), so the highest organismal diversity and abundance was expected within the DSL and the lowest diversity and abundance below the DSL. There was a higher level of diversity and species richness seen within the DSL transects, but organismal abundance remained the same throughout the water column. Additionally, we found that there was no significant difference in diversity in transects above or below the DSL (Båmstedt et al., 2003; Brodeur and Yamamura, 2005). This is consistent with other midwater studies that have described a higher concentration of organisms within the DSL (Vinogradov and Shushkina, 2002; Lindsay and Hunt, 2005; Song et al., 2022). However, it is notable that these historical sources describe increased diversity and abundance within the DSL. This study found that organisms seen within the DSL transects were more diverse and species-rich, but not more abundant; organismal abundance was not significantly changed due to DSL positioning. Previous studies also found lower diversity in deep trench environments (Vinogradov and Shushkina, 2002), which may be consistent with the decreased diversity found outside of the DSL in this case. Benthic surveys done in the Marianas Trench (such as Gallo et al., 2015) did not find a clear relationship between depth and biodiversity; this may also suggest that the diversity and abundance of organisms outside of the DSL stays consistent with depth.
There are several factors that may explain these results, but more investigation is needed to further elucidate patterns of abundance and diversity. Consistent abundance values within and below the DSL could support previous suggestions that historical estimates of biological abundance in the deep sea may be underestimated (Govindarajan et al., 2021). It may also be the case that biomass in the DSL has been historically overestimated due to the higher-than-average acoustic reflectance of common DSL organisms (such as Crustacea and Actinopterygii) (Båmstedt et al., 2003; Brodeur and Yamamura, 2005). However, it is possible that the sampling design lacked the sensitivity to pick up on higher abundance in the DSL due to factors like camera limitations and ROV avoidance. A future analysis of the mesopelagic EK60 acoustic data may help to more accurately measure abundance below the DSL by approximating the biomass present. The species accumulation curves did suggest that the sampling effort was not sufficient to gain a full understanding of the midwater taxa present in this environment. Insufficient sampling effort also posed a statistical problem; a multiple test correction (e.g. the Bonferroni correction) would adjust for using multiple statistical tests on the same dataset. However, applying this correction may overcompensate by significantly reducing the threshold for statistical significance, leading to high potential for type II error. A larger dataset would allow for more robust multifactor analysis. More sampling with diverse exploration techniques, especially those that employ more sensitive sampling techniques such as eDNA, are needed to explore these apparent patterns.
4.2 Hydrothermal vent analysis
For the hydrothermal analysis (dive 9), we suspected that there would be more organisms seen in the vent cloud than in the surrounding water due to the important role that hydrothermal vents play as the base of the benthic chemosynthetic food web (Levin et al., 2016). Hydrothermal vents are often surrounded by a higher diversity of benthic life than the surrounding seafloor (Kojima and Watanabe, 2015). Instead, there appeared to be less diversity and less abundance in and around the vent cloud within the water column.
This could be due to either the elevated temperature or the chemical composition of the vent cloud not being conducive to midwater life (Schander et al., 2010). It is also possible that there was microbial life present in the vent cloud since many chemosynthesizers are microbes (Limen and Juniper, 2006), which would be too small to be detected on the ROV cameras and therefore not accounted for in this study. However, this does not explain the lack of visible fauna in the vent column and surrounding area. It is also possible that the fundamental difference between benthic and midwater environments could help explain this contrast. Benthic organisms have more ability to remain in place around the vent source, allowing for adaptation to these unique microhabitats. In contrast, the constant movement present in the midwater would remove organisms before selection could act, preventing species from becoming specialized to the vent cloud ecosystem. It may also be the case that nektonic organisms simply choose to move to a more favorable temperature range or follow food to other locations. There were not enough data in this study to statistically determine diversity or abundance trends surrounding the vent cloud; therefore, more exploration must be done in this unusual microhabitat.
5 Conclusion
This expedition was among the first known midwater explorations done in the Marianas Trench and within an active venting cloud. Therefore, these discoveries serve as a basis for establishing trends in midwater faunal diversity. The purpose of this investigation was to investigate faunal distribution patterns in the Marianas midwater and to compare these patterns with environmental determinants. It was found that organismal diversity and richness may be impacted by the position of the DSL, but that abundance remains consistent throughout the water column. In addition, both diversity and abundance may have been impacted by the presence of a hydrothermal vent cloud. More research is needed to determine why these patterns may have occurred, but these preliminary findings are the first step in understanding this unique habitat.
Data availability statement
All NOAA Ocean Exploration ROV footage and annotations are publicly accessible and can be viewed on Ocean Networks Canada’s SeaTube V3 platform (https://data.oceannetworks.ca/ExpeditionManagement).
Author contributions
IM: Validation, Methodology, Investigation, Formal Analysis, Data curation, Conceptualization, Writing – review & editing, Writing – original draft, Visualization. AC: Writing – review & editing, Supervision, Resources, Project administration, Methodology, Investigation, Funding acquisition, Conceptualization. KE: Writing – review & editing, Visualization, Validation, Supervision, Software, Project administration, Methodology, Investigation, Formal Analysis, Conceptualization. AC: Writing – review & editing, Supervision, Investigation, Data curation.
Funding
The author(s) declared that financial support was received for this work and/or its publication. This work was funded through the NOAA Ernest F. Hollings fellowship program.
Acknowledgments
The authors thank Ashley Marranzino for assistance in annotating video footage, as well as Dhugal Lindsay and Kenneth Sulak for helping with organismal identification. We also want to thank the crew and officers of NOAA Ship Okeanos Explorer and the mission team of EX1605L3 that collected the data used in this study.
Conflict of interest
The authors declared that this work was conducted in the absence of any commercial or financial relationships that could be construed as a potential conflict of interest.
Generative AI statement
The author(s) declared that generative AI was not used in the creation of this manuscript.
Any alternative text (alt text) provided alongside figures in this article has been generated by Frontiers with the support of artificial intelligence and reasonable efforts have been made to ensure accuracy, including review by the authors wherever possible. If you identify any issues, please contact us.
Publisher’s note
All claims expressed in this article are solely those of the authors and do not necessarily represent those of their affiliated organizations, or those of the publisher, the editors and the reviewers. Any product that may be evaluated in this article, or claim that may be made by its manufacturer, is not guaranteed or endorsed by the publisher.
Supplementary material
The Supplementary Material for this article can be found online at: https://www.frontiersin.org/articles/10.3389/fmars.2025.1556454/full#supplementary-material
References
Båmstedt U., Kaartvedt S., and Youngbluth M. (2003). An evaluation of acoustic and video methods to estimate the abundance and vertical distribution of jellyfish. J. Plankton Res. 25, 1307–1318. doi: 10.1093/plankt/fbg084
Barham E. G. (1963). Siphonophores and the deep scattering layer. Science 140, pp.826–pp.828. doi: 10.1126/science.140.3568.826
Barham E. G. (1966). Deep scattering layer migration and composition: observations from a diving saucer. Science 151, 1399–1403. doi: 10.1126/science.151.3716.1399
Brodeur R. D., Seki M. P., Pakhomov E. A., and Suntsov A. V. (2005). Micronekton–What are they and why are they important. Pices Press 13, 7–11.
Burd B. J. and Thomson R. E. (2022). A review of zooplankton and deep carbon fixation contributions to carbon cycling in the dark ocean. J. Mar. Syst. 236, 103800. doi: 10.1016/j.jmarsys.2022.103800
Burian A., Mauvisseau Q., Bulling M., Domisch S., Qian S., and Sweet M. (2021). Improving the reliability of eDNA data interpretation. Mol. Ecol. Resour. 21, 1422–1433. doi: 10.1111/1755-0998.13367
Cantwell K. and Newman J. (2016). Okeanos Explorer ROV dive summary, EX1605L3, June 26, 2016 (Silver Springs, MD: National Oceanic and Atmospheric Administration).
Cantwell K., Pomponi S., Fryer P., Sowers D., Cantelas F., Netburn A., et al. (2021). Cruise report: EX-16–05 leg 3, 2016 deepwater exploration of the marianas (ROV & Mapping) (Silver Springs, MD: National Oceanic and Atmospheric Administration).
Copeland A. and Lobecker M. (2021). 2016 NOAA ship okeanos explorer EK60 calibration report (Silver Springs, MD: National Oceanic and Atmospheric Administration).
Dan M. E., Portner E. J., Bowman J. S., Semmens B. X., Owens S. M., Greenwald S. M., et al. (2024). Using low volume eDNA methods to sample pelagic marine animal assemblages. PloS One 19, e0303263. doi: 10.1371/journal.pone.0303263
Davison P. C., Koslow J. A., and Kloser R. J. (2015). Acoustic biomass estimation of mesopelagic fish: backscattering from individuals, populations, and communities. ICES J. Mar. Sci. 72, 1413–1424. doi: 10.1093/icesjms/fsv023
Drazen J. C., Smith C. R., Gjerde K. M., Haddock S. H., Carter G. S., Choy C. A., et al. Midwater ecosystems must be considered when evaluating environmental risks of deep-sea mining. In: Proceedings of the National Academy of Sciences. Echoview software. 2013 (Hobart, Australia: Echoview software Pty. Ltd.). (2020) 117, 17455–17460.
Foote K. G., Knudsen H. P., Vestnes G., MacLennan D. N., and Simmonds E. J. (1987). Calibration of acoustic intruments for fish density estimation: a practical guide (ICES Cooperative Research Reports (CRR)). (Copenhagen: ICES).
Ford M., Bezio N., and Collins A. (2020). Duobrachium sparksae (incertae sedis Ctenophora Tentaculata Cydippida): A new genus and species of benthopelagic ctenophore seen at 3,910 m depth off the coast of Puerto Rico. Plankton Benthos Res. (Silver Springs, MD: National Oceanic and Atmospheric Administration) 15, 296–305. doi: 10.3800/pbr.15.296
Ford M. and Netburn A. N. (2017). “The 2016 midwater exploration of the Mariana Region,” in New frontiers in ocean exploration: the E/V nautilus, NOAA ship okeanos explorer, and R/V falko, 36–37.
Gallo N. D., Cameron J., Hardy K., Fryer P., Bartlett D. H., and Levin L. A. (2015). Submersible-and lander-observed community patterns in the Mariana and New Britain trenches: influence of productivity and depth on epibenthic and scavenging communities. Deep Sea Res. Part I: Oceanograph Res. Papers 99, 119–133. doi: 10.1016/j.dsr.2014.12.012
Govindarajan A. F., Francolini R. D., Jech J. M., Lavery A. C., Llopiz J. K., Wiebe P. H., et al. (2021). Exploring the use of environmental DNA (eDNA) to detect animal taxa in the mesopelagic zone. Front. Ecol. Evol. 9, 574877. doi: 10.3389/fevo.2021.574877
Haddock S. H. and Choy C. A. (2024). Life in the midwater: the ecology of deep pelagic animals. Annu. Rev. Mar. Sci. 16, 383–416. doi: 10.1146/annurev-marine-031623-095435
Kajihara H. and Lindsay D. J. (2010). Dinonemertes shinkaii sp. nov.,(Nemertea: Hoplonemertea: Polystilifera: Pelagica) a new species of bathypelagic nemertean. Zootaxa 2429, 43–51. doi: 10.11646/zootaxa.2429.1.3
Kennedy B. R., Cantwell K., Malik M., Kelley C., Potter J., Elliott K., et al. (2019). The unknown and the unexplored: Insights into the Pacific deep-sea following NOAA CAPSTONE expeditions. Front. Mar. Sci. 6, 480. doi: 10.3389/fmars.2019.00480
Kojima S. and Watanabe H. (2015). Vent fauna in the Mariana Trough. Subseafloor biosphere linked to hydrothermal systems: TAIGA concept (Tokyo, Japan: Springer). 313–323.
Laroche O., Kersten O., Smith C. R., and Goetze E. (2020). From sea surface to seafloor: A benthic allochthonous eDNA survey for the abyssal ocean. Front. Mar. Sci. 7, 682. doi: 10.3389/fmars.2020.00682
Levin L. A., Baco A. R., Bowden D. A., Colaco A., Cordes E. E., Cunha M. R., et al. (2016). Hydrothermal vents and methane seeps: rethinking the sphere of influence. Front. Mar. Sci. 3, 72. doi: 10.3389/fmars.2016.00072
Limen H. and Juniper S. K. (2006). Habitat controls on vent food webs at Eifuku Volcano, Mariana Arc. Cahiers biolo Mar. 47, 449.
Lindsay D. J. and Hunt J. C. (2005). Biodiversity in midwater cnidarians and ctenophores: submersible-based results from deep-water bays in the Japan Sea and north-western Pacific. J. Mar. Biol. Assoc. United Kingdom 85, 503–517. doi: 10.1017/S0025315405011434
Luo J. Y., Condon R. H., Stock C. A., Duarte C. M., Lucas C. H., Pitt K. A., et al. (2020). Gelatinous zooplankton-mediated carbon flows in the global oceans: a data-driven modeling study. Global Biogeochemi Cycles 34, p.e2020GB006704. doi: 10.1029/2020GB006704
McElroy M. E., Dressler T. L., Titcomb G. C., Wilson E. A., Deiner K., Dudley T. L., et al. (2020). Calibrating environmental DNA metabarcoding to conventional surveys for measuring fish species richness. Front. Ecol. Evol. 8, 276. doi: 10.3389/fevo.2020.00276
R Core Team. (2022). R: A language and environment for statistical computing (Vienna, Austria: R Foundation for Statistical Computing). Available online at: https://www.R-project.org/ (Accessed June 01, 2022).
Schander C., Rapp H. T., Kongsrud J. A., Bakken T., Berge J., Cochrane S., et al. (2010). The fauna of hydrothermal vents on the Mohn Ridge (North Atlantic). Mar. Biol. Res. 6, 155–171. doi: 10.1080/17451000903147450
Song Y., Wang C., and Sun D. (2022). Both dissolved oxygen and chlorophyll explain the large-scale longitudinal variation of deep scattering layers in the tropical Pacific Ocean. Front. Mar. Sci. 9, 782032. doi: 10.3389/fmars.2022.782032
Song Y., Yang J., Wang C., and Sun D. (2021). Spatial patterns and environmental associations of deep scattering layers in the northwestern subtropical Pacific Ocean. Acta Oceanol Sin. 41, 139–152. doi: 10.1007/s13131-021-1973-1
Stefanoudis P. V., Rivers M., Ford H., Yashayaev I. M., Rogers A. D., and Woodall L. C. (2019). Changes in zooplankton communities from epipelagic to lower mesopelagic waters. Mar. Environ. Res. 146, 1–11. doi: 10.1016/j.marenvres.2019.02.014
Thys T. M., Ryan J. P., Dewar H., Perle C. R., Lyons K., O’Sullivan J., et al. (2015). Ecology of the ocean sunfish, Mola mola, in the southern California Current System. J. Exp. Mar. Biol. Ecol. 471, 64–76. doi: 10.1016/j.jembe.2015.05.005
Tinta T., Klun K., and Herndl G. J. (2021). The importance of jellyfish–microbe interactions for biogeochemical cycles in the ocean. Limnol Oceanograph 66, 2011–2032. doi: 10.1002/lno.11741
Trueman C. N., Johnston G., O’hea B., and MacKenzie K. M. (2014). Trophic interactions of fish communities at midwater depths enhance long-term carbon storage and benthic production on continental slopes. Proc. R. Soc. B: Biol. Sci. 281, 20140669. doi: 10.1098/rspb.2014.0669
Tunnicliffe V., Tyler J., and Dower J. F. (2013). Population ecology of the tonguefish Symphurus thermophilus (Pisces; Pleuronectiformes; Cynoglossidae) at sulphur-rich hydrothermal vents on volcanoes of the northern Mariana Arc. Deep Sea Res. Part II: Topic Stud. Oceanograph 92, 172–182. doi: 10.1016/j.dsr2.2013.01.026
Turner J. T. (2015). Zooplankton fecal pellets, marine snow, phytodetritus and the ocean’s biological pump. Prog. Oceanograph 130, 205–248. doi: 10.1016/j.pocean.2014.08.005
Vinogradov M. E. and Shushkina E. A. (2002). Vertical distribution of gelatinous macroplankton in the North Pacific observed by manned submersibles Mir-1 and Mir-2. J. Oceanograph 58, 295–303. doi: 10.1023/A:1015813809541
Keywords: ocean exploration, midwater, Marianas, water column, diversity, abundance
Citation: Moyer IM, Copeland A, Egan K and Collins AG (2025) Investigating faunal diversity and abundance in the Marianas midwater. Front. Mar. Sci. 12:1556454. doi: 10.3389/fmars.2025.1556454
Received: 06 January 2025; Accepted: 27 November 2025; Revised: 25 November 2025;
Published: 15 December 2025.
Edited by:
Manuel Maldonado, Spanish National Research Council (CSIC), SpainReviewed by:
Leocadio Blanco-Bercial, Bermuda Institute of Ocean Sciences, BermudaKirstin Meyer-Kaiser, Woods Hole Oceanographic Institution, United States
Copyright © 2025 Moyer, Copeland, Egan and Collins. This is an open-access article distributed under the terms of the Creative Commons Attribution License (CC BY). The use, distribution or reproduction in other forums is permitted, provided the original author(s) and the copyright owner(s) are credited and that the original publication in this journal is cited, in accordance with accepted academic practice. No use, distribution or reproduction is permitted which does not comply with these terms.
*Correspondence: Isabel M. Moyer, aW1tb3llckBlY2tlcmQuZWR1