 Vladimir Rogozhin1,2
 Alexander Osadchiev1,3*
 Alexander Savin1,3
 Ekaterina Rogozhina1
 Anton Georgiev4
 Olga Konovalova2,4
- 1Shirshov Institute of Oceanology, Russian Academy of Sciences, Moscow, Russia
- 2Marine Research Center at Lomonosov Moscow State University, Moscow, Russia
- 3Moscow Institute of Physics and Technology, Dolgoprudny, Russia
- 4Biological Faculty, Lomonosov Moscow State University, Moscow, Russia
In this study, we report an anomalously large freshened surface layer in the Eastern Arctic during ice-free season in 2019. This freshened surface layer is formed by river discharge and sea ice meltwater and is also referred to as the Lena plume, due to the Lena River discharge is its major freshwater source. Based on in situ and satellite data, we demonstrate that in August-September 2019 the Lena plume extended from the Lena Delta in the west to the Wrangel Island in the east, i.e., its zonal extent was approximately 2000 km. The area of the Lena plume varied between 750 000 and 870 000 km2 during this period, which is 1.5 times greater than the assessment of its maximal area in previous years, albeit they were often hindered by the presence of sea ice coverage. The main reasons for this anomalous spreading of the Lena plume are the following. First, intense sea ice melting in the Eastern Arctic in 2019 provided a significantly greater volume of meltwater inflow to the freshened surface layer, as compared to other years. Second, sea ice cleared out of the Laptev and East Siberian seas by the beginning of August and September 2019 respectively, and these seas remained free of ice during for 2 to 3 months (longer ice-free period occurred only in 2007 and 2020). Three months of favorable wind forcing on the Lena plume in July-September 2019 caused its anomalously extensive eastward and northward expansion, together with changes in the vertical structure of the Lena plume. This plume expansion affected the composition of phytoplankton communities, with the intrusion of freshwater species in the eastern part of the East Siberian Sea. The reported expansion of the large Lena plume under favorable sea ice and wind conditions provides the baseline for forecasting the future state of large-scale freshwater cycle in the Arctic Ocean, with an expectedly reduced ice cover.
1 Introduction
In the last decades, the Arctic Ocean has experienced intense sea ice decline during the warm season (Stroeve and Notz, 2018) due to ice-ocean albedo feedback (Kashiwase et al., 2017) and changes in the atmospheric circulation (Ding et al., 2017). The most significant decline in sea ice coverage during the warm season is observed in the Laptev and East Siberian seas (Matveeva and Semenov, 2022). The increase in duration of the ice-free period leads to the intensification of the wind influence on sea surface layer (Wang et al., 2021; Ding et al., 2022; Vavrus and Alkama, 2022).
One of the possible consequences of this process is the change in structure and spreading area of the freshened surface layer in the Eastern Arctic, which is formed by the large river runoff (Lena, Kolyma, Khatanga, Indigirka, Olenyok, Yana and smaller rivers) to the Laptev and East Siberian seas (Figure 1), as well as sea ice melting (Janout et al., 2020; Osadchiev et al., 2021b). The Lena River provides more than half of the total freshwater content in this freshened surface layer (Gordeev et al., 1996). Therefore, in this work, we will refer to the freshened surface layer in the Eastern Arctic as the Lena plume. However, other rivers and sea ice melting also make a significant contribution to its formation.
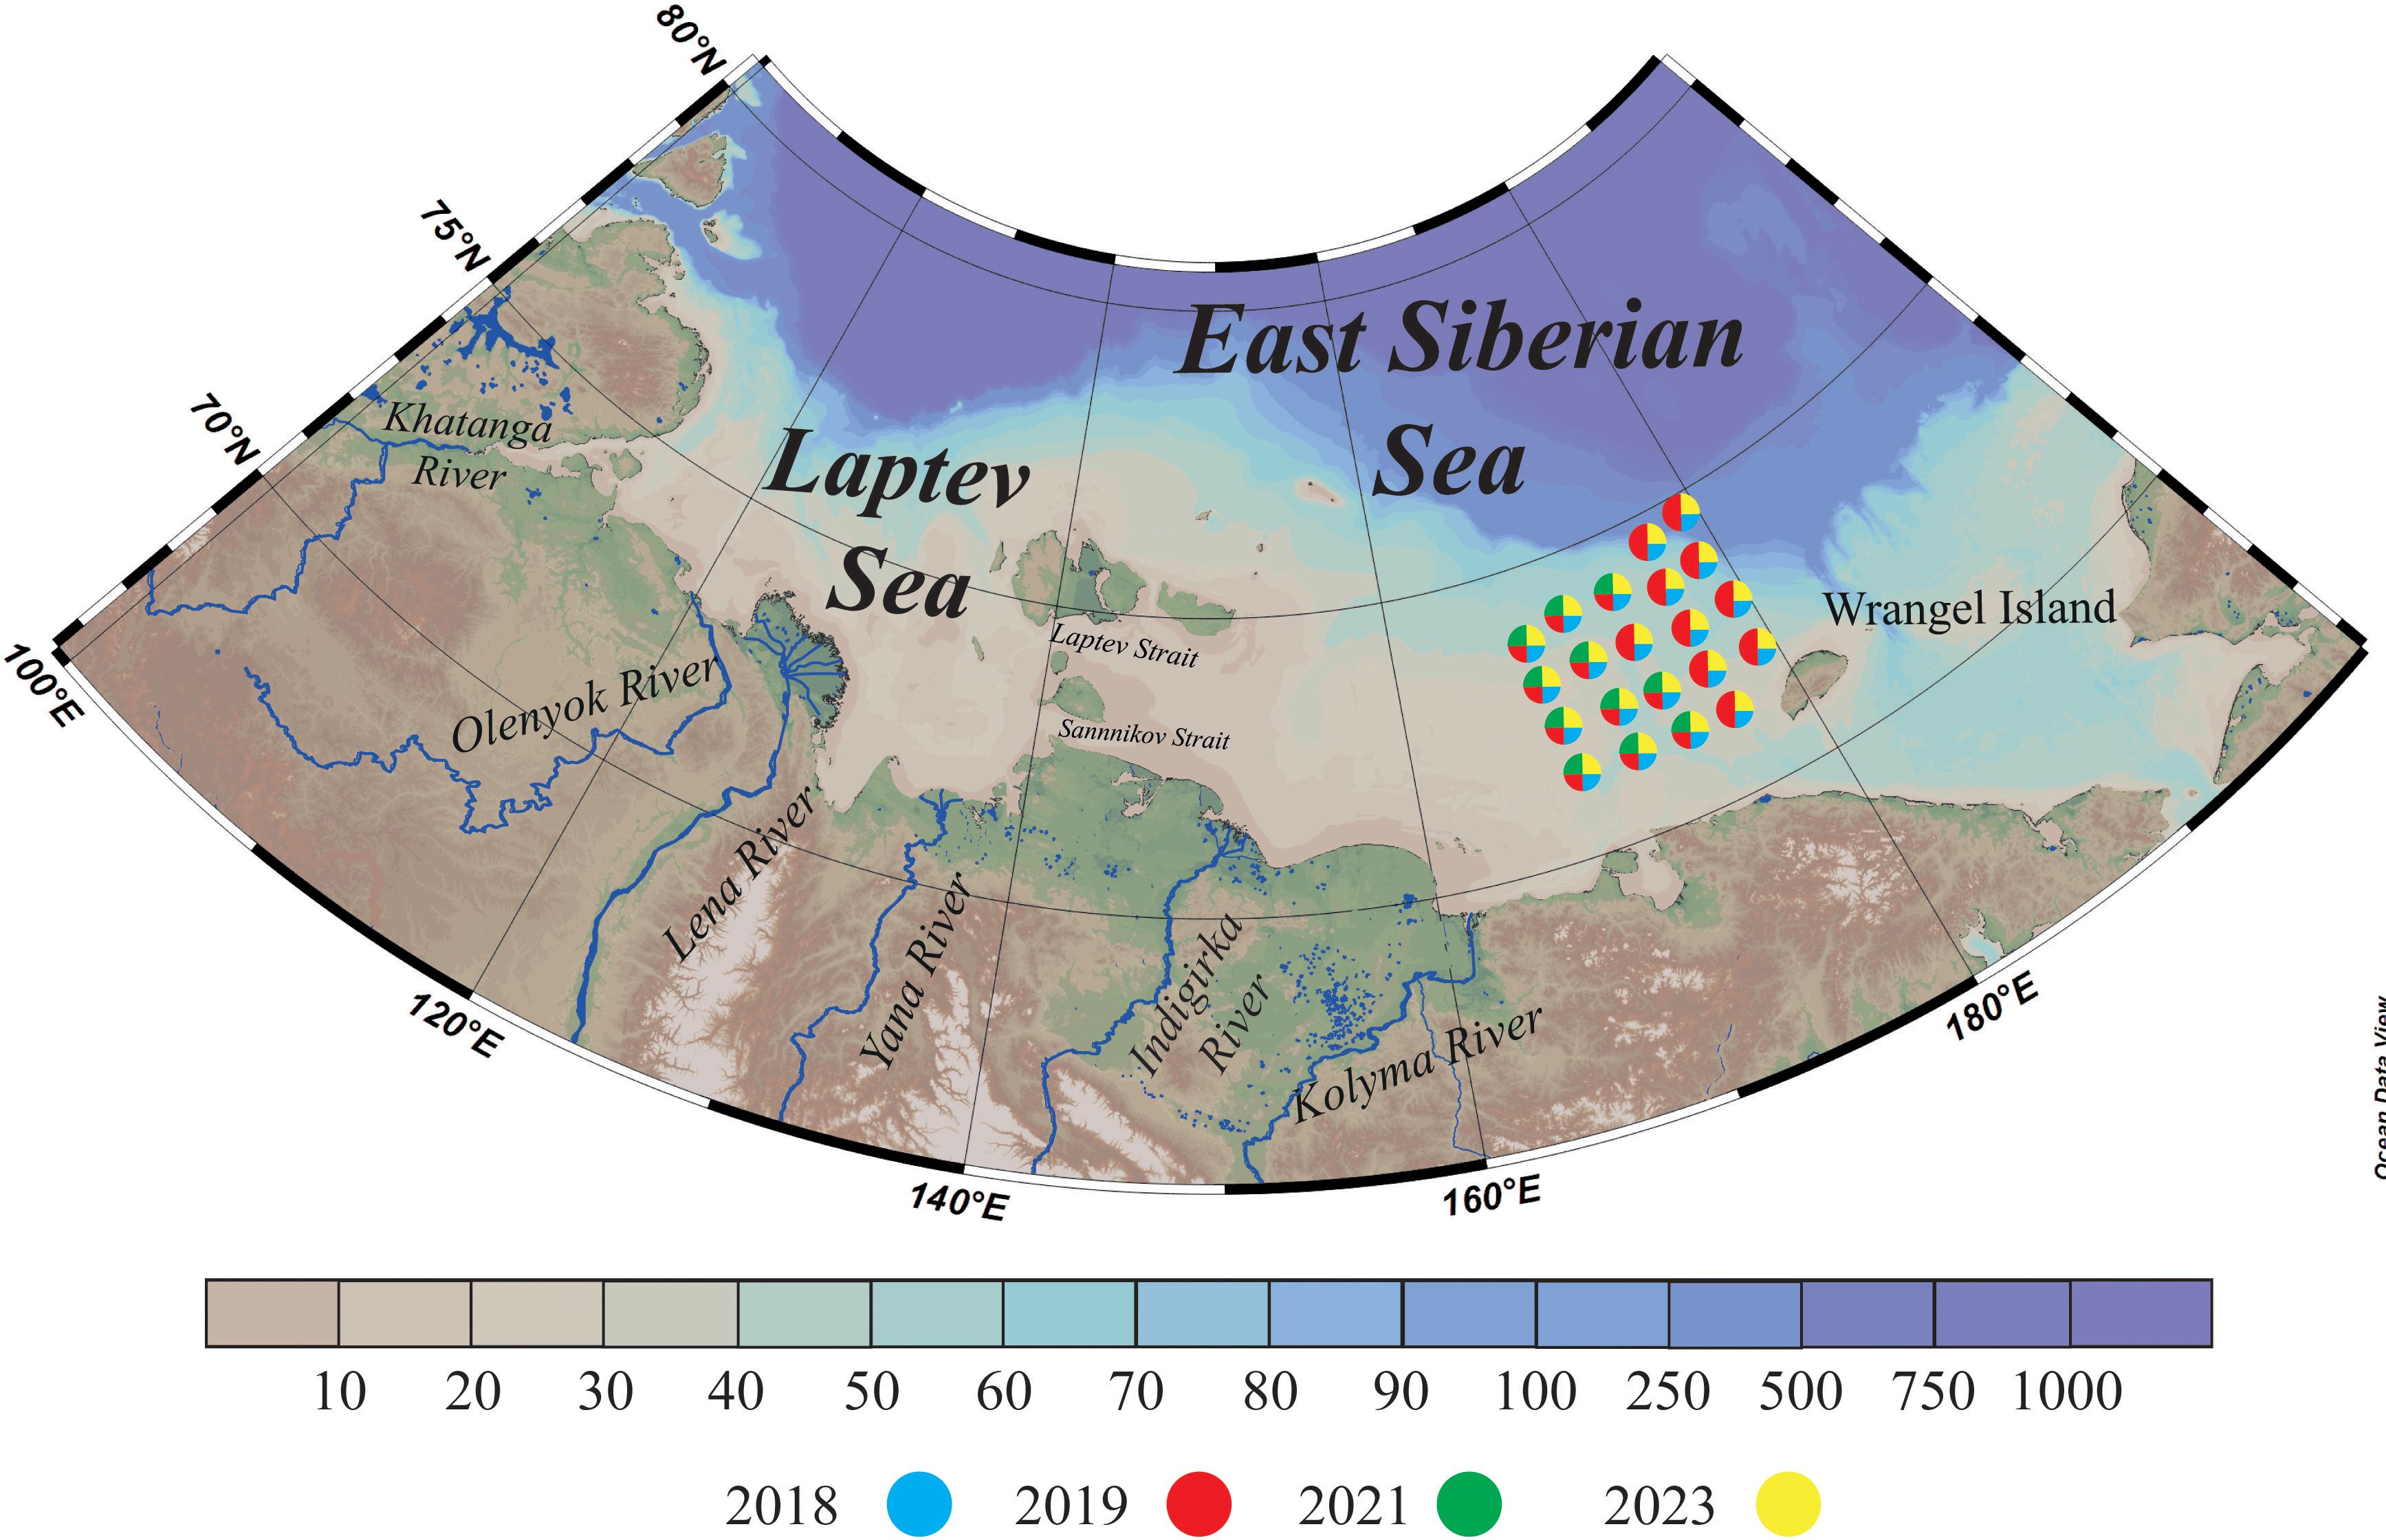
Figure 1. Bathymetry of the Eastern Arctic and location of hydrological stations (colored circles) from oceanographic surveys in the eastern part of the East Siberian Sea in 2018, 2019, 2021, and 2023. The bathymetric data was taken from the International Bathymetric Chart of the Arctic Ocean (IBCAO) (Jakobsson et al., 2012).
Note that the distribution of riverine water of different origin within the Lena plume still remains generally unknown, which is also the case of other large river plumes formed by discharges of several rivers (e.g., the Amazon-Orinoco plume in the tropical Atlantic Ocean (Fournier et al., 2017), the Ob-Yenisei plume in the Kara Sea (Osadchiev et al., 2021a), the Irrawaddy-Salween plume in the Andaman Sea (Pargaonkar and Vinayachandran, 2022).
Climate changes in river runoff to the Eastern Arctic, namely, the increase of river discharge and river water temperature, as well as earlier onset of the flooding period (Magritsky et al., 2023; Vasilenko et al., 2024) could also accelerate sea ice decline in summer and late autumn (Park et al, 2020). Moreover, stratification associated with the spreading of the freshened surface layer is the key factor that governs vertical convection and sea ice formation at the beginning of the cold season (Davis et al., 2016; Osadchiev et al., 2023c). As a result, the alteration of the Lena plume spreading in reduced sea ice and increased wind forcing conditions could significantly affect sea ice conditions, as well as local biogeochemical processes.
Despite the reduction of ice cover, the Eastern Arctic shelf (especially its northern and northeastern parts) is still among the most remote and least studied shelf areas in the Arctic Ocean. Even during the last 10–20 years, the duration of ice-free period in the northern and northeastern parts of the East Siberian Sea rarely exceeded several weeks. The lack of oceanographic expeditions and in situ data in this area results in many gaps in understanding of the structure and circulation of local water masses (Semiletov et al., 2005; Makhotin and Dmitrenko, 2011; Pipko et al., 2023; Kodryan et al., 2023; Dubinina et al., 2024), especially in comparison with the southern and western parts of the Eastern Arctic, which were addressed in many previous studies based on in situ data (Pipko et al., 2005; Dmitrenko et al., 2005; 2010; Savelieva et al., 2010; Semiletov et al., 2012, 2016; Pugach and Pipko, 2013; Thibodeau et al., 2014; Spivak et al., 2021; Osadchiev et al., 2023b, c; Xie et al., 2023; Wild et al., 2023; Konovalova et al., 2024).
The most comprehensive studies of the vertical structure and area of the Lena plume, based on in situ measurements of temperature and salinity, are presented in the work by Osadchiev et al. (2021b). This study indicates that the primary factor influencing the variability of the Lena plume area is the direction and speed of wind forcing during the flood period of the Lena River. Additionally, the studies conducted by Janout et al. (2020); Fofonova et al. (2015); Dmitrenko et al. (2005), and Zhuk and Kubryakov (2021), also identify wind influence as a critical factor affecting the Lena plume. It is further observed that, depending on the prevailing wind direction, the area of plume distribution is formed either northward, extending up to 76-77°N in the Laptev Sea, or eastward, reaching up to 170-175°E in the East Siberian Sea. Janout et al. (2020) also noted a more extensive distribution of freshened waters in the Laptev Sea over the past decade, in the context of declining ice cover, although this phenomenon occurs outside the region we are investigating in the eastern part of the East Siberian Sea.
Satellite observations generally could substitute lack of in situ data in the study area, especially for studying the freshened surface layer and surface processes in the Arctic Ocean (Mulligan and Perrie, 2019; Rogozhin et al., 2023; Konik et al., 2023). However, there are certain factors inherent in the Eastern Arctic that hinder the effective usage of satellite data. First, a common cloudy weather in the Laptev and East Siberian seas during summer and autumn (frequency of overcast sky is 80-90%) (Pavlov et al., 1996) significantly limits applicability of optical and infrared satellite imagery, which are obstructed by clouds. Second, the usage of the satellite altimetry to detect large river plumes in the Eastern Arctic is challenging and often misleading due to shallow shelf area (< 50 m), proximity of the coastline in the marginal Laptev and East Siberian seas and changes in the vertical plume structure due to mixing with ambient seawater (Frey and Osadchiev, 2021). Finally, sea surface salinity (SSS) products also do not depend on cloud conditions and potentially could be applied for study of the spreading area and internal structure of the freshened surface layer in the Eastern Arctic (Supply et al., 2020; Tarasenko et al., 2021; Zhuk and Kubryakov, 2021). However, standard algorithms applied for reconstruction of SSS from satellite data have low accuracy for shelf areas in the Arctic Ocean with low seawater temperature and salinity values, which requires development of specific Arctic shelf algorithms (Savin et al., 2023, 2024).
In this paper, we report and analyze thermohaline and in situ measurements performed during 4 oceanographic surveys in the eastern part of the East Siberian Sea in 2018, 2019, 2021, and 2023. We address the spreading of the Lena plume in the Eastern Arctic using these in situ data supported by satellite data, including SSS acquired from the Soil Moisture Active Passive (SMAP) satellite data using a new algorithm for the Arctic shelf (Savin et al., 2023, 2024), as well as sea ice thickness acquired from Cryosat-2 satellite data, using a new algorithm for the warm season (Landy et al., 2022). The latter dataset was used to calculate meltwater fluxes into the sea surface layer during the warm season (Osadchiev et al., 2024).
Based on this extensive (for this undersampled region) set of in situ and satellite data, we reconstructed the response of the freshened surface layer in the Eastern Arctic on wind forcing typical for the ongoing sea ice decline. In particular, we describe the anomalously large Lena plume during the ice-free season in 2019 caused by favorable wind and sea ice melting conditions. Finally, we assess the influence of anomalous spreading of the Lena plume on the local phytoplankton communities using in situ measurements performed in the eastern part of the East Siberian Sea (Figure 1) in 2019 and 2023.
This paper is organized as follows: Section 2 provides detailed information about in situ, satellite, river discharge and wind forcing data used in this study. The relationship between the external forcing conditions, on the one hand, and the spatial distribution and vertical thermohaline structure of the freshened surface layer in the Eastern Arctic, on the other hand, is described in Section 3 with an emphasis on the anomalous spreading of the Lena plume registered in August-September 2019. The influence of the latter process on the phytoplankton communities in the eastern part of the East Siberian Sea, as well as the assessment of the Lena plume variability on inter-annual time scales, is analyzed and discussed in Section 4, followed by the conclusions in Section 5.
2 Data and methods
2.1 In situ measurements
In this study, we analyzed thermohaline measurements in the eastern part of the East Siberian Sea obtained during 4 oceanographic surveys in 2018, 2019, 2021 and 2023 (colored circles in Figure 1). The information about the oceanographic surveys is summarized in Table 1. Thermohaline measurements were performed using SBE 911plus CTD profiler with a vertical resolution of 0.2 meters and were carried out from the end of August to the beginning of October covering the early autumn period.
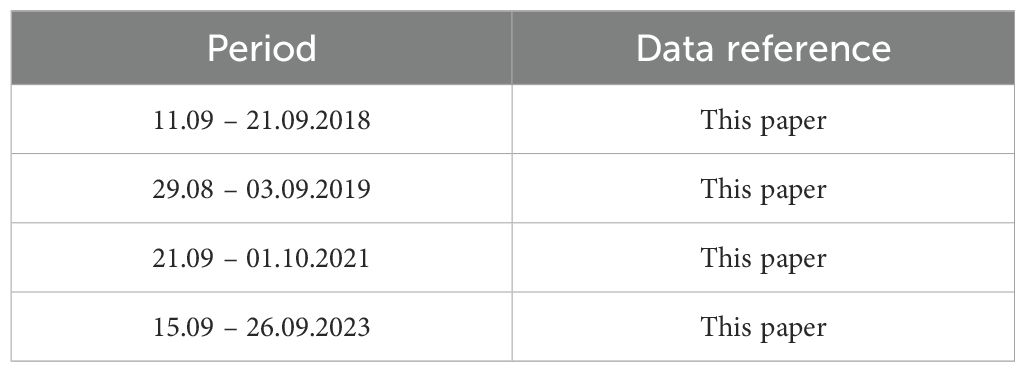
Table 1. Periods of 4 oceanographic surveys analyzed in this paper.
Phytoplankton sampling with the Niskin bathometer was performed at the surface layer at the same 20 stations during the oceanographic surveys in 2019 and 2023. Samples with a volume of 1 liter were concentrated to 50 ml using a reverse filtration chamber (Vinogradov, 1983) immediately after sampling, then fixed with formaldehyde (4% final concentration approximately). The samples were examined in the laboratory using a light microscope. Phytoplankton abundance and species composition was determined in counting chambers (Nageotte and Fuchs-Rosenthal) at a magnification of ×400. Microalgae biomasses were calculated by cell volume using the geometric similarity of shapes method (Hillebrand et al., 1999; Radchenko et al., 2010). The phytoplankton species list is given in accordance with the international database AlgaeBase (Guiry et al., 2018).
2.2 River discharge, wind and sea ice fluxes data
Discharge measurements at the Lena and Kolyma rivers analyzed in this study were acquired from two most downstream gauge stations located in Kyusyur and Kolymskoe respectively. The river discharge data were downloaded from the Arctic Great Rivers Observatory (ArcticGRO) website (https://arcticgreatrivers.org/data). Due to the absence of high-quality daily discharge data for the Khatanga, Indigirka, Olenyok, Yana and smaller rivers inflowing to the Laptev and East Siberian seas, the total annual river discharge forming the freshened surface layer in the Eastern Arctic was assessed as the annual discharge of the Lena River, multiplied by a coefficient of 1.55 according to the annual river discharge data presented in Gordeev et al. (1996), Magritsky et al. (2018) and Shiklomanov et al. (2021).
Wind forcing conditions and atmospheric pressure were examined using ERA5 atmospheric reanalysis with a 0.25° spatial and hourly temporal resolution (Hersbach et al., 2020). The ERA5 reanalysis data were downloaded from the European Centre for Medium-Range Weather Forecasts (ECMWF) website (https://www.ecmwf.int/en/forecasts/datasets/archive-datasets/reanalysisdatasets/era5). The sea ice data retrieved from satellite products were downloaded from the Arctic and Antarctic Research Institute (AARI) website (https://www.aari.ru/data/realtime/ledovye-karty-2/slo2024) and University of Bremen (https://seaice.uni-bremen.de/sea-ice-concentration/amsre-amsr2/).
Ekman transport and wind stress curl values were calculated using the standard equations. First, we calculated zonal and meridional wind stress components τx and τy: , , where u and v are the zonal and horizontal wind components, ρa is the atmospheric density equal to 1.225 kg/m³, Cd is the drug coefficient equal to 1.2×10⁻³. Further, we calculated the zonal and meridional Ekman transport (Qx and Qy) using the equations: , , where ρ is the seawater density equal to 1025 kg/m³, f is the Coriolis parameter equal to 1.35·10-4. Wind stress curl C was calculated using the equitation: .
2.3 SMAP sea surface salinity data
To assess the spatial and temporal variability of the Lena plume, sea surface salinity (SSS) data obtained from the Soil Moisture Active Passive (SMAP) satellite mission (Meissner et al., 2022) were analyzed for period 2015-2023. SMAP provides SSS data with a spatial resolution of ~25 km and a temporal resolution of 3 days. The SMAP sea surface salinity data shows good agreement (Bao et al., 2019) with in situ data at low latitudes (from 40°N to 40°S). However, in the Arctic Ocean, especially in the shelf seas affected by the river discharge, the quality of the SSS data is significantly reduced, with an overall root-mean-square deviation (RMSD) of 3.15 psu, and a maximum RMSD of 6.06 psu for low salinity waters (salinity less than 15 psu) (Supply et al., 2020; Savin et al., 2024).
To improve the quality of the SMAP SSS data, additional processing was performed using a gradient boosting composite neural network algorithm, which is described in detail in Savin et al. (2024). The key feature of this algorithm is its training on an extensive dataset of in situ temperature and salinity measurements performed in the surface layer in the Barents, Kara, Laptev and East Siberian seas. As a result of this additional processing, the overall quality of SSS retrieval improved, i.e., root mean square deviation decreased from 3.15 to 2.15. Furthermore, the correlation of the developed SSS dataset with the in situ data increased from 0.82 to 0.90 (Savin et al., 2024). The root mean square deviation and correlation were especially improved for salinity values, typical for river plumes (<25), which previously reconstructed with very low quality for standard SMAP SSS algorithms. Thus, the additional processing of SSS SMAP data has significantly improved its consistency with in situ measurements.
In order to further assess the quality of SSS data, a comparison of in situ salinity measurements at the surface layer with synchronous SSS satellite measurements was performed (Figure 2). The boundary of the Lena plume was determined by the location of the frontal zone manifested by a sharp increase in salinity values on the sea surface. Multiple previous studies of the Lena plume in the Laptev and East Siberian seas demonstrated that this frontal zone is consistent with the isohaline of 25 psu (Polukhin, 2019; Osadchiev et al., 2021b; Spivak et al., 2021). The resulting location of the outer boundary of the Lena plume, determined from in situ measurements, shows good agreement with the boundary determined from the satellite SSS data (Figure 2).
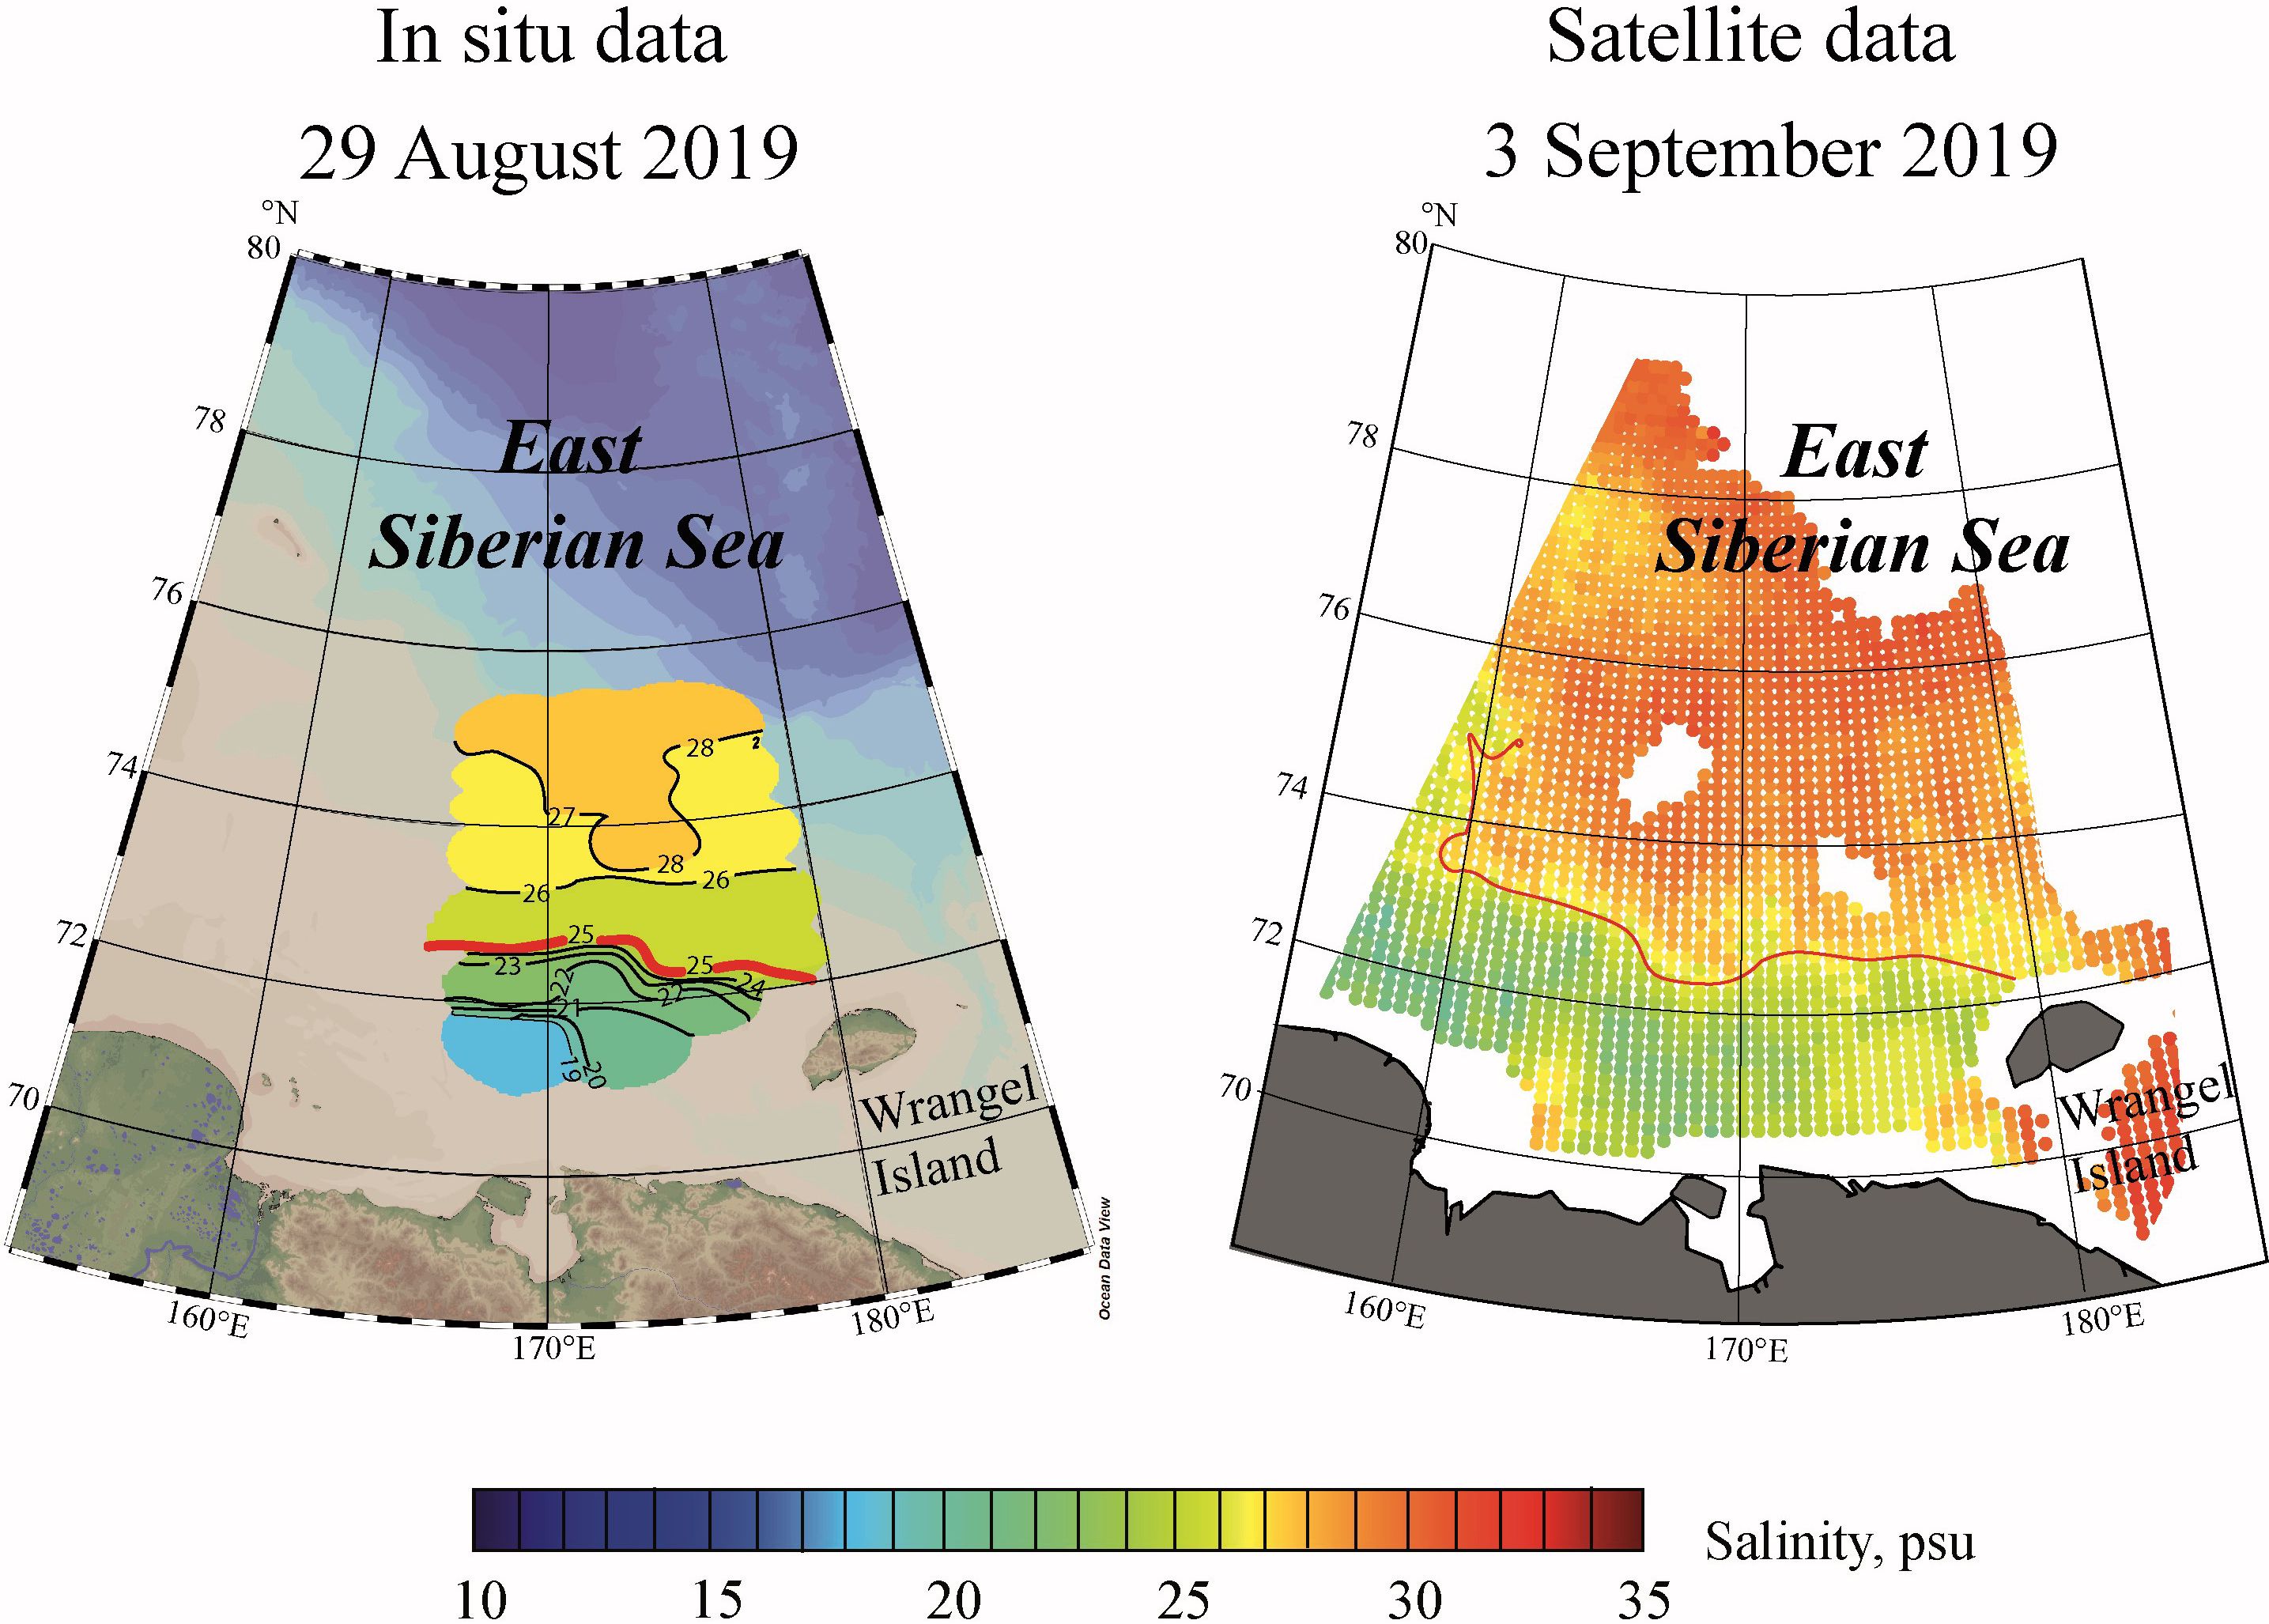
Figure 2. Location of the Lena plume boundary (red lines) reconstructed by in situ salinity data (left) and SMAP SSS data (right) on 29 August 2019 and 3 September 2019.
2.4 Meltwater fluxes
To estimate the volume of sea ice meltwater that contributed to formation of the freshened surface layer in the Eastern Arctic in 2018 and 2019, freshwater fluxes were calculated according to the methodology presented in Osadchiev et al. (2024). The cumulative volume of freshwater flux from sea ice meltwater during every two weeks at the 80 km grid points was calculated using the following equation QSIM = ΔV·AS·AV/S, where V = Cice·Tice is the sea ice volume at the grid point equal to the product of sea ice concentration Cice (reprojected to 80 km grid) and sea ice thickness Tice, AS equal to 0.8 is the coefficient to normalize meltwater salinity (prescribed equal to a salinity of 6) to fresh water (salinity of 0), AV equal to 0.9 is the coefficient to normalize ice volume to meltwater volume, S equal to 640 km2 is the area of a grid cell. Sea ice concentration data derived from AMSR2 satellite data with a spatial resolution of 6.25 km and a temporal resolution of 1 day (Spreen et al., 2008) and sea ice thickness derived from Cryosat-2 satellite data with a spatial resolution of 80 km and a temporal resolution of 2 weeks from May to September (Landy et al., 2022).
In this work, the calculation was performed with refined boundaries of the freshened surface layer based on SMAP SSS data presented in detail in Section 2.2. It is important to note that sea ice thickness data for the period from May to September is available only for 2012-2020. This limitation restricts our ability to determine sea ice meltwater fluxes only for 2018 and 2019, while these fluxes in 2021 and 2023 remain unknown.
3 Results
In this section, we assess major forcing conditions of the distribution of the Lena plume and examine its vertical and horizontal structure based on in situ and satellite salinity data. In addition, we investigate quantitative and qualitative characteristics of the phytoplankton communities in East Siberian Sea, based on the analysis of in situ samples. In Section 3.1, we analyze variability of the Lena River discharge and sea ice conditions during the study period (2018, 2019, 2021 and 2023). Also, in this section we assess wind forcing conditions on the Lena plume based on ERA5 reanalysis data and calculate freshwater fluxes from sea ice meltwater to understand shares of river discharge and meltwater in the Lena plume. In Section 3.2, we analyze the vertical and horizontal structure of the Lena plume in August 2019, September 2018, September 2021 and September 2023 based on in situ measurements. In Section 3.3, we analyze the spatial distribution of the Lena plume based on SMAP SSS data to estimate the total plume area during the periods of in situ measurements. In Section 3.4, we examine quantitative and qualitative characteristics of phytoplankton communities to assess the possible impact of the Lena plume distribution on the ecosystem of the East Siberian Sea.
3.1 River discharge, sea ice, and atmospheric conditions
River runoff to the Laptev and East Siberian seas is one of the most important sources of freshwater to the freshened surface layer in the Eastern Arctic (Anderson et al., 2004; Gordeev et al., 1996; Osadchiev et al., 2024). This volume has large inter-annual variability, in particular, total annual discharge of the Lena and Kolyma rivers (the largest rivers of the study area) varied from 750 to 1100 km3 and from 86 to 145 km3, respectively, during the last 20 years (Figure 3). The majority of annual river runoff (80-90%) inflows to the Eastern Arctic during warm season in June-September (Pavlov et al., 1996). The maximum discharge of the Lena and Kolyma rivers, which is observed during the flooding period in early summer, also has significant inter-annual variability. In 2018–2023 the maximal discharge of the Lena and Kolyma rivers varied from 82000 (in 2019) to 152000 (in 2018) m3/s and from 21000 (in 2019) to 31000 (in 2018) m3/s respectively (Figure 4). Discharges of the Lena and Kolyma rivers after flood peak, i.e., in July-October, were similar in 2018-2023, except the case of 2018 with secondary discharge peak at both rivers in August-September (Figure 4).
Figure 3. Total annual discharge of the Lena and Kolyma rivers in 2003–2023 according to https://www.arcticrivers.org/data.
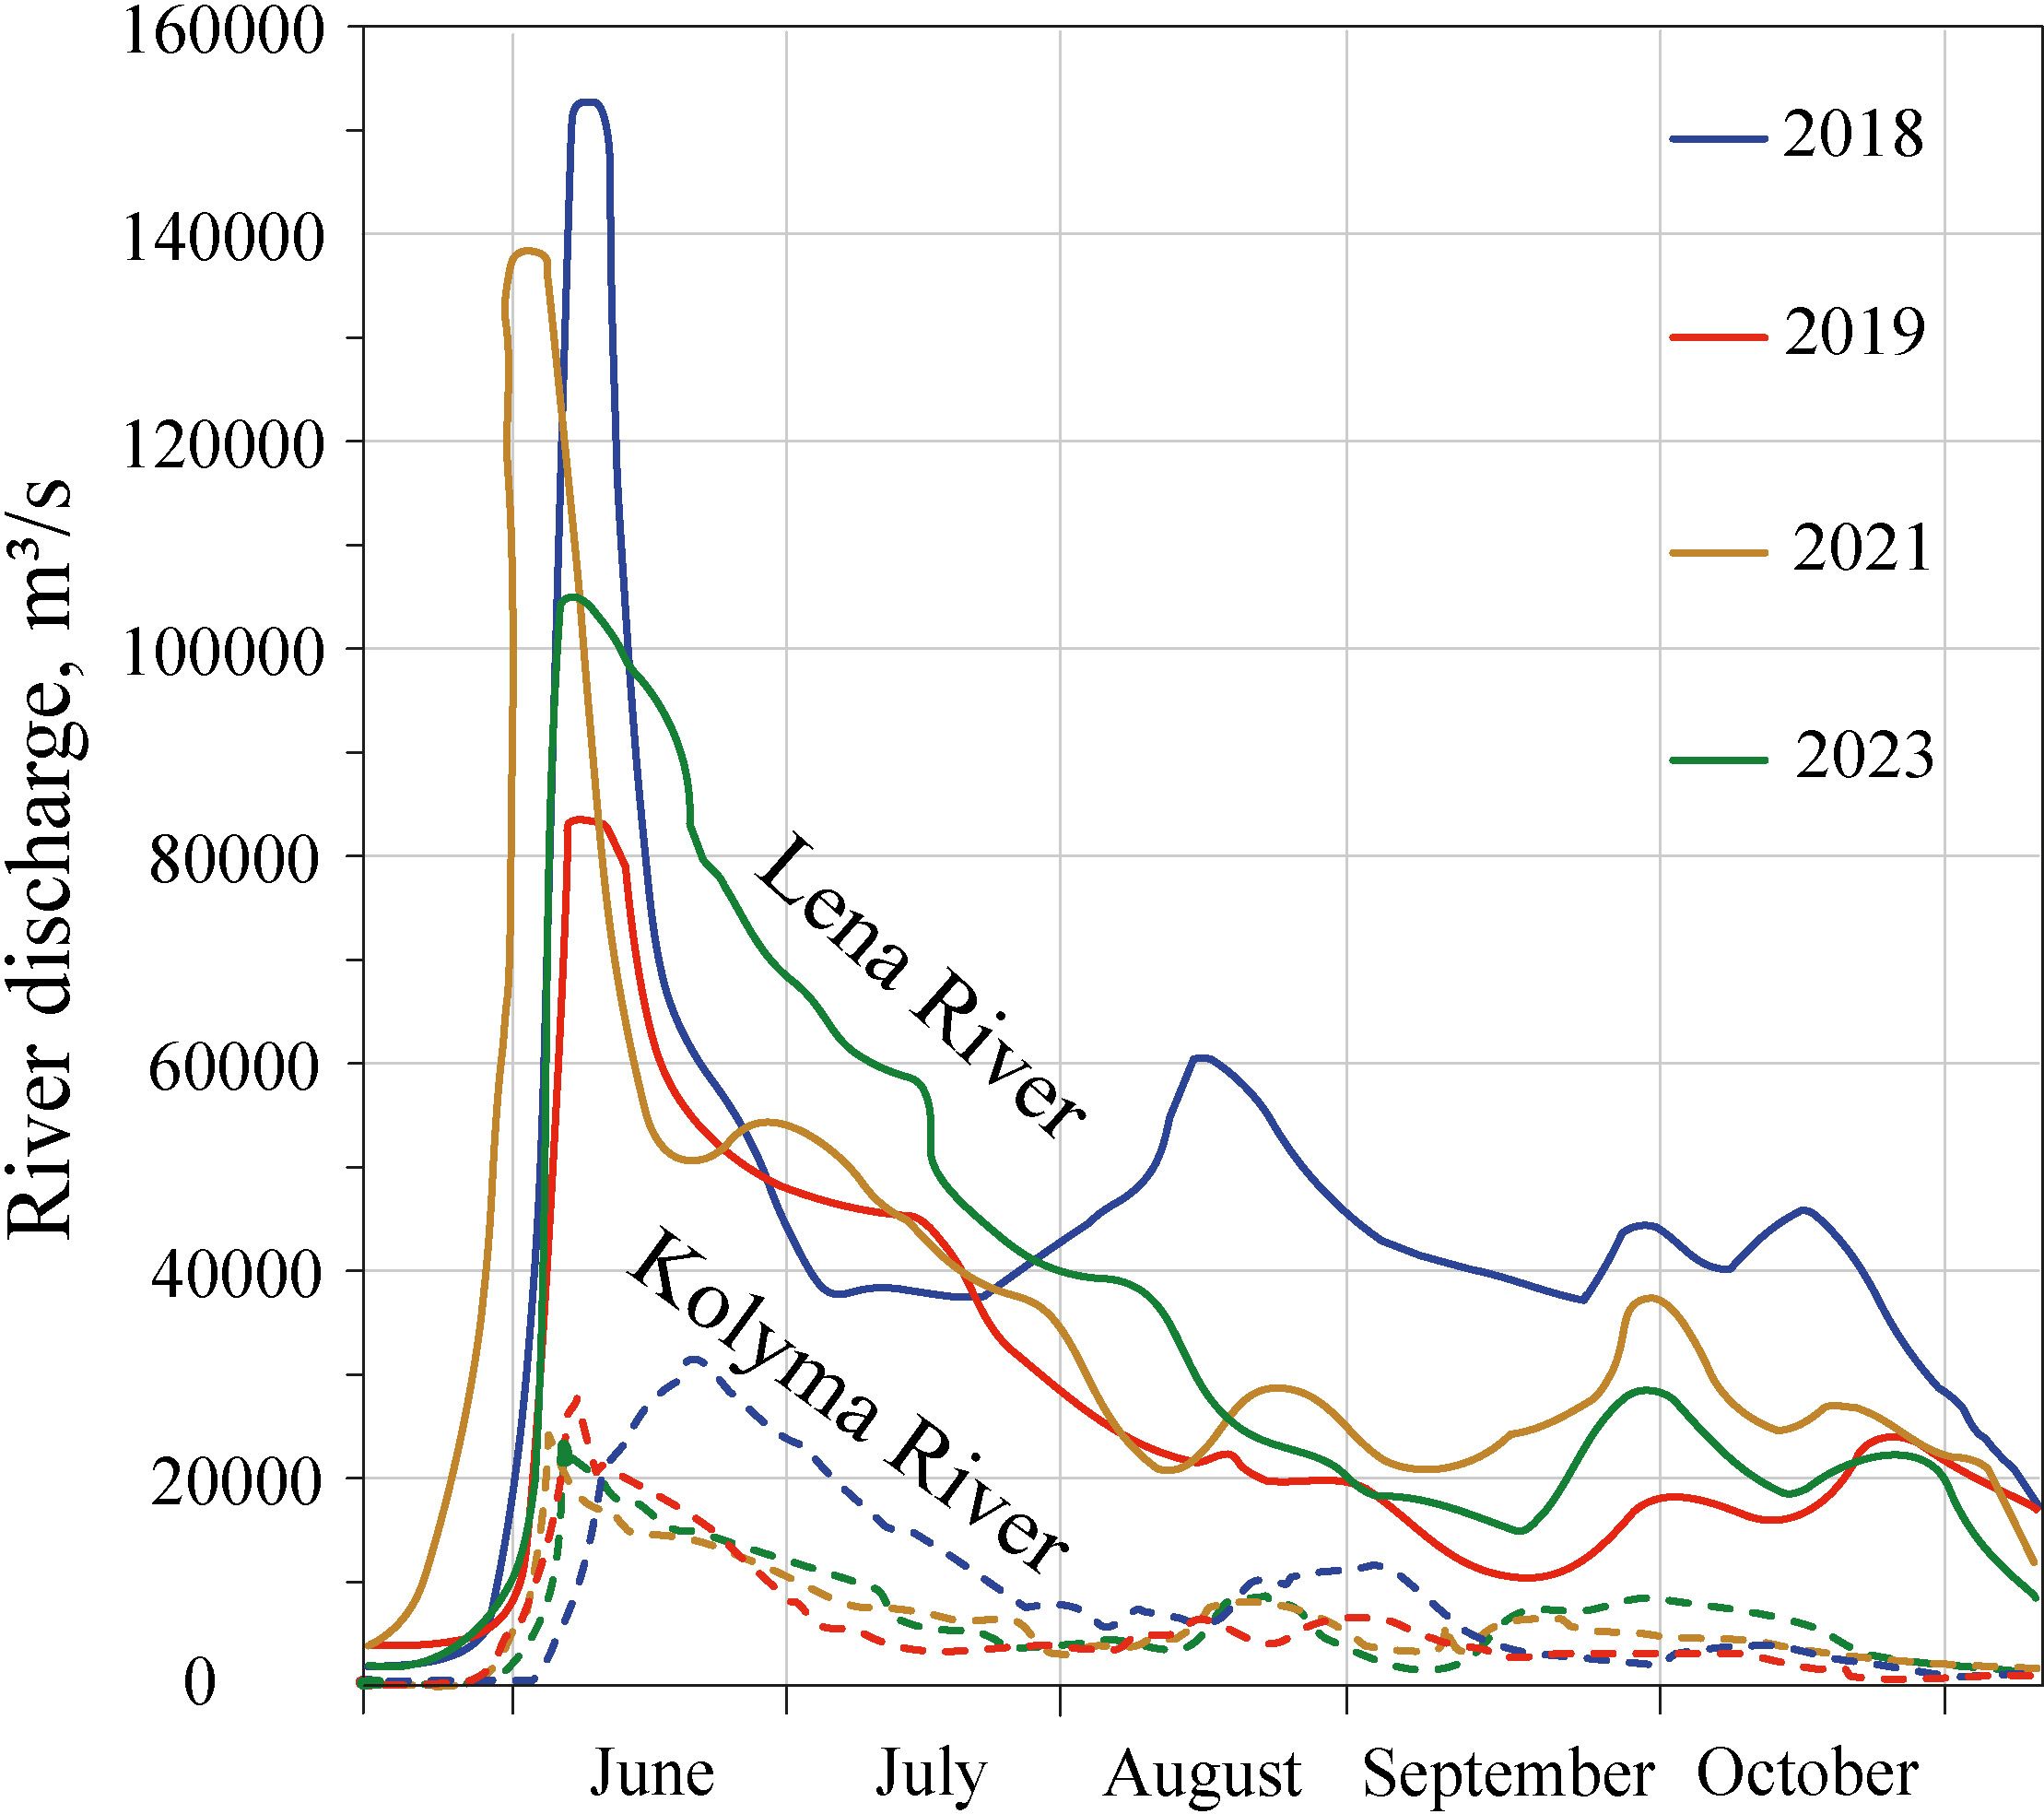
Figure 4. Discharges of the Lena (solid lines) and Kolyma (dashed lines) rivers during the warm season in 2018, 2019, 2021, 2023 according to https://www.arcticrivers.org/data.
In order to evaluate the freshwater fluxes into the Lena plume from the Lena and Kolyma rivers, a comprehensive analysis of the total river discharge of the Lena and Kolyma rivers was conducted for the period from May to September in 2017, 2018, 2019, 2020, 2021, and 2023. These calculations were conducted to align with the assessment of sea ice meltwater volumes presented later in this section. The peak level of the river discharge volume was recorded in 2018, equal to 985 km³, while the lowest discharge level was observed in 2019 equal to 606 km³ (Figure 4). During May, June, July, August, September in 2017, 2020, 2021, and 2023, the cumulative volume of river flow remained relatively stable, equal in total to 845, 838, 787, and 806 km³, respectively.
The Eastern Arctic is covered by ice from October-November till July-September (Pavlov et al., 1996; Osadchiev et al., 2021b). Despite the distinct increase of duration of ice-free period during the last two decades caused by earlier onset of ice melting and later beginning of ice formation (Liang and Su, 2021; Shabanov et al., 2024), sea ice conditions in the Laptev and East Siberian seas still have large inter-annual variability. During certain years, namely, in 2007, 2017, 2019, and 2020, the Laptev and East Siberian seas became free of ice in August. On the opposite, in 2008-2011, 2013-2014, 2016, 2018, 2021–2022 sea ice remained in the northern parts of these seas during the whole warm season. As a result, duration of ice-free period in the northeastern part of the East Siberian Sea varied from several weeks (e.g., in 2018, 2021, 2022, and 2023) till 2–3 months (e.g., in 2019 and 2020). Sea ice meltwater is the second most important source of freshwater in the Eastern Arctic, which on average provides 20% of the total freshwater volume in the freshened surface layer (Osadchiev et al., 2024). The inflow of meltwater to the Lena plume is governed by intensity of sea ice melting in the Eastern Arctic in August and September, which is the period of active expanding of the Lena plume (Osadchiev et al., 2024). In order to address this issue, we present sea ice conditions during oceanographic surveys in the eastern part of the East Siberian Sea in 2018, 2019, 2021, and 2023. Sea ice occupied almost the whole area in the East Siberian Sea in July and August 2018 and reduced by half by late September 2018 (Figure 5a). In 2019, the southern part of the East Siberian Sea was ice-free as early as the middle of July. The Intense ice melting in early August resulted in an ice-free East Siberian Sea by mid-August (Figure 5b). In 2021 and 2023, the East Siberian Sea was similarly covered by ice in July and early August. Ice coverage steadily decreased by half by late August and was almost completely gone by late September (Figures 5c, d).
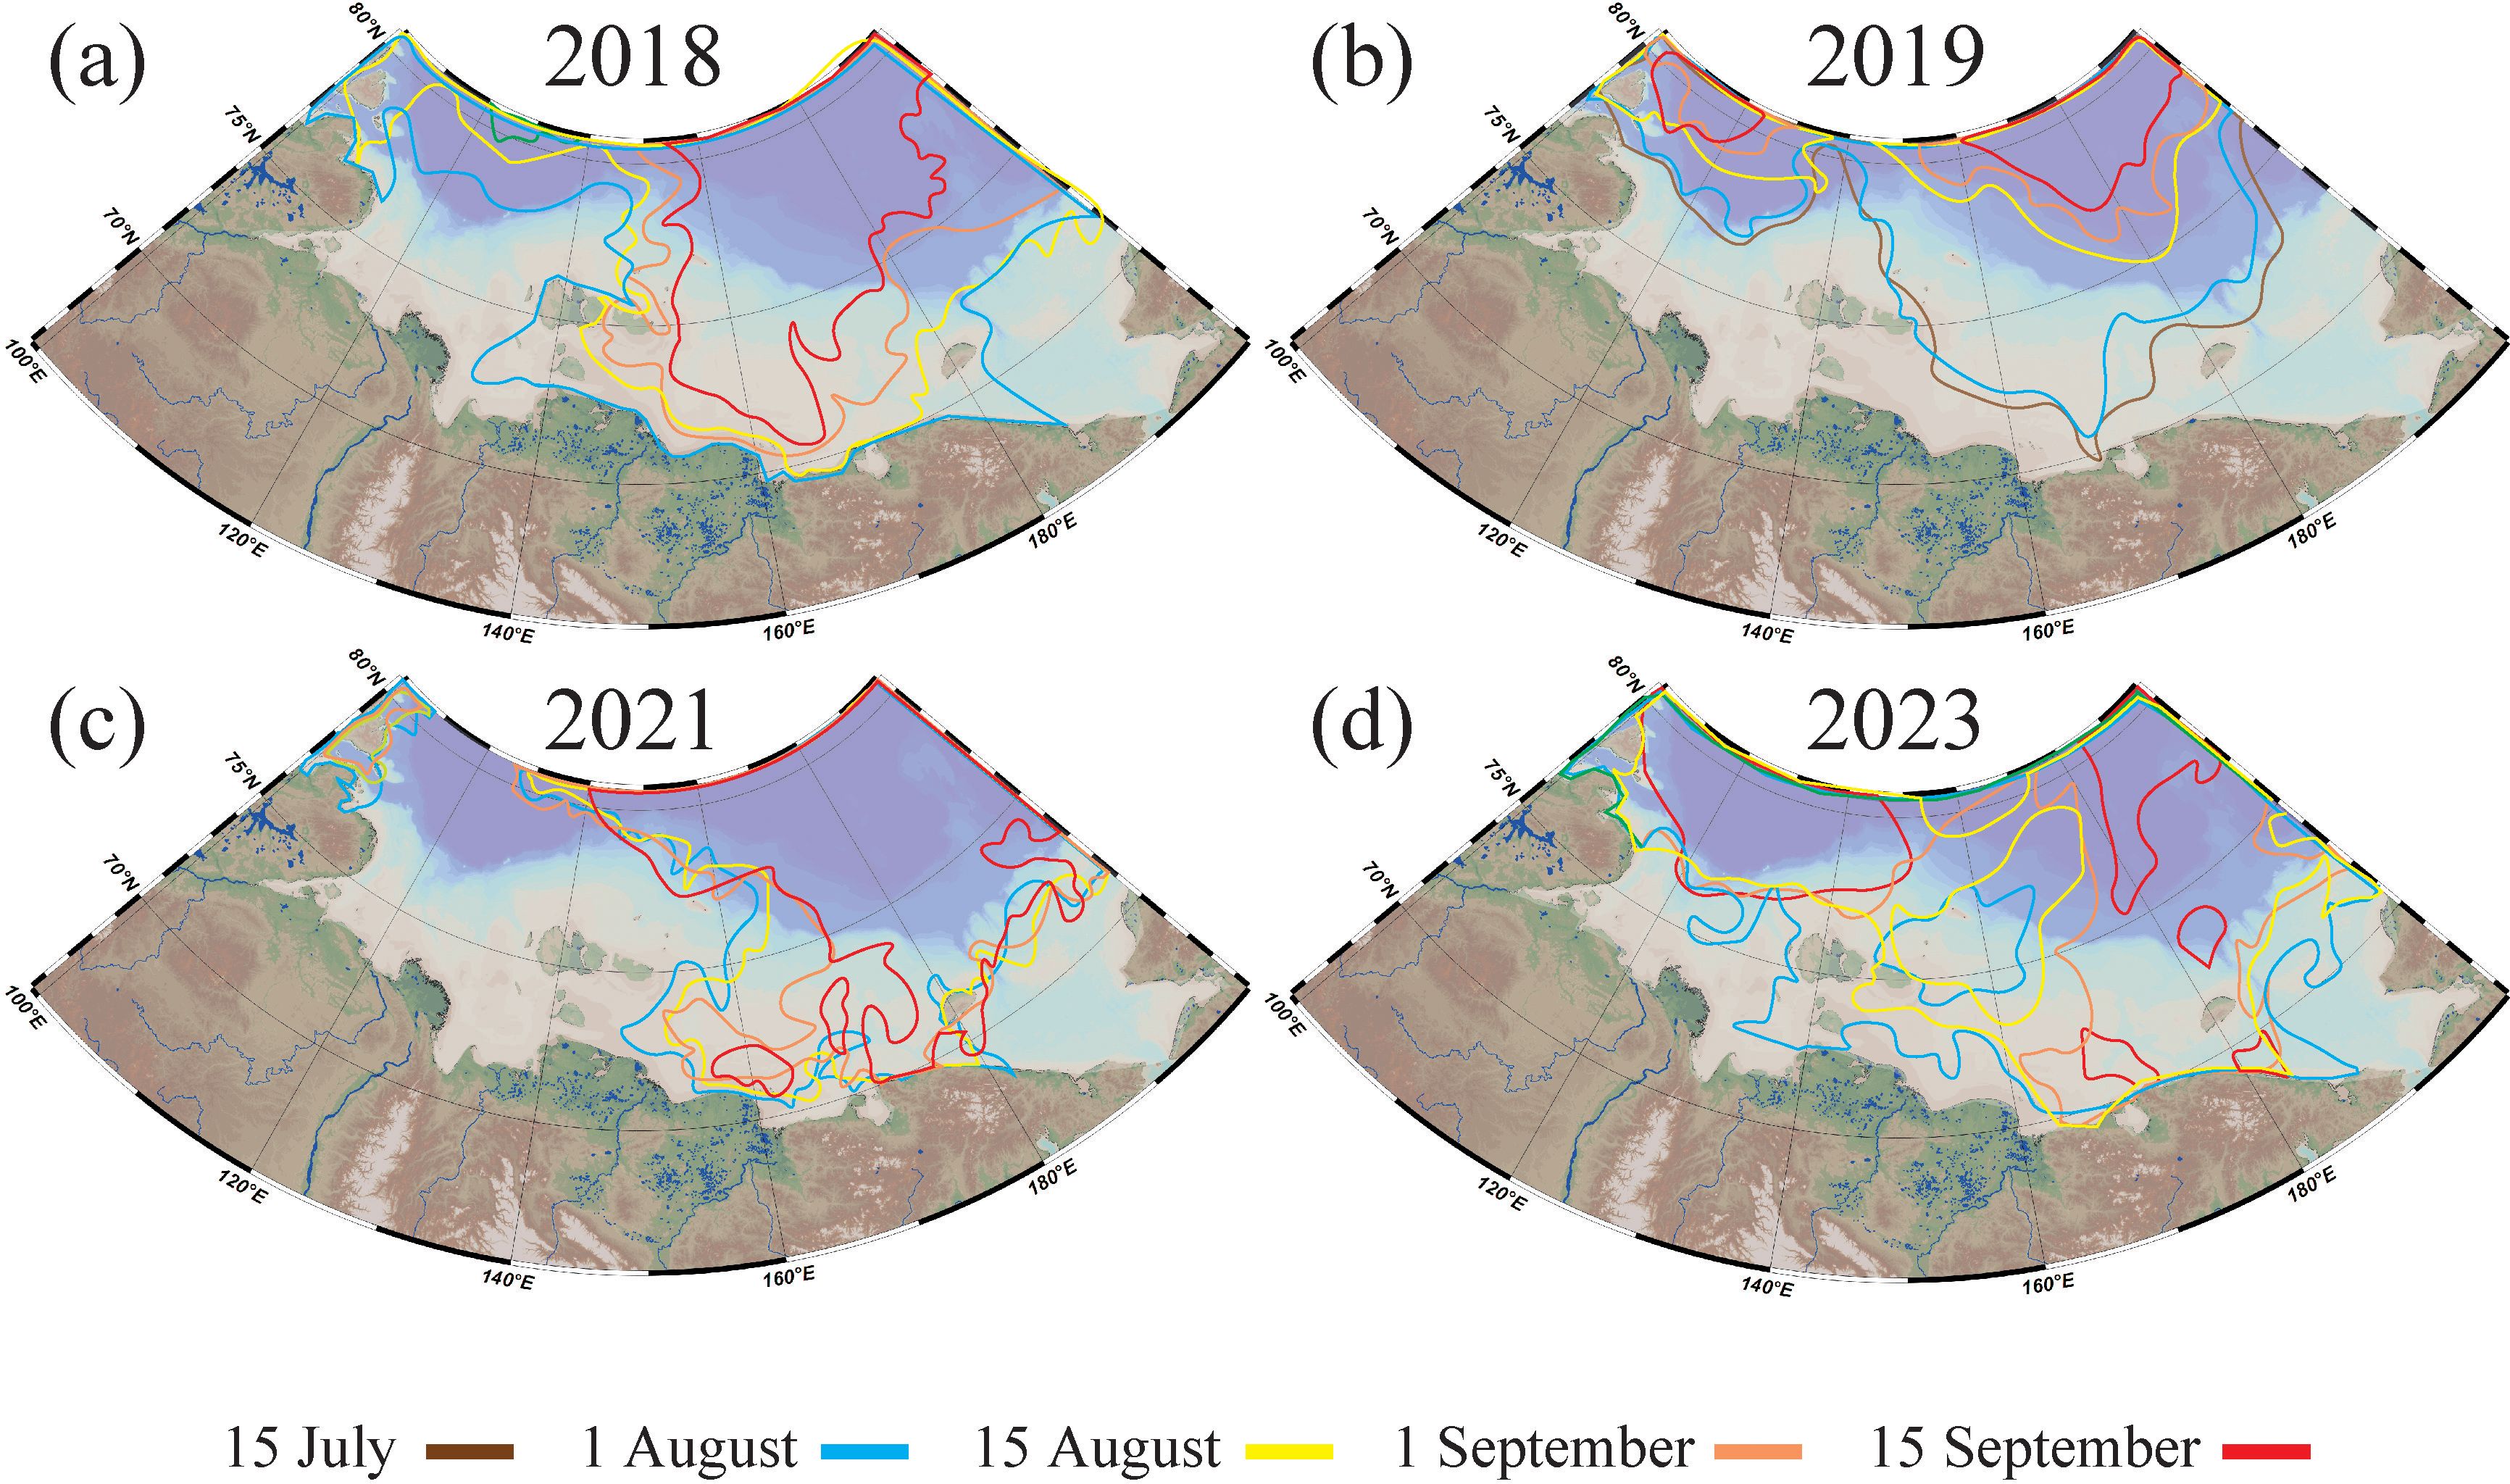
Figure 5. Position of the seasonal sea ice edge in the Laptev and East Siberian seas on 15 July (brown line), 1 August (blue line), 15 August (red line), 1 September (green line), and 15 September (yellow line) in 2018 (a), 2019 (b), 2021 (c), and 2023 (d). The different colored contours in the figure represent the location of ice coverage at a specific point in time, as indicated by the map legend. The area inside the closed contour is the location of the ice coverage. The position of the seasonal sea ice edge was visualized based on sea ice data provided by the Arctic and Antarctic Research Institute (https://www.aari.ru/data/realtime/ledovye-karty-2/slo2024) and the University of Bremen (https://seaice.uni-bremen.de/sea-ice-concentration/amsre-amsr2).
The contribution of meltwater to the Lena plume (Figure 6) was calculated by reconstructing the shares of river discharge and sea ice meltwater based on Osadchiev et al. (2024). Unfortunately, the shares of sea ice meltwater could be calculated only for 2018 and 2019 due to lack of the reliable data on sea ice thickness during warm season in subsequent years. We also made additional calculations for 2017 and 2020 due to long ice-free period in these years in order to compare it with the anomalous case of 2019. The proportion of meltwater (Figure 6) in 2019 (22%) was larger than in 2018 (19%) and in 2020 (18%), but less than in 2017 (26%).
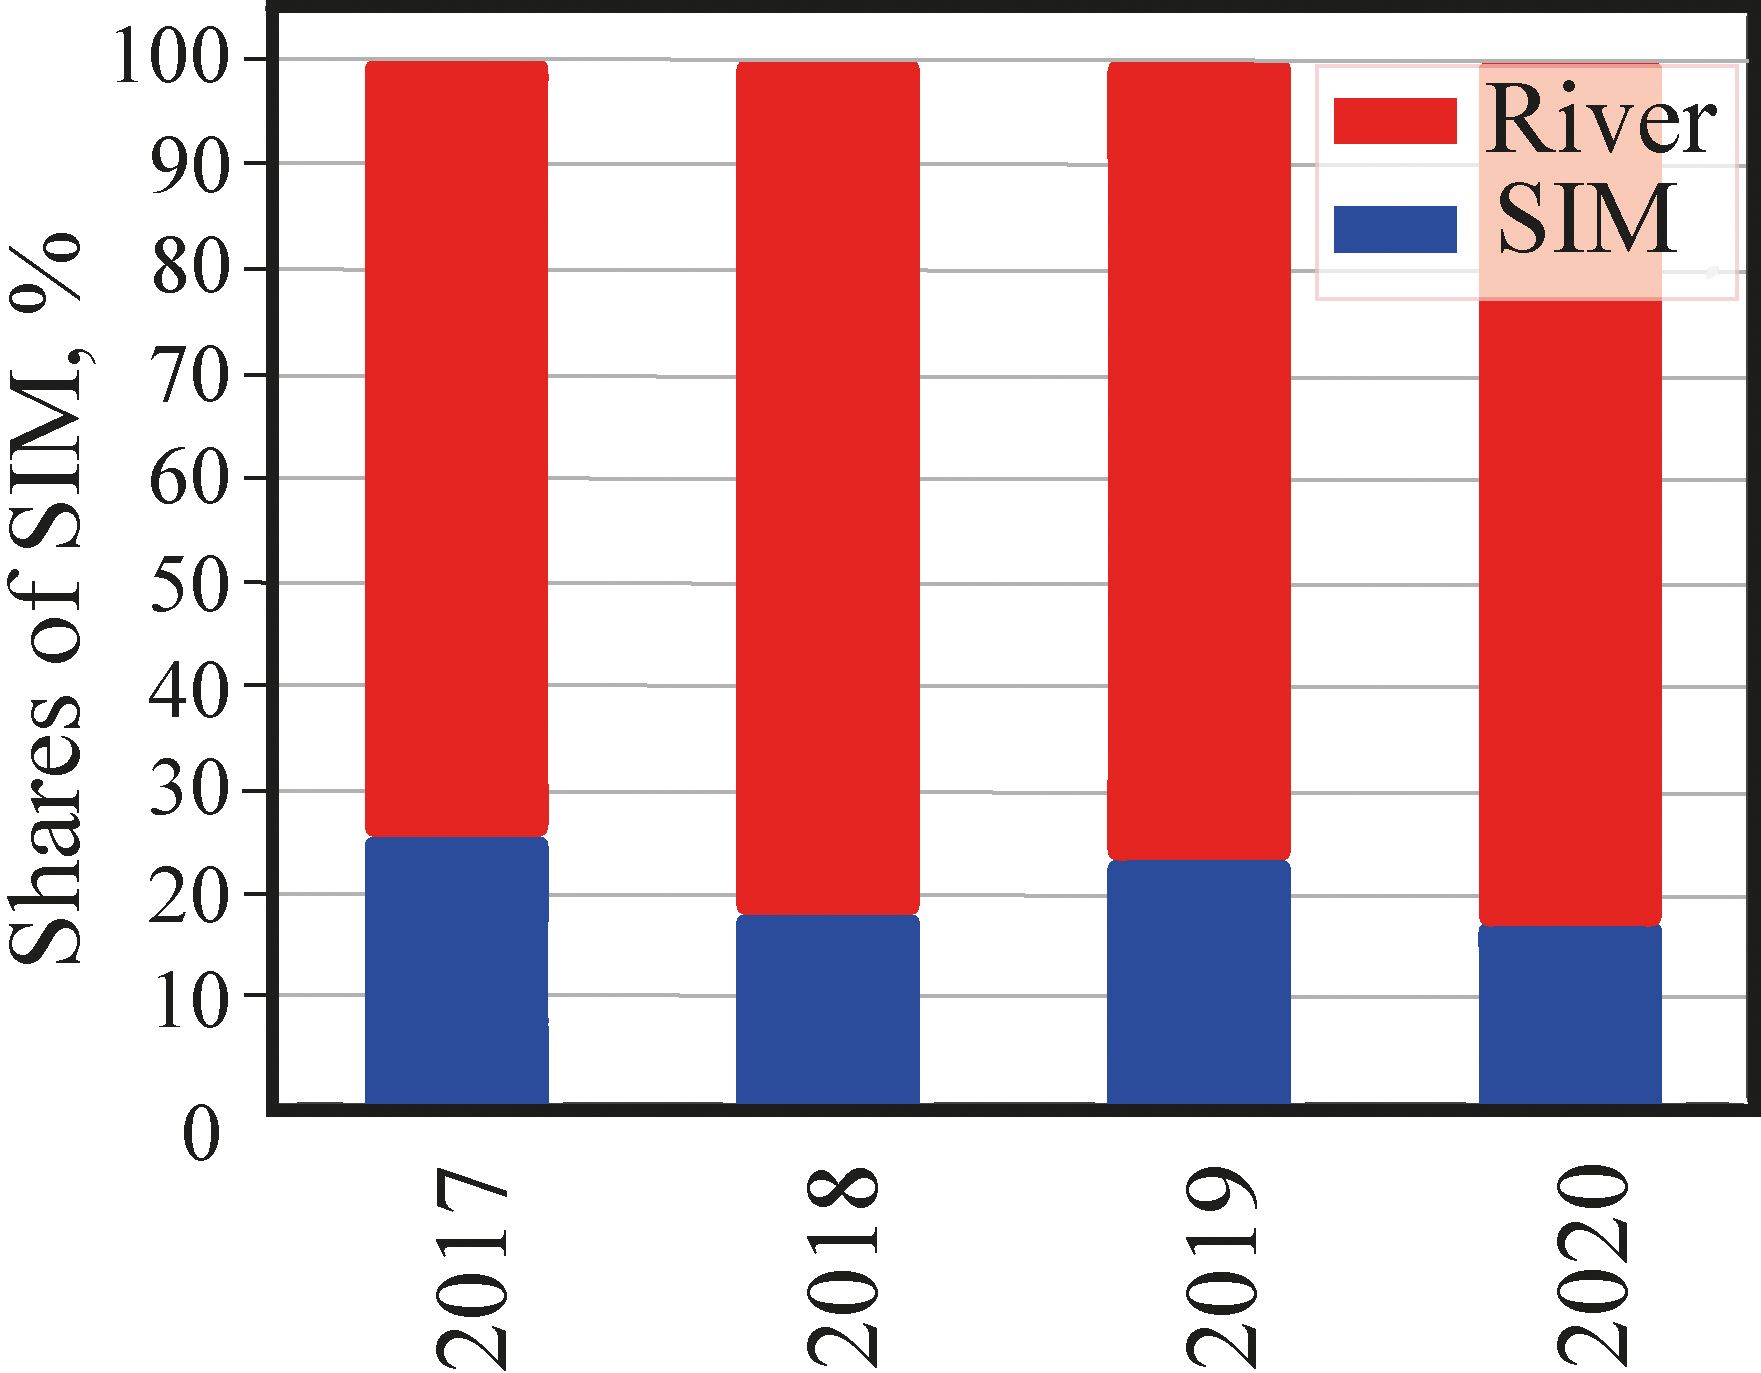
Figure 6. Shares of river discharge (red) and sea ice meltwater (blue) in total freshwater volume in the Lena plume during 2017-2020.
According to Figure 6 in Osadchiev et al. (2024), the share of sea ice meltwater in the total volume of the Lena plume was the second highest in 2019 (after 2017 with the share of 26%) during period of 2012-2020. The quantitative attribution of freshwater fluxes from sea ice meltwater is characterized by slightly different distribution through the considered years. The total volume of sea ice meltwater was the largest in 2017 (298 km3) with a decrease in 2018 (230 km3). In 2019 and 2020 the total volume of freshwater was approximately equal and amounted to 175 and 182 km3 respectively. Thus, the share of meltwater in 2019 was the lowest during the study period, despite fairly qualitative estimates due to variability in river discharge. It is important to note, that the impact of meltwater is significantly influenced by the timing of sea ice melting and the extent of river plumes. Once intense ice melting occurs after the initial spreading of the Lena plume, sea ice meltwater significantly contributes to surface freshening, thereby expanding the Lena plume volume and area.
As illustrated in Figure 5, the ice edge retreated to the northern part of the East Siberian Sea in 2019, resulting in a substantial volume of meltwater remaining in the Lena plume by September 2019. In contrast, the East Siberian Sea was completely ice-covered throughout September in 2018, with only a limited amount of meltwater persisting in the plume at its maximum extent.
Wind forcing conditions during two months preceding and one month during oceanographic surveys in 2017, 2018, 2019, 2020, 2021, 2023 are shown in Figure 7. Figures 7a, c, d, g, l, n and q demonstrates prevailing moderate (4–6 m/s) western (including northwestern and southwestern) winds at the shelf area of the Laptev and East Siberian seas in July 2017, September 2017, July 2018, July 2019, September 2020, August 2021 (in the East Siberian Sea) and August 2023. These winds are favorable for eastward spreading of the Lena plume (Dmitrenko et al., 2005; 2010; Janout et al., 2020; Osadchiev et al., 2021b). On the opposite, moderate (5–7 m/s) northward, eastward and south-eastward winds in August 2017, August – September 2018, August – September 2019, July-August 2020, July 2021, July 2023 (in the East Siberian Sea), September 2021 and September 2023 are favorable for northward spreading of the Lena plume are shown on Figures 7b, e, f, h–k, m, o, p and r respectively.
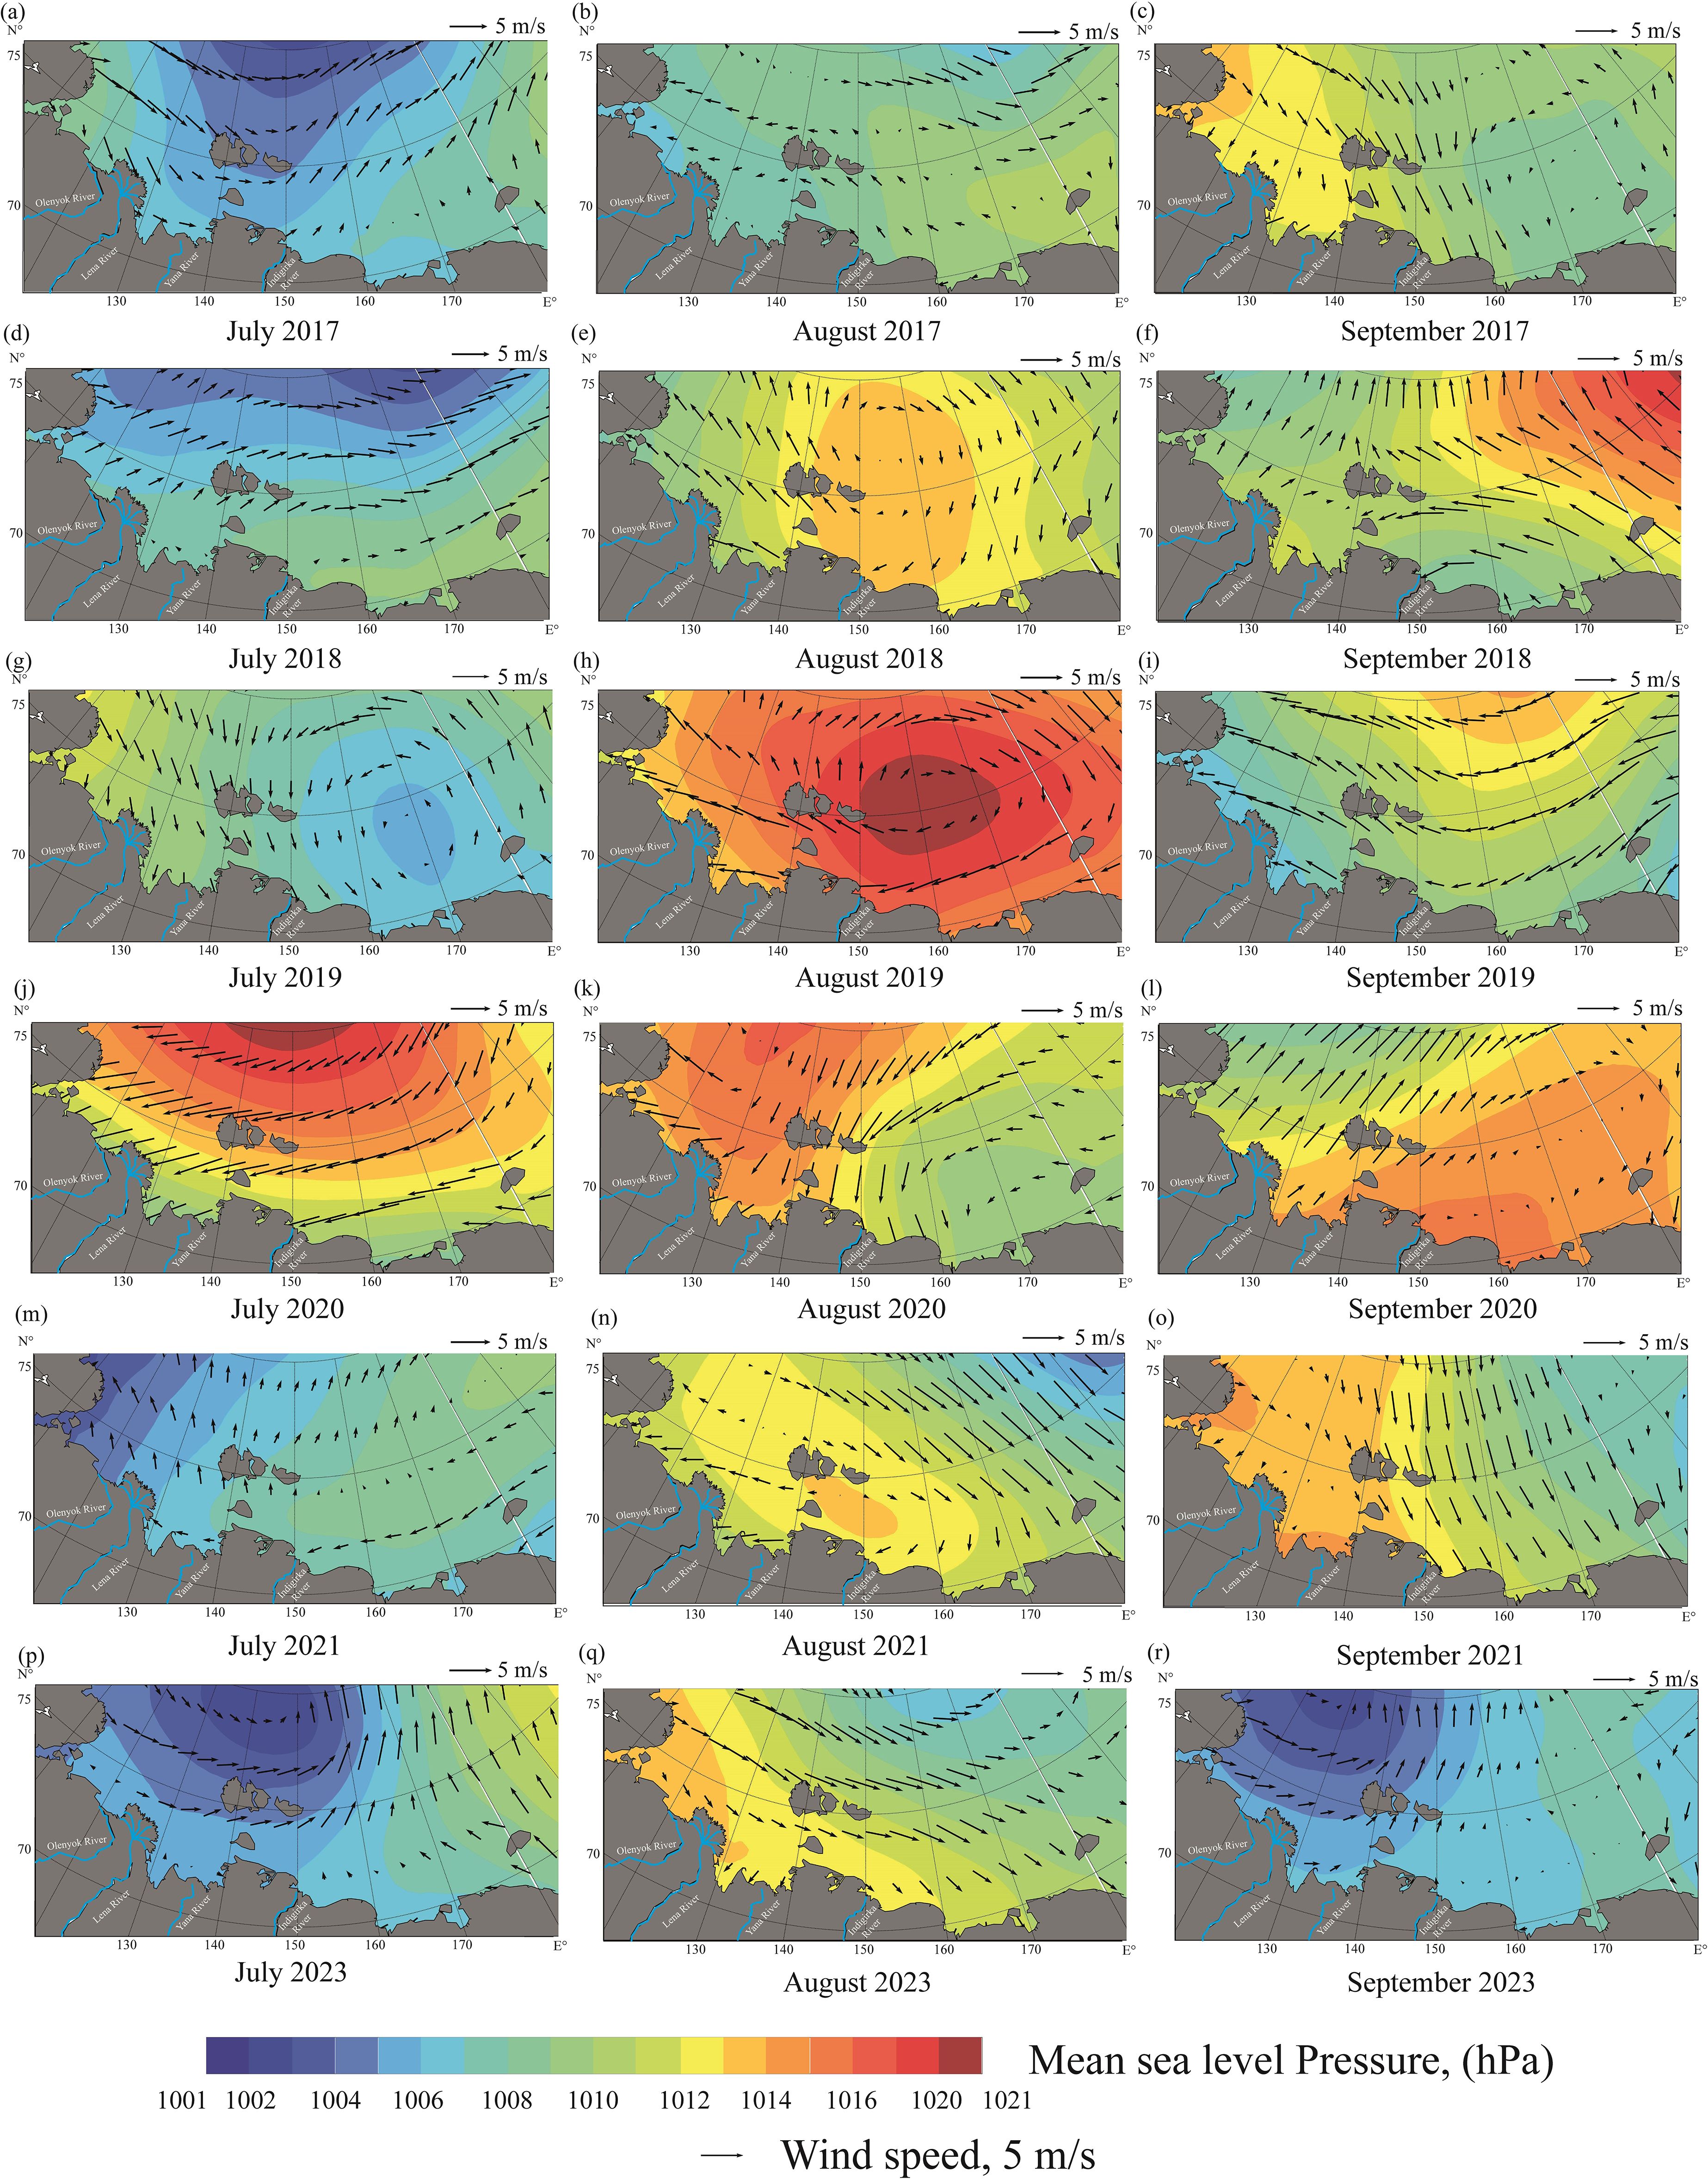
Figure 7. Monthly averaged wind forcing (direction is shown by arrows, mean sea level pressure is shown by color) in the Laptev and East Siberian seas in September 2017 (a-c), July – September 2018 (d-f), July – September 2019 (g-i), July – September 2020 (j-l), July – September 2021 (m-o), and July – September 2023 (p-r) according to ERA5 reanalysis data.
Therefore, wind conditions (wind speed and direction) in July 2017, September 2017, July 2018, July 2019, September 2020, August 2021 (in the East Siberian Sea) and August 2023 were most favorable for eastward propagation of the Lena plume. It is important to note that wind conditions in July 2017 - September 2017 and July-August 2019 were favorable during the period when the area of sea ice in the Laptev and East Siberian seas had already experienced seasonal reduction (Figure 5). As a result, wind forced the freshened surface layer directly. In contrast, during the other years (July 2018, September 2020, August 2021 and August 2023) a stable ice mass remained during early summer in the study area, hindering the impact of wind on the plume spreading.
To quantitatively assess the wind forcing on the Lena plume, Ekman transport and wind stress curl values were calculated using wind reanalysis data and presented in Figure 8. The analyzed data clearly illustrate the direction of the Lena plume advection under the influence of wind forcing. The highest values of the Ekman transport, ranging from 0.1 to 0.2 m²/s, were observed during August-September 2018, August-September 2019, and July 2020. They were associated with the northern plume propagation type (Figures 8e, f, h–j). In contrast, during July 2017, September 2017, August 2020, August-September 2021, and August-September 2023 (Figures 8a, c, k, n, o, q, r), Ekman transport values were notably lower, between 0.05 and 0.1 m²/s, and the direction of the plume advection was southward and westward, pressing the plume to the Siberian coast, which contributed to eastward direction of the Lena plume.
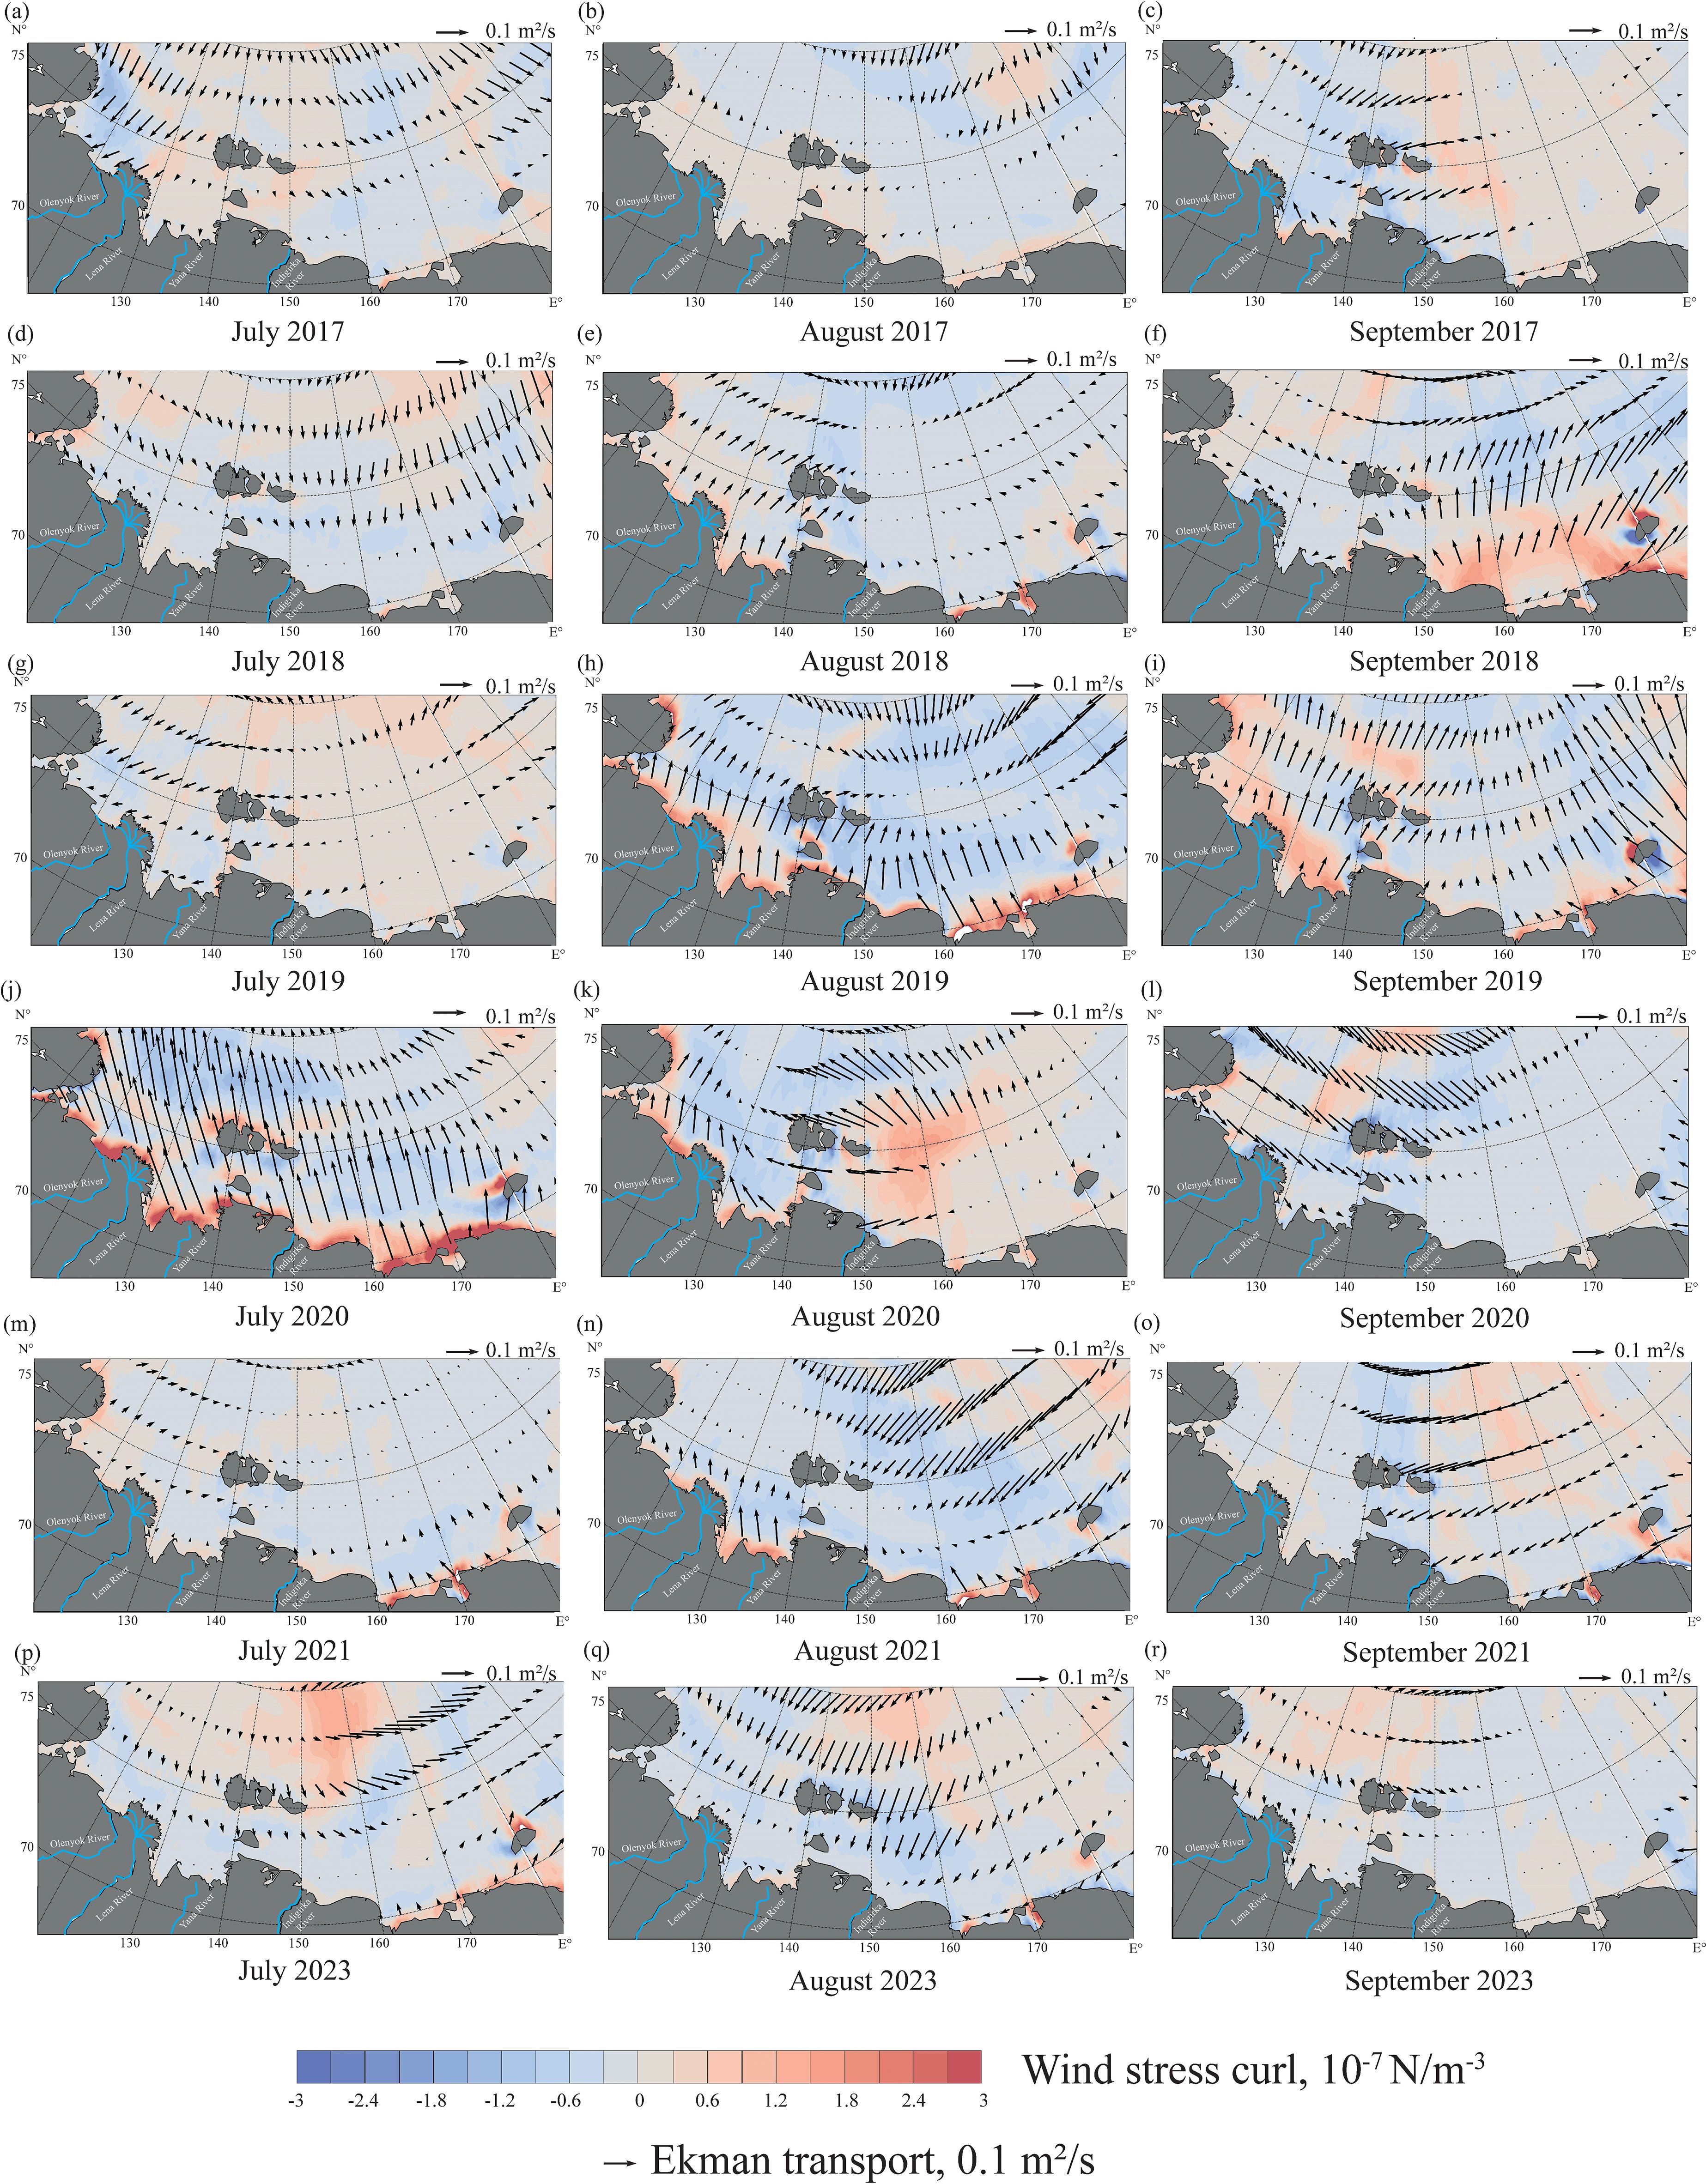
Figure 8. Monthly averaged Ekman transport (direction is shown by arrows, values are shown by arrows size) and wind stress curl (shown by color) in the Laptev and East Siberian seas in July – September 2017 (a-c), July – September 2018 (d-f), July – September 2019 (g-i), July – September 2020 (j-l), July – September 2021 (m-o), and July – September 2023 (p-r) according to ERA5 reanalysis data (https://www.ecmwf.int/en/forecasts/datasets/archive-datasets/reanalysisdatasets/era5).
In September 2020, the Lena plume advection in the Laptev Sea was eastward, with the Ekman transport of 0.15 m²/s (Figure 8l). During August 2017, July 2018, July 2019, and July 2023 (Figures 8b, d, g, p), the Ekman transport values were significantly low (less than 0.05 m²/s), indicating the likely absence of significant Ekman transport on the Lena plume during these periods.
Therefore, wind conditions in July 2017, September 2020, September 2021, and July-September 2023 were the most favorable for the eastward propagation of the Lena plume. It is important to note very low wind influence on the plume in July 2018 and July 2019, which was favorable for the eastward propagation of the plume. It was especially important in 2019 due to rapid seasonal decline of sea ice cover in the Laptev and East Siberian seas (Figure 5). In contrast, during the other years (September 2021 and July-September 2023) a stable sea ice mass remained during early summer in the study area and hindered the impact of wind on the plume spreading - relatively high values of Ekman transport (due to 0.15 m2/s) and positive wind forcing.
3.2 Thermohaline in situ measurements
Oceanographic surveys performed in the eastern part of the East Siberian Sea in September 2018, 2019, 2021 and 2023 demonstrated large inter-annual variability of salinity and temperature in the study area (Figures 9, 10). In 2018, surface salinities (Figure 9a) steadily increased from 26 in the southwestern part of the study area to 28.5 in its eastern part, while temperatures decreased from 2°C to -1°C (Figure 9b). No pronounced thermohaline gradients in the surface layer were observed. In 2019, on the opposite, sharp salinity gradient (frontal zone) was observed at the latitudes of 72-72.5°N separating warm (3-4°C) and low saline (19-21) water in the south and cold (1-2°C) and high saline (26-28) water in the north of the study area (Figure 9b). At the frontal zone, salinity increased from 21.5 to 25.5, while temperature decreased from 4 to 2°C at the distance of ~100 km. In 2021, the thermohaline characteristics in the study area were homogenous. Salinity and temperature varied from 28.0 to 28.5 and -0.5 to -1.5°C, respectively (Figure 9c).
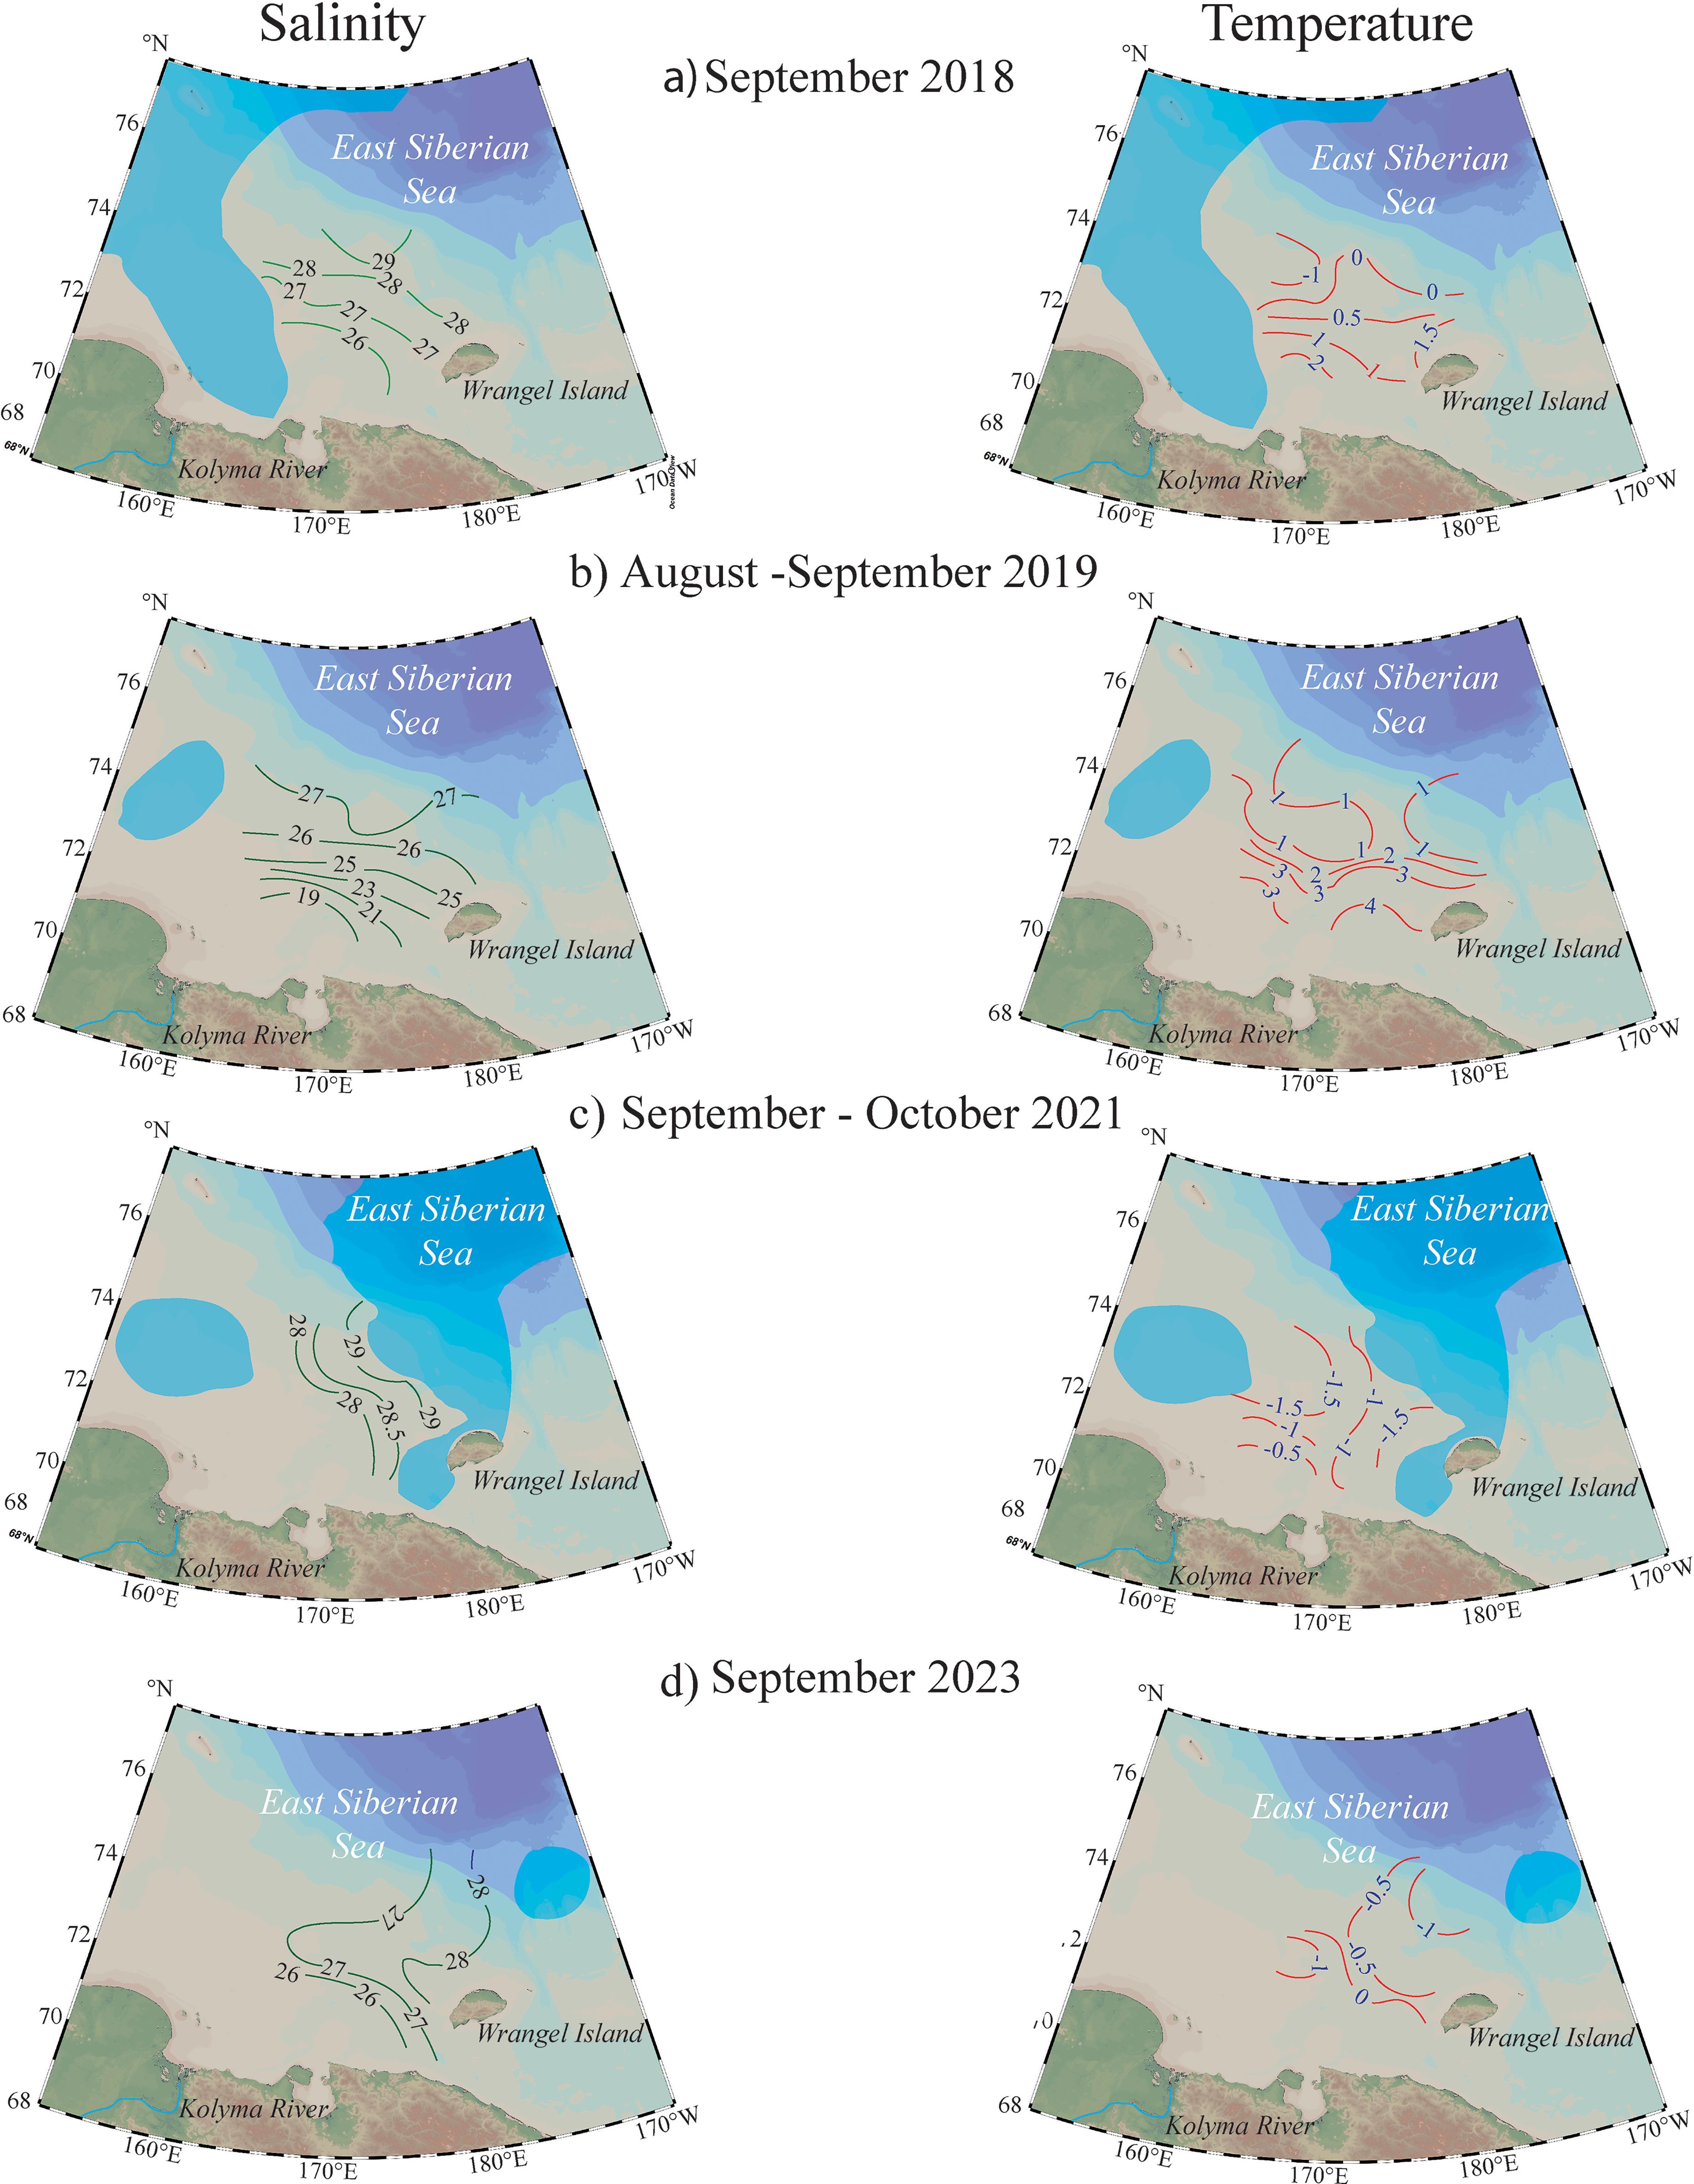
Figure 9. Surface salinity and temperature distribution during oceanographic surveys in September 2018 (a), 2019 (b), 2021 (c) and 2023 (d) in the eastern part of the East Siberian Sea are shown by colored lines, values of salinity and temperature are shown by numbers between colored lines. Blue color indicates the sea ice area.
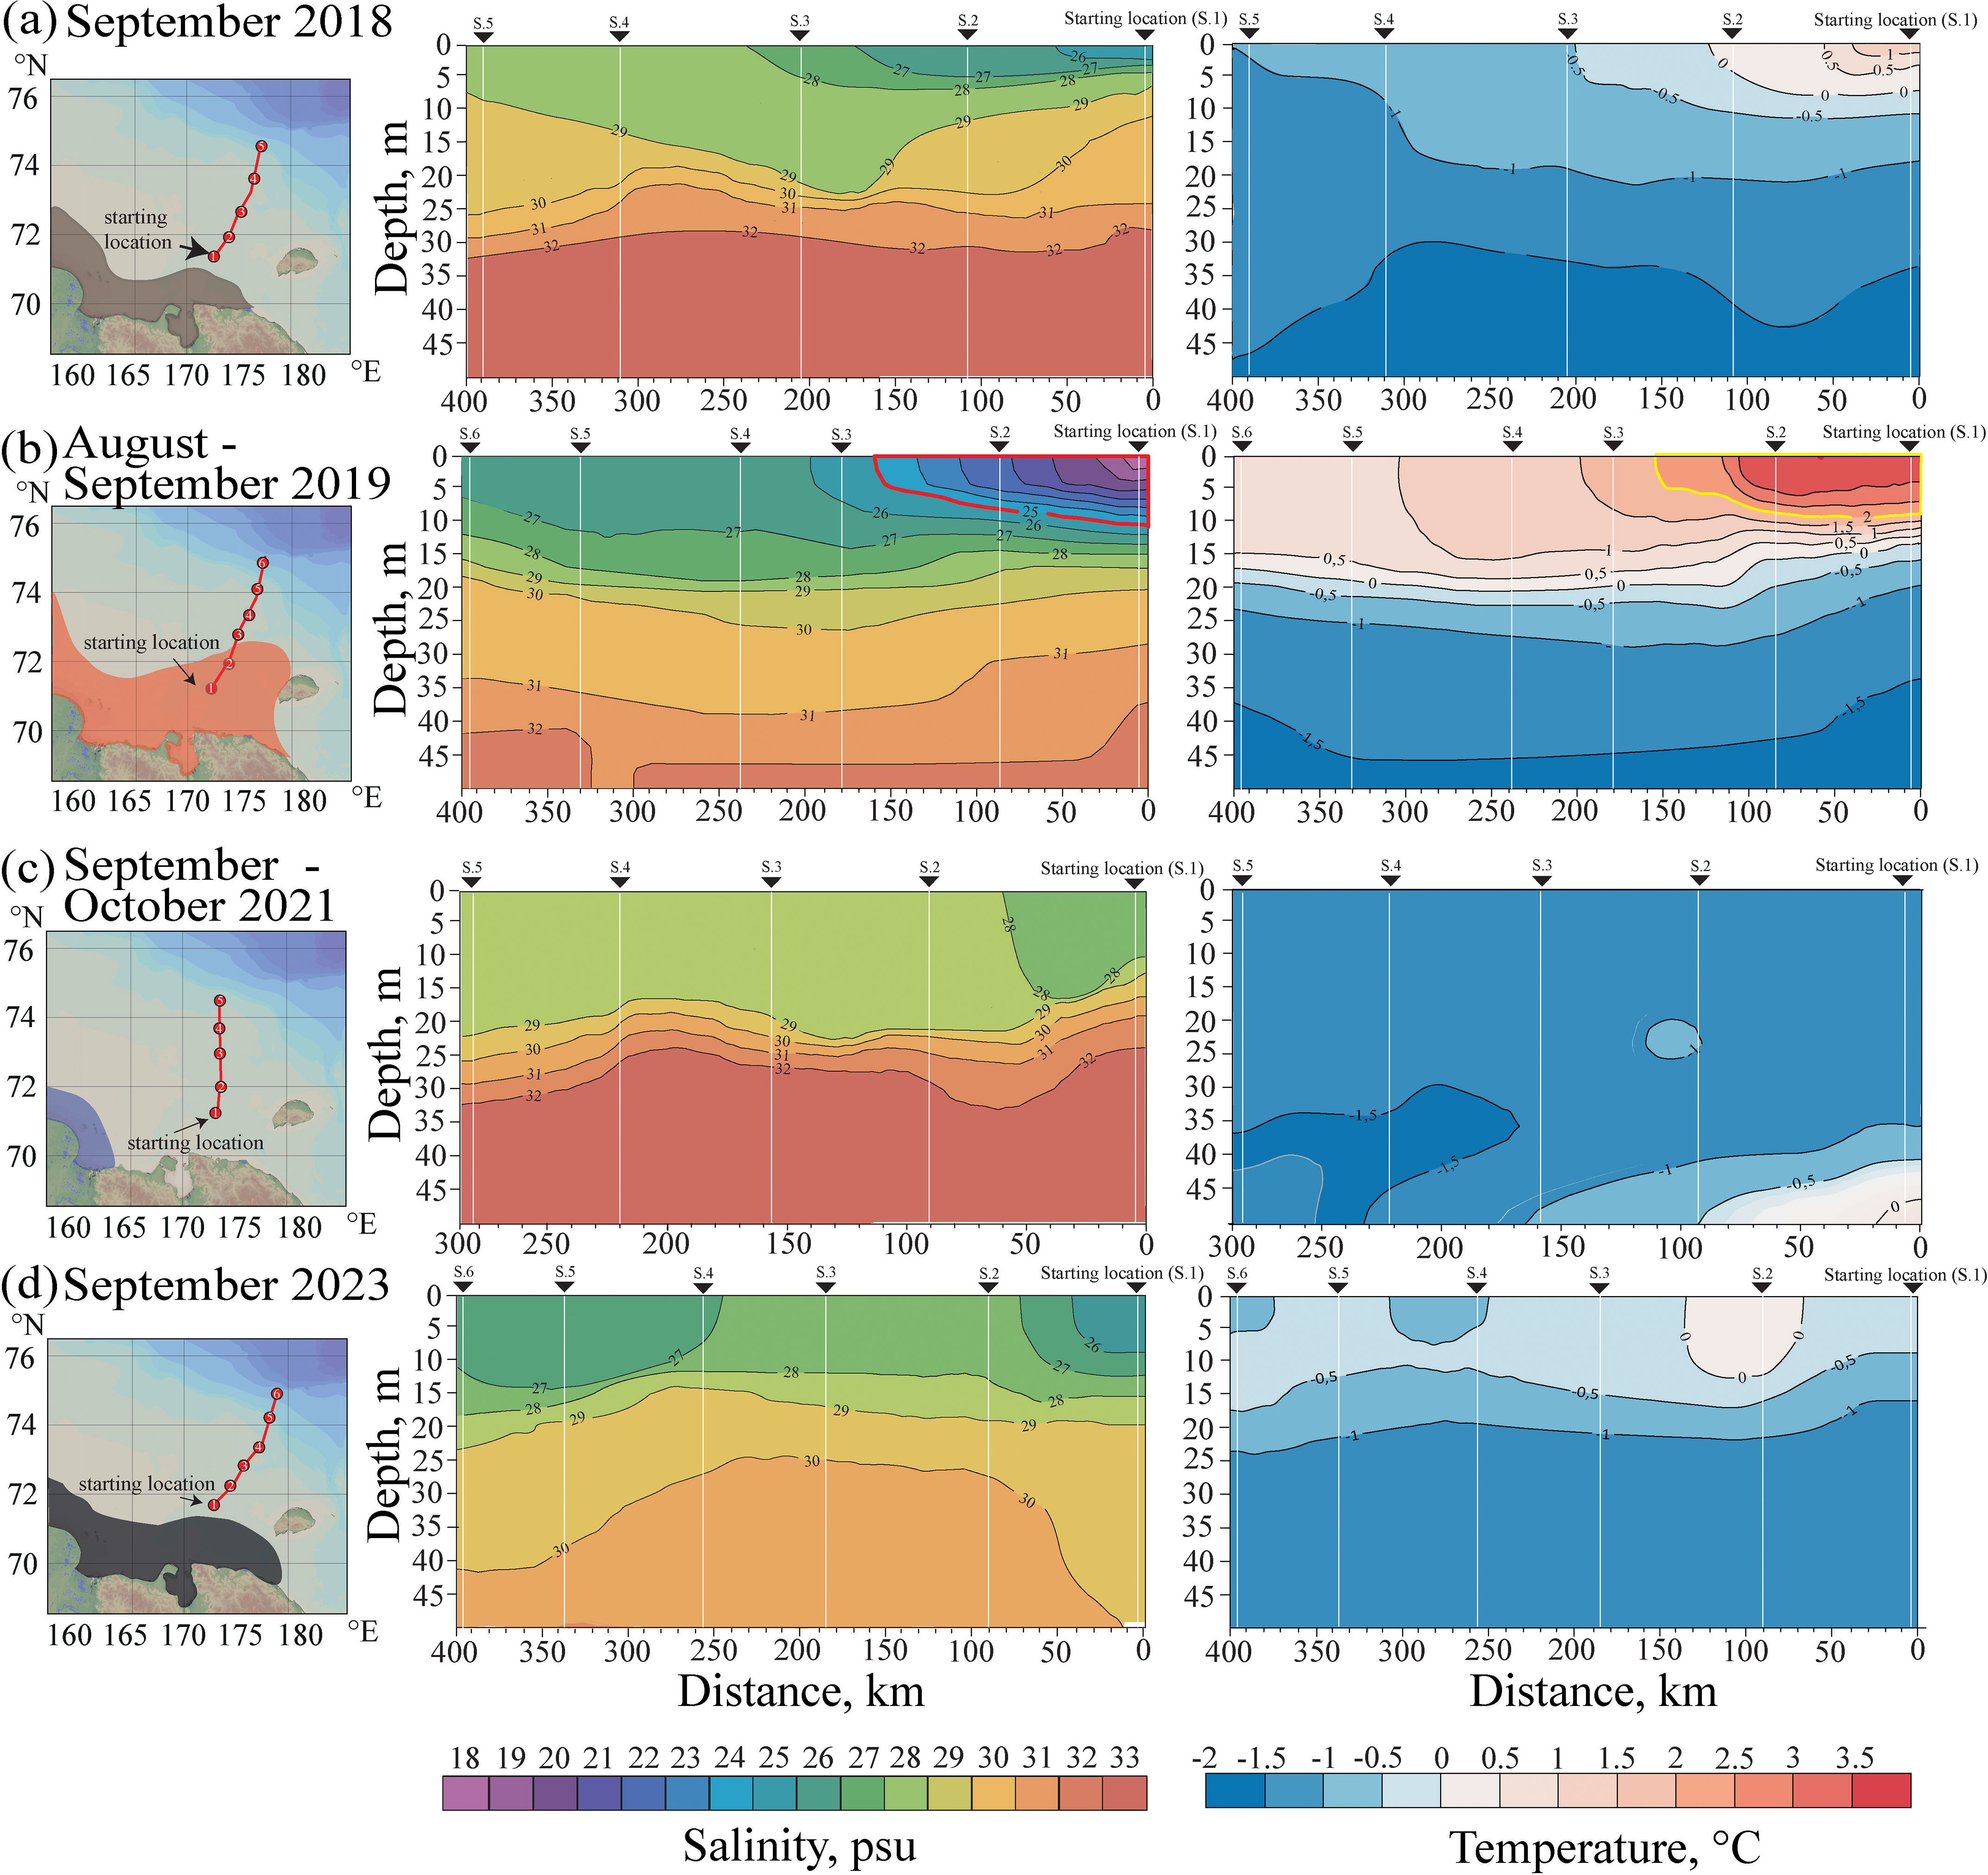
Figure 10. Vertical distribution of salinity and temperature till the depth of 50 meters along quasi-zonal transects in the eastern part of the East Siberian Sea in 2018 (a), 2019 (b), 2021 (c), and 2023 (d) based on in situ measurements. Locations of oceanographic stations are shown on the top of each transect by black triangle and station number. Black arrows on the left insets show locations of the starting points of the sections. Colored areas on the left insets show locations of the Lena plume during in situ measurements based on SMAP SSS data. Red (salinity distribution) and yellow (temperature) distribution lines on transect (10B) show vertical and horizontal borders of the Lena plume.
In 2023, hydrological conditions in the eastern part of the East Siberian Sea were similar to those recorded in 2018, with the lowest salinity values of 26 observed approximately 50 km from the Siberian coast (Figure 9d), but temperature values were 1-2°C lower than in 2018.
Figure 10 illustrates the vertical salinity and temperature structure along quasi-zonal transects in the eastern part of the East Siberian Sea for September 2018, August-September 2019, September-October 2021 and September 2023 and reveals significant differences in the depth and thermohaline characteristics of the surface layer.
Measurements taken along nearly the same transect during slightly different time periods allow for a comparison of the variations in the vertical thermohaline structure of this region over several years. It is important to note that comparing the vertical structure during the ice-free season is crucial, as this season occurs during different days and months in the East Siberian Sea (Figure 5), which leads to variations in the timing of in situ measurements.
The vertical distribution of salinity and temperature in 2018 (Figure 10a) demonstrated freshened (26-28) and warm (0.5-1.5°C) surface layer near the Siberian coast. Below this 5 m deep layer, values of salinity and temperature decreased to 30–31 and -1.5°C, respectively. In 2019, the vertical thermohaline structure along the southern part of the transect was characterized by much lower surface salinity (19-26) and higher temperatures (2-4°C) till the depth of 15 m, which is typical for the Lena plume in the Laptev and East Siberian seas (Spivak et al., 2021; Osadchiev et al., 2021b). The freshened surface layer with salinities 27–29 and temperatures 0.5-1.5°C (similar to that observed in 2018) occupied the central and northern parts of the transect in 2019.
In 2021, the meridional transect was shifted slightly to the west as compared to transects in 2018–2019 and 2023 due to presence of seasonal sea ice in the eastern part of the East Siberian Sea. In 2021, the entire water column down to the depth of 20–25 meters was well mixed due to late autumn vertical convection processes (Osadchiev et al., 2023c). As a result, salinity values in the upper mixed layer ranged from 29 to 32, with salinity gradient at the depths of 25–35 meters. Temperature values were stable throughout the entire water column ranging from -1 to -1.5°C. In 2023, vertical distribution of temperature and salinity was slightly similar to 2018. However, salinity values in the northern part of the transect were lower (27-28) and surface temperature also was low (-0.5-0°C).
3.3 Satellite-derived surface salinity measurements
The analysis of in situ data collected in the eastern part of the East Siberian Sea allows us to estimate presence or absence of the Lena plume in this area. In order to assess the spreading area of the Lena plume in the Eastern Arctic and to compare it with the available in situ data, we analyzed new SSS satellite data (Savin et al., 2024). Figure 11 illustrates spatial distribution of the Lena plume (defined by the isohaline of 25) in the Laptev and East Siberian seas during the periods of oceanographic surveys in 2018-2023. The spatial distribution of the Lena plume in 2017 and 2020 was also compared with the plume area in study period due to similar ice conditions in 2017 and 2020 to 2019. Location of the eastern boundary of the Lena plume according to SSS data (Figure 11) is consistent with the in situ measurements in the eastern part of the East Siberian Sea (Figures 9, 10).
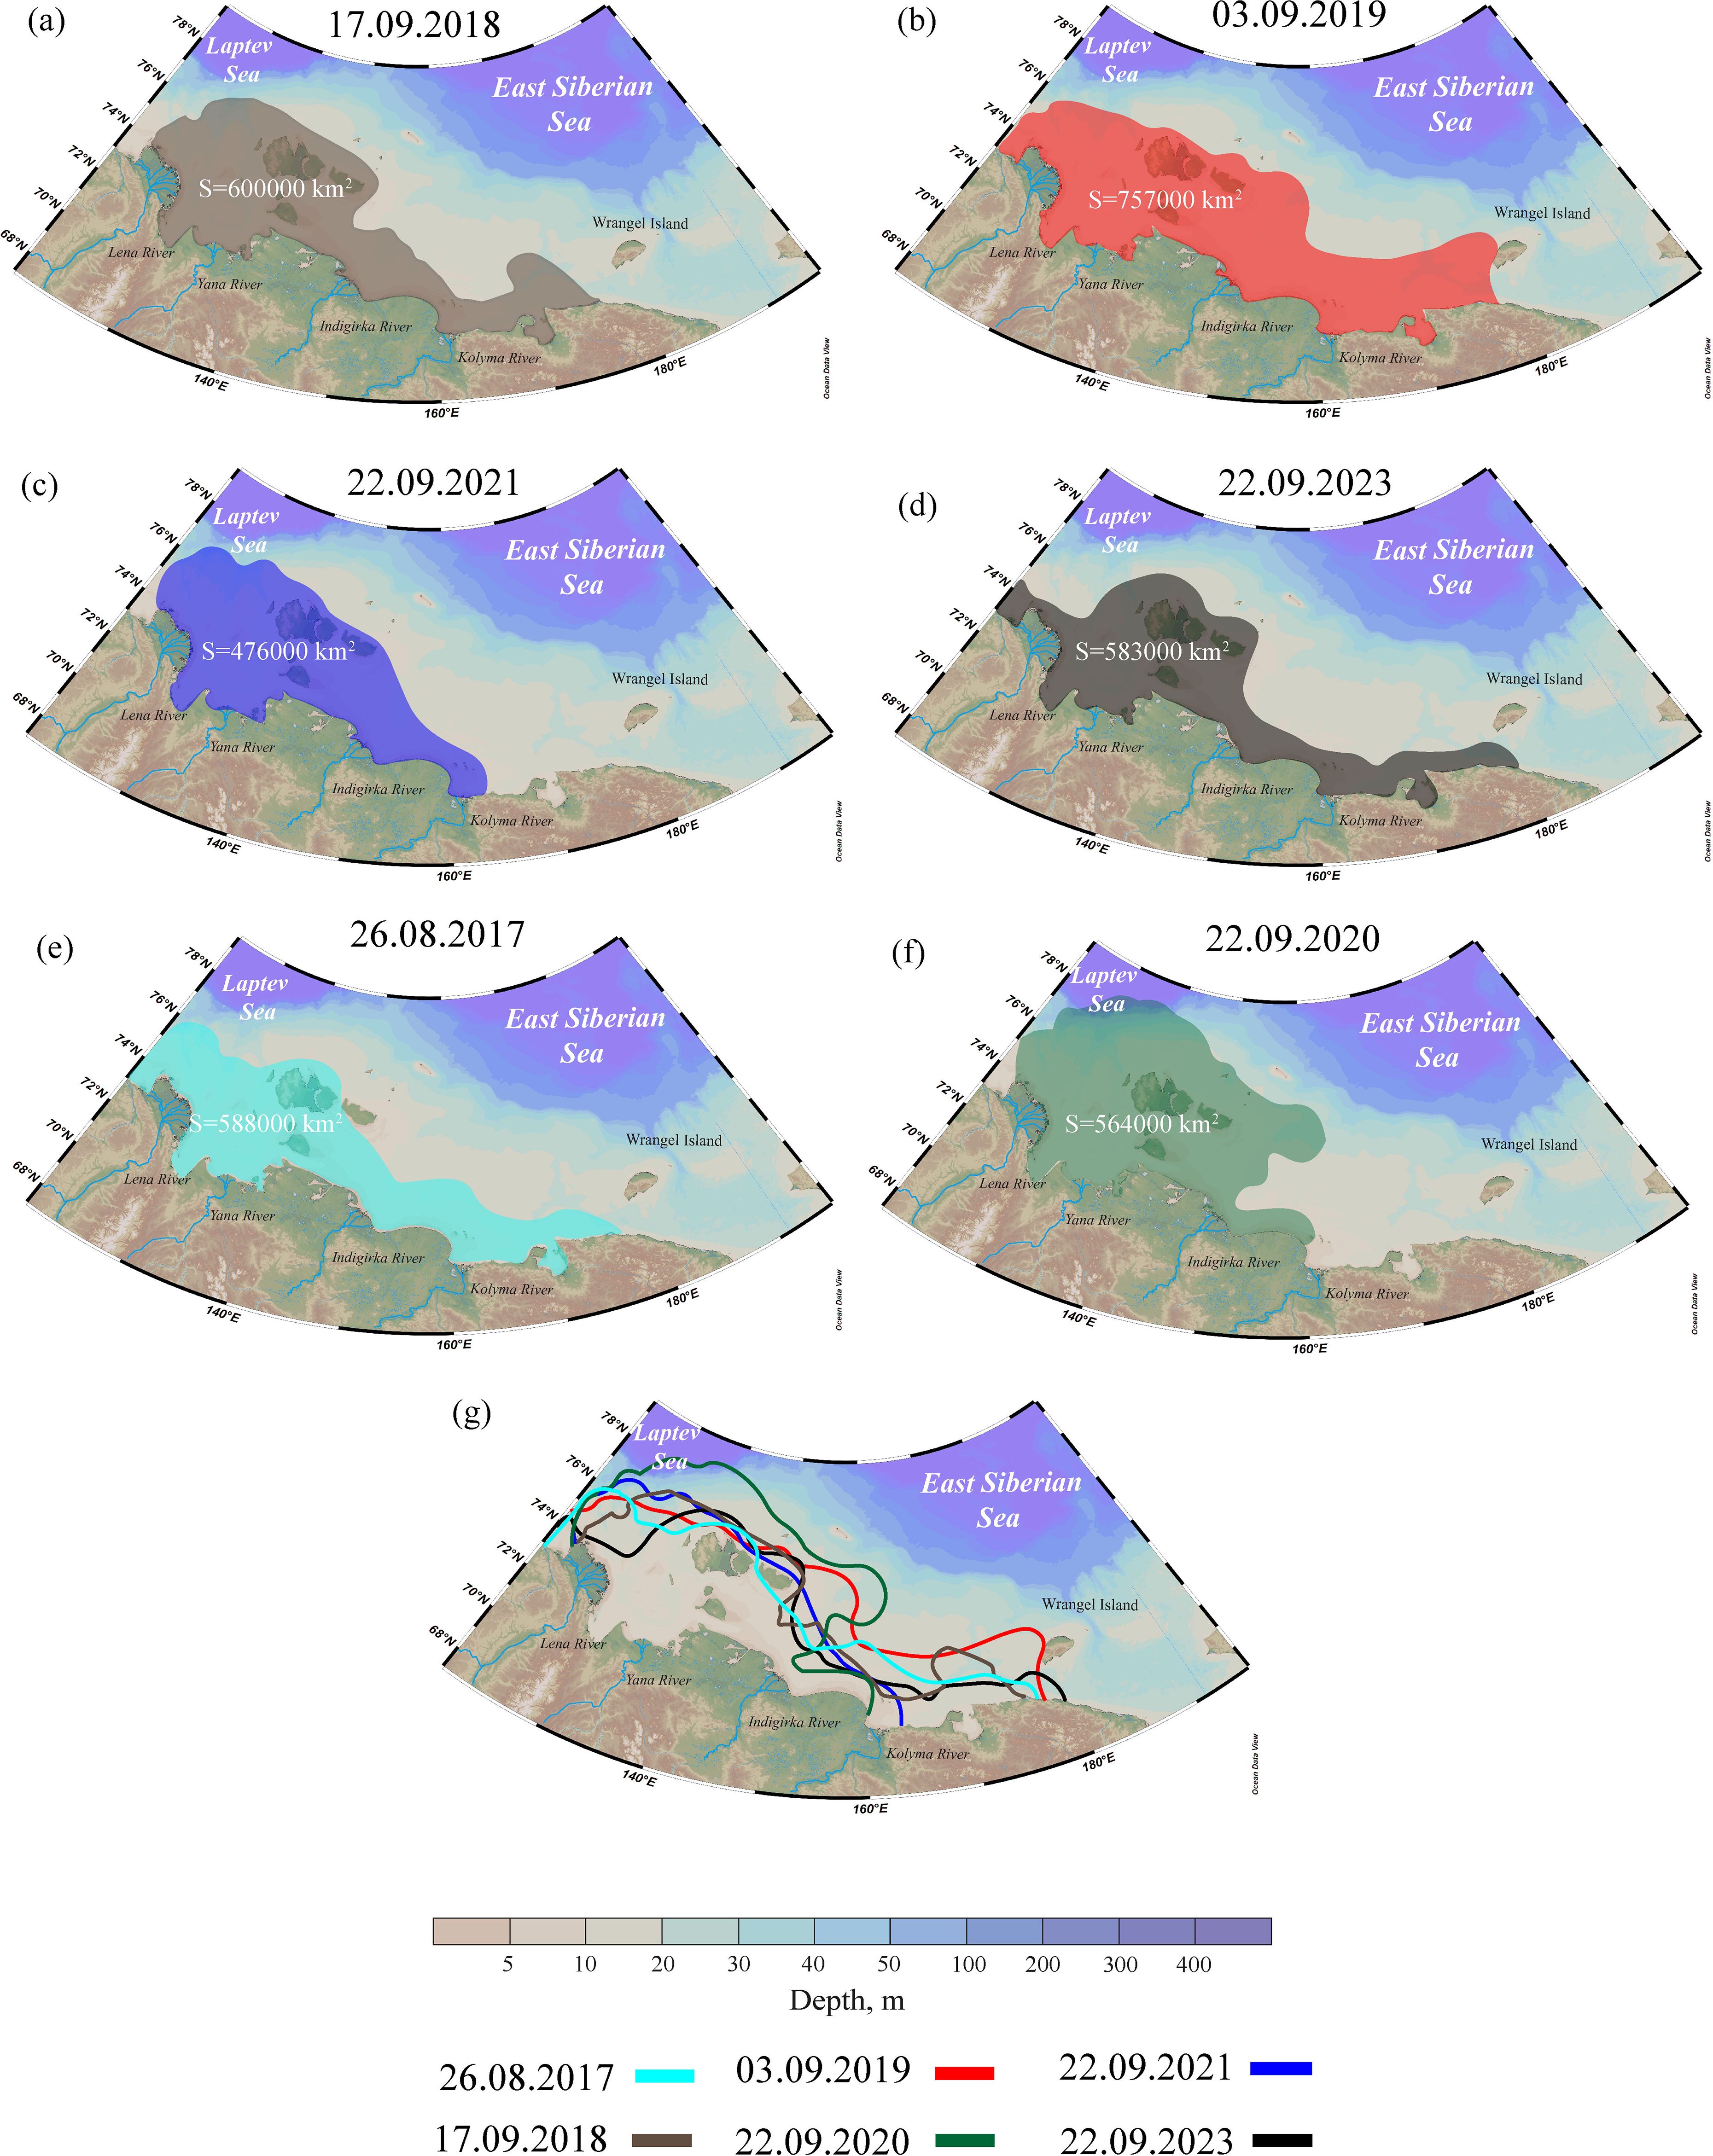
Figure 11. Spreading area of the Lena plume during the periods of oceanographic surveys on 17 September 2018 (a), 3 September 2019 (b), 22 September 2021 (c), 22 September 2023 (d), 26 August 2017 (e), 22 September 2020 (f) and location of the Lena plume boundary during these days (g) according to SMAP SSS data. Dates are presented in dd.mm.yyyy format.
Spreading of the Lena plume shows significant inter-annual variability (Figure 11g). First, the Lena plume occupied the whole eastern part of the East Siberian Sea till the Wrangel Island in August 2019 (Figure 11b), which was also registered by vertical salinity measurements (Figure 10b). Second, in September 2017, September 2018 and September 2023, the Lena plume was distributed mainly in the coastal zone of the East Siberian Sea till the Long Strait (Figures 11a, d, e), as a result low salinities were observed in the southern parts of the transects (Figures 10a, d). Third, the eastern boundary of the Lena plume in September 2020 and 2021 was located far from the Wrangel Island (Figure 11c) and surface salinities in the eastern part of the East Siberian Sea were the highest among the analyzed years (Figure 9c).
The eastward spreading of the Lena plume in the East Siberian Sea in 2017, 2018, 2019, and 2023 and its accumulation in the southwestern part of the East Siberian Sea in 2020 and 2021 is consistent with wind forcing conditions in the study area (Figures 7, 8). It is important to note that sea ice remained in the eastern part of the East Siberian Sea in early September 2018, 2021, and 2023 (Figure 5). Consequently, the moderate surface freshening at the northern part of the transect during these periods (Figures 11a, c, d) resulted from sea ice melting.
The area of the Lena plume demonstrates significant inter-annual variability (Figure 11). The largest plume area (757–000 km2) during study period was registered in late August 2019, due to presence of the Lena plume in the eastern and northeastern part of the East Siberian Sea. The smallest plume area (476 000 km2) was observed in late September 2021 due to presence of the plume only in the southwestern part of the East Siberian Sea. In September 2018, the Lena plume covered an area of 600 000 km², while in August 2017, September 2020 and September 2023, the areas were 588 000 km², 564 000 km² and 583 000 km², respectively. These intermediate values were significantly smaller than the area observed in August 2019, despite similar ice conditions in 2017 and 2020.
3.4 Phytoplankton communities
The species diversity of phytoplankton in the East Siberian Sea were addressed in several previous studies (Okolodkov, 1993; Polyakova, 1982; Polyakova et al., 2021; Sukhanova et al., 2021). In total, 215 phytoplankton species are reported in the East Siberian Sea, among them 147 species (68%) are diatom algae. Seven algal divisions are represented, namely, Bacillariophyta, Chlorophyta, Cryptophyta, Cyanobacteria (Cyanophyta), Euglenophyta, Miozoa (Dinophyta), Ochrophyta. The genera Chaetoceros, Navicula, Nitzschia, Protoperidinium, Thalassiosira have the largest number of species, which is typical for the Arctic seas. Most species are true planktonic forms, several species belong to the ice flora. Relatively low species diversity and presence of a single cold-water Arctic-boreal diatom complex dominating the phytoplankton composition is typical for the phytoplankton of the East Siberian Sea. This diatom complex includes mainly cryophiles and early spring (mostly diatom) species that develop near ice edge during ice-opening period. At the same time, the species diversity of phytoplankton in the neighboring seas (the Chukchi and Laptev seas) is much higher (Sergeeva et al., 2010; Druzhkova and Makarevich, 2013; Sukhanova et al., 2017).
The distribution of quantitative indicators of development and qualitative composition of phytoplankton in the East Siberian Sea is characterized by significant heterogeneity, which is similar to the Chukchi Sea (Sergeeva et al., 2010) and the Laptev Sea (Sukhanova et al., 2017). Cell abundance in these seas varied from 0.93 to 322 million cells/m3 and biomass ranged from 4.2 to 1070 mg/m3 (Glebov et al., 2016; Polyakova et al., 2021; Sukhanova et al., 2021).
The composition of phytoplankton communities is influenced by different parameters of environment, including sun radiation, salinity, temperature, nutrients, etc. (Edwards et al., 2013). Many phytoplankton species could be assigned to distinguish ecological group based on their occurrence (Ahyong et al., 2025). There are algal species that live only in freshwater and river plume (Polyakova et al., 2021), which are indicators of riverine influence on algal communities. In addition, a group of species that are cryophilic or associated with ice is clearly distinguished. They are found both in ice directly and then in meltwater around seasonal ice (Werner et al., 2007; Szymanski and Gradinger, 2016), and gradually disappear with further succession of marine phytoplankton communities (Druzhkova and Makarevich, 2013).
To assess the impact of thermohaline conditions on the state of phytoplankton communities in the eastern part of the East Siberian Sea, phytoplankton samples were collected in the surface layer in 2019 and 2023. In 2019, a total of 52 taxa of microalgae (of which 43 were identified to species) were recorded in the study area (Table 2). All noted forms belong to the following 5 divisions: Bacillariophyta (28 species), Miozoa (Dinophyta) (18 species), Ochrophyta (2 species), Cryptophyta (1 taxon), Haptophyta (1 taxon).

Table 2. Phytoplankton communities from the 2019 and 2023 surveys.
The greatest diversity is characterized by diatom algae (54% of the total number of taxa). They were represented by 13 genera, among which the greatest number of species is represented by the genus Chaetoceros (12 species), genera Attheya (2 species), Coscinodiscus (2 species), Navicula (2 species), and Pseudo-nitzschia (2 species). The other 8 genera were represented by single species. Most of the recorded species are planktonic forms with arcto-boreal or cosmopolitan distribution. Among diatom algae, Chaetoceros borealis and C. diadema were recorded at almost all stations (91% of encounters). The following species were observed at more than half of all stations: C. decipiens (52%), Chaetoceros sp. (65%), C. ingolfianus and Synedropsis hyperborea (56.5%), Cylindrotheca closterium (74%).
Dinophyte algae accounted for 38% of the total number of taxa. The diversity of dinophytes was represented by 7 genera, including Protoperidinium (7 species), Gyrodinium (4 species), Amphidinium (2 species), with one species each from the remaining genera. The highest occurrence of dinophyte algae was observed in Gyrodinium cf. crassum (43% of stations), Scrippsiella acuminata (39%), Amphidinium crissum (30%), Gyrodinium cf. pingue (30%), P. brevipes and P. pellucidum (30%). The contribution of other algal divisions (Cryptophyta, Haptophyta, Ochrophyta) to the species diversity of the study area is insignificant and amounts to 8% of the total number of taxa. Among them Dinobryon balticum had the highest occurrence (17%).
In 2023, a total of 48 taxa of microalgae were registered in the study area (Table 2). All noted forms belonged to four divisions, namely, Bacillariophyta (24 species), Dinophyta (Miozoa) (21 species), Chlorophyta (1 species), Ochrophyta (2 species). The greatest diversity was registered for diatom algae, which provided 50% of the total number of taxa in the phytoplankton community. They are represented by 10 genera, among which the genus Chaetoceros is represented by the largest number of species (11 species). Among the frequently occurring genera, the genus Thalassiosira is represented by 4 species, the genus Coscinodiscus is represented by 2 species, and the remaining seven genera are represented by one species. Other taxa occurred at less than half of all stations, among them Chaetoceros borealis, Chaetoceros diadema, Chaetoceros sp., Thalassiosira angustelineata were recorded at 6–8 stations. Dinophyte algae constituted 44% of the total number of taxa in the community and were represented by 9 genera. Among them, 11 species were registered in the genus Protoperidinium, 3 species were registered in the genus Dinophysis, the other genera were represented by one species. The detected species are typical for the planktonic marine biota at the study region. The highest occurrence of dinophyte algae was recorded for Protoperidinium brevipes, high occurrence was observed for Protoperidinium pellucidum, Scrippsiella acuminata, Protoperidinium bipes and Actiniscus pentasterias, the other taxa were recorded at less than half of the stations. Additionally, three species from Chlorophyta and Ochrophyta divisions were recorded in the study area. Freshwater species Crucigenia tetrapedia (Chlorophyta) were registered only at the southernmost station, where salinity values were < 26. The Ochrophyta species, Dinobryon balticum (Chrysophyceae) and Octactis speculum (Dictyochophyceae) were recorded in the whole study area.
Comparison of alpha diversity in 2019 and 2023 shows that the Chao-1 index (Figure 12) has good correlation with the number of taxa and was higher in 2019 than in 2023. The Shannon diversity index is very different for these years due to the fact that species occurrence was uniform in 2023.
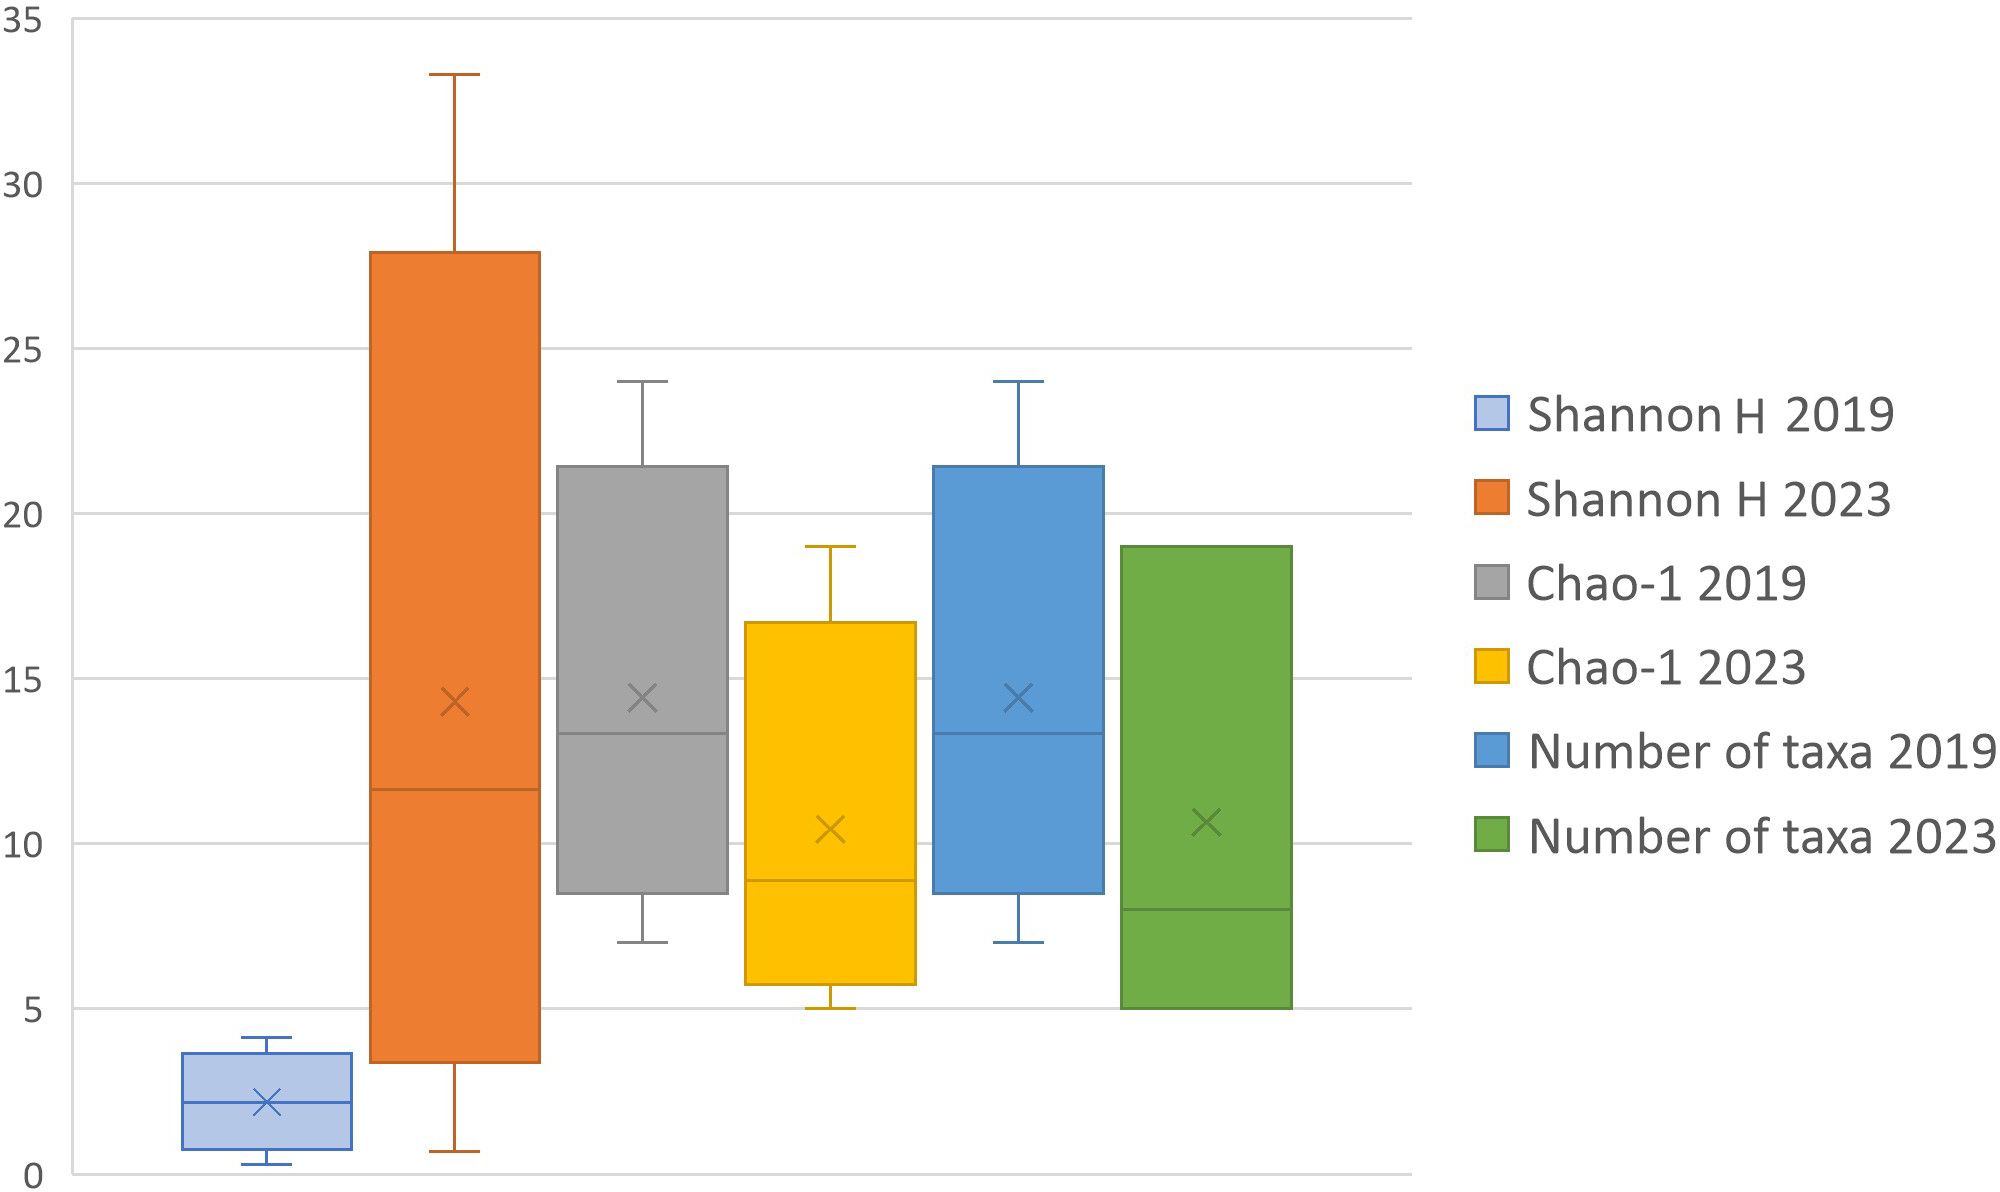
Figure 12. Alpha diversity of phytoplankton communities in the eastern part of the East Siberian Sea during oceanographic surveys in 2019 and 2023.
Hereby, we observed marine phytoplankton communities in 2019 and 2023 in different succession stages, but similar to those described previously (Polyakova et al., 2021; Sukhanova et al., 2021). The community in September 2019 was at the final stage of bloom or spring-summer stage, as indicated by the diversity and abundance of the genus Chaetoceros, as well as the presence of Scrippsiella acuminata and Skeletonema costatum. In September 2023, the community had already entered an autumn stage of during the study period, indicating a decrease in the abundance and biomass, as well as an increase in the proportion of heterotrophic species of Dinophyta. However, the community is typical for the shelf waters of the Eastern Arctic seas. In 2019 and 2023, the most algal species belonged to boreal neritic (characteristic of shelf waters) marine planktonic algae (Ahyong et al., 2025). However, among them, indicators of different freshened water masses were found and they were associated with the river runoff or meltwater.
In 2019, the sea ice-associated algae Pseudo-nitzschia delicatissima (Szymanski and Gradinger, 2016) was registered in the northern part of the study area, and Cylindrotheca closterium (Werner et al., 2007) was observed throughout the whole study area. Both of these species, as well as Chaetoceros socialis, are typical for shelf waters of the Eastern Arctic, which are affected by large river runoff (Polyakova et al., 2021). In 2023, these species were recorded sporadically in the southern part of the study area.
In 2023, the species Aulacoseira islandica was recorded at 19 stations, with the exception of several stations in the southern part of the study area. This taxon is considered to the river plume areas and was previously recorded in the East Siberian Sea only near river mouths (Polyakova et al., 2021). The freshwater species Crucigenia tetrapedia (Guiry et al., 2018) was also registered in 2023 at the station with the lowest salinity (< 26). The cryophilic species Thalassiosira nordenskioeldii (Szymanski and Gradinger, 2016) was found in the northern part of the study area. Pseudo-nitzschia cf. seriata supposed to be a cryophilic species (Werner et al., 2007; Szymanski and Gradinger, 2016) occurred in the southern part of the water area in both years.
To summarize the above, the phytoplankton communities consist of predominantly marine species with strong influence of low-salinity water originating from sea ice meltwater and river discharge. Ice-derived species were rarely found at individual stations, while species of river plume origin were found over a significant part of the study area. The extended spreading time of the Lena plume in 2019 in the study area provided enough time for formation of a specific low-salinity phytoplankton community with the elimination of riverine species, while moderate presence of the Lena plume in 2023 brought riverine algae species into the study area.
4 Discussion
Spreading of the Lena plume in the Laptev Sea and in the adjacent western part of the East Siberian Sea is rather well studied (Dmitrenko et al., 2005; 2010; Savelieva et al., 2010; Janout et al., 2020; Osadchiev et al., 2021b; Spivak et al., 2021). Wind forcing determines the general spreading direction of the Lena plume in this area. Position of the northern boundary of the Lena plume varies from 74-76°N in case of eastward winds to 76-78°N in case of westward winds (Osadchiev et al., 2021b). The depth of the Lena plume in the Laptev Sea and in the western part of the East Siberian Sea is 10–20 m (Osadchiev et al., 2021b). However, the spreading of the Lena plume in the eastern part of the East Siberian Sea has not been reported previously. The previous in situ measurements performed in 2003-2017 (Figure 7 in Osadchiev et al. (2021b)) and registered the eastern boundary of the Lena plume at the longitudes of 160-170°E.
In situ measurements performed in 2018, 2019, 2021, and 2023, which are described in this study, demonstrate that well-developed freshened surface layer was present in the eastern part of the East Siberian Sea in September 2019 (Figures 9, 10). During this period, the 15 m deep layer with salinities <26 and temperatures >2°C was observed to the west from the Wrangel Island, i.e., till the longitude of 180°E (Figures 9b, 10b). We associate this deep, warm, and low saline layer bounded by sharp salinity and temperature gradient with spreading of the Lena plume (albeit with a certain contribution of meltwater, which will be addressed below). The Lena plume was also observed along the Siberian coast in the southern part of the study area in September 2018 (Figures 9a, 10a) and September 2023 (Figures 9d, 10d).
The low-saline surface layer was also observed in the northeastern part of the East Siberian Sea in September 2018, September 2021, and September 2023 (Figures 9, 10). However, we associate this layer with inflow of meltwater without the influence of river discharge due to following reasons. First, salinities of the surface layer during these periods were 27-29, which is typical for meltwater (Salganik et al., 2023; Osadchiev et al., 2024), but higher than those registered in the Lena plume (Spivak et al., 2021; Osadchiev et al., 2021b). Second, temperatures of the surface layer were ~ 0°C, which is also typical to meltwater (which has source temperature of 0°C), but much lower than those typical to river discharge (which has source temperature of 12-14°C) (Osadchiev et al., 2021b; Chalov et al., 2023). Third, depth of the surface mixed layer was 25–35 m, which is greater than depth of the Lena plume. Finally, absence of sharp horizontal and vertical temperature and salinity gradients observed in the study area in 2018, 2021, and 2023 is typical for mixing of meltwater with saline seawater rather than spreading of the Lena plume.
Wind forcing conditions observed during the warm season in 2021 and 2023 (Figures 7, 8) resulted in the eastward spreading of the Lena plume described above. On the opposite, during July 2018 and 2019, the wind influence was minimal that it had very low effect on the river plume and did not shift its spreading in the eastward direction under the influence of the Coriolis force. However, the Lena plume occupied much greater area in the eastern part of the East Siberian Sea in 2019, as compared to 2018, 2021 and 2023. This feature is caused by different sea ice conditions in July – September during these years (Figure 5). Early sea ice decline along the Siberian coast at the Laptev and East Siberian seas (Figure 5b) and the absence of negative (here and further – wind direction which limiting plume distribution in the Laptev Sea and reducing its area) wind forcing in July 2019 resulted in eastward spreading of the Lena plume (Figure 11b). We presume that the Lena plume in 2019 reached the Wrangel Island in late July or early August, albeit there are no distinct evidences of that due to absence of in situ and satellite salinity data.
It is important to note that it is not always the case that rapid decrease in the extent of sea ice directly determines of the subsequent expansion of the Lena plume. In particular, area of the Lena plume in 2020 was significantly smaller than in 2019 (Figure 11), despite similar ice conditions during both years. Moderate eastward winds (up to 6–7 m/s) contributed to distribution of the Lena plume in northward direction due to Ekman transport and reduced its area. In 2017 area of the Lena plume had type of distribution slightly the same to 2018 and 2023 and less than in 2019 despite early sea ice decline due to eastward winds in September, which contributed to advection of the Lena plume to the west.
The subsequent northward and westward wind forcing in August and September 2019 under ice-free conditions in the East Siberian Sea resulted in eastward and northward spreading of the Lena plume and caused a significant increase of its area (Figures 9, 11). On the opposite, presence of consolidated ice coverage in the East Siberian Sea till the beginning of September in 2023 (Figure 5d) and the middle of September in 2018 (Figure 5a) effectively isolated the Lena plume from positive wind forcing. As a result, the eastern part of the plume remained localized along the Siberian coast in 2018 and 2023.
The quick and energetic response of the Lena plume on wind forcing during ice-free conditions, which is typical for river plumes (Korotkina et al., 2014; Osadchiev et al., 2016, 2021), is illustrated by abrupt changes in its position in August – September 2019, as reconstructed from SSS data (Figure 13). During the intense sea ice decline in the middle of August, the eastern part of the Lena plume remained localized along the Siberian coast in the East Siberian Sea (Figure 13a). Moderate (4–7 m/s) eastward winds over the notably ice-free southern part of the East Siberian Sea shifted offshore the eastern part of the Lena plume to the latitude of 72-73°N. As a result, the wide area in the northeastern part of the East Siberian Sea became covered by the Lena plume in late August 2019 (Figure 13b).
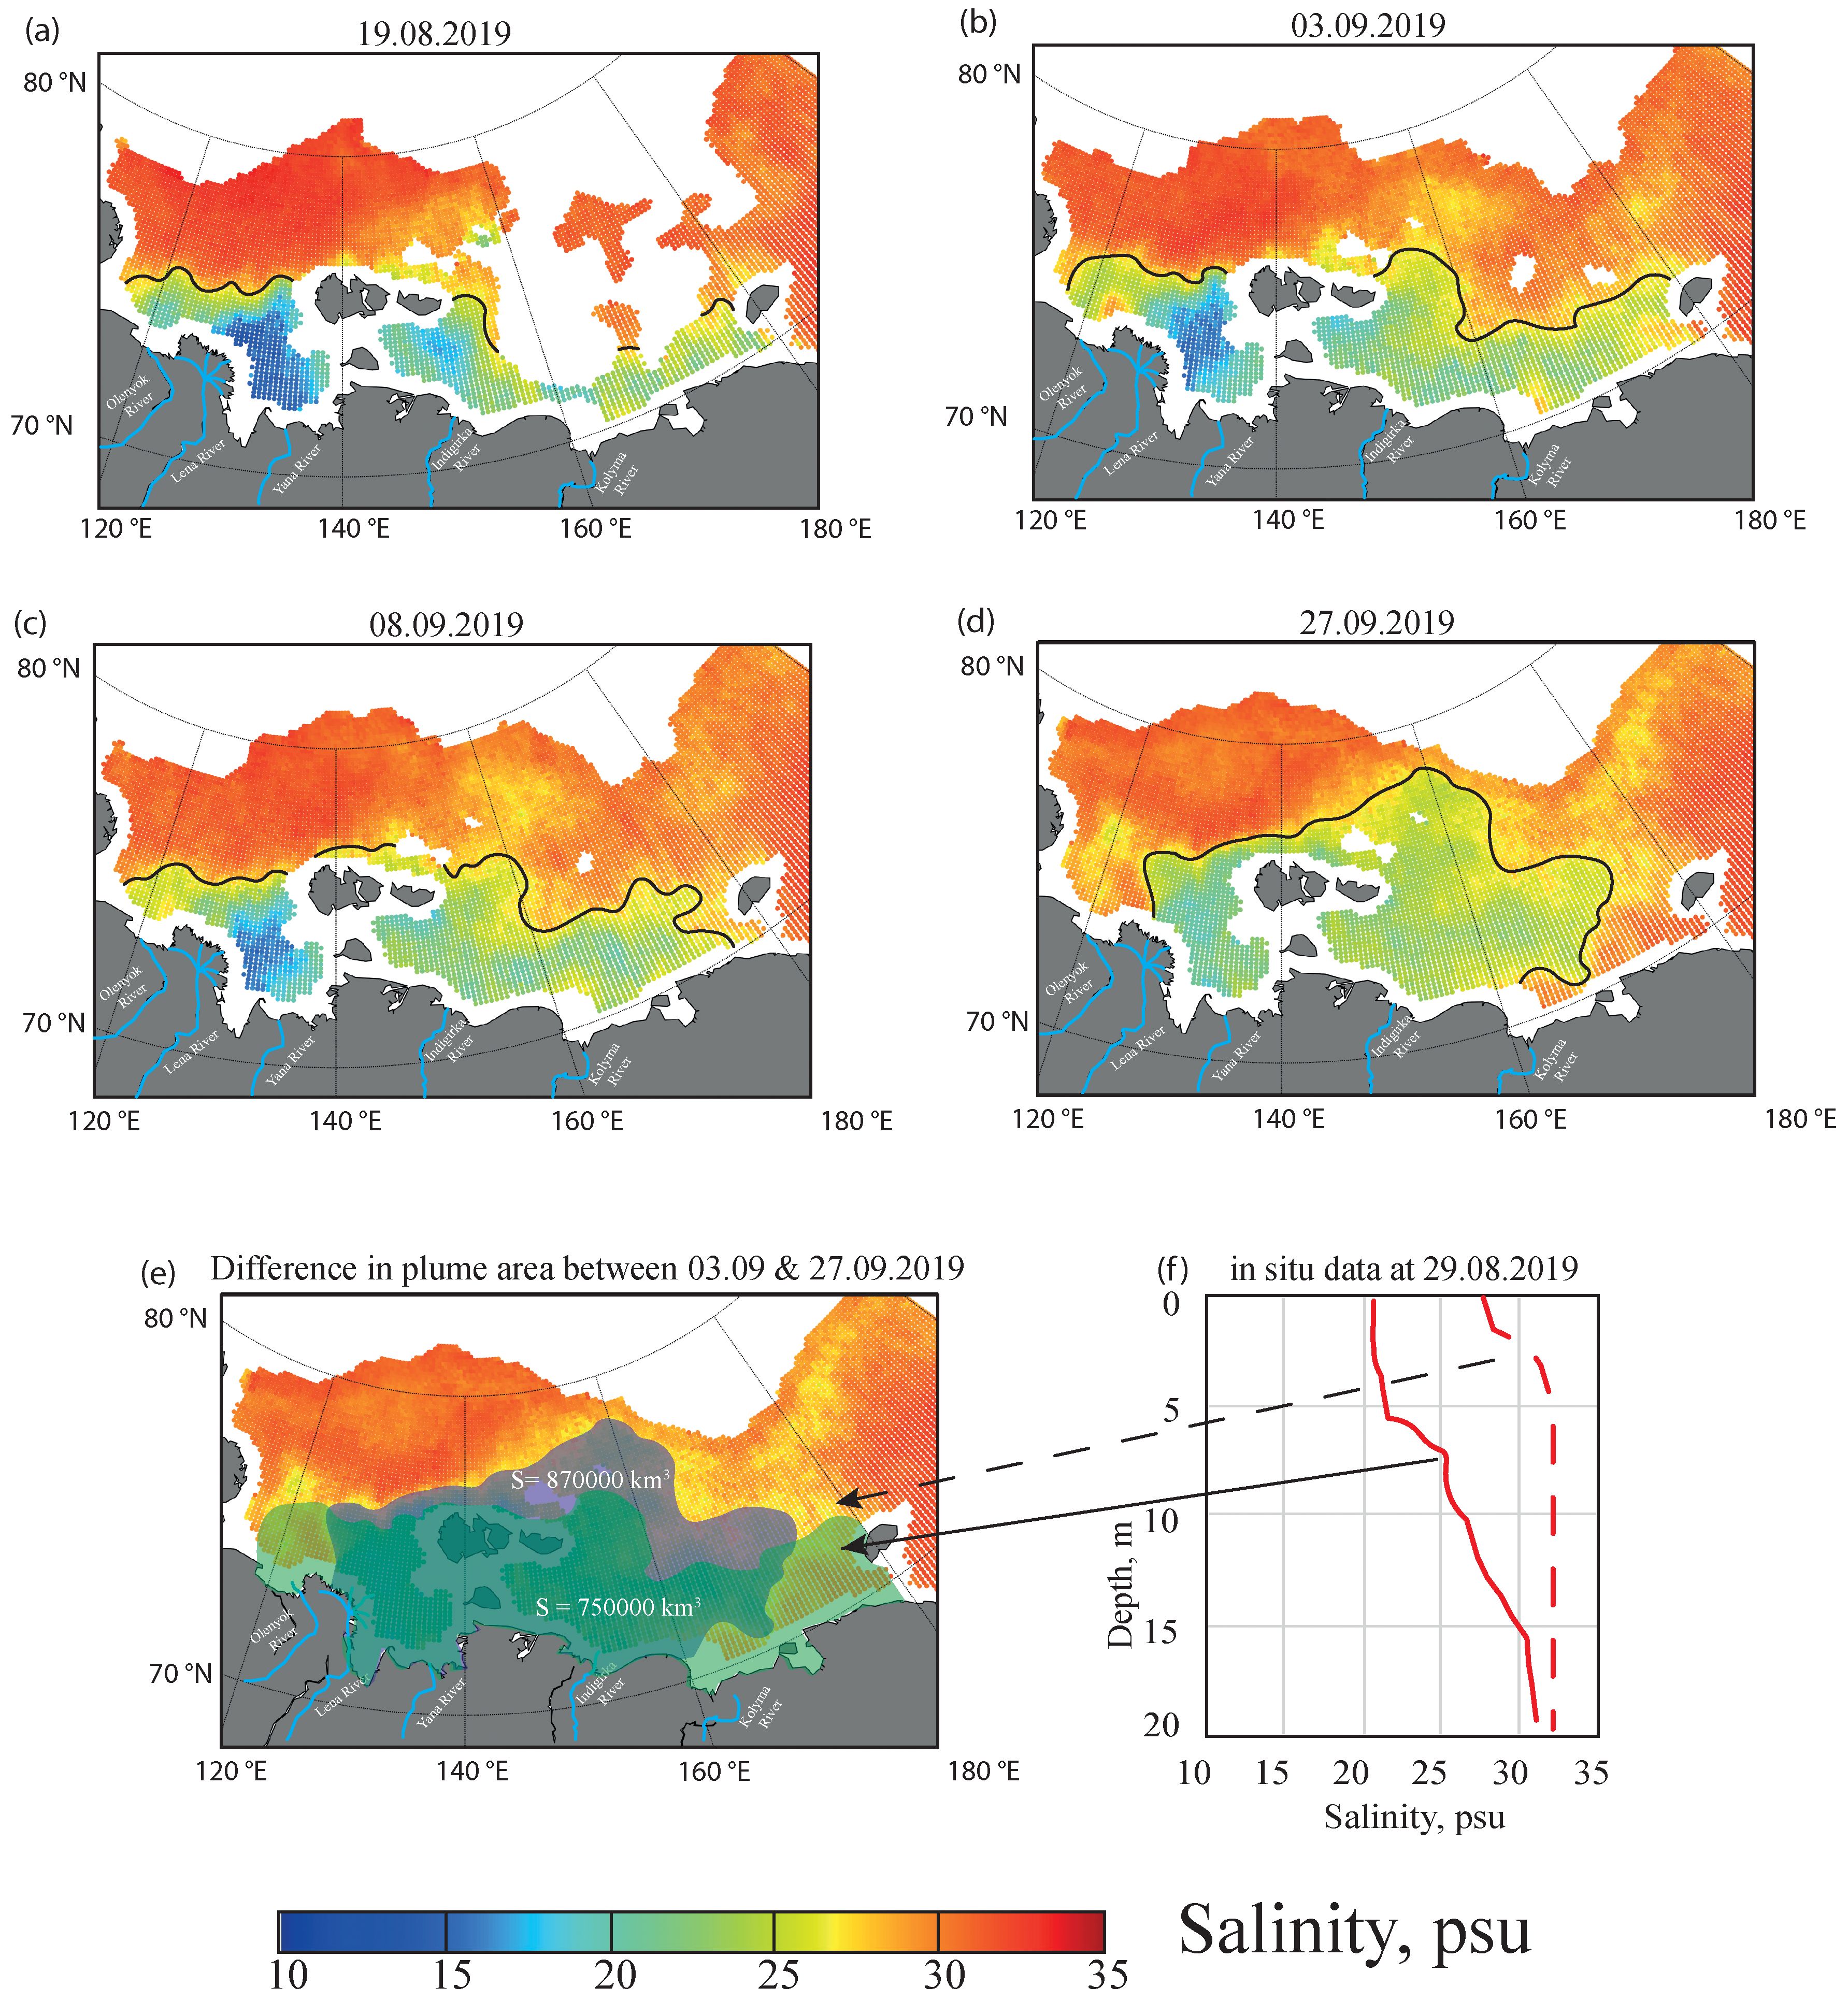
Figure 13. Surface salinity in the Laptev and East Siberian seas according to satellite data and location of the Lena plume boundary indicated by black lines on 19 August (a), 3 September (b), 8 September (c), 27 September (d) 2019. Difference in the Lena plume area between 3 September (green color) and 27 September 2019 (dark blue color) is shown in (e). Vertical salinity profiles during 29 August 2019 are shown by red lines in (f). Black lines between panels (e) and (f) show location of salinity in situ measurements.
Subsequent strong (up to 7–8 m/s) southeastward and eastward wind forcing in the East Siberian Sea pressed the Lena plume off the Wrangel Island (Figure 13c) in early September and then shifted it to the northwestern part of the East Siberian Sea in late September (Figure 13d). Due to ice-free conditions, the northern boundary of the Lena plume reached the latitude of 78°N. The area of the Lena plume during its anomalously far eastward and northward propagation of the in August – September 2019 varied between 757 000 and 870 000 km2 (Figure 13e), which is much greater than was observed in previous years (Osadchiev et al., 2021b).
Relative contribution of river discharge and meltwater to the formation of the Lena plume in 2012–2020 was recently described by Osadchiev et al. (2024). The total volume of freshwater fluxes, consisting of river discharge and sea ice meltwater fluxes from sea ice, was significantly greater in 2018 (1215 km3), 2019 (781 km3) and 2020 (1020 km3) and quite similar to 2017 (1144 km3). At the same time, the relative share of meltwater in 2019 (22%, 175 km3) was larger than that in 2018 (18%, 230 km3) and 2020 (18%, 182 km3). Relatively high contribution of meltwater to the Lena plume (Figure 6) in 2019 was caused by favorable sea ice conditions, namely, late but quick retreat of sea ice in the Eastern Arctic shelf (Figure 5a). This process significantly increased area and volume of the Lena plume in August-September 2019 in conditions of dramatically low volume of total river discharge (606 km3), especially in the eastern part of the East Siberian Sea located far from river mouths. In contrast, the majority of the East Siberian Sea remained covered by ice in early September 2018, as a result, a limited volume of meltwater contributed to the Lena plume (Figure 5b). In case, fluxes of the significant volume of meltwater (175 km3) with a relatively small volume of river runoff (606 km3) into the Lena plume with eastward distribution in 2019 causes a significant increase in its area, compared to 2017, when the Lena plume area was lower due to negative wind forcing despite a significantly larger volume of freshwater flows.
The role of sea ice meltwater in formation of the Lena plume in the eastern part of the East Siberian Sea is also confirmed by the study of local phytoplankton communities. In 2019, both cryophilic and riverine phytoplankton species (Cylindrotheca Closterium, Chaetoceros socialis) were found in the study area, indicating high shares of both river discharge and meltwater in the Lena plume. In 2023, only freshwater species (Crucigenia tetrapedia) were registered in the southern part of the study area indicating predominantly riverine origin of the freshened surface layer. These observations highlight the significant influence of meltwater on formation of the anomalously far eastern propagation of the Lena plume in August 2019.
5 Conclusions
This study is focused on spreading of the Lena plume in the East Siberian Sea during the ice-free season in the last several years (2018, 2019, 2021 and 2023). This freshened surface layer commonly occupies wide area (up to 500 000 km2) in the Laptev and East Siberian seas and strongly affects local processes in the sea surface layer (Osadchiev et al., 2021b). Analysis of in situ thermohaline data collected in the eastern part of the East Siberian Sea and satellite-derived SSS obtained using specific regional Arctic algorithm (Savin et al., 2024) revealed anomalously far eastward and northward spreading of the Lena plume in August-September 2019 (Figure 11b). During this period, the eastern boundary of the Lena plume reached the Wrangel Island (the longitude of 180°E), while the northern boundary of the Lena plume reached the latitude of 78°N. The area of the Lena plume in August-September 2019 determined from satellite SSS data varied between 757 000 and 870 000 km2. The reported values of the area, zonal (2000 km), and meridional (900 km) extents of the Lena plume in the Eastern Arctic are much greater than those observed in previous years.
The main reason for the anomalously large spreading of the Lena plume in August-September 2019 is the combination of favorable sea ice and wind forcing conditions. Intense sea ice melting during July and August 2019 resulted in the ice-free southern part of the East Siberian Sea in the middle of July and the ice-free East Siberian Sea by the early of August. Notably, the sea ice edge abruptly moved from the latitudes of 70-71°N on 1 August to 76-78°N on 15 August. Intense sea ice melting provided significant freshwater contribution to the Lena plume, i.e., approximately one quarter of freshwater volume in the Lena plume originated from meltwater (Osadchiev et al., 2024). The large share of meltwater in the Lena plume was confirmed by high presence of cryophilic phytoplankton species in the eastern part of the East Siberian Sea (Figure 12).
Favorable wind forcing during July-September 2019 under ice-free conditions in the study area was the second important factor that caused anomalously far eastward and northward spreading of the Lena plume. Note, that similar wind forcing observed in 2018, 2021 and 2023 did not result in similar spreading of the Lena plume due to presence of sea ice coverage in the East Siberian Sea during the whole warm season, which reduced wind influence on the Lena plume distribution (Figures 11a, c, d).
Early reduction of seasonal ice cover, in absence of positive wind influence, does not lead to a significant increase in the area of the Lena plume, as occurred in 2017 and 2020 (Figures 11e, f). In these years, despite rapid ice reduction, prevailing eastward winds constrained the plume primarily to southern and southwestern parts of the East Siberian Sea in 2017 and to the northern part of the Laptev Sea in 2020. Historical analysis suggests that in 2007 and 2012 (the other years with exceptionally low sea ice cover) - the Lena plume likely experienced similar eastward expansion pattern as in 2019, though precise verification remains impossible due to the absence of SMAP salinity data for those years.
Rapid reduction of sea ice cover (Vavrus and Alkama, 2022) and the increase of duration of the ice-free season (at least 5 days per decade (Stroeve et al., 2014; Shabanov et al., 2024)) that is observed in the Laptev and East Siberian seas during the last decades, is the key factor that made it possible for the anomalously large spreading of the Lena plume. Therefore, formation of the anomalously large Lena plume in the Eastern Arctic similar to that registered in 2019 and described in this study, could become a common feature during the future decades based on CMIP6 models predictions (Muilwijk et al., 2024) in increasing of wind forcing conditions and accelerating of the Arctic Ocean surface circulation - at least by 31–47% by 2100 (Muilwijk et al., 2024). Frequent occurrence of these conditions could significantly alter zonal and meridional transport of freshwater and river-borne constituents, intensify sea ice formation (Carmack et al., 2016), modify local phytoplankton communities and food webs (Ardyna et al., 2014; Castro de la Guardia et al., 2019). As a result, the reported expansion of the Lena plume under favorable sea ice and wind forcing conditions could contribute for understanding the future state of the large-scale freshwater cycle in the Eastern Arctic.
Data availability statement
The raw data supporting the conclusions of this article will be made available by the authors, without undue reservation.
Author contributions
VR: Conceptualization, Data curation, Formal analysis, Funding acquisition, Investigation, Methodology, Project administration, Resources, Validation, Visualization, Writing – original draft, Writing – review & editing. AO: Conceptualization, Supervision, Validation, Visualization, Writing – original draft, Writing – review & editing, Formal analysis, Investigation, Methodology, Project administration. AS: Conceptualization, Data curation, Formal analysis, Investigation, Methodology, Resources, Software, Validation, Visualization, Funding acquisition, Project administration, Supervision, Writing – review & editing. ER: Data curation, Formal analysis, Investigation, Methodology, Software, Validation, Visualization, Supervision, Writing – review & editing. AG: Conceptualization, Data curation, Formal analysis, Investigation, Methodology, Software, Validation, Visualization, Writing – review & editing. OK: Conceptualization, Data curation, Formal analysis, Investigation, Methodology, Validation, Visualization, Writing – original draft.
Funding
The author(s) declare that financial support was received for the research and/or publication of this article. This research was funded by the Russian Scientific Foundation, project 25-27-00335.
Acknowledgments
The authors wish to thank colleagues from Marine Research Center at Lomonosov Moscow State University and Russian Federal Research Institute of Fisheries and Oceanography for the provided in situ data. The authors are grateful to Kirill Kivva for valuable recommendations about the study.
Conflict of interest
The authors declare that the research was conducted in the absence of any commercial or financial relationships that could be construed as a potential conflict of interest.
Generative AI statement
The author(s) declare that no Generative AI was used in the creation of this manuscript.
Publisher’s note
All claims expressed in this article are solely those of the authors and do not necessarily represent those of their affiliated organizations, or those of the publisher, the editors and the reviewers. Any product that may be evaluated in this article, or claim that may be made by its manufacturer, is not guaranteed or endorsed by the publisher.
References
Ahyong S., Boyko C. B., Bernot J., Brandão S. N., De Grave D. M., et al. (2025). World Register of Marine Species. Available online at: https://www.marinespecies.org/ (Accessed March 16 2025).
Anderson L. G., Jutterström S., Kaltin S., Jones E. P., and Björk G. (2004). Variability in river runoff distribution in the Eurasian Basin of the Arctic Ocean. J. Geophys. Res. Oceans 109, C01016. doi: 10.1029/2003JC001773
Ardyna M., Babin M., Gosselin M., Devred E., Rainville L., and Tremblay J.É. (2014). Recent Arctic Ocean Sea ice loss triggers novel fall phytoplankton blooms. Geophys. Res. Lett. 41, 6207–6212. doi: 10.1002/2014GL061047
Bao S., Wang H., Zhang R., Yan H., and Chen J. (2019). Comparison of satellite-derived sea surface salinity products from SMOS, Aquarius, and SMAP. J. Geophys. Res. Oceans 124, 1932–1944. doi: 10.1029/2019JC014937
Carmack E. C., Yamamoto–Kawai M., Haine T. W., Bacon S., Bluhm B. A., Lique C., et al. (2016). Freshwater and its role in the Arctic Marine System: sources, disposition, storage, export, and physical and biogeochemical consequences in the Arctic and global oceans. J. Geophys. Res. Biogeosci. 121, 675–717. doi: 10.1002/2015JG003140
Castro de la Guardia L., Garcia-Quintana Y., Claret M., Hu X., Galbraith E. D., and Myers P. G. (2019). Assessing the role of high-frequency winds and sea ice loss on Arctic phytoplankton blooms in an ice-ocean-biogeochemical model. J. Geophys. Res. Biogeosci. 124, 2728–2750. doi: 10.1029/2018JG004869
Chalov S., Prokopeva K., Magritsky D., Grigoriev V., Fingert E., Habel M., et al. (2023). Climate change impacts on streamflow, sediment load and carbon fluxes in the Lena River delta. Ecol. Indic. 157, 111252. doi: 10.1016/j.ecolind.2023.111252
Davis P. E., Lique C., Johnson H. L., and Guthrie J. D. (2016). Competing effects of elevated vertical mixing and increased freshwater input on the stratification and sea ice cover in a changing Arctic Ocean. J. Phys. Oceanogr. 46, 1531–1553. doi: 10.1175/JPO-D-15-0174.1
Ding Q., Schweiger A., and Baxter I. (2022). Nudging observed winds in the Arctic to quantify associated sea ice loss from 1979 to 2020. J. Clim. 35, 6797–6813. doi: 10.1175/JCLI-D-21-0893.1
Ding Q., Schweiger A., L’Heureux M., Battisti D. S., Po-Chedley S., Johnson N. C., et al. (2017). Influence of high-latitude atmospheric circulation changes on summertime Arctic Sea ice. Nat. Clim Change 7, 289–295. doi: 10.1038/NCLIMATE3241
Dmitrenko I., Kirillov S., Eicken H., and Markova N. (2005). Wind-driven summer surface hydrography of the eastern Siberian shelf. Geophys. Res. Lett. 32, L14613. doi: 10.1029/2005GL023022
Dmitrenko I. A., Kirillov S. A., Krumpen T., Makhotin M., Abrahamsen E. P., Willmes S., et al. (2010). Wind-driven diversion of summer river runoff preconditions the Laptev Sea coastal polynya hydrography: evidence from summer-to-winter hydrographic records of 2007–2009. Cont. Shelf Res. 30, 1656–1664. doi: 10.1016/j.csr.2010.06.012
Druzhkova E. I. and Makarevich P. R. (2013). The Laptev Sea phytoplankton studies: past and present. Trudy KNC RAS 1, 71–79.
Dubinina E. O., Kossova S. A., Osadchiev A. A., Chizhova Y. N., and Avdeenko A. S. (2024). Pacific waters in the East Siberian Sea: identification from δ13С (DIC) and [DIC] characteristics. Dokl. Earth Sci. 515, 715–721. doi: 10.1134/S1028334X2460004X
Edwards K. F., Litchman E., and Klausmeier C. A. (2013). Functional traits explain phytoplankton community structure and seasonal dynamics in a marine ecosystem. Ecol. Lett. 16, 56–63. doi: 10.1111/ele.12012
Fofonova V., Danilov S., Androsov A., Janout M., Bauer M., Overduin P., et al. (2015). Impact of wind and tides on the Lena River freshwater plume dynamics in the summer sea. Ocean Dyn. 65, 951–968. doi: 10.1007/s10236-015-0847-573
Fournier S., Vandemark D., Gaultier L., Lee T., Jonsson B., and Gierach M. M. (2017). Interannual variation in offshore advection of Amazon-Orinoco plume waters: Observations, forcing mechanisms, and impacts. J. Geophys. Res. Oceans 122, 8966–8982. doi: 10.1002/2017JC013103
Frey D. I. and Osadchiev A. A. (2021). Large river plumes detection by satellite altimetry: case study of the Ob-Yenisei plume. Rem. Sens. 13, 5014. doi: 10.3390/rs13245014
Glebov I. I., Nadtochij V. A., Savin A. B., Slabinskij A. M., Borilko O. Y., Chulchekov D. N., et al. (2016). Results of comprehensive research in the East Siberian Sea in August 2015. Izvestiya TINRO 186, 81–92. doi: 10.26428/1606-9919-2016-186-81-92
Gordeev V. V., Martin J. M., Sidorov J. S., and Sidorova M. V. (1996). A reassessment of the Eurasian River input of water, sediment, major elements, and nutrients to the Arctic Ocean. Am. J. Sci. 296, 664–691. doi: 10.2475/ajs.296.6.664
Guiry M. D., Guiry G. M., Morrison L., Rindi F., Miranda S. V., Mathieson A. C., et al. (2018). AlgaeBase: an online resource for algae. Crypto. Algol. 35, 105–115. doi: 10.7872/crya.v35.iss2.2014.105
Hersbach H., Bell B., Berrisford P., Hirahara S., Horányi A., Muñoz-Sabater J., et al. (2020). The ERA5 global reanalysis. Q. J. R. Meteorol. Soc 146, 1999–2049. doi: 10.1002/qj.3803
Hillebrand H., Dürselen C. D., Kirschtel D., Pollingher U., and Zohary T. (1999). Biovolume calculation for pelagic and benthic microalgae. J. Phycol. 35, 403–424. doi: 10.1046/j.1529-8817.1999.3520403.x
Jakobsson M., Mayer L. A., Coakley B., Dowdeswell J. A., Forbes S., Fridman B., et al. (2012). The international bathymetric chart ofthe Arctic Ocean (IBCAO), version 3.0. Geophys. Res. Lett. 39 (12), L12609. doi: 10.1029/2012gl052219
Janout M. A., Holemann J., Laukert G., Smirnov A., Krumpen T., Bauch D., et al. (2020). On the variability of stratification in the freshwater-influenced Laptev Sea region. Front. Mar. Sci. 7. doi: 10.3389/fmars.2020.543489
Kashiwase H., Ohshima K. I., Nihashi S., and Eicken H. (2017). Evidence for ice-ocean albedo feedback in the Arctic Ocean shifting to a seasonal ice zone. Sci. Rep. 7, 8170. doi: 10.1038/s41598-017-08467-z
Kodryan K. V., Kivva K. K., Zubarevich V. L., and Pedchenko A. P. (2023). Water masses in the Western Chukchi Sea in August 2019 and their hydrochemical features. Oceanology 63, 314–324. doi: 10.1134/S0001437023020078
Konik A. A., Zimin A. V., Atadzhanova O. A., and Osadchiev A. A. (2023). Accuracy of NASA/SMAP satellite salinity in the area of the outer boundary of the Ob – Yenisei plume (river plume frontal zone) in the Kara Sea. Sovr. Probl. DZZ Kosm. 20, 9–19. doi: 10.21046/2070-7401-2023-20-4-9-19
Konovalova O., Rimskaya-Korsakova N., Kuznetsov P., Osadchiev A., Fedyaeva M., Moiseeva Y., et al. (2024). Benthic communities under methane gradient in the Laptev and East Siberian seas. Front. Mar. Sci. 12. doi: 10.3389/fevo.2024.1406680
Korotkina O.A., Zavialov P.O., and Osadchiev A.A. (2014). Synoptic variability of currents in the coastal waters of Sochi. Oceanology 54, 545–556. doi: 10.1134/S0001437014040079
Landy J. C., Dawson G., Tsamados M., Bushuk M., Stroeve J. C., Howell S. E. L., et al. (2022). A year-round satellite sea-ice thickness record from CryoSat-2. Nature 609, 517–522. doi: 10.1038/s41586-022-05058-5
Liang H. and Su J. (2021). Variability in sea ice melt onset in the Arctic northeast passage: Seesaw of the Laptev Sea and the East Siberian Sea. J. Geophys. Res. Oceans 126, e2020JC016985. doi: 10.1029/2020JC016985
Magritsky D. V., Frolova N. L., Evstigneev V. M., Povalishnikova E. S., Kireeva M. B., and Pakhomova O. M. (2018). Long-term changes of river water inflow into the seas of the Russian Arctic sector. Polarforschung 87, 177–194. doi: 10.2312/polarforschung.87.2.177
Magritsky D. V., Vasilenko A. N., Frolova N. L., and Shevchenko A. I. (2023). Temporal and spatial patterns of changes in thermal regime of the rivers in the northeast of the Asian part of Russia. 1. Assessment of changes in the water temperature. Water Resour. 50, 190–201. doi: 10.1134/S0097807823020124
Makhotin M. S. and Dmitrenko I. A. (2011). Interannual variability of Pacific summer waters in the Arctic Ocean. Dokl. Earth Sc. 438, 730–732. doi: 10.1134/S1028334X11050345
Matveeva T. A. and Semenov V. A. (2022). Regional features of the Arctic Sea ice area changes in 2000–2019 versus 1979–1999 periods. Atmosphere 13, 1434. doi: 10.3390/atmos13091434
Meissner T., Wentz F. J., Manaster A., Lindsley R., Brewer M., and Densberger M. (2022). Remote sensing systems smap ocean surface salinities [level 2c, level 3 running 8- day, level 3 monthly], version 5.0 (Santa Rosa, CA, USA: Remote Sensing Systems). doi: 10.5067/SMP50-2SOCS
Muilwijk M., Hattermann T., Martin T., and Granskog M. A. (2024). Future sea ice weakening amplifies wind-driven trends in surface stress and Arctic Ocean spin-up. Nat. Commun. 15, 6889. doi: 10.1038/s41467-024-50874-0
Mulligan R. P. and Perrie W. (2019). Circulation and structure of the Mackenzie River plume in the coastal Arctic Ocean. Continent. Shelf Res. 177, 59–68. doi: 10.1016/j.csr.2019.03.006
Okolodkov Y.В. (1993). A checklist of algal species found in the East Siberian Sea in May 1987. Polar Biol. 13, 7–11. doi: 10.1007/BF00236578
Osadchiev A.A., Korotenko K.A., Zavialov P.O., Chiang W.-S., and and Liu C.-C.v (2016). Transport and bottom accumulation of fine river sediments under typhoon conditions and associated submarine landslides: Case study of the Peinan River, Taiwan. Nat. Haz. Earth System Sci. 41, 54. doi: 10.5194/nhess-16-41-2016
Osadchiev A.A., Sedakov R.O., and Barymova А.А. (2021). Response of a small river plume on wind forcing. Front. Mar. Sci. 8, 809566. doi: 10.3389/fmars.2021.809566
Osadchiev A. A., Adamovskaya P., Myslenkov S. A., Dudarev O. V., and Semiletov I. P. (2023a). Satellite-based evaluation of submarine permafrost erosion at shallow offshore areas in the Laptev Sea. Rem. Sen. 15, 5065. doi: 10.3390/rs15205065
Osadchiev A. A., Frey D. I., Shchuka S. A., Tilinina N. D., Morozov E. G., and Zavialov P. O. (2021a). Structure of freshened surface layer in the Kara Sea during ice-free periods. J. Geophys. Res. Oceans 126, e2020JC016486. doi: 10.1029/2020JC016486
Osadchiev A. A., Frey D. I., Spivak E. A., Shchuka S. A., Tilinina N. D., and Semiletov I. P. (2021b). Structure and inter-annual variability of the freshened surface layer in the Laptev and East Siberian seas during ice-free periods. Front. Mar. Sci. 8. doi: 10.3389/fmars.2021.735011
Osadchiev A. A., Kuskova E. G., and Ivanov V. V. (2024). The roles of river discharge and sea ice melting in formation of freshened surface layers in the Kara, Laptev, and East Siberian seas. Front. Mar. Sci. 11. doi: 10.3389/fmars.2024.1348450
Osadchiev A., Sedakov R., Frey D., Gordey A., Rogozhin V., Zabudkina Z., et al (2023b). Intense zonal freshwater transport in the Eurasian Arctic during ice-covered season revealed by in situ measurements. Sci. Rep. 13, 16508. doi: 10.1038/s41598-023-43524-w
Osadchiev A., Zabudkina Z., Rogozhin V., Frey D., Gordey A., Spivak E., et al. (2023c). Structure of the Ob-Yenisei plume in the Kara Sea shortly before autumn ice formation. Front. Mar. Sci. 10. doi: 10.3389/fmars.2023.1129331
Pargaonkar S. M. and Vinayachandran P. N. (2022). The Irrawaddy River jet in the Andaman Sea during the summer monsoon. Front. Mar. Sci. 9. doi: 10.3389/fmars.2022.849179
Park H., Watanabe E., Kim Y., Polyakov I., Oshima K., Zhang X., et al. (2020). Increasing riverine heat influx triggers Arctic Sea ice decline and oceanic and atmospheric warming. Sci. Adv. 6, eabc4699. doi: 10.1126/SCIADV.ABC4699
Pavlov V. K., Timokhov L. A., Baskakov G. A., Kulakov, Yu. M., Kurazhov V. K., et al. (1996). Hydrometeorological Regime of the Kara, Laptev and East-Siberian Seas. Technical Memorandum, APL-UW TM 1-96 (Seattle, WA: Applied Physics Laboratory, University of Washington).
Pipko I., Pugach S., Semiletov I., and Konstantinov O. (2023). Dynamics of the seawater carbonate system in the East Siberian Sea: The diversity of driving forces. Water 15, 2670. doi: 10.3390/w15142670
Pipko I. I., Semiletov I. P., and Pugach S. P. (2005). The carbonate system of the East Siberian Sea waters. Dokl. Earth Sci. 402, 624–627.
Polukhin A. (2019). The role of river runoff in the Kara Sea surface layer acidification and carbonate system changes. Environ. Res. Lett. 14, 105007. doi: 10.1088/1748-9326/ab421e
Polyakova E. I. (1982). Diatoms of the sublittoral and lagoons of the Chukchi and East Siberian seas. Oceanology 22, 809–812.
Polyakova Y. I., Kryukova I. M., Martynov F. M., Novikhin A. E., Abramova E. N., Kassens H., et al. (2021). Community structure and spatial distribution of phytoplankton in relation to hydrography in the Laptev Sea and the East Siberian Sea (autumn 2008). Polar Biol. 44, 1229–1250. doi: 10.1007/s00300-021-02873-w
Pugach S. P. and Pipko I. I. (2013). Dynamics of colored dissolved matter on the East Siberian Sea shelf. Dokl. Earth Sci. 448, 153. doi: 10.1134/S1028334X12120173
Radchenko I. G., Kapkov V. I., and Fedorov V. D. (2010). Practical guide to collection and analysis of marine phytoplankton samples: a teaching aid for university students of biological specialties (Moscow: Lomonosov Moscow State University Press).
Rogozhin V. S., Osadchiev A. A., and Konovalova O. P. (2023). Structure and variability of the Pechora plume in the southeastern part of the Barents Sea. Front. Mar. Sci. 10. doi: 10.3389/fmars.2023.1052044
Salganik E., Katlein C., Lange B. A., Matero I., Lei R., Fong A. A., et al. (2023). Temporal evolution of under-ice meltwater layers and false bottoms and their impact on summer Arctic Sea ice mass balance. Elem.: Sci. Anthropocene 11, 35. doi: 10.1525/elementa.2022.00035
Savelieva N. I., Salyuk A. N., and Propp L. N. (2010). Peculiar features of the thermohaline and hydrochemical water structure in the southeastern Laptev Sea. Oceanology 50, 869–876. doi: 10.1134/S0001437010060068
Savin A. S., Krinitskiy M. A., and Osadchiev A. A. (2023). SMAP sea surface salinity improvement in the Arctic region using machine learning approaches. Moscow Univ. Phys. 78, 210–216. doi: 10.3103/S0027134923070299
Savin A. S., Krinitskiy M. A., and Osadchiev A. A. (2024). Improved sea surface salinity data for the Arctic Ocean derived from SMAP satellite data using machine learning approaches. Front. Mar. Sci. 11. doi: 10.3389/fmars.2024.1358882
Semiletov I. P., Dudarev O. V., Luchin V. A., Charkin A. N., Shin K.-H., and Tanaka N. (2005). The East Siberian Sea as a transition zone between Pacific-derived waters and Arctic shelf waters. Geophys. Res. Lett. 32, L10614. doi: 10.1029/2005GL022490
Semiletov I. P., Pipko I. I., Gustafsson Ö., Anderson L. G., Sergienko V., Pugach S. P., et al. (2016). Acidification of East Siberian Arctic shelf waters through addition of freshwater and terrestrial carbon. Nat. Geosci. 9, 361. doi: 10.1038/ngeo2695
Semiletov I. P., Shakhova N. E., Sergienko V. I., Pipko I. I., and Dudarev O. V. (2012). On carbon transport and fate in the East Siberian Arctic land–shelf– atmosphere system. Environ. Res. Lett. 7, 15201. doi: 10.1088/1748-9326/7/1/015201
Sergeeva V. M., Sukhanova I. N., Flint M. V., Pautova L. A., Grebmeier D. M., and Cooper L. V. (2010). Phytoplankton of the Western Arctic in July–August 2003. Oceanology 50, 203–217. doi: 10.1134/S0001437010020049
Shabanov P., Osadchiev A., Shabanova N., and Ogorodov S. (2024). Decline in ice coverage and ice-free period extension in the Kara and Laptev seas during 1979–2022. Remote Sens. 16, 1875. doi: 10.3390/rs16111875
Shiklomanov A., Déry S., Tretiakov M., Yang D., Magritsky D., Georgiadi A., et al. (2021). “River freshwater flux to the Arctic Ocean,” in Arctic hydrology, permafrost and ecosystems. Eds. Daqing Y. and Douglas L. K. (Springer, Cham), 703–738. doi: 10.1007/978-3-030-50930-9_24
Spivak E. A., Osadchiev A. A., and Semiletov I. P. (2021). Structure and variability of the Lena River plume in the southeastern part of the Laptev Sea. Oceanology 61, 839–849. doi: 10.1134/S00014370210601
Spreen G., Kaleschke L., and Heygster G. (2008). Sea ice remote sensing using AMSR-E 89 GHz channels. J. Geophys. Res. 113, C02S03. doi: 10.1029/2005JC003384
Stroeve J. C., Markus T., Boisvert L., Miller J., and Barrett A. (2014). Changes in Arctic Melt season and implications for Sea Ice loss. Geophys. Res. Lett. 41, 1216–1212. doi: 10.1002/2013GL058951
Stroeve J. and Notz D. (2018). Changing state of Arctic Sea ice across all seasons. Environ. Res. Lett. 13, 103001. doi: 10.1088/1748-9326/aade56
Sukhanova I., Flint M., Fedodov A., Sakharova E., Makkaveev P., Polukhin A., et al. (2021). First data on the structure of phytoplankton communities of the East Siberian Sea. Oceanology 61, 909–929. doi: 10.1134/S0001437021060151
Sukhanova I. N., Flint M. V., Georgieva E. J., Lange E. K., Kravchishina M. D., Demidov A. B., et al. (2017). The structure of phytoplankton communities in the eastern part of the Laptev Sea. Oceanology 57, 75–90. doi: 10.1134/S0001437017010209
Supply A., Boutin J., Vergely J.-L., Kolodziejczyk N., Reverdin G., Reul N., et al. (2020). New insights into SMOS sea surface salinity retrievals in the Arctic Ocean. Remote Sens. Environ. 249, 112027. doi: 10.1016/j.rse.2020.112027
Szymanski A. and Gradinger R. (2016). The diversity, abundance and fate of ice algae and phytoplankton in the Bering Sea. Polar Biol. 39, 309–325. doi: 10.1007/s00300-015-1783-z
Tarasenko A., Supply A., Kusse-Tiuz N., Ivanov V., Makhotin M., Tournadre J., et al. (2021). Properties of surface water masses in the Laptev and the East Siberian seas in summer 2018 from in situ and satellite data. Ocean Sci. 17, 221–247. doi: 10.5194/os-17-221-2021
Thibodeau B., Bauch D., Kassens H., and Timokhov L. A. (2014). Interannual variations in river water content and distribution over the Laptev Sea between 2007 and 2011: The Arctic Dipole connection. Geophys. Res. Lett. 41, 7237–7244. doi: 10.1002/2014GL061814
Vasilenko A., Frolova N., Grigoriev V. Y., Magritsky D., Shevchenko A., and Winde F. (2024). Spatio-temporal variability of water temperature of Arctic rivers in Russia over the past 60 years. Appl. Sci. 14, 10942. doi: 10.3390/app142310942
Vavrus S. J. and Alkama R. (2022). Future trends of arctic surface wind speeds and their relationship with sea ice in CMIP5 climate model simulations. Clim. Dyn. 59, 1833–1848. doi: 10.1007/s00382-021-06071-6
Vinogradov M. E. (1983). Modern methods of quantitative assessment of distribution of marine plankton (Moscow: Nauka).
Wang Q., Danilov S., Mu L., Sidorenko D., and Wekerle C. (2021). Lasting impact of winds on Arctic Sea ice through the ocean’s memory. Cryosph. 15, 4703–4725. doi: 10.5194/tc-15-4703-2021
Werner I., Ikävalko J., and Schünemann H. (2007). Sea-ice algae in Arctic pack ice during late winter. Polar Biol. 30, 1493–1504. doi: 10.1007/s00300-007-0310-2
Wild B., Ray N. E., Lett C., Davies A. J., Kirillova E., Holmstrand H., et al. (2023). Nitrous oxide dynamics in the Siberian Arctic Ocean and vulnerability to climate change. J. Geophys. Res. Biogeosci. 128, e2022JG007326. doi: 10.1029/2022JG007326
Xie L., Yakushev E., Semiletov I., Grinko A., Gangnus I., Berezina A., et al. (2023). Biogeochemical structure of the Laptev Sea in 2015–2020 associated with the River Lena plume. Front. Mar. Sci. 10. doi: 10.3389/fmars.2023.1180054
Keywords: river plume, sea surface layer, wind forcing, sea ice conditions, meltwater, phytoplankton communities, Lena River, Eastern Arctic
Citation: Rogozhin V, Osadchiev A, Savin A, Rogozhina E, Georgiev A and Konovalova O (2025) Sea ice decline in the Eastern Arctic results in expansion of the freshened surface layer. Front. Mar. Sci. 12:1558240. doi: 10.3389/fmars.2025.1558240
Received: 09 January 2025; Accepted: 08 April 2025;
Published: 19 May 2025.
Edited by:
Peigen Lin, Shanghai Jiao Tong University, ChinaReviewed by:
Borja Aguiar-González, University of Las Palmas de Gran Canaria, SpainHengling Leng, Ministry of Natural Resources, China
Copyright © 2025 Rogozhin, Osadchiev, Savin, Rogozhina, Georgiev and Konovalova. This is an open-access article distributed under the terms of the Creative Commons Attribution License (CC BY). The use, distribution or reproduction in other forums is permitted, provided the original author(s) and the copyright owner(s) are credited and that the original publication in this journal is cited, in accordance with accepted academic practice. No use, distribution or reproduction is permitted which does not comply with these terms.
*Correspondence: Alexander Osadchiev, b3NhZGNoaWV2QG9jZWFuLnJ1