 Michael P. Jensen1,2
 Erin L. LaCasella3
 Donald R. Kobayashi4
 Amy Frey3
 Tammy M. Summers5
 Jessy R. Hapdei6
 George H. Balazs7
 Shawn K. K. Murakawa8
 T. Todd Jones9
 Summer L. Martin8
 Alexander R. Gaos8
 Peter H. Dutton3*
- 1Department of Chemistry and Bioscience, Aalborg University, Aalborg East, Denmark
- 2World Wide Fund for Nature, Healthy Land and Seascapes, Brisbane, QLD, Australia
- 3Marine Mammal and Turtle Division, Southwest Fisheries Science Center, National Marine Fisheries Service, National Oceanic and Atmospheric Administration, La Jolla, CA, United States
- 4Pelagic Research Program, Pacific Islands Fisheries Science Center, National Marine Fisheries Service, NOAA, Honolulu, HI, United States
- 5Guam National Wildlife Refuge, United States Fish and Wildlife Service, Dededo, Guam
- 6Jessy’s Tag Services, Saipan, MP, United States
- 7Golden Honu Services of Oceania, Honolulu, HI, United States
- 8Marine Turtle Biology and Assessment Program, Pacific Islands Fisheries Science Center, National Marine Fisheries Service, NOAA, Honolulu, HI, United States
- 9Fisheries Research and Monitoring Division, Pacific Islands Fisheries Science Center, National Marine Fisheries Service, NOAA, Honolulu, HI, United States
The importance of ocean currents in influencing the connectivity and dispersal of marine megafauna, including sea turtles, is becoming increasingly recognized. However, more comprehensive studies are needed on how these currents impact the genetic makeup and connectivity of green turtle Chelonia mydas (Linnaeus, 1758) populations in the Pacific Islands region. To address this gap, our study conducted genetic analyses of green turtles in foraging grounds from four Micronesian sites and predictive modelling of hatchling dispersal patterns based on ocean currents to explore connectivity between foraging grounds and rookeries across Micronesia. We analyzed mitochondrial DNA (mtDNA) haplotype frequencies from newly collected and published data. We used Bayesian mixed stock analysis (MSA) to estimate the relative proportion of turtles from different Management Units (MUs) within the foraging grounds. Our ocean current simulations predicted hatchling dispersal trajectories, revealing how passive drift may facilitate wide-ranging dispersal and connectivity among distant foraging and nesting sites. Across the four Micronesian foraging grounds, the MSA revealed varying contributions from different rookeries, with some turtles exhibiting rare, long-distance dispersal traits. Our study highlights the intricate relationship between oceanic currents and the spatial dynamics of green turtles across the Pacific. Our findings offer essential insights into the conservation and management of green turtles by highlighting the role of oceanic currents in shaping population connectivity. Future research should focus on expanding genetic analyses and refining ocean drift simulations to enhance our understanding of marine megafauna migration and inform regional conservation strategies effectively.
Introduction
Ocean currents play a critical role in shaping physical and biological processes in marine ecosystems (Fossette et al., 2012; Hays, 2017). The dispersal and connectivity of many marine species are closely linked to the complex and continuously changing ocean currents, which transport larvae, juveniles, and adults across great distances. Not surprisingly, this paradigm extends to migratory marine megafauna, including sea turtles, whose complex life cycles include multiple stages, during which they rely on different oceanic conditions for optimal survival and growth (Hays, 2017).
As is the case for all sea turtle species, green turtles Chelonia mydas (Linnaeus, 1758) have complex life cycles that involve several ontogenetic shifts. Once hatched on sandy tropical and temperate beaches worldwide, they navigate the open ocean, utilizing currents and directed swimming to transport them to suitable habitats for feeding and development (Musick and Limpus, 1997; Fossette et al., 2012; Putman et al., 2012). Especially during their early life stages, ocean currents play a vital role in determining their dispersal patterns (Luschi et al., 2003). After several years as pelagic juveniles, young green turtles transition to shallow benthic habitats, sometimes thousands of kilometers from their birthplace. This shift typically happens when they reach a curved carapace length (CCL) greater than 35 cm (Musick and Limpus, 1997). As they mature, their movement can become more predictable, either displaying fidelity to a specific foraging ground (e.g., Limpus et al., 1992; Webster et al., 2022) or transitioning through a series of developmental habitats (e.g. Pilcher, 2010; van der Zee et al., 2019). The complex regional ocean currents that help distribute juvenile turtles across multiple locales typically result in foraging grounds hosting turtles from multiple rookeries (Jensen et al., 2013a, 2020).
The expansive spatial dynamics inherent to sea turtles present challenges and opportunities for researchers and managers. External factors, such as harvest or bycatch in artisanal and commercial fisheries, can affect populations far from their nesting sites (Jensen et al., 2013b; Stewart et al., 2016; Horne et al., 2023; Ng et al., 2024). Satellite telemetry and genetics have become invaluable tools for studying sea turtle movements and connectivity. While flipper tagging and satellite telemetry are useful for tracking the reproductive migrations of mature turtles, due to size constraints, they are not feasible for tracking recently hatched turtles (but see Mansfield et al., 2014). Due to the limited battery life of satellite tags and difficulty re-observing flipper-tagged turtles, these methods often fail to reveal the long-term movement of juvenile turtles, which stay in the same feeding ground for decades (Seminoff et al., 2015).
The remarkable natal homing abilities of female green turtles typically lead to pronounced genetic isolation between regional rookeries (i.e., nesting colonies), as illustrated by numerous studies (Dethmers et al., 2006; Dolfo et al., 2023; Dutton et al., 2014a, b; Levasseur et al., 2019). As mitochondrial DNA (mtDNA) is inherited maternally, we can trace the natal origin of juveniles by comparing their D-loop haplotypes with those of adult females. The utility of these genetic tools, especially mtDNA, is evident in distinguishing between rookeries and identifying fine-scale conservation units for marine turtles.
Rookeries with significant genetic differentiation are referred to as genetic stocks or management units (MU) (Moritz, 1994; Wallace et al., 2023). Although several studies have defined the population structure of green turtles in Pacific Ocean regions like Australasia (Dethmers et al., 2006; Cheng et al., 2008; Jensen et al., 2016; Nishizawa et al., 2018; Read et al., 2015), Japan (Nishizawa et al., 2013; Hamabata et al., 2014) and the East Pacific (Dutton et al., 2014a; Chaves et al., 2017), such research in the Pacific Islands - including Micronesia, Melanesia, and Polynesia - remain lacking. This is despite the fact that the area is known to host globally relevant green turtle nesting and foraging populations (Seminoff et al., 2015).
To help bridge this knowledge gap, we analyzed the genetic makeup of green turtles in foraging grounds at four foraging sites in Micronesia combined with ocean current modelling to predict hatchling dispersal, and to shed light on the connectivity patterns among these foraging grounds and rookeries across Micronesia and beyond. Our study contributes to a broader understanding of sea turtle dynamics in the Pacific, offering valuable insights for conservation and management in this region.
Materials and methods
Sample collection from nesting turtles
For the rookery (nesting) baseline used in the mixed stock analysis, mtDNA haplotype frequencies were primarily sourced from published literature (Dutton et al., 2014a, b; Hamabata et al., 2014; Read et al., 2015; Jensen et al., 2016; Chaves et al., 2017; Nishizawa et al., 2018; Li et al., 2022; Song et al., 2022; Hamabata et al., 2020; Dolfo et al., 2023). These include 3,477 samples spanning 38 previously identified MUs throughout the Pacific (Figure 1) in addition to nesting samples from two new rookeries (Lanyu and Wan-an) in Taiwan and one new rookery on Taipin Tao in the Spratly Islands (Cheng, 1996) for a total of 41 baseline rookeries. In Taiwan, samples from Lanyu (n = 39) were collected between 1997 and 2014, and from Wan-an (n = 57) between 1995–1998 and 2009-2013. A subset of these samples was previously reported by Cheng et al. (2008), based on a shorter 384 bp fragment of the control region. In this study, we re-sequenced these samples using longer mtDNA fragments to ensure compatibility with the broader dataset. Additionally, samples were collected from Taipin Tao in the Spratly Islands (n = 9) in 2013. Furthermore, new samples from Rose Atoll in American Samoa (n = 107) were incorporated to expand and strengthen the existing genetic rookery baseline for this site, originally part of a broader dataset in Dutton et al. (2014b). Samples from other American Samoa rookeries (n=6) were excluded due to low sample size (see Supplementary Table S1), leaving a final baseline dataset of 3,471 samples.
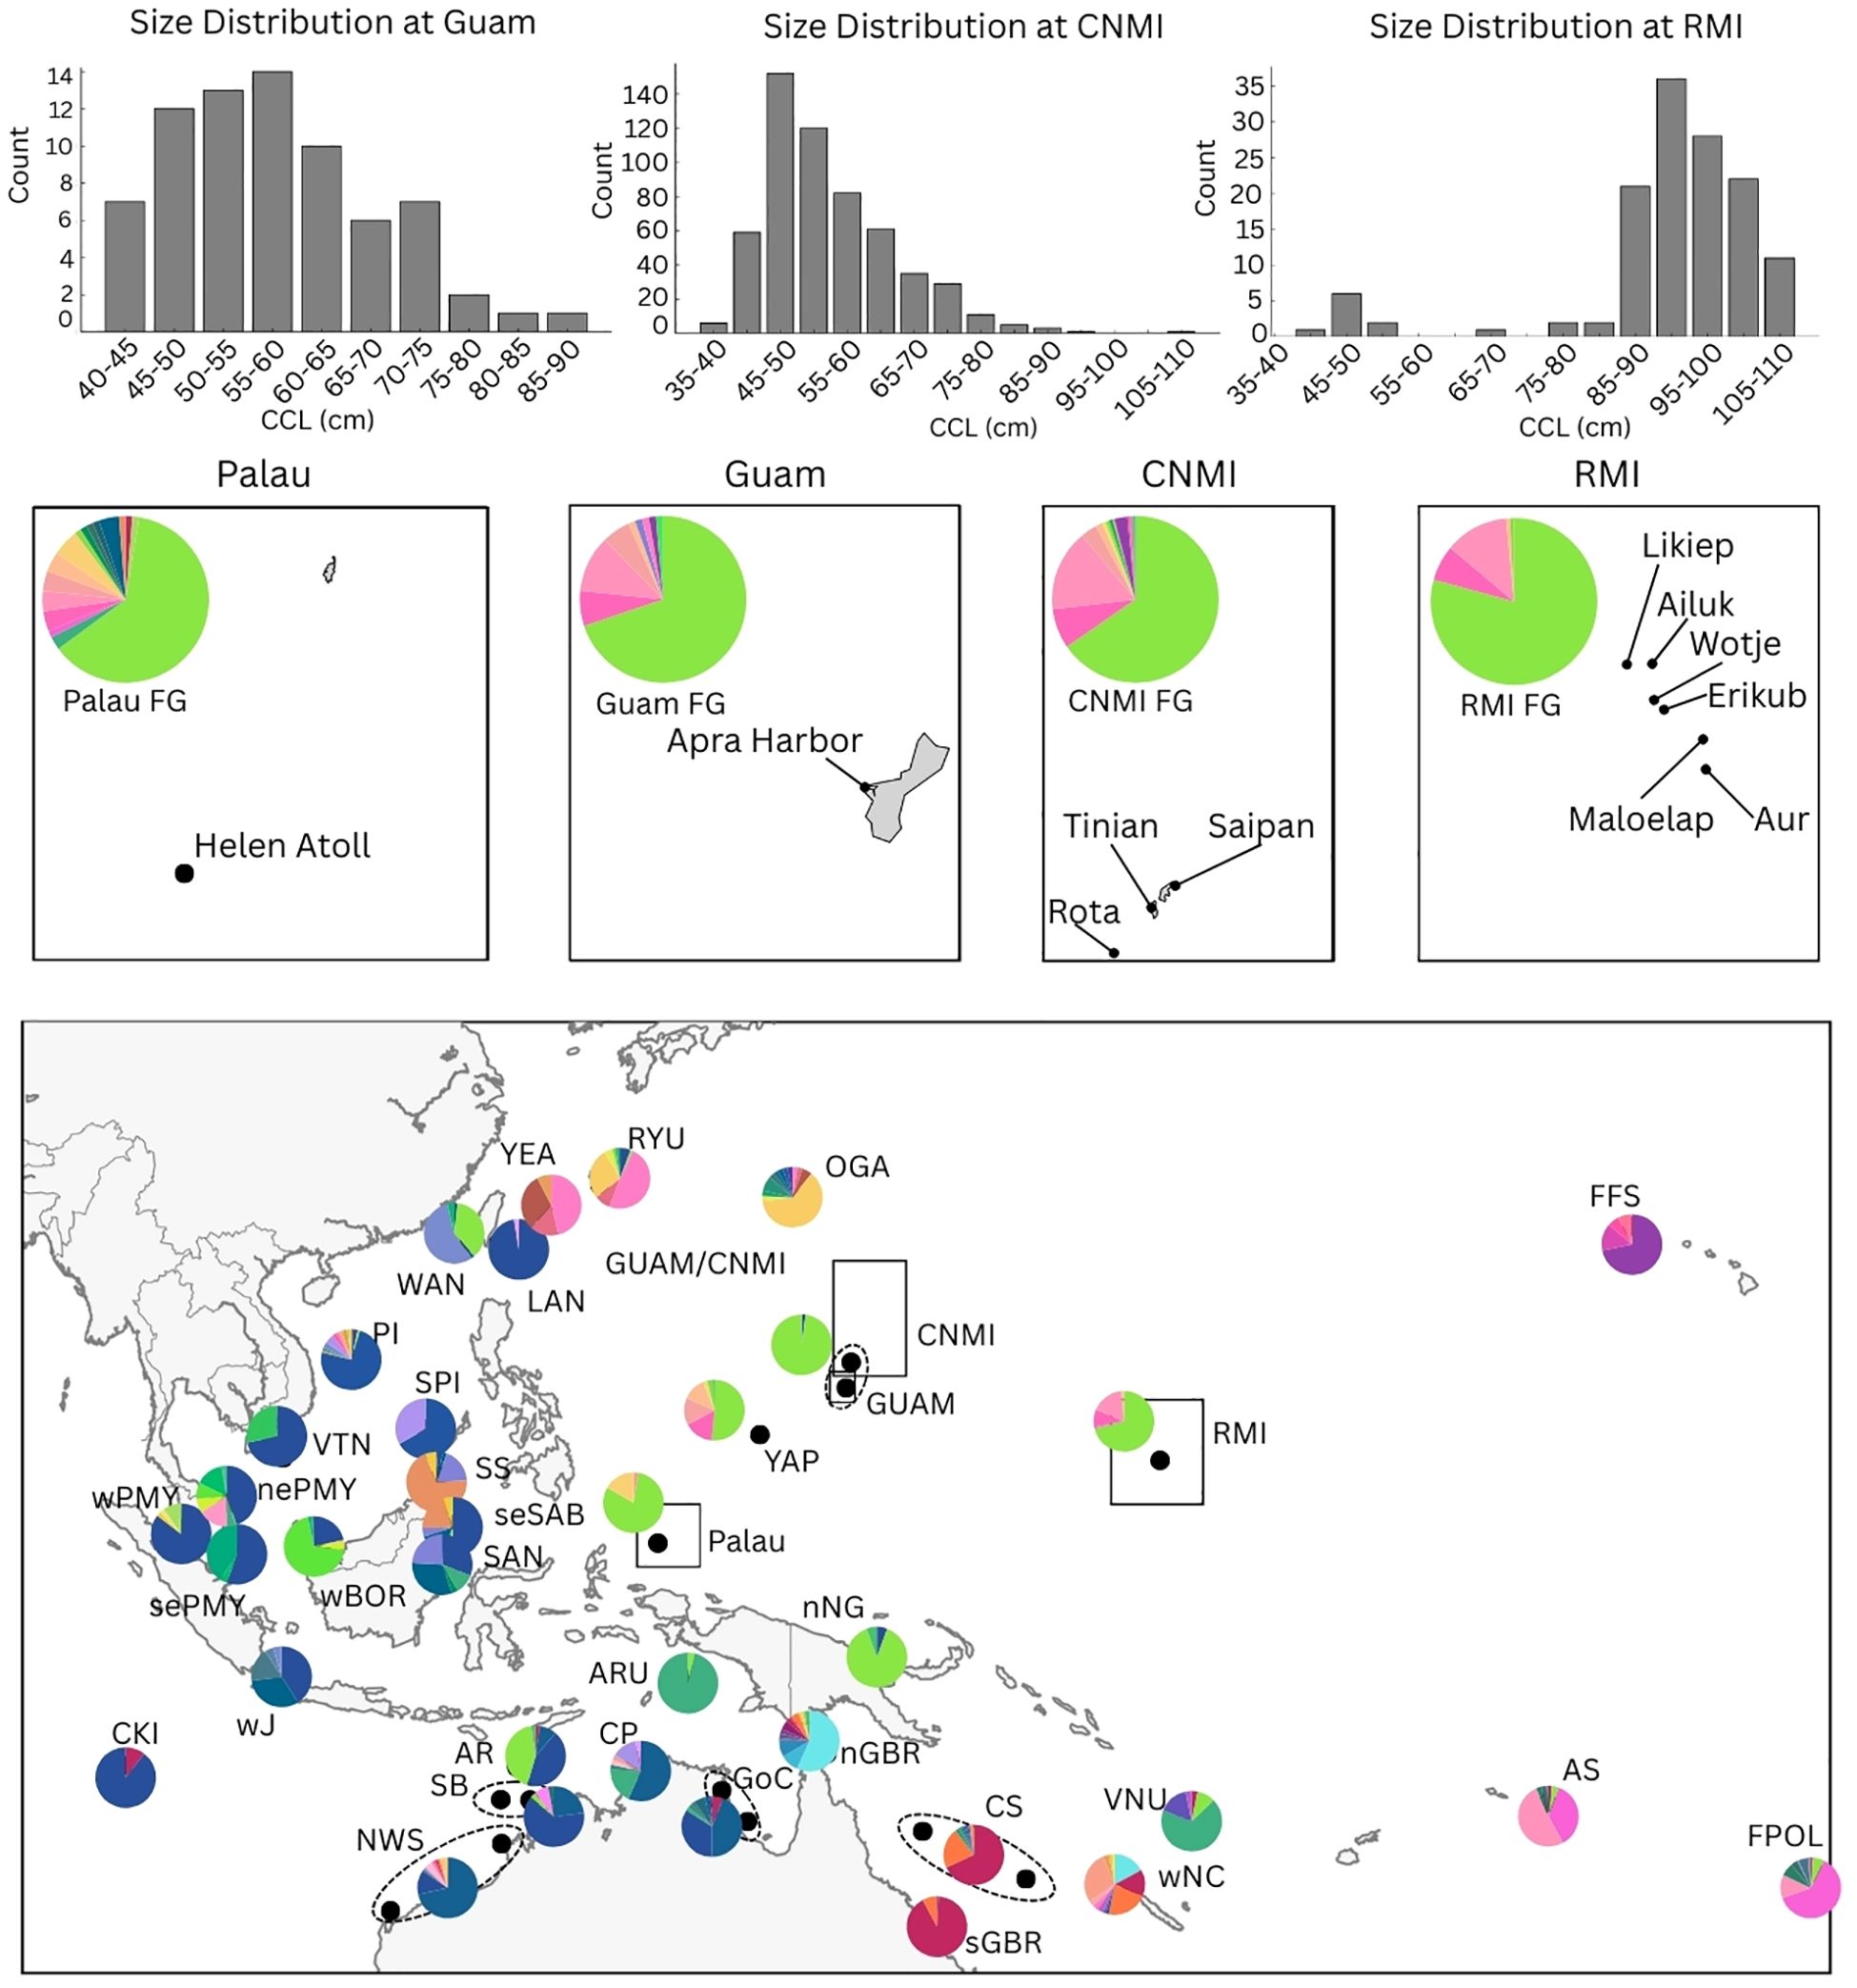
Figure 1. Map of the Asia-Pacific region showing the locations of the four foraging areas: Commonwealth of the Northern Mariana Islands (CNMI), Guam, Republic of the Marshall Islands (RMI), and Palau shown within black boxes. Pie charts on the map show haplotype frequencies at each Management Units (MUs) employed as the rookery baseline for the Mixed Stock Analysis (MSA) (excluding MUs from the Central and Eastern Pacific). Insert panels display haplotype frequencies of foraging ground (FG) samples from Palau, Guam, CNMI and RMI. Abbreviations for MU names align with the Stock ID column in Supplementary Tables S1 and S3. Additionally, the size distribution of turtles, represented by Curved Carapace Length (CCL) in 5 cm increments, is displayed for three foraging areas. No size data was available for Palau. For detailed haplotype frequencies, see Supplementary Table S1.
Sample collection from foraging turtles
A total of 849 skin samples were collected from foraging turtles across four locations in Micronesia and analyzed for the first time as part of this study (Figure 1). Whenever possible, turtles were classified into three size categories based on curved carapace length (CCL): juvenile (<65 cm CCL), sub-adult (65−<85 cm CCL), and large immature and adult turtles (>85 cm CCL) (Limpus, 1992).
Fieldwork and sample collection were conducted by various prior studies, including, 569 samples from the Commonwealth of the Northern Mariana Islands (CNMI), collected between 2008 and 2016 from Saipan (n = 469), Rota (n = 56), and Tinian (n = 44) (Martin et al., 2018). A total of 73 samples were collected from Guam between 2014 and 2017 (Martin and Jones, 2017; Martin et al., 2018). Seventy-seven samples were collected from the Republic of Palau in 2005, and 130 samples from the Republic of the Marshall Islands (RMI), primarily obtained from harvested turtles between 2005 and 2008. While these samples were collected as part of previously published fieldwork, the genetic sequencing and analysis were conducted for the first time in the present study. In the CNMI and Guam, turtles were hand captured by freediving between 2–25 meters. Captured turtles were immediately brought aboard for processing either on the boat or shore (Summers et al., 2017). The capture methods at other sites were either mixed or unspecified. All research in this study complied with applicable national guidelines, animal welfare laws, and permitting requirements. (and are listed in the acknowledgements). All samples were stored at -20°C in the Southwest Fisheries Science Center (SWFSC) Marine Mammal and Sea Turtle Research Collection in La Jolla, California, USA.
Genetic analyses
Genomic DNA was extracted from all samples using multiple extraction methods, adhering to standard laboratory procedures as described in Dutton et al., 2014a and Dutton et al., 2014b. Approximately ~800 bp of the mtDNA control region was amplified using polymerase chain reaction (PCR) techniques with primers LCM-15382 (5’ GCTTAACCCTAAAGCATTGG 3’) and H950g (5’GTCTCGGATTTAGGGGTTTG 3’) (Abreu-Grobois et al., 2006). A 25 µl volume PCR reaction was used, containing 18.25 µl of MilliQ H20, 2.5 µl of 10x MgCl2 buffer, 1.5 µl of dNTP (25 µM), 0.75 µl of each primer (10 µM), 0.25 µl of Taq polymerase and 1 µl of DNA template. PCR reactions were carried out using the following profile: initial DNA denaturation at 90°C for 2 min, followed by 35 cycles of 1) DNA denaturation at 94°C for 50 sec, 2) annealing between 52°C and 56°C for 50 sec, and 3) extension at 72°C for 1 min, ending with a final extension at 72°C for 5 min. Negative controls were used in each PCR to identify contamination, if present. The PCR products were run on 2% agarose gels stained with ethidium bromide to verify amplification (Maniatis et al., 1982). The Qiaquick PCR Purification kit (Qiagen, Valencia, CA, USA) was used to purify the PCR products. Samples were sequenced in both directions using a 12 µl reaction consisting of 3 µl MilliQ H2O, 3 µl of primer (1 µM), 3 µl of a 1:1 buffered version of the ABI® Big Dye Terminator v3.1, and 3 µl of purified PCR product. The samples were processed on an automated genetic analyzer (models 3130 and 3730, Applied Biosystems, Foster City, CA, USA). Sequence editing was performed using SeqScape v2.5 Applied Biosystems® or Geneious Prime software (Kearse et al., 2012). Each sequence was inspected for uncalled and miscalled bases, and all variable positions were validated by comparing sequences from the forward and reverse strands.
Once edited, the sequences were searched against the Basic Local Alignment Search Tool (BLAST) on GenBank (https://blast.ncbi.nlm.nih.gov/) and the SWFSC marine turtle haplotype databases to confirm their uniqueness and identify any matches with previously reported haplotypes. Haplotype nomenclature followed the CmP prefix standard, which provided a consistent naming system for the identified haplotypes (Jensen et al., 2019). All sequences were cropped to ~766 bp (Frey et al., 2009) to allow an accurate comparison with published literature.
Rookery population structure
To assess the population structure and genetic diversity among green turtle rookeries, we used Arlequin v.3.5 (Excoffier and Lischer, 2010). This was to perform a range of analyses, including calculating pairwise FST values and exact tests for population differentiation (Raymond and Rousset, 1995). We compared the newly obtained rookery samples with previously published MUs to determine their genetic relationships and potential conservation implications. The FST metric is widely used in population genetics to measure genetic differentiation, with values ranging from 0 (no differentiation) to 1 (complete differentiation). The significance of the FST values was determined through a permutation test using 10,000 permutations, with p-values less than 0.05 considered statistically significant. In addition to FST values, we performed the exact test of population differentiation to provide further insight into the genetic structure among the green turtle rookeries. This test compares allele frequencies between populations and calculates the probability of observing the given level of genetic differentiation by chance alone. As with the FST analysis, the exact test was conducted for each pair of rookery samples and between the new samples and previously published MUs. Statistical significance was determined using a Monte Carlo simulation (10,000 iterations), with p-values less than 0.05 considered significant. Finally, haplotype diversity (h) and nucleotide diversity (π) were estimated for each foraging ground based on 760-bp sequences using Arlequin v3.5 (Excoffier and Lischer, 2010).
Mixed stock analysis
Bayesian mixed stock analysis (MSA) was used to calculate the relative proportion of turtles from regional MUs within each of the four foraging grounds. The MSA was performed using baseline information derived from mtDNA haplotype frequencies of 41 genetically distinct green turtle MUs in the Asia-Pacific region (Supplementary Table S1). We used Bayes (Pella and Masuda, 2001) to analyze each foraging area individually. Flat priors were used for the MSA, and each model chain was initiated with equal prior probabilities. The analysis used four separate chains, each with a unique starting point. Chains underwent 50,000 iterations, with the initial 25,000 iterations discarded as burn-in. Subsequently, the mean, standard deviation, and 95% credibility interval were calculated. The summary statistics were calculated based both on individual MUs and summarized by their corresponding discrete population segment (DPSs) as defined under the US Endangered Species Act (Seminoff et al., 2015). A Gelman-Rubin shrink factor was computed to evaluate the convergence across all chains. A shrink factor value below 1.2 indicates convergence (Gelman and Rubin, 1992).
Ocean dispersal modeling
The ocean current simulations were conducted using the global Hybrid Coordinate Ocean Model (HYCOM; https://www.hycom.org/) (Bleck and Halliwell, 2007), which provided surface circulation data over a 6-year (May 9, 2008 through July 1, 2014, 2245 days) period. Given the 5–7 year pelagic phase typical for green turtles, extending simulations beyond a few years is unrealistic since the movement of larger, older individuals will likely have a more substantive swimming component than a passive drifting component. Therefore, hatchling dispersal was modeled for up to three years, focusing on the passive drift of simulated particles released daily from key nesting sites. Given the duration of currents, this drift window resulted in daily hatchling outputs of 3+ years (1150 release days with full 3-years at liberty), which were ten hatchlings per day per each of 33 critical nesting sites. Daily positions of each particle (hatchling) were recorded after one year of drift and until the end of 3 years. The trajectories and density of particles were visualized using GIS approaches and dispersal kernel matrices.
Results
Rookery baseline
The FST and Exact tests for samples from the new rookery at Taipin Tao, situated in the Spratly Islands, displayed significant differentiation from all other MUs, except for rookeries in the Paracel Islands, approximately 750 km northwest. However, given the small sample size (n = 9) and large distance (>500 km), we categorized the Spratly Islands as a distinct MU. A more extensive sample size is needed to determine if the Spratly Islands form a distinct genetic breeding population or part of a broader MU that includes the Paracel Islands. The FST and Exact tests of the samples from Lanyu, Wan-An, and American Samoa showed no significant difference compared to several earlier published data for regional rookeries (Supplementary Table S2). In our analysis, the Lanyu rookery demonstrated significant differentiation from all other MUs, except Western Peninsular Malaysia (FST and Exact test) and Cocos “Keeling” Islands (only FST) (Supplementary Table S2). A plausible explanation is the predominant presence of the haplotype CmP49.1 across the Asia Pacific region. Given the vast geographic distance between Lanyu to both Western Peninsular Malaysia (>3,200 km) and Cocos “Keeling” Islands (>4,700 km), these rookeries are also recognized and treated as distinct MUs. The Wan-An rookery showed a significant difference from all other MUs, reinforcing it as a distinct MU, consistent with previous work using shorter fragments of mtDNA d-loop (Cheng et al., 2008). Finally, in American Samoa, most samples originate from Rose Atoll (n = 107), while a small number of samples (n = 6) were collected from Swains, Tutuila, and Ofu and were excluded from the rookery baseline (Supplementary Table S1). Larger sample sizes from these sites are crucial to determine if multiple MUs exist within American Samoa. After grouping new samples with existing MUs, we conducted conclusive pairwise comparisons among the 41 MUs found throughout the Indo-Pacific (Supplementary Table S2). Of the 820 pairwise comparisons, 14 were not significant based on the FST, and nine were not significant for the Exact test. However, most of these (17 out of 20) included at least one site with samples fewer than 20, and these sites were over 500 km apart. Given this distance, which typically exhibits genetic differentiation, the results are attributed to a small sample size, and thus, we recognized these locations as distinct MUs. As a result, 41 MUs were identified as potential source rookeries when the mixed stock analysis was applied to the foraging grounds.
Sequence analysis
We identified 151 haplotypes across the 41 rookeries and the four foraging grounds (FG). Of these, 28 haplotypes (760 bp) were identified from 849 samples across four foraging grounds (Supplementary Table S1). Two haplotypes found in CNMI, CmP216.1 (GenBank accession number OR594305) and CmP223.1 (GenBank accession no. OR594306); one haplotype was found in Guam, CmP22.5 (GenBank accession no. OR594304) and one haplotype in Palau, CmP55.1 (GenBank accession no. KJ502596) were orphan haplotypes that had not been previously identified in the baseline (Supplementary Figure S1). These haplotypes were rare, making up less than 2% of the samples at each FG. No orphan haplotypes were found in RMI.
For the analysis of genetic diversity across the four foraging grounds, Palau showed a high number of haplotypes (16), including one orphan haplotype, the highest haplotype diversity at 0.6070 ± 0.0655 and nucleotide diversity, 0.01192 ± 0.00613, despite not having the most substantial sample size (n = 77). The CNMI, with the largest sample size of 569, also had a high number of haplotypes (18), including two orphan haplotypes. However, its haplotype diversity (0.5389 ± 0.0225) and nucleotide diversity (0.00512 ± 0.00283) were lower than Palau. Similar values were seen in Guam, with a moderate sample size of 73, a haplotype diversity of 0.4981 ± 0.0681, and a nucleotide diversity of 0.00622 ± 0.00340, also showing the presence of a unique orphan haplotype. The RMI, which presented a sample size of 130, recorded the lowest haplotype and nucleotide diversities among the regions, at 0.3549 ± 0.0497 and 0.00072 ± 0.00066, respectively (Table 1).
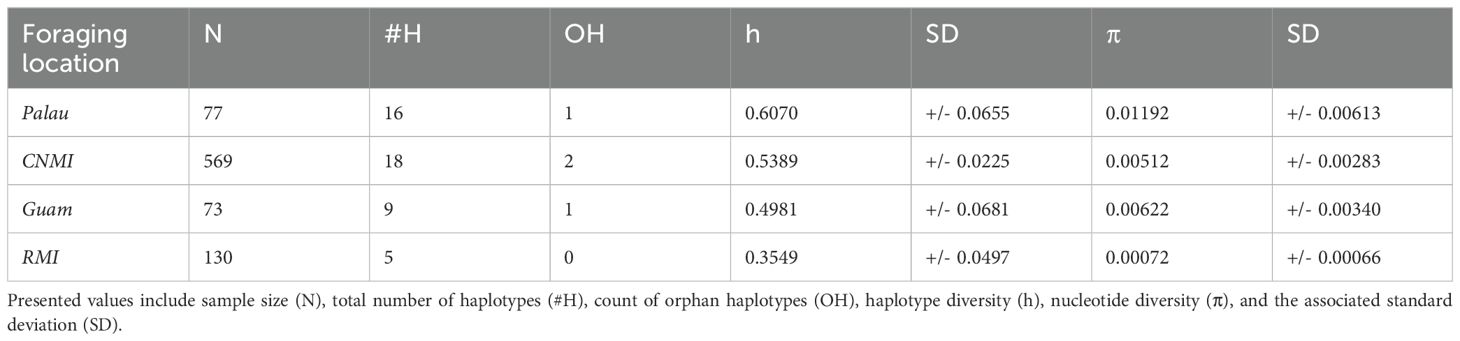
Table 1. Measures of genetic diversity across the four foraging locations including: Helen Reef, Palau; Commonwealth of Northern Mariana Islands (CNMI); Guam; and Republic of the Marshall Islands (RMI).
Carapace size of foraging turtles
The size of turtles varied across the different foraging grounds. In CNMI, Guam, and RMI, the CCL ranged from 36.1 to 105.1 cm, 41.6 to 87.3 cm, and 44.7 to 111.2 cm, respectively. However, the size distribution was skewed towards juvenile individuals in CNMI (mean = 54.7 cm) and Guam (mean = 57.9 cm). In contrast, the samples from the RMI foraging grounds predominantly included turtles that fell into the adult size category (mean = 91.7 cm CCL) (Figure 1). While this size distribution is typical of the turtles in Guam and CNMI (Summers et al., 2017, 2018; Gaos et al., 2020a, b), it may not reflect the actual size composition of the foraging turtles at RMI, given that RMI turtles were primarily sourced from harvested turtles (see discussion). No size data was available for the Palau FG. As such, in CNMI, most of the turtles were classified as juveniles (85%), 14% were subadults, and only five turtles were in the adult size range (>85 cm CCL) (Summers et al., 2017). Of the 73 samples in Guam, most turtles were juveniles (77%), 21% were sub-adults, and only two were large enough to be considered adults (Martin and Jones, 2017; Gaos et al., 2020b). The size range of the 77 turtles sampled from Palau were mostly unknown. Finally, the 130 samples collected from the Republic of the Marshall Islands (RMI) were classified as 7% juveniles, 4% as subadults, and 89% classified as adults. No size data was available for three turtles from RMI.
Mixed stock analysis
The MSA results across the four FGs showed some highly similar source contributions but also distinct differences in the origin of turtles (Figure 2, Supplementary Table S3). The predominant contributors in Guam and CNMI FGs were the rookeries in RMI (91% and 78%, respectively) and Yap (4% and 18%, respectively), with minimal contribution from MUs outside the region (3-4%). The MSA showed that turtles foraging within RMI waters also originate mainly from rookeries within RMI (82%), with a smaller contribution from rookeries in CNMI/Guam (12%) and Yap (4%) and minimal contributions from rookeries elsewhere (1%). Palau contrasted starkly with these foraging grounds, with the MSA showing minimal contribution from RMI (3%) and a more diverse mix of origins, including turtles originating from Yap (31%), Palau (47%), and a larger proportion of turtles coming from outside the region (16%). The latter included primary contributions from rookeries in the Central South Pacific DPS (American Samoa and French Polynesia) and the Indo-Pacific DPS (rookeries in northeast Borneo). The high diversity of haplotypes found in the Palau foraging grounds further supports the diverse origin of turtles that use this area.
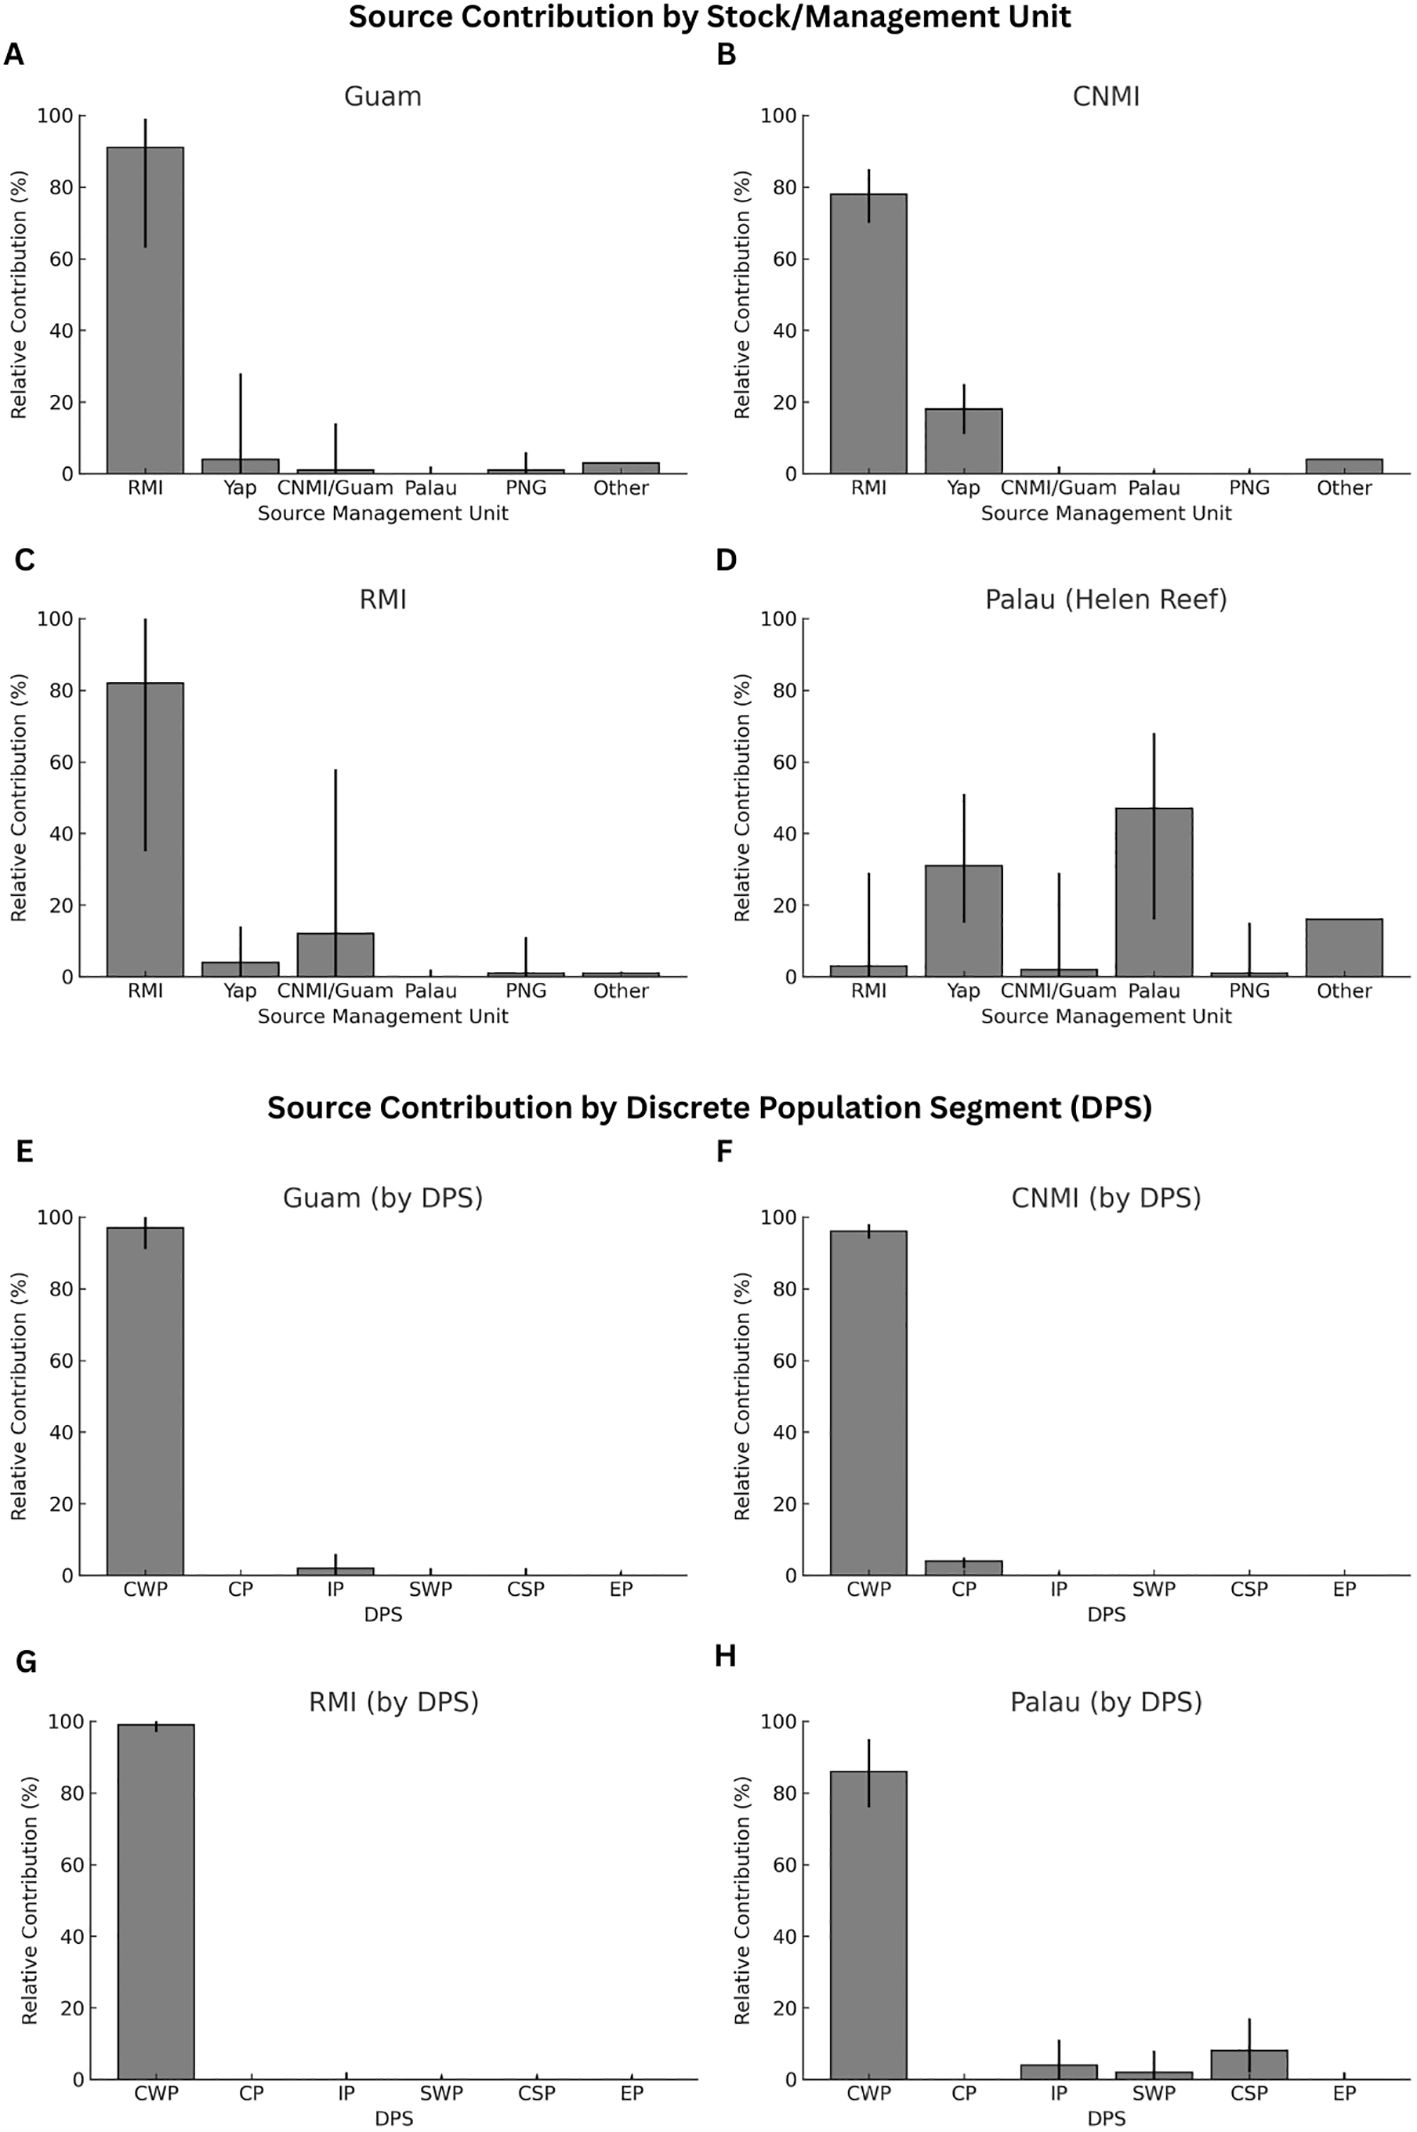
Figure 2. Results from a Bayesian Mixed Stock Analysis (MSA) showing the estimated contributions of source populations to four foraging grounds (FGs): Guam, CNMI, RMI, and Palau. Panels (A–D) display the relative contributions of individual Management Units (MUs). Only MUs within Micronesia are shown; contributions from other rookeries were negligible and are grouped under the “Other” category. Bars represent the mean estimated contribution, and error bars indicate the 95% Credibility Interval. Panels (E–H) present the same foraging grounds, but with contributions summarized by Discrete Population Segments (DPS).
Although rare, evidence of long-distance dispersal was evident by stock-specific haplotypes. For instance, in the Palau FG, haplotype CmP169.1 has only been identified in the northern Great Barrier Reef MU; haplotype CmP56.1 has only been found in American Samoa and French Polynesia, and haplotypes CmP40.1 and CmP57.1 are only found in rookeries in Indonesia and Malaysia. In the Guam foraging ground, haplotype CmP57.2 has only been found in low frequencies in Indonesia, American Samoa, and French Polynesia. Meanwhile, in the CNMI foraging ground, haplotype CmP106.1 is associated with rookeries in Indonesia and Malaysia.
In contrast, haplotype CmP50.1, found in both Guam and CNMI, has only been found in nesting turtles from Japan. Remarkably, four haplotypes uniquely linked to the Hawaiian and Eastern Pacific MUs (CmP1.1, CmP2.1, CmP3.1, and CmP3.2) were found in 20 individuals in CNMI and a single individual in Guam. This finding underscores the intricate movement patterns and diverse origins of marine turtles in these foraging areas.
Ocean dispersal models
The ocean dispersal modeling was conducted for 33 rookeries across the Pacific and Southeast Asia, with results presented in Supplementary Figures S1. While these simulations demonstrated broad dispersal patterns, they primarily highlighted within-region connectivity, aligning with the boundaries of discrete population segments (DPSs). For rookeries outside Micronesia, dispersal was generally confined to their respective DPSs, reinforcing the regional structure of green turtle populations. These broader patterns are visualized in the supplementary figures and provide insights into connectivity dynamics across the Pacific and Southeast Asia.
Focusing on the region of the study, the ocean dispersal modeling results show that the four Micronesian nesting sites were the primary source of particles dispersing to the Micronesian FGs (Figure 3; Supplementary Figures S1). The three-year simulations revealed that particles were dispersed widely within the region, primarily driven by prevailing westward currents. Dispersal patterns from the Republic of the Marshall Islands (RMI) suggested westward trajectories, with some particles reaching the Commonwealth of the Northern Mariana Islands (CNMI) and Guam. In contrast, particles released from Palau showed more particles remaining localized, highlighting the strong retention effects of currents near Helen Reef (Figure 3). Particles released from CNMI and Guam primarily followed westward trajectories, moving into the Philippines and beyond, indicating limited retention within Micronesia.
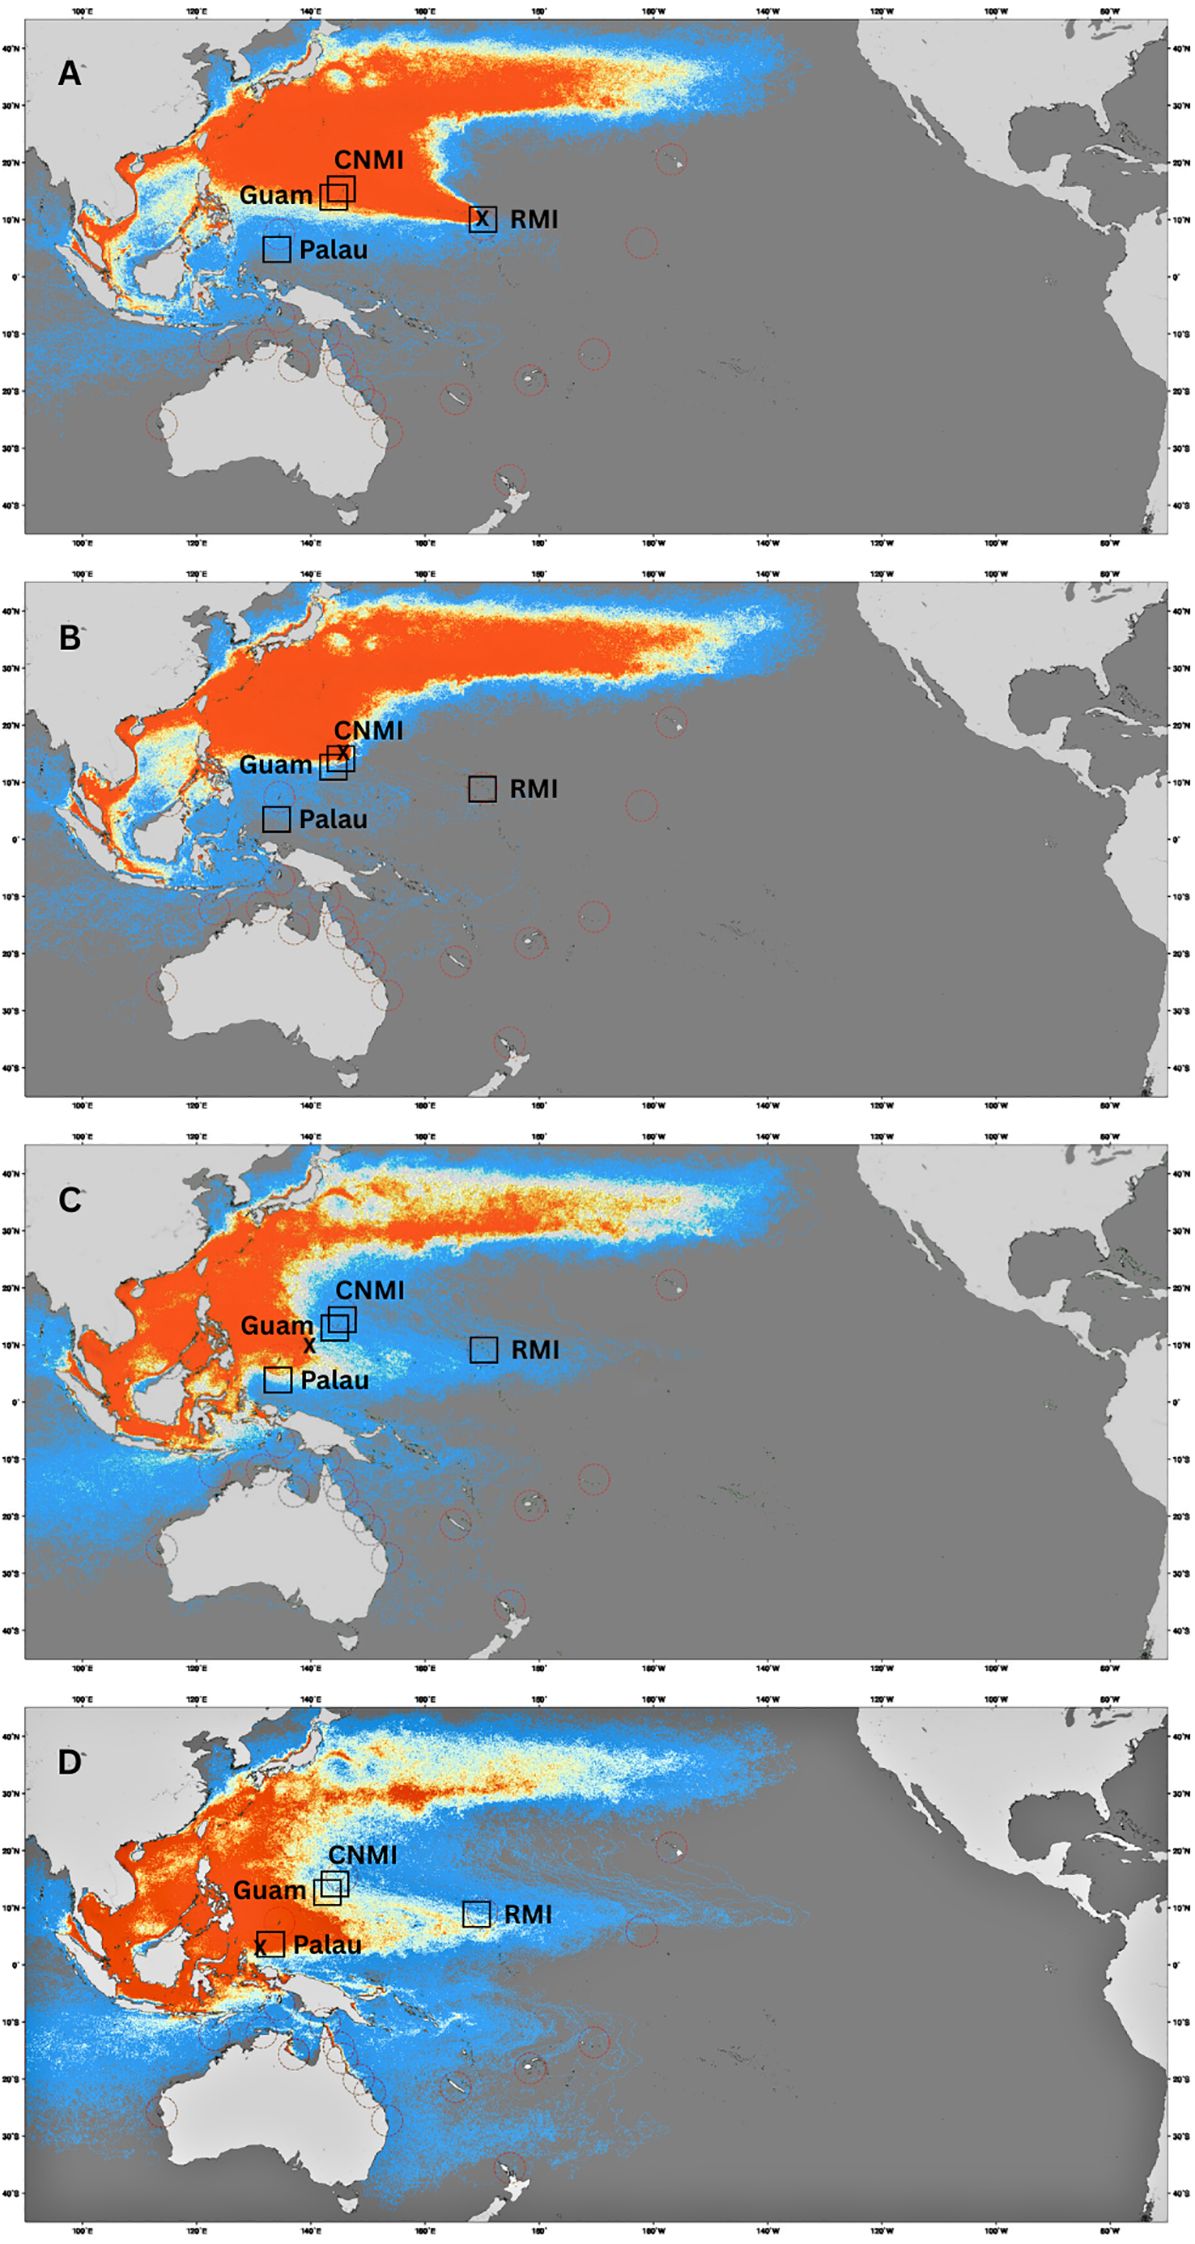
Figure 3. Simulated drift trajectories of Chelonia mydas post-hatchlings from four different release sites based on ocean current models. Panels (A–D) represent passive particle simulations from (A) Republic of the Marshall Islands (RMI), (B) Commonwealth of the Northern Mariana Islands (CNMI), (C) Federated States of Micronesia (Yap), (D) Helen Reef, Palau. Colors indicate relative density of simulated particles, with warmer colors (red/orange) showing areas of higher particle concentration.The approximate locations of the four key foraging grounds are marked with black squares, RMI, CNMI, Guam and Helen Reef, Palau.
Similarly, particles released from Yap displayed dispersal patterns consistent with ocean currents driving westward movement, although some retention where particles remained was observed locally within the Micronesian region.
Discussion
Although our drift models and mixed stock analysis revealed migration patterns that varied geographically, our findings suggest that most green turtles found at the four foraging grounds we sampled in Micronesia predominantly also nest in the same ocean region. However, albeit rare, we also see significant deviations from this paradigm, with some individuals originating from geographically disparate rookeries, including some located thousands of kilometers away in the central and eastern Pacific, requiring trans-Pacific migrations. These results underscore the significance of evaluating connectivity on local and regional scales.
Foraging grounds in Micronesia
The RMI foraging ground predominantly hosted turtles from its own rookeries, with an estimate that 82% of turtles originate from local beaches. It is however important to note that the RMI spans a significantly larger geographic area than Guam, CNMI and Palau. As a result, hatchlings born within the RMI may still undertake substantial movements to settle at different foraging areas within this broad region. However, not all turtles born in RMI rookeries recruit to local foraging grounds, with the RMI nesting colony substantially contributing to the foraging grounds in Guam and CNMI, a distance exceeding 2,700 km. At the same time, the foraging ground in Palau, situated further east (more than 4,000 km), showed a minimal (3%) contribution from RMI. These dispersal patterns are supported by the passive drift models (Figure 3), which suggest ocean currents facilitate the dispersal of post-hatchlings from RMI westward towards CNMI and Guam and even further into the northern parts of the Philippines, but not southwestward toward Palau.
The rookery contributions and ocean dispersal patterns for green turtles foraging in CNMI and Guam differ from those in the RMI. The MSA indicates only a moderate 12% contribution from CNMI/Guam nesting colonies to the RMI foraging ground, and ocean simulations show no connectivity flowing from CNMI/Guam to RMI. The perceived contribution from CNMI/Guam in the RMI foraging grounds might be attributed to the inherent limitations of the MSA (Jensen et al., 2013a). The weak genetic differentiation between MUs in CNMI/Guam and RMI, underscored by shared haplotypes, could skew the MSA results. Enhancing the genetic resolution is needed for a more accurate interpretation of the MSA.
Whole mitogenome sequencing, which has previously augmented resolution for green turtles in other regions (Shamblin et al., 2012), has recently been applied to CNMI and Guam green turtles (Frey et al., 2025). Frey et al. demonstrated that although D-loop haplotypes are shared between these neighboring rookeries (Dutton et al., 2014a; this study), full mitochondrial genomes provided the resolution needed to distinguish them. Such advancement is likely to bolster the precision of stock assignments.
Both of the aforementioned potential hatchling dispersal patterns are supported by satellite telemetry, which shows post-nesting green turtles satellite-tagged at Erikub Atoll in RMI migrating to foraging grounds in RMI, Kiribati, Philippines, and Federated States of Micronesia (FSM) (Maison et al., 2010). Meanwhile, of more than 40 post-nesting green turtles tagged on Guam and CNMI, 38 migrated to waters further west (e.g., Philippines, Indonesia), and only one migrated eastward to the FSM (NOAA unpublished data). This scenario supports the idea that contra-current dispersal patterns are rare and is consistent with the limited MSA contributions of Guam and CNMI rookeries to RMI foraging grounds from our results. One likely explanation for the migratory patterns of these reproductive females is that post-hatchlings from RMI are transported to foraging grounds in CNMI, Guam, and the Philippines during their early developmental years, but as these turtles reach maturity, they return to foraging grounds proximate to their rookery origins. This cycle explains the lack of larger adult-sized turtles in CNMI and Guam FGs and the predominant presence of adult-sized turtles foraging in RMI. Alternatively, it is possible that larger adult turtles were previously depleted in CNMI and Guam, and the current observations reflect a new post-protection cohort of turtles now maturing. Ongoing monitoring efforts will be able to assess this possibility in the coming years.
In CNMI and Guam, the reefs surrounding the islands host a large number of foraging green turtles that originate primarily from RMI, accounting for 78-91%. The Yap MU contributes a smaller fraction, with 4-18% and near zero (0-1%) originating from the CNMI/Guam MU itself. However, the number of juvenile turtles from Guam and CNMI may be too low to detect in mixed stock analysis. In CNMI and Guam, there are only tens of turtles nesting annually across the main four islands (Maison et al., 2010; Summers et al., 2018). Ocean simulations provide insights into the trajectories of these turtles post-hatching. Turtles from CNMI and Guam are likely swept westwards into the Philippines by prevailing currents and northwards into Japanese foraging grounds (Figure 3). This movement aligns with the MSA results, which show minimal connectivity to FGs in Palau or RMI, and satellite telemetry results for nesting females (NOAA unpublished data). Reinforcing this observation, satellite telemetry of two post-nesting green turtles from Guam showed that one migrated to foraging grounds in the Philippines and the other migrated north to Japan (Maison et al., 2010) and green turtles nesting in Yap have been tracked to the Philippines, and north to the Ryukyu Islands in Japan (Kolinski et al., 2014). Furthermore, genetic studies conducted in Japanese foraging grounds support these findings, indicating contributions from RMI and Yap (Hamabata et al., 2018).
Foraging turtles in Palau showed a more diverse range of origins. The primary contributors to this FG are local Palau rookeries, accounting for 47%, followed by Yap at 31%. In contrast, contributions from CNMI/Guam and RMI are minimal, at 1% and 3%, respectively. Again, these observations can be explained by ocean simulations. As highlighted previously, the simulations reveal how hatchlings from RMI could be transported towards CNMI and Guam but veer northwest, bypassing Palau and the north coast of Papua.
On the other hand, the simulations show connectivity of the Palau FG to the Palau and Yap MUs, which is consistent with the MSA results, which show Yap contributing significantly to Palau’s foraging ground but with minimal contributions to CNMI, Guam, or RMI. The dispersal patterns from Yap highlight its intermediate role within the regional connectivity of Micronesia, both contributing locally and facilitating connections with areas to the west. This suggests that while passive drift plays a role in dispersal, the local oceanic dynamics and the swimming behavior of hatchlings and young juveniles influence the eventual distribution of turtles in these regions.
Interestingly, the Palau FG showed small but specific contributions from regions outside the Central West Pacific, accounting for 16%. These contributions mainly came from rookeries in the Central South Pacific DPS (primarily American Samoa and French Polynesia) and the Indo-Pacific DPS, specifically pointing towards MUs in northeast Borneo (Sulu Sea, southeast Sabah and Sangalaki). Ocean simulations corroborate this potential connectivity (Supplementary Figure S1), where rookeries in northeast Borneo show links to the strait leading to Palau. While the connections to American Samoa and French Polynesia are less obvious, simulations and post-nesting satellite tracks (Murakawa et al., 2024) still hint at possible routes directing turtles’ northwest into regions proximate to Palau. Such findings are consistent with the high haplotype diversity identified in the Palau foraging grounds, underscoring the diverse origin of turtles that use this area.
These results emphasize the complex connectivity patterns observed among the different foraging grounds and the potential role of ocean currents in shaping these patterns.
Long-distance migrations
The long-distance movements of turtles in this study are remarkable. Perhaps most noteworthy are 20 turtles (3.4%) in the CNMI foraging ground that showed haplotypes only found in the nesting populations of the central and eastern Pacific rookeries. The MSA indicated that the turtles originated from the Northwestern Hawaiian Islands more than 4,200 km to the east. Although green turtles are not generally known for the ocean-wide migrations of leatherbacks and loggerheads (Bolten et al., 1998; Benson et al., 2011), support for sporadic long-distance dispersal across the Pacific Ocean has been documented in both directions. Haplotypes unique to East Pacific nesting populations have been identified at foraging grounds in Japan (Nishizawa et al., 2013, 2014), Fiji (Piovano et al., 2019), as well as at the small foraging population in New Zealand (Godoy et al., 2012). Notably, these examples all include juvenile turtles, which are only found at higher latitudes, such as in Japan and CNMI to the north or New Zealand to the south. For example, no East Pacific haplotypes were found in Palau or RMI, and no case exists for thousands of turtles sampled in New Caledonia (Read et al., 2015) or along the East Australian coastline (Jensen et al., 2016; Jones et al., 2018; Day et al., 2024). Similarly, haplotypes unique to the western Pacific have been identified at foraging grounds at the Northwest Hawaiian Islands (Dutton et al., 2008) and Gorgona Island in Colombia (Amorocho et al., 2012), and rare trans-oceanic dispersal of juvenile green turtles have been documented in the Atlantic (Monzón-Argüello et al., 2010). Interestingly, all these turtles shared a common feature: they were all juvenile-size classes, and it is noteworthy that except for the two individuals in Wan-an identified in this study, no haplotypes are shared between nesting populations on either side of the Pacific, suggesting that these turtles, once they reach maturity, migrate back across the Pacific to nest in their natal region.
Finally, it is worth noting that in the Wan-An rookery, two turtles had the haplotype CmP4.6, previously only found in rookeries in the East Pacific (Mexico, Costa Rica, and Ecuador). These two samples were sequenced multiple times (3 and 4 times, respectively) to validate the sequence accuracy. Furthermore, a supplementary microsatellite analysis of the same samples revealed that one individual was assigned to the Wan-An rookery while the other was assigned to the Galapagos Islands stock (Roden et al., 2023; Roden and Dutton, unpublished). These results allude to the potential presence of a recent migrant, marking the first instance of shared green turtle haplotypes between the West and East Pacific rookeries.
The role of ocean currents
The role of ocean currents in shaping the connectivity patterns of green turtle populations is critical, particularly during the early pelagic phase (Jensen et al., 2020; Putman and Naro-Maciel, 2013). Our simulations demonstrate that passive drift largely determines the initial dispersal of hatchlings, leading to significant westward movement from key rookeries like RMI and Yap. This westward flow aligns with the predominant current systems, supporting the findings of long-distance movements and the distribution of turtles in distant foraging grounds such as CNMI and Guam. However, the localized retention observed in Palau indicates that not all regions experience the same level of connectivity. In areas with more complex current systems or eddies, like Helen Reef in Palau, particles remained more clustered, suggesting these conditions may enhance site fidelity or local recruitment.
This variability underscores the need for detailed, site-specific conservation strategies that consider both regional connectivity and localized retention dynamics. Further refinement of drift models, incorporating longer time scales, interannual oceanographic variability (e.g. ENSO), and behavior based inputs would enhance our understanding of the complex connectivity patterns across such dynamic regions.
While our ocean drift simulations relied exclusively on passive dispersal models, there is a growing body of research highlighting the value of incorporating behavioral elements, such as swimming, into ocean dispersal modelling (Putman and Mansfield, 2015; Gaube et al., 2017; Wildermann et al., 2017). These Individual-Based Models (IBM) can offer a detailed understanding of how hatchlings and juveniles interact with dynamic features such as eddies and fronts (Putman and Naro-Maciel, 2013; Phillips et al., 2025). However, the primary objective of our study was to test whether passive drift alone could explain the observed genetic connectivity across Micronesia. The strong alignment between early (3-year) dispersal trajectories and the distribution of benthic foraging aggregations, suggests that passive drift can broadly predict turtle dispersal during early life stages.
We also acknowledge that our simulations, based on HYCOM data from a six years period (2008–2014), do not fully capture longer-term ocean variability. However, considering that juvenile turtles sampled span multiple size classes and likely hatched over a 15+ year period, both the MSA results and dispersal models reflect cumulative regional patterns rather than discrete temporal events. While more sophisticated modelling approaches will undoubtedly add value in the future, they fall outside the scope of this study.
Conclusion
Sea turtles hold deep cultural, spiritual and subsistence importance across the Pacific Islands (Balazs, 1975, 1983; Allen, 2007). Understanding their movements and habitat use is crucial for effective conservation, especially given ongoing threats from fisheries bycatch and traditional harvest (Aylesworth, 2009; Summers et al., 2018). A key priority for informed management and conservation is identifying population boundaries and connectivity between rookeries and foraging grounds (Hamann et al., 2010; Fuentes et al., 2023).
This study contributes to that goal by combining genetic and ocean simulation data to assess regional connectivity of green turtles across Micronesia. The findings highlight the diverse origins and migratory routes of green turtle populations, reinforcing the need for regional conservation efforts that can be tailored to protect the most vulnerable populations. The results presented here offer a valuable baseline to inform future efforts.
In particular, integrating genetic baselines with tagging, telemetry, behaviorally-informed dispersal models, and more comprehensive genomic and mitogenomic markers (Horne et al., 2023; Frey et al., 2025), will be important next steps for understanding and conserving green turtle populations in the western Pacific.
Data availability statement
The datasets presented in this study can be found in online repositories. The names of the repository/repositories and accession number(s) can be found in the article/Supplementary Material.
Ethics statement
The animal study was approved by Institutional Animal Care and Use Committee (IACUC) of the NOAA-National Marine Fisheries Service (Pacific Islands Fisheries Science Center). The study was conducted in accordance with the local legislation and institutional requirements.
Author contributions
MJ: Conceptualization, Formal analysis, Investigation, Writing – original draft, Writing – review & editing. EL: Data curation, Formal analysis, Methodology, Software, Validation, Writing – review & editing. DK: Formal analysis, Methodology, Software, Validation, Writing – review & editing. AF: Formal analysis, Investigation, Methodology, Software, Validation, Writing – review & editing. TS: Methodology, Resources, Validation, Writing – review & editing. JH: Methodology, Resources, Writing – review & editing. GB: Methodology, Resources, Writing – review & editing. SM: Resources, Writing – review & editing. TJ: Conceptualization, Funding acquisition, Resources, Supervision, Validation, Writing – review & editing. SM: Methodology, Project administration, Resources, Supervision, Writing – review & editing. AG: Resources, Validation, Writing – review & editing. PD: Conceptualization, Funding acquisition, Investigation, Project administration, Resources, Supervision, Validation, Writing – original draft, Writing – review & editing.
Funding
The author(s) declare that financial support was received for the research and/or publication of this article. Funding provided by the National Oceanic and Atmospheric Administration’s National Marine Fisheries Service and a Marie Skłodowska-Curie grant 898363-SeaTGen to MJ from the European Union’s Horizon 2020 research and innovation programme.
Acknowledgments
We thank SPREP, the late Lui Bell, Irene Kelly, Kyle Van Houtan, Camryn Allen, Karen Frutchey, I-Juinn Cheng for their help in coordinating sample collections. The authors also thank Suzanne Roden for valuable comments on the manuscript. A. Lanci, V. Pease, and A. Konopacki helped with the laboratory analysis. The following people, communities, and organizations helped with field collections: Alden Tagarino, Ruth Utzurrum, Katerine Schletz-Saili (American Samoa). Vicente Camacho, Roque Santos, Joseph Ruak, Sylvan Igisomar (Northern Marianas). Julie Barr and William Andrew (Palau); Shawn Wusstig (Guam). The Falalop, the FSM Ulithi Community, the Marine Resources Office, the Department of Resources and Development, and Yap State Marine Resources Management Division; the field crew in Ulithi included X. Maigul, M. Lingelmar, A. Sau, J. Mangirechog, J. P. Malisou, L. Mal, B. Malpuluw, V. Thawalmara, A. Suwel, A. Yangolug, E. Yatch, E. Rusumal, J. Mangirechog, M. Fasong, N. Malifang, J. Waithog, J. Maremog, J. J. Hasog, G. Hacheglyeg, M. Dohwel, Q. Yefalgoi, H. Remaatiul, R. J. Lutwog, K. Dothwel, R. Yurus, M. Tabungmai; the data collectors of Women United Together in the Marshall Islands (WUTMI), including K. Boktok, M. Langidrik, H. Jacob, E. Senight, R. Jidok, A. Bunglick, R. Jelke, R. Jidok, R. and A. deBrum, L. Mejbon; C. Bigler, H. Heine (Project Coordinators); N. Vander Velde (Biologist), the Marshall Islands Marine Resources Authority (MIMRA), and E. Kabua. The CNMI DLNR/DFW Sea Turtle Program (Department of Lands and Natural Resources/Division of Fish and Wildlife); the Palau Bureau of Marine Resources; for American Samoa: U. R. Tulafono (former DMWR director) R. Matagi-Tofiga (current DMWR director); Shawn Wusstig (Guam), Guam Division of Aquatic and Wildlife Resources (DAWR). The Commonwealth of the Northern Mariana Islands Department of Lands & Natural Resources, Division of Fish & Wildlife. All research in this study complied with all applicable animal welfare laws. Samples are archived in the US National Marine Fisheries Service (NMFS) Marine Mammal and Sea Turtle Research Collection at the Southwest Fisheries Science Center and were collected under the respective national authorizations, including USFWS permit # TE-72088A-3, NMFS permit # 21260, NMFS IACUC # SWPI_2013-05R and SWPI_2023_01 and were legally imported under US CITES permit US844694/9.
Conflict of interest
Author JRH is the owner of Jessy’s Tag Services.
The remaining authors declare that the research was conducted in the absence of any commercial or financial relationships that could be construed as a potential conflict of interest.
The author(s) declared that they were an editorial board member of Frontiers, at the time of submission. This had no impact on the peer review process and the final decision.
Generative AI statement
The author(s) declare that no Generative AI was used in the creation of this manuscript.
Publisher’s note
All claims expressed in this article are solely those of the authors and do not necessarily represent those of their affiliated organizations, or those of the publisher, the editors and the reviewers. Any product that may be evaluated in this article, or claim that may be made by its manufacturer, is not guaranteed or endorsed by the publisher.
Supplementary material
The Supplementary Material for this article can be found online at: https://www.frontiersin.org/articles/10.3389/fmars.2025.1558792/full#supplementary-material
References
Abreu-Grobois F. A., Horrocks J. A., Formia A., Dutton P. H., LeRoux R., Vélez-Zuazo X., et al. (2006). “New mtDNA D-loop primers which work for a variety of marine turtle species may increase the resolution of mixed stock analysis,” in Book of abstracts: Twenty-Sixth Annual Symposium on Sea Turtle Biology and Conservation, eds Frick M., Panagopoulou A., A., Rees F., and Williams K. (Crete: ISTS), 179.
Allen M. S. (2007). Three millennia of human and sea turtle interactions in Remote Oceania. Coral Reefs 26, 959–970. doi: 10.1007/s00338-007-0234-x
Amorocho D. F., Abreu-Grobois F. A., Dutton P. H., and Reina R. D. (2012). Multiple distant origins for green sea turtles aggregating off Gorgona Island in the Colombian Eastern Pacific. PloS One 7, e31486. doi: 10.1371/journal.pone.0031486
Aylesworth L. (2009). Oceania regional assessment. Pacific Island fisheries and interactions with marine mammals, seabirds and sea turtles. Nicholas School of the Environment and Earth Sciences, Durham, North Carolina, USA; Duke University.
Balazs G. H. (1983). Sea turtles and their traditional usage in Tokelau. Atoll Res. Bull. 279, ii–30. doi: 10.5479/si.00775630.279.1
Benson S. R., Eguchi T., Foley D. G., Forney K. A., Bailey H., Hitipeuw C., et al. (2011). Large-scale movements and high-use areas of western Pacific leatherback turtles, Dermochelys coriacea. Ecosphere 2, 1–27. doi: 10.1890/ES11-00053.1
Bleck R. and Halliwell G. R. (2007). The HYCOM (HYbrid Coordinate Ocean Model) data assimilative system. J. Mar. Syst. 65, 60–83. doi: 10.1016/j.jmarsys.2005.09.016
Bolten A. B., Bjorndal K. A., Martins H. R., Dellinger T., Biscoito M. J., Encalada S. E., et al. (1998). Transatlantic developmental migrations of loggerhead sea turtles demonstrated by mtDNA sequence analysis. Ecol. Appl. 8, 1–7. doi: 10.1890/1051-0761(1998)008[0001:TDMOLS]2.0.CO;2
Chaves J. A., Peña M., Valdés-Uribe J. A., Muñoz-Pérez J. P., and Torres-Carvajal O. (2017). Connectivity, population structure, and conservation of Ecuadorian green sea turtles. Endanger. Species Res. 32, 251–264. doi: 10.3354/esr00809
Cheng I. J. (1996). Sea turtles at Taipin Tao, South China Sea. Mar. Turtle Newslett. 75 1-12, p.20242367.
Cheng I. J., Dutton P. H., Chen C. L., Chen H. C., Chen Y. H., and Shea J. W. (2008). Comparison of the genetics and nesting ecology of two green turtle rookeries. J. Zool. 276, 375–384. doi: 10.1111/j.1469-7998.2008.00501.x
Day J., Hall J., Rose K., Vinette Herrin K., March D., Pitt O., et al. (2024). Mixed stock analysis identifies natal origins of green turtles at foraging grounds in southeastern Australia. Front. Mar. Sci. 11. doi: 10.3389/fmars.2024.1346932
Dethmers K. E. M., Broderick D., Moritz C., FitzSimmons N. N., Limpus C. J., Lavery S., et al. (2006). The genetic structure of Australasian green turtles (Chelonia mydas): exploring the geographical scale of genetic exchange. Mol. Ecol. 15, 3931–3946. doi: 10.1111/j.1365-294X.2006.03070.x
Dolfo V., Gaspar C., Bourjea J., Tatarata M., Planes S., and Boissin E. (2023). Population genetic structure and mixed stock analysis of the green sea turtle, Chelonia mydas, reveal reproductive isolation in French Polynesia. Front. Mar. Sci. 10. doi: 10.3389/fmars.2023.1201384
Dutton P. H., Balazs G. H., LeRoux R. A., Murakawa S. K. K., Zárate P. M., and Martínez L. S. (2008). Composition of Hawaiian green turtle foraging aggregations: mtDNA evidence for a distinct regional population. Endanger. Species Res. 5, 37–44. doi: 10.3354/esr00101
Dutton P. H., Jensen M. P., Frey A., Lacasella E., Balazs G. H., Zárate P., et al. (2014a). Population structure and phylogeography reveal pathways of colonization by a migratory marine reptile (Chelonia mydas) in the central and eastern Pacific. Ecol. Evol. 4, 4317–4331. doi: 10.1002/ece3.1269
Dutton P. H., Jensen M. P., Frutchey K., Frey A., LaCasella E. L., Balazs G. H., et al. (2014b). Genetic stock structure of green turtle (Chelonia mydas) nesting populations across the Pacific islands. Pac. Sci. 68, 451–464. doi: 10.2984/68.4.1
Excoffier L. and Lischer H. E. L. (2010). Arlequin suite ver 3.5: a new series of programs to perform population genetics analyses under Linux and Windows. Mol. Ecol. Resour. 10, 564–567. doi: 10.1111/j.1755-0998.2010.02847.x
Fossette S., Putman N. F., Lohmann K. J., Marsh R., and Hays G. C. (2012). A biologist’s guide to assessing ocean currents: a review. Mar. Ecol. Prog. Ser. 457, 285–301. doi: 10.3354/meps09581
Frey A., Dutton P. H., LaCasella E., LeRoux R., and Abreu-Grobois A. (2009). “Standardizing the mtDNA control region fragment for sea turtles: how long do sequences need to be,” in Proceedings of the Twenty-ninth Annual Symposium on Sea Turtle Biology and Conservation, vol. 79 . Eds. Belskis L., Frick M., Panagopoulou A., Rees A. F., and Williams K. (NOAA Tech Memorandum NMFS-SEFSC, Brisbane, QLD).
Frey A., LaCasella E., Jensen M. P., and Dutton P. H. (2025). Whole mitochondrial DNA sequencing improves resolution of population structure for Pacific green turtles (Chelonia mydas). Front. Mar. Sci. 12, 1581306. doi: 10.3389/fmars.2025.1581306
Fuentes M., McMichael E., Kot C. Y., Silver-Gorges I., Wallace B. P., Godley B. J., et al. (2023). Key issues in assessing threats to sea turtles: knowledge gaps and future directions. Endanger. Species Res. 160, 2671–2685. doi: 10.3354/esr01278
Gaos A. R., Martin S. L., and Jones T. T. (2020a). “Sea turtle tagging in the Mariana Islands Training and Testing (MITT) study area,” in Annual Report prepared for the U.S. Pacific Fleet Environmental Readiness Office, Pearl Harbor, Hawaii by NOAA Fisheries, Marine Turtle Biology and Assessment Group, Protected Species Division, Pacific Islands Fisheries Science Center, Honolulu, Hawaii under Interagency Agreement. DR-20-003 Honolulu, Hawaii, 47 p. doi: 10.25923/qq2e-e198
Gaos A. R., Martin S. L., and Jones T. T. (2020b). “Sea turtle tagging in the naval base Guam area,” in Annual Report prepared for the U.S. Naval Base Guam, Apra Harbor, Guam by NOAA Fisheries, the Marine Turtle Biology and Assessment Group, Protected Species Division, Pacific Islands Fisheries Science Center, Honolulu, Hawaii, under Interagency Agreement Honolulu, Hawaii, 24 p. doi: 10.25923/50bx-mk61
Gaube P., Barceló C., McGillicuddy D., Domingo A., Miller P., Giffoni B., et al. (2017). The use of mesoscale eddies by juvenile loggerhead sea turtles (caretta caretta) in the southwestern atlantic. PloS One 12, e0172839. doi: 10.1371/journal.pone.0172839
Gelman A. and Rubin D. B. (1992). Inference from iterative simulation using multiple sequences. Stat. Sci. 7, 457–511. doi: 10.1214/ss/1177011136
Godoy D. A., FitzSimmons N. N., and Boyle M. C. (2012). “A long way from home: First confirmed records of the east Pacific green turtle (Chelonia mydas Agassizii) in New Zealand,” in Proceedings of the Thirty-second Annual Symposium on Sea Turtle Biology and Conservation, Oaxaca, Mexico.
Hamabata T., Kamezaki N., and Hikida T. (2014). Genetic structure of green turtle (Chelonia mydas) peripheral populations nesting in the northwestern Pacific rookeries: evidence for northern refugia and postglacial colonization. Mar. Biol. 161, 495–507. doi: 10.1007/s00227-013-2352-z
Hamabata T., Matsuo A., Sato M. P., Kondo S., Kameda K., Kawazu I., et al. (2020). Natal origin identification of green turtles in the North Pacific by genome-wide population analysis with limited DNA samples. Front. Mar. Sci. 7. doi: 10.3389/fmars.2020.00658
Hamabata T., Nishizawa H., Kawazu I., Kameda K., Kamezaki N., and Hikida T. (2018). Stock composition of green turtles Chelonia mydas foraging in the Ryukyu Archipelago differs with size class. Mar. Ecol. Prog. Ser. 600, 151–163. doi: 10.3354/meps12657
Hamann M., Godfrey M. H., Seminoff J. A., Arthur K. E., Barata P. C. R., Bjorndal K. A., et al. (2010). Global research priorities for sea turtles: informing management and conservation in the 21st century. Endanger. Species Res. 11, 245–269. doi: 10.3354/esr00279
Hays G. C. (2017). Ocean currents and marine life. Curr. Biol. 27, PR470–PR473. doi: 10.1016/j.cub.2017.01.044
Horne J. B., Roden S. E., LaCasella E. L., Frey A., Martin S. L., Jones T. T., et al. (2023). Origins of green turtle fishery bycatch in the central Pacific revealed by mixed genetic markers. Front. Mar. Sci. 10. doi: 10.3389/fmars.2023.1112842
Jensen M. P., Bell I. P., Limpus C. J., Hamann M., Ambar S., Whap T., et al. (2016). Spatial and temporal genetic variation among size classes of green turtles (Chelonia mydas) provides information on oceanic dispersal and population dynamics. Mar. Ecol. Prog. Ser. 543, 241–256. doi: 10.3354/meps11521
Jensen M. P., Dalleau M., Gaspar P., Lalire M., Jean C., Ciccione S., et al. (2020). Seascape genetics and the spatial ecology of juvenile green turtles. Genes 11, 1–24. Available at: www.mdpi.com/2073-4425/11/3/278 (Accessed May 5, 2025)).
Jensen M. P., FitzSimmons N. N., Bourjea J., Hamabata T., Reece J., and Dutton P. H. (2019). The evolutionary history and global phylogeography of the green turtle (Chelonia mydas). J. Biogeogr. 46, 860–870. doi: 10.1111/jbi.13483
Jensen M. P., FitzSimmons N. N., Dutton P. H., and Michael P. (2013a). “Molecular genetics of sea turtles,” in The Biology of Sea Turtles, vol. 3 . Eds. Wyneken J., Lohmann K. J., and Musick J. A. (m: CRC Press), 135–161.
Jensen M. P., Limpus C. J., Whiting S., Guinea M., Prince R., Dethmers K., et al. (2013b). Defining olive ridley turtle Lepidochelys olivacea management units in Australia and assessing the potential impact of mortality in ghost nets. Endanger. Species Res. 21, 241–253. doi: 10.3354/esr00521
Jones K., Jensen M., Burgess G., Leonhardt J., van Herwerden L., Hazel J., et al. (2018). Closing the gap: mixed stock analysis of three foraging populations of green turtles (Chelonia mydas) on the Great Barrier Reef. PeerJ 6, e5651. doi: 10.7717/peerj.5651
Kearse M., Moir R., Wilson A., Stones-Havas S., Cheung M., Sturrock S., et al. (2012). Geneious basic: an integrated and extendable desktop software platform for the organization and analysis of sequence data. Bioinformatics 28, 1647–1649. doi: 10.1093/bioinformatics/bts199
Kolinski S. P., Cruce J., Parker D. M., Balazs G. H., and Clarke R. (2014). Migrations and conservation implications of post-nesting green turtles from Gielop Island, Ulithi Atoll, Federated States of Micronesia. Micronesica 2014-04, 1–9. Available at: http://www.uogedu.siteprotect.net/up/micronesica/2014 (Accessed May 5, 2025)).
Levasseur K. E., Stapleton S. P., Fuller M. C., and Quattro J. M. (2019). Exceptionally high natal homing precision in hawksbill sea turtles to insular rookeries of the Caribbean. Mar. Ecol. Prog. Ser. 620, 155–171. doi: 10.3354/meps12957
Li M., Zhang T., Liu Y., Li Y., and Lin L. (2022). Revisiting the genetic diversity and population structure of the endangered Green Sea Turtle (Chelonia mydas) breeding populations in the Xisha (Paracel) Islands, South China Sea. PeerJ 11, e15115. doi: 10.12074/202212.00172V1
Limpus C. J. (1992). Establishment of a marine turtle conservation program in Queensland, Australia. Mar. Turtle Newsl. 59, 11–14.
Limpus C. J., Miller J. D., Parmenter C. J., Reimer D., McLachlan N., and Webb R. (1992). Migration of green (Chelonia mydas) and loggerhead (Caretta caretta) turtles to and from eastern Australian rookeries. Wildl. Res. 19, 347–358. doi: 10.1071/WR9920347
Luschi P., Hays G. C., and Papi F. (2003). A review of long-distance movements by marine turtles, and the possible role of ocean currents. Oikos 103, 293–302. doi: 10.1034/j.1600-0706.2003.12123.x
Maison K. A., Kelly I. K., and Frutchey K. P. (2010). Green turtle nesting sites and sea turtle legislation throughout Oceania. Available online at: https://repository.library.noaa.gov/view/noaa/3961/noaa_3961_DS1.pdf (Accessed September 1, 2022).
Maniatis T., Fritsch E., and Sambrook J. (1982). In Molecular Cloning: A Laboratory Manual (Laurel Hollow, NY: Cold Spring Harbor Laboratory Press).
Mansfield K. L., Wyneken J., Porter W. P., and Luo J. (2014). First satellite tracks of neonate sea turtles redefine the ‘lost years’ oceanic niche. Proc. R. Soc London B 281, 20133039. doi: 10.1098/rspb.2013.3039
Martin S. L. and Jones T. T. (2017). “Sea turtle tagging in the Mariana Islands Training and Testing (MITT) study area, 15 December 2016,” in Annual Report prepared for the U.S. Navy by the Marine Turtle Biology and Assessment Group, Protected Species Division (Pacific Islands Fisheries Science Center, Honolulu, Hawaii).
Martin S. L., Jones T. T., and Gaos A. R. (2018). “Sea turtle tagging in the Mariana Islands Training and Testing (MITT) study area, 31 January 2018,” in Annual Report prepared for the U.S. Navy by the Marine Turtle Biology and Assessment Group, Protected Species Division (Pacific Islands Fisheries Science Center, Honolulu, Hawaii).
Monzón-Argüello C., Lopez-Jurado L. F., Rico C., Marco A., Lopez P., Hays G. C., et al. (2010). Evidence from genetic and Lagrangian drifter data for transatlantic transport of small juvenile green turtles. J. Biogeogr. 37, 1752–1766. doi: 10.1111/j.1365-2699.2010.02326.x
Moritz C. (1994). Defining “Evolutionarily significant units. Conserv. Trends Ecol. Evol. 9, 373–375. doi: 10.1016/0169-5347(94)90057-4
Murakawa S. K., Gaos A. R., Johnson D. S., Peck B., MacDonald M., Sachs E., et al. (2024). Abundance, production, and migrations of nesting green turtles at Rose Atoll, American Samoa, a regionally important rookery in the Central South Pacific Ocean. Front. Mar. Sci. 11. doi: 10.3389/fmars.2024.1403240
Musick J. A. and Limpus C. J. (1997). “Habitat utilization and migration in juvenile sea turtles,” in The biology of sea turtles. Eds. Lutz P. L. and Musick J. A. (CRC Press), 137–163.
Ng C. K. Y., Ishihara T., Hamabata T., Nishizawa H., Liu M., Song J. H., et al. (2024). Overview of the population genetics and connectivity of sea turtles in the East Asia Region and their conservation implications. Front. Mar. Sci. 11. doi: 10.3389/fmars.2024.1325849
Nishizawa H., Joseph J., Chong Y. K., Syed Kadir S. A., Isnain I., Ganyai T. A., et al. (2018). Comparison of the rookery connectivity and migratory connectivity: insight into movement and colonization of the green turtle (Chelonia mydas) in Pacific–Southeast Asia. Mar. Biol. 165, 77. doi: 10.1007/s00227-018-3328-9
Nishizawa H., Naito Y., Suganuma H., Abe O., Okuyama J., Hirate K., et al. (2013). Composition of green turtle feeding aggregations along the Japanese archipelago: implications for changes in composition with current flow. Mar. Biol. doi: 10.1007/s00227-013-2261-1
Nishizawa H., Narazaki T., Fukuoka T., Sato K., Hamabata T., Kinoshita M., et al. (2014). Juvenile green turtles on the northern edge of their range: mtDNA evidence of long-distance westward dispersals in the northern Pacific Ocean. Endanger. Species Res. 24, 171–179. doi: 10.3354/esr00592
Pella J. and Masuda M. (2001). Bayesian methods for analysis of stock mixtures from genetic characters. Fish. Bull. 99, 151–167.
Phillips K., Putman N., and Mansfield K. (2025). New insights on sea turtle behavior during the ‘lost years’. Proc. R. Soc B Biol. Sci. 292. doi: 10.1098/rspb.2024.2367
Pilcher N. J. (2010). Population structure and growth of immature green turtles at Mantanani, Sabah, Malaysia. J. Herpetol. 44, 168–171. doi: 10.1670/08-115.1
Piovano S., Batibasaga A., Ciriyawa A., LaCasella E. L., and Dutton P. H. (2019). Mixed stock analysis of juvenile green turtles aggregating at two foraging grounds in Fiji reveals major contribution from the American Samoa Management Unit. Sci. Rep. 9, 3150. doi: 10.1038/s41598-019-39475-w
Putman N. and Mansfield K. (2015). Direct evidence of swimming demonstrates active dispersal in the sea turtle “lost years. Curr. Biol. 25, 1221–1227. doi: 10.1016/j.cub.2015.03.014
Putman N. F. and Naro-Maciel E. (2013). Finding the ‘lost years’ in green turtles: insights from ocean circulation models and genetic analysis. Proc. R. Soc B. 280, 1768. doi: 10.1098/rspb.2013.1468
Putman N. F., Verley P., Shay T. J., and Lohmann K. J. (2012). Simulating transoceanic migrations of young loggerhead sea turtles: merging magnetic navigation behavior with an ocean circulation model. J. Exp. Biol. 215, 1863–1870. doi: 10.1242/jeb.067587
Raymond M. and Rousset F. (1995). An exact test for population differentiation. Evol. 49, 1280–1283. Available at: https://www.jstor.org/stable/2410454 (Accessed May 5, 2025).
Read T. C., FitzSimmons N. N., Wantiez L., Jensen M. P., Keller F., Chateau O., et al. (2015). Mixed stock analysis of a resident green turtle, Chelonia mydas, population in New Caledonia links rookeries in the South Pacific. Wildl. Res. 42, 488–499. doi: 10.1071/WR15064
Roden S. E., Horne J. B., Jensen M. P., FitzSimmons N. N., Balazs G. H., Farman R., et al. (2023). Population structure of Pacific green turtles: a new perspective from microsatellite DNA variation. Front. Mar. Sci. 10. doi: 10.3389/fmars.2023.1116941
Seminoff J. A., Allen C. D., Balazs G. H., Dutton P. H., Eguchi T., Haas H. L., et al. (2015). Status review of the green turtle (Chelonia mydas) under the U.S. Endangered Species Act. NOAA Technical Memorandum, NOAA-NMFS-SWFSC-539. 571p. Available online at: https://repository.library.noaa.gov/view/noaa/4922/noaa_4922_DS1.pdf (Accessed May 5, 2025).
Shamblin B. M., Bjorndal K. A., Bolten A. B., Hillis-Starr Z. M., Lundgren I., Naro-Maciel E., et al. (2012). Mitogenomic sequences better resolve stock structure of southern Greater Caribbean green turtle rookeries. Mol. Ecol. 21, 2330–2340. doi: 10.1111/j.1365-294X.2012.05530.x
Song J., Lin B., Jia Y., Dutton P. H., Kang B., Balazs G. H., et al. (2022). New management unit for conservation of the endangered green turtle Chelonia mydas at the Xisha (Paracel) Islands, South China Sea. Endanger. Species Res. 47, 145–154. doi: 10.3354/esr01172
Stewart K. R., LaCasella E. L., Roden S. E., Jensen M. P., Stokes L. W., Epperly S. P., et al. (2016). Nesting population origins of leatherback turtles caught as bycatch in the U.S. pelagic longline fishery. Ecosphere 7 (3), pg 1–18, e01272. doi: 10.1002/ecs2.1272
Summers T. M., Jones T. T., Martin S. L., Hapdei J. R., Ruak J. K., and Lepczyk C. A. (2017). Demography of marine turtles in the nearshore environments of the Northern Mariana Islands. Pac. Sci. 71, 269–286. doi: 10.2984/71.3.3
Summers T. M., Martin S. L., Hapdei J. R., Ruak J. K., and Jones T. T. (2018). Endangered green turtles (Chelonia mydas) of the Northern Mariana Islands: Nesting ecology, poaching, and climate concerns. Front. Mar. Sci. 4. doi: 10.3389/fmars.2017.00428
van der Zee J. P., Christianen M. J. A., Nava M., Velez-Zuazo X., Hao W., Bérubé M., et al. (2019). Population recovery changes population composition at a major southern Caribbean juvenile developmental habitat for the green turtle, Chelonia mydas. Sci. Rep. 9, 1–11. doi: 10.1038/s41598-019-50753-5
Wallace B. P., Posnik Z. A., Hurley B. J., DiMatteo A. D., Bandimere A., Rodriguez I., et al. (2023). Marine turtle regional management units 2.0: an updated framework for conservation and research of wide-ranging megafauna species. Endanger. Species Res. 52, 209–223. doi: 10.3354/esr01243
Webster E. G., Hamann M., Shimada T., Limpus C., and Duce S. (2022). Space-use patterns of green turtles in industrial coastal foraging habitat: Challenges and opportunities for informing management with a large satellite tracking dataset. Aquat. Conserv. 32, 1041–1056. doi: 10.1002/aqc.3813
Keywords: sea turtles, ocean currents, genetic diversity, mixed stock analysis, conservation, marine ecosystems
Citation: Jensen MP, LaCasella EL, Kobayashi DR, Frey A, Summers TM, Hapdei JR, Balazs GH, Murakawa SKK, Jones TT, Martin SL, Gaos AR and Dutton PH (2025) Expanding the boundaries: regional connectivity in green turtle (Chelonia mydas) populations across Micronesia. Front. Mar. Sci. 12:1558792. doi: 10.3389/fmars.2025.1558792
Received: 11 January 2025; Accepted: 28 April 2025;
Published: 30 May 2025.
Edited by:
Lyne Morissette, M – Expertise Marine, CanadaReviewed by:
Eduardo Ramirez-Romero, University of Malaga, SpainSandra Ludwig, Federal University of Minas Gerais, Brazil
Copyright © 2025 Jensen, LaCasella, Kobayashi, Frey, Summers, Hapdei, Balazs, Murakawa, Jones, Martin, Gaos and Dutton. This is an open-access article distributed under the terms of the Creative Commons Attribution License (CC BY). The use, distribution or reproduction in other forums is permitted, provided the original author(s) and the copyright owner(s) are credited and that the original publication in this journal is cited, in accordance with accepted academic practice. No use, distribution or reproduction is permitted which does not comply with these terms.
*Correspondence: Peter H. Dutton, cGV0ZXIuZHV0dG9uQG5vYWEuZ292