 Kelsey Swieca
 Su Sponaugle
 Moritz S. Schmid
 Jami Ivory2†
 Robert K. Cowen
- 1Department of Integrative Biology, Oregon State University, Corvallis, OR, United States
- 2Hatfield Marine Science Center, Oregon State University, Newport, OR, United States
Introduction: Globally, anchovy and sardine typically display asynchronous population fluctuations with anchovy dominating during cool periods and sardine dominating during warm periods. However, this anchovy-sardine cold-warm paradigm has recently broken down in the California Current, suggesting that recruitment may not be a simple product of large-scale physical drivers. Instead, consideration of larval fish trophodynamics together with local oceanography is likely necessary to mechanistically relate survival and recruitment to the physical environment.
Methods: We examined otolith-derived metrics of northern anchovy (Engraulis mordax) growth in the context of local oceanography and anchovy in situ prey and zooplankton predators in the northern California Current (NCC).
Results: Anchovy growth was spatially variable and the regions that conferred heighted growth differed with regard to the cross-shelf extent of upwelled waters. When upwelling was restricted to the nearshore environment, anchovy larvae grew significantly faster inshore than offshore. Conversely, when the upwelling front moved farther offshore following sustained upwelling, offshore anchovy larvae grew significantly faster than inshore larvae. Modelling individual anchovy growth revealed that growth was affected by ambient copepod prey availability and gelatinous zooplankton predation pressure, with growth peaking at intermediate prey availability and the highest abundance of predators. Fast growth under high predation pressure may be indicative of the selective loss of slow growing larvae. Notably, larval anchovy abundances were high offshore but diminished immediately inshore of the upwelling front regardless of its cross-shelf position. This suggests that the upwelling front may act as a shoreward boundary for anchovy larvae, affecting their access to the highly nutritious prey base typical of the Oregon continental shelf waters in summer.
Discussion: Variation in larval anchovy growth with local oceanographic conditions and fine-scale distributions of prey and predators provides a mechanistic hypothesis of food-web dynamics which will enhance our ability to predict the response of forage fishes to ecosystem variability.
1 Introduction
Most marine fishes experience high rates of mortality during their early life history stages with far reaching consequences for adult population dynamics. Within a few weeks of hatching, relatively small changes in larval growth and mortality rates can lead to orders of magnitude variability in year-class strength (Houde, 1987, 2008; Leggett and Deblois, 1994). As such, identifying the factors influencing larval survival is a core goal of fisheries oceanography.
Efforts to understand and predict year-class strength have been particularly robust for forage fishes, as these organisms play an important ecological role in coastal ecosystems (Cury et al., 2000; Koehn et al., 2016). As in other upwelling regions, anchovy (Engraulis mordax; northern anchovy) and sardine (Sardinops sagax; Pacific sardine) dominate the forage fish community in the California Current where their populations are characterized by dramatic boom and bust cycles (Baumgartner et al., 1992; Brodeur et al., 2005; Emmett et al., 2005). It is generally asserted that anchovy dominate during cool, productive periods while sardine dominate during warm periods (Lluch-Belda et al., 1989; Schwartzlose et al., 1999; Chavez et al., 2003). Yet, this theoretical anchovy-sardine cold-warm relationship has not held up under recent novel conditions in the California Current (Muhling et al., 2020). Contrary to expectations, northern anchovy abundance and larval survival reached record highs during and following the 2014–2016 severe marine heat wave, when sea surface temperatures were up to 6.2°C above average and primary productivity was anomalously low in many regions (Gentemann et al., 2017; Kahru et al., 2018; Thompson et al., 2019). This suggests that recruitment to the adult population is probably not a simple reflection of large-scale physical drivers as previously postulated. Instead, consideration of larval fish trophodynamics together with local and regional oceanography is likely necessary to mechanistically relate northern anchovy survival and recruitment to the physical environment. This notion is supported by Rykaczewski and Checkley (2008), who found that the type of localized upwelling (coastal versus curl-driven) impacts the planktonic prey base and differentially favors the subsequent recruitment of one forage species over another (anchovy versus sardine).
Growth and survival of pelagic larval fishes is determined by their ability to find food and avoid predation, which is tightly linked to the prevailing oceanographic conditions (Lasker, 1975; Bailey and Houde, 1989; Pepin et al., 2015). Wind-driven upwelling has been implicated as a prominent oceanographic process affecting northern anchovy success in the California Current (Lasker, 1975, 1978, 1981; Rykaczewski and Checkley, 2008; Takahashi et al., 2012). This type of upwelling occurs when equatorward winds drive the surface layer offshore allowing cool, nutrient-rich water to rise into the coastal euphotic zone. Coastal upwelling can influence the survival of the early life history stages of northern anchovy in two primary ways: (1) by dictating the quantity and quality of prey available in the water column and (2) by affecting the spatial distributions and encounter rates of larvae with their prey and potential predators.
Empirical relationships between northern anchovy success and upwelling intensity are thought to be dome-shaped, with optimal conditions for larval feeding occurring at moderate upwelling intensity. Larvae may be production limited when upwelling is weak, but too much upwelling may disrupt larval food aggregations necessary for sufficient feeding (‘Stable Ocean Hypothesis’: Lasker, 1978, 1981, ‘Optimal Environmental Window’: Cury and Roy, 1989; Roy et al., 1992). Additionally, a lack of upwelling-favorable winds reduces the nutritional quality of northern anchovy’s prey-field resulting in slower larval growth (Takahashi et al., 2012). Because fast larval growth and large size-at-age are thought to increase survival and year-class strength of most fishes (Anderson, 1988; Miller et al., 1988; Hare and Cowen, 1997), the influence of upwelling on prey availability and composition is likely an important factor regulating northern anchovy populations.
Beyond its effects on larval fish prey fields, upwelling also influences transport of larvae. During periods of sustained upwelling-favorable winds, coastal larvae inhabiting surface waters can be advected into more oligotrophic conditions offshore. Upwelling induced offshore transport poses a risk for larval feeding as well as life cycle closure, especially for species that recruit to nearshore habitats (Parrish et al., 1981). Given the impact of upwelling on larval success, variability in the spatial extent of upwelled waters may contribute to complex patterns of northern anchovy feeding, growth, and survival. Presently, however, little is known about the degree to which anchovy vital rates vary across space and the potential effect this may have on recruitment variability.
During summer in the northern California Current (NCC), north winds drive coastal upwelling and the establishment of an upwelling front where lower density (warmer, fresher) offshore waters meet higher density (colder, saltier) upwelled waters. Local upwelling intensity affects the strength and position of the upwelling front. As a result, the cross-shelf extent of upwelling influenced waters is highly variable in space and time (Castelao et al., 2005; Sato et al., 2018). For example, topographic features along the Oregon coast deflect the upwelling jet offshore, broadening the region influenced by upwelling-induced production (Checkley and Barth, 2009). Likewise, the front is pushed farther offshore following sustained periods of upwelling-favorable winds along the coast, thereby widening the region of cold and productive upwelled waters. A narrow band of upwelled waters is restricted nearshore at the initiation of upwelling or during weakly favorable winds (Castelao et al., 2005).
Either due to passive transport or physiological temperature limitations, the location of the upwelling front and extent of upwelled waters affects the cross-shelf distribution of larval and juvenile fishes, including northern anchovy (Miller and Shanks, 2004; Auth, 2008; Sato et al., 2018). While the hydrodynamics of the upwelling front can help retain coastal taxa nearshore (Bjorkstedt et al., 2002), the front can also simultaneously act as a shoreward boundary to offshore species (Sato et al., 2018). Off central Oregon, larval northern anchovy are typically concentrated in warm, low salinity offshore water originating from the Columbia River Plume (Richardson, 1973; Auth and Brodeur, 2006). However, when upwelling is weak, larvae tend to be evenly distributed between coastal and offshore regions and can even be concentrated close to shore during periods of downwelling (Auth, 2008). Variability in the cross-shelf distribution of anchovy under different upwelling scenarios likely affects their access to the highly abundant and lipid-rich prey base characteristic of shelf waters in summer in this system (Morgan et al., 2003), with implications for larval feeding and survival.
Northern anchovy are broadly distributed from southern Canada to Baja Mexico, with three distinct subpopulations throughout their range (Baxter, 1966; Vrooman et al., 1981). While the central subpopulation is quite well studied, we focus on the northern subpopulation which ranges from northern California to British Columbia and is thought to spawn primarily in the summer upwelling season (May – Aug) near the Oregon-Washington border where it also supports a small bait fishery (Richardson, 1981; Litz et al., 2008; Parnel et al., 2008). Anchovy hatch from eggs quickly after spawning and larvae are generally surface oriented and primarily found offshore in Columbia River Plume-influenced waters with sea surface temperatures ranging from 13-17.4°C (Baxter, 1966; Richardson, 1981; Auth and Brodeur, 2006). Larvae are phyto- and zooplanktivorous, becoming more zooplanktivorous as they grow (Baxter, 1966; Arthur, 1976). Like other anchovy species (Morote et al., 2010), northern anchovy of ~7 mm in standard length (SL) feed primarily on adult copepods and copepodites (Berner, 1959; Arthur, 1976).
We examined spatial variability in northern anchovy growth in the context of local oceanography and their in situ prey and zooplankton predators in the NCC. Specifically, we coupled otolith-based metrics of larval growth and in situ plankton imagery to elucidate how northern anchovy, their prey, and their predators are affected by the intensity and cross-shelf extent of local upwelling. Our overarching long-term goal is to use these oceanographic and trophodynamic relationships to more accurately predict the future responses of forage fish to ecosystem variability.
2 Materials and methods
2.1 Field sampling
To best relate larval northern anchovy (Engraulis mordax) growth to the fine-scale distributions of their zooplankton prey and potential predators, we coupled depth-discrete net sampling and fine-scale in situ plankton imaging. Sampling was conducted during two research cruises off the coast of Oregon in the summers of 2018 (Jul 3-11) and 2019 (Jul 16-25). During each cruise, northern anchovy larvae were collected at five stations along the Newport Hydrographic Line, which is just south of the spawning location of the northern subpopulation of northern anchovy (Figure 1; Richardson, 1981). Station locations were chosen to sample shelf (n=2), shelf-break (n=1), and offshore (n=2) environments. We sampled each station twice per cruise and continuously towed a plankton imager along the same cross-shelf transect within 24 h of each biological sample collection. All sampling occurred during daylight hours.
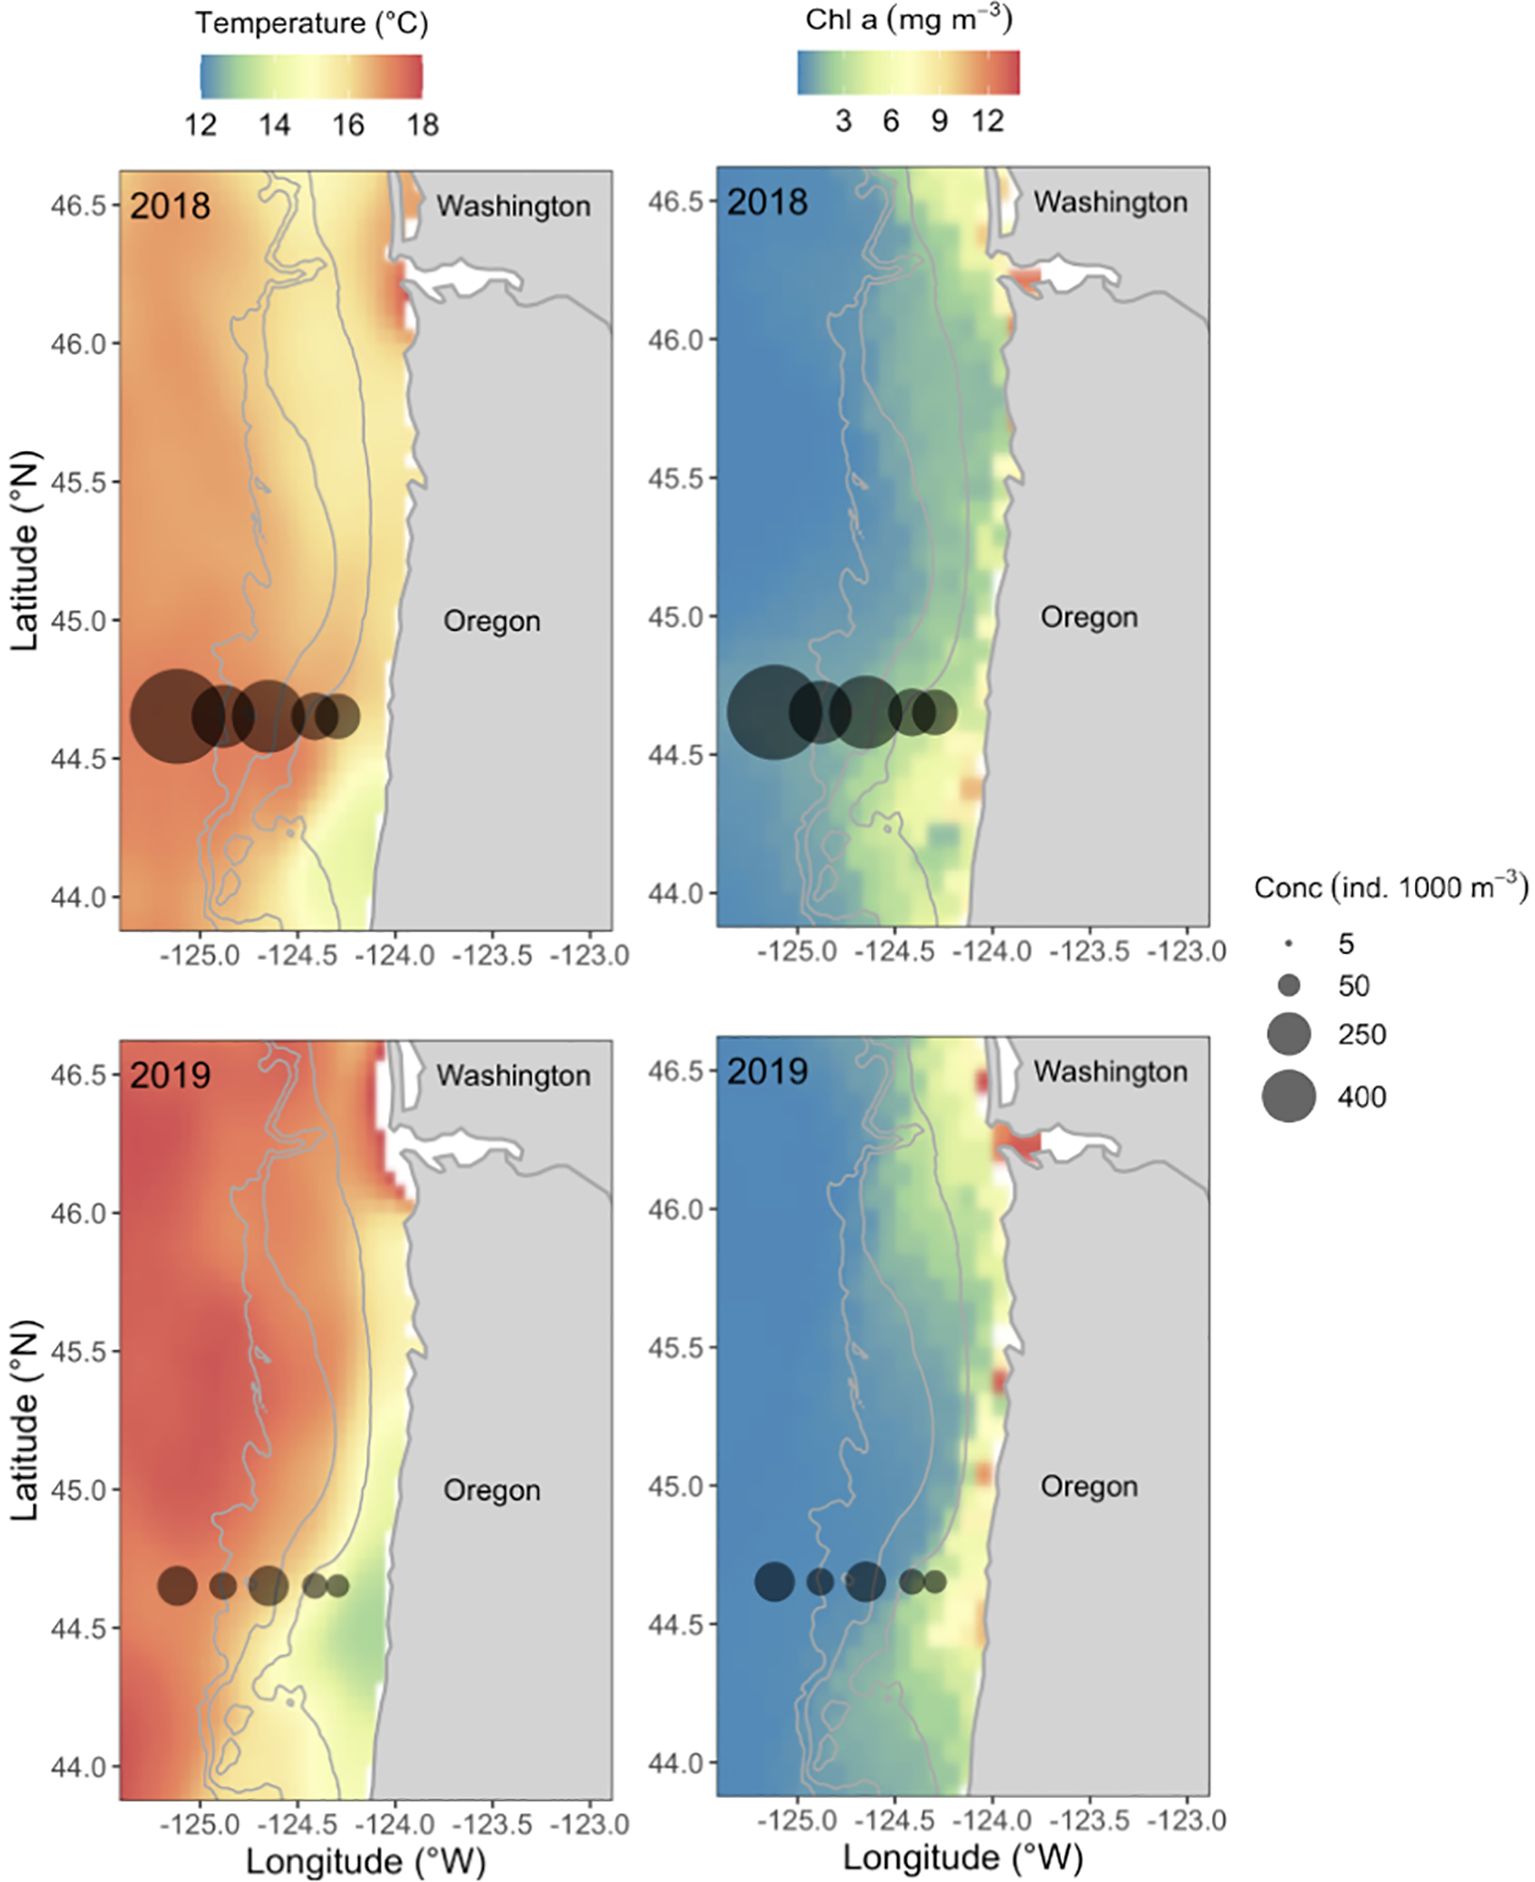
Figure 1. Mean concentration of northern anchovy (Engraulis mordax) larvae (individuals 1000 m -3) in the top 50 m of the water column sampled along the Newport Hydrographic Line during the summers of 2018 (Jul 3-11) and 2019 (Jul 16-25). Data are overlaid on satellite derived sea surface temperature (left) and chlorophyll (chl) a concentration (right). Contour lines represent the 100-, 200-, and 500-m isobaths. The mouth of the Columbia River at the border between Oregon and Washington is included to illustrate the geographical location of the sampling area.
Larval northern anchovy were collected at each station using a coupled Multiple Opening/Closing Net and Environmental Sensing System (MOCNESS; Guigand et al., 2005). The MOCNESS sampled discrete 25-m depth bins from the surface to depth (max 100 m) using paired nets (4 m2 and 1 m2) fit with 1-mm and 333-μm mesh, respectively. Larvae were sorted from both the 4 m2 (~845 m3 sample volume per net) and 1 m2 (~215 m3 sample volume per net) nets, which were designed for use in a larger study. The system included a flowmeter and conductivity, temperature, and depth sensors and was towed behind the ship at roughly 1 m s-1. Nets were rinsed, sieved, and samples preserved in 95% ethanol immediately following MOCNESS retrieval. Sample ethanol was changed at-sea within 48 h of collection and again within 60 d to ensure preservation of otoliths for microstructure analysis. In the laboratory, fish larvae were sorted, enumerated, and identified to the lowest possible taxonomic level and northern anchovy were separated out in individual vials for growth analysis. Larval northern anchovy concentrations (ind. 1000 m-3) were calculated by dividing counts from each net by the volume of water filtered through the net.
Three-dimensional prey and predator plankton distribution data were acquired using the In situ Ichthyoplankton Imaging System (ISIIS; Cowen and Guigand, 2008). ISIIS is a low turbulence, high-resolution in situ shadowgraph imager with a large sample volume (150–180 L s-1), a pixel resolution of 68 μm, and a large field of view (13 x 13 x 50 cm). This system captures organisms roughly ranging from 200 μm to 12 cm in length. These characteristics make it an ideal system to sample small plankters that have been shown to be key prey taxa for larval northern anchovy and fragile gelatinous zooplankton that can be important predators of larval fishes but are difficult to quantify with traditional net-based sampling techniques (McClatchie et al., 2012; Luo et al., 2014, 2018). ISIIS was towed in a tight undulating fashion from surface to 100 m depth, or within a few meters of the seafloor in shallower regions, allowing for fine-scale horizontal and vertical spatial analyses. Imagery and co-collected physical data from CTD (Sea-Bird SBE49 FastCAT), dissolved oxygen (Sea-Bird 43), fluorescence (Wetlabs FLRT), and photosynthetically active radiation (EPAR; Biospherical QCP-2300) sensors were transferred to ship-based computers via a fiber optic cable.
2.2 Physical data analysis
To understand how local oceanography influences larval anchovy we quantified the strength of upwelling immediately prior to sample collection and the cross-shelf location of the upwelling front during each sampling event. We use the cumulative daily Coastal Upwelling Transport Index (CUTI; https://mjacox.com/upwelling-indices/) 10 d and 30 d prior to sampling as a measure of upwelling strength. The first time period was selected to account for the lag between physical wind-stress and phyto- and zooplankton abundances. Off Oregon, this lag is thought to be approximately 7 d and 13–16 d, respectively (Spitz and Allen, 2005). The latter time period was selected to represent the upwelling experienced by larvae throughout the lifetime of our fish, as our oldest fish was 28 d old.
Geopotential anomaly fields (ΔΦ; dynamic height multiplied by the acceleration of gravity) can be used to determine the location of the upwelling front in the NCC (Barth et al., 2000). ISIIS physical data were kriged onto a grid equal to the length of each transect at 2-m vertical and 500-m horizontal resolution. Mean temperature, salinity, and pressure data per grid cell were used to estimate the geopotential anomaly at 10 m relative to 80 m depth for each ISIIS transect using the R software (v 4.0.4) package ‘gsw’ (Kelley and Richards, 2021). As in previous studies in this region (Sato et al., 2018), we defined the upwelling front as ΔΦ = 1.8 m2 s-2.
2.3 Growth analysis
We used otolith microstructure analysis to examine the spatio-temporal age and daily growth patterns of larval northern anchovy. To reduce variability that might be associated with depth and because anchovy are generally surface oriented, we restricted our growth analysis to MOCNESS larvae collected in the top 50 m of the water column. A random subset of those larvae (n = 734) were measured for standard length (SL) to the nearest 0.01 mm using a Leica MZ16 dissecting microscope with a QImaging camera and Image Pro Premier 9.1 software. Due to low sample sizes at some stations, particularly in 2019, stations were pooled into inshore (n=2), shelf-break (n=1), and offshore (n=2) locations (Figure 1) to analyze cross-shelf variability in otolith-based traits. Larvae from each year and cross-shelf location were randomly selected for otolith analysis (n = 270). Daily otolith growth increments have been validated in northern anchovy and daily increment deposition begins near yolk-sac absorption (~4.2 mm SL; Brothers et al., 1976; Methot and Kramer, 1979). Because at least three increments are needed to estimate recent daily growth (by definition), larvae < 5.5 mm SL were excluded from otolith analysis (Supplementary Figure S1).
Sagittal otoliths were dissected and stored in immersion oil on a glass slide for approximately 1–3 h to ‘clear’ prior to reading. Prepared otoliths were read along the longest axis at 400x magnification using a Zeiss Axio compound microscope fit with a QImaging camera and Image Pro Premier 9.1 software. Each otolith was read twice by the same reader without access to any sampling data. If reads differed by >5%, the otolith was read a third time. If reads differed by ≤5%, one read was randomly chosen for analysis. Otoliths where all three reads differed by >5% would have been removed from analysis (n = 0; Sponaugle et al., 2009).
Daily growth increments were enumerated to provide an estimate of age. The period from hatching to the first daily ring deposition varies with temperature and ranges from 3 to 9 d post-hatch (dph; Methot and Kramer, 1979). In the NCC, larval northern anchovy typically occur in regions where sea surface temperatures are 13-16°C (Richardson, 1981). In this study, we collected northern anchovy at a mean water temperature of ~13.5°C. Thus, as in other studies in the region (Takahashi et al., 2012), the first daily otolith increment was assumed to have been deposited at 5 dph and final ages were calculated by adding 5 d to the total otolith increment count.
We used two metrics to analyze northern anchovy growth patterns: (1) mean daily growth (MDG) which is the average increment width of each day of life and (2) mean recent growth (MRG) which is the average increment width of each individual over the last three full days of life. We use the latter because it is unknown how long larvae have been associated with the environmental and prey/predator conditions measured at the time of collection.
Otolith increment widths increase with age (Baumann et al., 2003). To account for this, we detrended the last three increment widths for age by calculating a detrended growth index:
Where DGij is the detrended growth of individual i at age j, Gij is otolith-based growth (increment width) for individual i at age j, Gj is the mean otolith-based growth of all individuals at age j, and SD is the standard deviation of G. Detrending for age allows us to investigate the spatio-temporal variability in MRG of differently aged northern anchovy larvae (Robert et al., 2009; Sponaugle et al., 2010).
We compared MRG across years and cross-shelf locations using analysis of covariance (ANCOVA) with age as a covariate. If a significant interaction between age and year or location precluded the interpretation of ANCOVA results, fish were split roughly in half into young (<14 d) and old (≥14 d) age groups and a separate ANCOVA with age as a covariate was conducted for each group. When applicable, ANCOVAs were followed by a Tukey HSD post-hoc test. We also examined the relationship between northern anchovy standard length vs. age, otolith radius vs. age, and size-at-age residuals vs. radius at age residuals to test whether otolith deposition rates were consistent between years and cross-shelf locations.
2.4 Imagery analysis
To investigate the relationships between MRG and the distributions of northern anchovy and their potential prey and predators we coupled growth analyses with in situ imagery. ISIIS data were processed, trained, and tested for automated classification following Luo et al. (2018); Briseño-Avena et al. (2020); Schmid et al. (2020, 2023), and Swieca et al. (2020), with the full pipeline code open-sourced in Schmid et al. (2021). After image processing, corrected taxa concentration estimates were kriged onto a grid equal to the length of each transect at 2-m vertical and 500-m horizontal resolution.
Although species of Clupeiformes larvae cannot be quantitatively discerned by ISIIS due to their indistinct morphology, co-collected net samples can be used to determine the constituents of this imagery group. During net sampling, we collected two Clupeiformes species: northern anchovy (Engraulis mordax) and Pacific sardine (Sardinops sagax), with northern anchovy comprising 98.4% of the Clupeiformes catch. Larval Pacific sardine were entirely absent in 2018 and were rare (1.6% Clupeiformes catch) in 2019. Thus, for our purposes, Clupeiformes imagery data can reasonably be used to represent the fine-scale distribution of northern anchovy larvae.
Prey groups of interest were selected based on field studies of northern anchovy diet analysis in the literature. Protists and calanoid and cyclopoid copepods of various life stages are frequently found in the guts of northern anchovy larvae (Berner, 1959; Baxter, 1966; Arthur, 1976). As in other anchovy species, northern anchovy around 6.5–7 mm SL prey predominantly on copepodites and adult copepods (i.e., post-nauplii copepods; Arthur, 1976; Morote et al., 2010). Because the mean size of larvae used in our growth analysis was 8.9 mm SL, we quantified potential prey availability from the distributions of post-nauplii calanoid and cyclopoid copepods.
Although a large body of work emphasizes the importance of top-down predation on northern anchovy, zooplankton predation on larval fishes is rarely quantified as part of the suite of potential predators. This is likely due to the variety of potential zooplankton predators (Bailey and Houde, 1989) and the difficulty in sampling some taxa (i.e., gelatinous taxa) with net-based systems. Nonetheless, several studies suggest that larval fishes are important prey for chaetognaths, ctenophores, hydromedusae, and siphonophores (Alvarino, 1980, 1985; Purcell, 1985). Further, larval fishes have been anecdotally observed in the guts of chaetognaths and ctenophores on the Newport Hydrographic Line (Auth and Brodeur, 2006). While many other potential larval anchovy predator taxa exist (e.g., krill), these taxa were selected as the potential predator groups for our analysis based on the best information and data available in the NCC study area.
The mean concentration (ind. m-3) of larval northern anchovy and their potential prey and predators was calculated for every sampling station as the mean taxa concentration per 2-m depth bin from the station waypoint to 500 m seaward and within the top 50 m of the water column. Station values were summarized into their respective inshore, shelf-break, and offshore cross-shelf locations each year. Vertical distribution plots of mean taxa concentration per 2-m depth bin were constructed for all cross-shelf locations each year. Vertically integrated taxa concentrations were compared among cross-shelf locations each year using non-parametric Kruskal-Wallis tests followed by a Dunn post-hoc test, when applicable.
We also explicitly investigated the effect of local oceanography on northern anchovy by examining the distributions of anchovy and their potential zooplankton prey and predators relative to the upwelling front each year. For the length of each transect, vertically integrated taxa concentrations were binned into 5-km horizontal segments and the distance from each segment to the position of the upwelling front was calculated. Mean (± SE) segment concentrations were normalized to the maximum transect value and were centered on the position of the upwelling front such that negative distances denoted concentrations inshore of the upwelling front and positive distances offshore of the upwelling front. The data were non-parametric so Wilcoxon rank sum tests were used to determine if differences between taxa concentrations inshore and offshore of the upwelling front each year were significant. Then, every plankton imagery frame (13 x 13 x 50 cm) containing a northern anchovy larva (n = 1444) was extracted and the mean number of selected prey and predator taxa co-occurring within the anchovy frame was plotted along the length of the transect. Plots were constructed for each sampling year, with the location of the upwelling front noted, to provide an estimate of anchovy overlap with their prey and predators on scales relevant to trophic interactions.
2.5 Statistical modeling
We quantified the effect of local oceanography and potential prey availability and predation pressure on the recent larval growth of northern anchovy using generalized additive models (GAMs). In these models, the response variable was the individual mean recent growth (MRG; last three full days of life) of 270 northern anchovy and the covariates were in situ temperature (continuous) and concentrations of protists (continuous, log transformed), copepod post-nauplii (continuous, log transformed), and predators (continuous, log transformed). Additionally, an early growth parameter (mean increment width over the first third of each fish’s life) was incorporated to account for the fact that an individual’s recent growth is likely impacted by their growth history (i.e., fish that grow fast early in life are more likely to continue growing fast later in life; Dower et al., 2008; Robert et al., 2014; Pepin et al., 2015). We also address the possible effect of density dependence on recent growth by incorporating a larval density term (mean concentration of northern anchovy per net tow) in the model. Finally, we included a random effect (intercept) of net tow, as individuals from the same MOCNESS tow are more likely to have similar growth patterns, but model selection indicated that models without the random intercept performed better.
MOCNESS environmental data were used to calculate mean in situ temperature per MOCNESS net (25-m depth bin) associated with each fish collected. Mean concentrations of protists, copepod post-nauplii (calanoid copepods, cyclopoid copepods), and predators (chaetognaths, ctenophores) were the mean ISIIS concentrations corresponding to the station where fish were collected on each transect. Calanoid and cyclopoid copepods as well as chaetognaths and ctenophores were pooled due to collinearity.
After pooling, variance inflation factors (VIF) indicated that collinearity between covariates would not preclude the interpretation of model results (values ≤ 3.5; Zuur et al., 2010). We applied a smoothing function to each covariate, restricting the number of knots to 4 to avoid model overfitting. Then, we used a backward stepwise approach for model selection and compared full and reduced versions of the models with Akaike’s information criterion (AIC) and generalized cross validation (GCV). The model with the lowest AIC and GCV values was chosen as the best model if it was the reduced (simpler) version. However, if the model with the lowest AIC and GCV was the more complex model, it was only selected if it was significantly different (ANOVA, p< 0.05) from the reduced version. Model residuals were checked for deviations from normality, homogeneity of variance, and other abnormalities. All modeling analyses were conducted using the R software (v 4.0.4) package ‘mgcv’ (Wood, 2021).
3 Results
3.1 Environmental setting
The physical environment along the Newport Hydrographic Line varied between the two sampling years. In 2018, the month preceding sampling was marked by strong and persistent upwelling. Approximately 5 d prior to sampling, upwelling winds weakened and sample collection occurred during a brief relaxation period (Figure 2A). In contrast, in 2019 we sampled during the onset of active upwelling following nearly a month-long relaxation event (Figure 2B). Cumulative CUTI upwelling values 30 d and 10 d prior to sampling were 10.67 m3s-1 and 3.05 m3s-1 in 2018 and 5.90 m3s-1 and 3.77 m3s-1 in 2019, respectively. Interannual variability in upwelling strength resulted in a ~12 km difference in the cross-shelf position of the upwelling front (ΔΦ = 1.8 m2 s-2), with the front located just ~3 km shoreward of the shelf-break (200 m isobath) in 2018, and ~15 km shoreward of the shelf break in 2019.
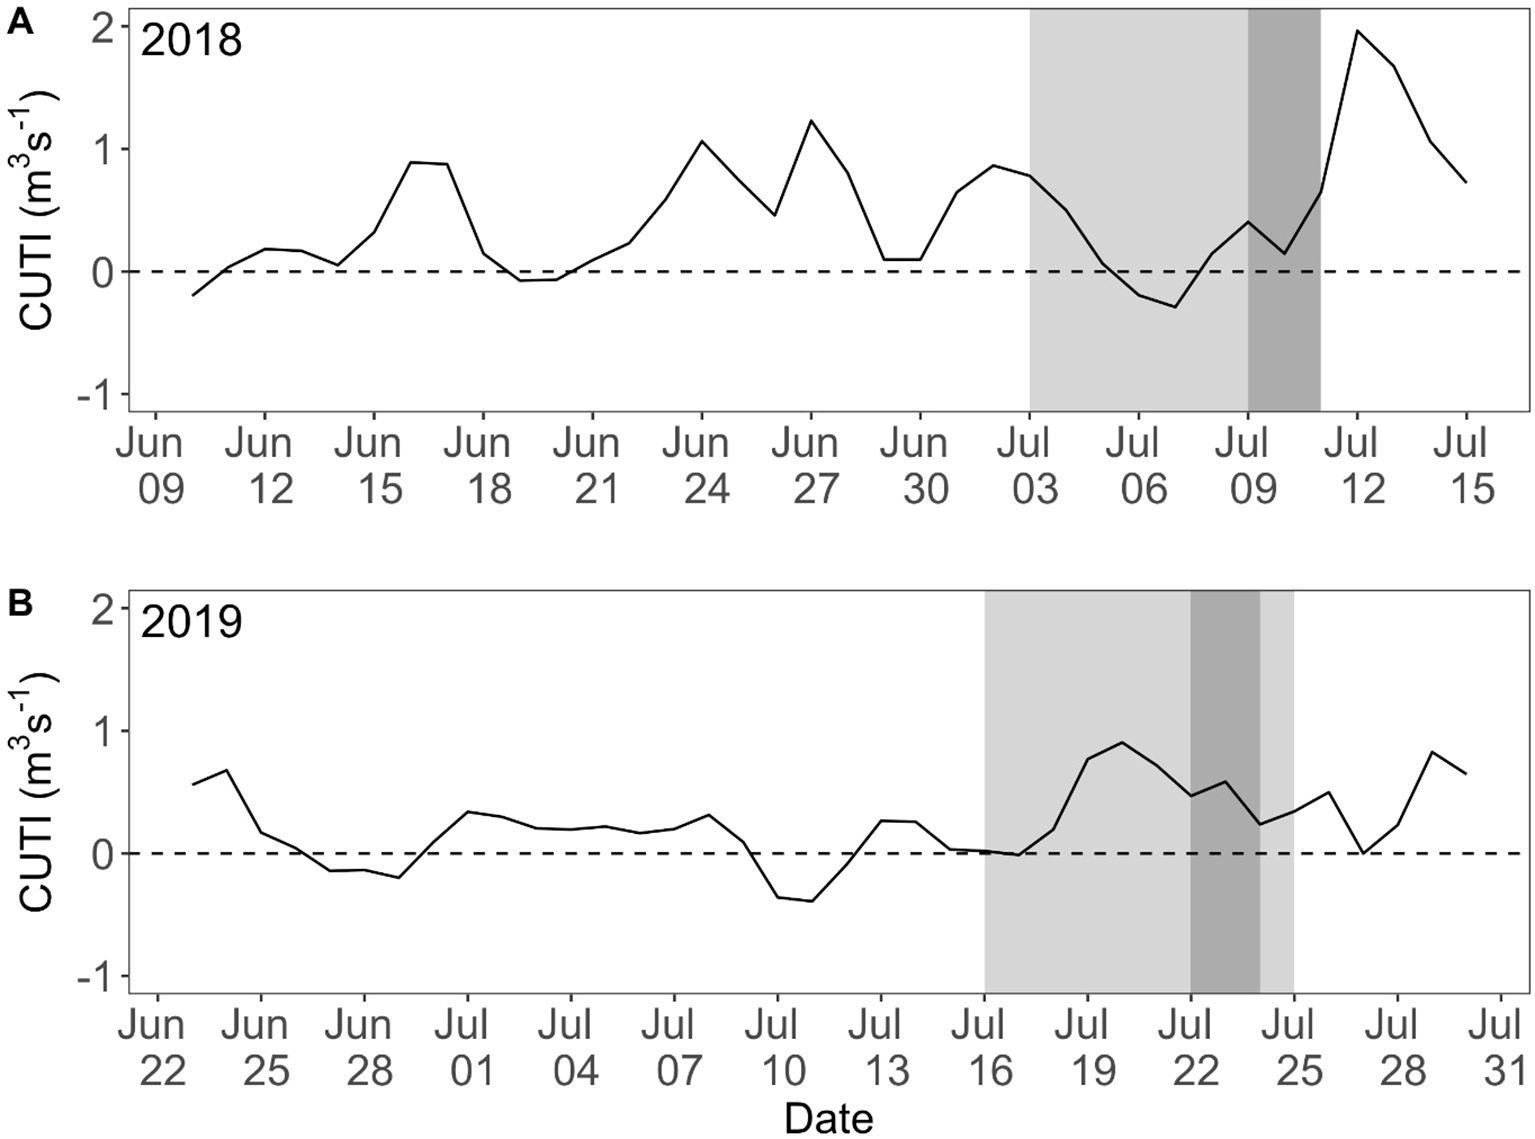
Figure 2. Daily Coastal Upwelling Transport Index (CUTI) for the Newport Hydrographic Line (45° N) prior to and during sampling in the summers of (A) 2018 and (B) 2019, with cruise dates highlighted in light gray and days northern anchovy (Engraulis mordax) were collected for otolith analysis in dark gray. Positive values signify upwelling, zero are neutral conditions, and negative values are downwelling.
Both in situ collected physical data and satellite derived surface maps show the effect of upwelling on the environment each year and align well with expectations based on the position of the upwelling front. Surface waters were generally cooler inshore and warmer offshore (Figure 1), but a cooler band of the upper most water column (~ 0–10 m) protruded farther across the shelf in 2018 compared to 2019 (Supplementary Figure S2). Similarly, high concentrations of chlorophyll-a were widely distributed in all cross-shelf environments in 2018, while high chlorophyll-a concentrations were restricted to only the nearshore in 2019 (Table 1, Figure 1). During this time, the concentration of chlorophyll-a nearshore was almost three times higher than at the shelf-break and was five times higher than offshore. Finally, the chlorophyll max was substantially shallower in 2018 than in 2019 and deeper offshore than inshore each year, ranging from 5.8-17.8 m in 2018 and 14.1-31.5 m in 2019 (Table 1).
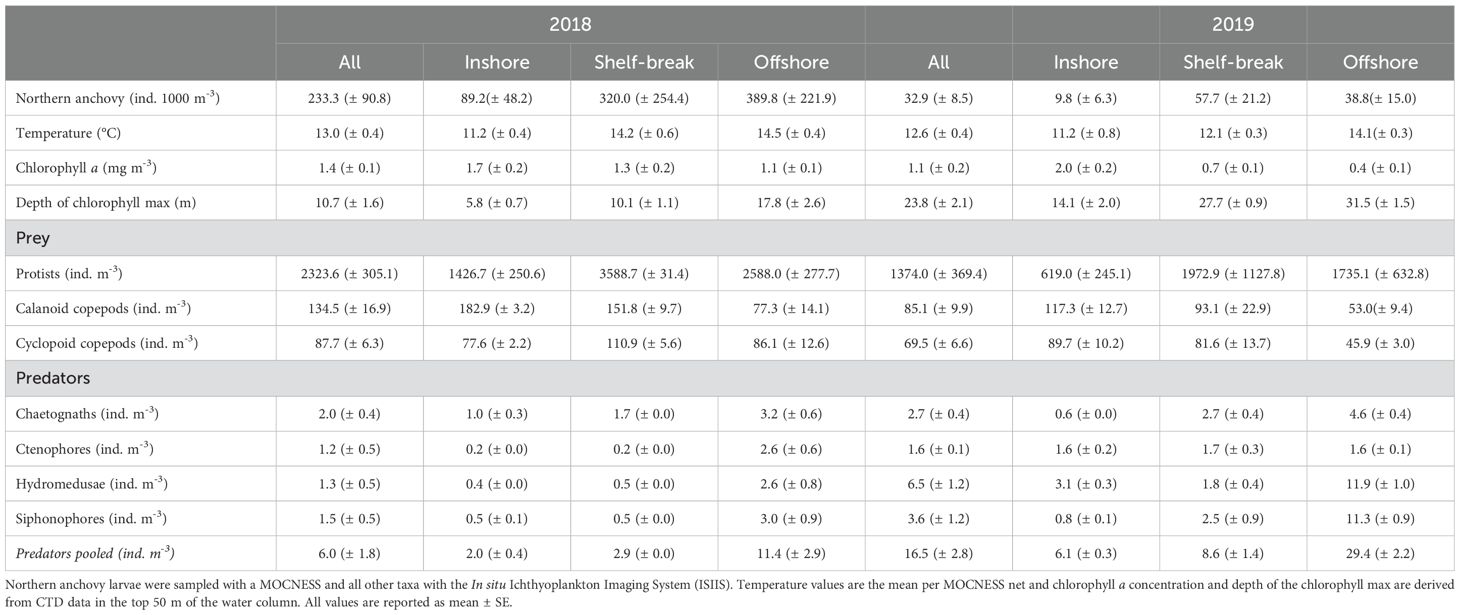
Table 1. Northern anchovy (Engraulis mordax) concentration, temperature, chlorophyll a concentration, depth of the chlorophyll max, and concentrations of environmental prey and potential predators at three cross-shelf locations along the Newport Hydrographic Line, Oregon, in the summers of 2018 and 2019.
3.2 Northern anchovy distributions
Northern anchovy was a dominate member of the ichthyoplankton assemblage during sampling (n = 1928), accounting for 37.4% of the total larval fish abundance in 2018 and 11.7% in 2019. Overall, the mean concentration of larval northern anchovy in the top 50 m of the water column was 75.3 (± 27.3) ind. 1000 m-3, ranging from 233.3 (± 90.8) ind. 1000 m-3 in 2018 to 32.9 (± 8.5) ind. 1000 m-3 in 2019 (Table 1). Concentrations were generally higher at the offshore (2018) and shelf-break (2019) locations compared to inshore each year (Table 1, Figure 1). Regardless of the cross-shelf position of the upwelling front, larval northern anchovy were significantly more abundant offshore than inshore of the front (Wilcoxon rank sum test: p< 0.001 both years), with abundances steadily declining immediately shoreward of the frontal boundary (Figure 3). Finally, northern anchovy larvae were heavily concentrated in the top 50 m of the water column. MOCNESS catches below this depth were negligible (n = 20 individuals; data not presented).
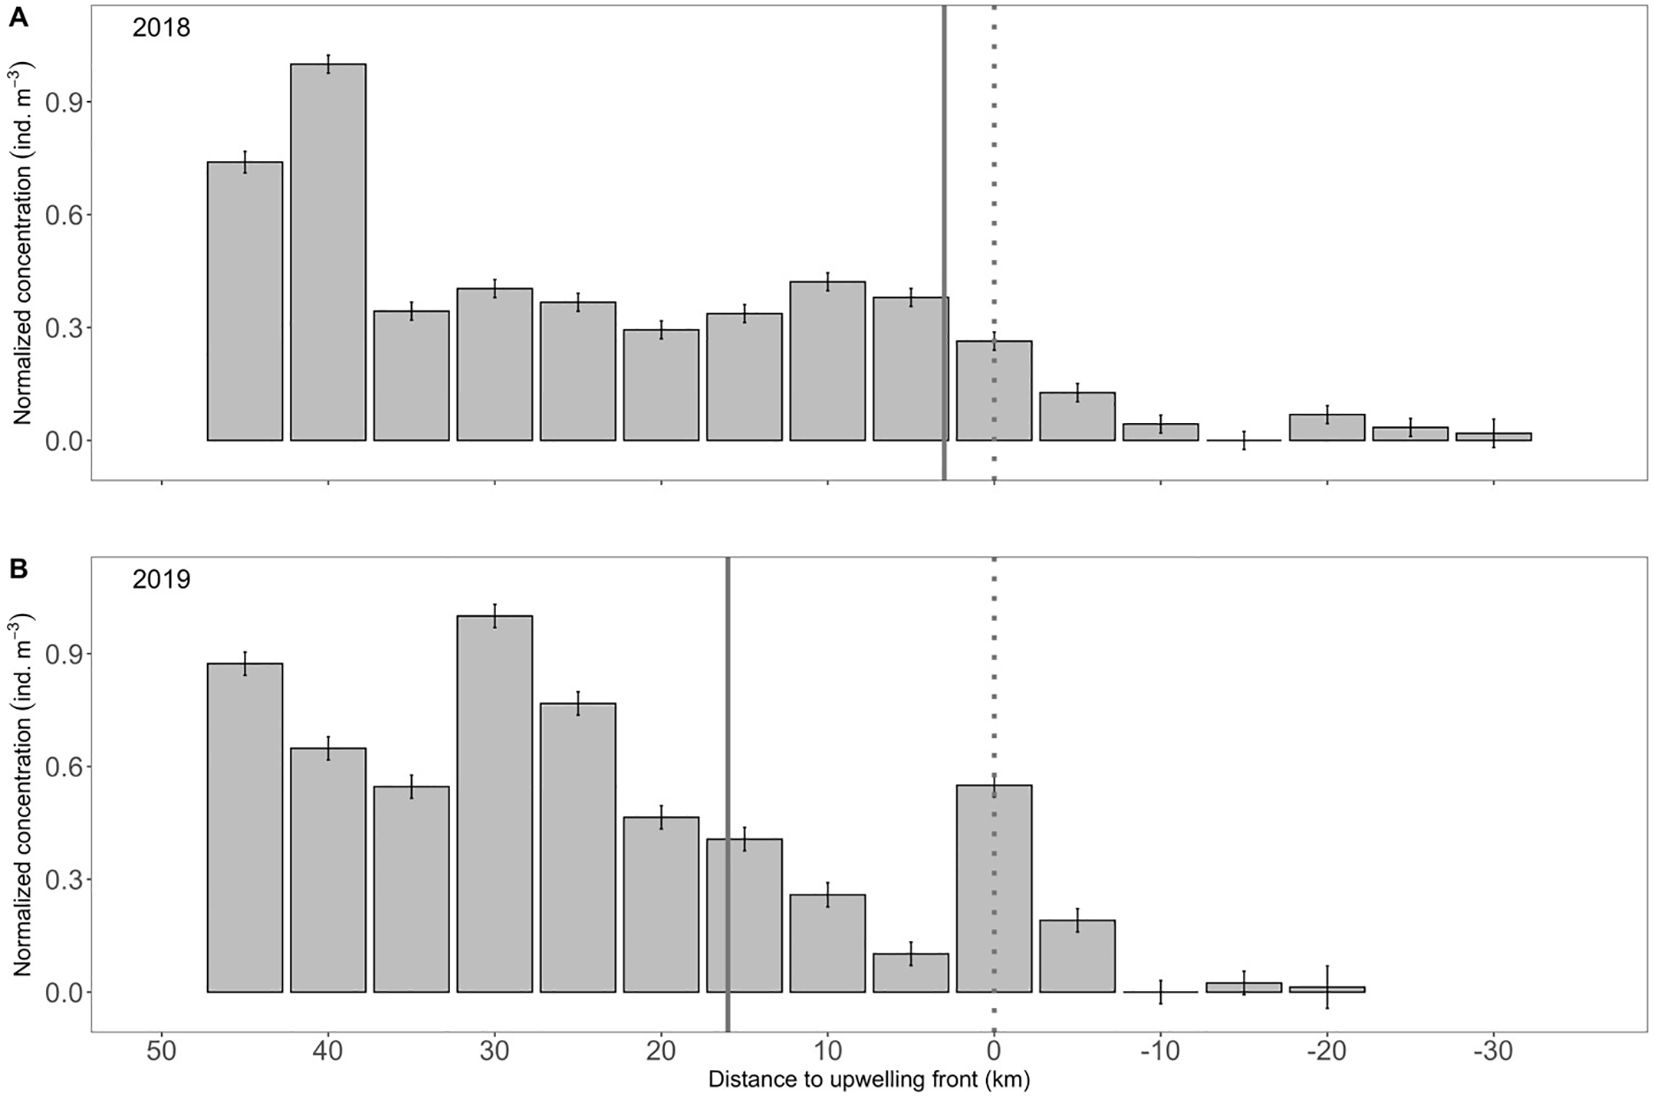
Figure 3. Mean (± SE) concentration of northern anchovy (Engraulis mordax) larvae relative to the upwelling front along the Newport Hydrographic Line in the summers of (A) 2018 and (B) 2019. Data were normalized to the maximum value each year. Solid vertical line denotes the location of the continental shelf-break and the dotted vertical line denotes the position of the upwelling front. Larval size distributions across the shelf are presented in Supplementary Figure S3.
3.3 Northern anchovy size, age, and growth
Northern anchovy used for growth analysis ranged in size from 5.6 to 14.9 mm SL and were 10 to 28 dph. There was general coherence in northern anchovy size and age across years and cross-shelf locations (Supplementary Figure S3). The overall population somatic growth rate was 0.58 mm d-1.
Larval otolith increments were well defined following a distinct first-feeding check. The growth region between the visible hatch and first-feeding checks typically had 2–5 faint and often irregular increments (Figure 4), as has been previously described for northern anchovy which begins regular increment deposition close to yolk-sac absorption and first-feeding (Methot and Kramer, 1979). There was a significant positive relationship between fish size vs. age, otolith size vs. age, and the fish size-at-age residuals vs. otolith size-at-age residual in all years and locations (Supplementary Table S1).
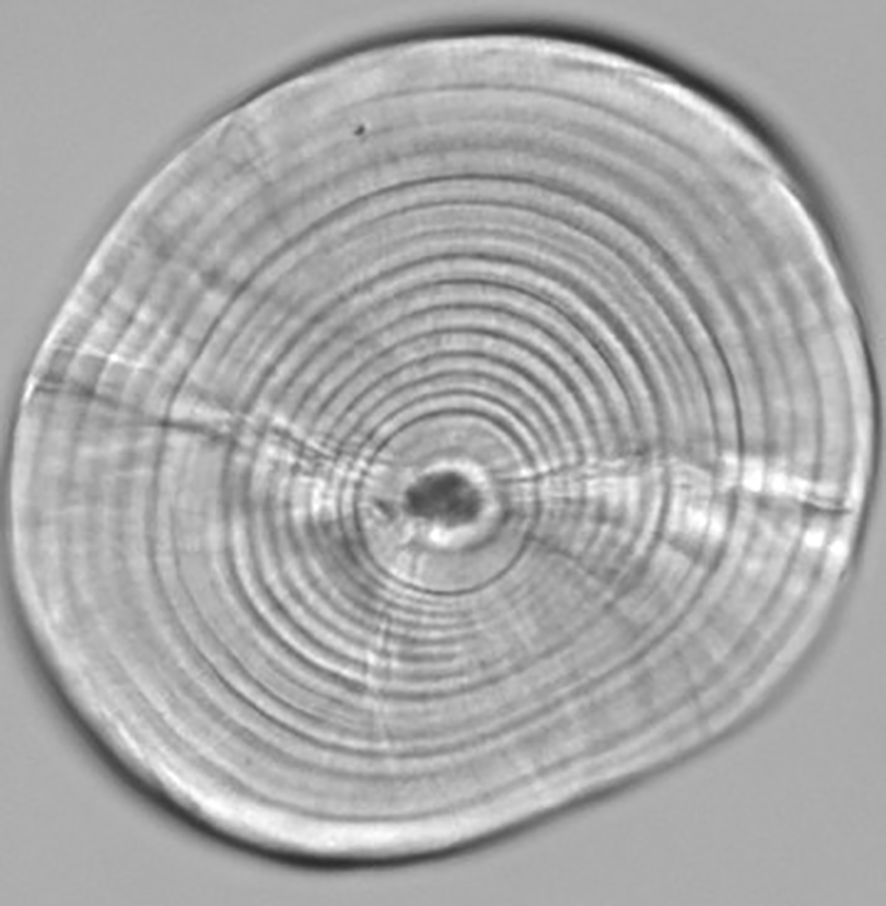
Figure 4. Larval northern anchovy (Engraulis mordax; 11.59 mm SL) sagittal otolith under 400x oil immersion magnification.
Early larval growth was spatially variable and the cross-shelf regions that conferred elevated growth differed between years. MDG (mean daily growth; mean increment widths for each day of life) was similar across space until ~11 dph in 2018 and ~13 dph in 2019 when growth diverged such that offshore northern anchovy grew significantly faster than inshore larvae in 2018 (Figure 5A) whereas the reverse occurred in 2019 (Figure 5B). At the shelf-break, growth tended to be intermediate between the inshore and offshore larvae, though the MDG of shelf-break larvae did not differ significantly from their slower growing counterparts each year (inshore 2018, offshore 2019; Figures 5A, B). Finally, growth was generally faster in 2019 compared to 2018, as the growth of slower growing larvae in 2019 was substantially higher than the growth of the slower growing larvae the previous year (Supplementary Figure S4).
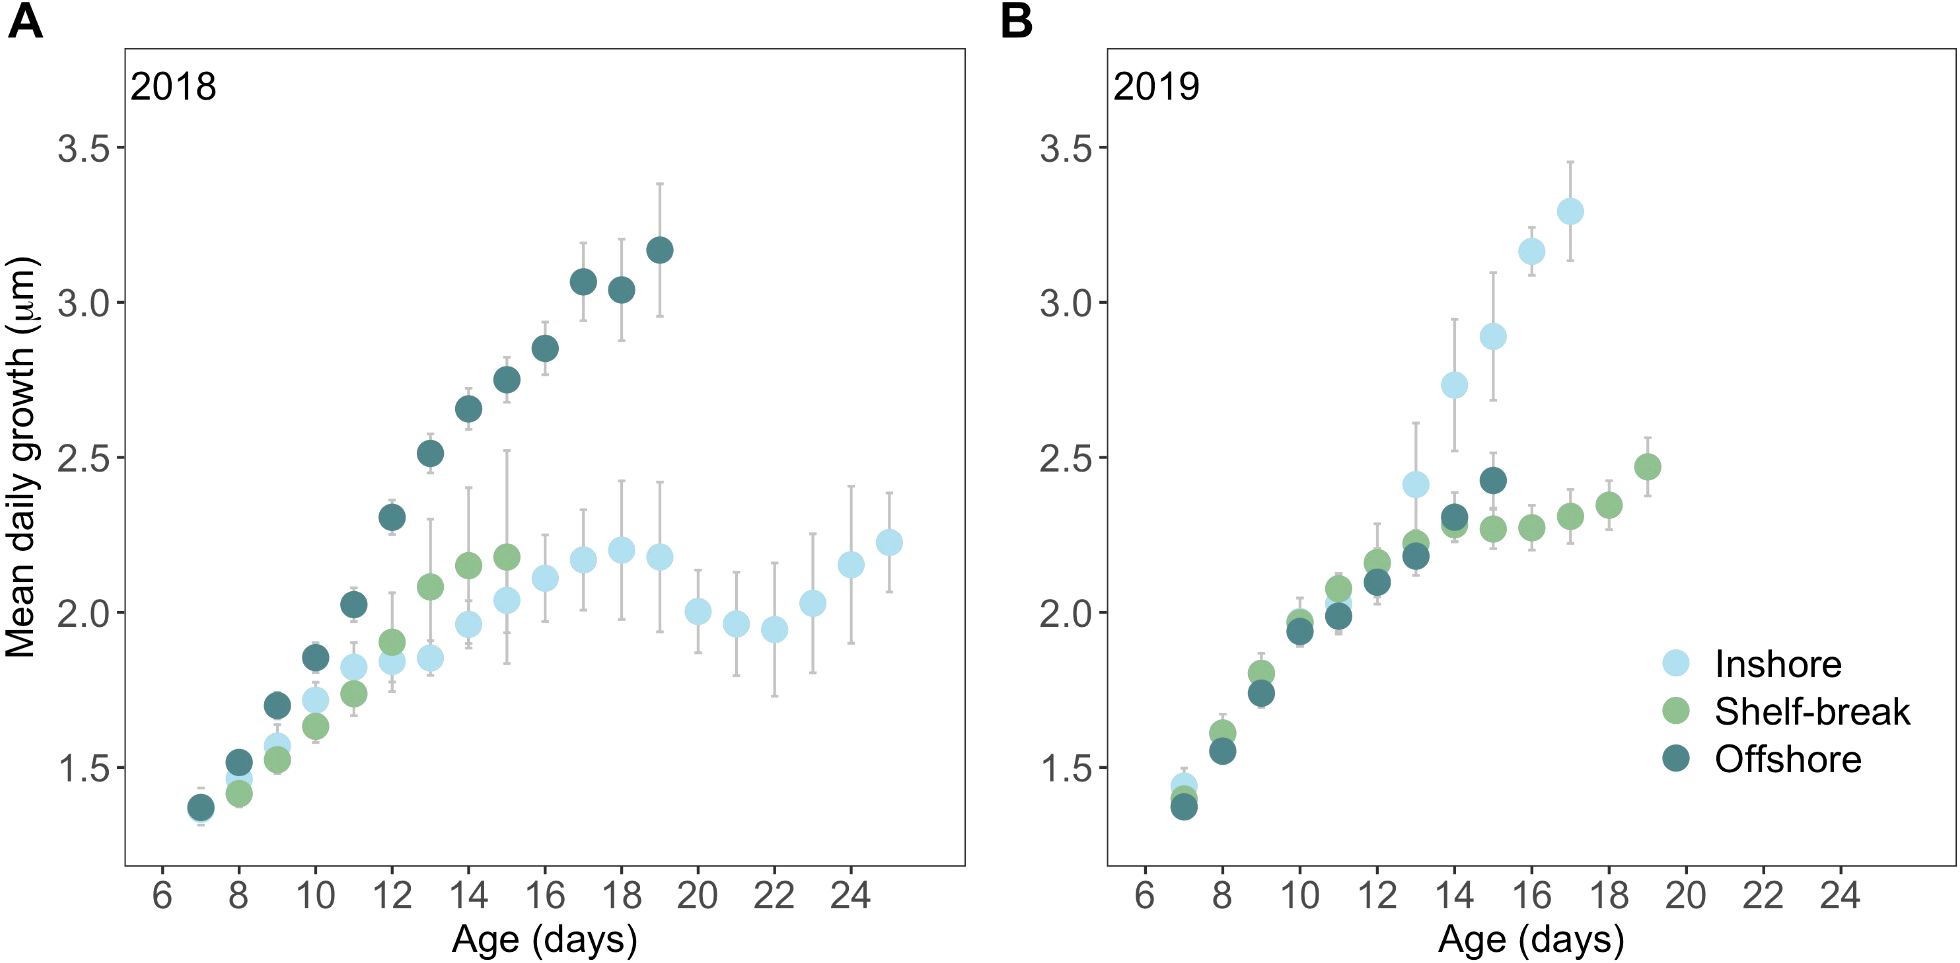
Figure 5. Mean (± SE) daily growth (otolith increment width) of northern anchovy (Engraulis mordax) collected along the Newport Hydrographic Line in the summers of (A) 2018 and (B) 2019 at three cross-shelf locations. Ages were truncated when n< 3 observations.
MRG (mean recent growth; mean increment width over the last three full days of life) followed a similar pattern to MDG. However, in 2018 there was a significant interaction between age and cross-shelf location requiring the division of old (≥14 dph) and young (<14 dph) age larval groups for ANCOVA analysis. In 2018, the MRG of young fish did not differ among cross-shelf locations, but old fish grew significantly faster at the shelf-break (p = 0.01) and offshore (p< 0.001) compared to inshore (Figure 6A). Conversely, in 2019, northern anchovy larvae grew significantly faster inshore compared to the shelf-break (p = 0.001) and offshore (p = 0.02) locations (Figure 6B). There was no significant difference in the growth of old and young anchovy larvae at any location in 2019 (Supplementary Figure S5).
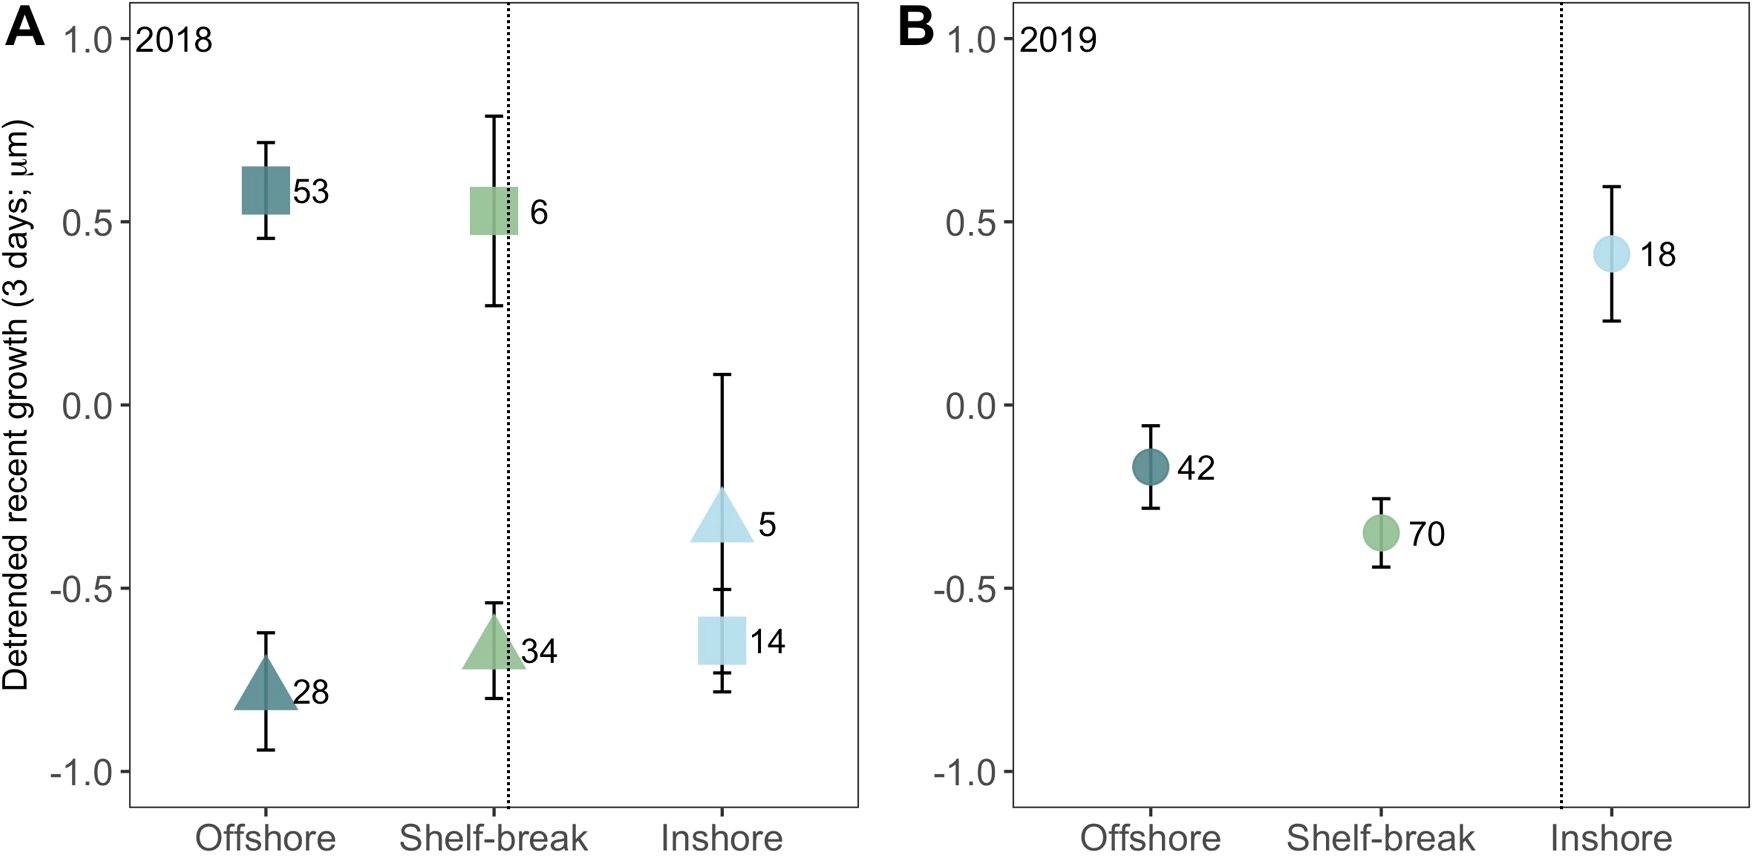
Figure 6. Mean (± SE) detrended growth during the last three complete days of life (mean recent growth; MRG) of northern anchovy (Engraulis mordax) collected along the Newport Hydrographic Line in the summers of (A) 2018 and (B) 2019 at three cross-shelf locations. The dotted line denotes the general position of the upwelling front. Circles are comparisons with all ages included; squares, old (≥ 14 d) age group only; and triangles, young (< 14 d) age group only. Samples size indicated to the right of each data point.
3.4 Recent growth modeling
Northern anchovy recent growth (MRG) was influenced by prey availability and potential predation pressure (Figure 7; deviance explained = 39.9%). Model results indicate that MRG had a dome-shaped relationship with ambient copepod (calanoid and cyclopoid) abundance (p< 0.001). Northern anchovy growth was below average at the lowest concentrations of copepods, reached a peak at intermediate values before decreasing to below average growth at the highest concentration of copepods (Figure 7A). Growth was also significantly affected by potential predator (chaetognaths, ctenophores) abundance (p< 0.001), with average growth at low predator concentrations, below average growth at mid-range values, and above average growth at the maximum predator abundances measured (Figure 7B). Finally, in situ temperature in the top 50 m of the water column, protist concentrations, and northern anchovy density did not significantly impact MRG.
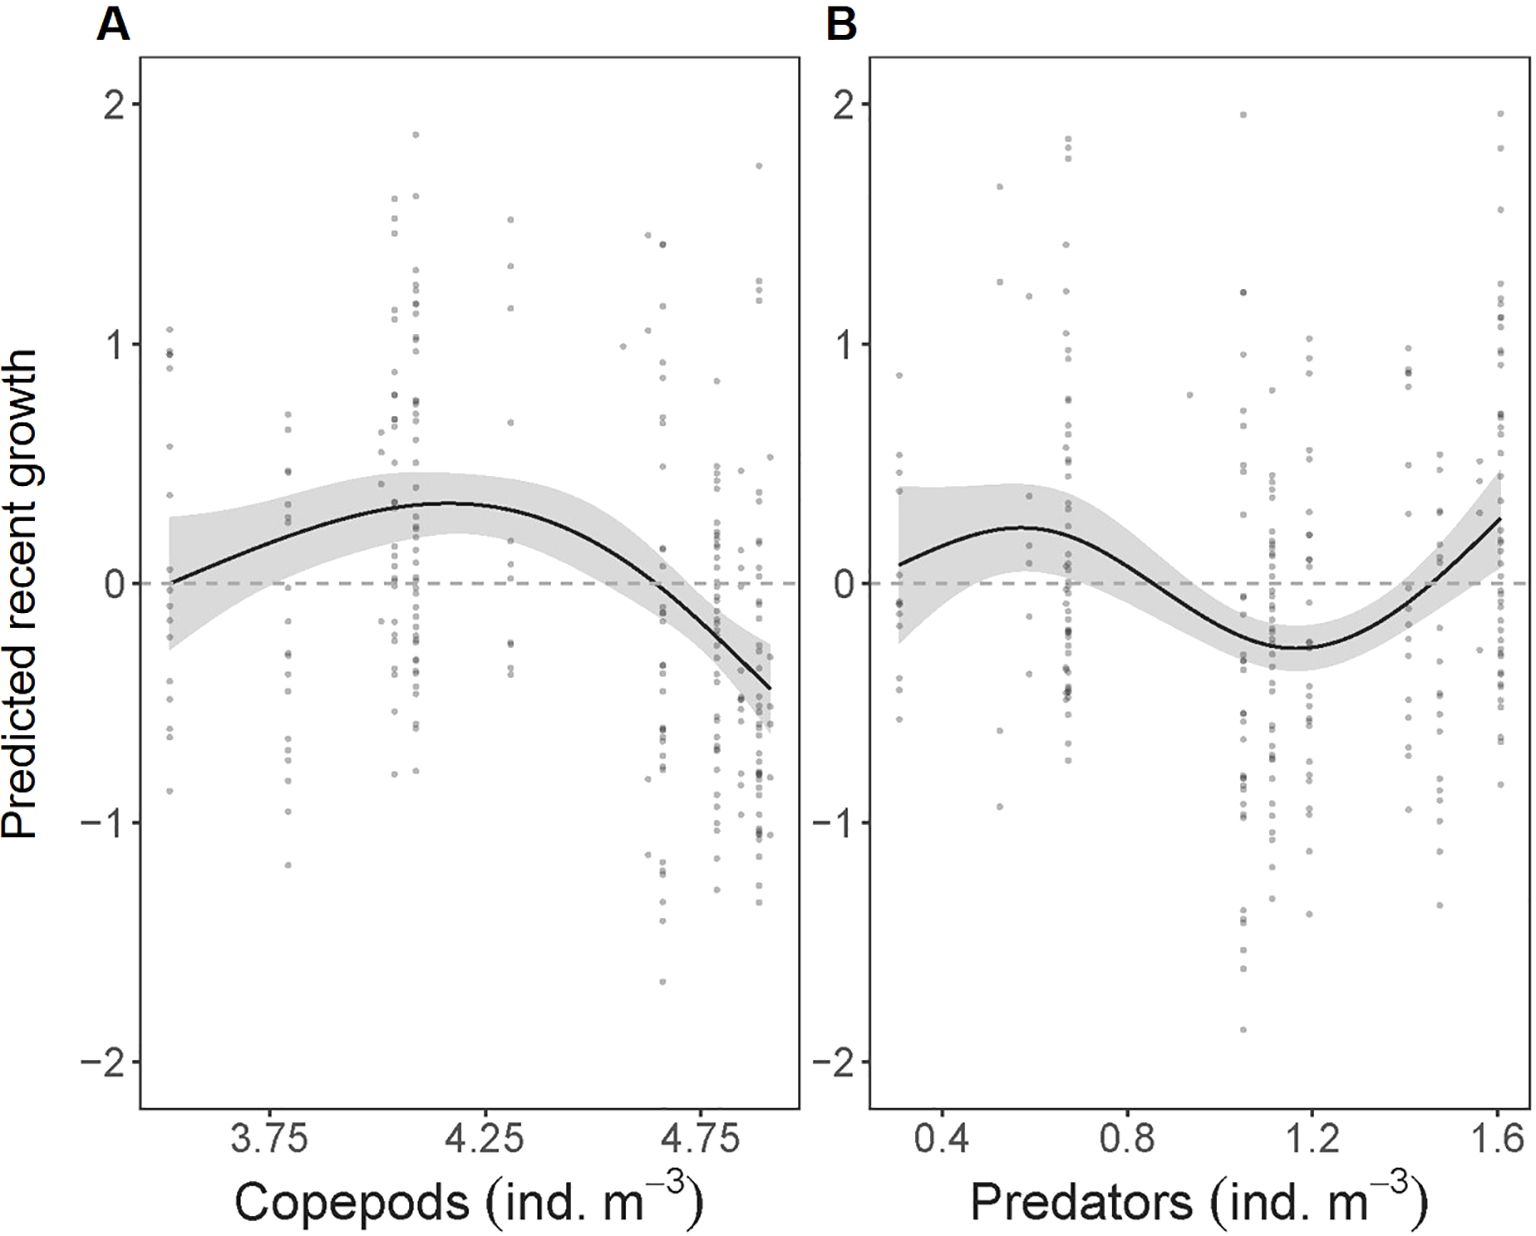
Figure 7. GAM smoothed functions showing the partial effects of each covariate after accounting for the other covariate effects on the mean recent growth (MRG; last three complete days) of individual larval northern anchovy (Engraulis mordax; n= 270). (A) copepod (calanoid and cyclopoid) and (B) potential predator (chaetognaths, ctenophores) concentrations are log+1 transformed. 95% confidence intervals (gray shading) and partial residuals (points) are shown for each covariate. Model deviance explained = 39.9%.
3.5 Prey availability and potential predation pressure
Prey availability was generally higher in 2018 than 2019 (p< 0.001, all prey taxa), but differed substantially across space within each year. In contrast to northern anchovy, high calanoid and cyclopoid copepod abundances were observed inshore of and across the upwelling front, with abundance decreasing roughly 20–25 km seaward of the position of the front throughout sampling. As such, relatively high abundances of copepods were present up to 25 km seaward of the shelf-break (200 m isobath) in 2018, but only 5–10 km seaward of the shelf-break in 2019 (Figure 8).
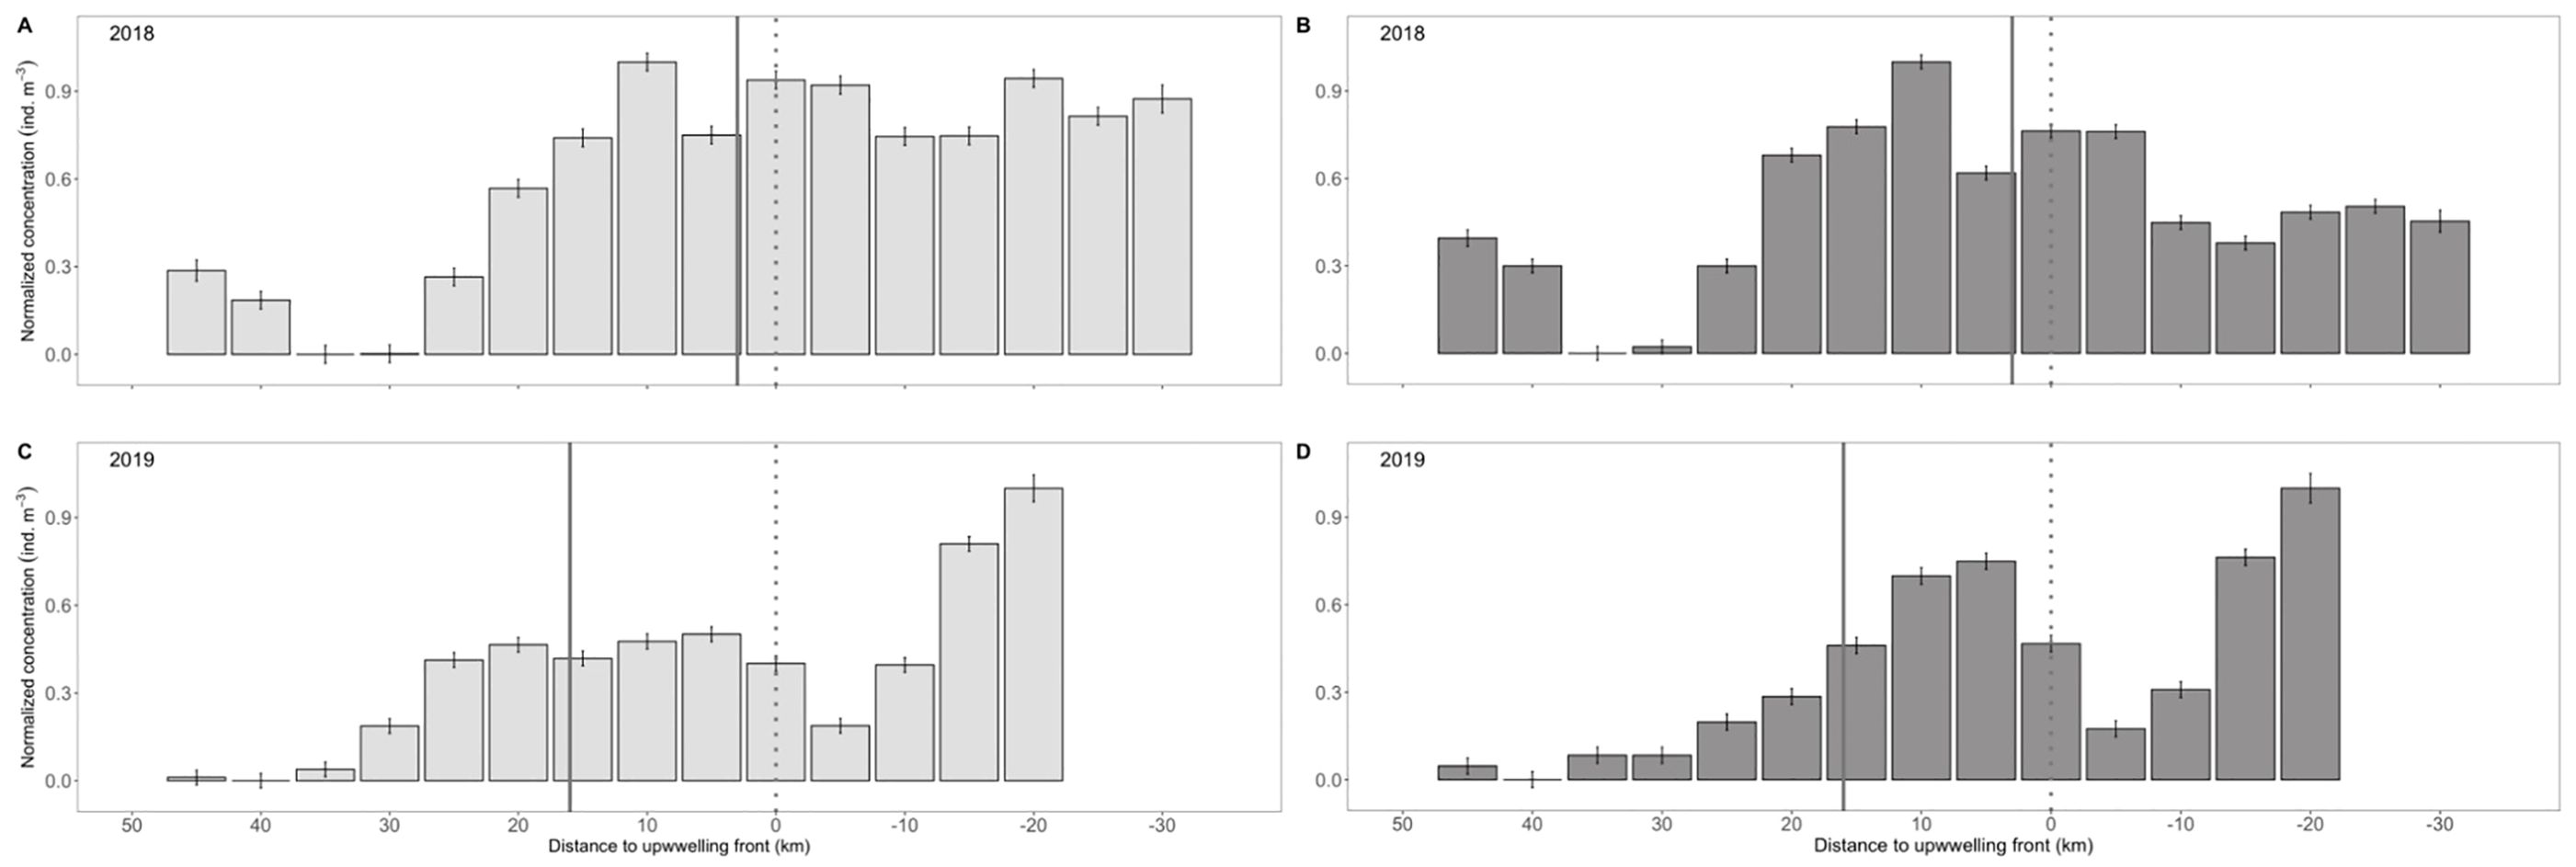
Figure 8. Mean (± SE) concentration of (A, C) calanoid copepods and (B, D) cyclopoid copepods relative to the upwelling front along the Newport Hydrographic Line in the summers of (A, B) 2018 and (C, D) 2019. Data are normalized to the maximum value each year. Solid vertical line denotes the location of the continental shelf-break and the dotted vertical line denotes the position of the upwelling front.
During 2018, there was no significant difference in cyclopoid copepod abundance inshore and offshore of the upwelling front (p = 0.19; Figure 8B) or among inshore, shelf-break, and offshore sampling locations (p = 0.70-0.93; Table 1). While calanoid copepod concentrations were higher inshore than offshore of the upwelling front (p< 0.001), high abundances of calanoid copepods were present 10s of kms beyond the front with a considerable decrease in abundance occurring only > 25 km seaward of the front (Figure 8A). Maximum copepod concentrations occurred at ~10 km seaward of the upwelling front, especially for cyclopoids (Figures 8A, B).
In 2019, calanoid and cyclopoid copepods were considerably more abundant inshore than offshore of the upwelling front (p< 0.001). Peak abundances of both taxa occurred 15–20 km shoreward of the front (Figures 8C, D). Calanoid copepods were especially concentrated nearshore, with their inshore concentration significantly exceeding their concentration at the shelf-break (p = 0.001) and offshore (p< 0.001; Table 1). There was no significant difference in the abundance of cyclopoid copepods at inshore and shelf-break locations (p = 0.42; Table 1), but a sharp decrease in abundance occurred immediately seaward of the shelf-break (Figure 8D). The 2019 offshore copepod concentrations were the lowest observed throughout all of the sampling, and were 1.5 – 2x lower than the offshore location the previous year (Table 1).
Predators were nearly three times more abundant in 2019 compared to 2018 (p< 0.001), but they displayed a similar cross-shelf pattern within each year, with offshore abundances up to five times higher than those at the shelf-break (p< 0.001, both years) and inshore locations (p< 0.001, both years; Table 1).
Finally, in both years, northern anchovy had the highest fine-scale overlap (mean number of prey ind. in a 13 x 13 x 50 cm frame with a larval fish) with their copepod prey in the region seaward (~20 km) of the upwelling front. Given the position of the front relative to the shelf-break, this resulted in the highest anchovy-copepod overlap offshore of the shelf-break in 2018 (Figure 9A), but not in 2019. Instead, in 2019 the anchovy-copepod overlap was greatest in the region between the upwelling front and the shelf-break (Figure 9B). Notably, anchovy-predator overlap was almost entirely restricted to seaward of the shelf-break, especially in 2018 (Figure 9).
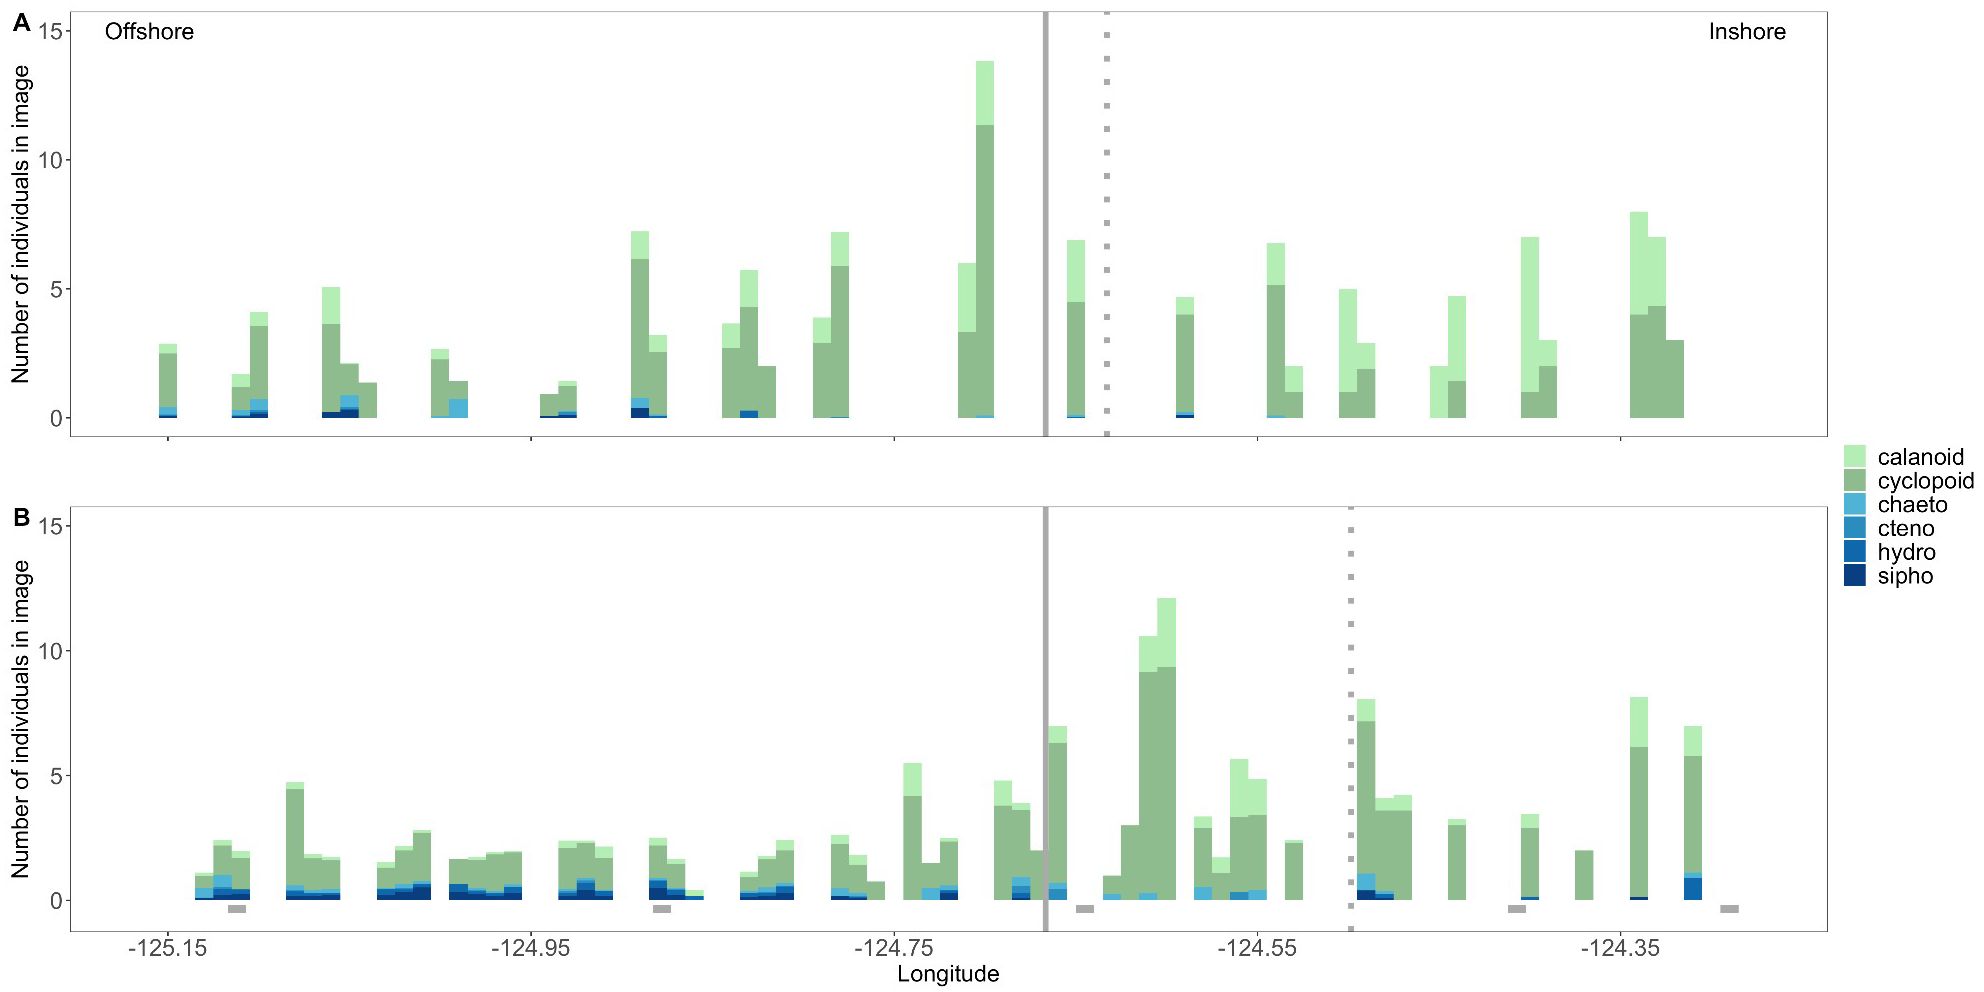
Figure 9. Mean number of zooplankton by taxonomic group found in all plankton imagery frames (13 x 13 x 50 cm) that contained a northern anchovy (Engraulis mordax) larva along the Newport Hydrographic line in the summers of 2018 (A) and 2019 (B). Potential zooplankton prey groups are coded in greens and predators in blues. Solid vertical line denotes the location of the continental shelf-break, the dotted vertical line denotes the position of the upwelling front during sampling each year, and grey rectangles along the x-axis in (B) mark the locations of biological sampling stations. Calanoid = calanoid copepods, cyclopoid = cyclopoid copepods, chaeto = chaetognaths, cteno = ctenophores, hydro = hydromedusae, sipho = siphonophores.
3.6 Taxa vertical distributions
Northern anchovy were fairly evenly distributed from the surface to 50 m depth at inshore and shelf-break sampling locations (Figure 10A, B, D, E). Offshore, they displayed distinct concentration peaks at approximately 12 m depth in 2018 (Figure 10C) and 25 m depth in 2019 (Figure 10F). In both occasions, peaks occurred just above the chlorophyll max. Copepod vertical distributions were more nuanced. In general, copepod concentrations peaked below the chlorophyll max, with the exception of 2019 offshore, where neither calanoid nor cyclopoid copepods displayed a clear concentration peak within the top 50 m of the water column (Figure 10).
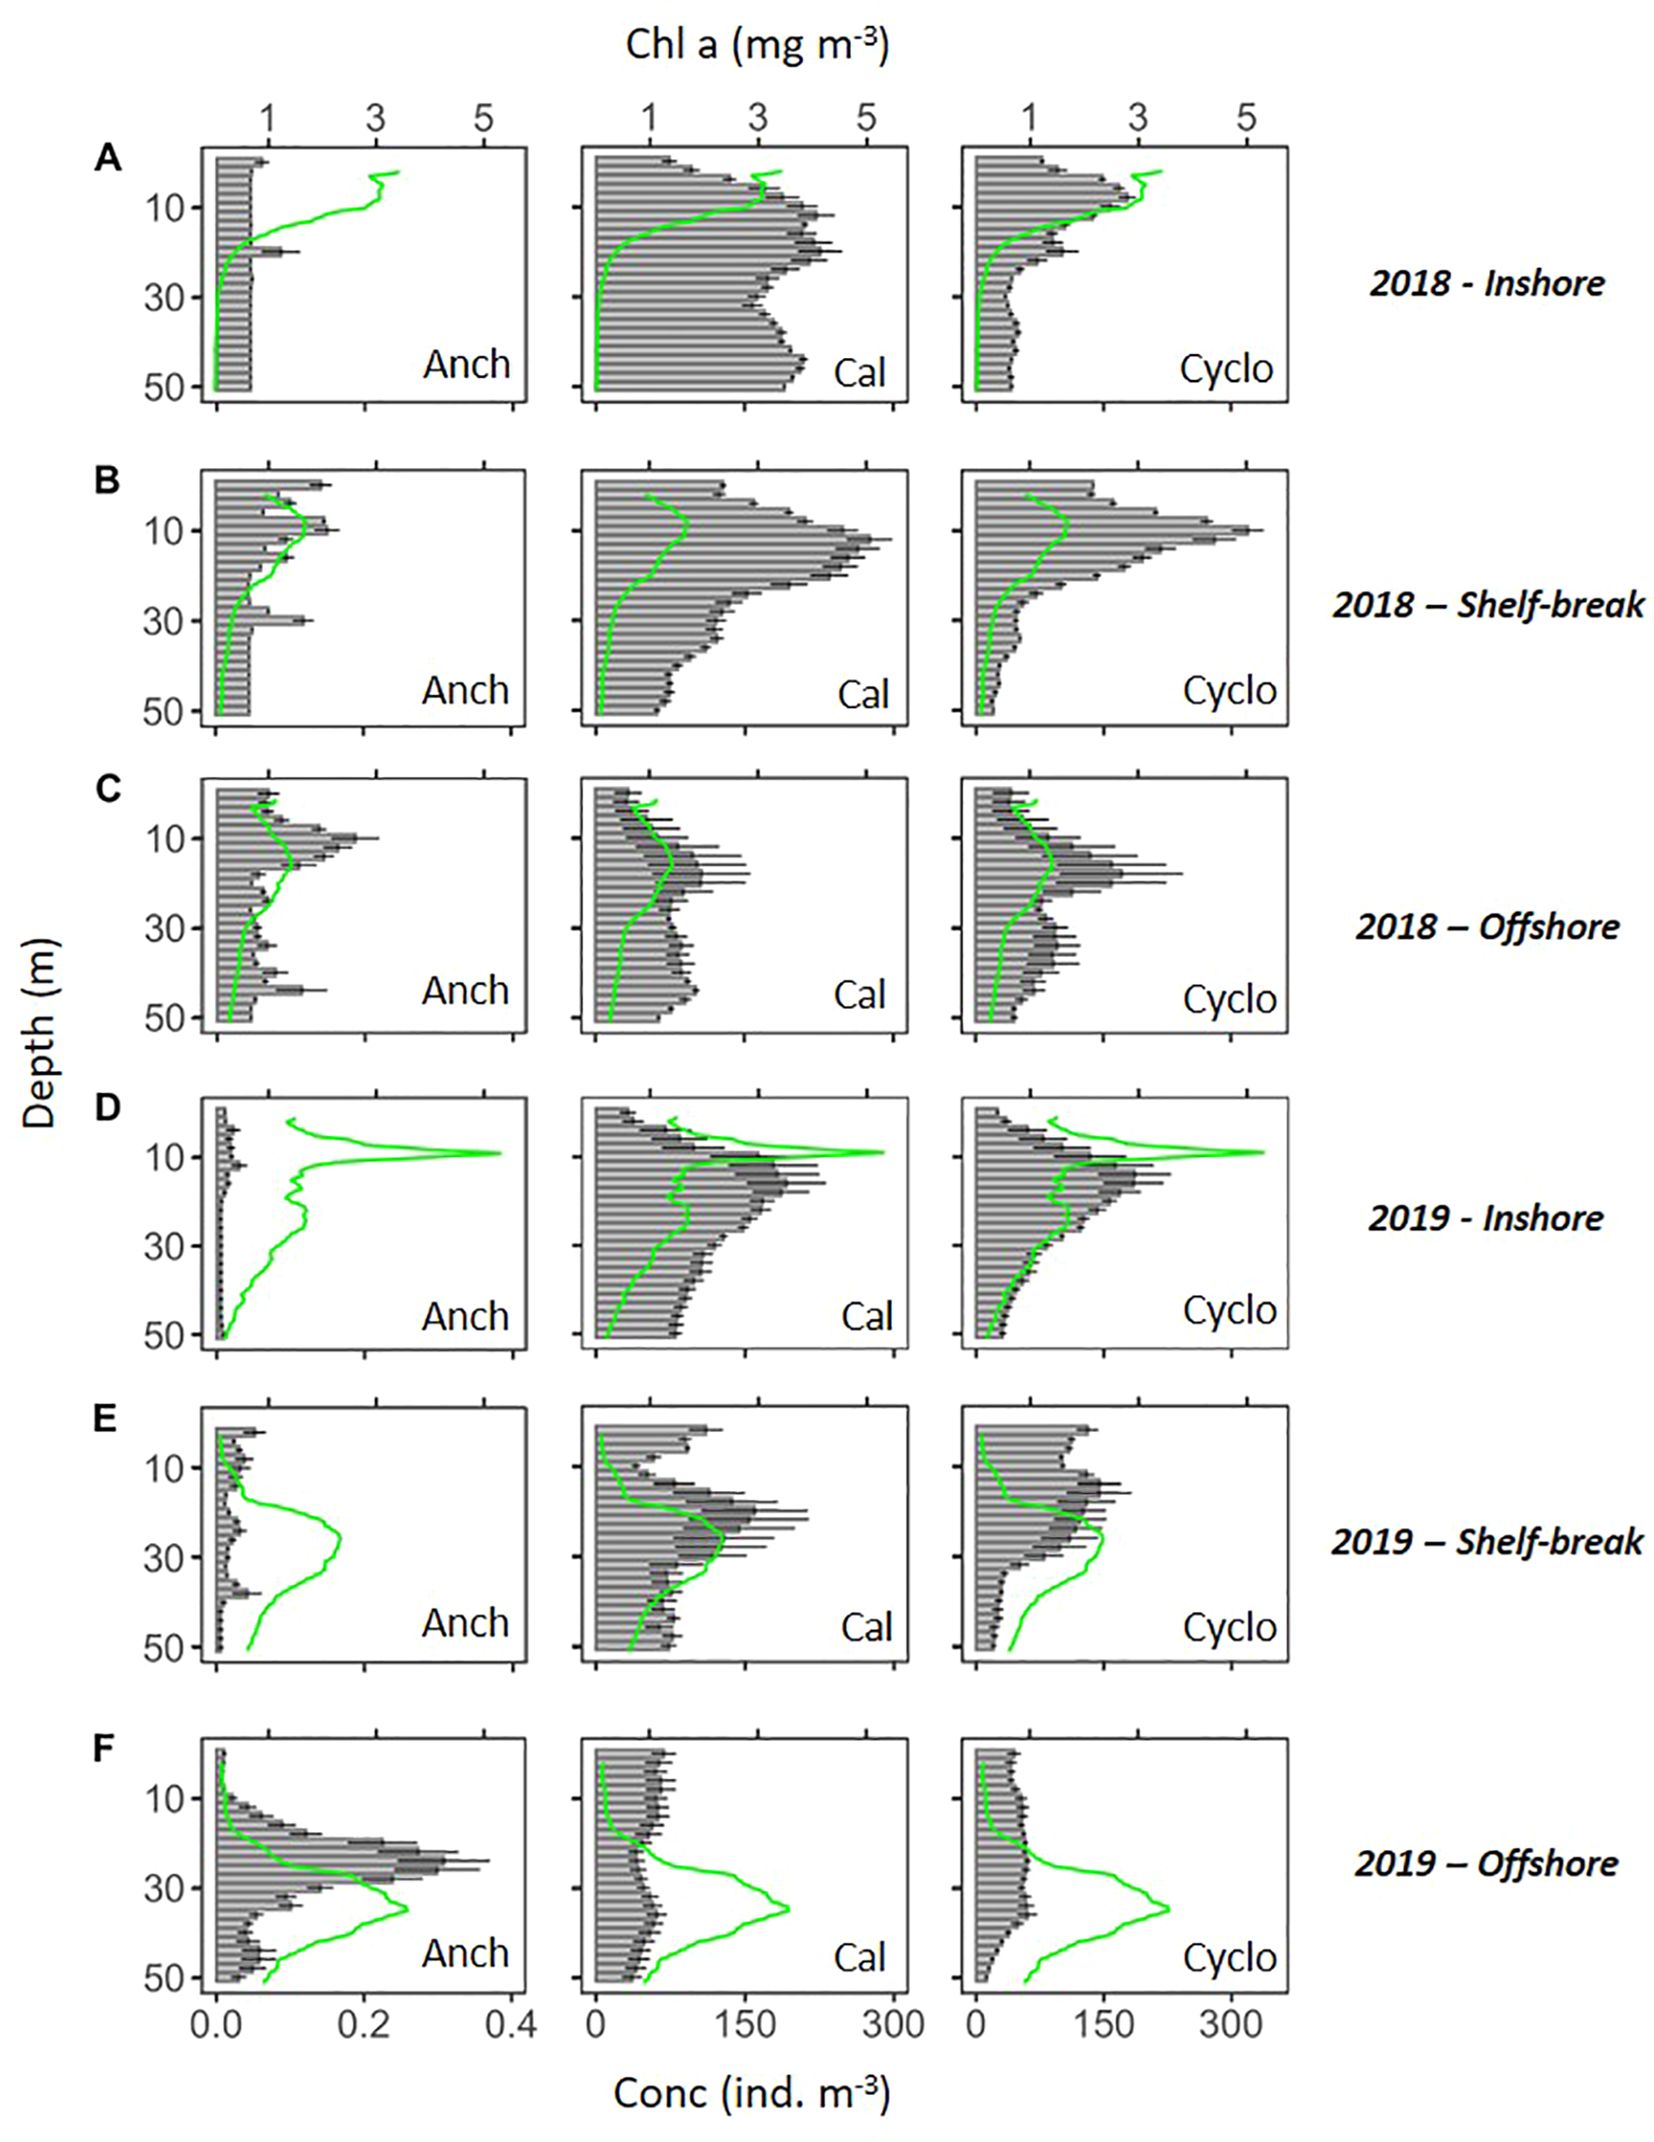
Figure 10. Mean concentration (± SE) of northern anchovy (Engraulis mordax) larvae (Anch), calanoid copepods (Cal), and cyclopoid copepods (Cyclo) in each 2-m depth bin down to 50-m depth during sampling in 2018 (A–C) and 2019 (D–F) inshore (A, D), at the shelf-break (B, E), and offshore (C, F). Mean chlorophyll-a profiles (green line) are overlaid for each sampling event.
4 Discussion
We examined otolith-derived metrics of larval northern anchovy (Engraulis mordax) growth in the context of local oceanography and their in situ prey and potential zooplankton predators in the northern California Current (NCC). Our 2 yrs of sampling occurred during strikingly different summer conditions, providing insight into how the strength and spatial extent of upwelling influences larval northern anchovy. Anchovy abundances were high offshore but diminished immediately inshore of the upwelling front regardless of its cross-shelf position. Zooplankton prey and predator concentrations relative to the upwelling front were more nuanced. As a result, anchovy growth was spatially variable and the regions that conferred higher growth differed between years. Following sustained upwelling in 2018, anchovy both offshore and at the shelf-break grew significantly faster than those inshore. Copepods were widely distributed, and the anchovy-copepod overlap peaked seaward of the shelf-break (200 m isobath). Conversely, in 2019 when upwelled waters were restricted to nearshore locations, copepod abundances and the anchovy-copepod overlap were both substantially higher on the continental shelf compared to offshore, resulting in significantly faster larval anchovy growth inshore than at the shelf-break or offshore.
4.1 Larval northern anchovy otolith microstructure
The larval growth rate of northern anchovy was 0.58 mm d-1, which is within the range, but on the high-end, of what has previously been reported for this species (Methot and Kramer, 1979; Methot, 1981; Butler, 1989). Growth was similar across space until ~12 dph, when northern anchovy began to exhibit spatial variability in their growth. The mean size of larvae at this age was 7.25 mm SL. Interestingly, this is near the size of flexion (6.5-13.5 mm SL; Moser, 1996) and roughly coincides with the size at which larval anchovies begin to incorporate significant numbers of copepodites and adult copepods (copepod post-nauplii) into their diets. While most studies investigating the diets of northern anchovy focused on first-feeding larvae in controlled lab-based experiments (Hunter, 1972; Lasker, 1975; Scura and Jerde, 1977), a few studies provide insights into the ontogenetic diet composition of this species in the wild. By 7 mm SL, northern anchovy larvae in the California Current undergo a diet shift away from protist consumption and toward late-stage copepods. Copepod nauplii appear to be an important component of northern anchovy diet throughout early ontogeny (Berner, 1959; Arthur, 1976). Growth divergence at roughly the size of a shift in diet suggests that copepod availability and consumption may underlie this spatial variability in northern anchovy growth.
Copepods are widely recognized as a nutritious prey source for fish larvae (Llopiz, 2013; Jackson and Lenz, 2016) and higher copepod ingestion has been shown to increase larval growth rates in a variety of systems and species including bluehead wrasse (Thalassoma bifasciatum) and blue marlin (Makaira nigricans) in the Straits of Florida (Sponaugle et al., 2009, 2010), walleye pollock (Gadus chalcogrammus, formerly Theragra chalcogramma) in the Gulf of Alaska (Bailey et al., 1995), and northern lampfish (Stenobrachius leucopsarus) in the NCC (Swieca et al., 2023). For northern anchovy, feeding on copepods increases larval condition and survival (Scura and Jerde, 1977; Hakanson, 1989), and presumably growth (Takahashi et al., 2012). By contributing to fast growth, copepod consumption may also help northern anchovy escape predation (Anderson, 1988).
4.2 Distribution of northern anchovy larvae
Larval northern anchovy abundances were consistently high offshore and diminished immediately inshore of the upwelling front regardless of its cross-shelf position. This observation suggests that the upwelling front may act as a shoreward boundary to northern anchovy larvae. In this system, northern anchovy larvae are typically concentrated in warm, low salinity offshore water originating from the Columbia River Plume (Richardson, 1973; Auth and Brodeur, 2006). However, Auth (2008) found that during weak upwelling seasons larvae are evenly distributed across coastal and offshore regions. Because the upwelling front is positioned closer to shore during weak upwelling (Castelao et al., 2005), this anecdotal finding provides support for the notion that the location of the upwelling front and the extent of upwelled waters limits the shoreward distribution of northern anchovy larvae.
It is difficult to distinguish the mechanisms driving this observation because of the variety of co-varying physical properties near upwelling fronts and the dynamic nature of upwelling systems. Northern anchovy larvae are generally concentrated in the top 10s of meters of the water column and thus are subject to passive cross-shelf transport in surface currents such as those generated by wind-driven upwelling and downwelling processes (Parrish et al., 1981). Temperature may also be an important factor regulating larval distributions. Similar to its effect on larval anchovy, the upwelling front functions as a shoreward boundary for adult planktivorous fish in the NCC and it is hypothesized that surface temperature ultimately limits the distribution of these taxa, as they are strongly temperature dependent and the upwelling front marks the transition from warm offshore water to cool upwelled water inshore (Sato et al., 2018). While anchovy may be more cold tolerant than other planktivorous fishes (Baxter, 1966; Checkley et al., 2000), they are generally confined to regions of relatively warm water where sea surface temperatures range from ~13-17.4°C (Baxter, 1966; Richardson, 1981; Auth and Brodeur, 2006). Poor swimming larvae likely have less control over their horizontal distribution than their adult counterparts, but a shift in adult spawning distributions relative to the upwelling front could help explain the observed larval distributions. Indeed, reduced upwelling has been shown to lead to a shoreward expansion of northern anchovy spawning habitat and consequently larval distributions off Oregon (Brodeur et al., 1985). Whether due to passive transport, physiological limitation, or shifting spawning habitats, variability in the cross-shelf distribution of anchovy under different upwelling scenarios likely affects their access to the highly abundant and lipid-rich prey base characteristic of summer shelf waters in this system (Morgan et al., 2003).
4.3 Prey availability and northern anchovy growth
Larval anchovy growth was spatially variable and the regions that conferred higher growth differed based on the cross-shelf extent of upwelled waters. When upwelling was restricted to the nearshore environment, anchovy grew significantly faster inshore than at the shelf-break or offshore. Conversely, when the upwelling front was located farther offshore following sustained upwelling, offshore and shelf-break anchovy grew significantly faster than those inshore. The spatial extent of upwelling differentially impacted the distribution of northern anchovy larvae and their copepod prey, with implications for trophodynamics.
Unlike northern anchovy who were concentrated offshore of the upwelling front, high calanoid and cyclopoid copepod abundances occurred inshore of and across the upwelling front both years. This is consistent with expectations, as copepod biomass during summer in the NCC can be nearly three times greater on the continental shelf compared to off the shelf (Morgan et al., 2003; Lamb and Peterson, 2005). Interestingly, copepod distributions appear to be less affected by the position of the upwelling front than larval anchovy. We observed persistently high copepod concentrations roughly 20–25 km seaward of the upwelling front throughout sampling. Variable fish and zooplankton responses to the upwelling front have been observed by other studies in this system (Sato et al., 2018) and contrasting responses of anchovy and copepods may explain the spatial variability in northern anchovy larval growth. The copepod response may be linked to the intermittent nature of upwelling in this system, with the base of the food-web less reliant on new production than in continuous upwelling systems (Schmid et al., 2023).
Following sustained upwelling in 2018, the upwelling front was located farther offshore and high copepod abundances and fine-scale overlap with anchovy were observed up to 25 km seaward of the shelf-break (200 m isobath). When upwelling was restricted to only nearshore locations in 2019, high anchovy-copepod overlap occurred over the entire continental shelf, but peaked 10s of kms inshore of the shelf-break. Enhanced prey availability offshore of the shelf-break in 2018, but inshore of the shelf-break in 2019 likely contributed to the contrasting patterns of fast growth between years.
In addition to spatial variability in copepod abundance, copepod community composition exhibits cross-shelf zonation during summer in the NCC, which also likely impacted larval anchovy growth. Continental shelf waters are characterized by the presence of ‘cold water’ copepod species transported south to the NCC from subarctic source waters. In contrast, the off-shelf community is dominated by ‘warm water’ copepods that either reside in coastal zones during winter and are advected offshore at the start of the upwelling season or are transported from the Transition Zone (Peterson and Miller, 1977; Morgan et al., 2003; Hooff and Peterson, 2006). Given their affinities, ‘cold water’ inshore copepods tend to be lipid-rich and serve as an important prey base for many coastal taxa, while ‘warm water’ offshore copepods are relatively lipid-poor (Logerwell et al., 2003; Peterson and Schwing, 2003; Hooff and Peterson, 2006; Tomaro et al., 2012; Peterson et al., 2014). It is generally asserted that ‘cold water’ copepods are retained on the shelf through ontogenetic vertical migrations that limit offshore advection during the upwelling season. However, only late-stage copepods (C3 copepodite - adult) undergo vertical migration, and nauplii through mid-stage copepodites are concentrated in the top 20 m of the water column where they are more frequently subject to cross-shelf transport in the surface layer, although late-stage copepods can also be transported offshore during especially strong upwelling (Morgan et al., 2003; Lamb and Peterson, 2005). It is possible that the younger life stages of lipid-rich ‘cold water’ copepods were transported offshore with sustained upwelling in 2018 contributing to fast offshore anchovy growth that year. When upwelling was reduced in 2019, this highly nutritious prey base was likely restricted to the nearshore environment, the region of fast anchovy growth that year.
4.4 Impact of predation pressure on northern anchovy growth
Larval northern anchovy growth is also significantly related to the abundance of zooplankton predators (chaetognaths and ctenophores). After accounting for the influence of prey availability, the partial effect of predators indicates that growth was just above average at low predator abundance, decreased to slower than average at mid-range predator abundance, then rapidly increased to above average growth at the highest abundance of predators. Contrasting effects of predation on northern anchovy growth is not entirely surprising and may be the result of shifting predator composition across years or cross-shelf locations. Foundational theories in the field of fisheries oceanography suggest that faster-growing larvae experience enhanced survivorship because their quick development reduces vulnerability to predation (i.e., predation selectively removes slow growers; Houde, 1987; Anderson, 1988). However, selection against fast growing larvae also occurs (Sponaugle et al., 2011; Takasuka et al., 2017), highlighting that patterns of selective mortality are species- (prey and predator) and habitat-specific. The predators included in our model have drastically different modes of predation - chaetognaths are aggressive ambush predators (Feigenbaum and Maris, 1984) while ctenophores often do not actively attack their prey (Purcell, 1985) - and exhibited different cross-shelf distributions throughout our sampling. As such, the variable growth response may reflect the relative composition of each type of predator and the effect of their predation on anchovy growth.
Although we were unable to incorporate all predator taxa in the model due to collinearity, high offshore abundances of chaetognaths and ctenophores generally co-occurred with high abundances of hydromedusae and siphonophores. This pattern resulted in offshore predator abundances that were up to five times greater than the shelf-break and inshore regions in both years. Other potential predator taxa (e.g., krill, planktivorous fishes, etc) are also expected to have higher offshore abundances. Consequently, larval anchovy-predator overlap was also higher offshore with implications for larval mortality rates and selective loss of larvae with particular traits.
Both bottom-up and top-down controls have been used to explain northern anchovy population fluctuations. Studies that focus on the latter emphasize the effect of predation on eggs and age-0 anchovy from piscivorous fishes, seabirds, and marine mammals as well as cannibalism from adult conspecifics (Hunter and Kimbrell, 1980; Folkvord and Hunter, 1986; Glaser, 2011; Sydeman et al., 2020). These studies provide substantial evidence to suggest that predation can exert some level of control on northern anchovy populations. Yet, studies investigating the potential role of zooplankton predation on the early life history stages of northern anchovy are scant. This may be due, in part, to the variety of potential zooplankton predators (Bailey and Houde, 1989) and the difficulty in sampling gelatinous taxa with net-based systems. Nonetheless, seminal work in this realm suggests that larval fishes comprise a significant portion of the diet of many zooplankton predators (Alvarino, 1985; Purcell, 1985; Purcell and Grover, 1990; Purcell et al., 1994; Purcell and Arai, 2001). Our results build upon these findings and demonstrate that predation is a key parameter affecting northern anchovy larval growth. Because larval growth and size-at-age strongly impact survival and year-class strength (Lasker, 1975; Anderson, 1988; Miller et al., 1988; Hare and Cowen, 1997), zooplankton predation on larval anchovy must be considered to holistically address the factors regulating northern anchovy populations. Quantifying the effects of predation on northern anchovy survival is becoming even more important in the context of changing ocean conditions in the NCC which have historically favored gelatinous predator taxa (Brodeur et al., 2019).
4.5 Upwelling and northern anchovy life history: a hypothesis
Annual upwelling in the NCC is defined as starting at the physical spring transition (Mar - Jun) and ending at the physical fall transition (Oct - Nov). Although the coastal ocean can generally be characterized as ‘upwelling-influenced’ between these two events, active upwelling does not occur for the entire duration of this season. On the sub-seasonal timescale, active upwelling is highly nuanced and regularly starts and stops (relaxes) in discrete events that occur on the order of days to weeks. At the start of an active upwelling event a front is established nearshore and as upwelling progresses this front is pushed incrementally farther offshore. In this dynamic ecosystem, we found that the habitat that provides for the best larval anchovy growth changes throughout an upwelling cycle. Nearshore habitats supported faster growth during the early stages of an upwelling event (i.e., nearshore front), while offshore habitats contributed to faster growth during the mid-to-late stages of an upwelling event (i.e., sustained upwelling; offshore front). The duration of the egg-stage is short in northern anchovy (2–4 d; Baxter, 1966) so adult spawning location likely impacts the habitat that larvae occupy. Based on our findings and the life history characteristics of northern anchovy, we hypothesize that fast early larval growth occurs when the location of spawning (i.e., inshore versus offshore) aligns with the stage of upwelling (i.e., early with an inshore front versus mid-to-late with an offshore front).
4.6 Conclusions
Recent novel oceanographic conditions have highlighted the gaps in our knowledge of the specific mechanisms by which variability in the environment translates into variability in northern anchovy recruitment. We integrated three tools (depth discrete biological sampling, in situ underwater imaging, and otolith microstructure analysis) to reveal spatial and temporal complexity in the ocean habitats that enhance growth, and presumably survival, of larval northern anchovy. Importantly, the regions that conferred higher growth differed between years and were related to upwelling variability. In particular, the spatial extent of cool, productive upwelled waters led to variability in the trophic environment experienced by northern anchovy with implications for their growth and survival. Our findings illustrate the importance of examining local oceanographic conditions and fine-scale food-web dynamics when predicting the response of forage fish to ecosystem variability.
Data availability statement
The raw data supporting the conclusions of this article will be made available by the authors, without undue reservation.
Ethics statement
The animal study was approved by Institutional Animal Care and Use Committee (IACUC). The study was conducted in accordance with the local legislation and institutional requirements.
Author contributions
KS: Conceptualization, Data curation, Formal Analysis, Investigation, Visualization, Writing – original draft, Writing – review & editing. SS: Conceptualization, Funding acquisition, Investigation, Project administration, Resources, Supervision, Writing – review & editing. MSS: Data curation, Investigation, Writing – review & editing. JI: Data curation, Investigation, Writing – review & editing. RKC: Conceptualization, Funding acquisition, Investigation, Project administration, Resources, Supervision, Writing – review & editing.
Funding
The author(s) declare that financial support was received for the research and/or publication of this article. This project was funded by National Science Foundation Division of Ocean Sciences grant NSF OCE 1737399. KS was also supported through the HMSC Mamie Markham Award, the Walter G. Jones Fishery Development Award, and the Hannah-Jones Award, as well as the Department of Integrative Biology Research Funds. During the preparation of this manuscript, SS, MSS, JI, and RKC were supported by NSF OCE 2125407.
Acknowledgments
We thank all who contributed to at-sea sampling, including the captains and crews of the R/V Atlantis and the R/V Sally Ride, H. William Fennie, Megan Wilson, Kelia Axler, Miram Gleiber, and Christian Briseño-Avena. This work was strengthened by input on larval fish identification from T. Auth and modeling guidance from Lorenzo Ciannelli. Co-investigator Kelly Sutherland and collaborators Ric Brodeur and Eric Bjorkstedt contributed substantially to overall project development. Comments from Ric Brodeur, Lorenzo Ciannelli, and Francis Chan improved an earlier version of the manuscript. Finally, we acknowledge Chris Sullivan and Oregon State University’s Center for Quantitative Life Sciences and the many undergraduate volunteers who contributed to the processing of imagery data and biological samples: L. Nepstad, A. Branka, A. Bolm, C. Watson, B. Anders, A. Pulscak, L. Wetchler, J. Knowlton, N. Baker, R. Hartley, K. Bowditch, K. Rorvig, H. Woodwick, K. Bauer, Z. Sallada, S. Knodel, M. Sandmeier, H. Woodruff, Z. Thomas, and B. Rothman.
Conflict of interest
The authors declare that the research was conducted in the absence of any commercial or financial relationships that could be construed as a potential conflict of interest.
Generative AI statement
The author(s) declare that no Generative AI was used in the creation of this manuscript.
Publisher’s note
All claims expressed in this article are solely those of the authors and do not necessarily represent those of their affiliated organizations, or those of the publisher, the editors and the reviewers. Any product that may be evaluated in this article, or claim that may be made by its manufacturer, is not guaranteed or endorsed by the publisher.
Supplementary material
The Supplementary Material for this article can be found online at: https://www.frontiersin.org/articles/10.3389/fmars.2025.1558793/full#supplementary-material
References
Alvarino A. (1980). The relation between the distribution of zooplankton predators and anchovy larvae. CalCOFI Rep. 21, 150–160.
Alvarino A. (1985). Predation in the plankton realm; mainly with reference to fish larvae. Inv. Mar. CICIMAR 2, 1–122.
Anderson J. T. (1988). A review of size dependent survival during pre-recruit stages of fishes in relation to recruitment. J. Northwest Atl. Fish. Sci. 8, 55–66.
Arthur D. (1976). The food and feeding of larvae of three fishes occurring in the California Current, Sardinops sagax, Engraulis mordax, and Trachurus symmetricus. Fish. Bull. 74, 517–530.
Auth T. (2008). Distribution and community structure of ichthyoplankton from the northern and central California Current in May 2004-06. Fish. Oceanogr. 17, 316–331. doi: 10.1111/j.1365-2419.2008.00481.x
Auth T. D. and Brodeur R. D. (2006). Distribution and community structure of ichthyoplankton off the coast of Oregon, USA, in 2000 and 2002. Mar. Ecol. Prog. Ser. 319, 199–213. doi: 10.3354/meps319199
Bailey K. and Houde E. (1989). Predation on eggs and larvae of marine fishes and the recruitment problem. Adv. Mar. Biol. 25, 1–83. doi: 10.1016/S0065-2881(08)60187-X
Bailey K. M., Canino M. F., Napp J. M., Spring S. M., and Brown A. L. (1995). Contrasting years of prey levels, feeding conditions and mortality of larval walleye pollock Theragra chalcogramma in the western Gulf of Alaska. Mar. Ecol. Prog. Ser. 119, 11–23. doi: 10.3354/meps119011
Barth J. A., Pierce S. D., and Smith R. L. (2000). A separating coastal upwelling jet at Cape Blanco, Oregon and its connection to the California Current System. Deep Sea Res. Part II Top. Stud. Oceanogr. 47, 783–810. doi: 10.1016/S0967-0645(99)00127-7
Baumann H., Pepin P., Davidson F. J., Mowbray F., Schnack D., and Dower J. F. (2003). Reconstruction of environmental histories to investigate patterns of larval radiated shanny (Ulvaria subbifurcata) growth and selective survival in a large bay of Newfoundland. ICES J. Mar. Sci. 60, 243–258. doi: 10.1016/S1054–3139(03)00019-5
Baumgartner T., Soutar A., and Ferreira-Bartina V. (1992). Reconstruction of the history of Pacific sardine and northern anchovy populations over the past two millennia from sediments of Santa Barbara Basin, California. CalCOFI Rep. 33, 24–40.
Baxter J. L. (1966). Summary of biological information on the northern anchovy Engraulis mordax Girard. CalCOFI Rep. 11, 110–116.
Berner L. (1959). The food of the larvae of the northern anchovy, Engraulis mordax. Inter-American Trop. Tuna Com. Bull. 4, 1–22.
Bjorkstedt E., Rosenfeld L., Grantham B., Shkedy Y., and Roughgarden J. (2002). Distributions of larval rockfishes Sebastes spp. across nearshore fronts in a coastal upwelling region. Mar. Ecol. Prog. Ser. 242, 215–228. doi: 10.3354/meps242215
Briseño-Avena C., Schmid M., Swieca K., Sponaugle S., Brodeur R. D., and Cowen R. K. (2020). Three-dimensional cross-shelf zooplankton distributions off the Central Oregon Coast during anomalous oceanographic conditions. Prog. Oceanogr. 188, 102436. doi: 10.1016/j.pocean.2020.102436
Brodeur R. D., Auth T. D., and Phillips A. (2019). Major shifts in pelagic micronekton and macrozooplankton community structure in an upwelling ecosystem related to an unprecedented marine heatwave. Front. Mar. Sci. 6. doi: 10.3389/fmars.2019.00212
Brodeur R. D., Fisher J. P., Emmett R. L., Morgan C. A., and Casillas E. (2005). Species composition and community structure of pelagic nekton off Oregon and Washington under variable oceanographic conditions. Mar. Ecol. Prog. Ser. 298, 41–57. doi: 10.3354/meps298041
Brodeur R. D., Gadomski D. M., Pearcy W. G., Batchelder H. P., and Miller C. B. (1985). Abundance and distribution of ichthyoplankton in the upwelling zone off Oregon during anomalous El Nino conditions. Estuar. Coast Shelf Sci. 21, 365–378. doi: 10.1016/0272-7714(85)90017-4
Brothers E. B., Mathews C. P., and Lasker R. (1976). Daily growth increments in otoliths from larval and adult fishes. Fish. Bull. 74, 1–8.
Butler J. L. (1989). Growth during the larval and juvenile stages of the northern anchovy, Engraulis mordax, in the California Current during 1980-84. Fish. Bull. 87, 645–652.
Castelao R. M., Barth J. A., and Mavor T. P. (2005). Flow-topography interactions in the northern California Current System observed from geostationary satellite data. Geophys. Res. Lett. 32, L24612. doi: 10.1029/2005GL024401
Chavez F., Ryan J., Lluch-Cota S., and Niquen M. (2003). From anchovies to sardines and back: multidecadal change in the Pacific Ocean. Science 299, 217–221. doi: 10.1126/science.1075880
Checkley D. M. Jr. and Barth J. A. (2009). Patterns and processes in the california current system. Prog. Oceanogr. 83, 49–64. doi: 10.1016/j.pocean.2009.07.028
Checkley D. M., Dotson R. C., and Griffith D. A. (2000). Continuous, underway sampling of eggs of Pacific sardine (Sardinops sagax) and northern anchovy (Engraulis mordax) in spring 1996 and 1997 off southern and central California. Deep Sea Res. Part II Top. Stud. Oceanogr. 47, 1139–1155. doi: 10.1016/S0967-0645(99)00139-3
Cowen R. K. and Guigand C. M. (2008). In situ ichthyoplankton imaging system (ISIIS): system design and preliminary results. Limnol. Oceanogr. Methods 6, 126–132. doi: 10.4319/lom.2008.6.126
Cury P., Bakun A., Crawford R. J. M., Jarre A., Quiñones R. A., Shannon L. J., et al. (2000). Small pelagics in upwelling systems: patterns of interaction and structural changes in ‘wasp-waist’ ecosystems. ICES J. Mar. Sci. 57, 603–618. doi: 10.1006/jmsc.2000.0712
Cury P. and Roy C. (1989). Optimal environmental window and pelagic fish recruitment success in upwelling areas. Can. J. Fish. Aquat. Sci. 46, 670–680. doi: 10.1139/f89-086
Dower J., Pepin P., and Kim G. (2008). Covariation in feeding success, size-at-age and growth in larval radiated shanny (Ulvaria subbifurcata): Insights based on individuals. J. Plankton Res. 31, 235–247. doi: 10.1093/plankt/fbn118
Emmett R. L., Brodeur R. D., Miller T. W., Pool S. S., Krutzikowsky G. K., Bentley P. J., et al. (2005). Pacific sardine (Sardinops sagax) abundance, distribution, and ecological relationships in the Pacific Northwest. CalCOFI Rep. 46, 122–143.
Feigenbaum D. and Maris R. (1984). Feeding in the chaetognatha. Oceanogr. Mar. Biol. Annu. Rev. 22, 343–392.
Folkvord A. and Hunter J. (1986). Size specific vulnerability of northern anchovy (Engraulis mordax) larvae to predation by fishes. Fish. Bull. 84, 859–869.
Gentemann C. L., Fewings M. R., and García-Reyes M. (2017). Satellite sea surface temperatures along the West Coast of the United States during the 2014–2016 northeast Pacific marine heat wave. Geophys. Res. Lett. 44, 312–319. doi: 10.1002/2016GL071039
Glaser S. M. (2011). Do albacore exert top-down pressure on northern anchovy? Estimating anchovy mortality as a result of predation by juvenile north pacific albacore in the California Current System. Fish. Oceanogr. 20, 242–257. doi: 10.1111/j.1365-2419.2011.00582.x
Guigand C. M., Cowen R. K., Llopiz J. K., and Richardson D. E. (2005). A coupled asymmetrical multiple opening closing net with environmental sampling system. Mar Technol. Soc. J. 39, 22–24. doi: 10.4031/002533205787444042
Hakanson J. (1989). Condition of larval anchvy (Engraulis mordax) in the Southern California Bight, as measured through lipid analysis. Mar. Biol. 102, 153–159.
Hare J. A. and Cowen R. K. (1997). Size, growth, development, and survival of the planktonic larvae of Pomatomus saltatrix (Pisces: Pomatomidae). Ecology 78, 2415–2431. doi: 10.1890/0012-9658(1997)078[2415:SGDASO]2.0.CO;2
Hooff R. C. and Peterson W. T. (2006). Copepod biodiversity as an indicator of changes in ocean and climate conditions of the northern California Current Ecosystem. Limnol Oceanogr 51, 2607–2620. doi: 10.4319/lo.2006.51.6.2607
Houde E. D. (1987). Fish early life dynamics and recruitment variability. Am. Fish. Soc Symp. 2, 17–29.
Houde E. D. (2008). Emerging from hjort’s shadow. Fish. Sci. J. Northw. Atl. Fish. Sci. 41, 53–70. doi: 10.2960/J.v41.m634
Hunter J. R. (1972). Swimming and feeding behavior of larval anchovy Engraulis mordax. Fish. Bull. 70, 821–838.
Hunter J. and Kimbrell C. (1980). Egg cannibalism in the northern anchovy, Engraulis mordax. Fish. Bull. 78, 811–816.
Jackson J. M. and Lenz P. H. (2016). Predator-prey interactions in the plankton: larval fish feeding on evasive copepods. Sci. Rep. 6, 33585. doi: 10.1038/srep33585
Kahru M., Jacox M. G., and Ohman M. D. (2018). CCE1: Decrease in the frequency of oceanic fronts and surface chlorophyll concentration in the California Current System during the 2014–2016 northeast Pacific warm anomalies. Deep Sea Res. Part I Oceanogr. Res. Pap. 140, 4–13. doi: 10.1016/j.dsr.2018.04.007
Kelley D. and Richards C. (2021). gsw. R package version 1.0-6. Available online at: https://cran.r-project.org/web/packages/gsw/index.html (Accessed November 1, 2021).
Koehn L. E., Essington T. E., Marshall K. N., Kaplan I. C., Sydeman W. J., Szoboszlai A. I., et al. (2016). Developing a high taxonomic resolution food web model to assess the functional role of forage fish in the California Current ecosystem. Ecol. Model 335, 87–100. doi: 10.1016/j.ecolmodel.2016.05.010
Lamb J. and Peterson W. (2005). Ecological zonation of zooplankton in the COAST study region off central Oregon in June and August 2001 with consideration of retention mechanisms. J. Geophys. Res. 110, C10S15. doi: 10.1029/2004JC002520
Lasker R. (1975). Field criteria for survival of anchovy larvae: the relation between inshore chlorophyll maximum layers and successful first feeding. Fish. Bull. 73, 453–462.
Lasker R. (1978). The relation between oceanographic conditions, and larval anchovy food in the California Current: Identification of factors contributing to recruitment failure. Rapp. P-V Reun. Cons. Int. Explo. Mer. 173, 212–230.
Lasker R. (1981). Factors contributing to variable recruitment of the nothern anchovy (Engraulis mordax) in the California Current: Contrasting years,1975 through 1978. Rapp. P-V Reun. Cons. Int. Explo. Mer. 178, 375–388.
Leggett W. and Deblois E. (1994). Recruitment in marine fishes: is it regulated by starvation and predation in the egg and larval stages? Netherlands J. Sea Res. 32, 119–134. doi: 10.1016/0077-7579(94)90036-1
Litz M. N., Emmett R. L., Heppell S. S., and Brodeur R. D. (2008). Ecology and distribution of the Northern subpopulation of Northern anchovy (Engraulis mordax) off the U.S. West Coast. CalCOFI Rep. 49, 167–182.
Llopiz J. K. (2013). Latitudinal and taxonomic patterns in the feeding ecologies of fish larvae: a literature synthesis. J. Mar. Syst. 109–110, 69–77. doi: 10.1016/j.jmarsys.2012.05.002
Lluch-Belda D., Crawford R., Kawasaki T., Maccall A., Parrish R., Schwartzlose R., et al. (1989). World-wide fluctuations of sardine and anchovy stocks: the regime problem. South Afr. J. Mar. Sci. 8, 195–205. doi: 10.2989/02577618909504561
Logerwell E., Mantua N., Lawson P., Francis R., and Agostini V. (2003). Tracking environmental processes in the coastal zone for understanding and predicting Oregon coho (Oncorhynchus kisutch) marine survival. Fish. Oceanogr. 12, 554–568. doi: 10.1046/j.1365-2419.2003.00238.x
Luo J. Y., Grassian B., Tang D., Irisson J.-O., Greer A. T., Guigand C. M., et al. (2014). Environmental drivers of the fine-scale distribution of a gelatinous zooplankton community across a mesoscale front. Mar. Ecol. Prog. Ser. 510, 129–149. doi: 10.3354/meps10908
Luo J. Y., Irisson J.-O., Graham B., Guigand C., Sarafraz A., Mader C., et al. (2018). Automated plankton image analysis using convolutional neural networks. Limnol. Oceanogr. Methods 16, 814–827. doi: 10.1002/lom3.v16.12
McClatchie S., Cowen R. K., Nieto K., Greer A., Luo J. Y., Guigand C., et al. (2012). Resolution of fine biological structure including small narcomedusae across a front in the Southern California Bight. J. Geophys. Res. Ocean 117, 1–18. doi: 10.1029/2011JC007565
Methot R. D. (1981). Spatial covariation of daily grow th rates of larval northern anchovy, Engraulis mordax, and larval northern lampfish, Stenobrachius leucopsarus. Rapp. P-V Reun. Cons. Int. Explo. Mer. 178, 424–431.
Methot R. D. and Kramer D. (1979). Growth of northern anchovy, Engraulis mordax, larvae in the sea. Fish. Bull. 77, 413–423.
Miller T., Crowder L., Rice J., and Marschall E. (1988). Larval size and recruitment mechanisms in fishes: toward a conceptual framework. Can. J. Fish. Aquat. Sci. 45, 1657–1670. doi: 10.1139/f88-197
Miller J. A. and Shanks A. L. (2004). Ocean-estuary coupling in the Oregon upwelling region: abundance and transport of juvenile fish and of crab megalopae. Mar. Ecol. Prog. Ser. 271, 267–279. doi: 10.3354/meps271267
Morgan C. A., Peterson W. T., and Emmett R. L. (2003). Onshore-offshore variations in copepod community structure off the Oregon coast during the summer upwelling season. Mar. Ecol. Prog. Ser. 249, 223–236. doi: 10.3354/meps249223
Morote E., Olivar M. P., Villate F., and Uriarte I. (2010). A comparison of anchovy (Engraulis encrasicolus) and sardine (Sardina pilchardus) larvae feeding in the Northwest Mediterranean: influence of prey availability and ontogeny. ICES J. Mar. Sci. 67, 897–908. doi: 10.1093/icesjms/fsp302
Moser H. (1996). The early life stages of fishes in the California Current Region, California Cooperative Oceanic Fisheries Investigations Atlas No. 33 (CALCOFI) (La Jolla, California: United States Department of Commerce National Oceanic and Atmospheric Administration, National Marine Fisheries Service, Southwest Fisheries Science Center).
Muhling B. A., Brodie S., Smith J. A., Tommasi D., Gaitan C. F., Hazen E. L., et al. (2020). Predictability of species distributions deteriorates under novel environmental conditions in the California Current System. Front. Mar. Sci. 7. doi: 10.3389/fmars.2020.00589
Parnel M. M., Emmett R. L., and Brodeur R. D. (2008). Ichthyoplankton community in the Columbia River plume off Oregon: effects of fluctuating oceanographic conditions. Fish. Bull. 106, 161–173.
Parrish R. H., Nelson C. S., and Bakun A. (1981). Transport mechanisms and reproductive success of fishes in the California Current. Biol. Oceanogr. 1, 175–203.
Pepin P., Robert D., Bouchard C., Dower J. F., Falardeau M., Fortier L., et al. (2015). Once upon a larva: revisiting the relationship between feeding success and growth in fish larvae. ICES J. Mar. Sci. 72, 359–373. doi: 10.1093/icesjms/fsu201
Peterson W. T., Fisher J. L., Peterson J. O., Morgan C. A., Burke B. J., and Fresh K. L. (2014). Applied fisheries oceanography: ecosystem indicators of ocean conditions inform fisheries management in the california current. Oceanography 27, 80–89. doi: 10.5670/oceanog.2014.88
Peterson W. T. and Miller C. B. (1977). Seasonal cycle of zooplankton abundance and species composition along the central Oregon coast. Fish. Bull. 75, 717–724.
Peterson W. T. and Schwing F. B. (2003). A new climate regime in northeast pacific ecosystems. Geophys. Res. Lett. 30, 1–4. doi: 10.1029/2003GL017528
Purcell J. E. (1985). Predation on fish eggs and larvae by pelagic cnidarians and ctenophores. Bull. Mar. Sci. 37, 739–755.
Purcell J. E. and Arai M. N. (2001). Interactions of pelagic cnidarians and ctenophores with fish: a review. Hydrobiologia 451, 27–44. doi: 10.1023/A:1011883905394
Purcell J. E. and Grover J. J. (1990). Predation and food limitation as causes of mortality in larval herring at a spawning ground in British Columbia. Mar. Ecol. Prog. Ser. 59, 55–61. doi: 10.3354/meps059055
Purcell J. E., Nemazie D., Dorsey S., Houde E., and Gamble J. (1994). Predation mortality of bay anchovy Anchoa mitchilli eggs and larvae due to scyphomedusae and ctenophores in Chesapeake Bay. Mar. Ecol. Prog. Ser. 114, 47–58. doi: 10.3354/meps114047
Richardson S. L. (1973). Abundance and distribution of larval fishes in waters off Oregon, MayO-October 1969, with special emphasis on the northern anchovy, Engraulis mordax. Fish Bull. 71, 697–711.
Richardson S. L. (1981). Spawning biomass and early life of northern anchovy, Engraulis mordax, in the northern subpopulation off Oregon and Washington. Fish. Bull. 78, 855–876.
Robert D., Castonguay M., and Fortier L. (2009). Effects of preferred prey density and temperature on feeding success and recent growth in larval mackerel of the southern Gulf of St. Lawrence. Mar. Ecol. Prog. Ser. 377, 227–237. doi: 10.3354/meps07833
Robert D., Pepin P., Dower J., and Fortier L. (2014). Individual growth history of larval Atlantic mackerel is reflected in daily condition indices. ICES J. Mar. Sci. 71, 1001–1009. doi: 10.1093/icesjms/fst011
Roy C., Cury P., and Kifani S. (1992). Pelagic fish recruitment success and reproductive strategy in upwelling areas: environmental compromises. South Afr. J. Mar. Sci. 12, 135–146. doi: 10.2989/02577619209504697
Rykaczewski R. and Checkley D. (2008). Influence of winds on the pelagic ecosystem in upwelling regions. PNAS. 105, 1965–1970. doi: 10.1073/pnas.0711777105
Sato M., Barth J. A., Benoit-Bird K. J., Pierce S. D., Cowles T. J., Brodeur R. D., et al. (2018). Coastal upwelling fronts as a boundary for planktivorous fish distributions. Mar. Ecol. Prog. Ser. 595, 171–186. doi: 10.3354/meps12553
Schmid M. S., Cowen R. K., Robinson K., Luo J. Y., Briseño-Avena C., and Sponaugle S. (2020). Prey and predator overlap at the edge of a mesoscale eddy: fine-scale, in-situ distributions to inform our understanding of oceanographic processes. Sci. Rep. 10, 921. doi: 10.1038/s41598-020-57879-x1
Schmid M. S., Daprano D., Jacobson K. M., Sullivan C., Briseño-Avena C., Luo J. Y., et al. (2021). A Convolutional Neural Network based high-throughput image classification pipeline - code and documentation to process plankton underwater imagery using local HPC infrastructure and NSF’s XSEDE (Corvallis, Oregon: Zenodo).
Schmid M. S., Sponaugle S., Thompson A. W., Sutherland K. R., and Cowen R. K. (2023). Drivers of plankton community structure in intermittent and continuous coastal upwelling systems – from microbes and micro-scale in situ imaging to large scale patterns. Front. Mar. Sci. 10. doi: 10.3389/fmars.2023.1166629
Schwartzlose R. A., Alheit J., Bakun A., Baumgartner T. R., Cloete R., Crawford R. J. M., et al. (1999). Worldwide large-scale fluctuations of sardine and anchovy populations. South Afr. J. Mar. Sci. 21, 289–347. doi: 10.2989/025776199784125962
Scura E. and Jerde C. (1977). Various species of phytoplankton as food for larval northern anchovy, Engraulis mordax, and relative nutritional value of the dinoflagellates Gymnodinium splendens and Gonyaulax polyedra. Fish. Bull. 75, 577–583.
Spitz Y. and Allen J. (2005). Modeling of ecosystem processes on the Oregon shelf during the 2001 summer upwelling. J. Geophys. Res. 110, C10S17. doi: 10.1029/2005JC002870
Sponaugle S., Boulay J., and Rankin T. (2011). Growth- and size-selective mortality in pelagic larvae of a common reef fish. Aquat. Biol. 13, 263–273. doi: 10.3354/ab00370
Sponaugle S., Llopiz J. K., Havel L. N., and Rankin T. L. (2009). Spatial variation in larval growth and gut fullness in a coral reef fish. Mar. Ecol. Prog. Ser. 383, 239–249. doi: 10.3354/meps07988
Sponaugle S., Walter K. D., Denit K. L., Llopiz J. K., and Cowen R. K. (2010). Variation in pelagic larval growth of Atlantic billfishes: the role of prey composition and selective mortality. Mar. Biol. 157, 839–849. doi: 10.1007/s00227-009-1366-z
Swieca K., Sponaugle S., Briseño-Avena C., Schmid M., Brodeur R. D., and Cowen R. K. (2020). Changing with the tides: fine-scale larval fish prey availability and predation pressure near a tidally modulated river plume. Mar. Ecol. Prog. Ser. 650, 217–238. doi: 10.3354/meps13367
Swieca K., Sponaugle S., Schmid M., Ivory J., Corrales-Ugalde M., Sutherland K. R., et al. (2023). Growth and diet of a larval myctophid across dinstinct upwelling regimes in the California Current. ICES J. Mar. Sci. 80, 1431–1446. doi: 10.1093/icesjms/fsad070
Sydeman W. J., Dedman S., García-Reyes M., Thompson S. A., Thayer J. A., Bakun A., et al. (2020). Sixty-five years of northern anchovy population studies in the southern California Current: a review and suggestion for sensible management. ICES J. Mar. Sci. 77, 486–499. doi: 10.1093/icesjms/fsaa004
Takahashi M., Checkley D. M. Jr., Litz M. N., Brodeur R. D., and Peterson W. T. (2012). Responses in growth rate of larval northern anchovy (Engraulis mordax) to anomalous upwelling in the northern California Current. Fish. Oceanogr. 21, 393–404. doi: 10.1111/j.1365-2419.2012.00633.x
Takasuka A., Sakai A., and Aoki I. (2017). Dynamics of growth-based survival mechanisms in Japanese anchovy (Engraulis japonicus) larvae. Can. J. Fish. Aquat. Sci. 74, 812–823. doi: 10.1139/cjfas-2016-0120
Thompson A. R., Schroeder I. D., Bograd S. J., Hazen E. L., Jacox M. G., Leising A., et al. (2019). State of the California Current 2018-19: a novel anchovy regime and a new marine heat wave? CalCOFI Rep. 60, 1–65.
Tomaro L., Teel D., Peterson W., and Miller J. (2012). When is bigger better? Early marine residence of middle and upper Columbia River spring Chinook salmon. Mar. Ecol. Prog. Ser. 452, 237–252. doi: 10.3354/meps09620
Vrooman A. M., Paloma P. A., and Zweifel J. R. (1981). Electrophoretic, morphometric, and meristic studies of subpopulations of northern anchovy, Engraulis mordax. Calif. Fish Game 67, 39–51.
Wood S. (2021). mgcv. R package version 1. 8-38. Available online at: https://cran.rproject.org/web/packages/mgcv/mgcv.pdf (Accessed November 1, 2021).
Keywords: northern anchovy (Engraulis mordax), trophodynamics, northern California Current, upwelling, zooplankton
Citation: Swieca K, Sponaugle S, Schmid MS, Ivory J and Cowen RK (2025) Oceanographic and trophodynamic underpinnings of anchovy success in the northern California Current. Front. Mar. Sci. 12:1558793. doi: 10.3389/fmars.2025.1558793
Received: 20 January 2025; Accepted: 22 April 2025;
Published: 15 May 2025.
Edited by:
George Jackson, Loma Linda University, United StatesReviewed by:
Laurent Marcel Cherubin, Florida Atlantic University, United StatesIain M Suthers, University of New South Wales, Australia
Copyright © 2025 Swieca, Sponaugle, Schmid, Ivory and Cowen. This is an open-access article distributed under the terms of the Creative Commons Attribution License (CC BY). The use, distribution or reproduction in other forums is permitted, provided the original author(s) and the copyright owner(s) are credited and that the original publication in this journal is cited, in accordance with accepted academic practice. No use, distribution or reproduction is permitted which does not comply with these terms.
*Correspondence: Kelsey Swieca, S2Vsc2V5LnN3aWVjYUBnbWFpbC5jb20=
†Present address: Moritz S. Schmid, Oregon Department of Fish and Wildlife, Marine Reserves Program, Newport, OR, United States
Jami Ivory, STEM Research Center, Oregon State University, Corvallis, OR, United States