 Enkang Wang1,2
 Jing Wang1
 Yonggen Sun1*Jinxia Zhao1
 Zhiwei Zhang1Guoqiang Xu1Yongqiang Zhang1,2
 Daolai Zhang3*
- 1First Institute of Oceanography, Ministry of Natural Resources, Qingdao, China
- 2College of Earth Science and Engineering, Shandong University of Science and Technology, Qingdao, China
- 3Qingdao Institute of Marine Geology, China Geological Survey, Qingdao, China
Introduction: Heavy metal(loid)s (HMs) are widespread pollutants in marine ecosystems that are disseminated through natural and anthropogenic activities.
Methods: To ascertain the extent of HM in the Yellow River estuary and its adjacent areas, the contents of seven HMs were determined in 103 surface sediments and 82 marine organisms collected in October 2022. The pollution status and potential ecological risks were analyzed and evaluated using various indicators.
Results: The results showed that, apart from Hg, all other HMS in the surface sediments had similar spatial distributions and were mainly derived from natural sources. Hg had an anthropogenic source and showed a very high potential ecological risk in the old Yellow River estuary. The average HM concentrations in marine organisms were in the order of Zn > Cu > As > Cr > Cd > Pb > Hg. Except for As and Cu in fish—which exceeded the standard at some stations—all other standard indices met the corresponding biological quality standards. The target hazard coefficients for the seven HMs were in the order of Cu > Cd > As > Zn > Cr > Hg > Pb. The target hazard coefficient of a single HM in all marine biological samples was <1, indicating that a single HM had no significant negative effects. The BSAF values of Cd and Hg in crustaceans, and Cu, Cd, and Hg in mollusks and fish were all >1, suggesting that these three organism types accumulated Cu, Cd, and Hg from surface sediments.
Conclusion: The findings of this study can serve as a theoretical foundation for the prevention and control of HM pollution in the Yellow River Basin.
1 Introduction
(HMs) are naturally occurring components of the environment that have attracted considerable attention because of their persistent pollution, non-degradability, bioenrichment, and other characteristics (Gil and Olmedo, 2023; Thorat et al., 2023). Coastal areas represent some of the most substantial human settlements worldwide, and as human activities in these areas intensify, HMs are being introduced into the ocean through several pathways, including land-based runoff, atmospheric deposition, and industrial wastewater discharge (Rehman et al., 2021). A reduction in the hydrodynamic force may result in considerable accumulation of HM elements in sedimentary deposits. When sediment is disturbed by natural or anthropogenic factors, the HMs present therein are released back into the overlying water, thereby becoming a source of pollution. The absorption of toxic HMs by marine organisms can result in their incorporation into the food chain with potential adverse effects on human health. Thus, it is of great importance to study the content and distribution of HMs in surface sediments and organisms to gain insight into status of pollution and human activities in coastal waters (Onakpa et al., 2018; Strode et al., 2017).
The Yellow River is the second longest river in China and has the highest suspended sediment content worldwide (Cheng et al., 2019). Annually, a considerable quantity of sediment is transported into estuaries, which affects the environment of wetlands and nearby sea areas (Chen et al., 2021). Previous studies have postulated that the HM content in the sea area near the Yellow River estuary is predominantly influenced by natural processes (Feng et al., 2011; Li et al., 1985; Liang et al., 2018; Wu et al., 2007). However, studies have shown that certain areas along the Yellow River, particularly near industrial zones and urban centers, exhibit elevated concentrations of heavy metals in water, sediments, and soil (Wang et al., 2022; Wu et al., 2022). Recently, there has been a gradual improvement in the ecological environment of the Yellow River basin, accompanied by a decrease in sediment discharge from the Yellow River to the estuary (Sun et al., 2015; Tang et al., 2010). Concurrently, the rapid economic development of the Yellow River basin has resulted in an increase in pollutants discharged into the river (Liu et al., 2020). However, there has been a paucity of comprehensive studies on HMs in the Yellow River estuary in recent years. Most studies have focused on surface sediments, with a dearth of research on the status of HMs in organisms and their interactions with the environment. Therefore, this study presents an analysis of the content and spatial distribution characteristics of seven HM elements in surface sediments and organisms in the Yellow River estuary and its adjacent areas. The objective is to evaluate the status and potential ecological risks associated with HM pollution.
2 Materials and methods
2.1 Sampling and analytical methods
In October 2022, 103 surface sediment samples from the Yellow River estuary and its adjacent areas were collected, along with 82 biological samples from the same locations (Figure 1). Sample collection, storage, transportation, and processing were conducted in accordance with the stipulations in the Marine Monitoring Code, Part 3 (GB 17378.3-2007). Surface sediment samples were collected using a grab-type mud sampler, whereas upper layer (0–5 cm) sediment samples were placed in bags and frozen for storage.
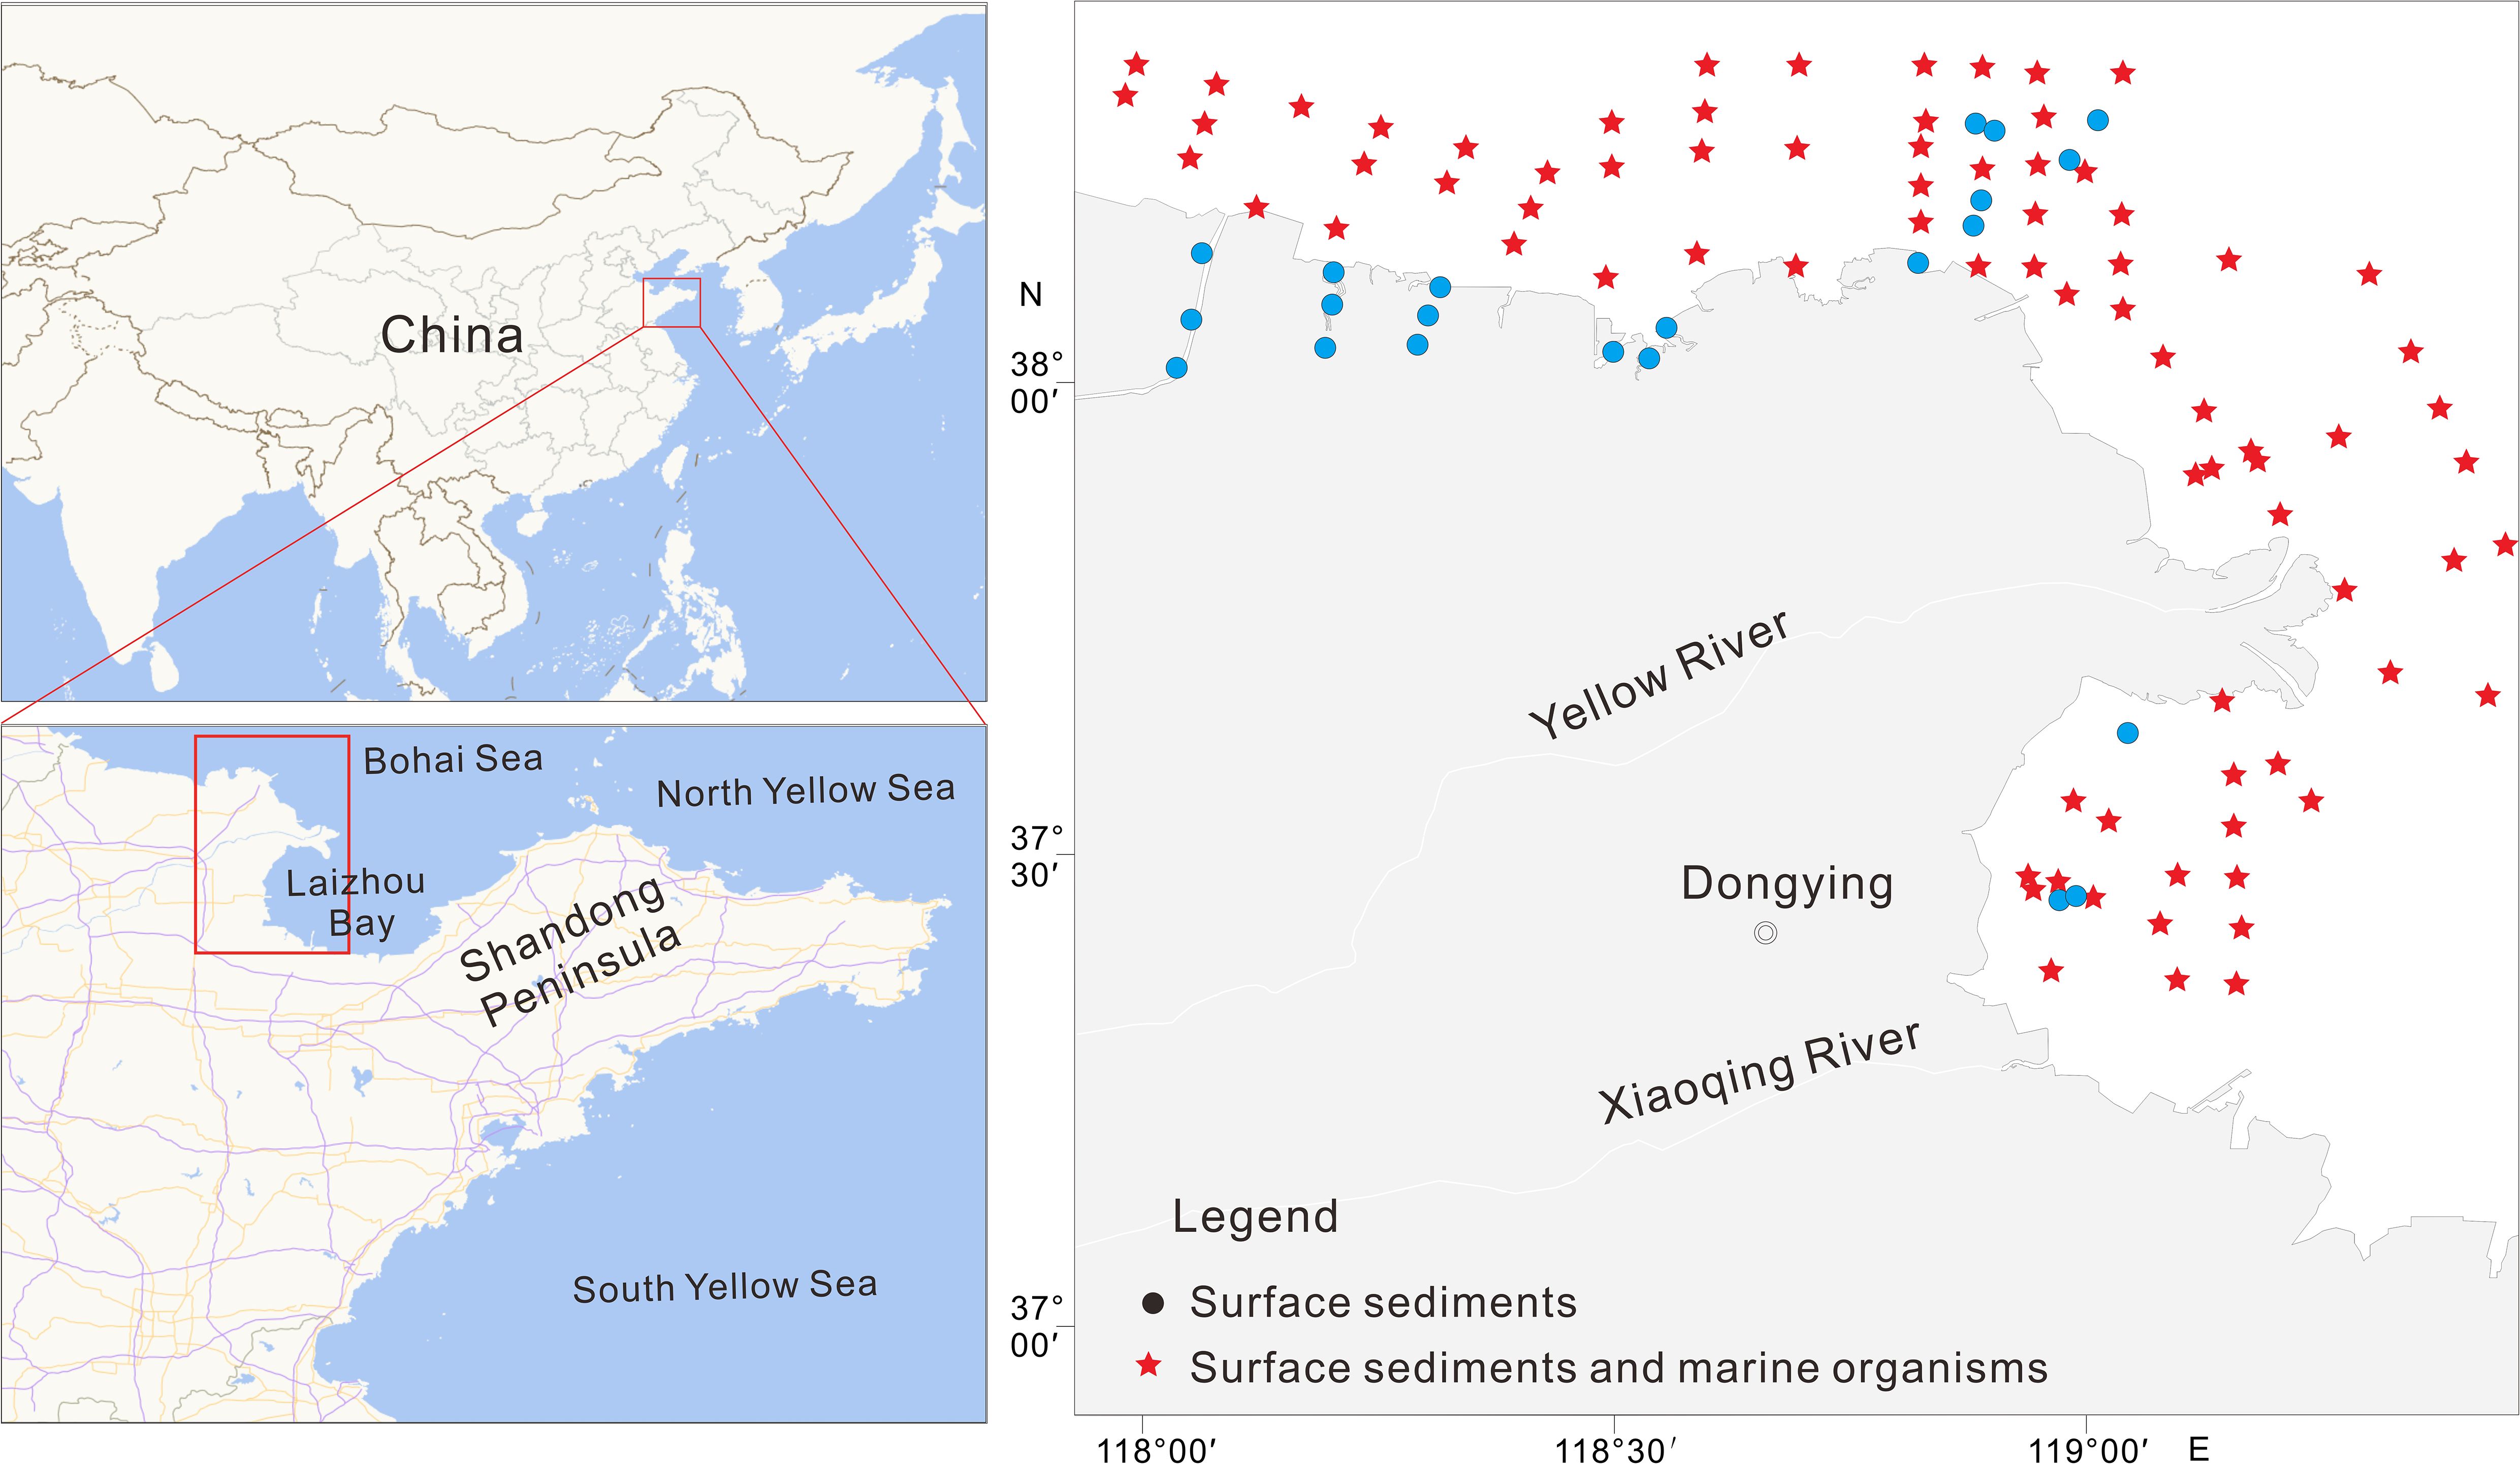
Figure 1. Surface sediment and marine organism sampling sites in the Yellow River estuary and its adjacent areas.
The biological samples were collected using a single vessel equipped with a wing and a single bag bottom trawl (40 × 94/49.3 m) at an average towing speed of 3.0 knots and for ~1 h of trawling time. Biological samples were identified to the species level and measurements, including body length and mass, were recorded as biological indicators. Subsequently, the samples were classified, refrigerated, and transported to the laboratory for analysis. The pectoral fins of fishes, head muscles of cephalopods, claw muscles of crabs, closed-shell muscles of bivalves, and shell muscles of gastropods were extracted from the samples. Subsequently, the muscle tissues were washed with ultra-pure water and frozen in 10 mL centrifuge tubes, which were then stored in a refrigerator. The digestion process for the biological samples was conducted in accordance with the analytical methods outlined in the standard “pretreatment for analysis of heavy metals in marine sediments and marine organisms” (HY/T132-2010). For each digestion cycle, 0.1 g of biological sample was taken along with 9 mL of nitric acid and 3 mL of hydrogen peroxide, which constituted the digestion solution. The specific operation is as follows: Place the weighed sample in the sample tank, add the digestion solution, and after the reaction stabilizes, cover and tighten the lid, then put it into the microwave digestion instrument and digest under the selected working conditions (heating: the first step is 120°C, heating time 5 minutes, hold for 5 minutes; the second step is 175°C, heating time 5 minutes, hold for 25 minutes). After the temperature inside the tank reaches equilibrium with the room temperature, take it out, vent it, and transfer the sample digestion solution into a polytetrafluoroethylene container. Heat it on an electric hot plate at 130°C to drive off the acid until it is nearly dry. Quantitatively transfer the solution and residue into a 25.0 ml colorimetric tube, dilute to the 25 ml mark with 1% nitric acid solution, shake well, and set it aside for use on the instrument. Simultaneously, carry out the pretreatment of blank reagents and quality control samples.
The collected biological samples were species identified. The types of organisms were divided into three categories, including crustaceans, mollusks, and fishes. Six stations are crustaceans, including Oratosquilla oratoria and Eriocheir sinensis. Twelve stations are mollusks, including Ostreidae, Rapana venosa, and Loligo japonica. Fifty-four stations are fishes, including Chaeturichthys stigmatias, Lateolabrax maculatus, Synechogobius hasta, Pleuronecttes bicoloratus, and Lateolabrax japonicas.
Six elements—Cu, Pb, Zn, Cd, Cr, and As were analyzed using inductively coupled plasma mass spectrometry (Thermo X Series 2, USA), whereas Hg was analyzed using atomic fluorescence spectrometry (AFS-920, China). The detection limit for Cu, Pb, Zn, Cr, Cd, As, and Hg in sediments and organisms are 0.008, 0.07, 6, 0.07, 0.015, 0.06, 0.002 ng/g and 0.08, 0.03, 1.66, 0.3, 0.03, 0.1, 0.002 ng/g, respectively. Total organic carbon (TOC) was analyzed using the potassium dichromate oxidation-reduction capacity method. An offshore sediment standard material (GBW07314) was employed to ensure the quality of the sample analysis. The concentration difference between the measured value and the standard value and the error of repeated measurement are controlled within 10% and 5% respectively, in order to ensure the accuracy and precision of the experimental results. The recovery rate of all elements is between 90% and 110%, ensuring the reliability and consistency of the measurement.
2.2 Analytical assessment method
2.2.1 Pollution assessment
The geoaccumulation index (Igeo), single-factor pollution index (Pi), and principal component analysis (PCA) were used to evaluate the degree of HM pollution (Bramha et al., 2025). Spatial data visualization was achieved using Surfer 23.0 software for generating planar distribution maps, while statistical analyses including principal component analysis and Pearson correlation analysis were performed using SPSS 27.0 (IBM Corp.). Microsoft Excel 2016 (Microsoft Corp.) was employed for preliminary data processing and descriptive statistical calculations.
Igeo was calculated as follows (Equation 1):
The background values of Bn for HMs were derived from the elemental baseline in the soil of the Shandong Province, China (China National Environmental Monitoring Center (CNEMC), 1990). The Igeo classification consists of seven classes, from uncontaminated (Igeo≤ 0) to seriously contaminated (Igeo > 5), following the criteria established by Muller (1981).
In accordance with the “Marine Biological Quality” (GB18421-2001) standard, the single factor pollution index method was employed to assess the extent of HM contamination in marine organisms and the calculation formula is as follows (Equation 2):
The single pollution index (Pi) was calculated using the measured concentration of pollutants (Ci) and the evaluation standard or reference value of the pollutants (Si). The evaluation criteria for HMs in crustaceans, mollusks (except shellfish), and fish were based on biological quality standards set out in the “concise regulations for comprehensive survey of coastal and sea surface resources in China”. The relevant standard values are listed in Table 1. Currently, there are no clear grading standards in China, and it is commonly accepted that when Pi is<1.0, the biological mass meets the standard. However, when Pi is >1.0, the biological mass exceeds the standard (Xavier et al., 2020).
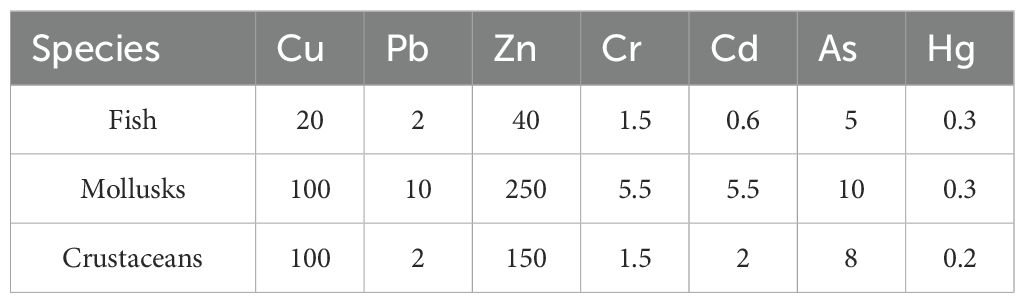
Table 1. Various types of biological evaluation standards (units: μg/g, wet weight).
2.2.2 Risk assessment
The potential ecological risk index (RI) shows the degree of HM contamination in sediments based on the potential toxicity of HMs and environmental responses. It considers not only the measured and background concentrations of different metal(loid)s but also their unique toxicities and combined ecological risks (Hakanson, 1980). The RI was calculated as follows (Equation 3):
Based on the potential ecological risk, and RI were classified into five and four grades, respectively (Table 2).
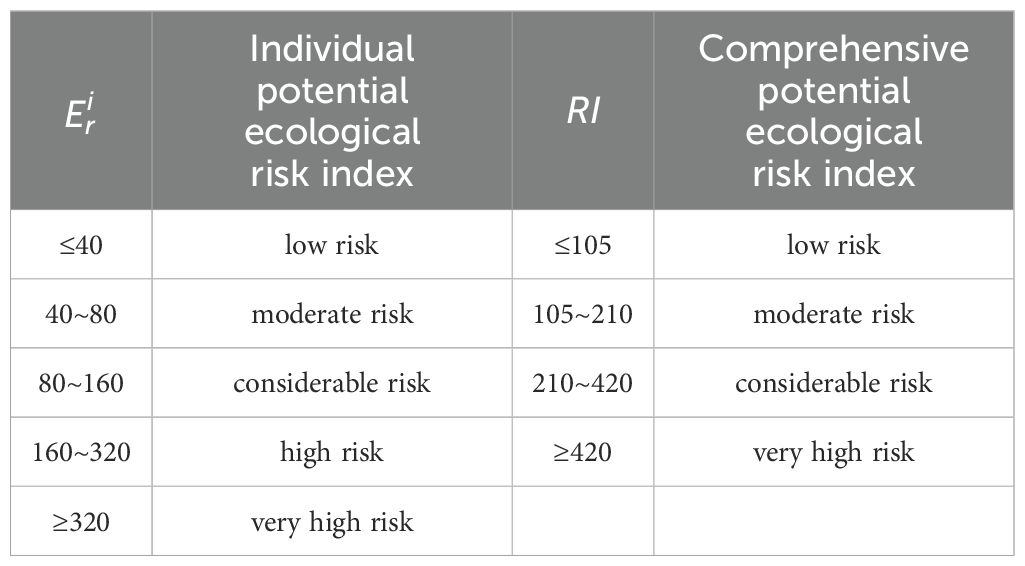
Table 2. Classification criteria of potential ecological risk indices.
The target hazard quotient (THQ) is the health risk assessment model recommended by the United States Environmental Protection Agency (US EPA). It is employed to characterize the level of non-carcinogenic risk, whereby the ratio of the pollutant exposure dose to the reference dose is utilized. The THQ can be expressed as follows (Equation 4):
where EF represents the frequency of exposure, calculated as 365 days per year; ED is defined as the length of time over which exposure occurred and was set at 70 years for adults; FIR denotes the amount of food consumed per person per day, set at 57.5 g; C is the content of HMs in organisms per g; the average body weight (BW) of Chinese adults was set at 60 kg; and TA indicates the total exposure time (365 days per year multiplied by ED). The allowable daily intake of HMs (RfD) is as follows: Cu (0.04 mg/kg/d), Pb (0.004 mg/kg/d), Zn (0.3 mg/kg/d), Cr (0.003 mg/kg/d), Cd (0.001 mg/kg/d), As (0.0003 mg/kg/d) and Hg (0.0005 mg/kg/d). A THQ value<1 indicates that there is no significant non-carcinogenic health risk associated with exposure to the specified HMs. Conversely, a THQ value >1 suggests the presence of a potential non-carcinogenic health risk in the exposed population. It is important to note that as the THQ value increases, the non-carcinogenic risk of HMs harmful to human health also increases.
In light of the fact that the impact of HMs on human health is typically the consequence of the combined action of multiple elements, it can be posited that (Equation 5):
An HI value ≤1.0 indicates that no significant negative effects are likely to occur. Conversely, an HI value >1.0 suggests that there is a high probability of adverse effects on human health, and an HI >10.0 indicates the presence of chronic toxic effects.
2.2.3 Partitioning and bioaccumulation
The biota sediment accumulation factor (BSAF) refers to the degree of enrichment of HMs by organisms in the surrounding environment. Here, BSAF was used to represent the biological concentration coefficient of HMs in the sediment with the formula as follows (Equation 6):
where Ci and Cs represent the concentration of HMs in organisms and sediments, respectively (μg/g).
3 Results and discussion
3.1 Distribution and pollution assessment of HMs in sediments
The concentrations of Cu, Pb, Zn, Cr, Cd, As, and Hg in the sediments ranged from 6.3 to 31.8, 12.3 to 30.3, 25.5 to 85.2, 28.9 to 71.6, 0.054 to 0.334, 6.02 to 19.2, and 0.004 to 0.474 mg/kg, respectively (means of 15.99 ± 5.6, 18.13 ± 4.2, 51.31 ± 14.9, 49.23 ± 8.5, 0.12 ± 0.04, 10.23 ± 2.6, and 0.06 ± 0.09 mg/kg, respectively; Table 3). Except for Cd and Hg, the average concentrations of the other five HMs in the Yellow River and its adjacent areas were lower than those along the Dongying coast (Wu et al., 2022) and Laizhou Bay (Duan et al., 2021). The Cd concentration in the intertidal zones of the Yellow River estuary (Yu et al., 2023) was higher than that in the study area. Cd, As, and Hg concentrations were above the elemental baseline in the Shandong Peninsula soils (China National Environmental Monitoring Center (CNEMC), 1990). The concentrations of all HMs in the surface sediments of the Yellow River estuary and its adjacent areas were found to be below the limits specified in GB 18668-2002 (Administration of quality supervision, inspection and quarantine of the People's Republic of China (AQSIQ), 2002).
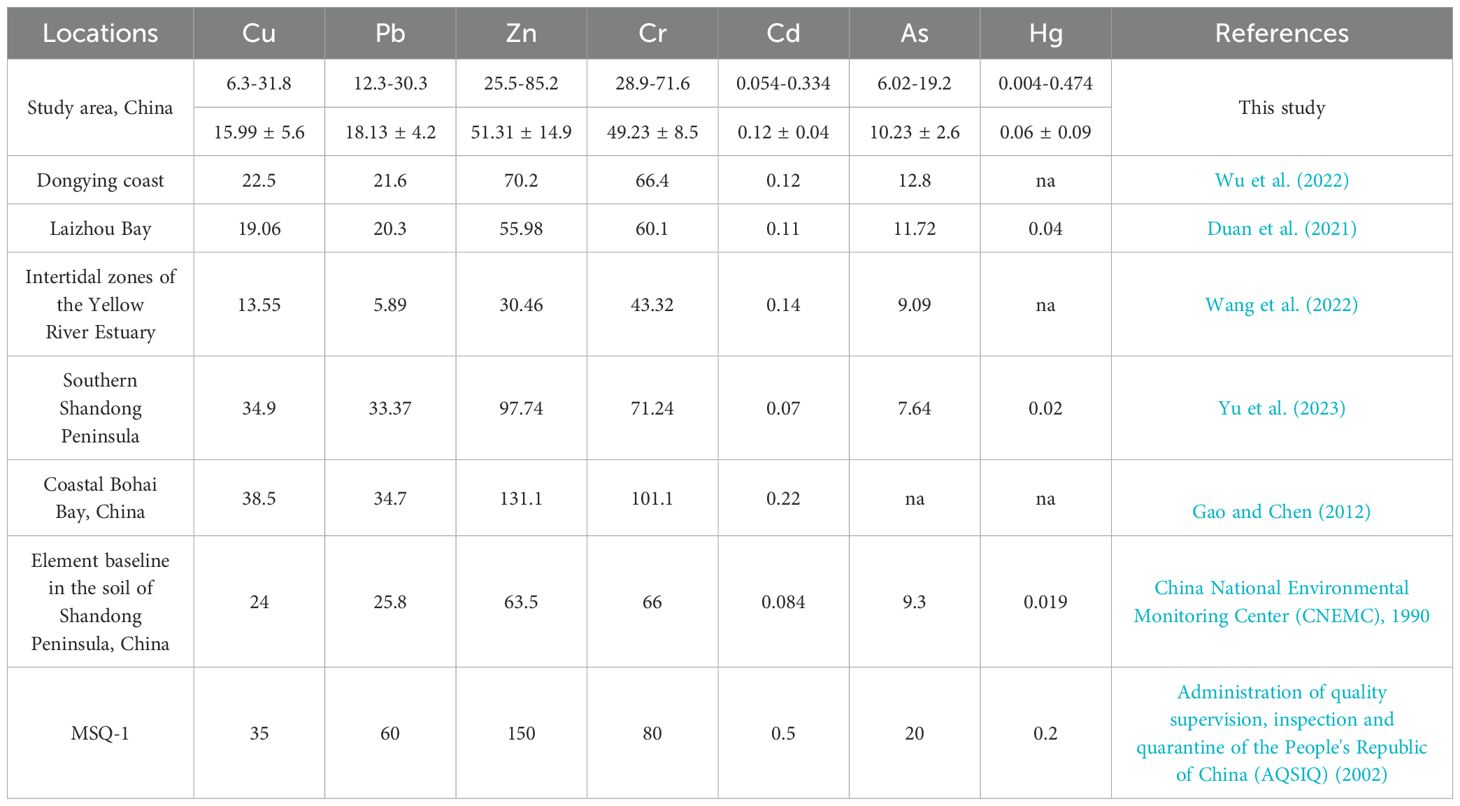
Table 3. HM contents in the surface sediment in Yellow River estuary and nearby areas (units: mg/kg).
The spatial distribution of HMs in the sediments of the Yellow River estuary and its adjacent areas is shown in Figure 2. In addition to Hg, the spatial distributions of other HMs were generally consistent. Two high-value areas were observed northeast of the Yellow and Xiaoqing River estuaries. The spatial distribution of Hg differed from that of the other elements, with high-value areas showing a dotted distribution north of the study area.
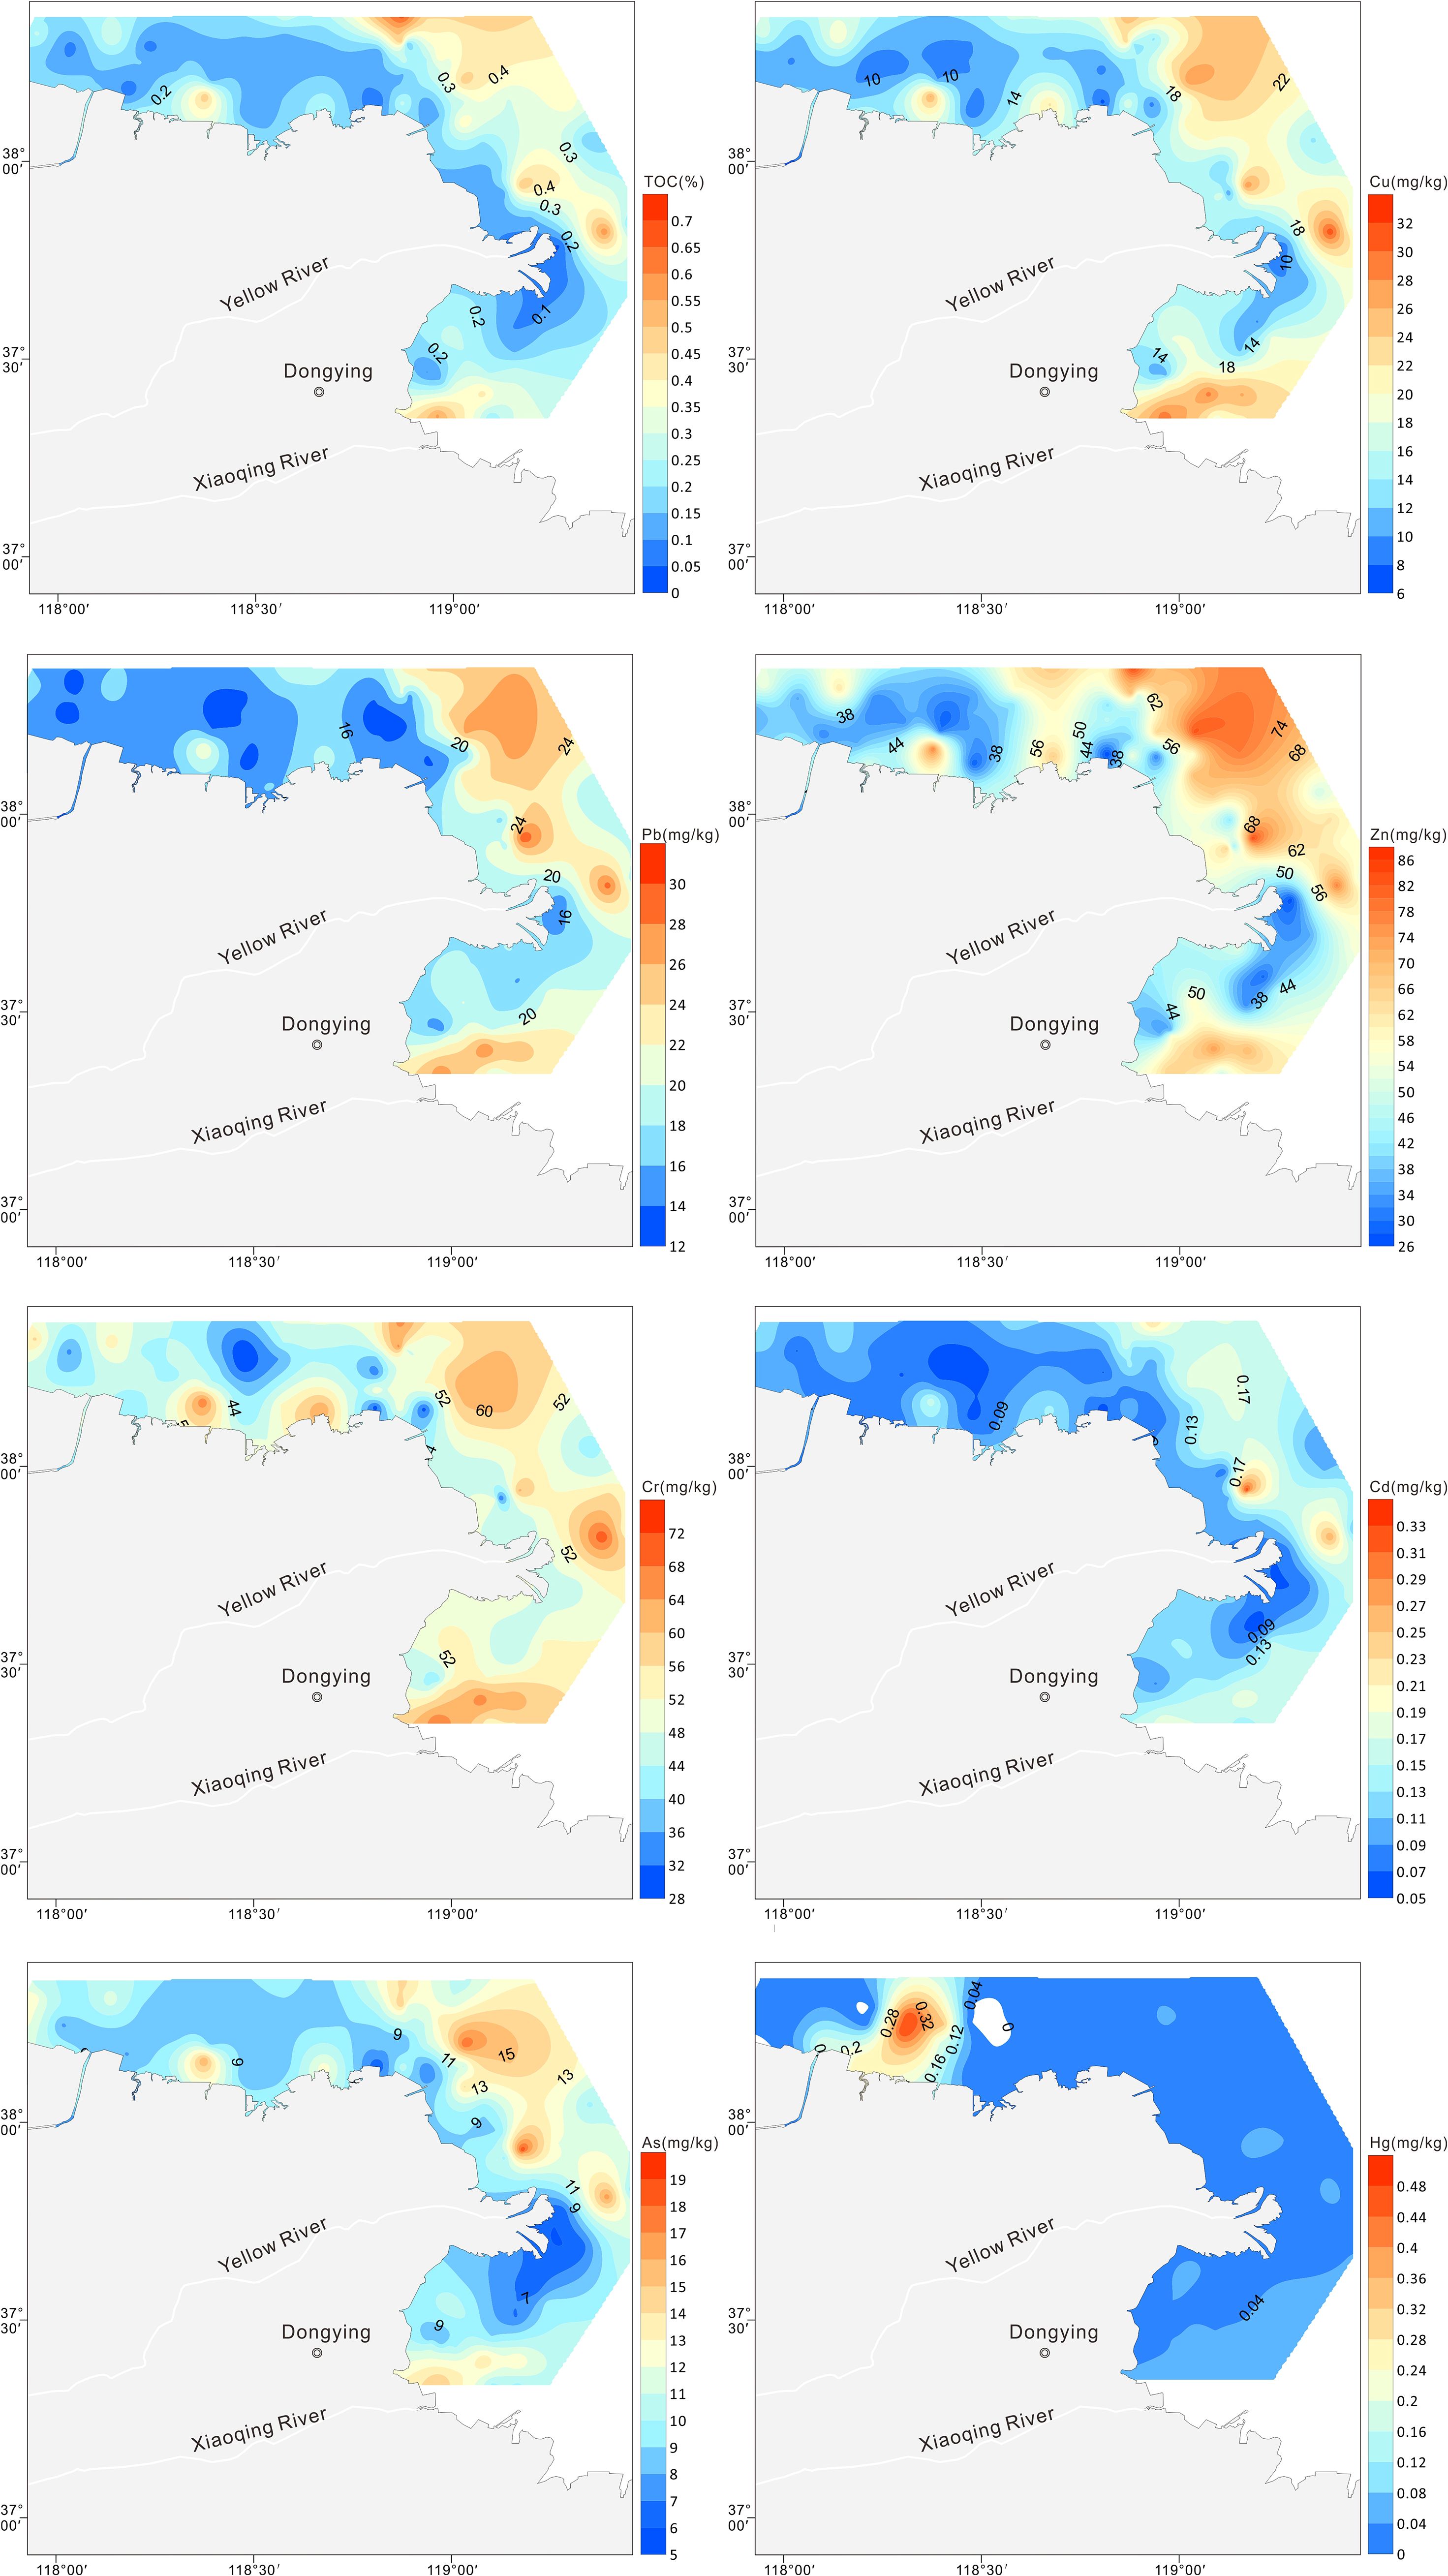
Figure 2. HMs and TOC spatial distributions in surface sediments.
The Igeo values for Cu, Pb, Zn, Cr, Cd, As, and Hg in the sediments ranged from -2.5 to -0.2, -1.7 to -0.4, -1.9 to -0.2, -1.8 to -0.5, -1.2 to 1.4, -1.2 to 0.5, and -2.8 to 4.1, respectively, with mean values of -1.26, -1.13, -0.95, -1.03, -0.19, -0.49, and -0.11 respectively (Table 4). The degree of pollution was found to be most prevalent in samples of Hg, followed by Cd, As, Zn, Cr, Pb, and Cu. The Igeo values of Cd, As, and Hg exceeded zero in 34%, 11%, and 44% of the samples, respectively (Figure 3). The sediments were found to be slightly (0–1) to moderately (1–2) polluted with Cd, As, and Hg in the northeastern parts of the Yellow River estuary and the Xiaoqing River estuary, and even locally strongly polluted (4–5) with Hg in the old Yellow River estuary.
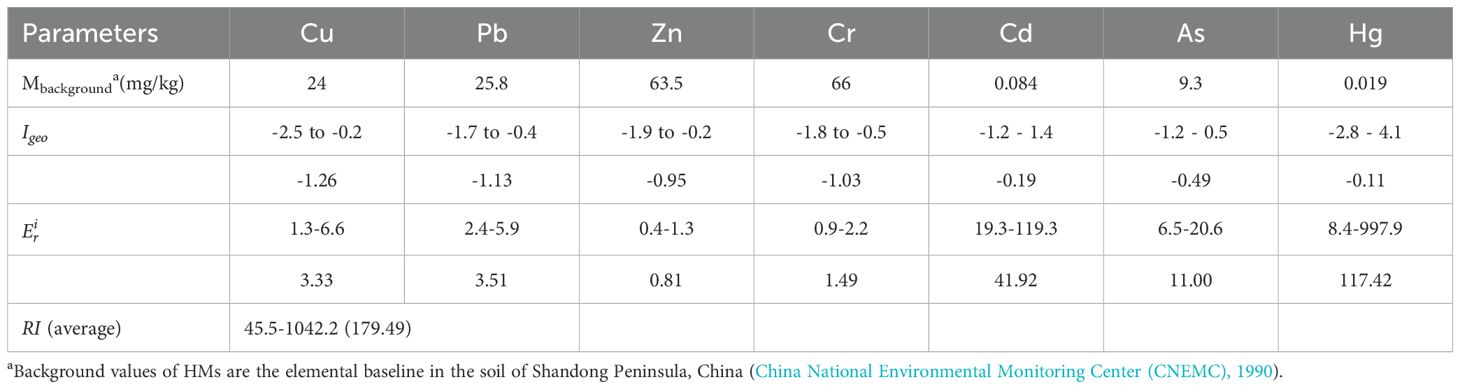
Table 4. Background value, Igeo, , RI and PINemerow values of HMs in Yellow River estuary.
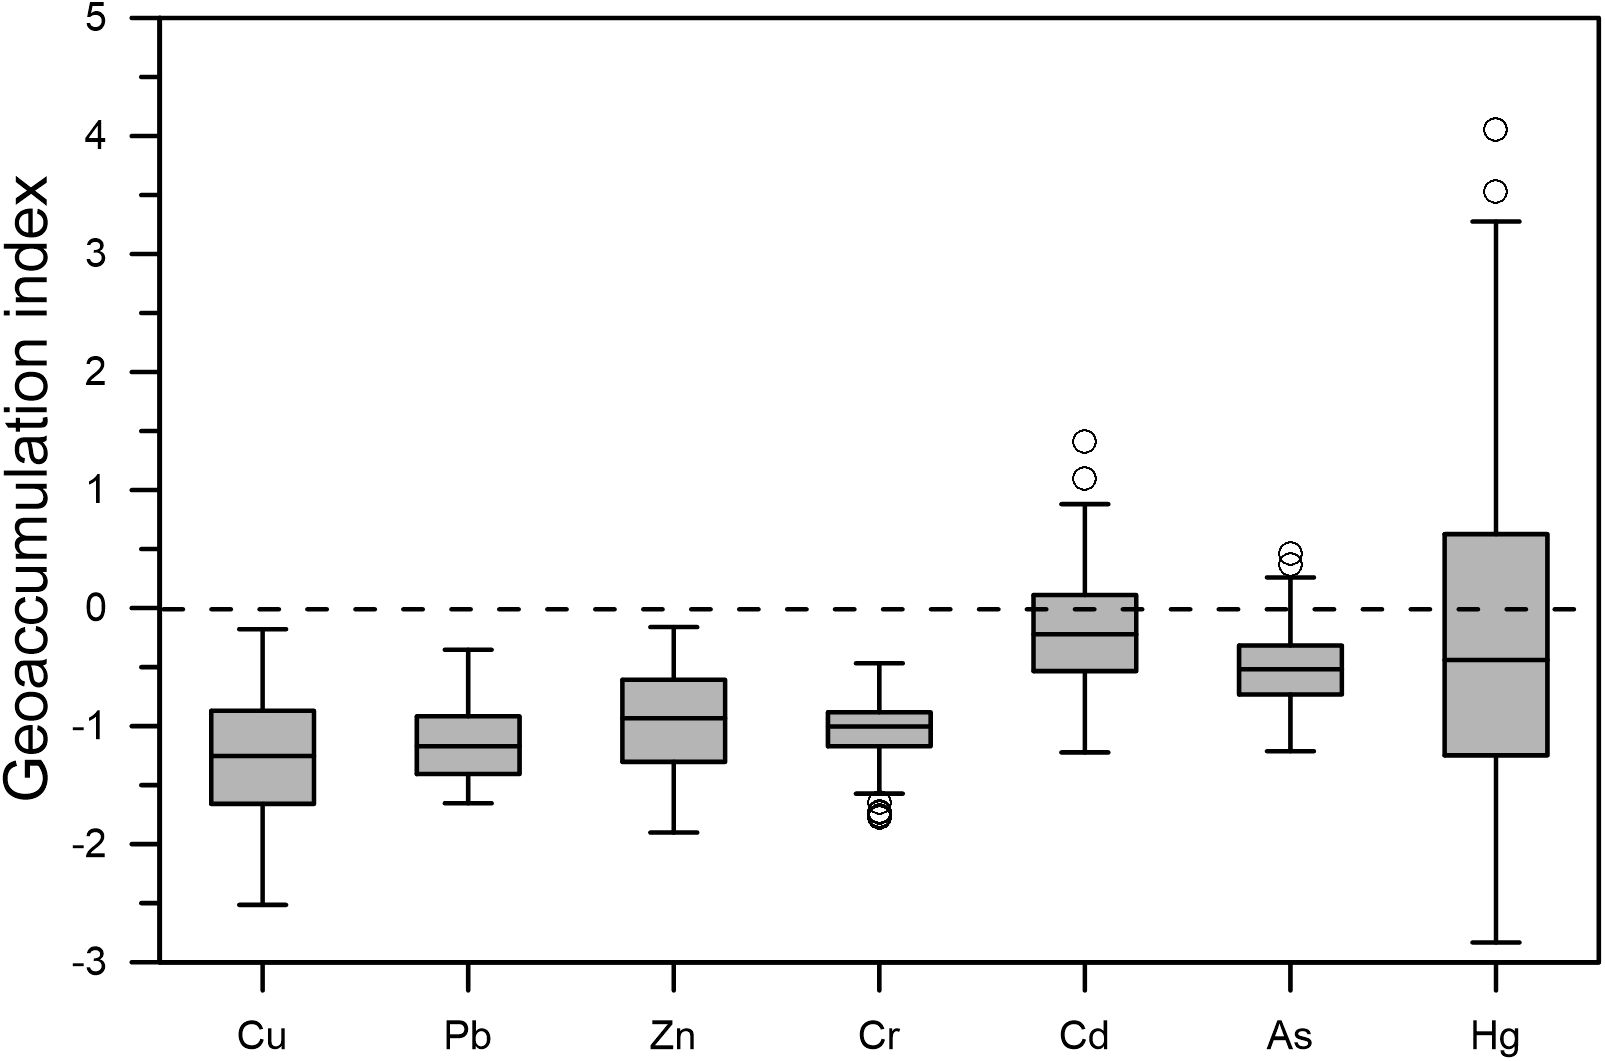
Figure 3. Metal(loid) geoaccumulation indices (Igeo) of HMs in surface sediments (Top and bottom line segments represent the maximum and minimum values of the data respectively. The top and bottom line segments of the box diagram represent the third and first quartiles, respectively, and the thick line segment in the middle of the box diagram represents the median of the data. The circles at the top and bottom of the box diagram represent the extreme values of the sample data.).
The following is a ranking of the potential ecological risk coefficient for each HM in the sediment: Hg > Cd > As > Pb > Cu > Cr > Zn (Table 4). It is evident from Figure 4 that all HMs at all sites had individual potential ecological risk coefficients of less than 40, indicating minimal potential ecological danger, with the exception of Cd and Hg. The potential ecological risk posed by Cd varied between 19.3 and 119.3, indicating a low to significant level of risk. The survey revealed that 45.6% of the sites in the northern Yellow River estuary exhibited a moderate to significant ecological concern for Cd. A similar pattern was observed for the individual potential ecological coefficients of Hg, which varied from 8.4 to 997.9, indicating low to very high potential ecological dangers. The survey revealed that 12.6% of stations in the old Yellow River estuary exhibited very high potential ecological risk for mercury, while 39.8% of stations in the northeastern Yellow River estuary and old Yellow River estuary demonstrated moderate to large potential ecological danger. It is noteworthy that even in low concentrations, mercury exhibits a high degree of toxicity, as evidenced by the findings of Madadi et al. (2023). The total prospective ecological risk index (RI) ranged from 45.5 to 1042.2 (mean = 179.49, Table 4), indicating moderate ecological risk (105< RI< 210). Of particular concern is the identification of 13 locations within the historic Yellow River estuary, where the RI exceeds 420, indicating a very high ecological risk.
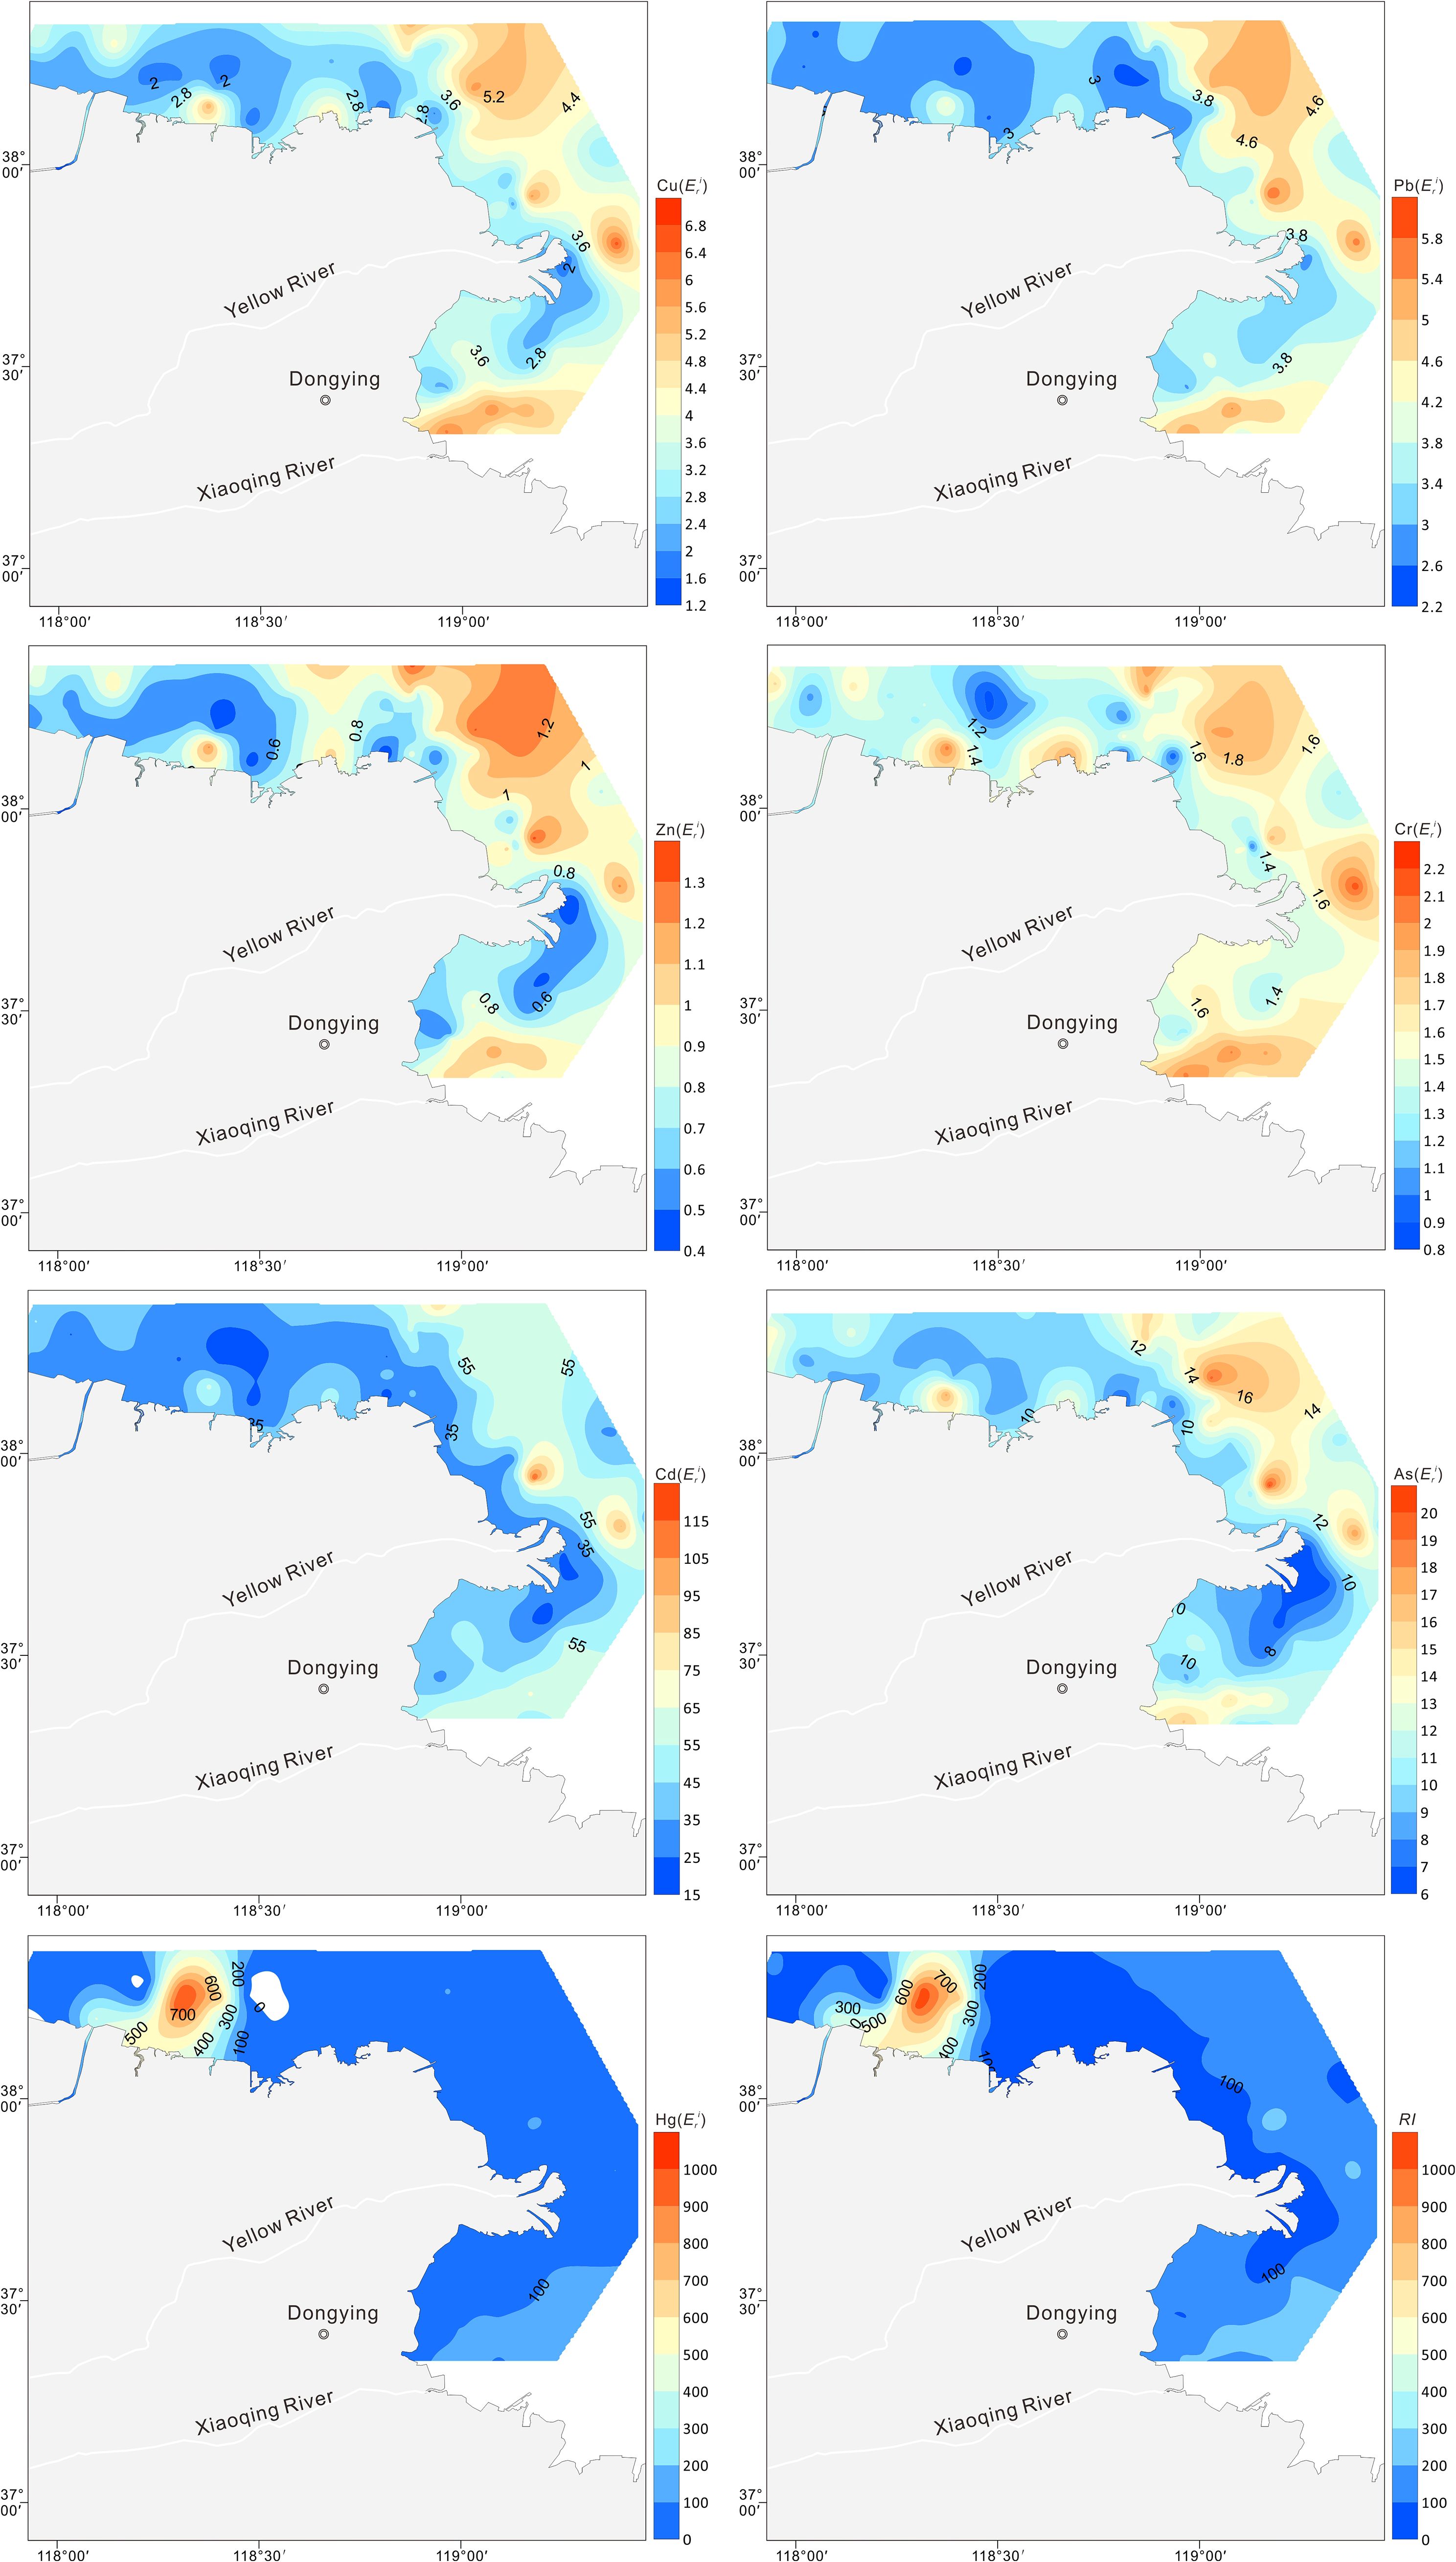
Figure 4. Spatial distributions of and RI values for Cu, Pb, Zn, Cr, Cd, As, and Hg in the surface sediments.
3.2 Concentrations and human health risks of HMs in organisms
The HM contents of Cu, Pb, Zn, Cr, Cd, As, and Hg in marine organisms in the Yellow River estuary and adjacent areas ranged from 0.51 to 39.17, 0.01 to 0.1, 5.48 to 33.55, 0.08 to 0.25, 0.01 to 0.35, 0.9 to 6.62, and 0.003 to 0.048 μg/g, respectively (with means of 11.99, 0.039, 16.46, 0.139, 0.12, 3.68, and 0.016 μg/g, respectively; Table 5). The average concentrations in marine organisms were as follows: Zn > Cu > As > Cr > Cd > Pb > Hg. The highest concentrations of Cu, Pb, As, and Hg were found in C. stigmatias and L. maculatus, whereas Zn, Cr, and Cd showed the highest concentrations in the mollusks of Ostreidae, R. venosa, and L. japonica. The lowest concentrations of all HMs were found in the fish species C. stigmatias and L. maculatus. Except for Pb, Cr, and Hg, the HM concentrations in the mollusks were much higher than those in crustaceans and fish.
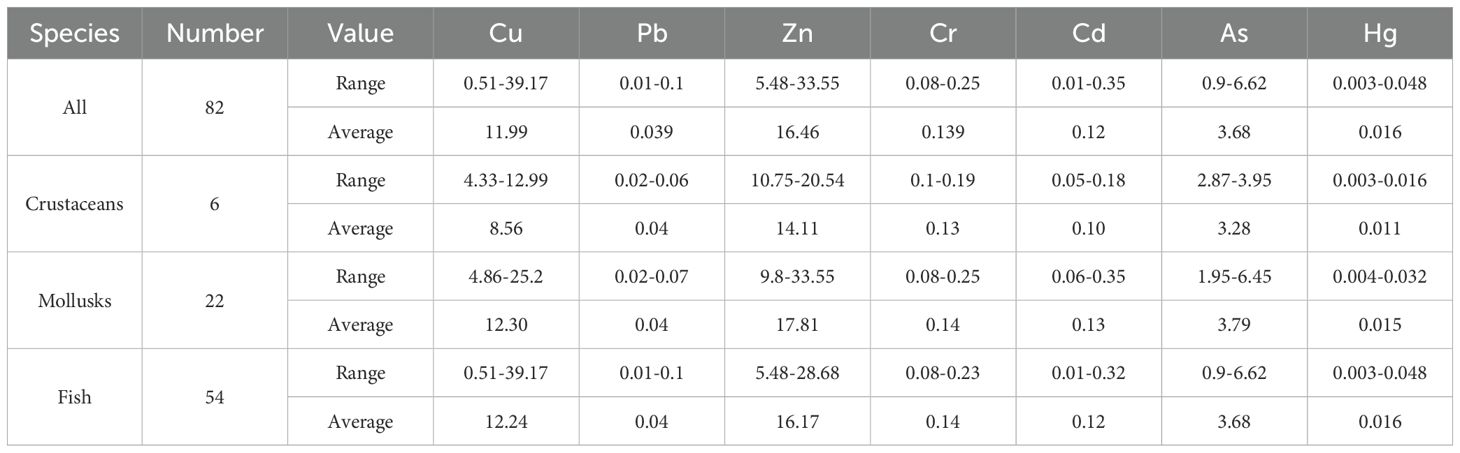
Table 5. HM concentration in marine organism in Yellow River estuary and its adjacent areas (unit: μg/g).
A certain regularity was observed in the average content of HM elements in the three organism types in the Yellow River estuary and adjacent areas as follows: crustaceans, Zn > Cu > As > Cr > Cd > Pb > Hg; mollusks, Zn > Cu > As > Cr > Cd > Pb > Hg; and fish, Cu > Zn > As > Cr > Cd > Pb > Hg. Zn and Cu—both essential elements for the growth and development of marine organisms—are primarily involved in enzyme synthesis and are highly concentrated in these organisms, becoming an indispensable part of them. The other five HMs have low or negligible biological demand due to their harmful effects, resulting in a relatively low concentration of enrichment in the biological body. However, the high As content in fish, mollusks, and crustaceans may be affected by pollution.
The contents of Cu, Pb, Zn, Cr, Cd, ang Hg (with average values of 31.28, 3.38, 139.27, 1.46, 3.09, and 1.73 μg/g) in marine organisms in Haizhou Bay and its adjacent waters were obviously higher than those in the study area. But the Hg concent (0.93 μg/g) was significantly lower than that (3.68 μg/g) in Yellow Rvier estuary (Fu, 2023). In Haizhou Bya, the maximum contents of Cu, Zn, Cd, and Cr were found in Ostreidae, and the maximum contents of As were found in Loligo chinensis. The highest values of Hg and Pb were found in O. oratoria and the lowest values of the seven HMs were found in Clupanodon punchtatus and Setipinna taty. The characteristics of HM content in organisms were obviously different from those in Yellow River estuary and its adjacent areas.
In accordance with the biological quality standards set forth in the Concise Regulations for the Comprehensive Survey of Coastal Zone and Sea Surface Resources in China, the standard index of HM content in marine organisms within the study area is presented in Table 6. The average standard index of HM content in fish was As > Cu > Zn > Cd > Cr > Hg > Pb, and Cu and As at some stations exceeded the standard. The average index of HM content in mollusks was As > Cu > Zn > Hg > Cr > Cd > Pb, and all standard indices met the standard requirements. The average standard index of HM content in crustaceans was As > Zn > Cr > Cu > Hg > Cd > Pb, and each index met the standard requirements. As had the average standard index was highest in fish, mollusks, and crustaceans (0.74, 0.38, and 0.41, respectively), followed by Cu (0.61, 0.12, and 0.09, respectively) (Table 6). The standard indices of the remaining HMs were low, indicating that they met the corresponding biological quality standards.
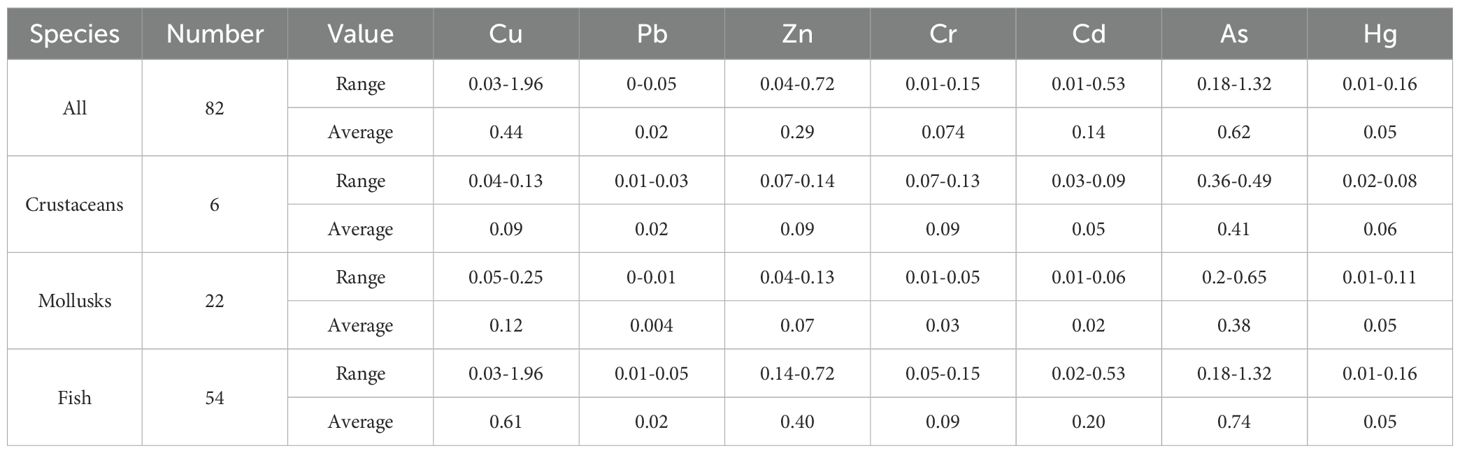
Table 6. Standard index of HM content in organisms in the study area.
Using the THQ as an evaluation index, this study evaluated the risk caused by the consumption of these marine organisms. For a single HM, the target risk coefficient for Cu, Pb, Zn, Cr, Cd, As, and Hg was 0.01–0.93, 0–0.02, 0.02–0.11, 0.03–0.08, 0.01–0.33, 0.02–0.13, and 0.01–0.09, respectively (with means of 0.29, 0.01, 0.05, 0.04, 0.12, 0.07, and 0.03, respectively; Table 7). The target hazard coefficients for the seven HMs were in the order of Cu > Cd > As > Zn > Cr > Hg > Pb. The target hazard coefficient of a single HM in all the marine biological samples was<1, indicating that a single HM had no significant negative effects. The overall target hazard coefficient HI was 0.11–1.47. The HI values at the four stations were >1, and the species identified were S. hasta, P. bicoloratus, and L. japonicas. Considering the combined contamination of HMs in the same seafood type, there are potential non-carcinogenic health risks associated with the ingestion of these three fish species.
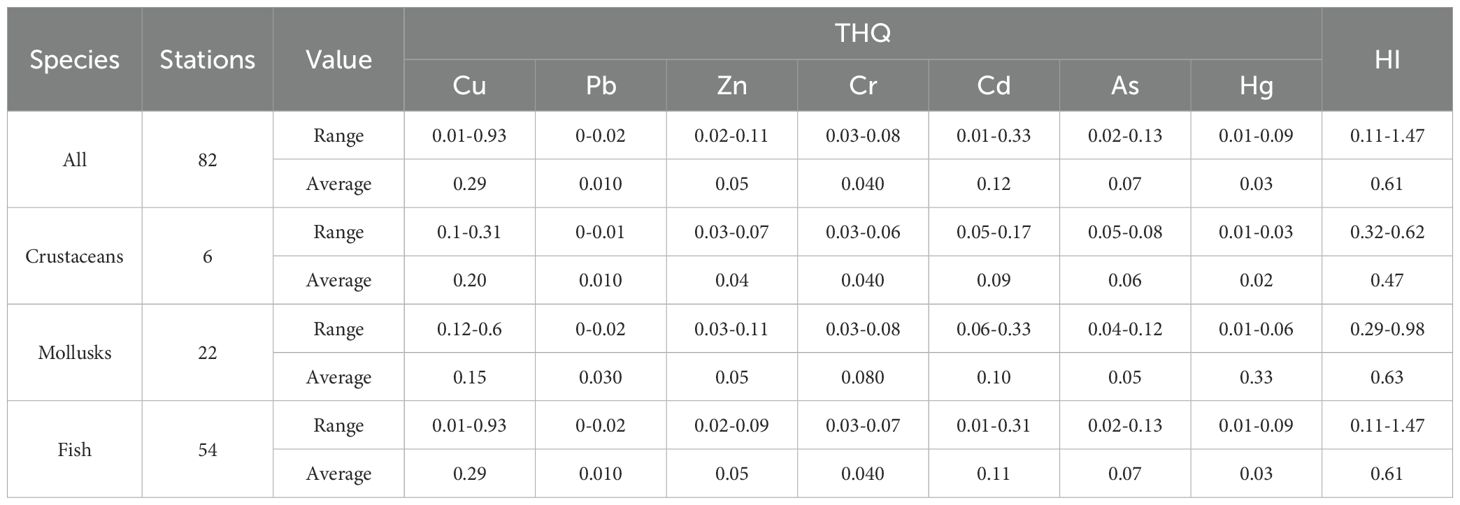
Table 7. Target hazard quotient of metal(loid)s in different marine organisms.
3.3 Interrelationship and source analysis of HMs
The capacity of marine organisms to accumulate HMs was quantified using BSAF. A BSAF > 1 indicates that the organism has a strong capacity for HM enrichment. The average biological enrichment indices of Cu, Pb, Zn, Cr, Cd, As, and Hg in the Yellow River estuary and adjacent areas were 0.87, 0.002, 0.35, 0.003, 1.17, 0.38, and 0.97 (Table 8). The HM with the highest degree of enrichment by organisms in the sediment was Cd, followed by Hg, Cu, A, Zn, Cr, and Pb. The BSAF values of Cd and Hg in crustaceans, and Cu, Cd, and Hg in mollusks and fish were >1, indicating that these three organism types accumulated Cu, Cd, and Hg from surface sediments (Long et al., 1998).
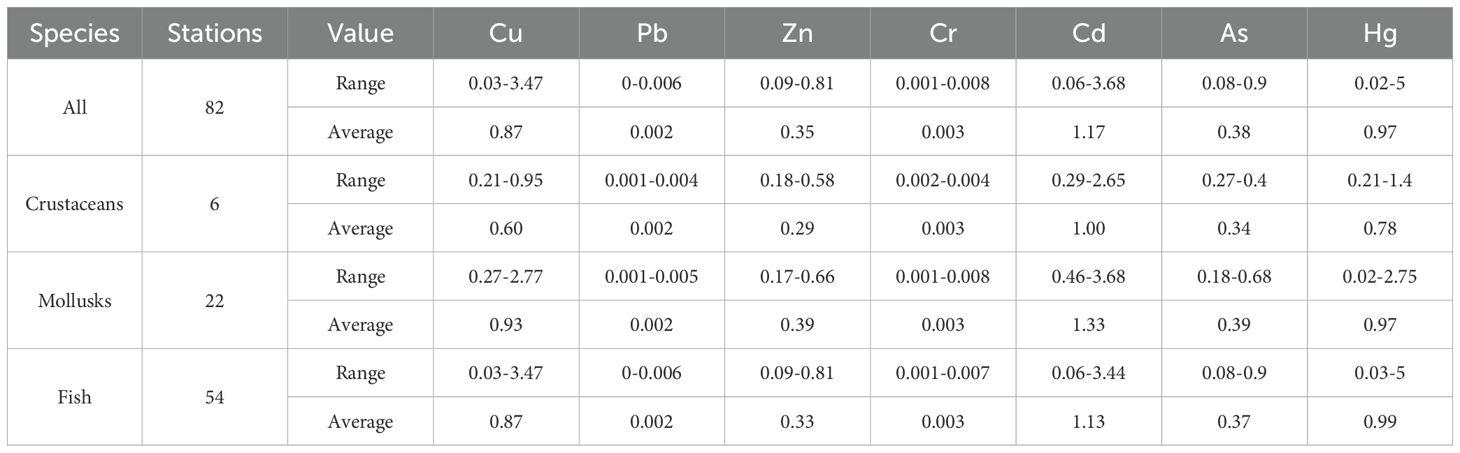
Table 8. BSAF of HMs in Yellow River estuary and its adjacent area.
The Pearson correlation coefficients between the TOC in sediments and the amounts of heavy metals (loids) (Cu, Pb, Zn, Cr, Cd, As, and Hg) are shown in Table 9. All other HMs, with the exception of mercury, demonstrated positive correlations with one another (r=0.70–0.90), thereby indicating that they originated from the same sources. Furthermore, a substantial positive correlation was identified between these six HM concentrations and TOC (r=0.75–0.87). Conversely, the mercury concentration exhibited a negative correlation with other heavy metals (loids) and a weak correlation with TOC.
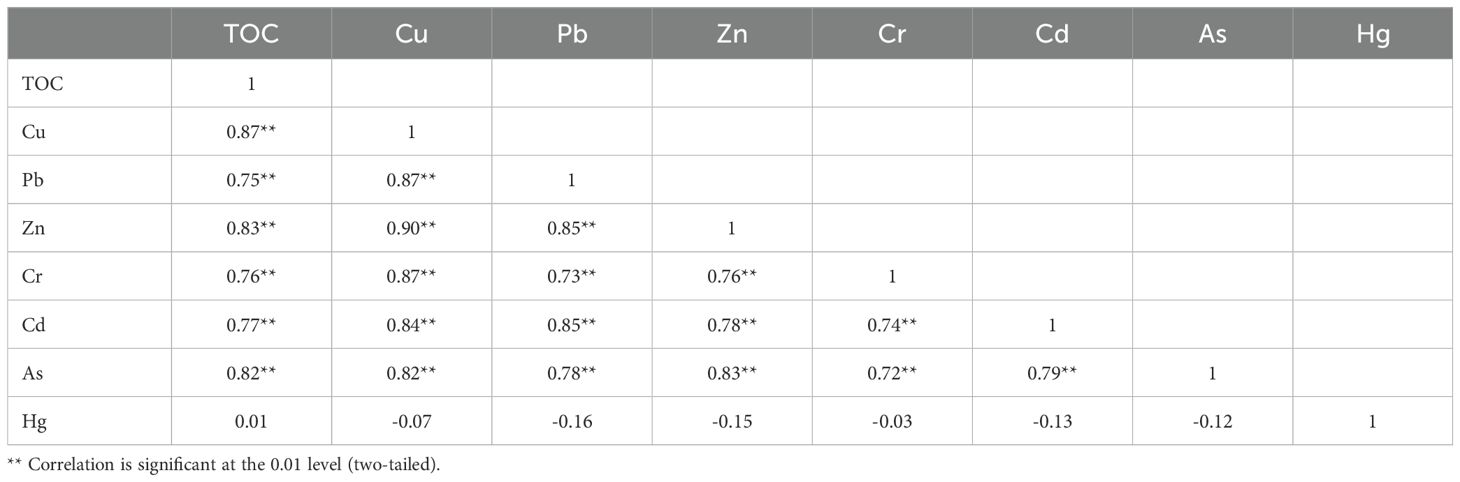
Table 9. Pearson’s correlation matrix for the HMs and TOC.
The potential sources of HMs in the surface sediments were identified using PCA with varimax rotation. The loadings are shown in Table 10. The analysis yielded two principal components, which collectively accounted for 85% of the observed variation, as illustrated in Figure 5. The contributions of PC1 (73.13%) included TOC, Cu, Pb, Zn, Cr, Cd, and As with high loadings of 0.90, 0.96, 0.91, 0.93, 0.8, 0.90, and 0.90, respectively, showing that these metal(loid)s had the same source. The average Igeo values of the six metal(loid)s were<0 (Table 4), indicating that they did not cause pollution (Muller, 1981). Therefore, we inferred that PC1 was composed of natural sources. PC2 demonstrated a high loading for Hg (0.99) and explained 12.74 percent of the variation. The prevailing opinion among researchers is that anthropogenic activities, including the production of alloys, dyeing, electroplating, cosmetics, and household sewage, are the primary sources of mercury contamination (Duan et al., 2021). The presence of a significant number of chemical plants and oil fields in the old Yellow River estuary, located north of the study area, has been documented (Wang et al., 2022). Consequently, PC2 was identified as an anthropogenic source.
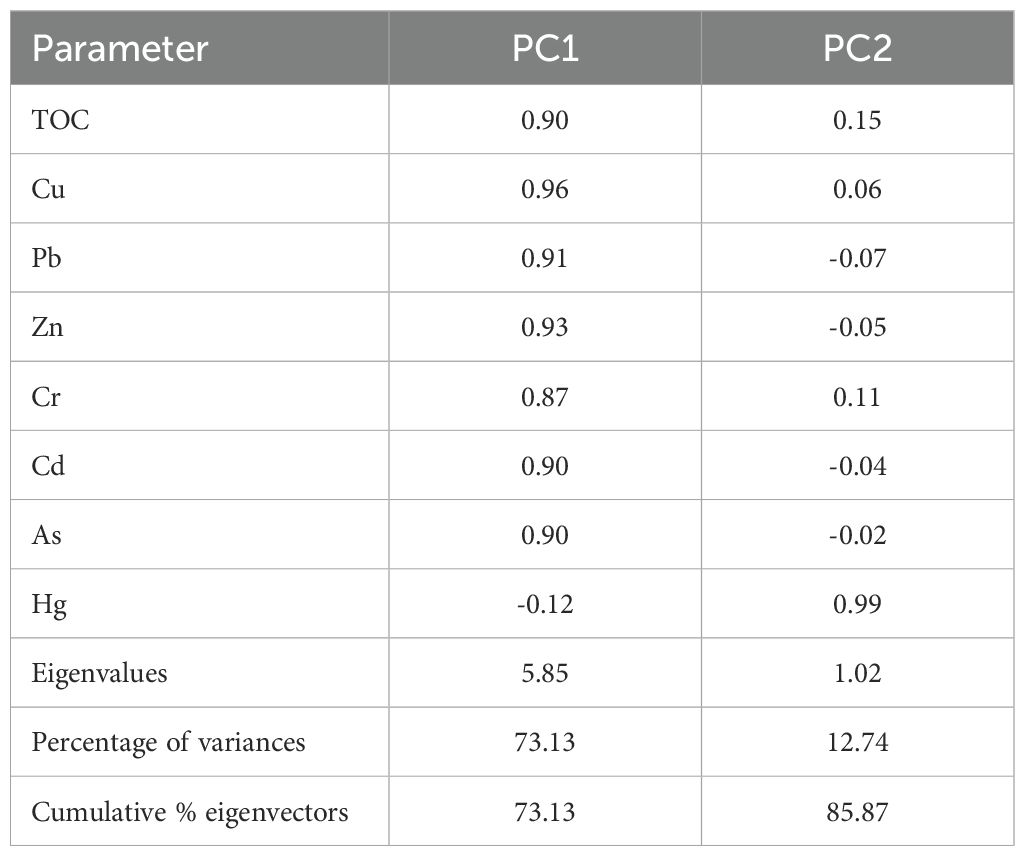
Table 10. Extracted two principal components (PC1 – PC2) in surface sediments.
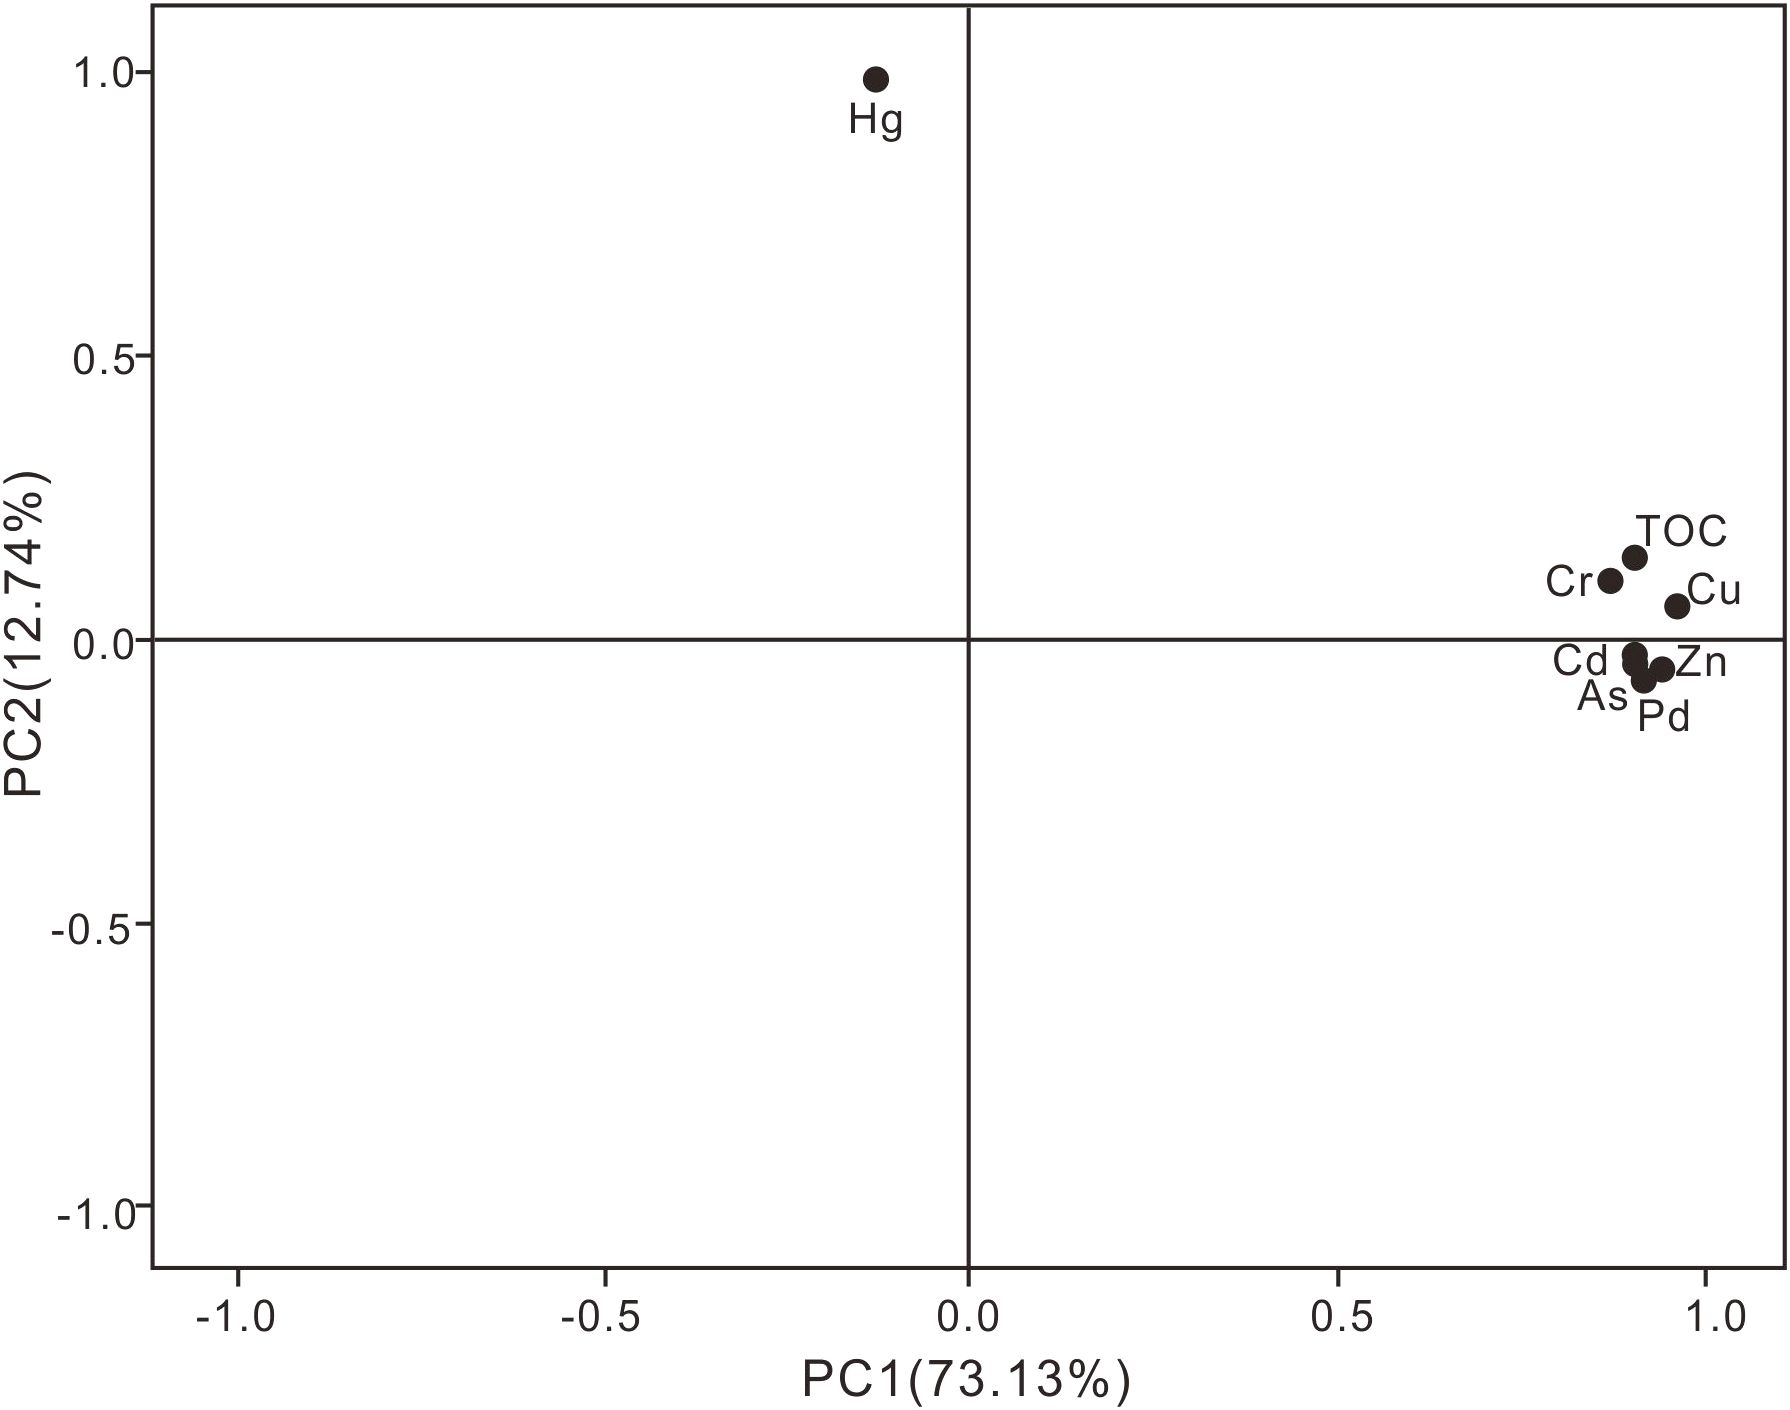
Figure 5. Principal component loading diagram for HM concentrations and TOC concentrations in surface sediments.
4 Conclusion
In summary, the distribution and pollution status of HMs in surface sediments and organisms from the Yellow River estuary and adjacent areas in China were investigated. In addition to Hg, the spatial distribution of other HMs was generally consistent. The spatial distribution of Hg differed from that of the other elements, with high-value areas showing a dotted distribution north of the study area. All HM levels in the surface sediments were below those specified in GB 18668-2002 and all HMs were mainly derived from natural sources, except for Hg. Hg presents a moderate to very high potential ecological risk in the northeastern and old Yellow River estuaries. A certain regularity was observed in the average HM content among the three organism types as such: crustaceans, Zn > Cu > As > Cr > Cd > Pb > Hg; mollusks, Zn > Cu > As > Cr > Cd > Pb > Hg; and fish, Cu > Zn > As > Cr > Cd > Pb > Hg. Except for As and Cu in fish, which exceeded the standards at some stations, all other standard indices met the corresponding biological quality standards. The target hazard coefficient of a single HM in all marine organisms was<1, but the HI values at the four stations were >1, indicating that there were potential non-carcinogenic health risks associated with the ingestion of these three species of fish. The BSAF values of Cd and Hg in crustaceans, and Cu, Cd, and Hg in mollusks and fish were >1, suggesting that these three types of organisms accumulated these HMs from surface sediments. The findings of this study can serve as a theoretical foundation for the prevention and control of HM pollution in the Yellow River Basin.
Data availability statement
The raw data supporting the conclusions of this article will be made available by the authors, without undue reservation.
Author contributions
EW: Conceptualization, Funding acquisition, Methodology, Writing – original draft. JW: Formal Analysis, Investigation, Writing – original draft. YS: Data curation, Resources, Writing – original draft. JZ: Investigation, Software, Writing – original draft. ZZ: Investigation, Software, Writing – original draft. GX: Validation, Visualization, Writing – original draft. YZ: Software, Validation, Writing – original draft. DZ: Conceptualization, Methodology, Writing – original draft.
Funding
The author(s) declare that financial support was received for the research and/or publication of this article. This study is supported by the Shandong Provincial Natural Science Foundation (No. ZR2023MD017).
Conflict of interest
The authors declare that the research was conducted in the absence of any commercial or financial relationships that could be construed as a potential conflict of interest.
Generative AI statement
The author(s) declare that no Generative AI was used in the creation of this manuscript.
Publisher’s note
All claims expressed in this article are solely those of the authors and do not necessarily represent those of their affiliated organizations, or those of the publisher, the editors and the reviewers. Any product that may be evaluated in this article, or claim that may be made by its manufacturer, is not guaranteed or endorsed by the publisher.
References
Administration of quality supervision, inspection and quarantine of the People's Republic of China (AQSIQ) (2002). Marine Sediment Quality of China (GB 18668-2002) (Beijing: Standards Press of China).
Bramha S., Pradhan U., Sarangapani R., Chandrasekaran S., Krishnaveni M. (2025). Distribution of natural radionuclides and associated geological properties in shelf sediment of southwest (sw) bay of bengal: a multivariate statistical approach. Reg. Stud. Mar. Sci. 82, 104035. doi: 10.1016/j.rsma.2025.104035
Chen Y., liu M., Zhang X., Bu X., Chen J., Wu X. (2021). Metals in Yellow River estuary sediments during the 2018 water-sediment regulation scheme period, Mar. Pollut Bull. 166, 112177. doi: 10.1016/.marpolbul.2021.112177
Cheng Q., Zhou W., Zhang J., Shi L., Xie Y., li X. (2019). Spatial variations of arsenic and heavy metal pollutants before and after the water-sediment regulation in the wetland sediments of the Yellow River estuary, China. Mar. Pollut. Bull. 145, 138–147. doi: 10.1016/j.marpolbul.2019.05.032
China National Environmental Monitoring Center (CNEMC) (1990). Chinese Elemental Background Values for Soils (Beijing: Chinese Environmental Science Press).
Duan Y., Pei S., Liao M., Zhai S., Zhang H., Xu G., et al. (2021). Spatial distribution of heavy metals in the surface sediments of Laizhou Bay and their sources and pollution assessment. Mar. Geol. Quat. Geol. 41, 67–81. doi: 10.16562/j.cnki.0256-1492.2020112601
Feng H., Jiang H., Gao W., Weinstein M., Zhang Q., Zhang W., et al. (2011). Metal contamination in sediments of the western Bohai Bay and adjacent estuaries, China. J. Environ Manage. 92, 1185–1197. doi: 10.1016/i.jenvman.2010.11.020
Fu K. (2023). Distribution, sources and risk assessment of heavy metals in the environment and organisms of Marine pastures in Haizhou Bay and its adjacent waters. (Shanghai: Shanghai Ocean University).
Gao X., Chen C. A. (2012). Heavy metal pollution status in surface sediments of the coastal Bohai Bay. Water Res. 46, 1901–1911. doi: 10.1016/j.watres.2012.01.007
Gil F., Olmedo P. (2023). “Food safety heavy metals and metalloids,” in Encyclopedia of Human Nutrition (Academic Press, Maryland, USA). doi: 10.1016/b978-0-12-821848-8.00041-x
Hakanson L. (1980). An ecological risk index for aquatic pollution control.a sedimentological approach. Water Res. 14, 975–1001. doi: 10.1016/0043-1354(80)90143-8
Li J., Chen S., Liu M., Yang S., Huang Q. (1985). Distribution and seasonal variation of heavy metal in the sediments from Huanghe River estuary and adjacent areas. J. Shandong Coll. Oceanol. 15, 105–111.
Liang B., Qian X., Peng S., Liu X., Bai L., Cui B., et al. (2018). Speciation variation and comprehensive risk assessment of metal(loid)s in surface sediments of intertidal zones. Int. J. Environ. Res. Public Health 15, 2125. doi: 10.3390/ijerph15102125
Liu Y., Han M., Pan B., Jing X. (2020). Water quality assessment and pollutant fluxes into the sea in the lower reaches of Xiaoqing River. J. China Hydrol. 40, 88–96. doi: 10.19797/i.cnki.1000-0852.20190361
Long E. R., Field L. J., MacDonald D. D. (1998). Predicting toxicity in marine sediments with numerical sediment quality guidelines. Environ. Toxicol. Chem. 17, 714–727. doi: 10.1002/etc.5620170428
Madadi R., Mejjad N., De-la-Torre G. E. (2023). Geochemical speciation, ecological risk, and source identification of heavy metal(loid)s in sediments and waters from Musa Estuary, Persian Gulf. Mar. Pollut. Bull. 190, 114836. doi: 10.1016/j.marpolbul.2023.114836
Muller G. (1981). Die Schwermetallbelastung der sediment des Neckars und seiner Nebenflusse: eine Bestandsaufnahme. Chemiker Zeitung 105, 157–164.
Onakpa M. M., Njan A. A., Kalu O. C. (2018). A review of heavy metal contamination of food crops in Nigeria. Ann. Glob. Health 84, 488–494. doi: 10.29024/aogh.2314
Rehman T., Naz S., Hussain R., Chatha A., Ahmad F., Yamin A., et al. (2021). Exposure to heavy metals causes histopathological changes and alters antioxidant enzymes in fresh water fish (Oreochromis niloticus). Asian J. Agricul. Biol. 1. doi: 10.35495/ajab.2020.03.143
Strode E., Jansons M., Purina I., Balode M., Berezina N. (2017). Sediment quality assessment using survival and embryo malformation tests in amphipod crustaceans: The Gulf of Riga, Baltic Sea AS case study. J. Mar. Syst. 172, 93–103. doi: 10.1016/j.jmarsys.2017.03.010
Sun Z., Mou X., Tong C., Wang C., Xie Z. (2015). Spatial variations and bioaccumulation of heavy metals in intertidal zone of the Yellow River estuary, China. Catena 126, 43–52. doi: 10.1016/j.catena.2014.10.037
Tang A., Liu R., Min L., Xu L., Wang J. (2010). Distribution characteristics and controlling factors of soluble heavy metals in the Yellow river estuary and adjacent sea. Proc. Environ.Sci. 2, 1193–1198. doi: 10.1016/j.proenv.2010.10.129
Thorat B., Prasad P., Ram A. (2023). Heavy metal accumulation in a moderately polluted Ulhas estuary, Western India. Reg. Stud. Mar. Sci. 60, 102818. doi: 10.1016/j.rsma.2023.102818
Wang Z., Lin K., Liu X. (2022). Distribution and pollution risk assessment of heavy metals in the surface sediment of the intertidal zones of the Yellow River Estuary, China. Mar Pollut. Bull. 174, 113286. doi: 10.1016/j.marpolbu,2021.113286
Wu Z., Dong Y., Liu R., Liu L., Gao J., Song W., et al. (2022). Assessment of heavy metal contamination in surface sediments off the Dongying coast, Bohai Sea. Mar. Pollut. Bull. 180, 113826. doi: 10.1016/j.marpolbul.2022.113826
Wu X., Liu R., Qin J., Sun P., Gao Z., Jia Y. (2007). Study on the variance character of heavy metals contents in sediments in Yellow River estuary. Trans. Ocenol. Limnol. S1, 69–74.
Xavier D. D. A., dos Santos V. ,. F., de Miranda A. G., Berredo J. F. (2020). Determination of background geochemistry of an Amazon estuary: the Cunaní Estuary- Amapa. Mar. Pollut. Bull. 155, 111144. doi: 10.1016/j.marpolbul.2020.111144
Yu Y., Liu J., Cao K., Yin P., Gao F., Chen X. (2023). Composition, distribution and enrichment of trace metals in sediments from the muddy area off the southern Shandong Peninsula in the Northwestern South Yellow Sea of China since 10,000 years. Mar. Pollut. Bull. 192, 115034. doi: 10.1016/j.marpolbul.2023.115034
Keywords: heavy metal(loid)s, pollution assessment, surface sediments, marine organisms, Yellow River estuary
Citation: Wang E, Wang J, Sun Y, Zhao J, Zhang Z, Xu G, Zhang Y and Zhang D (2025) Spatial distribution and risk assessment of heavy metal(loid)s in sediments and marine organisms in the Yellow River estuary and its adjacent areas, China. Front. Mar. Sci. 12:1560640. doi: 10.3389/fmars.2025.1560640
Received: 14 January 2025; Accepted: 02 April 2025;
Published: 28 April 2025.
Edited by:
Ilaria Corsi, University of Siena, ItalyReviewed by:
Satyanarayan Bramha, Indira Gandhi Centre for Atomic Research (IGCAR), IndiaDario Savoca, University of Palermo, Italy
Copyright © 2025 Wang, Wang, Sun, Zhao, Zhang, Xu, Zhang and Zhang. This is an open-access article distributed under the terms of the Creative Commons Attribution License (CC BY). The use, distribution or reproduction in other forums is permitted, provided the original author(s) and the copyright owner(s) are credited and that the original publication in this journal is cited, in accordance with accepted academic practice. No use, distribution or reproduction is permitted which does not comply with these terms.
*Correspondence: Yonggen Sun, c3lnQGZpby5vcmcuY24=; Daolai Zhang, emhhbmdkYW9sYWkxOTg0QDE2My5jb20=