 Marcela C. Nascimento
 Magali P. Gonçalves
 Jasmin Lieser
 Igor Mayer
 Marco Scotti
- 1Research Division: Marine Ecology, GEOMAR Helmholtz Centre for Ocean Research Kiel, Kiel, Germany
- 2Academy of AI Games and Media, Breda University of Applied Sciences, Breda, Netherlands
- 3Department of Geography, Kiel University, Kiel, Germany
- 4Institute of Biosciences and Bioresources, National Research Council of Italy, Sesto Fiorentino, Italy
The MSP Challenge Simulation Platform assists planners and stakeholders in understanding and managing the complexity of Maritime Spatial Planning (MSP). It allows users to view various data layers covering an entire sea region, assess the status of the socio-ecological system, and create future scenarios for marine space usage over several decades. The platform integrates the ecosystem modelling approach Ecopath with Ecosim (EwE) to support the implementation of evidence-based and ecosystem-based MSP principles from the EU Directive 2014/89/EU. Each regional edition of the MSP Challenge includes a tailored ecosystem model of the basin. The ecosystem model simulates the effects of pressures from human activities by applying functional responses to each trophic group. This article explains how the modelling of pressures and functional responses was extended from the original system, using the western Baltic Sea as an example. It focuses on pressures characteristic of offshore wind farms, an infrastructure increasingly important for achieving European carbon neutrality and reducing reliance on fossil fuels amid energy crises. First, the general noise pressure that included all kinds of noise and vibrations was split into impulsive noise, continuous noise and bottom vibrations, with air disturbance added as a separate component. Second, a new semi-quantitative metric inspired by the Leopold matrix used in Environmental Impact Assessment was applied to link each pressure to the trophic group’s response, making the process more objective. These improvements standardize the functional response inputs and provide detailed insights into the impacts of different human activities on specific trophic groups. The novelties presented here improve the MSP Challenge Platform’s ability to deliver realistic predictions on ecosystem functioning in response to the construction, operation and decommissioning of offshore wind farms, and may foster more robust decision-making for sustainable maritime spatial planning.
1 Introduction
The Directive 2014/89/EU of the European Parliament and of the Council of 23 July 2014 (European Union, 2014) establishes a framework for Marine Spatial Planning (MSP), mandating EU Member States to implement a “maritime planning process”, resulting in a “maritime spatial plan, or plans” (Art 9.) by 2021. MSP is defined as “a process by which the relevant Member States” authorities analyze and organize human activities in marine areas to achieve ecological, economic, and social objectives. Nations and their different sectors of activity must consider sustainability and the health status of marine ecosystems in their ambitions. Globally, marine and coastal ecosystems are under severe pressure (Tamis et al., 2016), but the cumulative effects of human uses on these ecosystems are not yet fully known. Different international treaties and agreements, such as the Convention on Biological Diversity (CBD), including the Aichi targets (United Nations, 2020), and the United Nations’ Sustainable Development Goals (SDG), specifically SDG 14: Life Below Water, call upon nations and stakeholders to “conserve and sustainably use the oceans, seas and marine resources for sustainable development” (United Nations, 2015). More recently, in 2022, the Kunming-Montreal Global Biodiversity Framework (also called The Biodiversity Plan) set the “effective protection and management of 30% of the world’s terrestrial, inland water, and coastal and marine areas by the year 2030”, colloquially known as “30x30”, as one of the 23 targets (CBD, 2024).
On the other hand, the European Green Deal (European Commission, 2019) places the energetic transition at the center of the EU’s goal of achieving carbon neutrality by 2050, focusing on renewable energy sources, including offshore wind farms. Many other EU and national initiatives moved in the same direction, particularly after the intensification of the Russia-Ukraine conflict in 2022. The increasing demand to use the marine environment for energy production prompts the importance of thoroughly assessing the potential impacts of offshore wind farms on marine organisms and ecosystems, especially when considered alongside other activities, such as fishing, during the marine spatial planning process. Furthermore, the long-term impacts of wind farm construction and operation are still not fully understood. One way to explore the potential combined effects of wind farms and other existing activities is through modelling and simulation of different scenarios. MSP is, therefore, in urgent need of innovative approaches and effective Planning Support Systems (PSS) that enable sectoral planners and stakeholders to assess the current ecological status of marine areas, while also jointly exploring the future consequences of planning decisions on the marine environment (Jean et al., 2018). Over the last few years, several PSS for ecosystem-based MSP have been developed, each one having specific strengths and limitations (HELCOM, 2018; Hammar et al., 2020; Menegon et al., 2018; Pınarbaşı et al., 2017). However, few of these tools can truly be considered as “integrated” in the sense that they link with simulation models for a wider range of maritime sectors, such as energy (offshore wind farming, energy grid) or shipping. Furthermore, these tools often require scientific knowledge, which can hinder cross-sectoral stakeholder engagement and transboundary co-design sessions (Steenbeek et al., 2020).
Duke (1974) is taken as the pioneer in considering simulation or serious games (SG) as an effective communication and learning tool for planning and decision-making. Through play, planners and stakeholders learn about the dynamic interrelations among various subsystems, the interdependencies among the actors, and the consequences of future actions by experimenting. SGs thus become connected to a communicative and learning style of planning and planning support (Muro and Jeffrey, 2008; Mayer, 2016). The MSP Challenge brand of board and digital games was developed to explore these ideas further in the context of ecosystem-based maritime spatial planning (Maritime Spatial Planning Challenge1). The MSP Challenge Simulation Platform (from now on referred to as MSP Challenge) integrates real geographic and marine data provided by many proprietary institutions (e.g., HELCOM2, EMODnet3, IMO4) with science-based simulation models for shipping, energy, and ecology (Abspoel et al., 2021; Mayer et al., 2013). In the platform, several users take the role of a Marine Spatial Planner for a different country in a given region. Players can make several plans for energy, shipping, fishing and conservation; then, the simulations run providing feedback to users in terms of key performance indicators and heatmaps. The results are interpreted with the support of a moderator who evaluates national and regional performance.
Ecosystem modelling is one of the methodologies used to understand ecological dynamics, including species interactions, the impacts of environmental change, such as rising temperatures, and anthropogenic stressors like habitat destruction and variations in fishing intensity (Christensen et al., 2014). One of the tools to model ecosystems is the Ecopath with Ecosim (EwE) framework. In this context, the authors proposed an improved pressure system for the MSP Challenge. This paper describes improvements to the pressure system driving the EwE model and explores its application to the western Baltic Sea, an area with operational offshore wind farms and additional facilities that have been commissioned or are under construction.
2 Materials and methods
2.1 The MSP challenge – EwE (Ecospace) linkage
Ecopath with Ecosim (EwE) is a free ecosystem modelling toolset used to represent marine ecosystems by mapping biomass and predation relationships among functional groups (Polovina, 1984; Christensen and Pauly, 1992; Walters et al., 1997). These functional groups (FG) can depict individual species, groups of species, or specific life stages (e.g., juveniles and adults), which are lumped together according to shared functional and ecological traits (Christensen et al., 2014). EwE enables simulation of ecosystem dynamics over time, allowing researchers to assess the impacts of fishing and environmental disturbances (Christensen and Walters, 2004). Moreover, it facilitates the visualization of these dynamics across space and time through map grids, helping explore spatial management strategies such as assessing the efficacy of marine protected areas (Christensen and Walters, 2004, 2024; Steenbeek et al., 2013).
Ecospace, the spatial component of the EwE framework, assigns environmental values to each grid cell based on the spatial maps. The habitat foraging capacity for each FG is calculated based on the foraging arena theory (Ahrens et al., 2012), from the FGs affinities for given habitats and functional responses to environmental conditions, based on the habitat layers in the base map (Christensen et al., 2014). The Ecospace model is driven by the foraging capacities of the FGs, resulting from the cumulative effects of multiple physical, oceanographic, environmental, and topographic conditions that operate spatially in conjunction with the food web and fisheries dynamics (Coll et al., 2019; de Mutsert et al., 2023). In the MSP Challenge integration, pressures such as bottom and surface disturbance are set as environmental drivers, and the impact of those pressures as functional responses connected to the pressure layers (Gonçalves et al., 2021; Steenbeek et al., 2020). To integrate the ecosystem-based principle of marine spatial planning (MSP) into the MSP Challenge simulation platform, it became clear that a robust ecosystem-modelling tool like EwE was essential. This led to the development of the MSP Challenge with EwE Link (MEL)— hand in hand with a modular architecture introduced in 2016 to expand on earlier linkages between the MSP Challenge and EwE (Santos and Gonçalves, 2016). MEL is designed to be fully adaptable, enabling data exchange between any sea basin edition of the MSP Challenge and its corresponding EwE ecosystem model tailored to that region.
At the start of a simulation and during each monthly time step, MEL calculates pressure layers stemming from human activities in the sea basin, including newly implemented planning decisions. These pressure inputs are then processed through EwE, whose results—expressed through heatmaps and key performance indicators—are fed back into the MSP Challenge environment (Santos and Gonçalves, 2016).
2.2 The western Baltic Sea Ecospace model
The western Baltic Sea (WBS) Ecospace model was developed from the EwE model of Scotti et al. (2022). The Ecopath model is composed of 18 functional groups (FGs), 17 living groups, one multi-stanza (Supplementary Table S1), and was adapted to represent the ICES subdivisions 22, 23, and 24 (44,746 km2; Figure 1). The model depicts the ecosystem in 1994, the first year for which a complete dataset for different trophic levels was available. The Ecospace model spans a grid of 44 cells in the longitudinal direction and 76 cells in the latitudinal direction, totaling 1,244 active square cells of approximately 6 km in size. Each active cell can contain one or more stationary habitat types and temporally dynamic environmental drivers, such as water temperature, which can affect the computed foraging capacity of the FGs. Substrate type (Al-Hamdani and Reker, 2007) and seagrass (Zostera marina) meadows (HELCOM, 2018) were used as habitat types. FGs’ dispersal rates were defined based on Hernvann et al. (2020); Nascimento et al. (2023), and Püts et al. (2020). The environmental responses of the FGs to each environmental layer were included when important for their spatial distribution. Parameters relevant to each FG were defined, and corresponding limits were obtained from the literature.
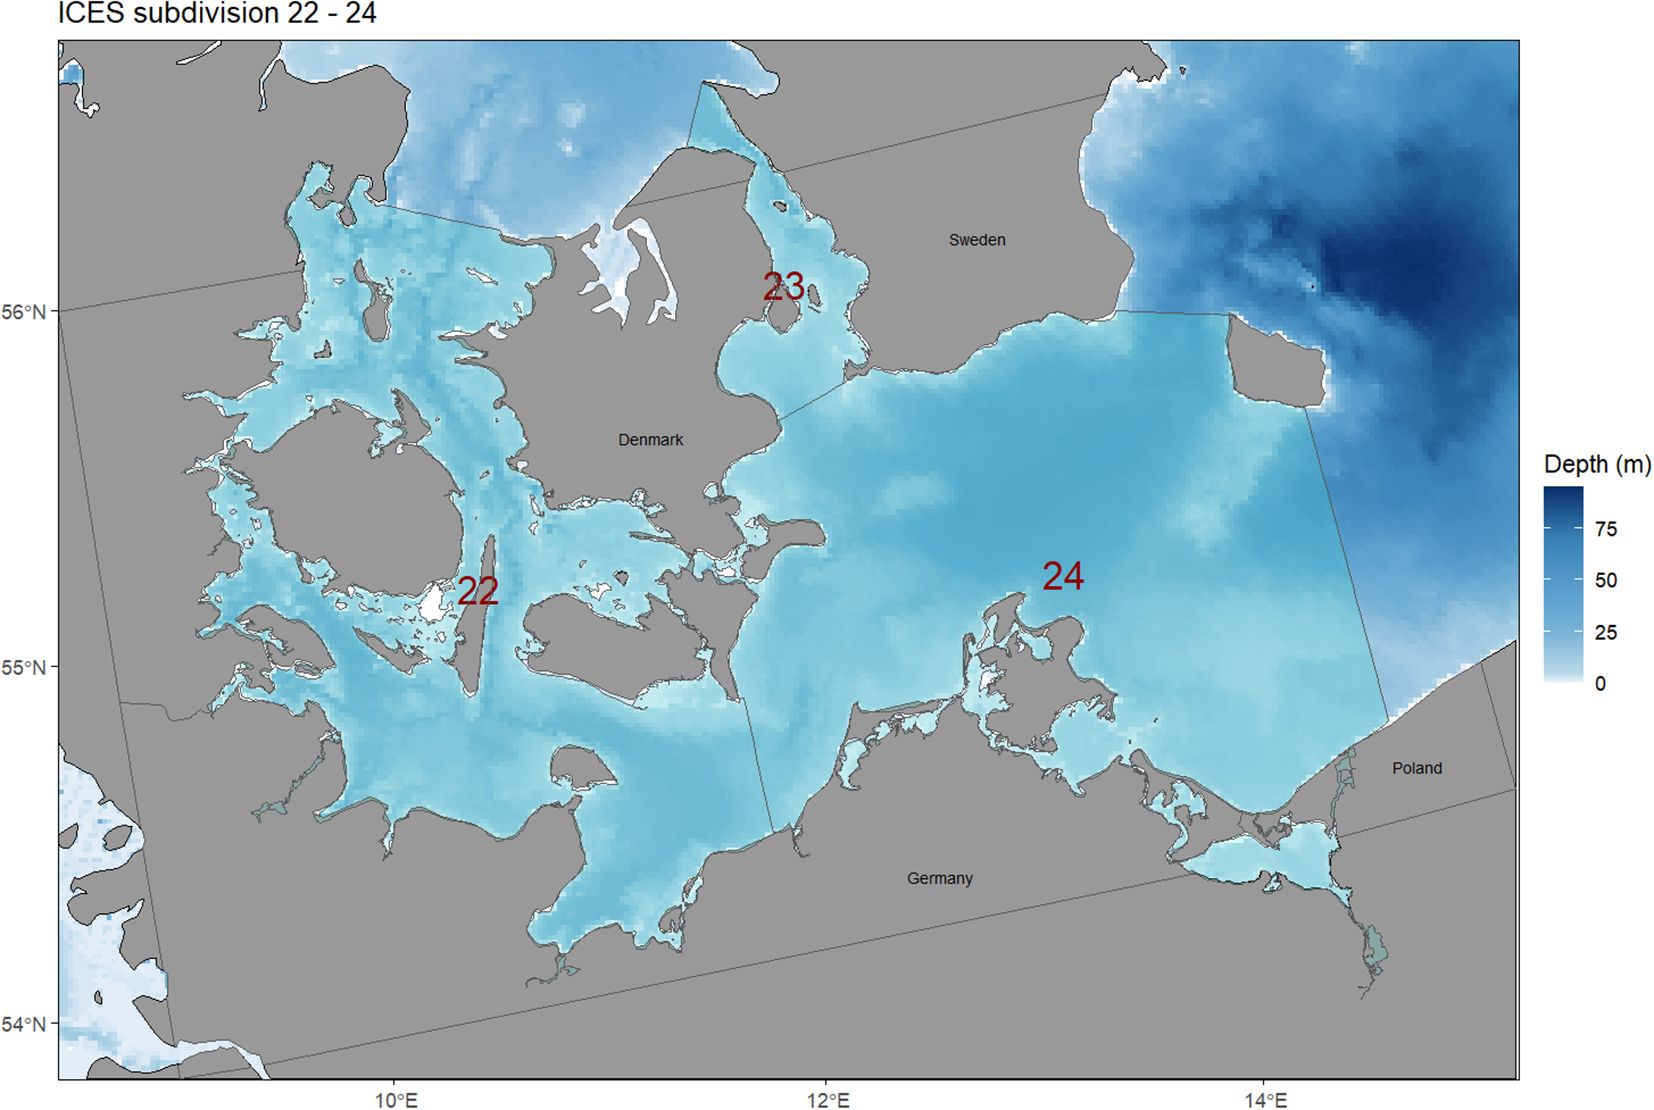
Figure 1. The western Baltic Sea; the modelled area consists of ICES subdivisions 22, 23, and 24.
The model was validated by comparing the simulated decadal average distributions of FGs for the 2010s with observed distributions of key species (e.g., herring, cod, flatfish, and harbor porpoise) from the same period. For validation, environmental data from the RCO-SCOBI models (Meier et al., 2019; Saraiva et al., 2019) were used, including bottom and surface temperatures, oxygen concentrations, salinity, and primary productivity. These data were incorporated using the framework to run the monthly external data of EwE 6.7, Pro version. The model was run in monthly time steps, from 1994 to 2098, with a prior spinning-up period of 10 years. The center of gravity (CG) and inertia (Woillez et al., 2007, 2009) of FG distributions were calculated for both observed and modelled data within the study area. Then, the Euclidean distance (km) between the modelled and observed CGs was calculated. To assess the significance of these distances, a bootstrap analysis was performed. The Euclidean distances were normalized using the observed inertia and isotropy values, and 10,000 simulated samples of the modelled centroids were generated. The normalized Euclidean distances were calculated for each of these bootstrap samples. This method showed that the differences between observed and modelled distributions were within the natural ranges of the evaluated species, confirming its suitability for making future projections of food web composition, interactions, and FG distributions under multi-stressor scenarios.
In the WBS Ecospace model developed for the MSP Challenge, the four fishing fleets (pelagic, demersal, recreational, and illegal, unreported and unregulated – IUU) from the original WBS EwE model (Scotti et al., 2022) were split into national fleets. This division was based on the proportion of species caught by each fleet and the landings reported by countries within each ICES subdivision (Rossing et al., 2010; ICES, 2023a, b). For the MSP Challenge version of the WBS Ecospace model, in addition to environmental layers (e.g., temperature, salinity, and oxygen concentration at the sea surface and sea bottom) and the FGs’ responses to these variables, empty maps were added to represent pressures from human activities to be supplied by the MSP Challenge. These additions allowed the effects of those human activities on the species to be defined within the model.
2.3 Human activities and pressure system within the MSP challenge
2.3.1 Background
Multiple activities take place simultaneously in the western Baltic Sea. Activities such as energy generation with wind farms, fishing, shipping, energy delivery and communication through cables, natural gas transport with pipelines, and military operations. These activities can influence species differently in distinct phases. For example, the type of noise generated by wind farms varies during the survey, installation, operation, and decommissioning phases, potentially impacting habitats and species differently in each phase (Mooney et al., 2020). Considering the unique characteristics of these activities, the MSP Challenge pressure system (Santos and Gonçalves, 2016; Steenbeek et al., 2020) was upgraded to represent more realistically their impacts on the WBS biological community.
The main human activities in the WBS were defined based on the documents and maps available on the HELCOM, ICES, EMODnet, and Copernicus portals. Table 1 summarizes the main human activities considered in the western Baltic Sea MSP Challenge Edition and their contribution to the pressure layers, and Figure 2 presents the spatial distribution of the primary non-fisheries human activities contributing to ecosystem pressures in the western Baltic Sea.
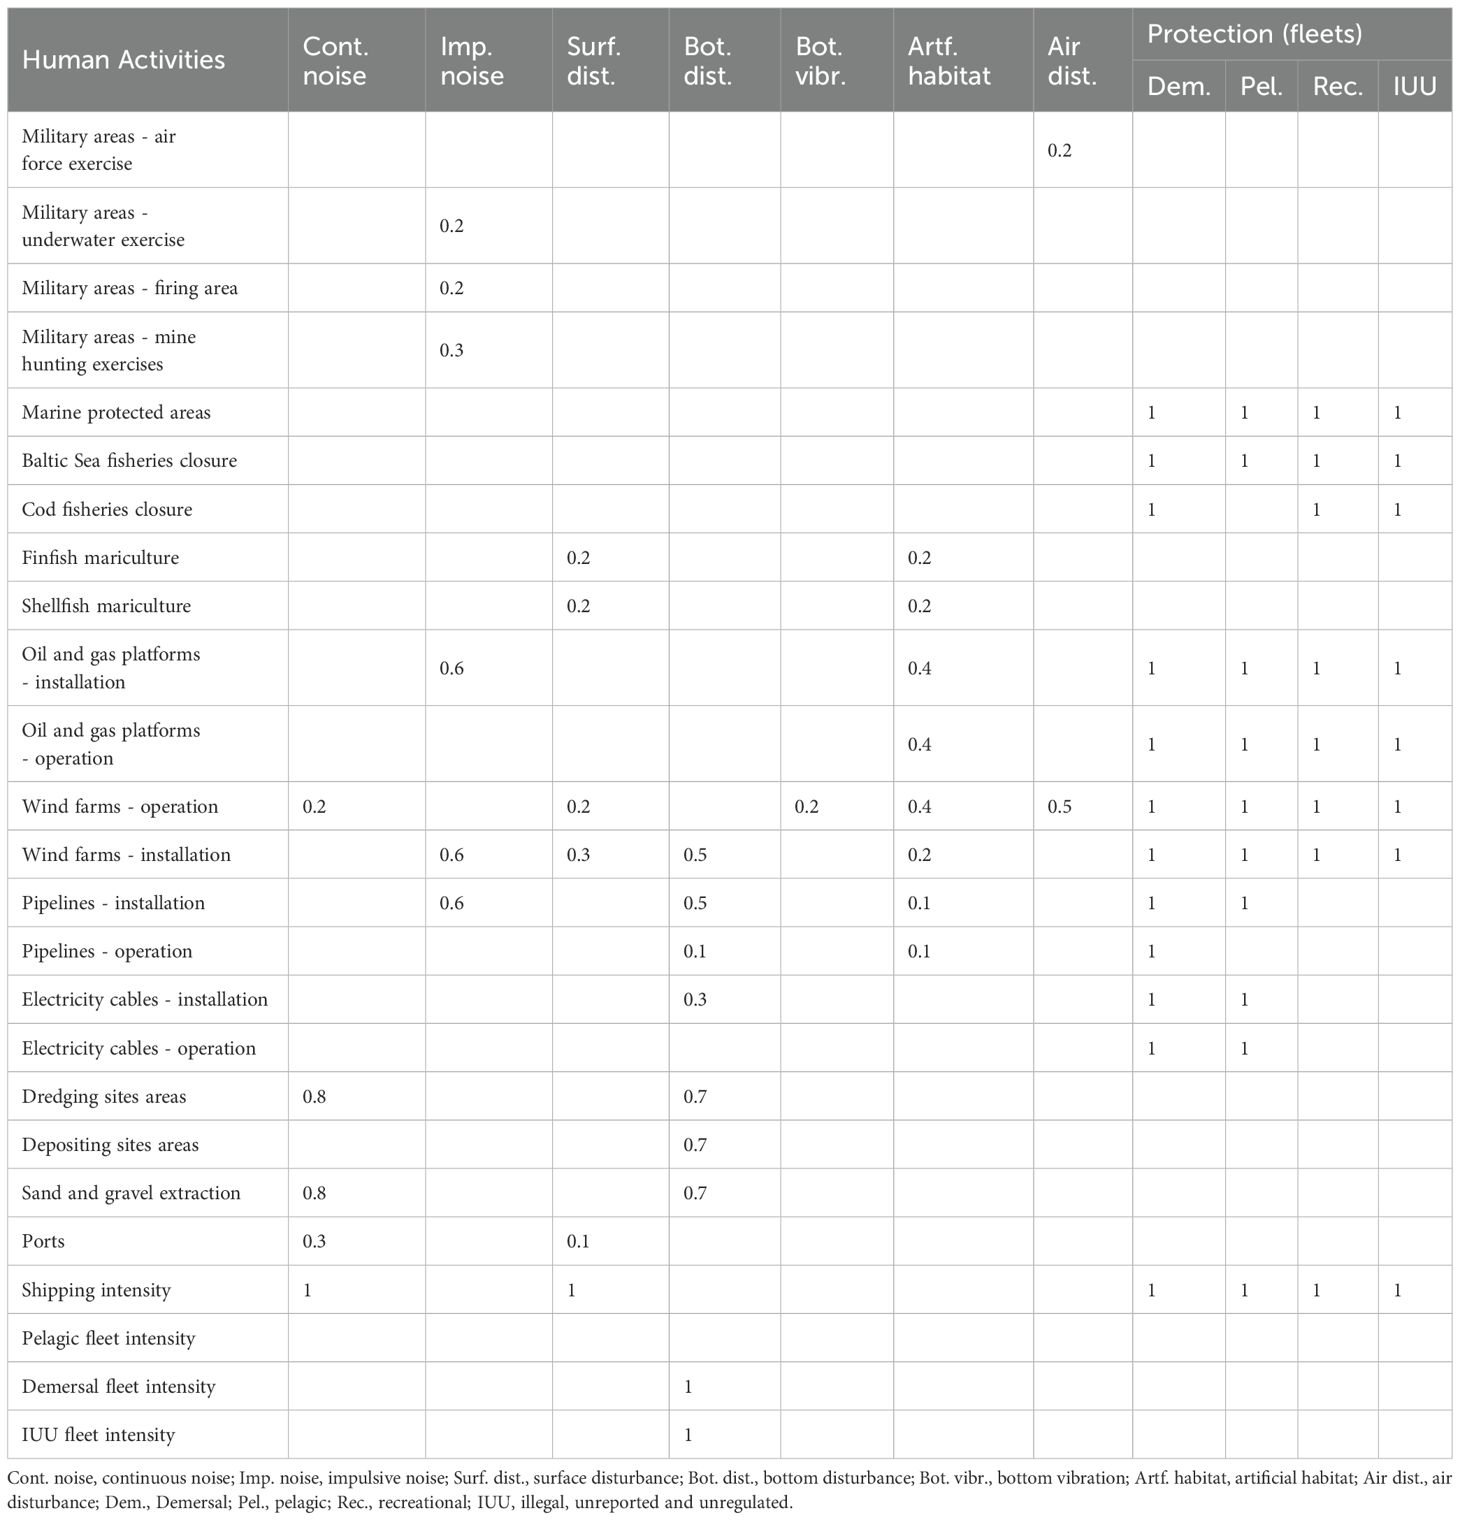
Table 1. Human activities in the western Baltic Sea and their contribution to each pressure from 0 (no contribution) to 1 (maximum contribution).
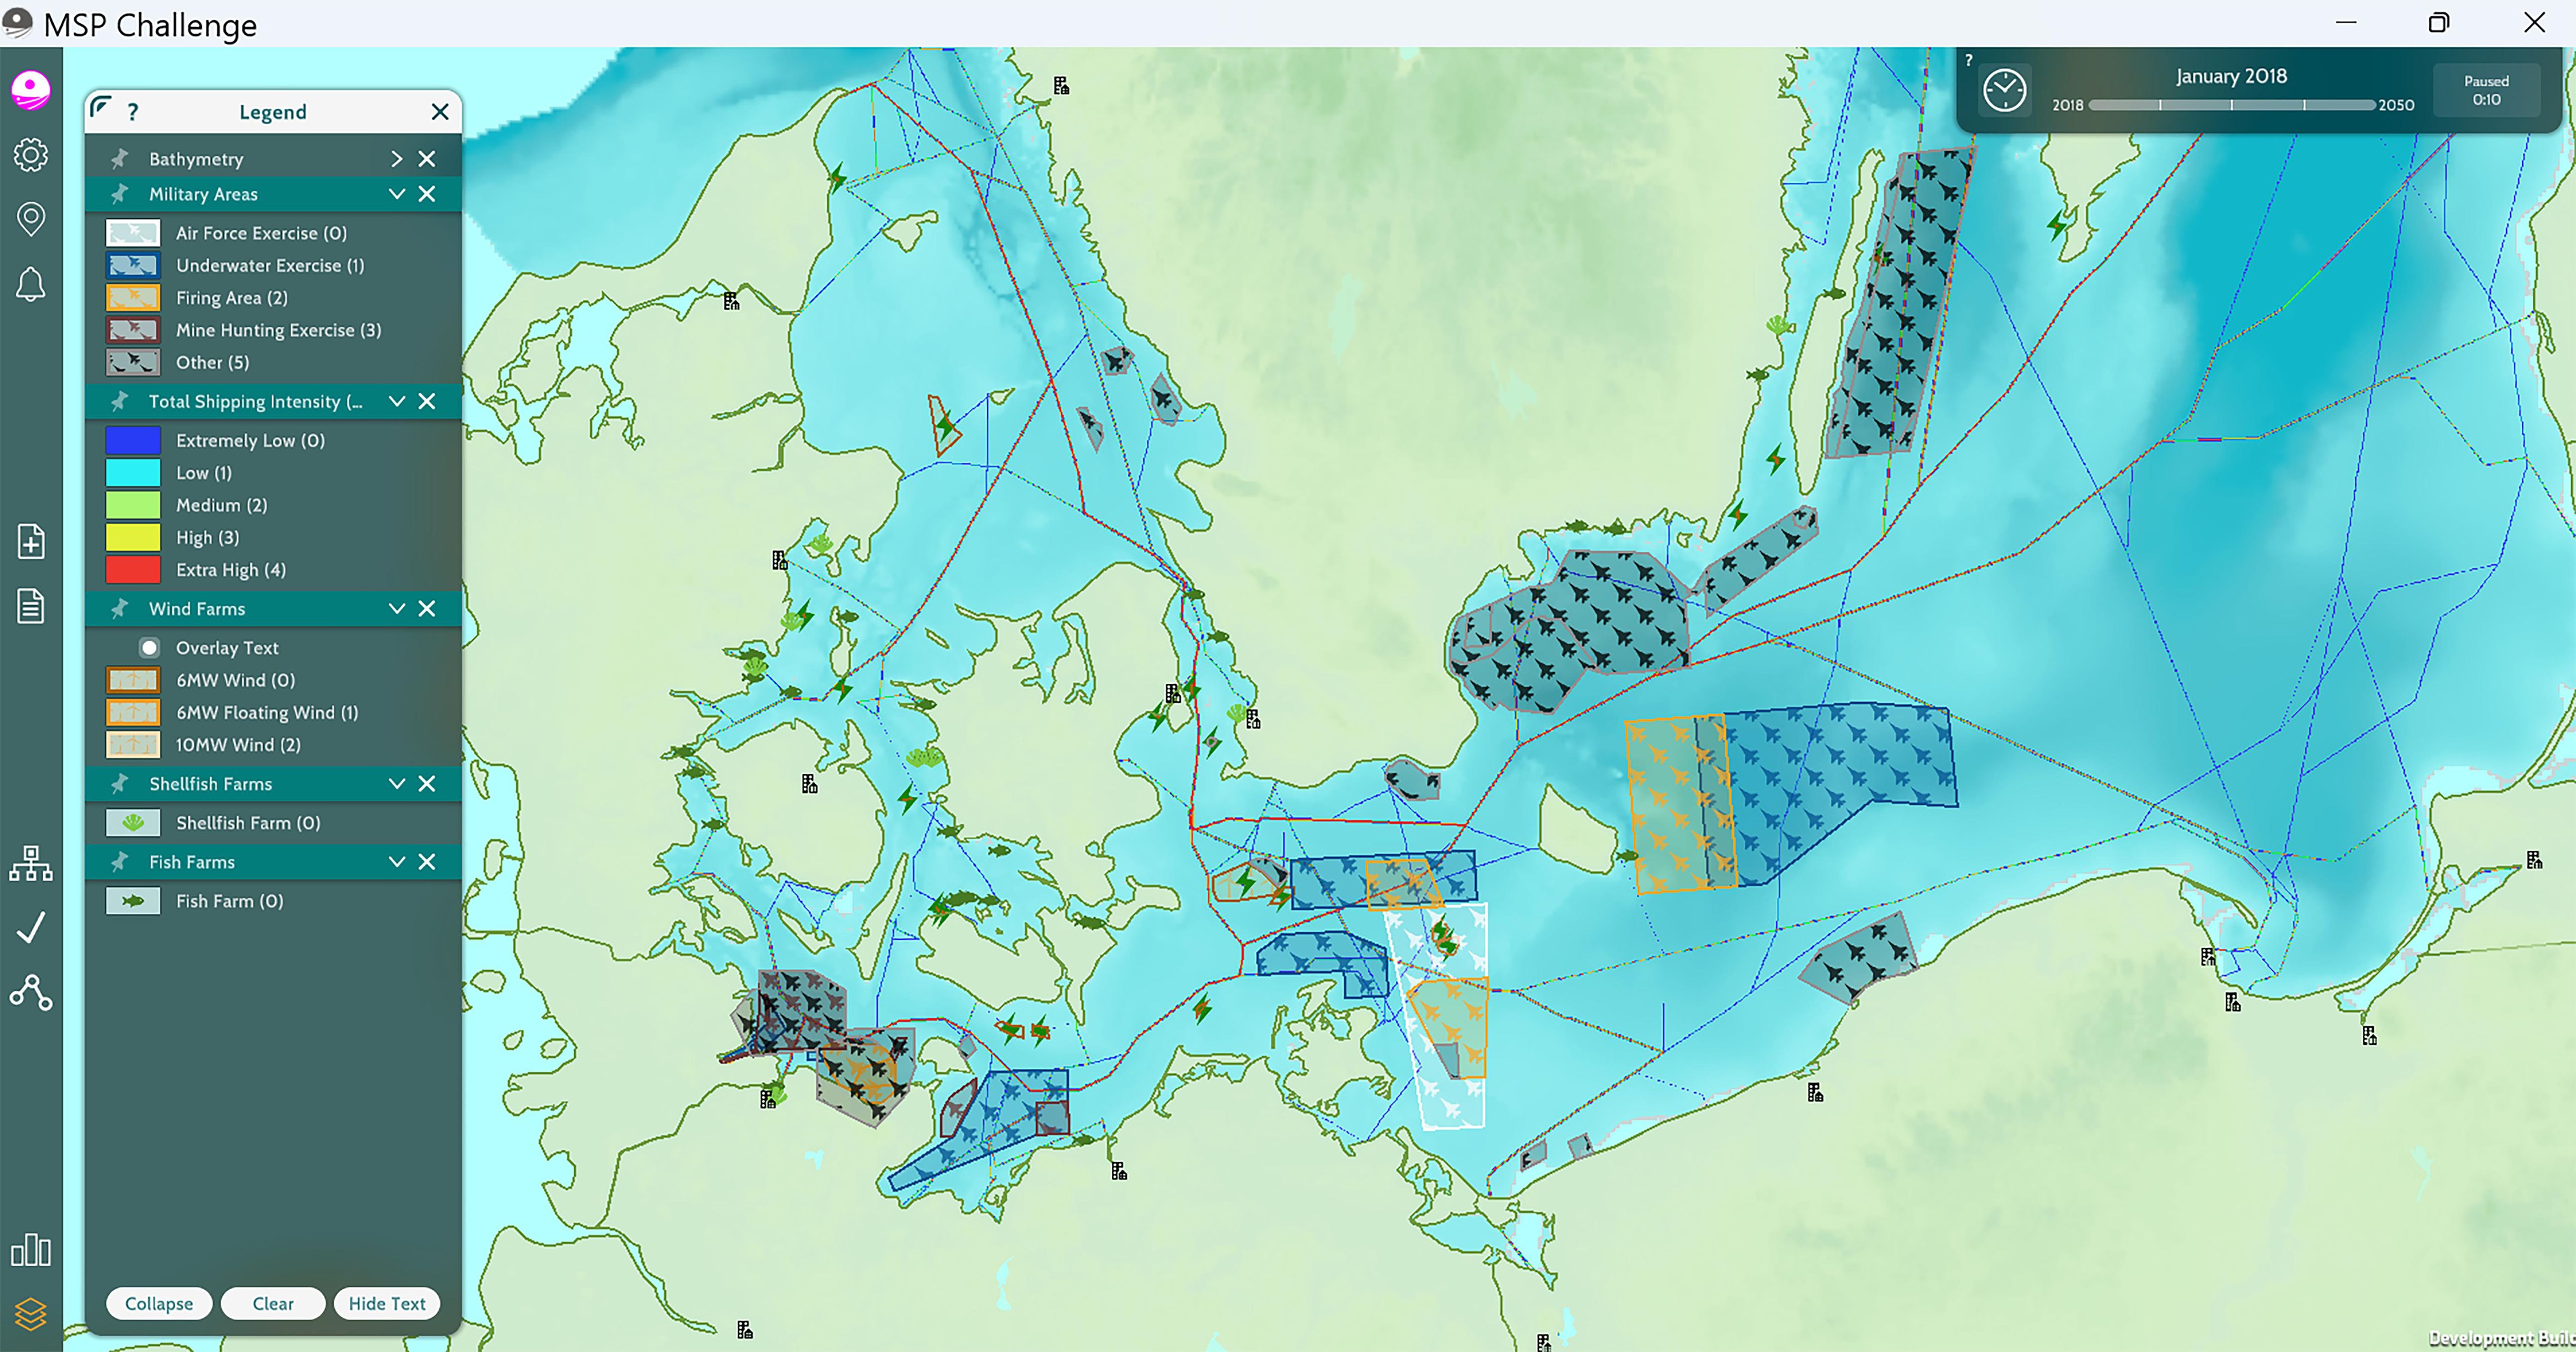
Figure 2. Location of military areas, simulated shipping intensity, wind farms in operation, and aquaculture sites in the western Baltic Sea Edition of the MSP Challenge.
2.3.2 The original MSP challenge pressure system
The original MSP Challenge pressure system, as described by Santos and Gonçalves (2016) and Steenbeek et al. (2020), includes artificial substrate, noise, bottom disturbance, protected sites, and fishing intensity (Table 2). The construction of structures in the marine environment can negatively affect the seafloor (i.e., contributing to the bottom disturbance pressure) but can also create new habitats, potentially benefitting benthic species that require hard surfaces to settle. Noise generally alters species distribution as it encompasses diverse types of disturbance, including vibrations, continuous and impulsive sound. Bottom disturbance refers to stressors that act on or near the seafloor, such as the release of chemical pollutants and the generation of sediment plumes from resource extraction or the installation of structures. Protected sites are areas where fishing is excluded; in the original pressure system, this category includes both marine protected areas and offshore wind farms. Fishing intensity allows scaling the EwE fishing effort to reflect the fleet activity across the times series.
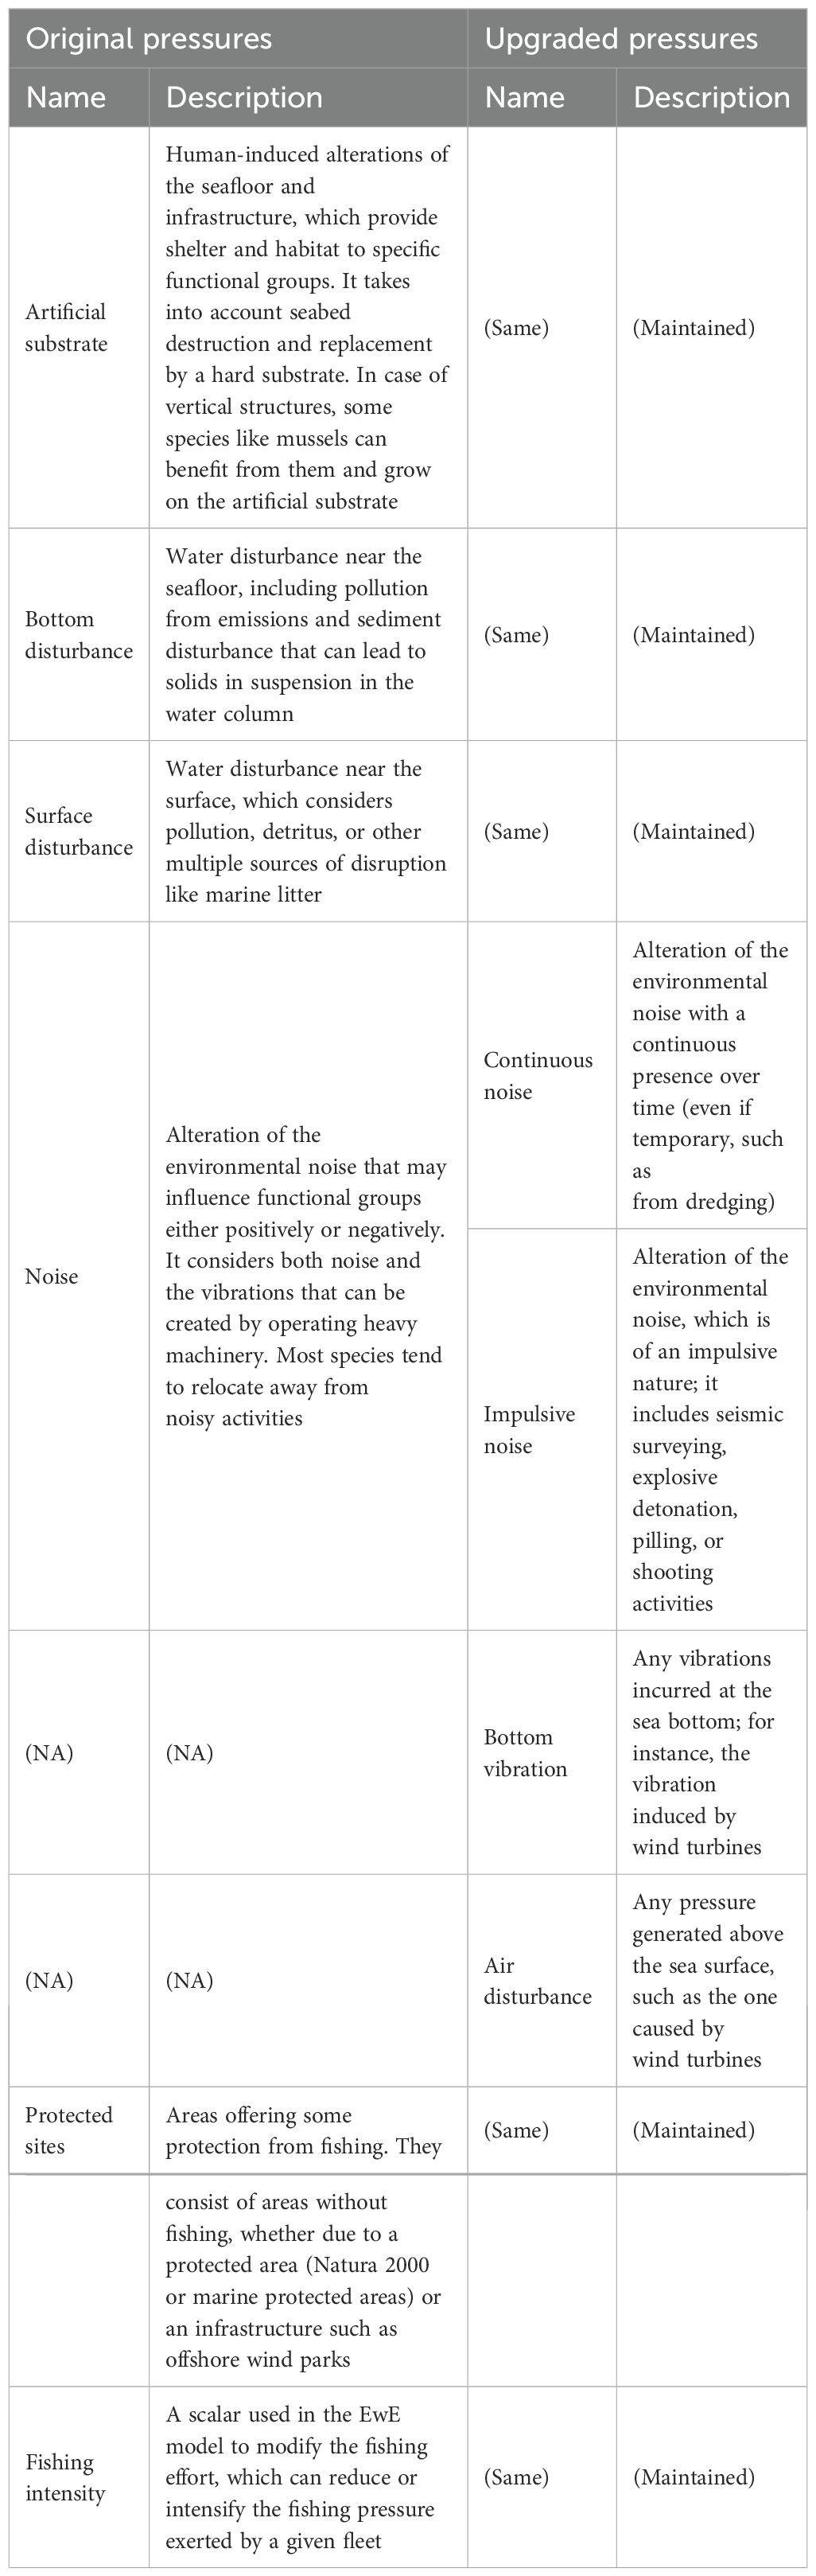
Table 2. Description of the original and updated MSP challenge pressures based on human activities.
2.3.3 The updated MSP challenge pressure system
The authors introduced four new pressures to assess human activities: continuous noise, impulsive noise, air disturbance, and bottom vibration. These additions clarify the ecosystem impacts of the wind farms, distinguishing them from general noise and surface disturbance. Previously, noise encompassed both noise and vibrations, and the potential for bird collisions with wind turbines was considered under surface disturbance alongside other activities such as shipping. The revised framework splits noise into continuous noise, impulsive noise (HELCOM, 2023), and bottom vibration, while adding air disturbance. The authors hypothesize that using more specific pressure types will allow for a more refined activities/pressure matrix, better reflecting the effects of different pressures on the various FGs in the Baltic Sea. This would also lead to a better understanding of the effects of the different phases of wind farm development on the ecosystem. Table 2 compares the original pressures in the MSP Challenge with the newly proposed ones. Figure 3 illustrates differences in pressure calculations between the two systems. The upper-left map shows noise pressure as calculated under the original system while the other three maps visualize impulsive noise, continuous noise, and bottom vibration, which represent distinctive pressure types that can be differentiated using the new system introduced in this paper.
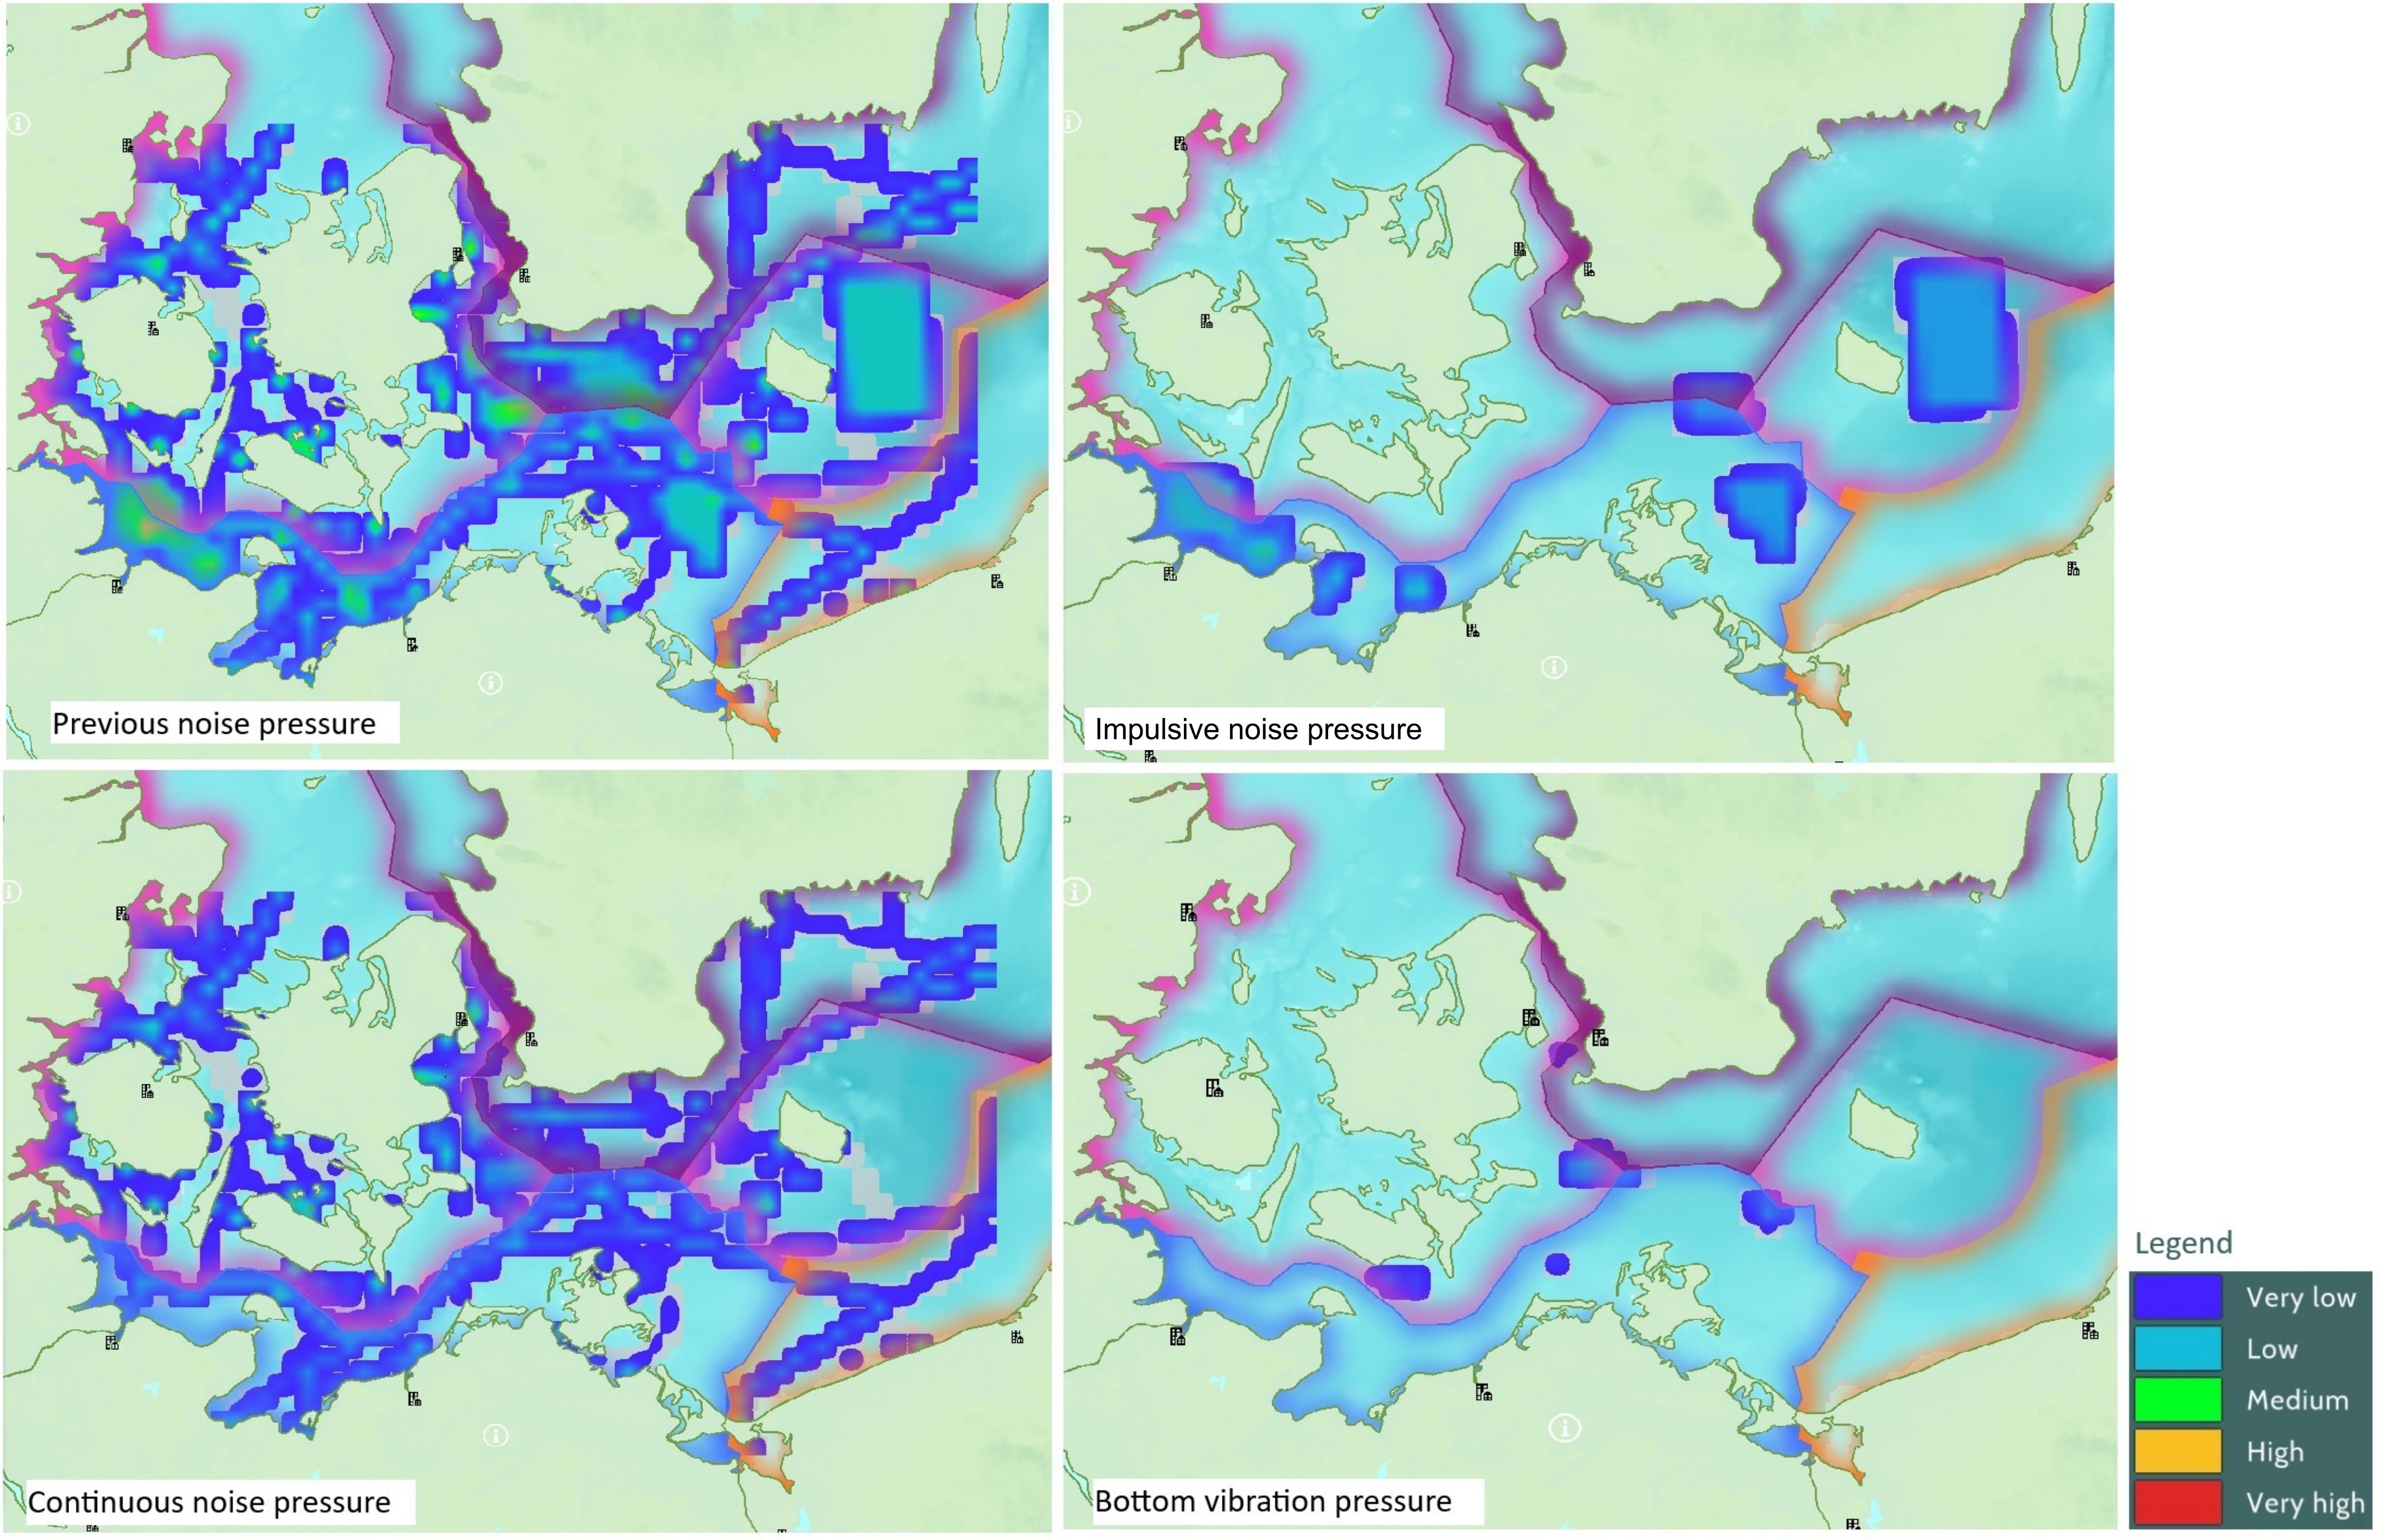
Figure 3. Comparison between the original noise pressure (top left) and the new pressures defined in this paper: Impulsive noise on top right, continuous noise on bottom left, and bottom vibration on bottom right.
2.4 Impact of human activities on the functional groups
A semi-quantitative approach based on a risk assessment matrix is developed to define the impacts of human activities on the functional groups in the Ecospace model. This approach is inspired by the Leopold matrix (Leopold et al., 1971), a classic Environmental Impact Assessment (EIA) tool developed to identify and evaluate environmental impacts resulting from human activities. The proposed framework integrates multiple impact dimensions, including the magnitude of the effect, damage intensity, and probability of occurrence, to evaluate systematically the pressures on each FG. The impact (I) is calculated using the following equation:
Where:
· I = impact of a specific pressure on a given FG.
· Ef = potential effect of the pressure, scaled from 1 to 5.
· D = potential damage associated with the pressure on the FG, scaled from 1 to 3.
· Prob = likelihood of the pressure affecting the FG, scaled from 1 to 10.
To ensure that the combined impact of Ef and D does not exceed their expected limits, the values were normalized by their maximum possible product (15). This normalization ensures that each component of the index contributes proportionally to the result. For consistency and comparability, standardized scales for each parameter are defined as below:
Effect (Ef) - adapted from what was proposed by Gușatu et al. (2021) for the impacts of offshore wind farms:
· 1 – Only behavioral responses are expected.
· 2 – Changes in the species’ perception of the environment.
· 3 – Physiological alterations in affected species.
· 4 – Physical injuries likely due to the activity.
· 5 – Activity-induced mortality.
Damage (D):
· 1 – Low (recoverable).
· 2 – Intermediate (recoverable with potential side effects).
· 3 – High (permanent).
Probability (Prob) – This scale is intentionally defined with discrete values representing thresholds of probability, avoiding unnecessary granularity for a semi-quantitative assessment:
· 0 – No potential impact (no expectation of the FG being affected by the pressures at all).
· 1 – Almost impossible to impact (very low expectation of FG being affected by the pressure in space and time).
· 2 – Low probability of impact on the FG.
· 5 – Equal probability of causing impact or not.
· 8 – Impact likely, but intensity uncertain.
· 10 – Impact is certain to happen.
The impacts of pressures on FGs can be positive or negative and are classified into four intensity levels: low, intermediate, high, and extreme. Figure 4 illustrates the shape of the curves of the impacts calculated from this matrix and imputed in Ecospace; negative effects are shown on the top and positive effects on the bottom. This approach provides a practical and adaptable tool for systematically defining the effects of human pressures on FGs in the interface Ecospace-MSP Challenge platform.
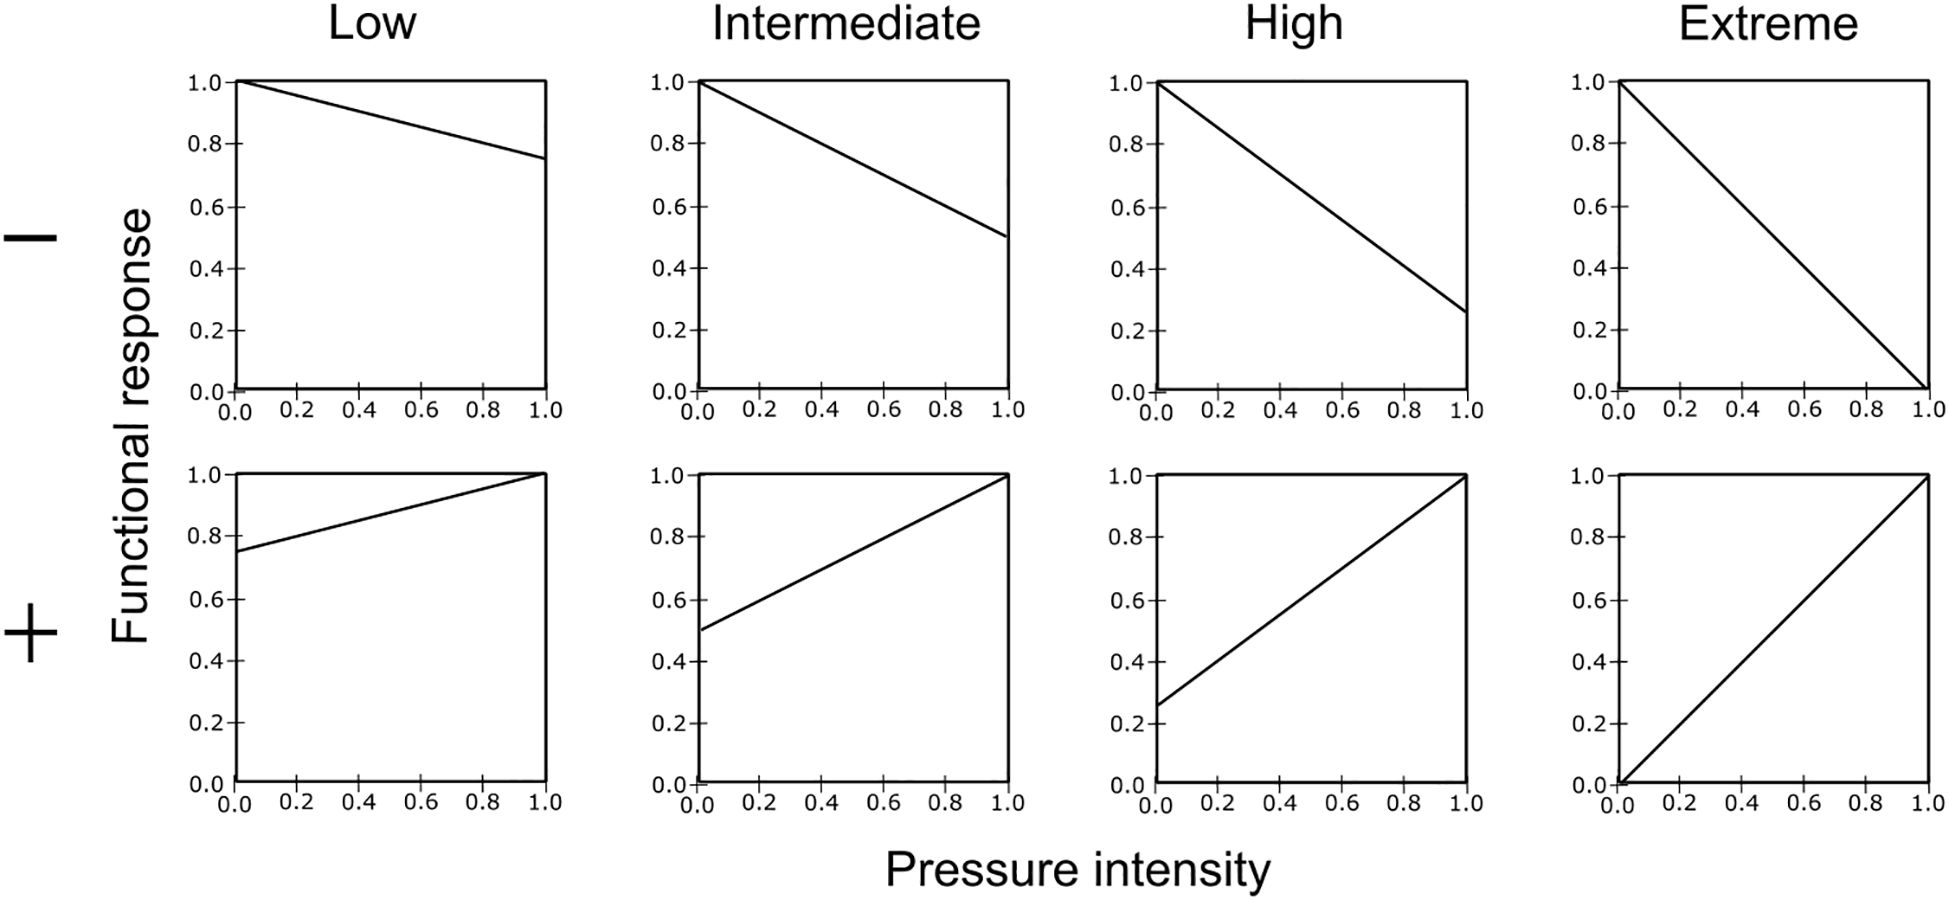
Figure 4. Shape of the functional responses representing the effect of pressures on the functional groups or species. The x-axis represents pressure values ranging from 0 (no pressure) to 1 (maximum pressure), while the y-axis shows the relative influence on the biomass affected by the pressure. Negative effects are shown on the top and positive effects on the bottom.
The types of impacts each pressure causes on the FGs were derived from the literature and are listed in Table 3. The impacts are based on the best available data. However, current knowledge regarding the effects of certain disturbances, such as underwater noise, on specific life stages or taxa remains limited and may be refined by future research.
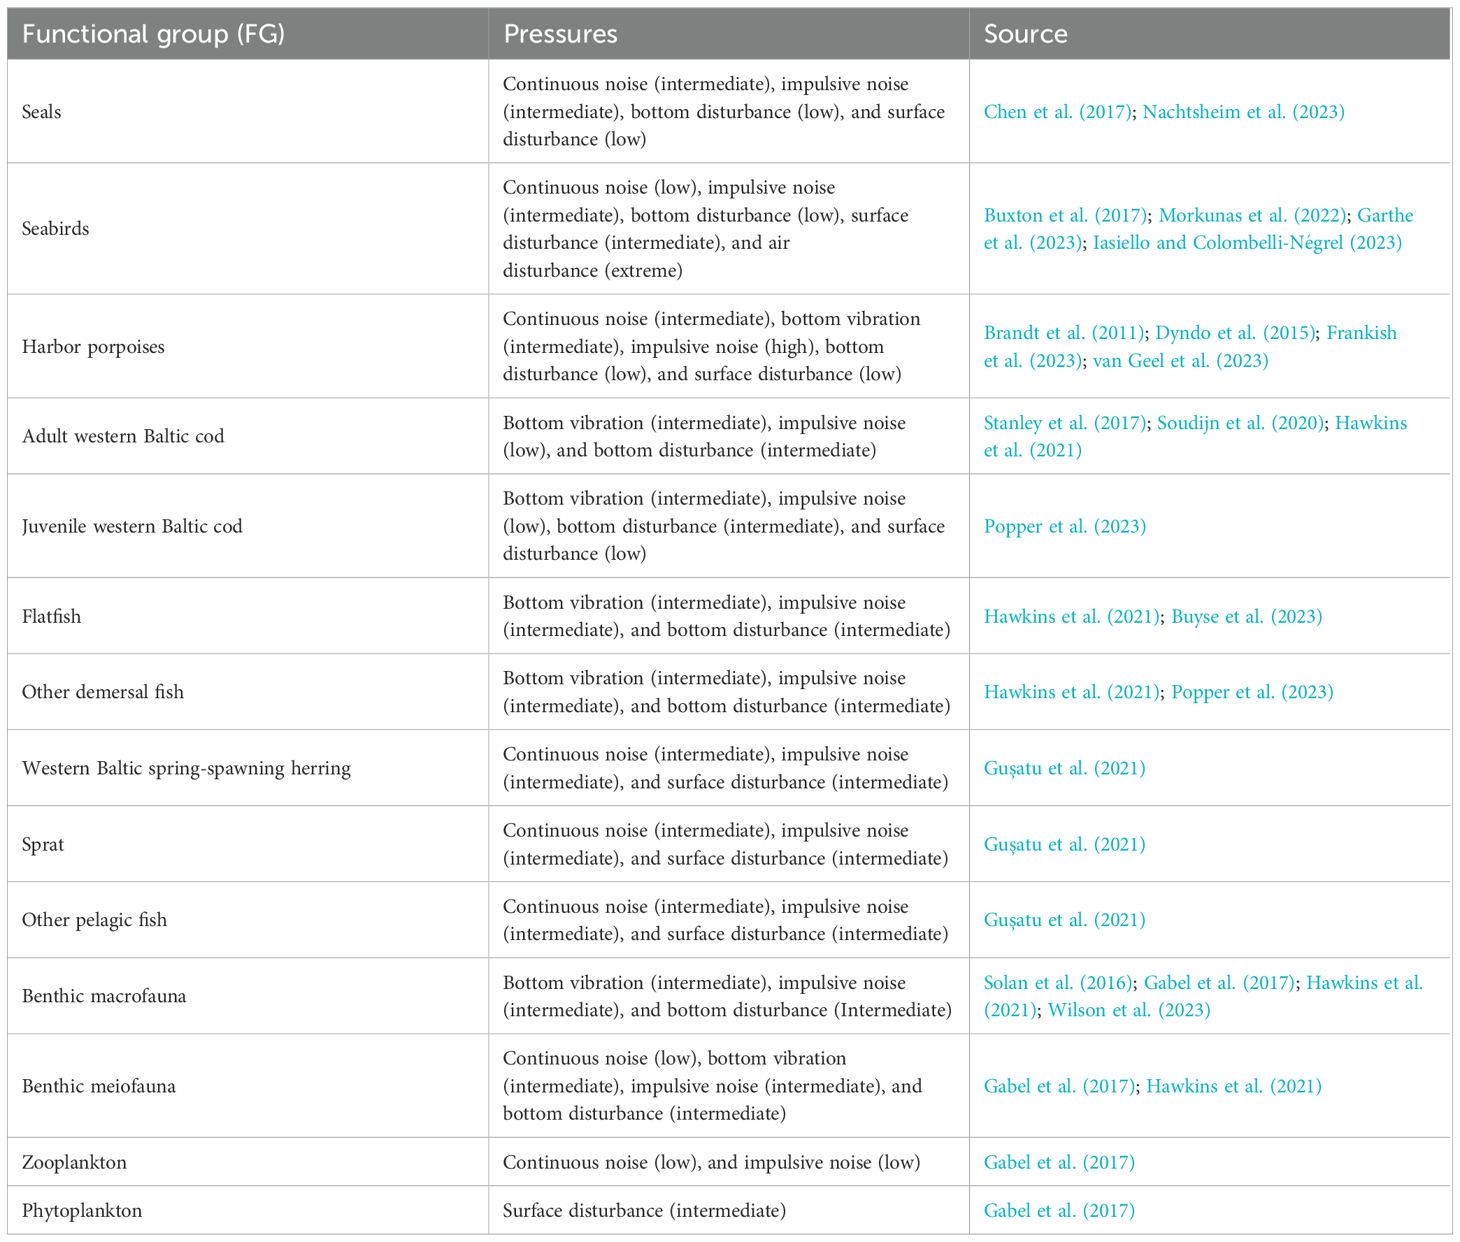
Table 3. Impact of human pressures on each functional group. The type of functional response assigned is indicated in brackets (see Figure 4 for reference).
2.5 Testing the updated system
EwE developed an application to return the models’ reaction to the pressures created by the MSP Challenge, i.e., the MSP tools. To verify if the new pressure system would improve the assessment proposed by the MSP Challenge using the original system, the MSP tools were used to run the WBS Ecospace model with the original set of pressures and the new one proposed in this paper. The total biomass estimated using the two systems was analyzed at the end of the 100 years of simulation. The resulting FGs’ distributions were then compared in the R statistical environment (R Core Team, 2024) by subtracting the raster files using the Terra package (Hijmans, 2024). The difference is displayed using a contrasting color scale to highlight where the simulated biomass of the FGs remains similar, decreases, or increases. The goal of these analyses is to quantify whether the new pressure system modifies the total biomass estimates and the relative biomass distribution of the FGs compared to the original MSP Challenge pressure system. It is important to note that the pressures calculated in both cases (i.e., using the original and the new pressure systems) reflect only the current state of human activities in the Baltic Sea. If this work succeeds, it will enable scientists and policy advisors to more effectively evaluate their plans for future development of offshore wind farms in the Baltic Sea and other regional seas.
3 Results and discussion
3.1 Human activities and the new pressure system
The new pressure system was expected to generate more localized impacts of wind farms on seabirds and harbor porpoises. These FGs are characterized by stronger direct responses to pressures (i.e., air disturbance and impulsive noise, respectively). The hypothesis was that the biomass of these FGs would decrease, especially around wind farms (for seabirds) and military areas (for harbor porpoises). The differences between total biomasses simulated with the updated and original system at the end of the century (i.e., 2100) never exceed 2%, with the highest absolute deviations observed for the two ontogenetic stages of the western Baltic cod, seabirds, other pelagic fish, sprat (all these groups increased), and harbor porpoise (which decreased; Figure 5). Although these cumulative differences might seem negligible, a finer assessment of the relative spatial changes found with the updated model reveals the importance of modelling with increased detail the different pressure types. Spatial distributions in the updated system show that biomass concentrations of the most sensitive FGs decline in areas with activities related to the new pressure types, notably offshore wind farms and military zones (Figure 6). Although no major reductions in the total biomasses occurred after the 100-year simulation, the effect of the new pressures introduced by our updated system became evident at the local scale. In response to the disturbance caused by wind farm energy generation and military activities, the biomass of the most sensitive FGs, i.e., harbor porpoises and seabirds, is re-distributed to areas unaffected by the proposed activities (maps A and B in Figure 6). The magnitude of the largest relative changes observed for seabirds is more than twice that simulated for harbor porpoises. These outcomes were obtained without introducing any new human activities in the simulations; only the pressure calculation method was changed. Therefore, no major changes in the biomass quantities were found, and the effects of the pressures were mostly reflected by local variations in the relative biomass distribution.
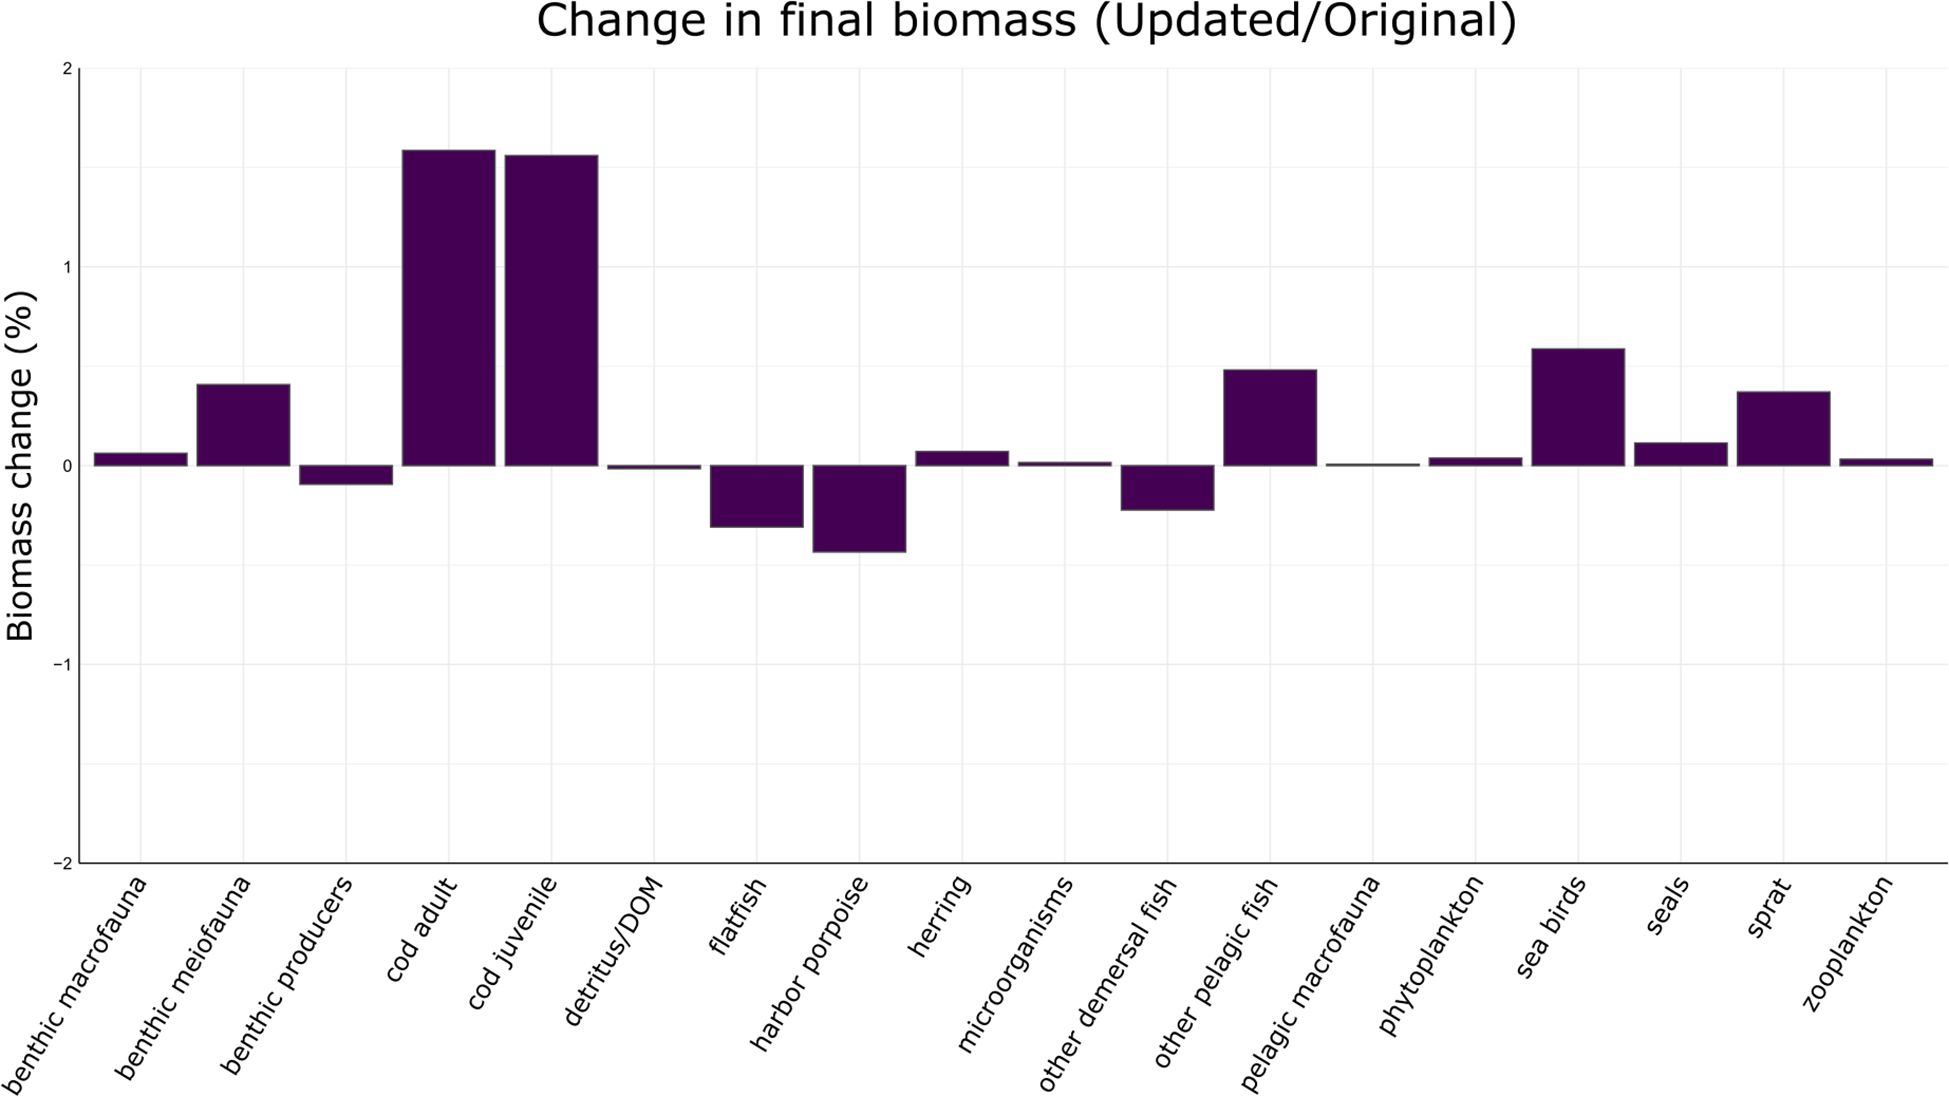
Figure 5. Biomass change (%) in 2100, calculated by comparing Ecospace simulations using the updated and original pressure systems.
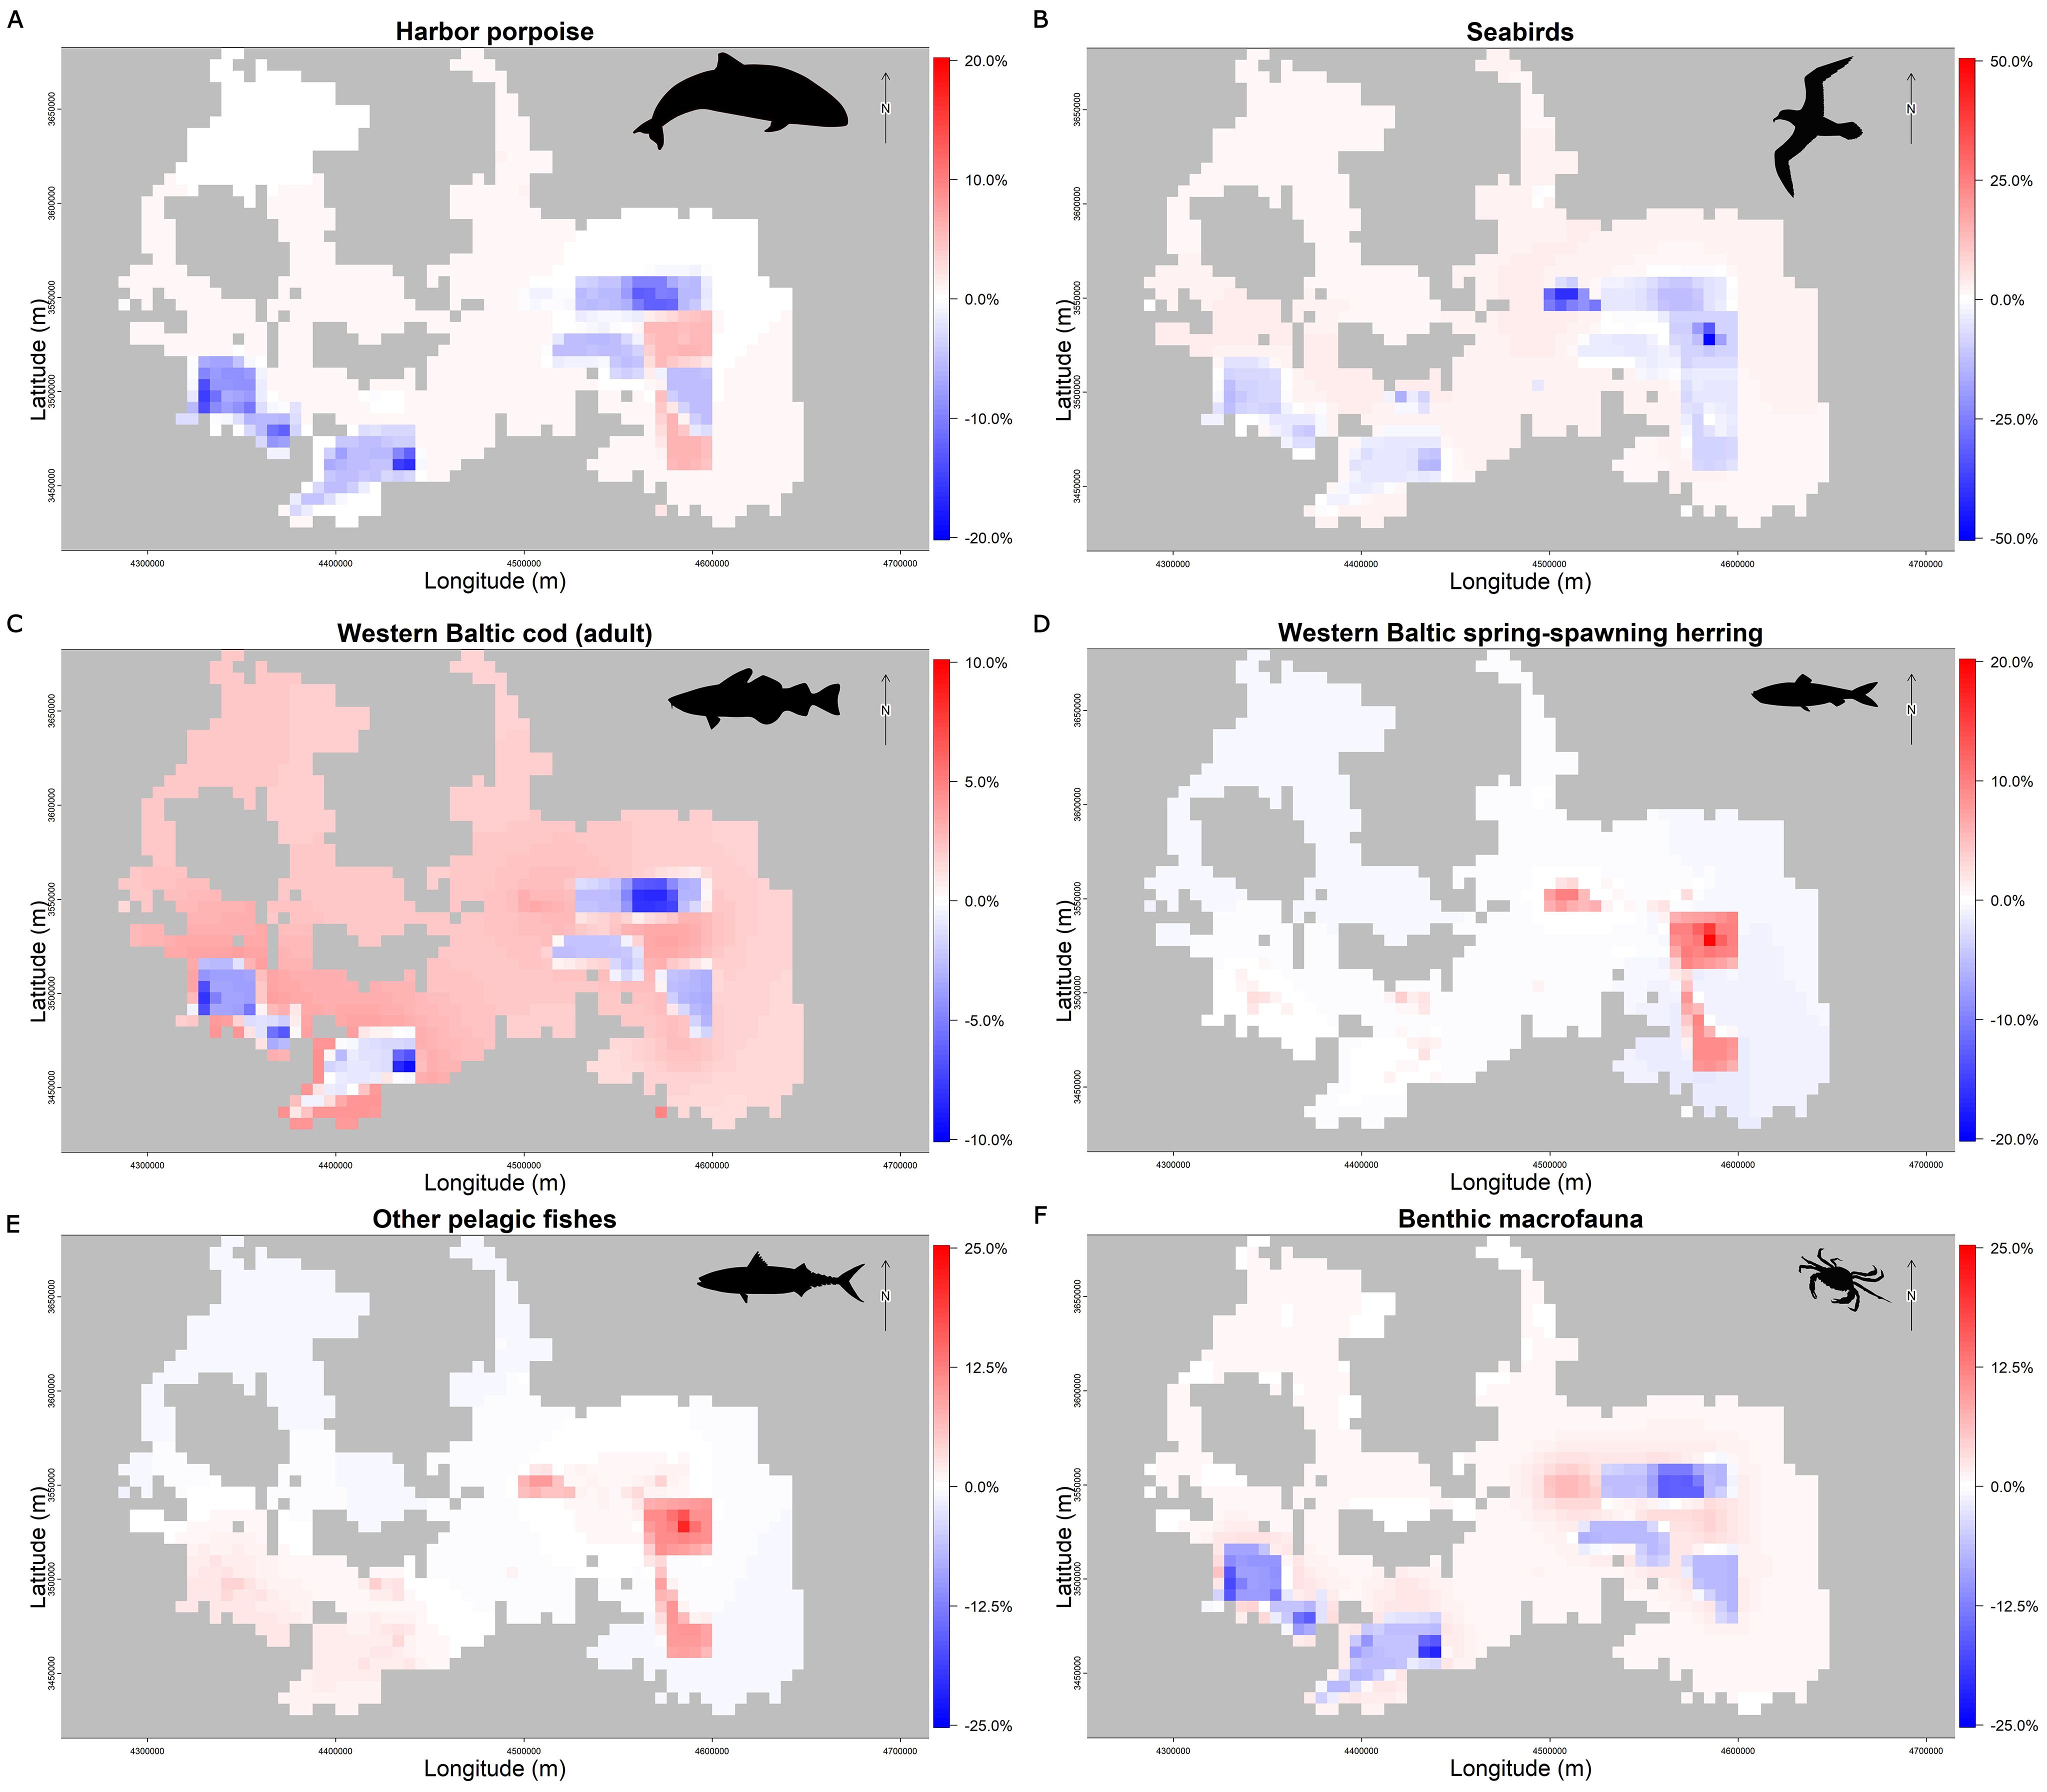
Figure 6. Difference in the biomass (%) distribution of (A) harbor porpoises, (B) seabirds, (C) adult western Baltic cod, (D) western Baltic spring-spawning herring, (E) other pelagic fishes, and (F) benthic macrofauna in the western Baltic Sea at the end of the century (i.e., 2100). The difference was obtained by comparing the results based on the original and updated systems of pressures. Blue areas indicate biomass reduction while areas in red stand for biomass increase.
Harbor porpoises are known to be highly sensitive to underwater noise, with sound having a relevant impact on their navigation, foraging, and communication system. High frequency and impulsive noise are especially dangerous for them (Dyndo et al., 2015; Frankish et al., 2023; van Geel et al., 2023). The new pressure system, including the bottom vibration and impulsive noise, takes into account the strong impacts of activities such as wind farms operation and installation, and underwater military exercises. During the simulations, harbor porpoises’ biomass was mainly regulated by their tendency to avoid impulsive noise, which is largely caused by military activities (Figure 6A). Seabirds were instead affected by aerial activities of offshore wind farms where the main impact is the air disturbance (Figure 6B). Seabirds were affected only by the surface disturbance in the original pressure system. However, recent studies showed they avoid offshore wind farms and surrounding areas (Garthe et al., 2023), and impulsive noise can interfere with their reproductive behavior (Buxton et al., 2017; Iasiello and Colombelli-Négrel, 2023). For these reasons, in the new version of the model we updated the list of pressures and their effects on seabirds (Table 3).
The updated pressure system revealed a nuanced interaction between anthropogenic pressures and the responses of some species and trophic groups. For organisms sensitive to underwater vibration, such as marine mammals and bottom-related species (e.g., benthic macrofauna, western Baltic cod, and flatfishes), negative effects of the bottom vibrations caused by wind farms can be seen on local populations. In the simulation, this negative effect is also observed for the harbor porpoise (Figure 6A), supporting previous findings in the literature (van Geel et al., 2023). However, the fishing exclusion zones surrounding these installations may represent a protective buffer, since fishing is not allowed in offshore wind farm areas, offsetting some adverse impacts. Studies have shown that harbor porpoises may increase in abundance after the construction of wind farms, possibly due to increased food availability and reduced fishing pressure (Galparsoro et al., 2022). Similarly, some fishes benefit from the artificial reef effect of wind turbine foundations, with species associated to the rocky environment showing higher abundance near offshore wind farms (Galparsoro et al., 2022).
The distinction between construction and operational phases is crucial for evaluating species responses. While the installation phase primarily causes temporary disturbances to marine habitats, the operational phase induces long-lasting changes by altering water mixing, nutrients’ balance, and light penetration (Benkort et al., 2024). Thus, the proposed distinction between impulsive noise (installation phase) and continuous noise (operation phase) allows a clearer evaluation of species with different responses to these pressures, such as adult cod and harbor porpoises in our study case. While cod is sensitive to impulsive noise created during the installation phase, the harbor porpoise is sensitive to both impulsive and continuous noise.
In simulations based on both pressure systems (i.e., original and updated ones), species like western Baltic spring-spawning herring, sprat, and other pelagic fishes benefited from the reduced fishing pressures within wind farm zones (maps D and E in Figure 6). While the protection from fishing enhanced their spatial presence in the proximity of the offshore wind farm area, their absolute biomass remained largely unchanged (Figure 5). This outcome highlights that offshore wind farms may contribute to the local spatial redistribution of species rather than improving the overall ecosystem productivity. Galparsoro et al. (2022) discuss that the presence of offshore wind farms can lead to a redistribution of biomass due to local effects, such as the structural complexity provided by turbines and foundations that act as artificial reefs and fish aggregation devices, as well as the exclusion of bottom trawling for safety reasons. These factors can enhance biodiversity in areas with homogeneous seabed and attract more marine life than natural reefs. Additionally, spillover effects can be generated by creating zones of increased biomass and biodiversity that may extend into surrounding areas. These authors, however, highlight that there is limited evidence regarding a global increase in productivity due to offshore wind farms, a hypothesis that seems to be corroborated by our findings.
The introduction of hard substrates, changes in sediment dynamics, bottom vibration generated in all phases by the wind farms, and underwater military activities can lead to local impacts on benthic macrofauna (Hawkins et al., 2021; Wilson et al., 2023). However, reducing fishing activities, particularly trawling, may partially mitigate these pressures (Dannheim et al., 2020). Comparing both simulations, the introduction of bottom vibration and impulsive noise into the pressure matrix shows stronger local impacts caused by military areas with underwater activities and offshore wind farms. Nonetheless, fishing exclusion (mainly trawling), coupled with reduced sediment disturbance, partially mitigated these pressures, as indicated by an increase in the biomass inside wind farm areas compared to the original pressure system (Figure 6F).
Our study reinforces the dual-edged nature of human activity-induced pressures. For instance, while offshore wind farm development introduces new stressors, their associated exclusion zones for fishing activities and shipping offer compensatory ecological benefits, particularly for pelagic species previously overexploited by fisheries.
3.2 New metric for defining the impact of human activities on functional groups
The new approach introduced here advances the assessment of human activities’ impact on FGs and species, providing a tool that can be applied in MSP. Unlike traditional tools, which can be static and qualitative, our work integrates an approach derived from the Leopold matrix into the Ecospace model. It ensures greater precision and replicability in defining the impacts of human activities in the MSP Challenge, compared to traditional methods. In fact, it enables the transformation of impacts triggered by specific pressures into changes in biomass and spatial distribution over time and space. This integration enhances the inclusion of ecological mechanisms into the MSP, promoting a more robust and informed analysis of how human activities can affect the functioning of marine ecosystems (Ehler and Douvere, 2009). Applying standardized metrics and scales specific to effect, damage, and probability, the approach reduces the subjectivity often associated with the parameterization of environmental pressures in ecological models (Christensen et al., 2014). This characteristic makes the tool more objective and replicable, which is critical for comparative studies. In the context of policies such as the European Green Deal (European Commission, 2019) and the EU Strategy for Renewable Offshore Energy, which aims to expand the maritime infrastructure while preserving the ecological integrity of European and global seas (European Commission, 2019), this new approach can support modelers and users in generating more realistic results to address the challenge of producing clean energy with reduced ecosystem impacts.
3.3 Limitations
Under real-world conditions, the intensity of pressures such as fishing, shipping, and coastal development typically decreases with distance from areas where these activities are concentrated. This process, known as spatial decay, requires responses to be modelled as a function of distance from a given pressure intensity. In the pressure layers derived from human activities, we did not explicitly incorporate distance-based attenuation. Therefore, our analysis does not account for the capacity to model spatial decay. Another important aspect to highlight is that our Ecospace model was constructed on a grid of square cells, each approximately 6 km per side; this represents the minimum size of a spatial feature in the model, such as a wind farm. As a result, the impact of smaller structures may be overestimated while those slightly larger than a single cell size may be underestimated. It is important to highlight that the impacts are based on the best available data; however, current knowledge of disturbance effects remains limited and could be improved. We have expanded our analysis to include activities such as offshore wind farms, detailing construction and operation phases that generate distinct impacts. Additional phases with different characteristics, as described by Mooney et al. (2020), could also be incorporated. Despite significant progress, a major limitation in ecosystem modelling for marine spatial planning remains the scarcity of empirical data derived from EIAs, particularly those from long-term monitoring of existing projects. Consequently, many studies continue to rely heavily on subjective methods based on experts’ knowledge. Our approach seeks to address this gap by providing a more systematic and objective framework for impact evaluation, though it inevitably retains a degree of subjectivity due to its semi-quantitative nature. The advantage is that this methodology is highly scalable and transferable to other marine regions, as established best practices for ecosystem modelling can readily support adaptations tailored to specific contexts, such as the MSP Challenge.
4 Conclusions
The simulation results demonstrate that the new pressure system more effectively captures changes in the spatial distribution of FGs’ biomass, identifying areas of higher vulnerability to human activities. Species and FGs with high sensitivity to impulsive noise, aerial structures, and bottom vibration, such as harbor porpoises and seabirds, exhibit more pronounced spatial discrepancies under the new system compared to the original. Moreover, the spatial distribution simulated for harbor porpoises and seabirds matches more closely empirical evidence (Brandt et al., 2011; Garthe et al., 2023; Iasiello and Colombelli-Négrel, 2023; van Geel et al., 2023), indicating enhanced ecological realism. The proposed standardization of impacts, which distinguishes between behavioral, physiological, and mortality effects, facilitates communication among modelers, stakeholders, and policymakers by providing a shared framework for assessing trade-offs between conservation and sustainable development. The methodology developed and presented in this article significantly advances the assessment of human impacts in MSP, providing a more objective and ecologically grounded framework that aligns with contemporary conservation and sustainability challenges.
Data availability statement
The original contributions presented in the study are included in the article/Supplementary Material. Further inquiries can be directed to the corresponding author.
Author contributions
MN: Conceptualization, Data curation, Formal Analysis, Methodology, Visualization, Writing – original draft, Writing – review & editing. MG: Conceptualization, Data curation, Formal Analysis, Methodology, Writing – original draft, Writing – review & editing. JL: Data curation, Writing – review & editing. IM: Funding acquisition, Writing – review & editing. MS: Conceptualization, Formal Analysis, Funding acquisition, Writing – review & editing.
Funding
The author(s) declare financial support was received for the research and/or publication of this article. This research was funded by the German Federal Ministry of Education and Research (BMBF) through the German Alliance for Marine Research (DAM) as part of the project SpaCeParti 2.0 (DAM-SN-SpaCeParti 2.0 – Spatial solutions for a sustainability transformation of Western Baltic fisheries – Ecological solutions: Identification of spatial opportunities and protection needs; no. 03F0914D) and by the European Commission’s Horizon 2020 Research and Innovation program under grant agreement No 101000302 through the EcoScope project (Ecocentric management for sustainable fisheries and healthy marine ecosystems). The German Federal Agency for Nature Conservation (Bundesamt für Naturschutz, BfN) provided financial support to MCN and MS with funds from the Federal Ministry of the Environment, Nature Conservation and Nuclear Safety (BMU), under the project AWZ Fisch 4, grant agreement FKZ: 3524520800.
Acknowledgments
We acknowledge Jeroen Steenbeek, Harald Warmelink, and Till Bayer for their valuable support in implementing the MSP Challenge Edition of the western Baltic Sea.
Conflict of interest
The authors declare that the research was conducted in the absence of any commercial or financial relationships that could be construed as a potential conflict of interest.
Generative AI statement
The author(s) declare that no Generative AI was used in the creation of this manuscript.
Any alternative text (alt text) provided alongside figures in this article has been generated by Frontiers with the support of artificial intelligence and reasonable efforts have been made to ensure accuracy, including review by the authors wherever possible. If you identify any issues, please contact us.
Publisher’s note
All claims expressed in this article are solely those of the authors and do not necessarily represent those of their affiliated organizations, or those of the publisher, the editors and the reviewers. Any product that may be evaluated in this article, or claim that may be made by its manufacturer, is not guaranteed or endorsed by the publisher.
Supplementary material
The Supplementary Material for this article can be found online at: https://www.frontiersin.org/articles/10.3389/fmars.2025.1561347/full#supplementary-material
Footnotes
- ^ https://www.mspchallenge.info
- ^ https://helcom.fi/
- ^ https://emodnet.ec.europa.eu/en
- ^ https://www.imo.org/
References
Abspoel L., Mayer I., Keijser X., Warmelink H., Fairgrieve R., Ripken M., et al. (2021). Communicating maritime spatial planning: the MSP challenge approach. Mar. Policy 132, 103486. doi: 10.1016/j.marpol.2019.02.057
Ahrens R. N. M., Walters C. J., and Christensen V. (2012). Foraging arena theory. Fish Fish. 13, 41–59. doi: 10.1111/j.1467-2979.2011.00432.x
Al-Hamdani Z. and Reker J. (2007). Towards marine landscapes in the Baltic Sea. BALANCE interim report 10. Available online at: http://balance-eu.org/ (Accessed December 8, 2024).
Benkort D., Christiansen N., Ho-Hagemann H. T. M., Daewel U., and Gilles A. (2024). How do offshore wind farms affect the ocean? Front. Young Minds 12. doi: 10.3389/frym.2024.1336535
Brandt M. J., Diederichs A., Betke K., and Nehls G. (2011). Responses of harbour porpoises to pile driving at the Horns Rev II offshore wind farm in the Danish North Sea. Mar. Ecol. Prog. Ser. 421, 205–216. doi: 10.3354/meps08888
Buxton R., Galvan R., Mckenna M., White C. L., and Seher V. (2017). Visitor noise at a nesting colony alters the behavior of a coastal seabird. Mar. Ecol. Prog. Ser. 570, 233–246. doi: 10.3354/meps12073
Buyse J., Hostens K., Degraer S., De Troch M., and Cozijn D. (2023). Increased food availability at offshore wind farms affects trophic ecology of plaice Pleuronectes platessa. Sci. Total Environ. 883, 163226. doi: 10.1016/j.scitotenv.2023.163226
CBD (2024). Kunming-montreal global biodiversity framework: 2030 targets (with guidance notes). Available online at: https://www.cbd.int/gbf/targets (Accessed December 12, 2024).
Chen F., Shapiro G. I., Bennett K. A., Ingram S. N., Thompson D., Vincent C., et al. (2017). Shipping noise in a dynamic sea: a case study of grey seals in the Celtic Sea. Mar. pollut. Bull. 114, 372–383. doi: 10.1016/j.marpolbul.2016.09.054
Christensen V., Coll M., Steenbeek J., Buszowski J., Chagaris D., and Walters C. J. (2014). Representing variable habitat quality in a spatial food web model. Ecosystems. 17, 1397–1412. doi: 10.1007/s10021-014-9803-3
Christensen V. and Pauly D. (1992). ECOPATH II — a software for balancing steady-state ecosystem models and calculating network characteristics. Ecol. Model. 61, 169–185. doi: 10.1016/0304-3800(92)90016-8
Christensen V. and Walters C. J. (2004). Ecopath with Ecosim: methods, capabilities and limitations. Ecol. Model. 172, 109–139. doi: 10.1016/j.ecolmodel.2003.09.003
Christensen V. and Walters C. J. (2024). Ecosystem modelling with ewE (Vancouver, BC: The University of British Columbia). Available online at: https://pressbooks.bccampus.ca/eweguide/.
Coll M., Pennino M. G., Steenbeek J., Sole J., and Bellido J. M. (2019). Predicting marine species distributions: Complementarity of food-web and Bayesian hierarchical modelling approaches. Ecol. Model. 405, 86–101. doi: 10.1016/j.ecolmodel.2019.05.005
Dannheim J., Bergström L., Birchenough S. N. R., Brzana R., Boon A. R., Coolen J. W. P., et al. (2020). Benthic effects of offshore renewables: identification of knowledge gaps and urgently needed research. ICES J. Mar. Sci. 77, 1092–1108. doi: 10.1093/icesjms/fsz018
de Mutsert K., Coll M., Steenbeek J., Ainsworth C., Buszowski J., Chagaris D., et al. (2023). “Advances in spatial-temporal coastal and marine ecosystem modeling using Ecospace,” in Reference module in earth systems and environmental sciences (Elsevier). doi: 10.1016/B978-0-323-90798-9.00035-4
Dyndo M., Wiśniewska D. M., Rojano-Doñate L., and Madsen P. T. (2015). Harbour porpoises react to low levels of high frequency vessel noise. Sci. Rep. 5, 11083. doi: 10.1038/srep11083
Ehler C. and Douvere F. (2009). Marine spatial planning: a step-by-step approach toward ecosystem-based management. IOC Manual and Guides No. 53 (Paris: UNESCO). Available online at: https://unesdoc.unesco.org/ark:/48223/pf0000186559.
European Commission (2019). The european green deal. Available online at: https://ec.europa.eu/info/sites/default/files/european-green-deal-communication_en.pdf (Accessed December 2, 2024).
European Union (2014). Directive 2014/89/EU of the European Parliament and of the Council of 23 July 2014 establishing a framework for maritime spatial planning. Off. J. Eur. Union. 257, 135.
Frankish C. K., Von Benda-Beckmann A. M., Teilmann J., Tougaard J., Dietz R., Sveegaard S., et al. (2023). Ship noise causes tagged harbour porpoises to change direction or dive deeper. Mar. pollut. Bull. 197, 115755. doi: 10.1016/j.marpolbul.2023.115755
Gabel F., Lorenz S., and Stoll S. (2017). Effects of ship-induced waves on aquatic ecosystems. Sci. Total Environ. 601-602, 926–939. doi: 10.1016/j.scitotenv.2017.05.206
Galparsoro I., Menchaca I., Garmendia J. M., Borja A., Maldonado A. D., Iglesias G., et al. (2022). Reviewing the ecological impacts of offshore wind farms. Ocean. Sustain. 1, 1. doi: 10.1038/s44183-022-00003-5
Garthe S., Schwemmer H., Peschko V., Markones N., Müller S., Schwemmer P., et al. (2023). Large-scale effects of offshore wind farms on seabirds of high conservation concern. Sci. Rep. 13, 4779. doi: 10.1038/s41598-023-31601-z
Gonçalves M., Steenbeek J., Tomczak M., Romagnoni G., Puntila R., Karvinen V., et al. (2021). "Food-Web Modeling in the Maritime Spatial Planning Challenge Simulation Platform: Results from the Baltic Sea Region." in Simulation Gaming Through Times and Disciplines. ISAGA 2019. Lecture Notes in Computer Science, eds. Wardaszko M., Meijer S., Lukosch H., Kanegae H., Kriz W. C., and Grzybowska-Brzezińska M., vol 11988. (Cham: Springer). doi: 10.1007/978-3-030-72132-9_25
Gușatu L. F., Menegon S., Depellegrin D., Zuidema C., Faaij A., and Yamu C. (2021). Spatial and temporal analysis of cumulative environmental effects of offshore wind farms in the North Sea basin. Sci. Rep. 11, 10125. doi: 10.1038/s41598-021-89537-1
Hammar L., Molander S., Pålsson J., Schmidtbauer Crona J., Carneiro G., Johansson T., et al. (2020). Cumulative impact assessment for ecosystem-based marine spatial planning. Sci. Total Environ. 734, 139024. doi: 10.1016/j.scitotenv.2020.139024
Hawkins A. D., Hazelwood R. A., Popper A. N., and Macey P. C. (2021). Substrate vibrations and their potential effects upon fishes and invertebrates. J. Acoust. Soc Am. 149, 2782–2790. doi: 10.1121/10.0004773
HELCOM (2018). Baltic Sea Impact Index and its use in Maritime Spatial Planning. Report by HELCOM Secretariat, HASPS 2 project July 2018. Available online at: https://helcom.fi/wp-content/uploads/2019/08/HELCOM-Baltic-Sea-Impact-Index-and-its-use-in-Maritime-Spatial-Planning.pdf (Accessed November 14, 2024).
HELCOM (2023). Thematic assessment of spatial distribution of pressures and impacts 2016-2021. Baltic Sea Environment Proceedings No.189. Available online at: https://helcom.fi/wp-content/uploads/2023/03/HELCOM-Thematic-assessment-of-spatial-distribution-of-pressures-and-impacts-2016-2021.pdf (Accessed November 14, 2024).
Hernvann P.-Y., Gascuel D., Grüss A., Druon J.-N., Kopp D., Perez I., et al. (2020). The celtic sea through time and space: ecosystem modeling to unravel fishing and climate change impacts on food-web structure and dynamics. Front. Mar. Sci. 7. doi: 10.3389/fmars.2020.578717
Hijmans R. (2024). terra: Spatial Data Analysis. R package version 1.7-83. Available online at: https://CRAN.R-project.org/package=terra (Accessed November 02, 2024).
Iasiello L. and Colombelli-Négrel D. (2023). Noisy neighbours: effects of construction noises on nesting seabirds. Mar. Freshw. Res. 74, 573–585. doi: 10.1071/MF22138
ICES (2023a). Baltic fisheries assessment working group (WGBFAS). ICES Sci. Rep. 5, 58. doi: 10.17895/ices.pub.23123768
ICES (2023b). Herring assessment working group for the area south of 62° N (HAWG). ICES Sci. Rep. 5, 23. doi: 10.17895/ices.pub.22182034
Jean S., Gilbert L., Medema W., Keijser X., Mayer I., Inam A., et al. (2018). Serious games as planning support systems: learning from playing maritime spatial planning challenge 2050. Water. 10, 1786. doi: 10.3390/w10121786
Leopold L. B., Clarke F. E., Hanshaw B. B., and Balsley J. R. (1971). “A procedure for evaluating environmental impact,” in Geological survey circular 645 (U.S. Geological Survey, Washington, DC).
Mayer I. S. (2016). Playful organisations & Learning systems (Breda/The Hague, the Netherlands: NHTV Breda University of Applied Science).
Mayer I. S., Zhou Q., Lo J., Abspoel L., Keijser X., Olsen E., et al. (2013). Integrated, ecosystem-based marine spatial planning: design and results of a game-based quasi-experiment. Ocean Coast. Manage. 82, 7–26. doi: 10.1016/j.ocecoaman.2013.04.006
Meier H. E. M., Edman M., Eilola K., Placke M., Neumann T., Andersson C., et al. (2019). Assessment of uncertainties in scenario simulations of biogeochemical cycles in the baltic sea. Front. Mar. Sci 6. doi: 10.3389/fmars.2019.00046
Menegon S., Sarretta A., Depellegrin D., Farella G., Venier C., and Barbanti A. (2018). Tools4MSP: an open source software package to support Maritime Spatial Planning. PeerJ Comput. Sci. 4, e165. doi: 10.7717/peerj-cs.165
Mooney A., Andersson M. H., and Stanley J. (2020). Acoustic impacts of offshore wind energy on fishery resources: an evolving source and varied effects across a wind farm’s lifetime. Oceanography. 33, 82–95. doi: 10.5670/oceanog.2020.408
Morkunas J., Bružas M., Rouxel Y., Morkūnė R., and Mitchell D. (2022). Seabird bycatch in a Baltic coastal gillnet fishery is orders of magnitude larger than official reports. Avian Conserv. Ecol. 17, 31. doi: 10.5751/ACE-02153-170131
Muro M. and Jeffrey P. A. (2008). Critical review of the theory and application of social learning in participatory natural resource management processes. J. Environ. Plan. Manage. 51, 325–344. doi: 10.1080/09640560801977190
Nachtsheim D. A., Johnson M., Schaffeld T., van Neer A., Madsen P. T., Findlay C. R., et al. (2023). Vessel noise exposures of harbour seals from the Wadden Sea. Sci. Rep. 13, 6187. doi: 10.1038/s41598-023-33283-z
Nascimento M. C., Husson B., Guillet L., and Pedersen T. (2023). Modelling the spatial shifts of functional groups in the Barents Sea using a climate-driven spatial food web model. Ecol. Model. 481, 110358. doi: 10.1016/j.ecolmodel.2023.110358
Pınarbaşı K., Galparsoro I., Borja Á., Stelzenmüller V., Ehler C. N., and Gimpel A. (2017). Decision support tools in marine spatial planning: Present applications, gaps and future perspectives. Mar. Policy 83, 83–91. doi: 10.1016/j.marpol.2017.05.031
Popper A. N., Haxel J., Staines G., Guan S., Nedelec S. L., Roberts L., et al. (2023). Marine energy converters: Potential acoustic effects on fishes and aquatic invertebrates. J. Acoust. Soc Am. 154, 518–532. doi: 10.1121/10.0020150
Püts M., Taylor M., Núñez-Riboni I., Steenbeek J., Stäbler M., Möllmann C., et al. (2020). Insights on integrating habitat preferences in process-oriented ecological models – a case study of the southern North Sea. Ecol. Model. 431, 109189. doi: 10.1016/j.ecolmodel.2020.109189
R Core Team (2024). R: A language and environment for statistical computing (Vienna, Austria: R Foundation for Statistical Computing). Available online at: https://www.R-project.org/ (Accessed November 02, 2024).
Rossing P., Booth S., and Zeller D. (2010). Total marine fisheries extractions by country in the Baltic Sea: 1950-present (Vancouver, BC: The University of British Columbia).
Santos C. and Gonçalves M. (2016). MSP challenge 2050 - ecopath link design document (NHTV Breda University of Applied Sciences). Available online at: https://pure.buas.nl/ws/files/720118/Santos_MSP_challenge_2050_ecopath_link_design_document.pdf.
Saraiva S., Markus Meier H. E., Andersson H., Höglund A., Dieterich C., Gröger M., et al. (2019). Baltic Sea ecosystem response to various nutrient load scenarios in present and future climates. Clim. Dyn. 52, 3369–3387. doi: 10.1007/s00382-018-4330-0
Scotti M., Opitz S., MacNeil L., Kreutle A., Pusch C., and Froese R. (2022). Ecosystem-based fisheries management increases catch and carbon sequestration through recovery of exploited stocks: The western Baltic Sea case study. Front. Mar. Sci. 9. doi: 10.3389/fmars.2022.879998
Solan M., Hauton C., Godbold J. A., Wood C. L., Leighton T. G., and White P. (2016). Anthropogenic sources of underwater sound can modify how sediment-dwelling invertebrates mediate ecosystem properties. Sci. Rep. 6, 20540. doi: 10.1038/srep20540
Soudijn F. H., Van Kooten T., Slabbekoorn H., and De Roos A. M. (2020). Population-level effects of acoustic disturbance in Atlantic cod: a size-structured analysis based on energy budgets. P. R. Soc B-Biol. Sci. 287, 20200490. doi: 10.1098/rspb.2020.0490
Stanley J. A., Van Parijs S. M., and Hatch L. T. (2017). Underwater sound from vessel traffic reduces the effective communication range in Atlantic cod and haddock. Sci. Rep. 7, 14633. doi: 10.1038/s41598-017-14743-9
Steenbeek J., Coll M., Gurney L., Mélin F., Hoepffner N., Buszowski J., et al. (2013). Bridging the gap between ecosystem modeling tools and geographic information systems: Driving a food web model with external spatial–temporal data. Ecol. Model. 263, 139–151. doi: 10.1016/j.ecolmodel.2013.04.027
Steenbeek J., Romagnoni G., Bentley J. W., Heymans J. J., Serpetti N., Gonçalves M., et al. (2020). Combining ecosystem modeling with serious gaming in support of transboundary maritime spatial planning. Ecol. Soc 25, 21. doi: 10.5751/ES-11580-250221
Tamis J. E., de Vries P., Jongbloed R. H., Lagerveld S., Jak R. G., Karman C. C., et al. (2016). Toward a harmonized approach for environmental assessment of human activities in the marine environment. Integr. Environ. Assess. Manage. 12, 632–642. doi: 10.1002/ieam.1736
United Nations (2015). Transforming our world: the 2030 Agenda for Sustainable Development, A/RES/70/1, 21 October 2015. Available online at: https://www.refworld.org/legal/resolution/unga/2015/en/111816 (Accessed December 3, 2024).
United Nations (2020). Strategic plan 2011-2020, aichi biodiversity targets. Available online at: https://www.cbd.int/sp/targets (Accessed November 22, 2024).
van Geel N. C. F., Benjamins S., Marmo B., Nabe-Nielsen J., Wittich A., Risch D., et al. (2023). “Spatial impact of wind farm construction on harbor porpoise detectability,” in The effects of noise on aquatic life: principles and practical considerations. Eds. Popper A. N., Sisneros J., Hawkins A. D., and Thomsen F. (Springer International Publishing, Cham), 1–24.
Walters C., Christensen V., and Pauly D. (1997). Structuring dynamic models of exploited ecosystems from trophic mass-balance assessments. Rev. Fish. Biol. Fish. 7, 139–172. doi: 10.1023/A:1018479526149
Wilson L., Constantine R., Pine M. K., Farcas A., and Radford C. A. (2023). Impact of small boat sound on the listening space of Pempheris adspersa, Forsterygion lapillum, Alpheus richardsoni and Ovalipes catharus. Sci. Rep. 13, 7007. doi: 10.1038/s41598-023-33684-0
Woillez M., Poulard J.-C., Rivoirard J., Petitgas P., and Bez N. (2007). Indices for capturing spatial patterns and their evolution in time, with application to European hake (Merluccius merluccius) in the Bay of Biscay. ICES J. Mar. Sci. 64, 537–550. doi: 10.1093/icesjms/fsm025
Keywords: ecospace, western Baltic Sea, multiple anthropogenic stressors, marine spatial planning, offshore wind farms, marine protected areas
Citation: Nascimento MC, Gonçalves MP, Lieser J, Mayer I and Scotti M (2025) Extending the human pressures-species response system in the MSP challenge ecosystem simulation platform. Front. Mar. Sci. 12:1561347. doi: 10.3389/fmars.2025.1561347
Received: 15 January 2025; Accepted: 05 August 2025;
Published: 28 August 2025.
Edited by:
Igal Berenshtein, University of Haifa, IsraelReviewed by:
Joana Brito, University of the Azores, PortugalAteret Shabtay, Society for the Protection of Nature in Israel, Israel
Copyright © 2025 Nascimento, Gonçalves, Lieser, Mayer and Scotti. This is an open-access article distributed under the terms of the Creative Commons Attribution License (CC BY). The use, distribution or reproduction in other forums is permitted, provided the original author(s) and the copyright owner(s) are credited and that the original publication in this journal is cited, in accordance with accepted academic practice. No use, distribution or reproduction is permitted which does not comply with these terms.
*Correspondence: Marcela C. Nascimento, bmFzY2ltZW50by5tYXJjZWxhY0BnbWFpbC5jb20=
†These authors have share first authorship