 Tamara M. Russell
 David M. Pereksta2
 James R. Tietz
 Maria Vernet
 Jaime Jahncke
 Lisa T. Ballance
- 1Scripps Institution of Oceanography, University of California - San Diego, La Jolla, CA, United States
- 2Bureau of Ocean Energy Management Pacific Outer Continental Shelf (OCS) Region, Camarillo, CA, United States
- 3Point Blue Conservation Science, Petaluma, CA, United States
- 4Marine Mammal Institute, Oregon State University, Newport, OR, United States
Climate change is impacting marine ecosystems through physical changes (e.g., increased marine heatwaves, long-term warming) that can manifest biologically at all trophic levels. In the California Current Ecosystem (CCE), a productive and economically important eastern boundary upwelling system, the effects of these physical changes are observed throughout the region from Mexico to Canada. We investigated range expansions into the CCE and correlations with the environment for a group of tropical/sub-tropical seabirds, widely recognized as ecosystem indicators. We assessed changes in the abundance (2002-2022) of five species from the genus Sula (Cocos, Blue-footed, Red-footed, Masked, and Nazca Boobies), using a novel compilation of four data sources and investigated potential relationships with the environment. All five species increased in abundance within the CCE by 692-3015% after the extreme marine heatwaves that began in late 2013, and all species, with the exception of Blue-footed, exhibited a northward range expansion by as much as 6.8 degrees latitude and increased range area of 235-1013%. Furthermore, the increased presence of all species except Masked and Nazca Boobies correlated with warmer conditions around Baja California, Mexico, one month prior to their occurrence northward. Our results document the increase of these large bodied, tropical species and a tropical shift in the predator community of the CCE, which mirrors changes that occurred there during the last extreme global warming period on Earth, the Miocene. As marine heatwaves are projected to increase in frequency and intensity, in addition to long-term warming, we hypothesize that these species will continue to expand their range northward and increase in abundance in this upwelling ecosystem.
1 Introduction
Species distributions are changing rapidly in response to anthropogenic climate change, due to direct and indirect impacts, including changes in species interactions, prey availability/quality, reproductive habitat availability/quality, and/or physiological constraints (Pinsky et al., 2013; Wingfield et al., 2015; Pinsky et al., 2020). Species moving into or out of an ecosystem may have impacts on the ecosystem structure, such as food web efficiency, stability through diversity, and interspecies competition (Albouy et al., 2014; Bartley et al., 2019; Tekwa et al., 2022).
Seabirds are conspicuous marine predators, and their distribution and abundance patterns can provide information on underlying marine food webs (Fauchald, 2009). Changes in seabird distributions can signal perturbations in an ecosystem, and new species may become competitors for resources with resident species. Understanding drivers of changing species distributions allows us to better predict how an ecosystem may continue to change with a warming climate and how these shifts may impact existing species in these regions.
The California Current Ecosystem (CCE) is a productive eastern boundary upwelling region (Figure 1) that experiences climatic variability on multiple temporal scales. A dominant climatic forcing is the El Niño–Southern Oscillation (ENSO), which fluctuates between cool (La Niña) and warm (El Niño) phases every two to seven years (Mysak, 1986). During El Niño, the easterly equatorial winds weaken, decreasing upwelling along the CCE and suppressing nutrient availability for ocean primary productivity, therefore, decreasing predator foraging success (Mysak, 1986; McGowan et al., 1998; Velarde et al., 2015). Within the southern sector of the CCE, the Southern California Bight (SCB) is a unique transition zone between cool and warm water ecosystems. The headland of Point Conception, California, is where cool water from the north meets warm subtropical waters from the south (Horn and Allen, 1978; Hunt et al., 1980; Hendershott and Winant, 1996), and corresponds to the northern or southern extent of many species’ ranges (Hayward and Vennck, 1998; Pitz et al., 2020; Sydeman et al., 2009; Horn and Allen, 1978; Briggs and Bowen, 2012).
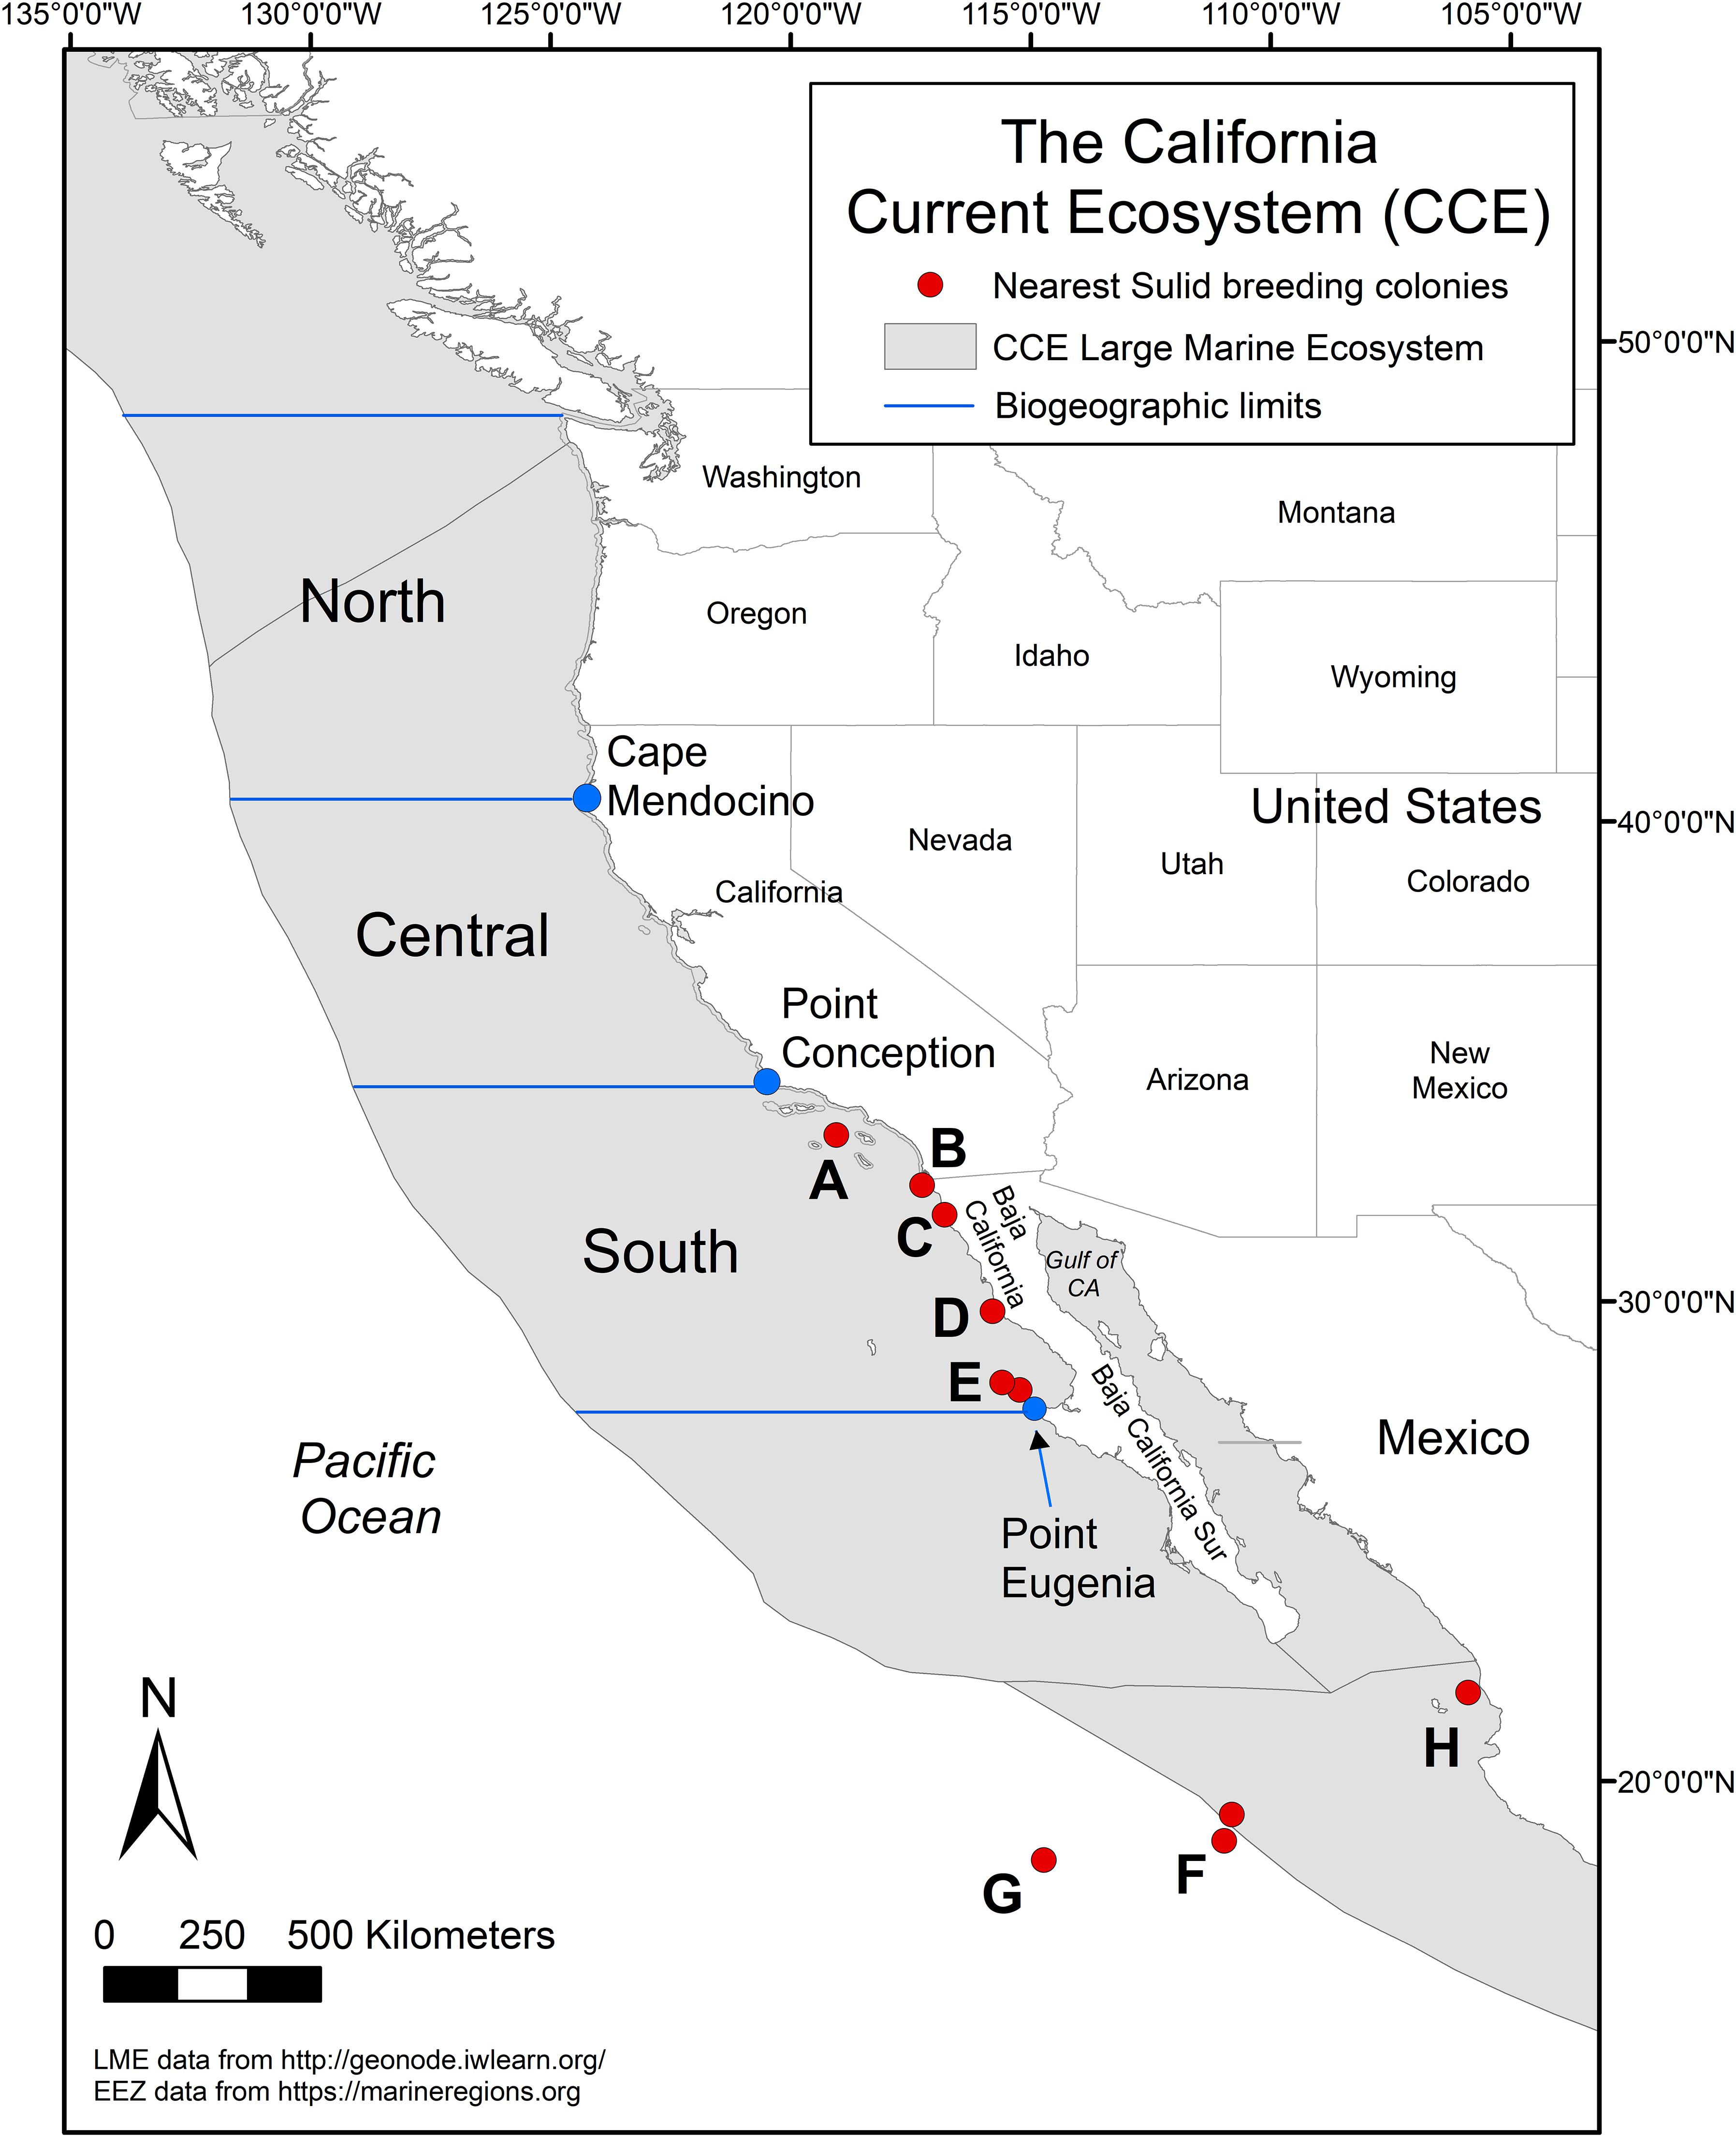
Figure 1. Map of the California Current Ecosystem. The north and central biogeographic regions are separated by Cape Mendocino, California (USA), the central and south by Point Conception, California (USA) and the south extends down to Point Eugenia, Baja California (Mexico). The locations of Sulid breeding colonies in the Pacific are indicated in red and are as follows: (A) Sutil Rock, Santa Barbara Island, (B) Middle Rock, Coronado Islands, (C) Todos Santos Islands, (D) San Jerónimo Island, (E) San Benito and Cedros Islands, (F) San Benedicto and Socorro Islands (inner Revillagigedo Islands), (G) Clarion Island (outer Revillagigedo Islands), and (H) Isabella Island.
Climate change is impacting marine ecosystems in the CCE through physical changes (e.g., an increase in the frequency and intensity of marine heatwaves; MHW) that manifest themselves biologically at all trophic levels (Jacox et al., 2020). MHWs are prolonged periods of anomalously warm waters (Hobday et al., 2016) mostly due to atmospheric forcing that affect wind and pressure systems that reduce upwelling, therefore stratifying the water column and leading to overall warming (Di Lorenzo and Mantua, 2016). In the past decade, several persistent MHW have affected this ecosystem, including the largest, longest-lasting MHW globally that occurred between the end of 2013 through 2016 (Bond et al., 2015; Di Lorenzo and Mantua, 2016; Suryan et al., 2021; Cavole et al., 2016). The 2013-2016 MHW caused massive ecological changes in the North Pacific including shifts in the community composition, abundance, and/or quality of zooplankton and fishes (Brodeur et al., 2019; von Biela et al., 2019; Arimitsu et al., 2021), changes in the ranges of lower and upper trophic level organisms (Sutherland et al., 2018; Lonhart et al., 2019; Tanaka et al., 2021; Welch et al., 2023; Osborne et al., 2020), and mass mortality events of marine species (Jones et al., 2018; Piatt et al., 2020; Cavole et al., 2016). Such changes persisted in this ecosystem for at least five years (Suryan et al., 2021; Scannell et al., 2020) and there was little time for this ecosystem to recover before the next MHWs in 2018 and 2019 (Fumo et al., 2020; Amaya et al., 2020).
As ocean temperatures have warmed within the SCB, the cool-warm gradient has blurred, and subtropical seabirds from warmer waters have moved north (Rasmussen et al., 2020; Sagarin et al., 1999; Ainley, 1980; Hyrenbach and Veit, 2003). For example, Elegant Terns (Thalasseus elegans) that breed within the Gulf of California, Mexico, migrate north to the Pacific Coast to forage and/or breed during warm years and poor food availability in their usual habitat; the California breeding population has been growing steadily overtime and booms during these warm water years (Velarde et al., 2015; Toochin and Haviland, 2016; Veit et al., 2021). In addition, both Cocos Boobies (Sula brewsteri; previously Brown Booby, S. leucogaster brewsteri) and one pair of Blue-footed Boobies (S. nebouxii) have recently (2017 and 2022, respectively) expanded their breeding range to Sutil Rock off Santa Barbara Island, California (Howard et al., 2024; Figure 1). Preceding this breeding range extension, both Cocos and Blue-footed Boobies had expanded their breeding to locations off the west coast of northern Baja California, Mexico; Cocos to Middle Rock, Islas Los Coronados in 2005 (Whitworth et al., 2007), and Blue-footed to San Jerónimo Island in 2016 (Bedolla-Guzmán et al., 2019). Although these breeding extensions are well-documented, the drivers of these changes have yet to be explained. In addition, sightings of all five Sulids that occur off the Pacific Coast of Mexico are increasing in the CCE, which includes Cocos, Blue-footed, Red-footed (S. sula), Masked (S. dactylatra), and Nazca Boobies (S. granti; Hamilton et al., 2007; Withgott, 2021; Tweit et al., 2022).
Species within the genus Sula are large (wingspans between 140-165 cm), plunge-diving seabirds that are found in tropical and subtropical habitats (Nelson, 1978). Due to their size and flight-style, they have high energetic needs and require large amounts of food to sustain them (Ballance, 1995; Nelson, 1978). Two of these species have pantropical distributions (Red-footed, and Masked), while Cocos, Nazca, and Blue-footed Boobies occur only in the Eastern Tropical Pacific (Nelson, 1978). Prior to the range extension and colonization of Middle Rock, San Jerónimo Island, and Sutil Rock, the nearest Sulid colonies were located off Baja California Sur, central Mexico, and within the Gulf of California (Nelson, 1978; Whitworth et al., 2007; Howard et al., 2024). As these species mostly live in tropical, lower productivity regions, the impacts of warming temperatures may have disproportionate effects on already low stocks of potential prey, and they may be experiencing competitive pressures to venture farther for resources.
Here, we documented the northward range expansion of five Sulids and tested our hypothesis that their occurrence in the CCE related to warmer ocean conditions. For example, upwelling where these species traditionally forage may be depressed during warmer, El Niño periods, thereby negatively affecting food for forage fishes and other seabird prey causing birds in those regions to travel northward into cooler, more productive waters to forage. Data on ‘rare’ or infrequent species are inherently lacking, therefore including all available data may increase the ability to detect abundance and distribution trends. In this study, we took an integrative approach and utilized structured, semi-structured, and unstructured data to describe changes in Sulid abundance and evaluate their relationships with the environment to better understand the impacts of warming in this upwelling ecosystem.
2 Materials and methods
2.1 Study area
The CCE is a productive eastern boundary current that stretches roughly 2,800 km from the North Pacific Current (~50˚N) down to Baja California, Mexico, and extends approximately 500 km offshore (27°N; Figure 1; Checkley and Barth, 2009). Within the CCE are three biogeographic regions –North, Central, South – that have distinct upwelling patterns and biological communities (Ainley, 1976; Ainley et al., 2015; Schipper et al., 2016; Russell et al., 2023). The North (up to 50°N) and Central regions are separated by Cape Mendocino, California (40.438°N), the Central and South by Point Conception, California (34.448˚N), and the South extends to Point Eugenia, Baja California, Mexico (27.848°N, -115.083˚W; Checkley and Barth, 2009).
2.2 Seabird data
All data processing, compilation, and analyses were conducted in the R environment (version 4.0.3, R Core Team, 2020). Sulids in the CCE were considered vagrant species, or species occurring outside of their typical range (Stake, 2012; Taylor et al., 1994; Mason et al., 2007). Vagrancy may be due to variation in migration and/or exploratory behavior by individuals and is an important mechanism of populations colonizing new regions (Veit, 2000; Veit et al., 2021; Veit et al., 2022; Lees and Gilroy, 2022). As data on such species are inherently rare, we used multiple data sources to investigate trends in Sulid abundance and potential environmental drivers (Supplementary Figures S1, S2). We utilized structured (at-sea strip transects), semi-structured (summarized surveys and incidental sightings on Southeast Farallon Island, SEFI, and eBird; Sullivan et al., 2014), and unstructured data (Bird Records Committee reports). Structured data is collected using strict protocols to prevent bias, while semi-structured data lacks strict protocols or has been summarized in ways that have removed the power that structured data have. However, these semi-structured data still include information about the observation, such as duration and distance travelled during data collection, whether the observer recorded data on all species, and other information that provides metadata along with species observations. The integration of public-collected (i.e., ‘citizen science’), semi-structured data with structured survey data has been shown to improve estimates of abundance (Schindler et al., 2022) and population growth rates (Walker and Taylor, 2017; Horns et al., 2018; Robinson et al., 2018). To increase our ability to detect Sulid trends, we used structured and semi-structured data and filled in potential gaps of observations with unstructured data from the California, Oregon, and Washington Bird Records Committee reports. For each data type, we compiled data on all five booby species reported in the CCE, hereafter referred to as Cocos, Blue-footed, Red-footed, Masked, and Nazca.
2.2.1 At-sea data
Within the CCE, there are a wealth of data on the at-sea distributions of seabirds that have been collected through temporary or long-term systematic surveys over several decades. These data were collected using standard strip transect methods from ships and aerial platforms (Tasker et al., 1984; Ballance, 2007; Mason et al., 2007) and can be used to estimate density of seabird species within the surveyed transect (Henkel et al., 2007). Data from 21 of these programs were previously compiled into a common format (Leirness et al., 2021; 1980-2017), to which we added additional years from California Cooperative Oceanic Fisheries Investigations (CalCOFI), Applied California Current Ecosystem Studies (ACCESS), and NOAA’s Southwest Fisheries Science Center’s California Current Ecosystem Survey (CCES) resulting in a dataset that spanned 43 years (1980-2022; Supplementary Table S1, Supplementary Figure S1A). Observations were subdivided into smaller transect segments (mean = 3.91 km) to calculate area surveyed (transect length x transect width; km2) and assigned coordinates of each transect segment midpoint.
2.2.2 Southeast Farallon island data
There has been avian monitoring at SEFI, California since 1967, including documented daily sightings of bird species. These data include the species, number of individuals, and date of first arrival in any given year, and were summarized as monthly sightings spanning 56 years (1967-2022; Supplementary Figure S1B).
During the fall (mid-August to early December), researchers conducted daily counts for Brown Pelicans and Sulids from the lighthouse from 0700 to 0900 when no part of the island was obscured (e.g., fog, clouds, etc.). During other seasons (December to mid-August), the counts were conducted opportunistically. Throughout the year, a 5-minute sea watch was conducted before 0900 with a 30x spotting scope from the houses facing southwest. Additionally, during the fall, a 30-minute sea watch was conducted from the east side of the island late in the afternoon, and between 2005-2022, area searches were conducted once in the morning and once in the afternoon, until mid-November when the afternoon survey was dropped. Area searches consisted of a single person walking all accessible parts of the island to search for land birds, but non-land bird species such as Sulids, were also recorded. Prior to 2005, these fall surveys were conducted more casually.
For each month, Sulid counts were provided for each species, with arrival and departure dates estimated for each unique individual, which were identified based on their age, sex, and plumage. For Cocos, an unknown individual (no age or sex information recorded) was assumed to be the same bird as a previously seen Cocos within a 30-day window. For Blue-footed, four juveniles showed up at SEFI in 2013 when there was a large influx of juveniles into California (Rottenborn et al., 2016). Since there were very few Blue-footed reported in the CCE afterwards, the two that showed up as second-year birds in 2014 and returned as adults for several years (2015-2018) were considered two of the four juveniles from 2013. For Red-footed, Masked, and Nazca, individual records were based on California Bird Records Committee decisions (https://californiabirds.org/database_query.asp).
2.2.3 Bird records committees
We used data from three Bird Records Committees (BRC), volunteer organizations in the U.S. that maintain rare bird records. The public submits records of rare birds on each state’s review list (a classification that ranges from less than four occurrences per year in CA, 20 or fewer records during the previous 10-year period in WA, and varies in OR; Hamilton et al., 2007) to the committee and the committee evaluates, confirms (or declines to confirm) observations based on evidence from each submitted species sighting, and manages an open access records database. We compiled data from the California (CBRC), Oregon (OBRC), and Washington (WBRC) bird records reports to fill in Sulid occurrences that were not recorded in other data types (https://californiabirds.org; https://oregonbirding.org ; https://wos.org ; Benson et al., 2022). We only used accepted and verified reports in our analyses. From documentation, the committee also assesses whether reports are new or recurring individuals, and if recurring, they record the date of their first arrival and date last reported. We used the date of first arrival in all analyses. The BRC records used in this study included 576 Sulid observations (CBRC n=504, OBRC n=40, WBRC n=32) spanning from 1935 to 2023 (Supplementary Figure S1C). By 2021, all five Sulids (Cocos =2007, Blue-footed =2014, Red-footed & Nazca=2019, Masked=2021) were removed from the CBRC review list. However, all Sulids except for Cocos (removed in 2023 from OBRC and 2018 in WBRC) are still tracked by OBRC and WBRC.
2.2.4 eBird data
We used citizen science data from the web-based application, eBird, which is hosted by Cornell Lab of Ornithology (Sullivan et al., 2014). Citizen science data covers larger spatiotemporal scales than is economically possible for structured data programs (Conrad and Hilchey, 2011; Walker and Taylor, 2017). The use of eBird has been growing globally at exponential rates since it was launched in 2002 (Walker and Taylor, 2017). These data are publicly available for download (www.ebird.org/science/download-ebird-dataproducts) and can be processed using the ‘auk’ R package (Strimas-Mackey et al., 2017). On eBird, an observer can note method of data collection (e.g., stationary, travelling, incidental, or historic records), survey effort (e.g., time and distance travelled), and whether they recorded all species they could identify or were casually noting birds. Once bird lists are submitted, they are flagged if there are anomalous observations (e.g., species not regularly seen in that area or unusually high counts), and regional volunteer reviewers contact the observer for more details and either accept or reject the observation.
We downloaded all eBird data for the five Sulids in our study, their hybrids, and Sulid groups (i.e., those that could not be identified to species). This resulted in 204,577 individual records, spanning across all months from 1800 to 2023, which included many historical records (pre-2002 when eBird was established).
We downloaded sampling effort data (information on all lists submitted regardless if a Sulid was seen) and connected Sulid observation data to the sampling effort by each unique survey location. We only used eBird data that had been reviewed and accepted by regional eBird reviewers. We changed each ‘presence-only’ record to one individual, which conservatively estimated species abundance. We calculated the number of lists submitted per day at each location and standardized Sulid observations with this number. This controlled for multiple reports on the same individual(s) submitted at the same location on the same day (Supplementary Figure S2).
For all four data types, we assigned observations to regions within and outside the CCE. We classified data by latitude and biogeographic region- Baja California Sur (hereafter S. Baja) and the three areas in the CCE: Southern, Central, and Northern (Figure 1). Regions outside of the CCE were not used in analyses but were plotted alongside the CCE (Supplementary Figure S2). We assigned data to the CCE (CCE Large Marine Ecosystem; www.geonode.iwlearn.org) and to the Gulf of California (ww.marineregions.org) using shapefiles with a 20-km buffer to capture coastal observations. We classified remaining data as the “Salton Sea” if they were located within California and south of 34°N, “Inland” if the location was within the remaining parts of California, Oregon, or Washington or anywhere within Arizona, Nevada, and Utah, and “north of CCE” for all northern observations.
2.3 Environmental data
To determine potential correlates of Sulid abundance, we used a suite of environmental variables and indices to represent the broader region, the “local” CCE (where they were recorded), and potential source locations (conditions in S. Baja and Gulf of California) including the Oceanic Niño Index (ONI), sea surface temperature (SST), Bakun Upwelling Index, and air temperature (Figure 2).
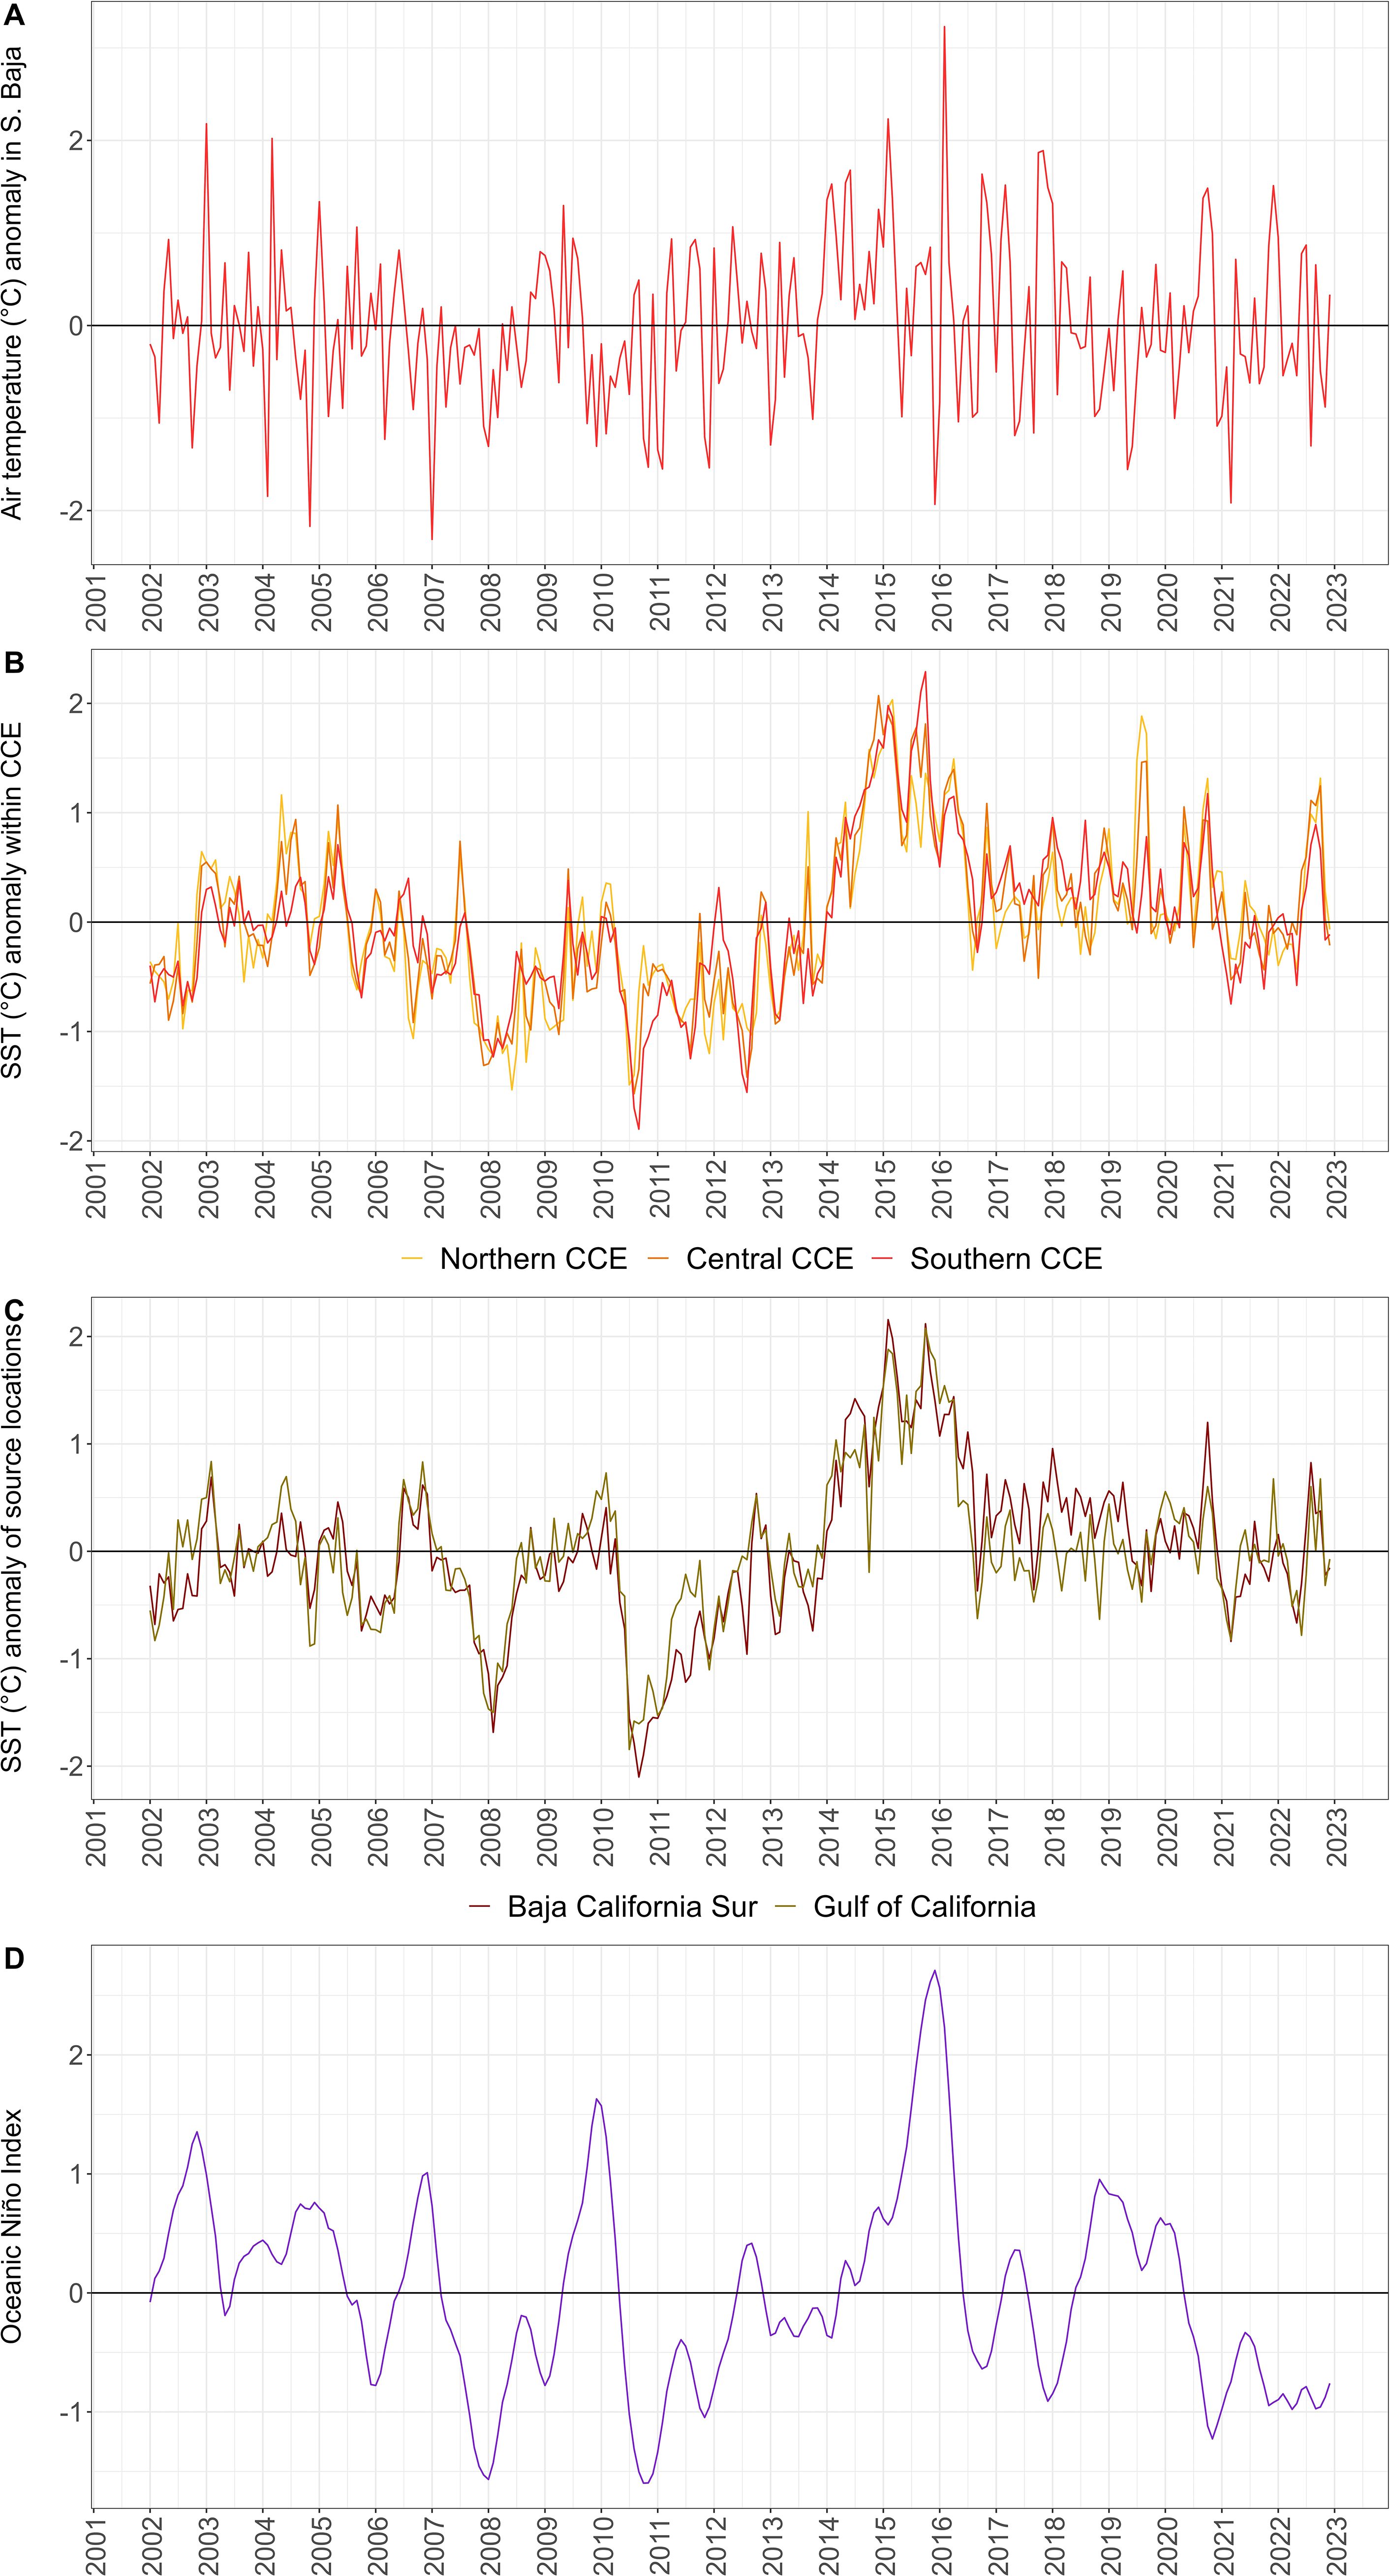
Figure 2. The anomalies of the environmental variables used in analyses (2002-2024), including (A) air temperature, (B) sea surface temperature (SST) from potential source locations and (C) from within the California Current Ecosystem, and (D) the Oceanic Niño Index. Anomalies were calculated using the entire environmental dataset (1948-2024; Supplementary Figure S3) from the monthly climatological mean within each region subtracted from the monthly value.
For broad-scale (3-4 year) conditions in the North Pacific, we used ONI as a measure of the El Niño Southern Oscillation (ENSO). ONI is calculated by a three- month running average of SST, where high values (>0.5) are warmer, El Niño conditions, and low values (<-0.5) are cooler, La Niña conditions (NOAA, 2023). We downloaded ONI data using the data retrieval package, ‘rsoi’ (Albers, 2023; version 0.5.5).
For local CCE conditions, we used the Bakun Upwelling Index and SST. The Bakun Upwelling Index calculates Ekman transport to estimate upwelling intensity, with positive values implying upwelling and negative values indicating downwelling (Bakun, 1973). We summarized the Bakun Upwelling Index into biogeographic regions. SST provides information on upwelling within a region, which affects ocean productivity and can support potential seabird prey (Thayer and Sydeman, 2007). We used SST (˚C) data from the Hadley Centre Global Sea Ice and Sea Surface Temperature (HadISST, Rayner et al., 2003) obtained from National Center for Atmospheric Research (https://rda.ucar.edu/datasets/ds277.3). We used the 1° monthly measurements calculated from a combination of in-situ and adjusted satellite-derived measurements. We generated subsets of SST data by regions using previously mentioned shapefiles (Gulf of CA and CCE Large Marine Ecosystem). We then categorized data in the CCE region into North, Central, South, and S. Baja based on previously mentioned boundaries.
For S. Baja air temperatures, we used GHCN_CAMS Gridded 2 m Temperature (˚C) data which contains monthly means of high resolution (0.5 x 0.5˚) analyzed global land surface temperatures (1948-2022; Fan and van den Dool, 2008). We extracted air temperatures from S. Baja as a proxy of source conditions that may have influenced Sulids to move northward.
2.4 Data analysis
We analyzed trends in Sulid abundance and range and investigated relationships between their abundance and broad-scale, local, and source environmental conditions. We analyzed each species separately, although we combined data on Masked and Nazca due to their recent split as distinct species and their similarity in appearance (Pyle, 2020; Pitman and Jehl, 1998).
As all four data types had different coverage, methods of collection, effort across months and years, and protocols for approving records, we could not directly compile all data together. Instead, we standardized data to include the date, species, counts of individuals, coordinates of observation, and assigned region (e.g., north CCE), then combined all data types. We produced 50 x 50 km grid cells over our study area, from offshore to up to 20 km inland (Figure 1; -144˚W to -109˚W, 21˚N to 60˚N) and assigned Sulid data to the corresponding grid cell using the ‘sf’ package (Pebesma, 2018). A grid size of 50 x 50 km was used to limit the same individuals from being double-counted in the data compilation, as typical Sulid foraging ranges are 40-100 km (Lerma et al., 2020; Mendez et al, 2017b; Weimerskirch et al., 2008). We then used the maximum number of Sulids seen at one time within each grid cell for each month and year of the compiled data as a metric for Sulid abundance. This metric, therefore, resulted in values that are higher than the actual numbers of birds agreed upon by the BRC’s. Although true “absence” within a grid cell cannot be obtained, we gave each grid cell a zero count during a month and year where there was any effort within the grid cell, but no Sulids detected. Lastly, local SST data were extracted at each grid cell midpoint, we connected each grid cell to the nearest latitude for Bakun Upwelling Index, and remaining environmental data (ONI, S. Baja and Gulf of California SST and S. Baja air temperature) were assigned to all grid cells.
We used the gridded data only within the CCE in our analysis, which included 533 grid cells. Because there were differences in years covered by each data type (eBird 1935-2022, BRC 1935-2022, SEFI 1967-2022, At-sea 1980-2022), we could not analyze changes over time across the entire period. Therefore, we only analyzed years since eBird began (2002) when there was overlap among all data types (2002-2022), which resulted in 9,712 records of Sulids.
Prior to environmental analysis, we evaluated the correlation between Sulids and lagged source conditions. If Sulids respond to conditions in S. Baja or the Gulf of California, it may take time for them to decide to travel north, therefore, we tested relationships between their abundance with 1-12 month lagged source data (SST and air temperature in S. Baja and SST in the Gulf of California) using the Spearman rank correlation (r) calculated with the ‘cor’ function (Core Team, 2020).
We used zero-inflated Poisson generalized additive models (GAM) to investigate non-linear relationships between Sulid abundance and environmental conditions. We conducted GAMs using Restricted Maximum Likelihood (REML) smoothness estimation using the ‘mgcv’ package (Woods, 2017). To determine the model of best fit, we first ran models with only the two highest correlated lagged variables (potential source conditions) and selected the month lag that best explained the variability in the data. As Red-footed, Masked, and Nazca do not breed in the Gulf of California, we did not use Gulf of California SST as a proxy for source conditions in our analyses with these species. We checked for collinearity among all variables using variance inflation factors (VIF), which measure the amount of variance of a variable that is inflated by its correlation with another variable. We used a conservative threshold, with values less than 3 indicating no strong collinearity, and excluded variables with values greater than 3 from the overall model (Zuur et al., 2012; Johnston et al., 2018). There was high collinearity between S. Baja SST, Gulf of California SST, and S. Baja air temperatures, therefore, we ran full models (with all other variables) for each of these variables separately. We then removed any non-significant variables and compared each to the initial models. Variables with effective degrees of freedom (EDF; i.e., the non-linearity of a curve) equal to one were incorporated without smoothers. To select the model of best fit, we compared models using Akaike information criterion (AIC; Akaike, 1973; Venables and Ripley, 2002).
To test our hypothesis that Sulid abundance increased with warm water periods, we investigated differences in abundance between years prior to extreme MHWs (2002-2012) and years during and after MHWs (2013-2022). We compared the mean and max abundance of each species between the pre and during/post MHW periods. We calculated the percentage difference between the means and conducted a student’s t-test to compare them.
2.5 Range shift analysis
To test whether the ranges of Sulids had significantly expanded, we first calculated the maximum latitude of 50 x 50 km gridded sightings of each species per year. We then conducted linear regression between the maximum latitudes of a species observation within 50 x 50 km grid cells per year. By consolidating observations into grid cells in this analysis, we limited the influence of differences in effort and accounted for potential double counts of the same individual.
We tested for changes in range area by counting the number of 50 x 50 km grid cells per year in which at least one individual was reported for each species. We controlled for effort by dividing the number of grid cells with an observation by the number of grid cells that had any effort. We used a generalized linear model with a gamma, log-linked distribution to evaluate changes overtime in range area for each species. We also compared the number of grid cells each species was observed within the years before MHWs (2002-2012) to years during and after MHWs (2013-2022). We calculated the percentage difference between the means and conducted a student’s t-test to compare them.
3 Results
3.1 Changes in abundance
The abundance of all Sulids in this study increased in the CCE (2002-2022; Figure 3). Prior to 2002, Sulids were rare vagrants north of Mexico, with only periodic observations, including a pulse of Blue-footed (mostly inland) in 1973 (Figure 3). After 2002, Cocos increased throughout biogeographic regions (from 0.21 mean number of birds per grid cell prior to 2002 to 3.80 mean birds between 2002-2022), with the highest observations in 2014 and 2015 (5.36 mean number of birds per grid cell observed during these two years). Since 2002, Blue-footed were infrequently observed most years, however, were present in periodically high abundances (e.g., 850 total observations in 2013 compared to 103 before 2013). It was not until 2018 that Red-footed increased from 165 total observations pre-2018 to 586 observations post-2018, Masked from 194 to 391, and Nazca from 135 to 634.
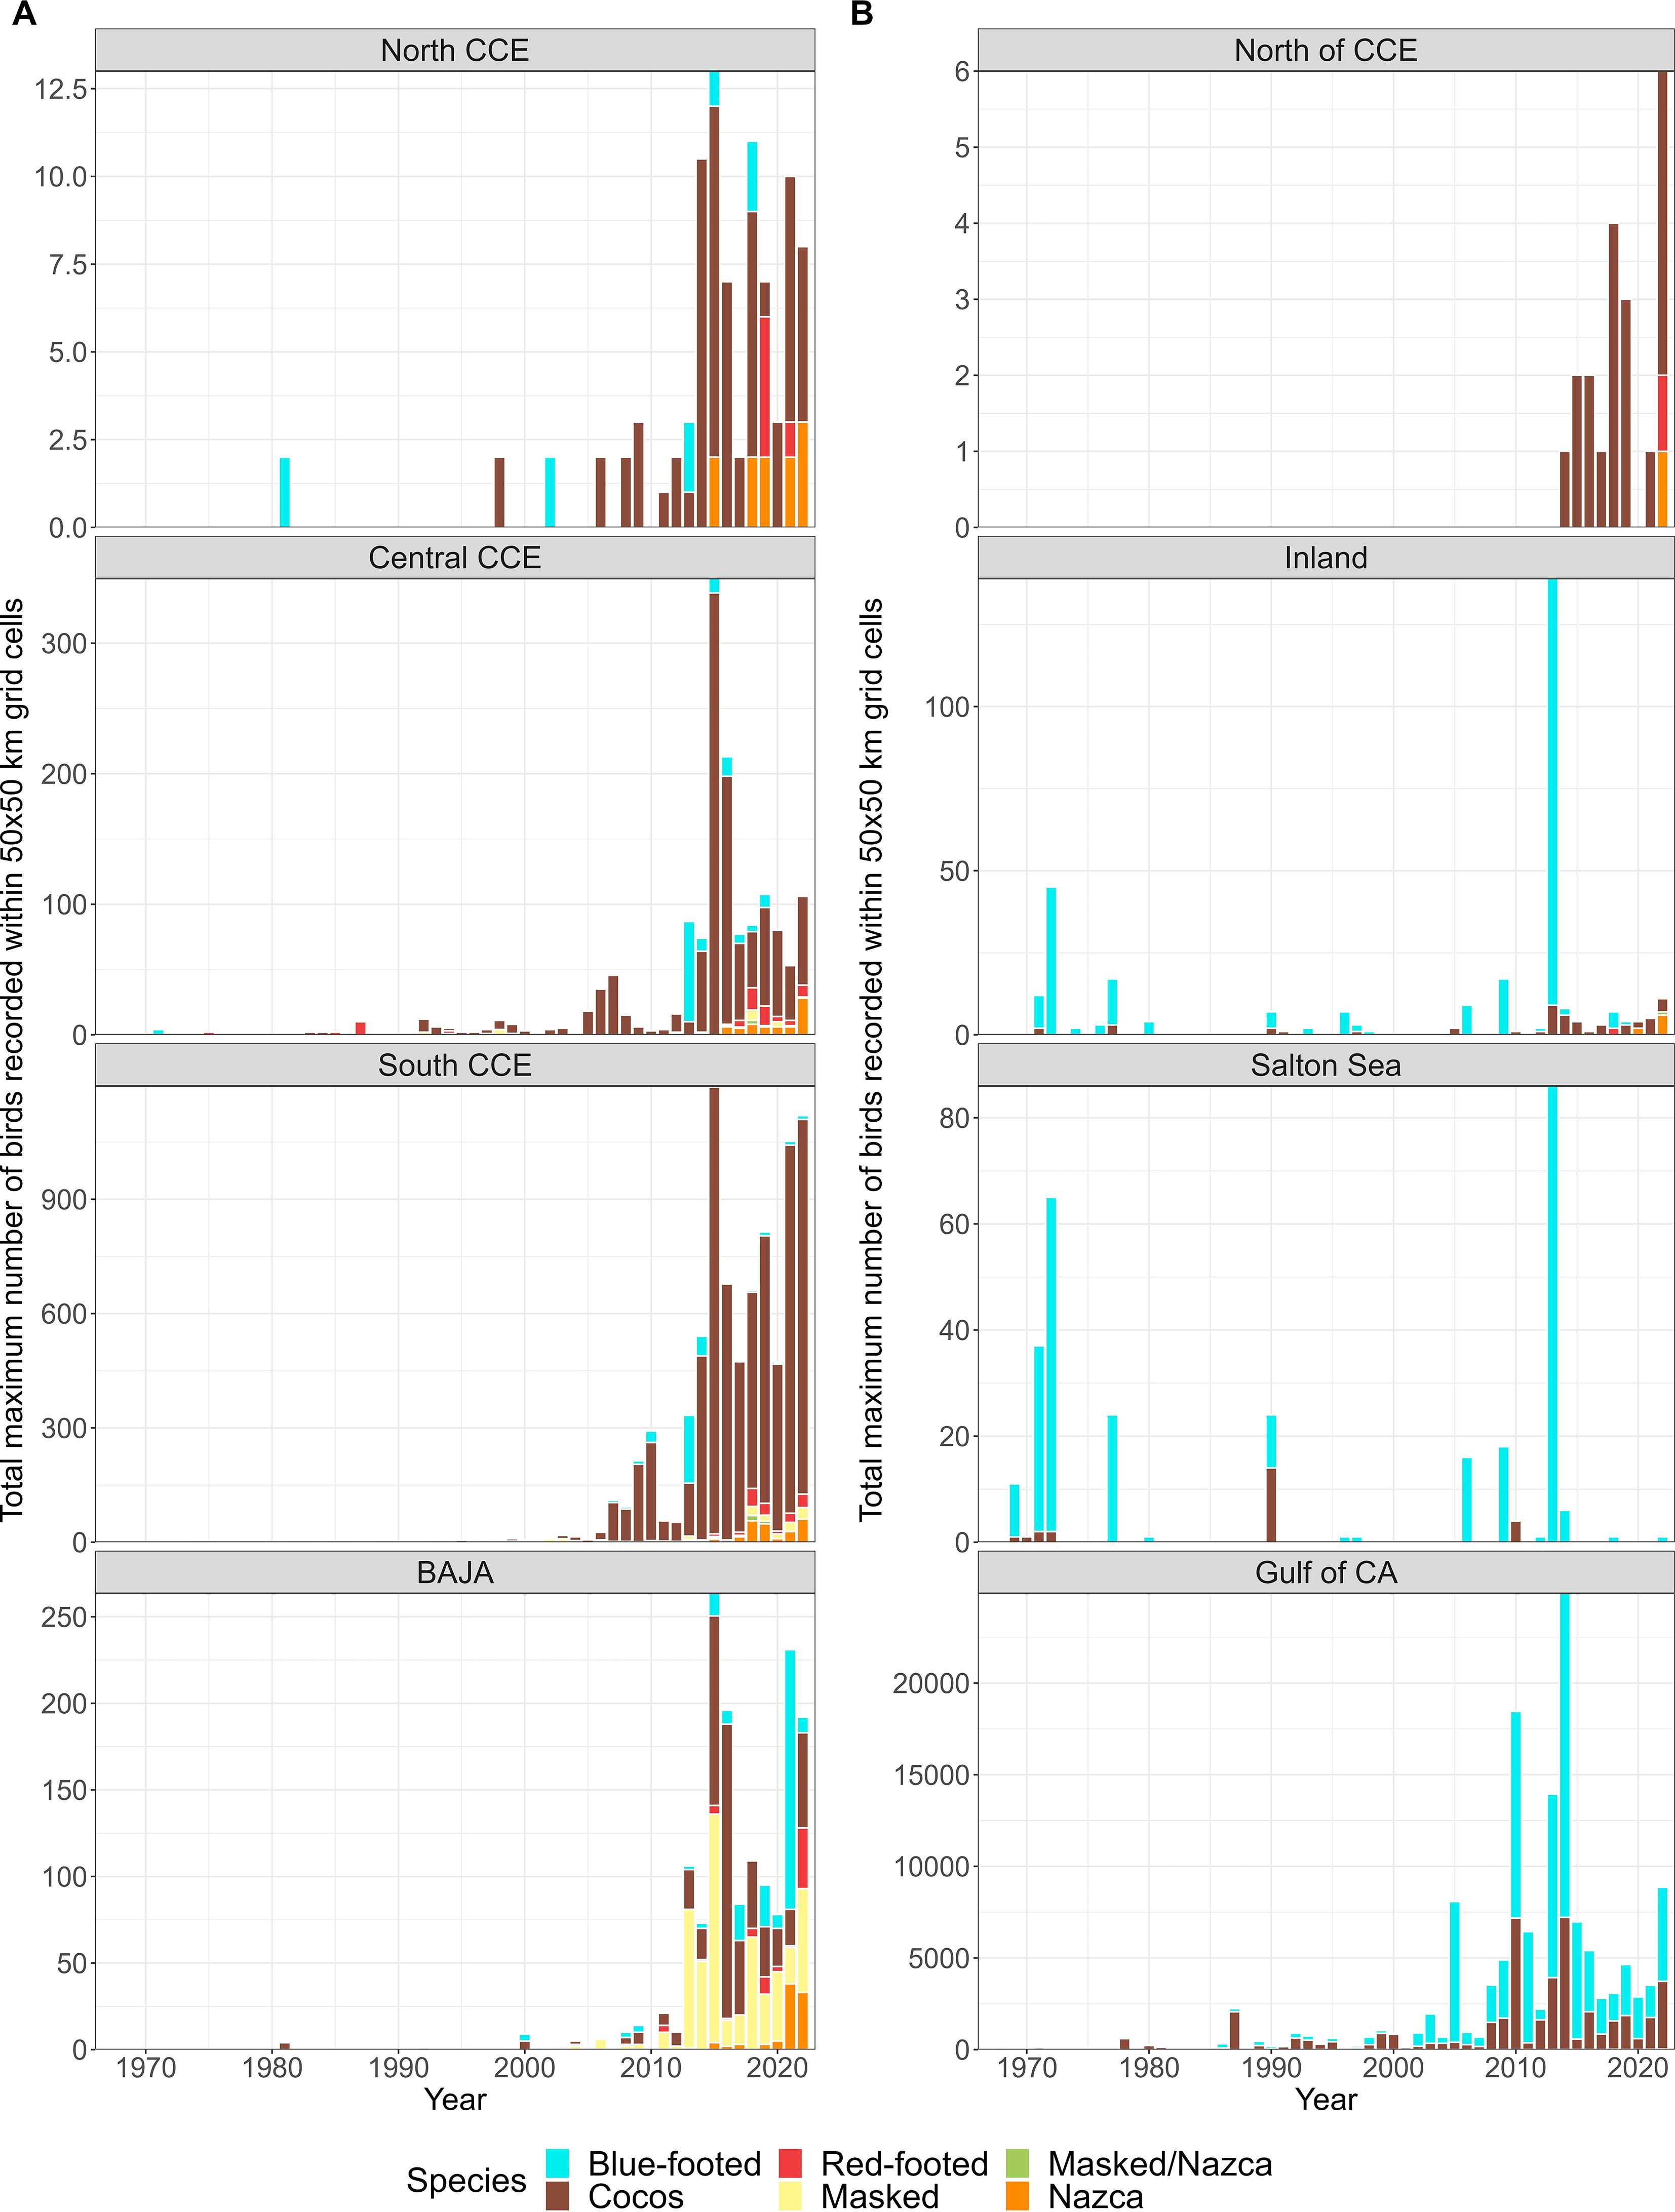
Figure 3. The sum of the maximum number of each Sulid recorded within a 50 x 50 km grid cell for each year and region using most of the available data (1966-2022; excluded <1966 due to low observations). (A) Regions within and south of the California Current Ecosystem (CCE) and (B) regions outside or north of the CCE.
There were differences in the seasonality of Sulid observations. For Cocos and Blue-footed, there was no seasonality in their occurrences in the CCE, however, they were more abundant north of the CCE, inland, and at the Salton Sea during summer and fall, while they were more abundant from fall to spring in the Gulf of California (Supplementary Figure S4). Red-footed, Masked, and Nazca, however, occurred in the CCE and S Baja mostly during late spring through fall (June to November; Supplementary Figure S4).
Conservatively, using the maximum number of each species within a 50 x 50 km grid cell, all five species increased in abundance (Figures 4A-7A). The increase in Cocos was most apparent from 2002 to 2010 (Figure 4A). A similar increase occurred in Blue-footed through this same period (2005-2010; Figure 5A). Red-footed had low abundance, with high uncertainty in their estimates from 2002-2013 (Figure 6A). In 2014, Red-footed abundance increased until 2021. Masked and Nazca declined from a few observations in 2002 to minima in 2006 before increasing throughout the rest of the survey period (Figure 7A).
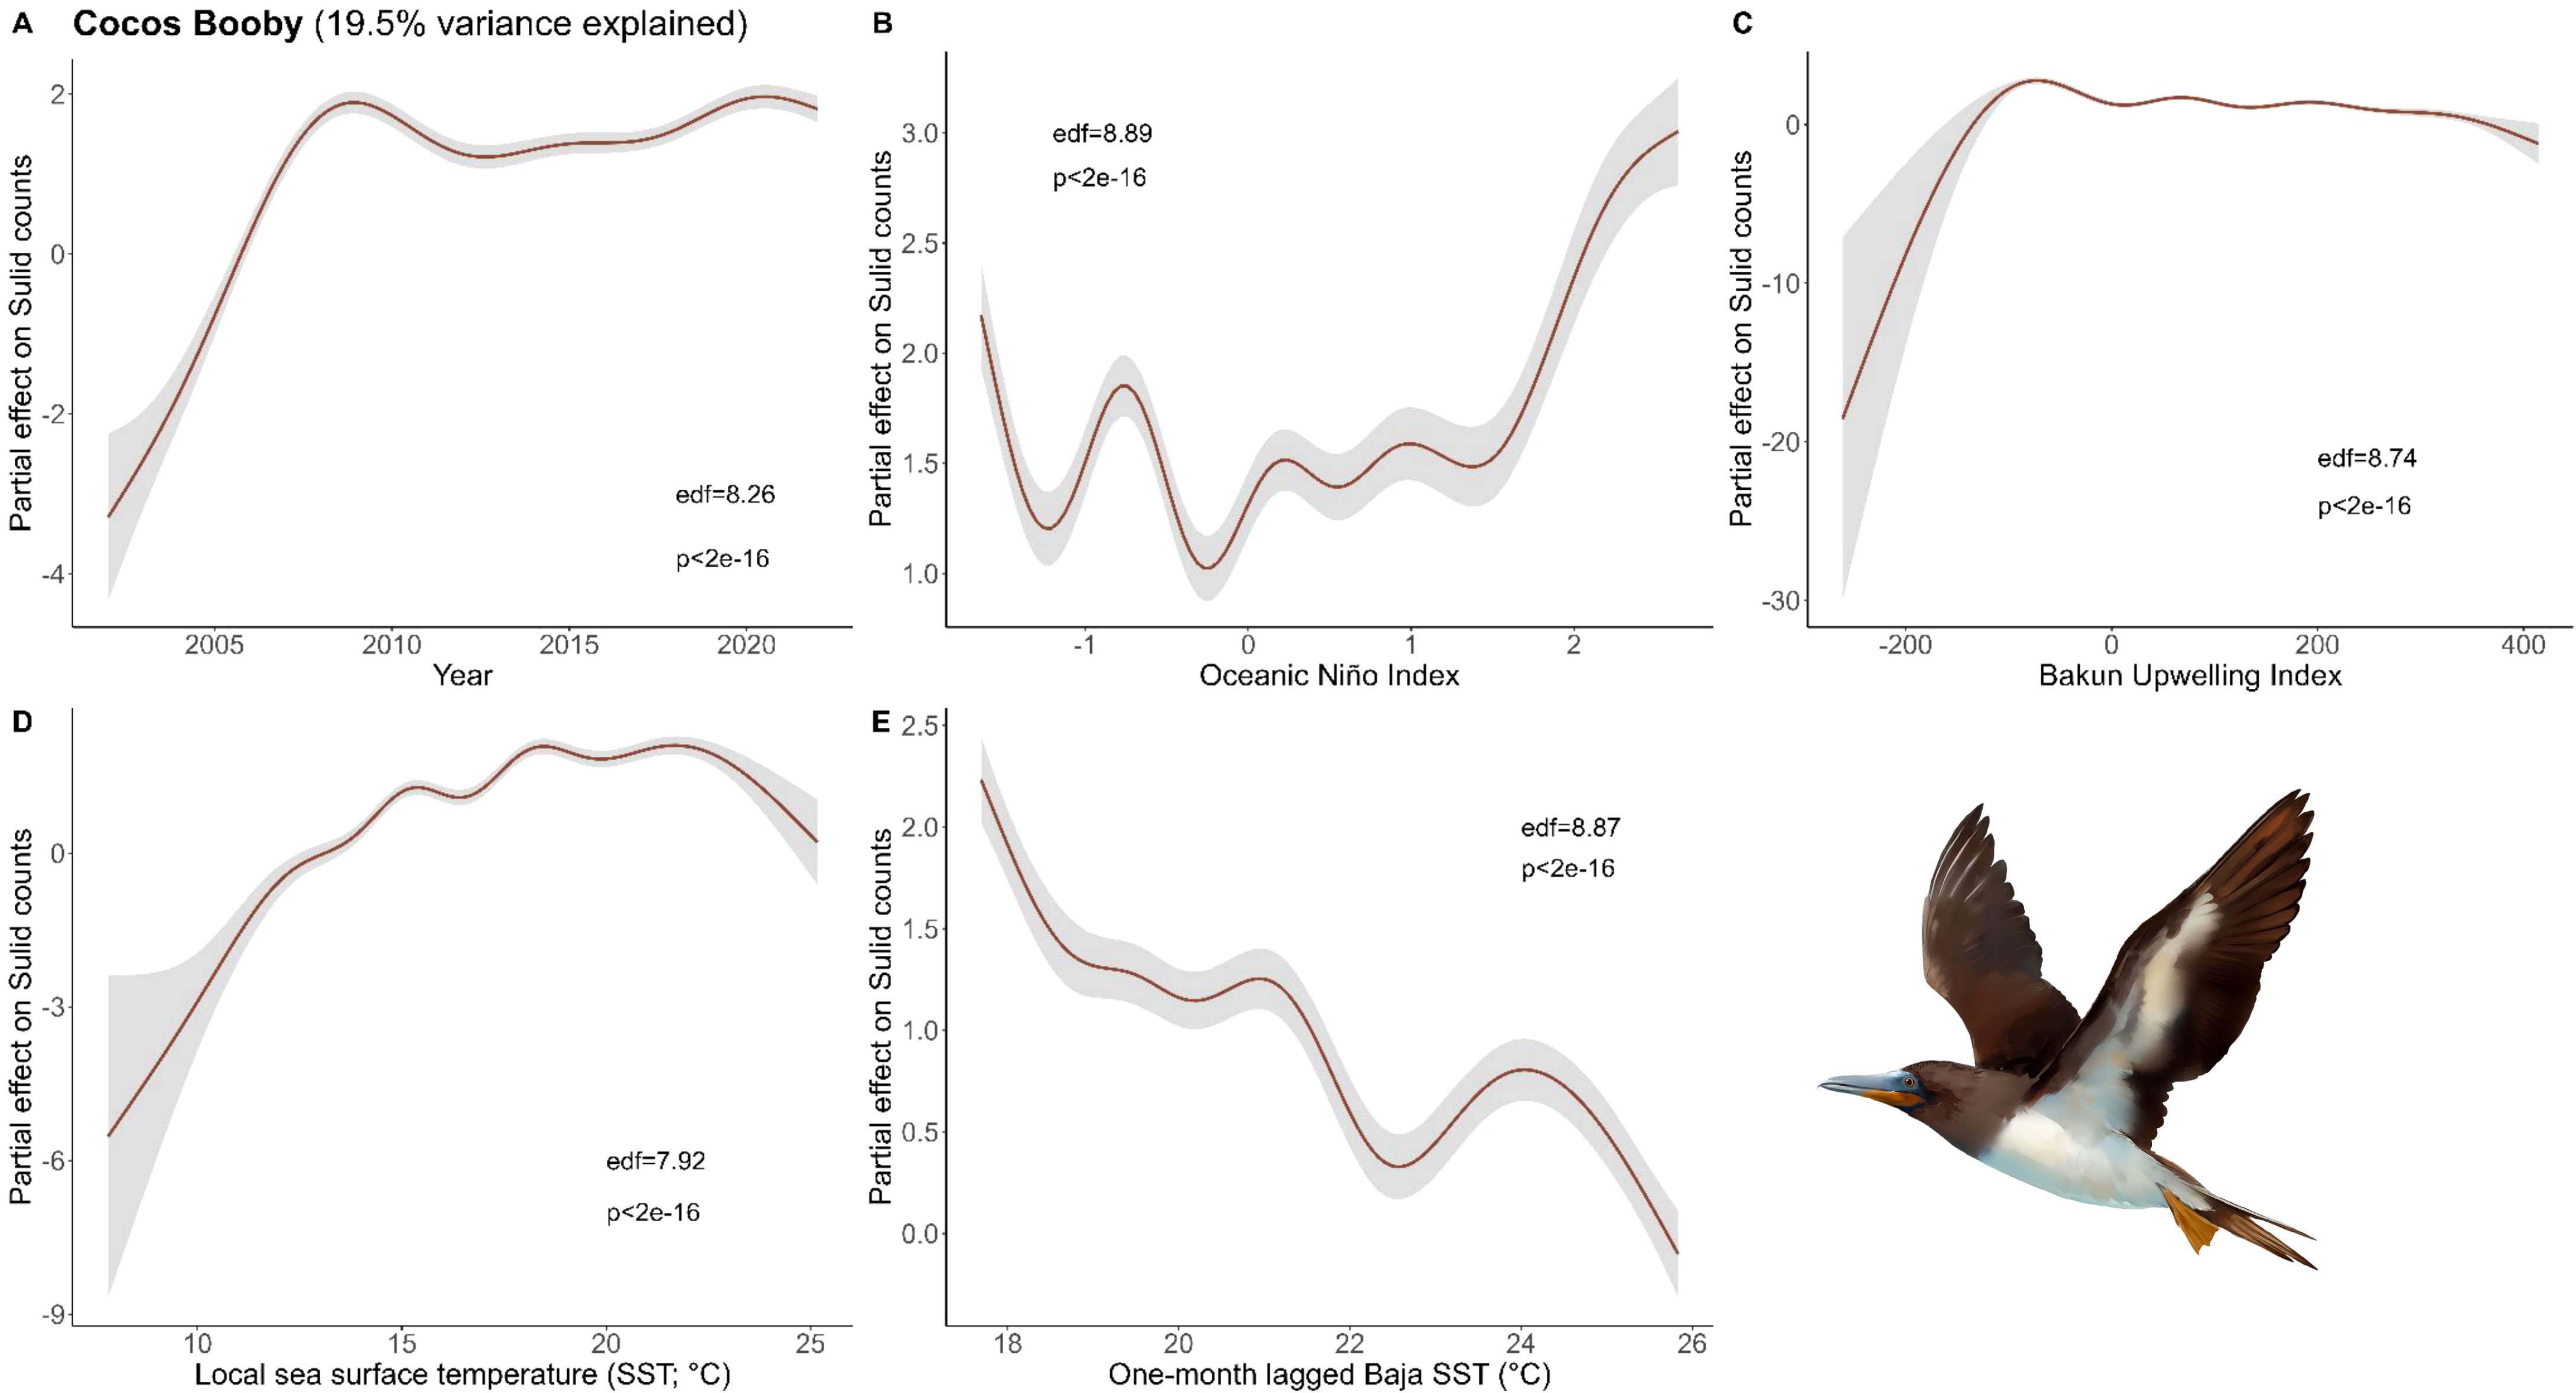
Figure 4. Results of generalized additive models (GAM) on Cocos Booby abundance across (A) years and with environmental variables: (B) Oceanic Niño Index, (C) Bakun Upwelling Index, (D) the sea surface temperature (SST) of the coastal latitude of each observation, and (E) one-month lagged SST in southern Baja. We used all data types to derive the maximum Cocos Booby observations within a 50 x 50 km grid cell for each month and year and used these values as conservative estimates of bird abundance in our analysis (Bird illustrations by Freya Hammar).
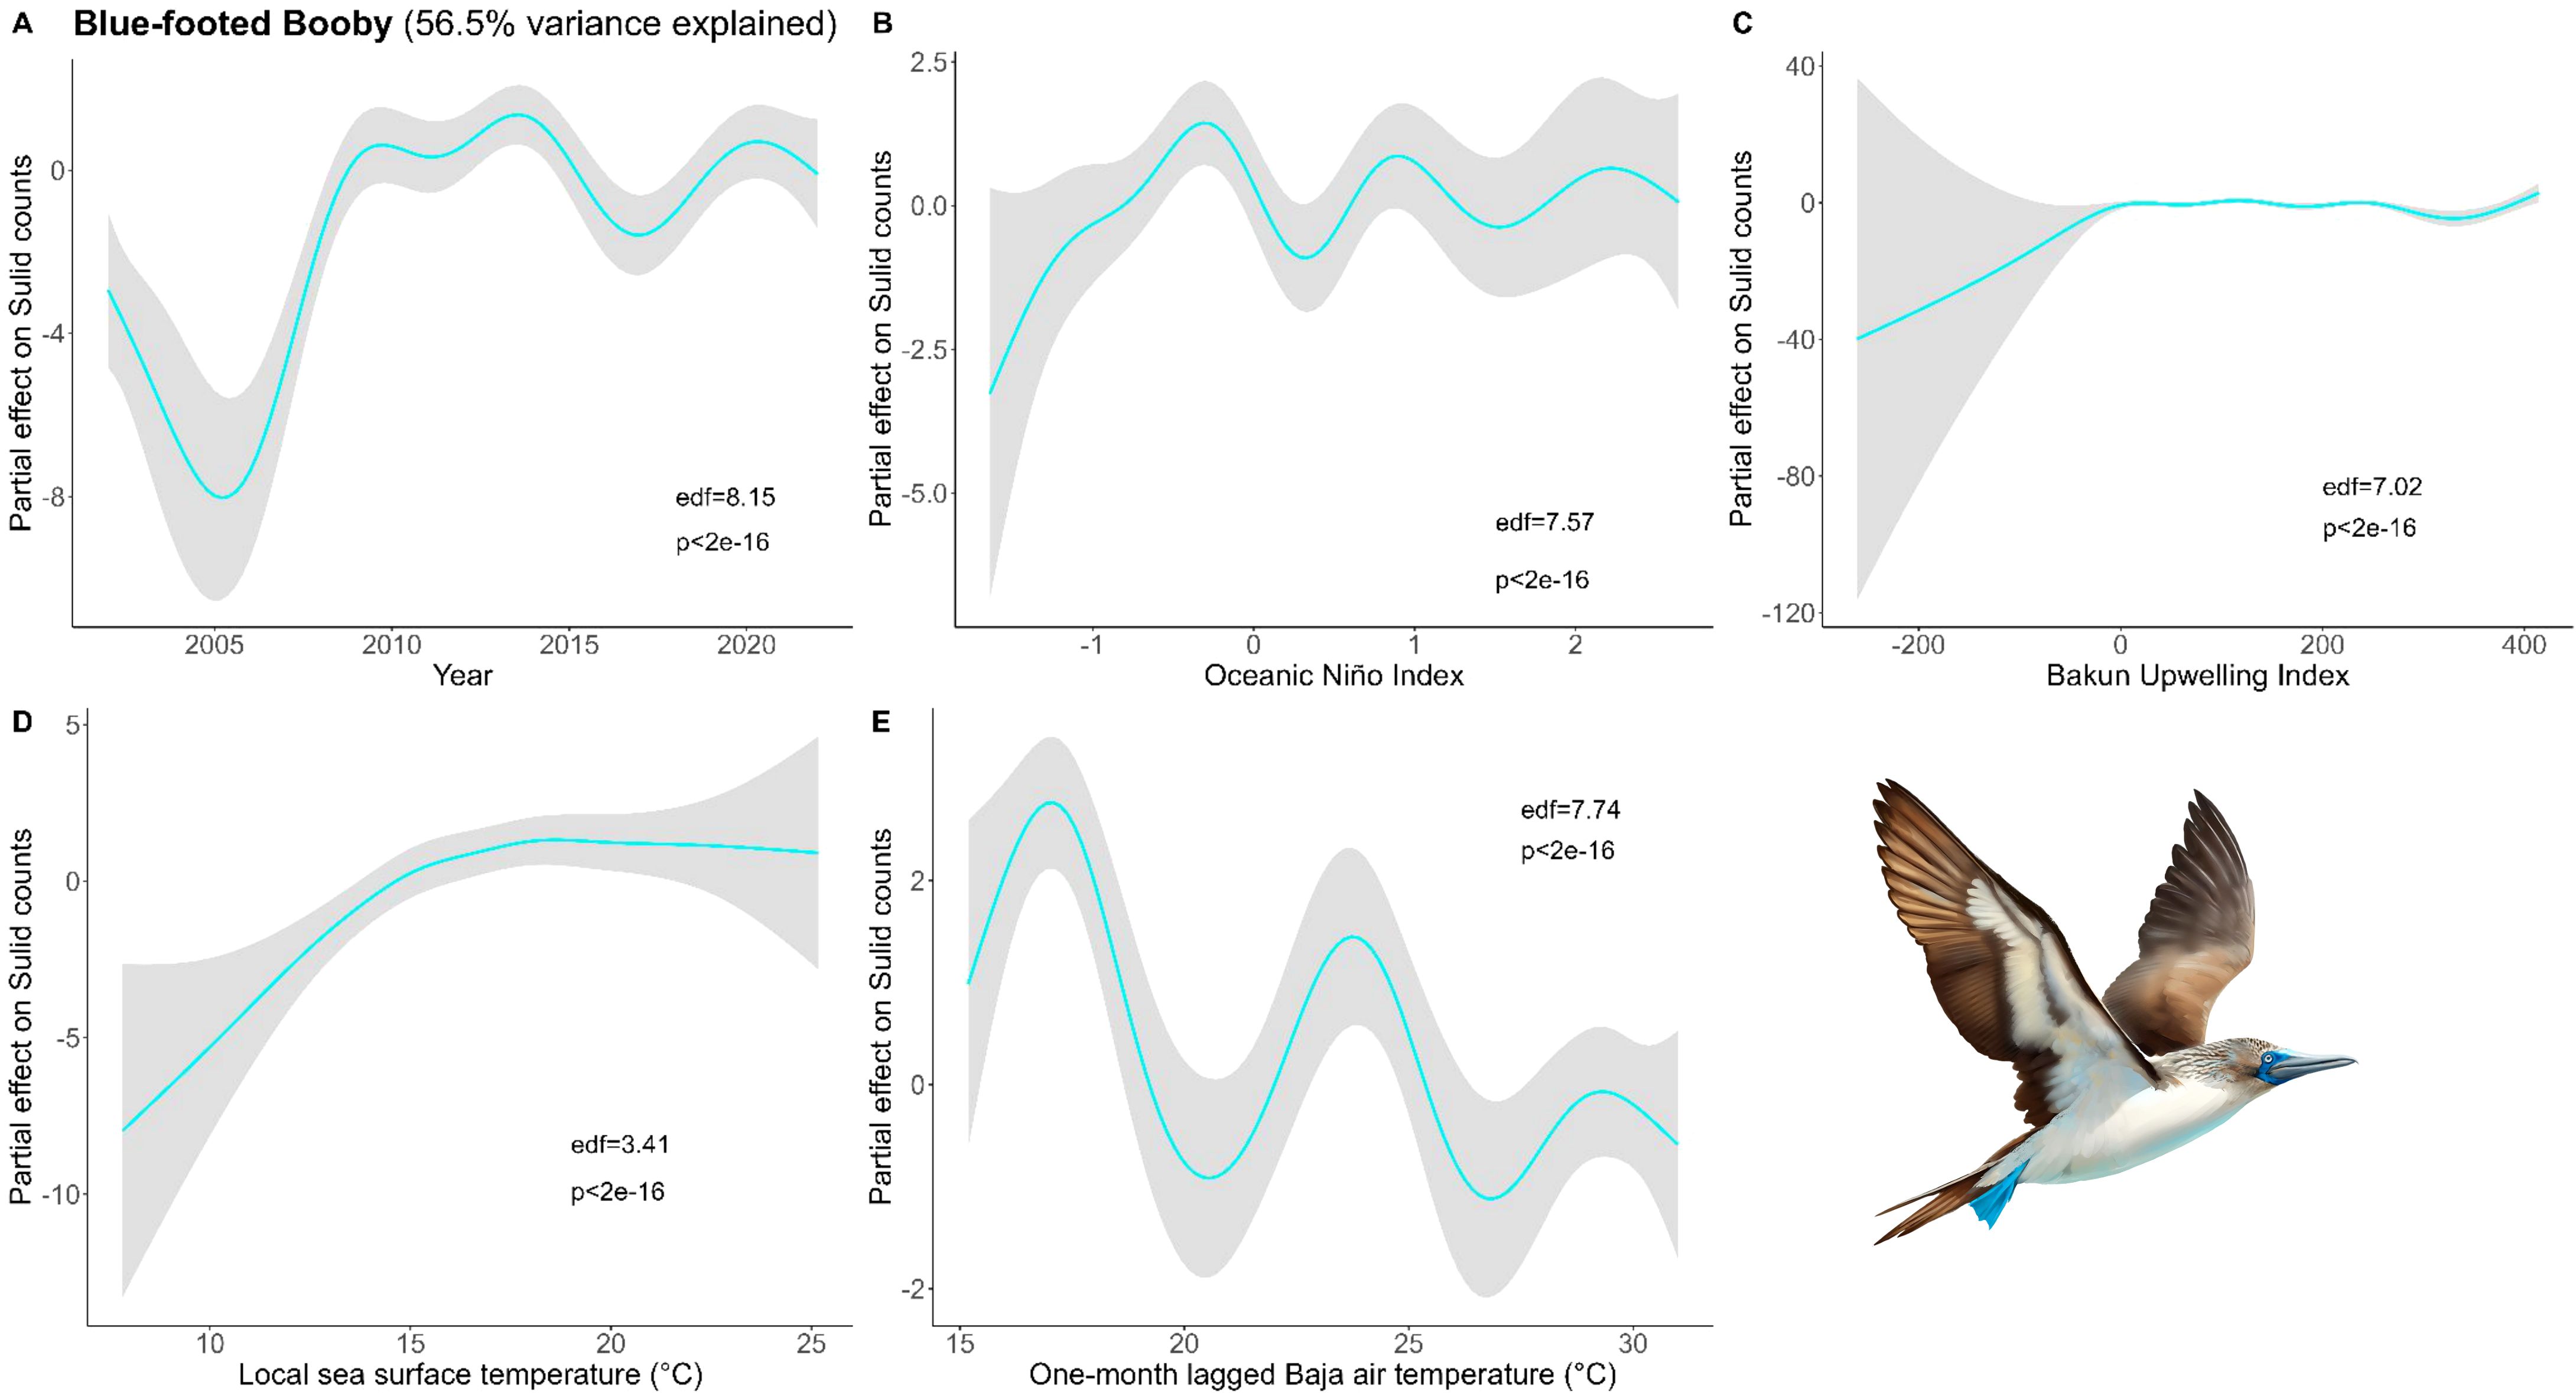
Figure 5. Results of generalized additive models (GAM) on Blue-Footed Booby abundance across (A) years and with environmental variables: (B) Oceanic Niño Index, (C) Bakun Upwelling Index, (D) sea surface temperature of the coastal latitude of each observation, and (E) one-month lagged air temperature in southern Baja. We used all data types to derive the maximum Blue-footed Booby counts within a 50 x 50 km grid cell for each month and year and used these values as conservative estimates of bird abundance in our analysis (Bird illustrations by Freya Hammar).
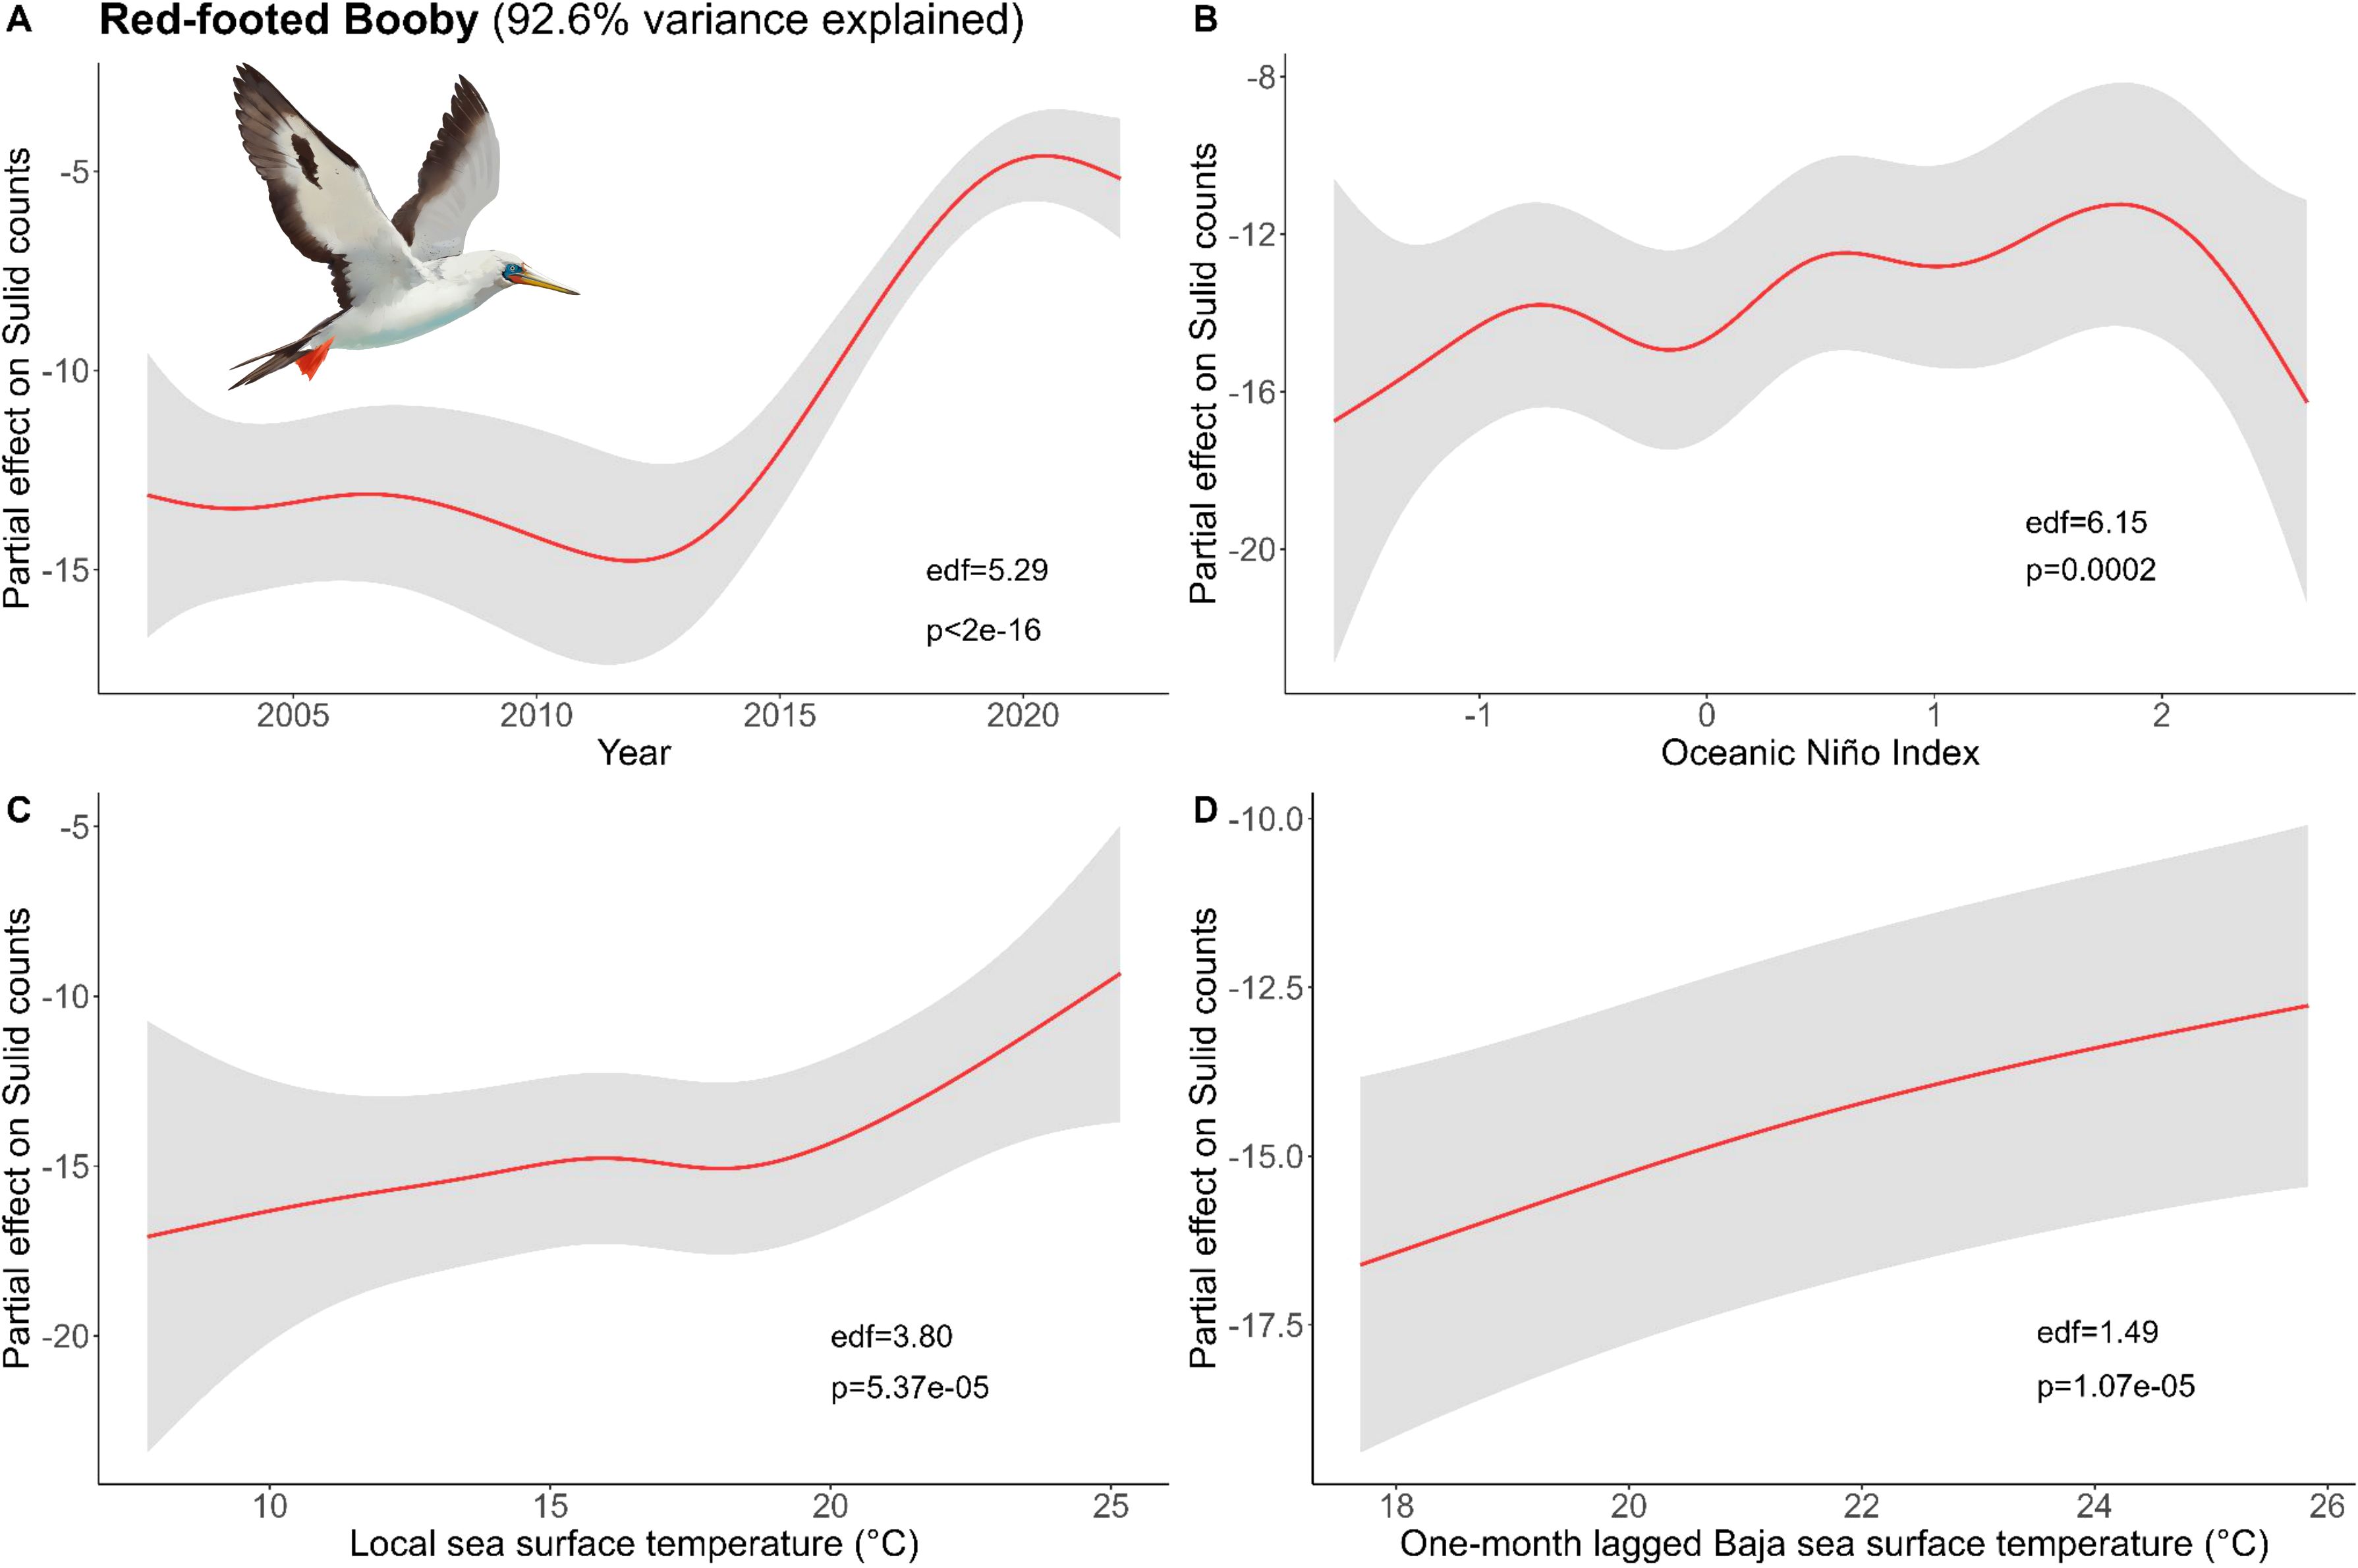
Figure 6. Results of generalized additive models (GAM) on Red-Footed Booby abundance across (A) years and with environmental variables: (B) Oceanic Niño Index, (C) the sea surface temperature (SST) of the coastal latitude of each observation, and (D) one-month lagged southern Baja SST. We used all data types to derive the maximum Red-footed Booby counts within a 50 x 50 km grid cell for each month and year and used these values as conservative estimates of bird abundance in our analysis (Bird illustrations by Freya Hammar).
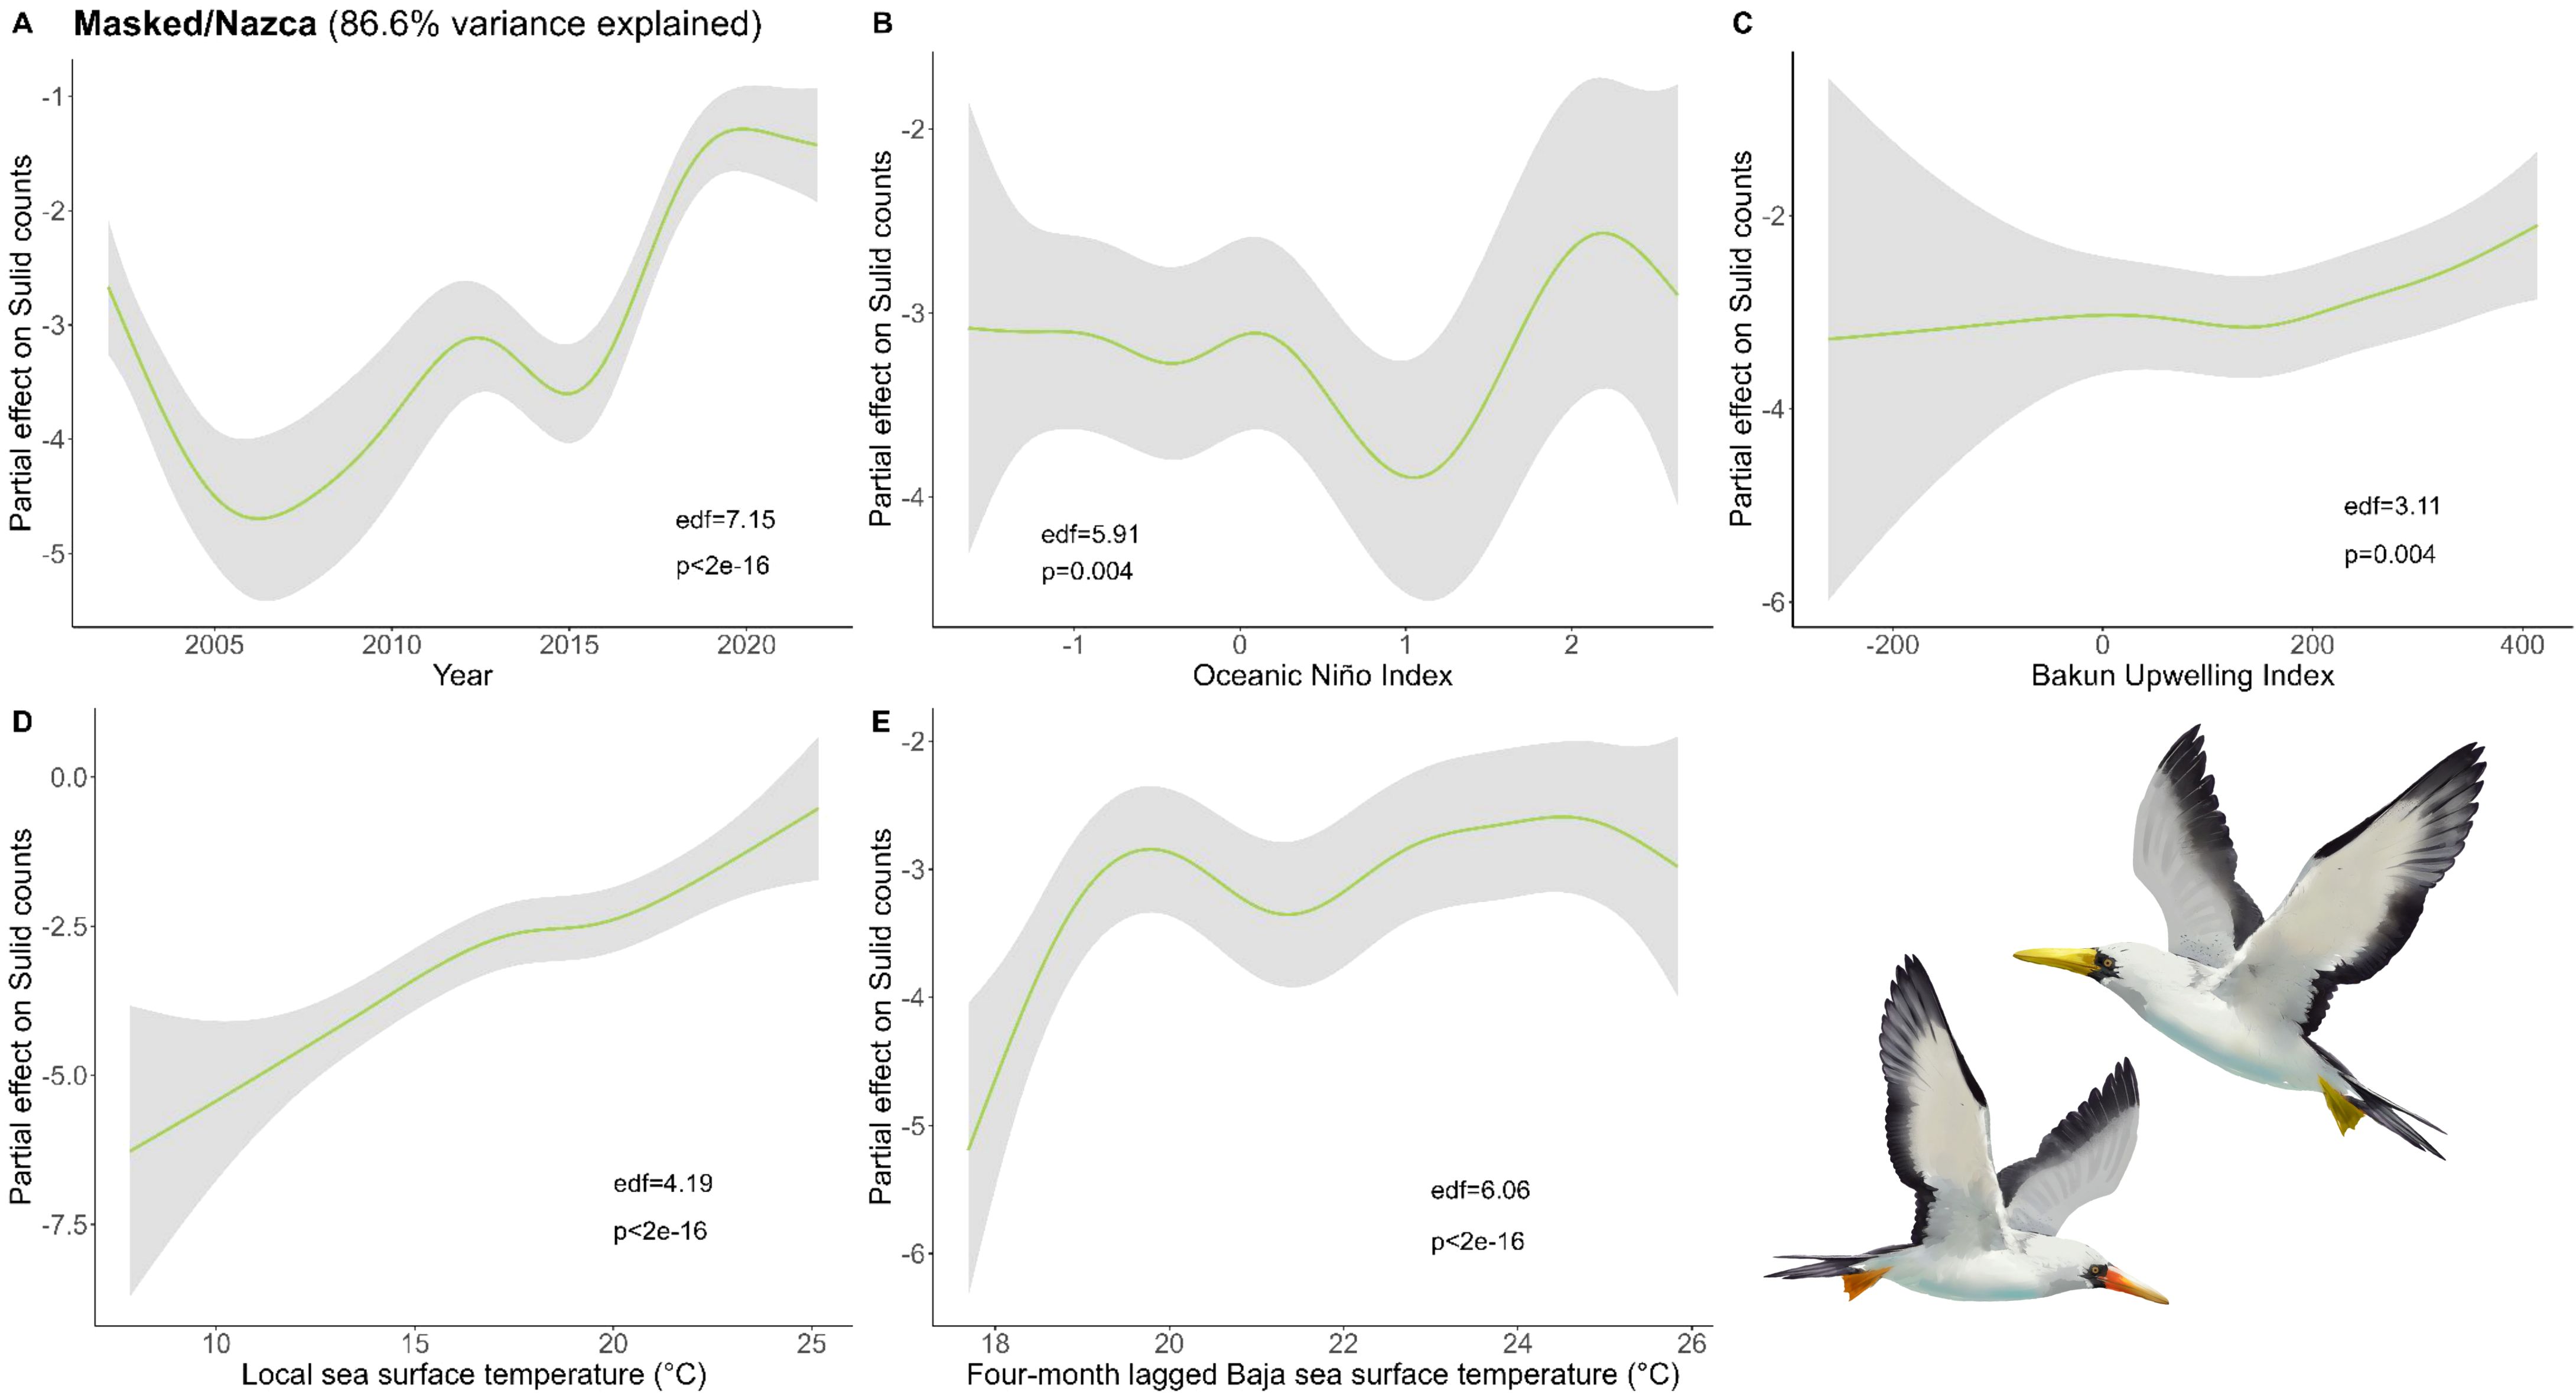
Figure 7. Results of generalized additive models (GAM) on Masked and Nazca Booby abundance across (A) years and with environmental variables: (B) Oceanic Niño Index, (C) Bakun Upwelling Index, (D) the sea surface temperature (SST) of the coastal latitude of each observation, and (E) four-month lagged SST in southern Baja. We used all data types to derive the maximum Masked and Nazca Booby counts within a 50 x 50 km grid cell for each month and year and used these values as conservative estimates of bird abundance in our analysis (Bird illustrations by Freya Hammar).
3.2 Changes with environmental conditions
We selected lagged variables that had the two highest correlations with the abundance of each species (Supplementary Figure S5). Abundance had a positive relationship with recent conditions (0-1 month lags) and conditions 5-7 months prior for all species. We selected lagged variables with a correlation coefficient over 0.1; no correlations were greater than 0.5.
For Cocos, the final model included the variables Year, ONI, local SST, local Bakun Upwelling Index, and one-month lagged S. Baja SST (Figure 4). Our models did a poor job capturing their abundance in the CCE (19.5% variance explained), which suggests there were other factors driving this northward expansion or that their sustained presence and abundance over this time may have masked trends.
For Blue-footed, the final model included Year, ONI, local Bakun Upwelling Index, local SST, and one-month lagged S. Baja air temperature (Figure 5). Blue-footed were abundant during diverse conditions in the CCE. Local SST had the largest partial effect, with greater abundance during warmer local SST. There were pulses of Blue-footed during cool, moderate, and warm S. Baja air temperatures, indicating this is not a main driver for birds in the CCE.
For Red-footed, conditions with one-month lag had better explanatory power for their abundance than longer lagged data. The Bakun Upwelling Index was not a significant predictor and was removed, which improved the explanatory value of our model, which included Year, ONI, local SST, and one-month lagged S. Baja SST (Figure 6). Red-footed abundance was best explained by the year, then local and lagged S. Baja SST. The trend with SST and ONI indicated there was higher abundance during warmer conditions (higher SST and El Niño).
For Masked and Nazca, longer lagged source data were better explanatory variables (seven-month lagged S. Baja air temperature and four-month S. Baja SST; Figure 7). The four-month lagged S. Baja SST resulted in the best fitting model, and our final model included year, ONI, local Bakun, local SST, and four-month lagged S. Baja SST. Masked and Nazca abundances were greatest during warm water conditions (local and four-month lagged S. Baja SST) and El Niño.
When we compared Sulid abundance before and after the 2013-2016 MHW, we found that all species significantly increased after this warm-water event (692-3015%; Table 1). For all species, both the mean number of individuals, and number of positive observations (lower proportion of zeros) increased (Table 1). For all species except Blue-footed, there was also a significant increase in maximum number of birds seen at one time (Cocos from 20.5 ± 18.2 to 136.9 ± 46.2; Red-footed from 1 ± 0.5 to 3 ± 0.9; Masked and Nazca from 2 ± 0.5 to 10 ± 2.6).
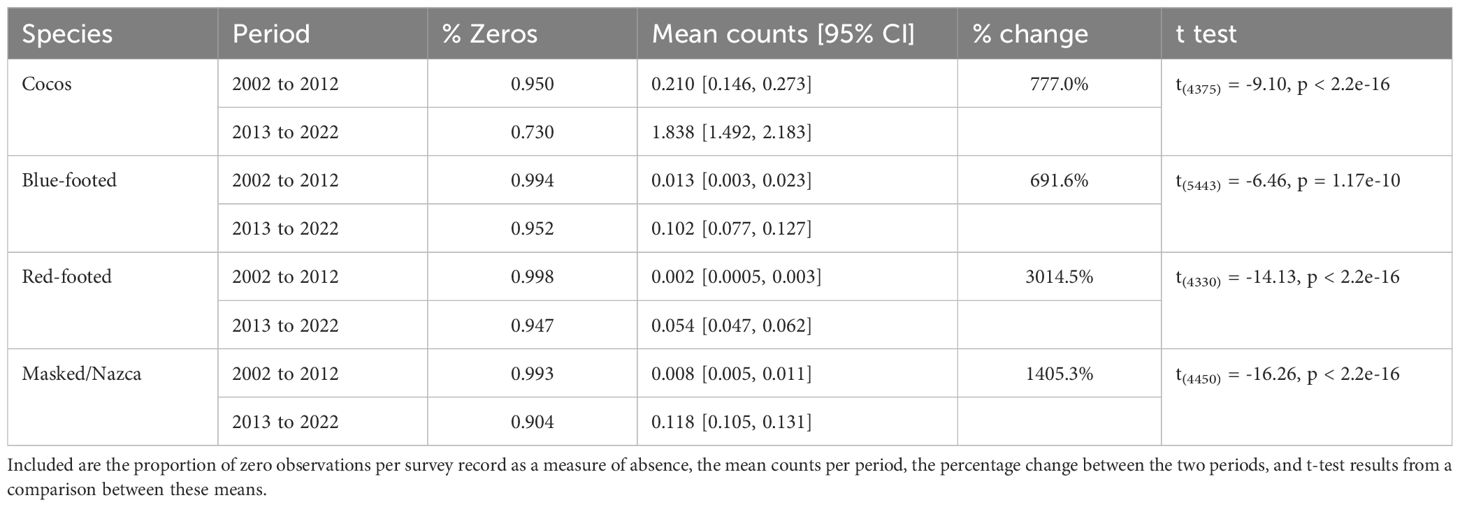
Table 1. Comparison between Sulid (Booby) observations before the 2013-2016 marine heatwave (2002-2012, n = 4,581 grid cells) and the period during and after the heatwave (2013-2022, n = 4,100 grid cells).
3.3 Changes in range
All Sulids expanded their range northward during our study period (Figures 8, 9). As we are only evaluating these spatial changes at the northern edge of their range, we cannot say whether it is a range shift or expansion, but for the sake of brevity, we call it a northward expansion. The range of Cocos, Red-footed, and Masked/Nazca all increased in maximum latitude (Adj. R2 = 0.58, p=0.00004; Adj. R2 = 0.46, p=0.0045; and Adj. R2 = 0.62, p=0.00004, respectively) and range area (F(1,19)=52.98, p=6.62e-07;, F(1,12)= 32.08, p=0.0001;, and F(1,17)= 29.58, p=4.42e-05, respectively). This change was not significant for Blue-footed in either their maximum latitude or area of their range.
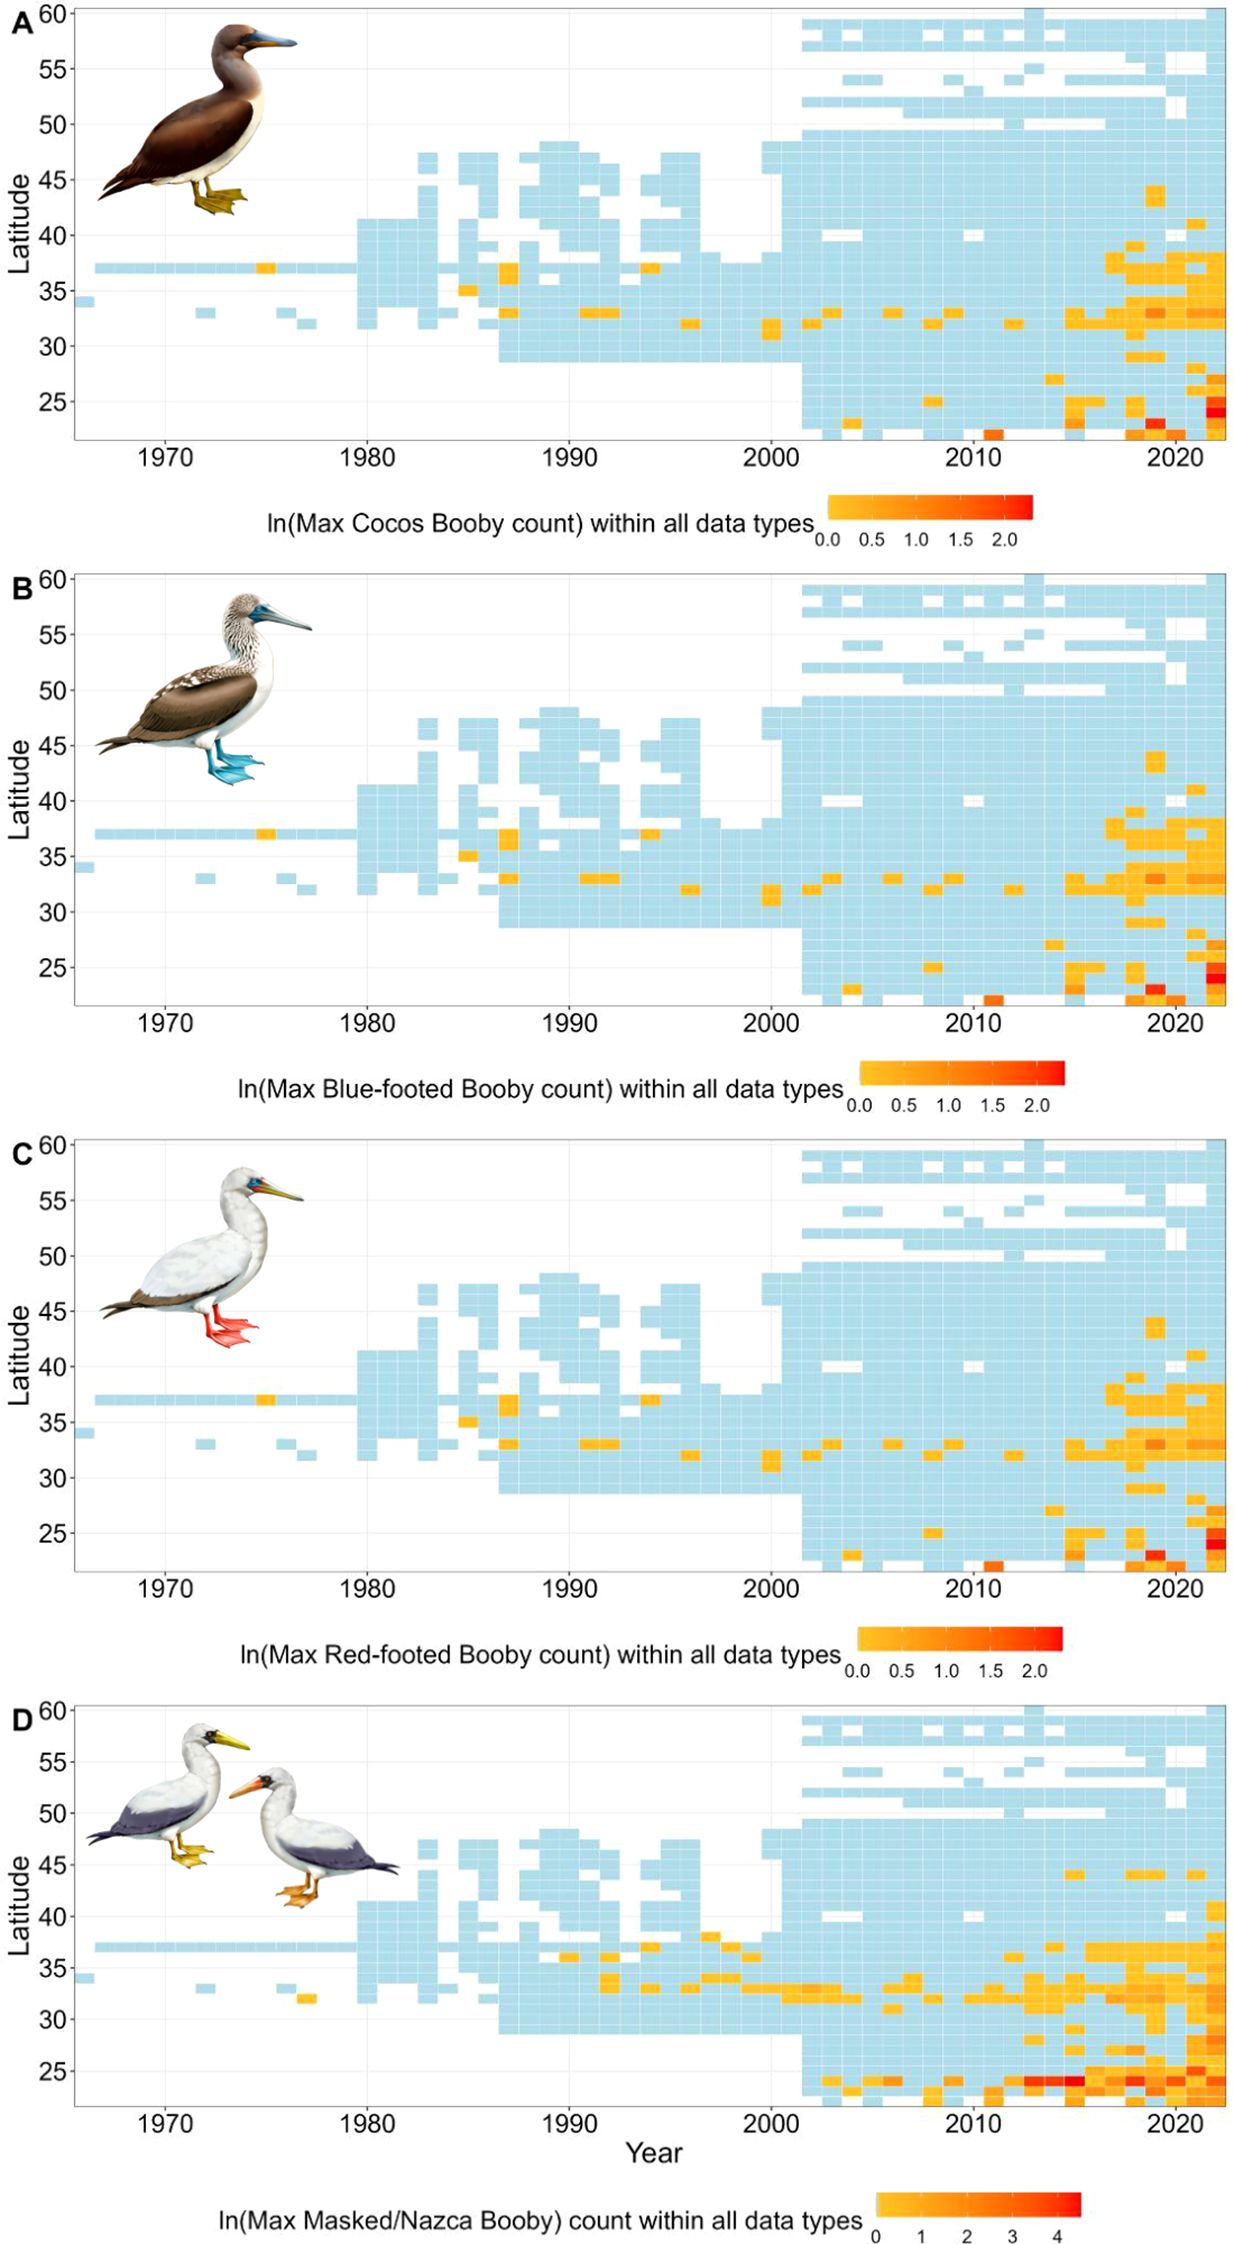
Figure 8. The maximum number of (A) Cocos, (B) Blue-footed, (C) Red-footed, and (D) Masked/Nazca Booby, observed within each latitude per year in the Northeastern Pacific Ocean. Boxes in blue indicate there was data collected within this latitude and year, but there were no Sulids observed. As there are many single observations and some large values, we took the log of maximum counts and centered the color gradient on the mean to show smaller values (Bird illustrations by Freya Hammar).
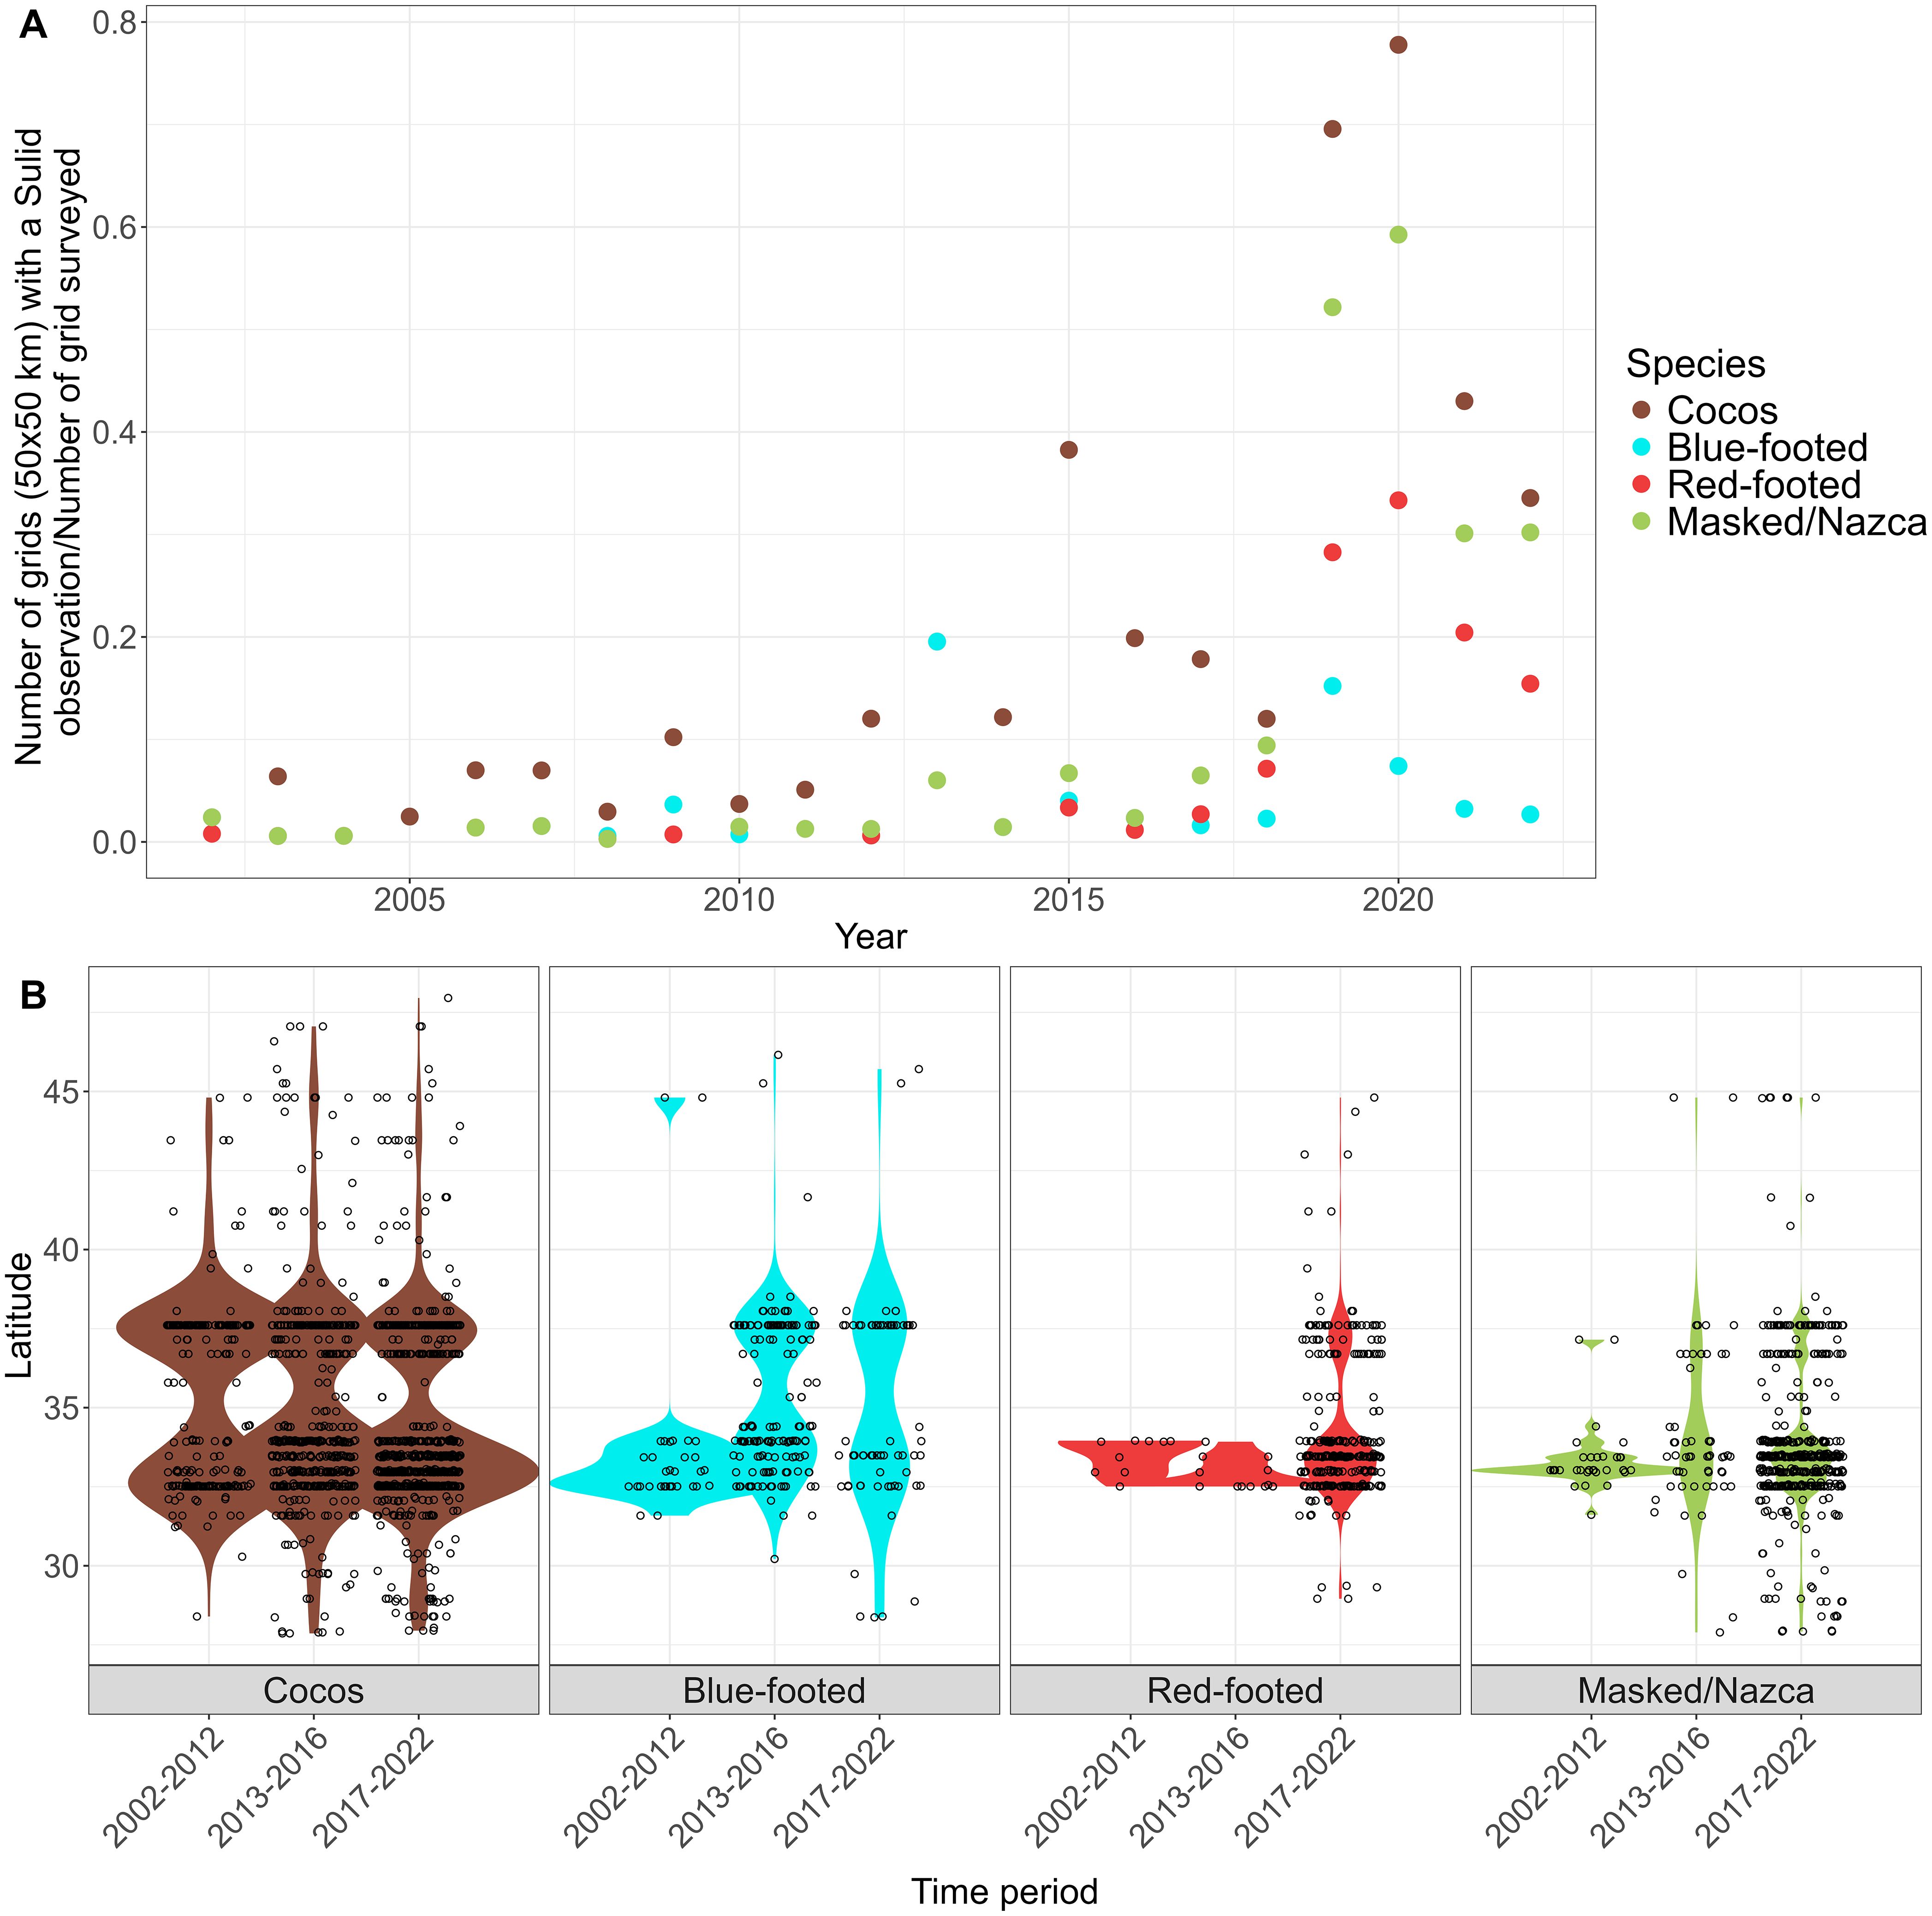
Figure 9. (A) The number of grid cells that a Sulid was observed divided by the total number of grid cells that had any survey effort within the CCE. In-plot statistics are the results of generalized linear models on the grids observed/grids surveyed per year for each species (COBO, Cocos; BFBO, Blue-footed; RFBO, Red-footed; MA/NA, Masked/Nazca Booby). (B) Violin plot with overlaid observations for the latitude of sighting per month and year for each species within each period (2002-2012, 2013-2016, 2017-2022); only observations along the west coast were included (southern Baja, South, Central, and North biogeographic regions).
The northward expansion of Sulids corresponded with the warmer periods during MHWs, with an increase in their maximum latitude by 4-6 degrees and the size of their range area by 167-777% between pre-MHW (2002-2012) and during/after MHW (2013-2022; Figure 9B; Supplementary Figure S6, Supplementary Table S2). The northward expansion of Cocos began in the late 2000’s (Figures 8, 9), with further expansions in their range in 2015 and 2019. During the 2013-2016 MHW, Cocos abundance and maximum latitude increased (Figure 9B; Supplementary Figure S6, Table S2), and these have remained similar since. Compared to the pre MHW period (2002-2012), Cocos expanded their range area by 287.5% and their maximum latitude by 6.18 degrees. Prior to 2002, Blue-footed periodically moved northward in large pulses (Figure 8; Supplementary Figure S6). However, although Blue-footed expanded their range (5.5 degrees north and 235% in area) during the MHW periods (2013-2022), the increase across 2002-2022 was not statistically significant (Figure 9; Supplementary Figure S6). Very few Red-footed were observed within the CCE prior to 2002 (Figure 8); since then, their abundance and range have increased, especially since 2018 (Figure 9, Supplementary Figure S6). After 2012, Red-footed increased their range by 920.8% and their annual maximum latitude by 4.86 degrees (Figure 9A; Supplementary Table S2). Observations of Masked and Nazca occurred sporadically throughout the 1990’s and 2000’s, with an increase in abundance after 2012 (Figure 8). There was an increase in their abundance during the 2013-2016 MHW; this increased further in 2019 (Supplementary Figure S6). After the pre-MHW period, Masked and Nazca increased their range area by 1013.9% and their annual maximum latitude by 6.85 degrees (Figure 9B; Supplementary Table S2).
4 Discussion
All five Sulid species in our study increased in abundance, range area, and maximum latitude in the CCE during our study period (2002-2022), and increases in their abundance corresponded to warm water events. After increases in their abundance and range, for all species except Blue-footed, they did not contract back to their previous range.
4.1 Changes in abundance
Cocos have an eastern Pacific distribution and were occasionally recorded along the U.S. West Coast before our survey period (2002-2022). Prior to their breeding range extension, the nearest colonies were on Clipperton Atoll and Islas Revillagigedo (Schreiber and Norton, 2020) off central Mexico and on Roca Consag and Isla San Jorge in the Gulf of California (Mellink et al., 2000). The first record in California was in 1946 (McMurry, 1948) in Imperial County and small numbers were seen north of Mexico until the early 2000’s (McCaskie, 1970). Since 2002, their abundance increased, with substantial increases after 2013, which includes the 2017 colonization of Sutil Rock in the Channel Islands, California (Howard et al., 2024; Figure 3). This is now the most common Sulid in the CCE, with no apparent seasonality in their occurrence; they are now permanent, year-round residents.
Blue-footed are found within the Eastern Tropical Pacific and have a coastal distribution compared to the other Sulids in our study (Nelson, 1978). Prior to their breeding range extension, the closest breeding locations were within the Gulf of California, although the largest breeding colonies occur on the Galapagos Islands (Nelson, 1978; Díaz and Gómez, 2020). This species was first recorded in California at the Salton Sea in 1929 (Clary, 1930) and is the most commonly observed species inland. Although there were large pulses in their abundance in 1973 (inland only) and in 2013 (all CCE regions but the north), their distribution and abundance trends are different from other Sulids as they have not significantly increased over time or remained in large numbers after warm water events. As they are a coastal Sulid (Zavalaga et al., 2008), there may be limitations on their range and/or specific habitat preferences responsible for this difference from other Sulids. However, a few individuals have begun breeding at Sutil Rock in the Channel Islands, so this colony may provide a foothold for their future establishment in the CCE.
Both Red-footed and Masked have a pantropical distribution, while Nazca are only found in the Eastern Tropical Pacific and all three are highly pelagic. Their nearest breeding locations occur on Islas Revillagigedo and/or Clipperton Atoll off central Mexico (Howell and Pyle, 1997; Pitman and Ballance, 2002). These Sulids were mostly observed during summer and fall. Masked and Nazca are seasonal breeding species. For example, Masked that breed on Clipperton Island begin laying eggs in November and chick-rearing can continue through February (Weimerskirch et al., 2008), while Nazca that breed on the Galapagos have a breeding season that spans October to June (Tompkins and Anderson, 2021). Therefore, most of the birds showing up in the CCE are arriving (May-Nov) during the non-breeding season. Conversely, Red-footed are seasonal breeders at some locations (Weimerskirch et al., 2005), while not at others (Nelson, 1969). Their seasonal occurrence may indicate that birds in the CCE are from colonies with seasonality, and they are here during the non-breeding season. There were limited sightings of these three species prior to our study period. The first Red-footed observation in California was at SEFI in 1975 (Supplementary Figure S1, Huber and Lewis, 1980), first Masked off San Clemente Island in 1977 (Lewis and Tyler, 1978), and first Nazca was in 2013 when a carcass was recovered in Ventura, CA (Benson et al., 2022). Reports of these species remained sparse before increasing in the mid-2000’s, and substantially since 2018.
4.2 Changes in abundance with environmental conditions
As seabird distributions can reflect productive conditions for their prey, we evaluated which environmental conditions may have encouraged changes in Sulid northern abundance. Connections between marine predators and the environment can be concurrent, or they may occur at different lagged time scales depending on how the distribution, abundance, and quality of their prey are affected (Wakefield et al., 2009; Mendez et al., 2017a). We found that Sulids responded to their ‘source’ conditions (SST and air temperatures) at scales of 0-1 months or 5-7 months, such that some individuals appeared to respond rapidly to changing conditions, while others appeared to wait to head north until conditions worsened.
Our models performed well in characterizing the environmental conditions that may drive the abundance of Red-footed, Masked and Nazca, however the trends for Cocos and Blue-footed were not as straightforward. Although Cocos increased during and after MHWs, trends with environmental variables were complicated by their year-round presence in recent years. Similarly, Blue-footed did not show a clear trend with the environment, although a pulse in Blue-footed abundance occurred during a warm period (2013) when conditions further south or in the Gulf of California may have been poor compared to conditions in the central and northern CCE. These more favorable conditions may have retained recurrent visitors, such as the two second-year birds that showed up on SEFI in 2014 and returned each year (2015-2018), and the breeding pair on Sutil Rock (Howard et al., 2024).
For the highly pelagic and wide-ranging Red-footed, their abundance increased between the mid-2010’s to 2022 during the warm water and reduced upwelling conditions of the extreme MHWs. Although there was a positive relationship between Red-footed abundance and one-month lagged S. Baja SST, some of these individuals may have travelled from breeding locations in Hawaii, which may explain the one record of this species off Alaska in 2022.
Masked and Nazca abundances were higher during warm-water conditions. Tracking studies have shown that these large Sulids will travel far in search of productive conditions (Sommerfeld et al., 2015); their occurrence during poor conditions may be an indication that conditions in their typical range were even worse.
4.3 Changes in range
This study documented the northward range expansion of five Sulid species into the CCE. Both range area and maximum latitude have increased over time for all species except Blue-footed. Although Blue-footed increased its area and latitude northward between pre/post MHW, it was not a linear trend. Blue-footed movements north of Baja have been limited except for a few substantial incursions, with only a few individuals remaining afterwards. This pattern may change now that they expanded their breeding range north; however, breeding appears to be limited to only a few nests at most (Díaz and Gómez, 2020; Howard et al., 2024). Prior to the northward breeding expansion to Sutil Rock, Cocos had expanded their breeding range to Middle Rock, Baja California in 2005 (Whitworth et al., 2007). After this initial northward breeding extension, Cocos abundance rapidly increased, with peak abundance occurring during the initial years of attendance and breeding attempts at Sutil Rock (starting in 2013; Howard et al., 2024).
For Red-footed, their northward expansion did not occur until 2018. They were observed sporadically before 2002, as lone individuals mostly within 31-33˚N, with one record at SEFI in 1975 (~37˚N). Starting in 2018, their range area and northward limit expanded until numbers plateaued in 2021.
Even though Masked and Nazca increased in abundance during the mid-2000’s, their ranges did not significantly expand northward until 2013. Initially, the expansion was due to an uptick in Nazca abundance and northern range (Supplementary Figure S1 & Supplementary Figure S2). After 2018, the abundance, range area, and maximum latitude of both species increased and continued to increase to 2022. In the most recent year of our data (2022), there was at least one Masked/Nazca detected within each degree of latitude between 22˚N and 37˚N.
4.4 Changes associated with marine heatwaves
There was a variety of climatic conditions during our survey period (2002-2022), including the largest El Niño since 1997/1998 (Chen et al., 2017) and three intense MHWs. The largest MHW began in the fall of 2013, and soon, the North Pacific reached temperatures of three standard deviations above the mean (Bond et al., 2015; Di Lorenzo and Mantua, 2016; Suryan et al., 2021; Cavole et al., 2016). Anomalous warming began in the southern CCE in spring 2014, and by summer, records off Baja California reached 4˚C above the mean (Figure 2; Robinson, 2016; Leising et al., 2015). This MHW peaked in 2015, and warmer conditions remained through 2016 (Gentemann et al., 2017; Hobday et al., 2018). This MHW coincided with the severe El Niño that developed in April 2015 and persisted until May 2016, suppressing upwelling and increasing SST further in the Eastern Pacific (Mcclatchie et al., 2016; Wells et al., 2017). With little time for this ecosystem to recover, there was a localized MHW in the SCB during the summer of 2018 that extended from Point Conception, California to Point Eugenia, Baja California Sur (Fumo et al., 2020). While this MHW was severe in the SCB, north of Point Conception SST anomalies were negative, which may have encouraged Sulids northward. The next MHW began in summer of 2019 due to a weakening of the high-pressure system in the North Pacific and persisted through 2020 (Amaya et al., 2020; Chen et al., 2021; Welch et al., 2023).
The abundance and range of all five Sulids in this study increased during and after these MHWs (Figure 10 & Supplementary Figure S6). Cocos increased during the 2013-2016 MHW, with peaks in their abundance coinciding with El Niño (2015-2016; Supplementary Figure S1). This increase occurred alongside the initiation of breeding at Sutil Rock, and the continued use of this colony supported their occupancy in the CCE to the end of our study period in 2022 (Howard et al., 2024). In contrast, Blue-footed increased during initial warming of the MHW (September-December 2013), however they did not remain afterwards, with the exception of a few, likely recurring individuals. Red-footed remained rare visitors until 2018, during the severe MHW in the SCB and Baja California, when their abundance and range suddenly increased. Masked and Nazca began increasing preceding the 2013-2016 MHW, however their abundance and range substantially increased during the MHW and severe El Niño and continued afterwards. The severe El Niño exasperated already warm waters throughout this region and affected conditions throughout the entire Pacific basin, which may have brought Sulids from further locations to the CCE, such as Masked that breed outside of the Eastern Tropical Pacific.
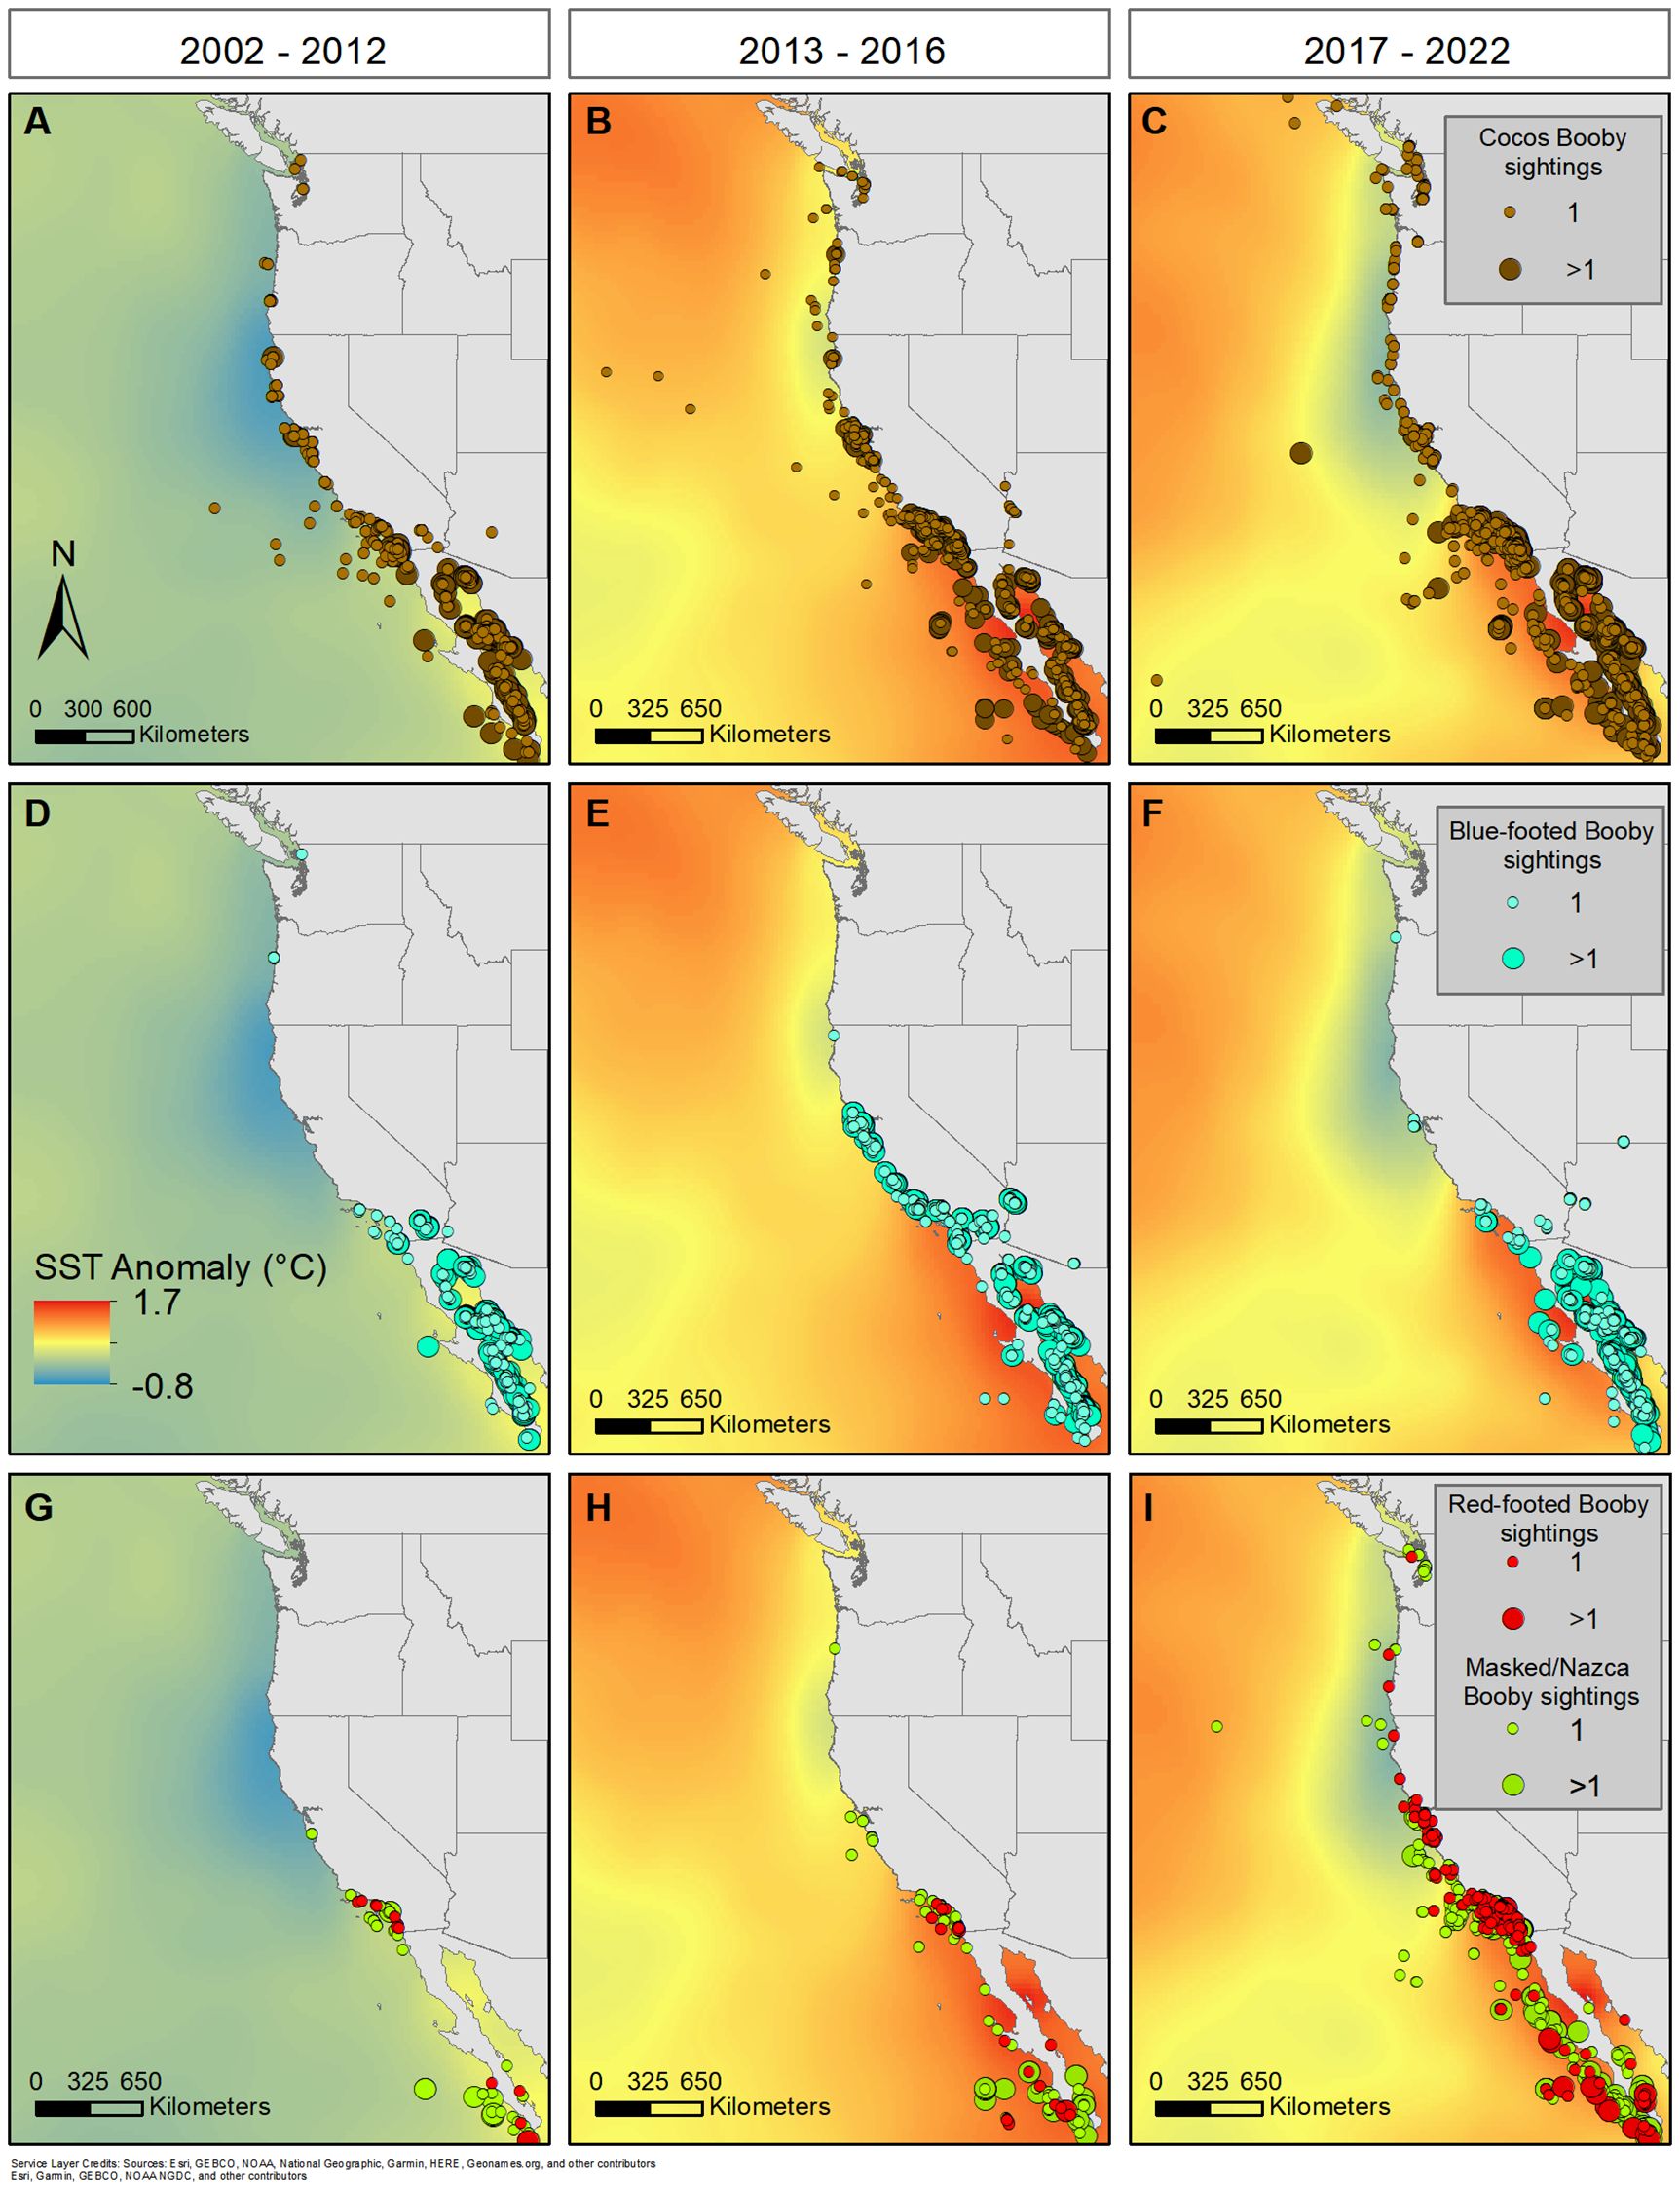
Figure 10. Map of the sea surface temperature (SST) anomalies within the California Current Ecosystem during three periods during our study; (A, D, G) before the extreme marine heatwaves (MHV; 2002-2012), (B, E, H) during the extreme 2013-2016 MHW, and (C, F, I) afterwards (2017-2022), which included a regional MHW off of Baja in 2018 and a larger MHW in the North Pacific in 2019. Mean anomalies within each period were calculated from the mean SST across available data (1947-2022; HadISST, Rayner et al., 2003). The distribution of all observations (i.e., from all at-sea, Farallon Island, Bird Records Committees, and eBird) were plotted for each species. We reduced bias of counts at colonies by splitting observations into one or greater than one for all reported sightings.
As MHWs are projected to increase in frequency and intensity, in addition to long-term warming, we hypothesize that these species will continue their northward expansion (Oliver et al., 2018; Oliver, 2019; Laufkötter et al., 2020; Jacox et al., 2020). Seabird prey are poikilothermic, therefore changes in SST (along with subsequent changes in nutrients from depressed upwelling) directly influence the distribution and health of their prey (Sunday et al., 2012; Alfonso et al., 2021), and indirectly the distribution and/or abundance of seabirds (e.g., Veit et al., 1997; Oedekoven et al., 2001; Sydeman et al., 2015). Whether these Sulids are moving northward to escape poor conditions in their established range during MHWs, or whether they are exploring new regions along their range edge and staying within the CCE due to better conditions is unknown and requires further investigation. Dispersal outside of a species range can occur through several mechanisms, such as increased competition, poor habitat quality, or simply through exploratory behavior during, or coupled with, population growth (Clobert et al., 2009; Chuang and Peterson, 2016). Understanding the driver(s) of these expansions will be important for future conservation planning as changes in marine predator distributions can have consequences for pre-existing species, such as increased competition for resources, including food and breeding habitat (Pinsky et al., 2020; Petalas et al., 2021; Petalas et al., 2024).
4.5 Other drivers of sulid northward range expansion
Although environmental conditions explained the trends in some species’ abundance, it did not correlate with all Sulids. Environmental variables are only proxies for conditions that may alter seabird prey; therefore, investigating prey abundance trends directly would be beneficial. As was hypothesized in Howard et al. (2024), the combination of warm water conditions and prey availability likely played a substantial role in the breeding range expansion of Cocos and Blue-footed. Coinciding with the 2013-2016 MHW, was the collapse of the sardine fishery in the Gulf of California (2013-2015; Velarde et al., 2015), while the anchovy biomass around the Channel Islands was at mean conditions (Gallo et al., 2019). These factors set up prime conditions for birds in the Gulf of California to move northwest into the CCE. Moreover, Brown Boobies, recently split from Cocos, have been increasingly moving northward in the northwestern Atlantic Ocean where MHWs and warming ocean temperatures are occurring as well, which indicates the response to these conditions is more widespread than just the northeastern Pacific (Ramírez-Garofalo, 2019; Oliver et al., 2018; Karnauskas et al., 2021).
In addition to oceanographic conditions and prey availability, successful conservation work may have influenced range expansions. Many of the islands with Sulid colonies within the Gulf of California and off the Pacific coast of Mexico have experienced successful eradication of invasive species (Aguirre-Muñoz et al., 2018). Invasive mammals can cause devastating harm to seabird eggs, chicks, and even adults (Spatz et al., 2023). The removals of invasive species and habitat restoration on these islands have had a positive impact on seabirds that breed there (Bedolla-Guzmán et al., 2019; Méndez Sánchez et al., 2022). An investigation into how the timing of restoration and population trends relate to Sulid trends in the CCE would be useful. An increase in population size has been shown to increase vagrancy in other seabird species (Acosta Alamo et al., 2022; Veit, 2000; Zawadzki et al., 2019; Zawadzki et al., 2021), therefore, trends on these islands could play a role in their range expansion.
The potential drivers for the northward expansion of Red-footed, Masked, and Nazca are complicated by their breeding colonies being far removed from the CCE. We also do not have any indication as to what colonies these visitors are travelling from. Increased biologging of individuals at colonies in the North Pacific are needed to better determine foraging ranges during the non-breeding season and how individuals respond to environmental change.
4.6 Reversal to the Miocene
Although warming from anthropogenic climate change is occurring at a more rapid pace, our Earth has previously experienced warm periods. During the mid-Miocene (17-15 Ma) occurred the ‘Middle Miocene Climate Optimum’ (MMCO), a period of high CO2 and dramatic, global warming (Foster et al., 2012; Knorr & Lohmann, 2014). Fossil evidence from southern California and Baja California show that Sulids were once a dominant member of the seabird community, and had high diversity, with six species recorded in California (Warheit, 1992; Stucchi et al., 2015). Sulids were abundant along the Pacific coast of South America in the early Middle Miocene, from which they expanded to North America during the Middle to Late Miocene (Kloess and Parham, 2017), and they were present in California and Baja California until the Late Miocene. Their expansion into the Northeastern Pacific occurred during the MMCO, and as temperatures decreased, the CCE community shifted to diving species, such as alcids (Kloess and Parham, 2017). These shifts in temperature regimes and seabird communities occurred in tandem with the development of the upwelling system in the CCE (White et al., 1992; Holbourn et al., 2014). The recent influx of Sulids to the CCE during extreme warming mirrors shifts that occurred during the Miocene. As we continue to understand how human-induced increases in CO2 and subsequent warming affect marine ecosystems, utilizing paleo records of past events may shed light on the mechanisms and consequences of these changes.
Data availability statement
The data analyzed in this study is subject to the following licenses/restrictions: The data used in this study are either publicly available or can be requested for use (links and contact below). Requests to access these datasets should be directed to eBird (https://science.ebird.org/en/use-ebird-data/download-ebird-data-products); California (https://californiabirds.org), Oregon (https://oregonbirding.org)and Washington Bird Records Committees (https://wos.org); At-sea data derived from Leirness et al., 2021 (https://repository.library.noaa.gov/view/noaa/49073) and additional CalCOFI data (https://calcofi.org/data/marine-ecosystem-data/seabirds/); Southeast Farallon Island data requests can be submitted to Point Blue Conservation Science (aW5mb0Bwb2ludGJsdWUub3Jn).
Author contributions
TR: Conceptualization, Data curation, Formal analysis, Funding acquisition, Investigation, Methodology, Validation, Visualization, Writing – original draft, Software. DP: Conceptualization, Investigation, Validation, Writing – review & editing. JT: Resources, Validation, Writing – review & editing. MV: Funding acquisition, Supervision, Writing – review & editing. JJ: Resources, Writing – review & editing. LB: Project administration, Supervision, Writing – review & editing.
Funding
The author(s) declare that financial support was received for the research and/or publication of this article. This research was supported by the National Oceanic and Atmospheric Administration Dr. Nancy Foster Scholarship; NA20NOS4290114.
Acknowledgments
We thank all data collectors and contributors to this study, including at-sea data principal investigators (Supplementary Table S1) and seabird observers, staff and volunteers that collected Sulid observations from SEFI, the CA, OR, and WA Bird Records Committee, and eBird reviewers. We also sincerely thank the Farallon Institute staff for the substantial data contribution from the California Cooperative Oceanic Fisheries Instigations. We extend much appreciation to the millions of birdwatching community scientists whose contributions to eBird make studies like this possible. We also thank the Cornell Lab of Ornithology’s eBird team for creating and maintaining eBird, and for making this incredible dataset freely available online, along with coding tutorials.
Conflict of interest
The authors declare that the research was conducted in the absence of any commercial or financial relationships that could be construed as a potential conflict of interest.
Generative AI statement
The author(s) declare that no Generative AI was used in the creation of this manuscript.
Publisher’s note
All claims expressed in this article are solely those of the authors and do not necessarily represent those of their affiliated organizations, or those of the publisher, the editors and the reviewers. Any product that may be evaluated in this article, or claim that may be made by its manufacturer, is not guaranteed or endorsed by the publisher.
Supplementary material
The Supplementary Material for this article can be found online at: https://www.frontiersin.org/articles/10.3389/fmars.2025.1561438/full#supplementary-material
References
Acosta Alamo M., Manne L. L., Veit R. R. (2022). Does population size drive changes in transatlantic vagrancy for gulls? A study of seven north atlantic species. Front. Ecol. Evol. 10. doi: 10.3389/fevo.2022.850577
Aguirre-Muñoz A., Bedolla-Guzmán Y., Hernández-Montoya J., Latofski-Robles M., Luna-Mendoza L., Méndez-Sánchez F., et al. (2018). “The conservation and restoration of the mexican islands, a successful comprehensive and collaborative approach relevant for global biodiversity,” in Mexican natural resources management and biodiversity conservation: recent case studies. Ed. Ortega-Rubio A. (Springer International Publishing, Cham), 177–192.
Ainley D. G. (1976). The occurrence of seabirds in the coastal region of California. Western Birds 7, 33–68. Available online at: https://archive.westernfieldornithologists.org/archive/V07/7(2)-p0033-p0068.pdf.
Ainley D. G. (1980). Birds as marine organisms: A review. CalCOFI Rep. 21, 48–52. Available at: https://calcofi.org/downloads/publications/calcofireports/v21/Vol_21_Ainley.pdf.
Ainley D. G., Adams P. B., Jahncke J. (2015). California current system — predators and the preyscape. J. Mar. Syst. 146, 1–2. doi: 10.1016/j.jmarsys.2014.10.011
Akaike H. (1973). Maximum likelihood identification of gaussian autoregressive moving average models. Biometrika 60 (2), 255–265.
Albers S. (2023). Rsoi: Import various northern and southern hemisphere climate indices. R package version 0.5.5.
Albouy C., Velez L., Coll M., Colloca F., Le Loc’h F., Mouillot D., et al. (2014). From projected species distribution to food-web structure under climate change. Glob Change Biol. 20, 730–741. doi: 10.1111/gcb.12467
Alfonso S., Gesto M., Sadoul B. (2021). Temperature increase and its effects on fish stress physiology in the context of global warming. J. Fish Biol. 98, 1496–1508. doi: 10.1111/jfb.14599
Amaya D. J., Miller A. J., Xie S. P., Kosaka Y. (2020). Physical drivers of the summer 2019 North Pacific marine heatwave. Nat. Commun. 11, 1903. doi: 10.1038/s41467-020-15820-w
Arimitsu M. L., Piatt J. F., Hatch S., Suryan R. M., Batten S., Bishop M. A., et al. (2021). Heatwave-induced synchrony within forage fish portfolio disrupts energy flow to top pelagic predators. Glob. Change Biol. 27, 1859–1878. doi: 10.1111/gcb.15556
Bakun A. (1973). Coastal upwelling indices, West Coast of North America 1946-71. NOAA Tech. Rep. NMFS SSRF-671, 114. Available online at: https://repository.library.noaa.gov/view/noaa/9041.
Ballance L. T. (1995). Flight energetics of free-ranging red-footed boobies (Sula sula). Physiol. Zoology 68:5, 887–914. doi: 10.1086/physzool.68.5.30163937
Ballance L. T. (2007). Understanding seabirds at sea: why and how? Mar. Ornithology 35, 127–135. doi: 10.5038/2074-1235.35.2.743
Bartley T. J., McCann K. S., Bieg C., Cazelles K., Granados M., Guzzo M. M., et al. (2019). Food web rewiring in a changing world. Nat. Ecol. Evol. 3, 345–354. doi: 10.1038/s41559-018-0772-3
Bedolla-Guzmán Y., Méndez-Sánchez F., Aguirre-Muñoz A., Félix-Lizárraga M., Fabila-Blanco A., Bravo-Hernández E., et al. (2019). “Recovery and current status of seabirds on the Baja California Pacific Islands, Mexico, following restoration actions,” in Island invasives: scaling up to meet the challenge. Occasional Paper SSC no. 62. Eds. Veitch C. R., Clout M. N., Martin A. R., Russell J. C., West C. J. (IUCN;, Gland, Switzerland), 531–538.
Benson T. A., House D. J., McCaskie G., Rinkert A. M., Terrill R. S. (2022). The 46th annual report of the california bird records committee: 2020 records. W. Birds 53, 120–142. doi: 10.21199/WB53.2.2
Bond N. A., Cronin M. F., Freeland H., Mantua N. (2015). Causes and impacts of the 2014 warm anomaly in the NE Pacific. Geophys. Res. Lett. 42, 3414–3420. doi: 10.1002/2015GL063306
Briggs J. C., Bowen B. (2012). A realignment of marine biogeographic provinces with particular reference to fish distributions. J. Biogeography 39, 12–30. doi: 10.1111/j.1365-2699.2011.02613.x
Brodeur R. D., Auth T. D., Phillips A. J. (2019). Major shifts in pelagic micronekton and macrozooplankton community structure in an upwelling ecosystem related to an unprecedented marine heatwave. Front. Mar. Sci. 6. doi: 10.3389/fmars.2019.00212
Cavole L. M., Demko A. M., Diner R. E., Giddings A., Koester I., Pagniello C. M. L. S., et al. (2016). Biological impacts of the 2013–2015 warm-water anomaly in the Northeast Pacific: Winners, losers, and the future. Oceanography 29, 273–285. doi: 10.5670/oceanog.2016.32
Checkley D. M., Barth J. A. (2009). Patterns and processes in the california current system. Prog. Oceanography 83, 49–64. doi: 10.1016/j.pocean.2009.07.028
Chen L., Li T., Wang B., Wang L. (2017). Formation mechanism for 2015/16 super El Niño. Sci. Rep. 7, 2975. doi: 10.1038/s41598-017-02926-3
Chen Z., Shi J., Liu Q., Chen H., Li C. (2021). A persistent and intense marine heatwave in the Northeast Pacific during 2019–2020. Geophysical Res. Lett. 48, e2021GL093239. doi: 10.1029/2021GL093239
Chuang A., Peterson C. R. (2016). Expanding population edges: theories, traits, and trade-offs. Global Change Biol. 22, 494–512. doi: 10.1111/gcb.2016.22.issue-2
Clary B. L. (1930). Blue-footed booby on salton sea. Condor 32, 160–161. Available online at: https://digitalcommons.usf.edu/condor/vol32/iss3/13
Clobert J., Le Galliard J. F., Cote J., Meylan S., Massot M. (2009). Informed dispersal, heterogeneity in animal dispersal syndromes and the dynamics of spatially structured populations. Ecol. Lett. 12, 197–209. doi: 10.1111/j.1461-0248.2008.01267.x
Conrad C. C., Hilchey K. G. (2011). A review of citizen science and community-based environmental monitoring: issues and opportunities. Environ. Monit. Assess. 176, 273–291. doi: 10.1007/s10661-010-1582-5
Core Team R. (2020). R: A language and environment for statistical computing (Vienna, Austria: R Foundation for Statistical Computing). Available at: https://www.R-project.org/.
Díaz J. A. H., Gómez E. N. S. (2020). “Blue-footed Booby (Sula nebouxii), version 1.0,” in Birds of the world. Ed. Schulenberg T. S. (Cornell Lab of Ornithology, Ithaca, NY, USA).
Di Lorenzo E., Mantua N. (2016). Multi-year persistence of the 2014/15 North Pacific marine heatwave. Nat. Clim Change 6, 1042–1047. doi: 10.1038/nclimate3082
Fan Y., van den Dool H. (2008). A global monthly land surface air temperature analysis for 1948-present. J. Geophys. Res. 113, D01103. doi: 10.1029/2007JD008470
Fauchald P. (2009). Spatial interaction between seabirds and prey: review and synthesis. Mar. Ecol. Prog. Ser. 391, 139–151. doi: 10.3354/meps07818
Foster G. L., Lear C. H., Rae J. W. (2012). The evolution of pCO2, ice volume and climate during the middle Miocene. Earth Planetary Sci. Lett. 341, 243–254. doi: 10.1016/j.epsl.2012.06.007
Fumo J. T., Carter M. L., Flick R. E., Rasmussen L. L., Rudnick D. L., Iacobellis S. F. (2020). Contextualizing marine heatwaves in the Southern California bight under anthropogenic climate change. J. Geophysical Research: Oceans 125, e2019JC015674. doi: 10.1029/2019JC015674
Gallo N. D., Drenkard E., Thompson A. R., Weber E. D., Wilson-Vandenberg D., McClatchie S., et al. (2019). Bridging from monitoring to solutions-based thinking: lessons from calCOFI for understanding and adapting to marine climate change impacts. Front. Mar. Sci. 6. doi: 10.3389/fmars.2019.00695
Gentemann C. L., Fewings M. R., García-Reyes M. (2017). Satellite sea surface temperatures along the West Coast of the United States during the 2014–2016 northeast Pacific marine heat wave. Geophys. Res. Lett. 44, 312–319. doi: 10.1002/2016GL071039
Hamilton R. A., Patten M. A., Erickson R. A. (2007). Rare birds of california: A work of the california bird records committee (California: Western Field Ornithologists. Camarillo).
Hayward T. L., Vennck E. E. (1998). Near-surface pattern in the California Current: coupling between physical and biological structure. Deep-sea Res. 45, 1617–1638. doi: 10.1016/S0967-0645(98)80010-6
Hendershott M. C., Winant C. D. (1996). Surface circulation in the santa barbara channel. Oceanography 9, 114–121. doi: 10.5670/oceanog.1996.14
Henkel L. A., Ford R. G., Tyler W. B., Davis J. N. (2007). Comparison of aerial and boat-based survey methods for Marbled Murrelets Brachyramphus marmoratus and other marine birds. Mar. Ornithology 35, 145–151. Available online at: https://digitalcommons.usf.edu/marine_ornithology/vol35/iss2/9.
Hobday A. J., Alexander L. V., Perkins S. E., Smale D. A., Straub S. C., Oliver E. C. J., et al. (2016). A hierarchical approach to defining marine heatwaves. Prog. Oceanography 141, 227–238. doi: 10.1016/j.pocean.2015.12.014
Hobday A. J., Oliver E. C. J., Sen Gupta A., Benthuysen J. A., Burrows M. T., Donat M. G., et al. (2018). Categorizing and naming marine heatwaves. Oceanography 31, 162–173. doi: 10.5670/oceanog.2018.205
Holbourn A., Kuhnt W., Lyle M., Schneider L., Romero O., Andersen N. (2014). Middle Miocene climate cooling linked to intensification of eastern equatorial Pacific upwelling. Geology 42, 19–22. doi: 10.1130/G34890.1
Horn M. H., Allen L. G. (1978). A distributional analysis of california coastal marine fishes. J. Biogeography 5, 23–42. doi: 10.2307/3038105
Horns J. J., Adler F. R., Şekercioğlu C. H. (2018). Using opportunistic citizen science data to estimate avian population trends. Biol. Conserv. 221, 151–159. doi: 10.1016/j.biocon.2018.02.027
Howard J. A., DuVall A. J., Pereksta D. M., Mazurkiewicz D. M., Searcy A. J., Capitolo P. J., et al. (2024). Northern breeding range expansion of two Sula species at Sutil Island, California, USA. Western North Am. Nat. 84, 356–365. doi: 10.3398/064.084.0305
Howell S. N. G., Pyle P. (1997). Twentieth report of the California Bird Records Committee: 1994 records. W. Birds 28, 117–141. Available online at: https://www.birdpop.org/docs/pubs/Howell_and_Pyle_1997_Twentieth_Report_of_the_CA_Bird_Records_Committee.pdf.
Huber H. R., Lewis T. J. (1980). First records of the Red-footed Booby in the western United States. W. Birds 11, 199–200. Available online at: https://archive.westernfieldornithologists.org/archive/V11/11(4)-p0199-p0200.pdf.
Hunt G. L. Jr, Pitman R. L., Jones H. A. (1980). “Distribution and abundance of seabirds breeding on the California Channel Islands,” in The California Channel Islands: Proceedings of a multidisciplinary symposium. Ed. Power D. M.(Santa Barbara, CA: National Park Service).
Hyrenbach K. D., Veit R. R. (2003). Ocean warming and seabird communities of the southern California Current System 1987–98): response at multiple temporal scales. Deep-Sea Res. II 50, 2537–2565. doi: 10.1016/S0967-0645(03)00123-1
Jacox M. G., Alexander M. A., Bograd S. J., Scott J. D. (2020). Thermal displacement by marine heatwaves. Nature 584, 82–86. doi: 10.1038/s41586-020-2534-z
Johnston R., Jones K., Manley D. (2018). Confounding and collinearity in regression analysis: a cautionary tale and an alternative procedure, illustrated by studies of British voting behaviour. Qual Quant 52, 1957–1976. doi: 10.1007/s11135-017-0584-6
Jones T., Parrish J. K., Peterson W. T., Bjorkstedt E. P., Bond N. A., Ballance L. T., et al. (2018). Massive mortality of a planktivorous seabird in response to a marine heatwave. Geophysical Res. Lett. 45, 3193–3202. doi: 10.1002/2017GL076164
Karnauskas K. B., Zhang L., Amaya D. J. (2021). The atmospheric response to North Atlantic SST trends 1870–2019. Geophysical Res. Lett. 48, e2020GL090677. doi: 10.1029/2020GL090677
Kloess P. A., Parham J. F. (2017). A specimen-based approach to reconstructing the late Neogene seabird communities of California. Palaeogeography Palaeoclimatology Palaeoecol. 468, 473–484. doi: 10.1016/j.palaeo.2016.12.042
Knorr G., Lohmann G. (2014). Climate warming during antarctic ice sheet expansion at the middle miocene transition. Nat. Geosci. 7 (5), 376–381.
Laufkötter C., Zscheischler J., Frölicher T. L. (2020). High-impact marine heatwaves attributabl e to human-induced global warming. Science 369, 1621–1625. doi: 10.1126/science.aba0690
Leirness J. B., Adams J., Ballance L. T., Coyne M., Felis J. J., Joyce T., et al. (2021). Modeling at-sea density of marine birds to support renewable energy planning on the pacific outer continental shelf of the contiguous United States. US Dept. Int. Bur. Ocean Energy Manage (Camarillo (CA) 2021-014, 385. Available online at: https://pubs.usgs.gov/publication/70228321.
Leising A. W., Schroeder I. D., Bograd S. J., Abell J., Durazo R., Gaxiola-Castro G., et al. (2015). State of the California Current 2014–15: Impacts of the warm water “Blob”. Cal. Coop. Fish. Invest. Rep. 56, 31–68. Available online at: https://swfsc-publications.fisheries.noaa.gov/publications/CR/2015/2015Leising.pdf.
Lerma M., Serratosa J., Luna-Jorquera G., Garthe S. (2020). Foraging ecology of masked boobies (Sula dactylatra) in the world’s largest “oceanic desert”. Mar. Biol. 167, 87. doi: 10.1007/s00227-020-03700-2
Lewis D. B., Tyler W. B. (1978). First record of the Blue-faced Booby from the Pacific coast of the United States. W. Birds 9, 175–176. Available online at: https://archive.westernfieldornithologists.org/archive/V09/9(4)-p0175-p0176.pdf.
Lonhart S. I., Jeppesen R., Beas-Luna R., Crooks J. A., Lorda J. (2019). Shifts in the distribution and abundance of coastal marine species along the eastern Pacific Ocean during marine heatwaves from 2013 to 2018. Mar. Biodivers Rec 12, 13. doi: 10.1186/s41200-019-0171-8
Mason J. W., McChesney G. J., McIver W. R., Carter H. R., Takekawa J. Y., Golightly R. T., et al. (2007). At-sea distribution and abundance of seabirds off southern California: a 20-Year comparison. Cooper Ornithological Society Stud. Avian Biol. 33, 1–101. doi: 10.1525/auk.2009.41009.2
McCaskie G. (1970). The occurrence of four species of Pelecaniformes in the southwestern United States. Calif. Birds 1, 117–142. Available online at: https://archive.westernfieldornithologists.org/archive/V01/1(4)-p0117-p0142.pdf.
Mcclatchie S., Goericke R., Leising A., Auth T. D., Bjorkstedt E., Robertson R. R., et al. (2016). State of the california current 2015-16: comparisons with the 1997-98 el niño. https://escholarship.org/uc/item/730558jh.
McGowan J. A., Cayan D. R., Dorman L. M. (1998). Climate-ocean variability and ecosystem response in the northeast pacific. Science 281 (5374), 210–217.
McMurry F. B. (1948). Brewster’s booby collected in the United States. . Auk 65, 309–310. doi: 10.2307/4080331
Mellink E., Domínguez J., Luévano J. (2000). Diet of Eastern Pacific brown boobies Sula leucogaster brewsteri on Isla San Jorge, North-eastern Gulf of California, and an April comparison with diets in the middle Gulf of California. Mar. Ornithology 29, 23–28. doi: 10.5038/2074-1235.29.1.487
Mendez L., Borsa P., Cruz S., de Grissac S., Hennicke J. C., Lallemand J., et al. (2017a). B. Geographical variation in the foraging behaviour of the pantropical red-footed booby. Mar. Ecol. Prog. Ser. 568, 217–230. doi: 10.3354/meps12052ff.ffhal-01499294f\
Mendez L., Prudor A., Weimerskirch H. (2017b). A. Ontogeny of foraging behaviour in juvenile red-footed boobies (Sula sula). Sci. Rep. 7, 13886. doi: 10.1038/s41598-017-14478-7
Méndez Sánchez F., Bedolla Guzmán Y., Rojas Mayoral E., Aguirre-Muñoz A., Koleff P., Aguilar Vargas A., et al. (2022). Population trends of seabirds in Mexican Islands at the California Current System. PloS One 17, e0258632. doi: 10.1371/journal.pone.0258632
Mysak L. A. (1986). El Niño interannual variability and fisheries in the Northeast Pacific Ocean. Can. J. Fisheries Aquat. Sci. 43, 464–497. doi: 10.1139/f86-057
Nelson J. B. (1969). The breeding ecology of the red-footed booby in the galapagos. J. Anim. Ecol. 38, 181–198. doi: 10.2307/2745
NOAA (2023). Cold and warm episodes by season. Available online at: https://www.climate.gov/news-features/understanding-climate/climate-variability-oceanic-ni%C3%B1o-index. (Accessed April 2, 2023).
Oedekoven C. S., Ainley D. G., Spear L. B. (2001). Variable responses of seabirds to change in marine climate: California Current 1985-1994. Mar. Ecol. Prog. Ser. 212, 265–281. doi: 10.3354/meps212265
Oliver E. C. (2019). Mean warming not variability drives marine heatwave trends. Climate Dynamics 53 (3), 1653–1659.
Oliver E. C. J., Donat M. G., Burrows M. T., Moore P. J., Smale D. A., Alexander L. V., et al. (2018). Longer and more frequent marine heatwaves over the past century. Nat. Commun. 9, 1324. doi: 10.1038/s41467-018-03732-9
Osborne O., O’Hara P., Whelan S., Zandbergen P. A., Hatch S. A., Elliott K. H. (2020). Breeding seabirds increase foraging range in response to an extreme marine heatwave. Mar. Ecol. Prog. Ser. 646, 161–173. doi: 10.3354/meps13392
Pebesma E. (2018). Simple features for R: standardized support for spatial vector data. R J. 10, 439–446. doi: 10.32614/RJ-2018-009
Petalas C., Lazarus T., Lavoie R. A., Elliott K. H., Guigueno M. F. (2021). Foraging niche partitioning in sympatric seabird populations. Sci. Rep. 11 (1), 2493. doi: 10.1038/s41598-021-81583-z
Petalas C., van Oordt F., Lavoie R. A., Elliott K. H. (2024). A review of niche segregation across sympatric breeding seabird assemblages. Ibis. doi: 10.1111/ibi.13310
Piatt J. F., Parrish J. K., Renner H. M., Schoen S. K., Jones T. T., Arimitsu M. L., et al. (2020). Extreme mortality and reproductive failure of common murres resulting from the northeast pacific marine heatwave of 2014-2016. PloS One 15 (1), e0226087. doi: 10.1371/journal.pone.0226087
Pinsky M. L., Selden R. L., Kitchel Z. J. (2020). Climate-driven shifts in marine species ranges: scaling from organisms to communities. Ann. Rev. Mar. Sci. 12, 153–179. doi: 10.1146/annurev-marine-010419-010916
Pinsky M. L., Worm B., Fogarty M. J., Sarmiento J. L., Levin. S. A. (2013). Marine taxa track local climate velocities. Science 341, 1239–1242. doi: 10.1126/science.1239352
Pitman R. L., Ballance L. T. (2002). The Changing Status of Marine Birds Breeding at San Benedicto Island, Mexico. Wilson Bull. 114, 11–19. Available at: http://www.jstor.org/stable/4164413.
Pitman R. L., Jehl J. R. Jr. (1998). Geographic variation and reassessment of species limits in the “Masked” Boobies of the eastern Pacific Ocean. Wilson Bull. 110, 155–170. Available online at: https://sora.unm.edu/sites/default/files/journals/wilson/v110n02/p0155-p0170.pdf.
Pitz K. J., Guo J., Johnson S. B., Campbell T. L., Zhang H., Vrijenhoek R. C., et al. (2020). Zooplankton biogeographic boundaries in the California Current System as determined from metabarcoding. PloS One 15, e0235159. doi: 10.1371/journal.pone.0235159.0.1126/sciadv.1400210
Pyle P. (2020). Molt, age, and identification of the masked and Nazca boobies in California. Western Birds 51, 129–149. doi: 10.21199/WB51.2.6
Ramírez-Garofalo J. R. (2019). A brown booby (Sula Leucogaster) in New York City during a region-wide influx. Kingbird. 69, 22–26. Available online at: https://nybirds.org/KB_IssuesArchive/y2019v69n1.pdf.
Rasmussen L. L., Carter M. L., Flick R. E., Hilbern M., Fumo J. T., Cornuelle B. D., et al. (2020). A century of Southern California coastal ocean temperature measurements. J. Geophysical Research: Oceans 125, e2019JC015673. doi: 10.1029/2019JC015673
Rayner N. A., Parker D. E., Horton E. B., Folland C. K., Alexander L. V., Rowell D. P., et al. (2003). Global analyses of sea surface temperature, sea ice, and night marine air temperature since the late nineteenth century. J. Geophys. Res. (Atmospheres) 108, 2–1. doi: 10.1029/2002JD002670
Robinson C. J. (2016). Evolution of the 2014–2015 sea surface temperature warming in the central west coast of Baja California, Mexico, recorded by remote sensing. Geophys. Res. Lett. 43, 7066–7071. doi: 10.1002/2016GL069356
Robinson O. J., Ruiz-Gutierrez V., Fink D., Meese R. J., Holyoak M., Cooch E. G. (2018). Using citizen science data in integrated population models to inform conservation. Biol. Conserv. 227, 361–368.
Rottenborn S. C., McCaskie G., Daniels B. E., Garrett J. (2016). The 39th annual report of the california bird records committee: 2013 records. Western Birds 47, 2–26.
Russell T. M., Szesciorka A. R., Joyce T. W., Ainley D. G., Balance L. T. (2023). National Marine Sanctuaries capture enhanced abundance and diversity of the California Current Ecosystem avifauna. J. Mar. Syst. 240, 103887. doi: 10.1016/j.jmarsys.2023.103887
Sagarin R., Barry J., Gilman S., Baxter C. (1999). Climate-related change in an intertidal community over short and long time scales. Ecol. Monogr. 69, 465–490. doi: 10.1890/0012-9615(1999)069[0465:CRCIAI]2.0.CO;2
Scannell H. A., Johnson G. C., Thompson L., Lyman J. M., Riser S. C. (2020). Subsurface evolution and persistence of marine heatwaves in the Northeast Pacific. Geophysical Res. Lett. 47, e2020GL090548. doi: 10.1029/2020GL090548
Schindler A. R., Cunningham S. A., Schafer T. L., Sinnott E. A., Clements S. J., DiDonato F. M., et al. (2022). Joint analysis of structured and semi-structured community science data improves precision of relative abundance but not trends in birds. Sci. Rep. 12, 20289. doi: 10.1038/s41598-022-23603-0
Schipper A. M., Belmaker J., de Miranda M. D., Navarro L. M., B¨ohning-Gaese K., Costello M. J., et al. (2016). Contrasting changes in the abundance and diversity of north American bird assemblages from 1971 to 2010. Glob. Change Biol. 22, 3948–3959. doi: 10.1111/gcb.13292
Schreiber E. A., Norton R. L. (2020). “Brown Booby (Sula leucogaster), version 1.0,” in Birds of the world. Ed. Billerman S. M. (Cornell Lab of Ornithology, Ithaca, NY, USA).
Sommerfeld J., Kato A., Ropert-Coudert Y., Garthe S., Wilcox C., Hindell M. A. (2015). Flexible foraging behaviour in a marine predator, the Masked booby (Sula dactylatra), according to foraging locations and environmental conditions. J. Exp. Mar. Biol. Ecol. 463, 79–86. doi: 10.1016/j.jembe.2014.11.005
Spatz D. R., Jones H. P., Bonnaud E., Kappes P., Holmes N. D., Bedolla Guzmán Y. (2023). “Chapter 4 - Invasive species threats to seabirds,” in Conservation of marine birds. Eds. Young L., VanderWerf E. (London, England: Academic Press), 97–130. doi: 10.1016/B978-0-323-88539-3.00017-0
Stake M. M. (2012). Trends in vagrant capture rates at a coastal California banding station 1993-2010). Bird Populations 11, 14–21. Available online at: https://www.birdpop.org/docs/journals/Volume-11/BPJ11-08_Stake.pdf.
Strimas-Mackey M., Miller E., Hochachka W. (2017). auk: eBird Data Extraction and Processing with AWK. R package version 0.7.0. https://cornelllabofornithology.github.io/auk/.
Stucchi M., Varas-Malca R. M., Urbina-Schmitt M. (2015). New Miocene sulid birds from Peru and considerations on their Neogene fossil record in the Eastern Pacific Ocean. Acta Palaeontologica Polonica 61, 417–427. doi: 10.4202/app.00170.2015
Sullivan B. L., Aycrigg J. L., Barry J. H., Bonney R. E., Bruns N. E., Cooper C. B., et al. (2014). The eBird enterprise: An integrated approach to development and application of citizen science. Biol. Conserv. 169, 31–40. doi: 10.1016/j.biocon.2013.11.003
Sunday J., Bates A., Dulvy N. (2012). Thermal tolerance and the global redistribution of animals. Nat. Clim Change 2, 686–690. doi: 10.1038/nclimate1539
Suryan R. M., Arimitsu M. L., Coletti H. A., Hopcroft R. R., Lindeberg M. R., Barbeaux S. J., et al. (2021). Ecosystem response persists after a prolonged marine heatwave. Sci. Rep. 11, 6235. doi: 10.1038/s41598-021-83818-5
Sutherland K. R., Sorensen H. L., Blondheim O. N., Brodeur R. D., Galloway A. W. E. (2018). Range expansion of tropical pyrosomes in the northeast Pacific ocean. Ecology 99, 2397–2399. doi: 10.1002/ecy.2429
Sydeman W., Thompson S. A., Santora J. A., Koslow J. A., Goericke R., Ohman M. D. (2015). Climate-ecosystem change off southern California: Time-dependent seabird predator-prey numerical responses. Deep-sea Res. Part Ii-topical Stud. Oceanography 112, 158–170. doi: 10.1016/j.dsr2.2014.03.008
Sydeman W. J., Mills K., Santora J. A., Thompson S., Bertram D., Wells B., et al. (2009). Seabirds and climate in the California Current – A synthesis of change. California Cooperative Oceanic Fisheries Investigations Rep. 50, 82–104. Available online at: https://www.sfu.ca/biology2/wildberg/papers/sydemanetalCalCOFIRep09.pdf.
Tanaka K. R., Van Houtan K. S., Mailander E., Dias B. S., Galginaitis C., O’Sullivan J., et al. (2021). North Pacific warming shifts the juvenile range of a marine apex predator. Sci. Rep. 11, 3373. doi: 10.1038/s41598-021-82424-9
Tasker M. L., Jones P. H., Dixon T. I. M., Blake B. F. (1984). Counting seabirds at sea from ships: A review of methods employed and a suggestion for a standardized approach. Auk 101, 567–577. doi: 10.1093/auk/101.3.567
Taylor D. M., Desante D. F., Geupel G. R., Houghton K. (1994). Autumn populations of landbirds along central coastal California 1976-1986. J. Field Ornithology 65, 169–185. Available online at: https://www.birdpop.org/docs/pubs/Taylor_et_al_1994_Autumn_Populations_of_Landbirds_Along_Central_Coastal_CA.pdf.
Tekwa E. W., Watson J. R., Pinsky M. L. (2022). Body size and food–web interactions mediate species range shifts under warming. Proc. R. Soc B. 289 (1972), 28920212755. doi: 10.1098/rspb.2021.2755
Thayer J. A., Sydeman W. J. (2007). Spatio-temporal variability in prey harvest and reproductive ecology of a piscivorous seabird, Cerorhinca monocerata, in an upwelling system. Mar. Ecol. Prog. Ser. 329, 253–265. doi: 10.3354/meps329253
Tompkins E. M., Anderson D. J. (2021). Breeding responses to environmental variation are age- and trait-dependent in female Nazca boobies. Ecology. 102, e03457. doi: 10.1002/ecy.3457
Toochin R., Haviland L. (2016). Status and Occurrence of Elegant Tern (Thalasseus elegans) in British Columbia. Available online at: https://ibis.geog.ubc.ca/biodiversity/efauna/documents/Elegant_Tern-RT-LH.pdf (Accessed March 1, 2025).
Tweit B., Shaw R., Bartels M. (2022). Twelfth report of the washington bird records committe 2016–2018). Western Field Ornithologists. 53, 90–119. doi: 10.21199/WB53.2.1
Veit R. R. (2000). Vagrants as the expanding fringe of a growing population. Auk 117, 242–246. doi: 10.1093/auk/117.1.242
Veit R. R., Manne L. L., Zawadzki L. C., Alamo M. A., Henry R. W. III (2022). Vagrancy, exploratory behavior and colonization by birds: Escape from extinction? Front. Ecol. Evol. 10. doi: 10.3389/fevo.2022.960841
Veit R., McGowan J., Ainley D., Wahl T., Pyle P. (1997). Apex marine predator declines ninety percent in association with changing oceanic climate. Global Change Biol. 3, 23–28. doi: 10.1046/j.1365-2486.1997.d01-130.x
Veit R. R., Velarde E., Horn M. H., Manne L. L. (2021). Population growth and long-distance vagrancy leads to colonization of europe by elegant terns thalasseus elegans. Front. Ecol. Evol. 9. doi: 10.3389/fevo.2021.725614
Velarde E., Ezcurra E., Horn M. H., Patton R. T. (2015). Warm oceanographic anomalies and fishing pressure drive seabird nesting north. Sci. Adv. 1, e1400210. doi: 10.1126/sciadv.1400210
Venables W. N., Ripley B. D. (2002). Modern Applied Statistics with S, Fourth edition (New York: Springer).
von Biela V. R., Arimitsu M. L., Piatt J. F., Heflin B., Schoen S. K., Trowbridge J. L., et al. (2019). Extreme reduction in nutritional value of a key forage fish during the Pacific marine heatwave of 2014–2016. Mar. Ecol. Prog. Ser. 613, 171–182. doi: 10.3354/meps12891
Wakefield E. D., Phillips R. A., Matthiopoulos J. (2009). Quantifying habitat use and preferences of pelagic seabirds using individual movement data: a review. Mar. Ecol. Prog. Ser. 391, 165–182. doi: 10.3354/meps08203
Walker J., Taylor P. D. (2017). Using eBird data to model population change of migratory bird species. Avian Conserv. Ecol. 12, 4. doi: 10.5751/ACE-00960-120104
Warheit K. I. (1992). A review of the fossil seabirds from the tertiary of the north pacific: plate tectonics, paleoceanography, and faunal change. Paleobiology 18 (4), 401–424.
Weimerskirch H., Corre M. L., Jaquemet S., Marsac X. X. X. F. (2005). Foraging strategy of a tropical seabird, the red- footed booby, in a dynamic marine environment. Mar. Ecol. Prog. Ser. 288, 251–261. doi: 10.3354/meps288251
Weimerskirch W., Le Corre M., Bost C. A. (2008). Foraging strategy of masked boobies from the largest colony in the world: relationship to environmental conditions and fisheries. Mar. Ecol. Prog. Ser. 362, 291–302. doi: 10.3354/meps07424
Welch H., Savoca M. S., Brodie S., Jacox M. G., Muhling B. A., Clay T. A., et al. (2023). Impacts of marine heatwaves on top predator distributions are variable but predictable. Nat. Commun. 14, 5188. doi: 10.1038/s41467-023-40849-y
Wells B. K., Schroeder I. D., Bograd S. J., Hazen E. L., Jacox M. G., Leising A., et al. (2017). State of the California Current 2016-17: still anything but” normal” in the north. https://escholarship.org/uc/item/4ht150tf.
White L. D., Garrison R. E., Barron J. A. (1992). Miocene intensification of upwelling along the California margin as recorded in siliceous facies of the Monterey Formation and offshore DSDP sites. Geological Society London Special Publications 64, 429–442. doi: 10.1144/GSL.SP.1992.064.01.28
Whitworth D. L., Carter H. R., Koepke J. S. (2007). Colonization of the brown booby at the coronado islands, baja california, Mexico. Western Birds 38, 268–279. Available online at: https://archive.westernfieldornithologists.org/archive/V38/38(4)-p0268-p0279.pdf.
Wingfield J. C., Krause J. S., Perez J. H., Chmura H. E., Németh Z., Word K. R., et al. (2015). A mechanistic approach to understanding range shifts in a changing world: What makes a pioneer? Gen. Comp. Endocrinol. 222, 44–53. doi: 10.1016/j.ygcen.2015.08.022
Withgott J. (2021). Oregon bird records committee 2020 report. Oregon Birds 47, 49–55. Available online at: https://oregonbirding.org/wp-content/uploads/2024/01/2020_OBRC_Report_Withgott.pdf.
Woods S. (2017). Generalized additive models: an introduction with R, 2 edition (New York, NY USA: Chapman and Hall/CRC).
Zavalaga C. B., Benvenuti S., Dall’Antonia L., Emslie. S. D. (2008). Foraging areas of breeding blue-footed boobies Sula nebouxii in northern Peru, as determined by direction recorders. J. Avian Biol. 39, 405–412. doi: 10.1111/j.0908-8857.2008.04275.x
Zawadzki L. C., Hallgrimsson G. T., Veit R. R., Rasmussen L. M., Boertmann D., Gillies N., et al. (2021). Predicting source populations of vagrants using breeding population data: A case study of the lesser black-backed gull (Larus fuscus). Front. Ecol. Evol. 9. doi: 10.3389/fevo.2021.637452
Zawadzki L. C., Veit R. R., Manne L. L. (2019). The influence of population growth and wind on vagrancy in a North American passerine. Ardea 107, 131–147. doi: 10.5253/arde.v107i2.a2
Keywords: climate change, range expansions, California Current Ecosystem, marine heatwaves, seabirds, sulidae
Citation: Russell TM, Pereksta DM, Tietz JR, Vernet M, Jahncke J and Ballance LT (2025) Increase of tropical seabirds (Sula) in the California Current Ecosystem with warmer ocean conditions. Front. Mar. Sci. 12:1561438. doi: 10.3389/fmars.2025.1561438
Received: 15 January 2025; Accepted: 26 March 2025;
Published: 28 April 2025.
Edited by:
K. David Hyrenbach, Hawaii Pacific University, United StatesReviewed by:
Richard Reed Veit, College of Staten Island, United StatesAlvaro Jaramillo, Oikonos Ecosystem Knowledge, United States
Copyright © 2025 Russell, Pereksta, Tietz, Vernet, Jahncke and Ballance. This is an open-access article distributed under the terms of the Creative Commons Attribution License (CC BY). The use, distribution or reproduction in other forums is permitted, provided the original author(s) and the copyright owner(s) are credited and that the original publication in this journal is cited, in accordance with accepted academic practice. No use, distribution or reproduction is permitted which does not comply with these terms.
*Correspondence: Tamara M. Russell, ZHJ0YW1teXJ1c3NlbGxAZ21haWwuY29t