 Chong Wang
 Xufeng Liu
 Ke Li2
 Chunzhu Wei
- 1School of Law, School of Geography and Planning, Southern Marine Science and Engineering Guangdong Laboratory (Zhuhai), Sun Yat-sen University, Guangzhou, China
- 2Faculty of Science, National University of Singapore, Singapore, Singapore
Fisheries are a critical source of animal protein for billions globally, yet the intensification of aquaculture has increased reliance on artificial inputs, raising concerns over associated carbon emissions. This study analyzes the spatial distribution and temporal trends of global seafood production, consumption, and related carbon emissions from 2015 to 2020, using the Eora26 and Food and Agriculture Biomass Input-Output (FABIO) multi-regional input-output databases. Special attention is given to the carbon footprint of fishmeal and fish oil across economic sectors. Findings reveal that Asia, particularly China, dominates global seafood production, accounting for 39.2% of output and contributing significantly to spatial disparities in fisheries-related emissions. From 2015 to 2020, global seafood-related carbon emissions rose by 31.6%, with East Asia consistently ranking highest across domestic, consumption-based, and production-based emissions. South America increasingly serves as a major exporter, meeting rising global seafood demand. Fishmeal and fish oil are primarily consumed in the fisheries, cattle, pig, and dairy sectors. China is the largest recipient, while Norway, Peru, Chile, and the United States are key producers. The carbon footprint of these intermediate products exhibits scaling law characteristics, reflecting the complexity and transboundary nature of their supply chains. This study highlights the spatial and industrial intricacies of seafood-related carbon emissions and underscores the need for more targeted, sector-specific mitigation strategies. The findings also emphasize the importance of applying the principle of common but differentiated responsibilities to ensure equitable carbon reduction across regions within the global fisheries system.
1 Introduction
Aquaculture has become central to global food security as the demand for aquatic animal products continues to rise. High-yield, nutritious, and environmentally friendly aquatic foods can create new opportunities for environmental protection (Gephart et al., 2021). Over the past six decades, global seafood consumption has increased nearly fivefold (FAO, 2022), with per capita intake growing by 3.0% annually. However, the growth of capture fisheries has plateaued since the 1990s (Boyd et al., 2022), positioning aquaculture as the primary engine of seafood supply expansion. In 2022, aquaculture production of animal-based seafood surpassed that of capture fisheries for the first time (FAO, 2024). Despite its rapid average annual growth rate of 5.3% (Ahmad et al., 2021), aquaculture still faces challenges in meeting rising and diversifying consumer demand. Approximately 89% of aquatic animal production is consumed directly, while the remainder is converted into fishmeal and fish oil—critical inputs that have historically comprised over 90% of aquafeed formulations (Glencross et al., 2011; Auchterlonie, 2016).
As aquaculture expands to meet rising demand, its environmental impact has become a global concern. Greenhouse gas (GHG) emissions are a key aspect of this impact (Dong et al., 2022; Halpern et al., 2022), Especially for some major countries that consume a lot of aquatic products (Xu et al., 2023). Forecasts suggest that by 2030, aquaculture will account for nearly two-thirds of fish consumed globally (Naylor et al., 2021). While aquatic products are generally seen as more carbon-efficient than land-based proteins due to shorter food chains and higher feed conversion efficiency (Parker et al., 2018; Bianchi et al., 2022), these evaluations often omit emissions embedded in upstream and downstream processes such as feed production, processing, and transboundary trade. With aquaculture’s supply chains becoming increasingly complex and globalized, indirect emissions are growing in significance but remain insufficiently accounted for in current assessments—presenting a key gap in sustainability research and climate policy.
Among aquaculture’s emission sources, fishmeal and fish oil represent the most carbon-intensive and least understood components. Earlier studies on seafood-related greenhouse gas emissions focused mainly on capture fisheries. These studies examined factors such as fuel consumption, fishing gear, and emissions-related policies. In contrast, aquaculture involves a wider range of emission sources (Abernethy et al., 2010; Avadí and Fréon, 2013; Parker et al., 2015). These include feed production (particularly fishmeal and fish oil), oxygenation systems, on-farm energy consumption, processing, and long-distance transportation (Eroldoğan et al., 2023). Recent estimates suggest that aquaculture contributes approximately 0.49% of global GHG emissions, with feed production alone accounting for 39%, and feed production plus transport comprising up to 57% (Gokulakrishnan et al., 2023). When upstream and downstream feed-related emissions are included, they can represent as much as 90% of aquaculture’s total carbon footprint (Hammer et al., 2022). These figures underscore the urgent need for more granular and comprehensive assessments of the feed supply chain, particularly fishmeal and fish oil.
Fishmeal and fish oil also serve as critical links between aquaculture and other food sectors, but their cross-sectoral carbon impacts remain underexplored. These marine-based inputs are not limited to aquaculture; they are also widely used in pig and poultry production, improving feed efficiency and animal health (Chia et al., 2019). For example, China is projected to remain the largest global importer of fishmeal through 2030. Approximately 35 percent of its imported fishmeal is used for livestock feed (Qian et al., 2024). Despite rising costs and the emergence of plant- and insect-based alternatives, fishmeal and fish oil maintain a stronghold due to their nutritional and economic value. Yet their dual-sector usage means emissions are distributed across both aquaculture and livestock sectors. Failing to account for these shared emissions obscures the true environmental cost of marine-based feeds, hindering the development of effective, cross-sectoral mitigation strategies (Wei et al., 2023; Moungsree et al., 2024).
Existing carbon footprint assessment tools are insufficient for capturing the full scope of aquaculture’s intersectoral and international environmental impacts. Life Cycle Assessment (LCA), while commonly used, is limited by its site-specific focus and inability to model global supply chains or traded emissions (Vázquez-Rowe et al., 2012; Ruiz-Salmón et al., 2021). In contrast, multi-regional input-output (MRIO) models offer a system-wide perspective, tracing carbon and resource flows across countries and sectors. MRIO methods have been widely applied to studies of water use (Sturla et al., 2023), land use (Wilting et al., 2017), and carbon emissions (Long et al., 2020; Sun et al., 2020), but have yet to be systematically applied to the aquaculture sector. This methodological gap limits our understanding of how aquaculture’s environmental footprint interacts with global trade and with other sectors such as agriculture and livestock production.
Moreover, the assessment of aquaculture’s emissions must consider equity through the lens of the Common But Differentiated Responsibilities (CBDR) principle. Codified in the United Nations Framework Convention on Climate Change (UNFCCC), Kyoto Protocol, and Paris Agreement, the CBDR principle recognizes that while all countries are responsible for climate mitigation, obligations should differ based on historical emissions and development capacity (Rajamani, 2016; Ebbesson and Hey, 2022). This principle is particularly relevant for aquaculture, which is a critical food and income source for many low- and middle-income countries. Ignoring distributional equity risks imposing disproportionate mitigation burdens on nations that are least equipped to bear them.
To address these critical gaps, this study applies a global MRIO approach to estimate the carbon footprint of aquaculture, with a specific focus on fishmeal and fish oil across sectors and regions. Using the Eora26 and Food and Agriculture Biomass Input-Output (FABIO) multiregional input-output databases, this study tracks carbon flows across 20 aggregated world regions and 190 countries. It identifies carbon hotspots embedded in aquafeed supply chains and analyzes interdependencies between aquaculture, livestock, and agriculture. In doing so, it aims to provide a more complete understanding of aquaculture’s environmental footprint and inform more equitable and targeted mitigation strategies.
The core research questions addressed are:
1. How can input-output models be used to systematically quantify and analyze the carbon emission characteristics of the aquaculture sector in global supply chains and trade regions?
2. How can material flow relationships and potential carbon footprints between aquaculture and other agricultural sectors (e.g., fisheries, livestock, and arable land) be characterized through the lens of fishmeal and fish oil?
3. How can carbon emission responsibilities be allocated across regions and sectors under the framework of the CBDR principle, using empirical data?
By integrating MRIO analysis with a focus on fishmeal and fish oil, this study contributes a new perspective on aquaculture’s environmental externalities. It also offers a pathway for cross-sectoral mitigation strategies, carbon accounting, and policy recommendations aimed at achieving a sustainable, equitable future for aquatic food systems.
2 Research data and methods
2.1 Study area
This study adopts the Food and Agriculture Organization (FAO)’s regional classification framework to define the spatial scope of analysis. A total of over 190 countries and regions were aggregated into 20 standardized FAO regions, of which 19 were used in this study after excluding one unidentifiable entity (Figure 1A). These regions provides a consistent spatial basis for analyzing seafood production, trade flows, and carbon emissions across different parts of the world. To support regional-level analysis, all countries were assigned to their corresponding FAO region according to the latest official mapping. This ensures that data aggregation and comparison are spatially consistent.
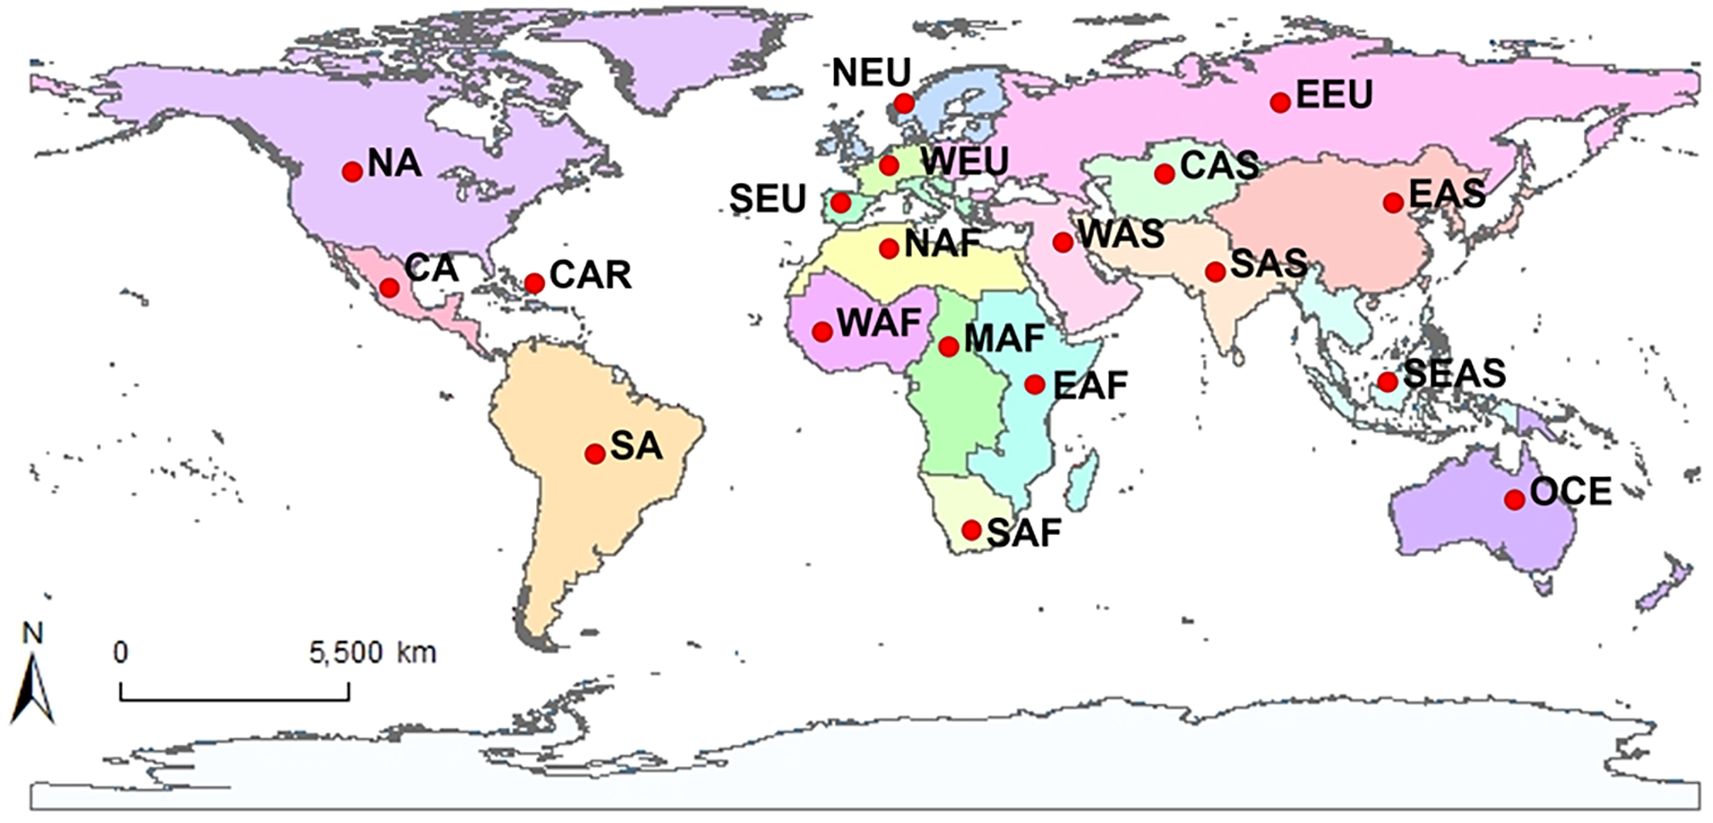
Figure 1. Geographical regions based on FAO classification (19 regions).
2.2 Dataset
The study uses two databases, Eora26 and FABIO, as the primary data sources for carbon footprint measurement, with a time range from 2015 to 2020. Additionally, population data from 2015 to 2020 was used to measure per capita carbon footprints. The population data is sourced from FABIO.
Eora26 covers 190 countries and 26 economic sectors globally from 1990 to 2022, making it highly effective for cross-country and regional analysis. Currently, Eora26 is widely used in carbon footprint analysis, supply chain research, and environmental policy modeling. The Eora Environmental Satellite Account includes multiple greenhouse gas emission data sources, such as EDGAR, CDIAC, and PRIMAPHIST. PRIMAPHIST actually includes EDGAR and CDIAC data, which are interpolated and smoothed as needed. National-level reports are given the highest priority and are widely accepted in climate convention negotiations. Therefore, this study uses the PRIMAPHISTv2.4 Total emission attribute from Eora26 as the data field for carbon emissions.
The FABIO provides a multi-regional input-output table covering global agriculture and forestry, spanning 191 countries and regions, 121 production processes, and 130 products, with a time range from 1986 to 2013. FABIO collects base data from sources such as FAOSTAT, IEA, EIA, Comtrade and BACI. It then generates CBS, BTD, and Prices tables through data organization, blank filling, and integration. These data are subsequently used to construct Supply and Use Tables, Multi-Supply and Use Tables, and MRIO, enabling comprehensive analysis of global material flows.
3 Research method
The Eora26 and FABIO models are both MRIO databases, but they differ in scope, sectoral detail, and focus, affecting their utility in aquaculture-related carbon footprint analysis. Eora26 aggregates the global economy into 26 sectors across 190 countries, offering broad coverage of economic activities and environmental extensions such as CO2 emissions and energy use (Lenzen et al., 2012, 2013). Its major strength lies in enabling global-scale analysis of embodied carbon flows and trade-related emissions. However, its coarse sectoral resolution limits the ability to isolate aquaculture-specific processes like fishmeal and fish oil production, as these are grouped within broad categories like agriculture or food manufacturing.
By contrast, FABIO is tailored to the agri-food system, offering high sectoral granularity across more than 130 food and biomass commodities, including fishmeal and fish oil, in 192 countries (Bruckner et al., 2019; Zhang et al., 2025). This makes FABIO particularly suitable for tracing material flows and analyzing the interconnections between aquaculture, livestock, and agriculture. Its fine-grained sectoral detail is ideal for examining upstream feed inputs and cross-sectoral interactions. However, FABIO lacks monetary flow data and has more limited environmental indicators (e.g., no energy or non-GHG emissions), reducing its capacity for full-scale economic carbon attribution or life-cycle assessments.
In this study, the complementary strengths of both models are leveraged. Eora26 is used to trace global GHG emissions and trade-related carbon footprints, while FABIO provides detailed insights into material flows, especially for fishmeal and fish oil across sectors. Together, they offer a more comprehensive framework: Eora26 enables macro-level emission accounting across regions, and FABIO captures the nuanced sectoral dynamics critical to understanding aquaculture’s indirect environmental impacts.
3.1 Carbon consumption footprint and carbon production footprint measurement based on the Eora26 input-output table
This study firstly adopts a MRIO approach using the Eora26 database to assess carbon emissions from the fisheries sector across 20 global regions. The methodology includes data extraction, emission classification, time-series analysis, carbon flow mapping, and responsibility allocation. Fisheries-related input-output data, trade flows, and carbon extensions are first extracted and standardized to ensure regional and temporal consistency. Carbon emissions are then categorized into domestic emissions (DOS), consumption-based emissions (CBA) (Equation 1), and production-based emissions (PBA) (Equation 2). DOS focuses on emissions arising from a country’s own resource use and production activities, whether for domestic use or export. It highlights the internal environmental burden of national supply chains. CBA attributes carbon emissions to the final consumers of goods and services, regardless of where the emissions occur. It includes emissions embodied in imports and excludes those in exports, offering a demand-side view of environmental impact:
where is the final demand of region i, is the intermediate input matrix between region i and j, and is the carbon intensity of region j.
Production-Based Emissions (PBA) assigns emissions to the country where production takes place, capturing emissions within national boundaries. It was to quantify emissions occurring in a region due to external demand and calculated as:
here is the final demand of region i, is the intermediate input matrix between region i and j, and is the carbon intensity of region j. In CBA, emissions are “imported” from production regions (e.g., Region j) into the consuming region (e.g., Region i). In PBA, emissions remain within the producing region i, regardless of where the goods are exported or consumed. Finally, we conduct long-term tracking of DOS, CBA and PBA emissions for fisheries sectors from 2015 to the most recent year, to analyze trends and identify regional disparities in emissions trajectories.
3.2 Potential carbon footprint of fish meal and fish oil based on the FABIO input-output table
Using the FABIO input-output database, this study further estimates the carbon footprint of fishmeal and fish oil across 20 global regions, focusing on both upstream and downstream linkages of the fisheries sector. Material flow data are combined with emission coefficients derived from different fisheries types (e.g., capture and aquaculture) based on Cashion et al. (2017).
As an upstream consumer, the fisheries sector depends on agricultural inputs for feed production. As a producer, it supplies fishmeal and fish oil to various downstream industries, including aquaculture and livestock sectors (e.g., pigs, poultry, cattle, and dairy), as detailed in Table 1 and illustrated in Figure 2. This analysis refines the sectoral carbon footprint by capturing the cross-sectoral and interregional flows embedded in fishmeal and fish oil production.
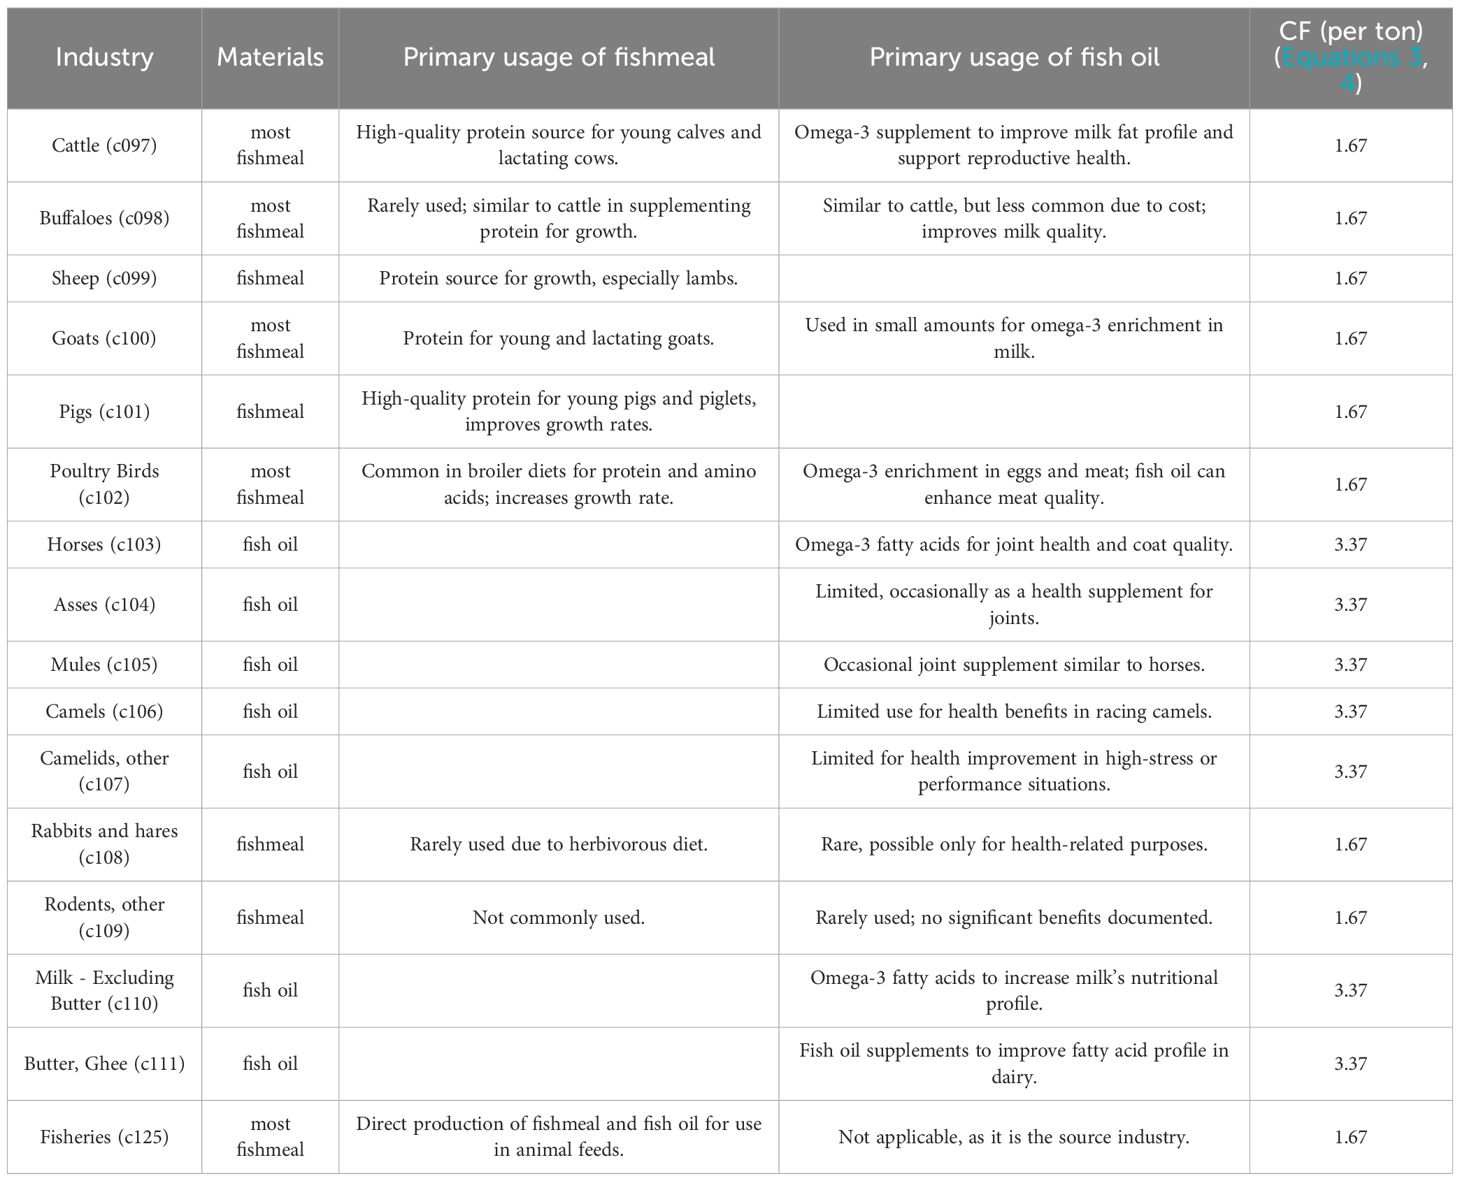
Table 1. Potential fisheries carbon footprint coefficients for fishmeal and fish oil utilization by various industry sectors in the FABIO dataset.
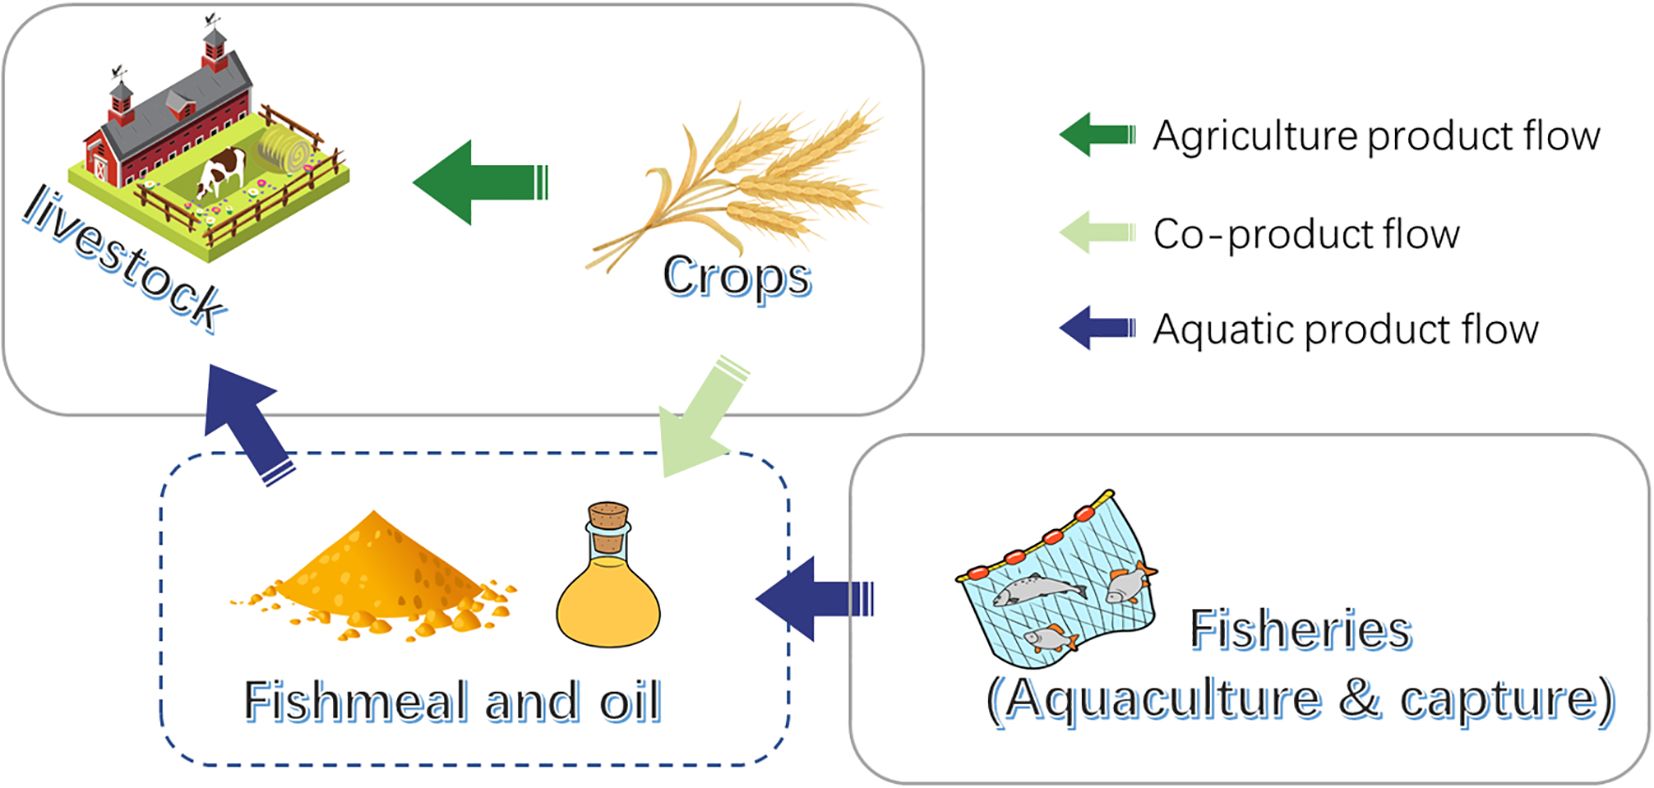
Figure 2. Potential carbon flow of fishmeal and fish oil across various sectors.
Upstream fisheries production influences downstream fisheries consumption sectors, highlighting the interdependence within the value chain. However, since the fisheries sector primarily operates as an upstream producer, its role as a downstream consumer is already integrated into the analysis and is not discussed separately. Therefore, a detailed analysis of material flows between the fisheries sector and other sectors reveals that fishmeal and fish oil are the primary fisheries products used in other industries:
1. Fishmeal: Used predominantly by sectors such as cattle, buffalo, sheep, goats, pigs, rabbits, poultry, birds, and fisheries.
2. Fish Oil: Composed primarily of fats (lipids) and containing essential vitamins A and D, fish oil is utilized to enhance dairy product quality (e.g., milk and butter) and to improve the fur conditions of animals like horses, mules, and donkeys.
Meanwhile, the emission factors provided by Cashion et al. (2017) can be integrated with the sectors to further calculate carbon footprints, which include:
1. Fishmeal: An average carbon footprint of 1.67 tons of CO2 per ton, ranging from 0.48 to 5.57 tons CO2 (as shown in Table 1).
2. Fish oil: An average carbon footprint of 3.37 tons of CO2 per ton, ranging from 0.70 to 11.92 tons CO2.
The carbon footprint for each sector is calculated using the following formula:
Where:
: Carbon footprint of sector s.
: Quantity of fishmeal used by s (tons).
: Quantity of fish oil used by s (tons).
: Carbon emission factor for fishmeal (1.67 tons CO2/ton).
: Emission factor for fish oil (3.37 tons CO2/ton).
Then the total carbon footprint is analyzed from production and consumption perspectives. In the production perspective, fisheries’ role as a supplier to downstream sectors is expressed as:
In the consumption perspective, fisheries’ role as a consumer of upstream products (e.g., agricultural feeds) is assessed to highlight the inputs required for fisheries production. Meanwhile, carbon emissions are attributed to individual sectors based on their primary use of fisheries products. If fishmeal dominates, the fishmeal emission factor is applied; if fish oil dominates, its respective emission factor is used. To account for variability, regional differences and production methods are considered using the emission factor ranges provided by Cashion et al. (2017). This comprehensive approach provides insights into the carbon emissions associated with fisheries, revealing their dual roles as both consumers and suppliers in global production networks.
4 Results
4.1 Basic situation of aquatic product production in different regions
Global aquatic product production shows clear spatial and temporal differences. These patterns are influenced by natural resource availability, production capacity, and consumption preferences. From 2015 to 2020 (Figure 3C), production was highly concentrated in Asia. East Asia and Southeast Asia emerged as major production centers. China was the largest producer, reaching 83.93 million tons in 2020. This accounted for 39.23 percent of global output. Other leading producers included Indonesia, India, Vietnam, and Peru. Several African countries, such as Nigeria and Egypt, also experienced rapid production growth.
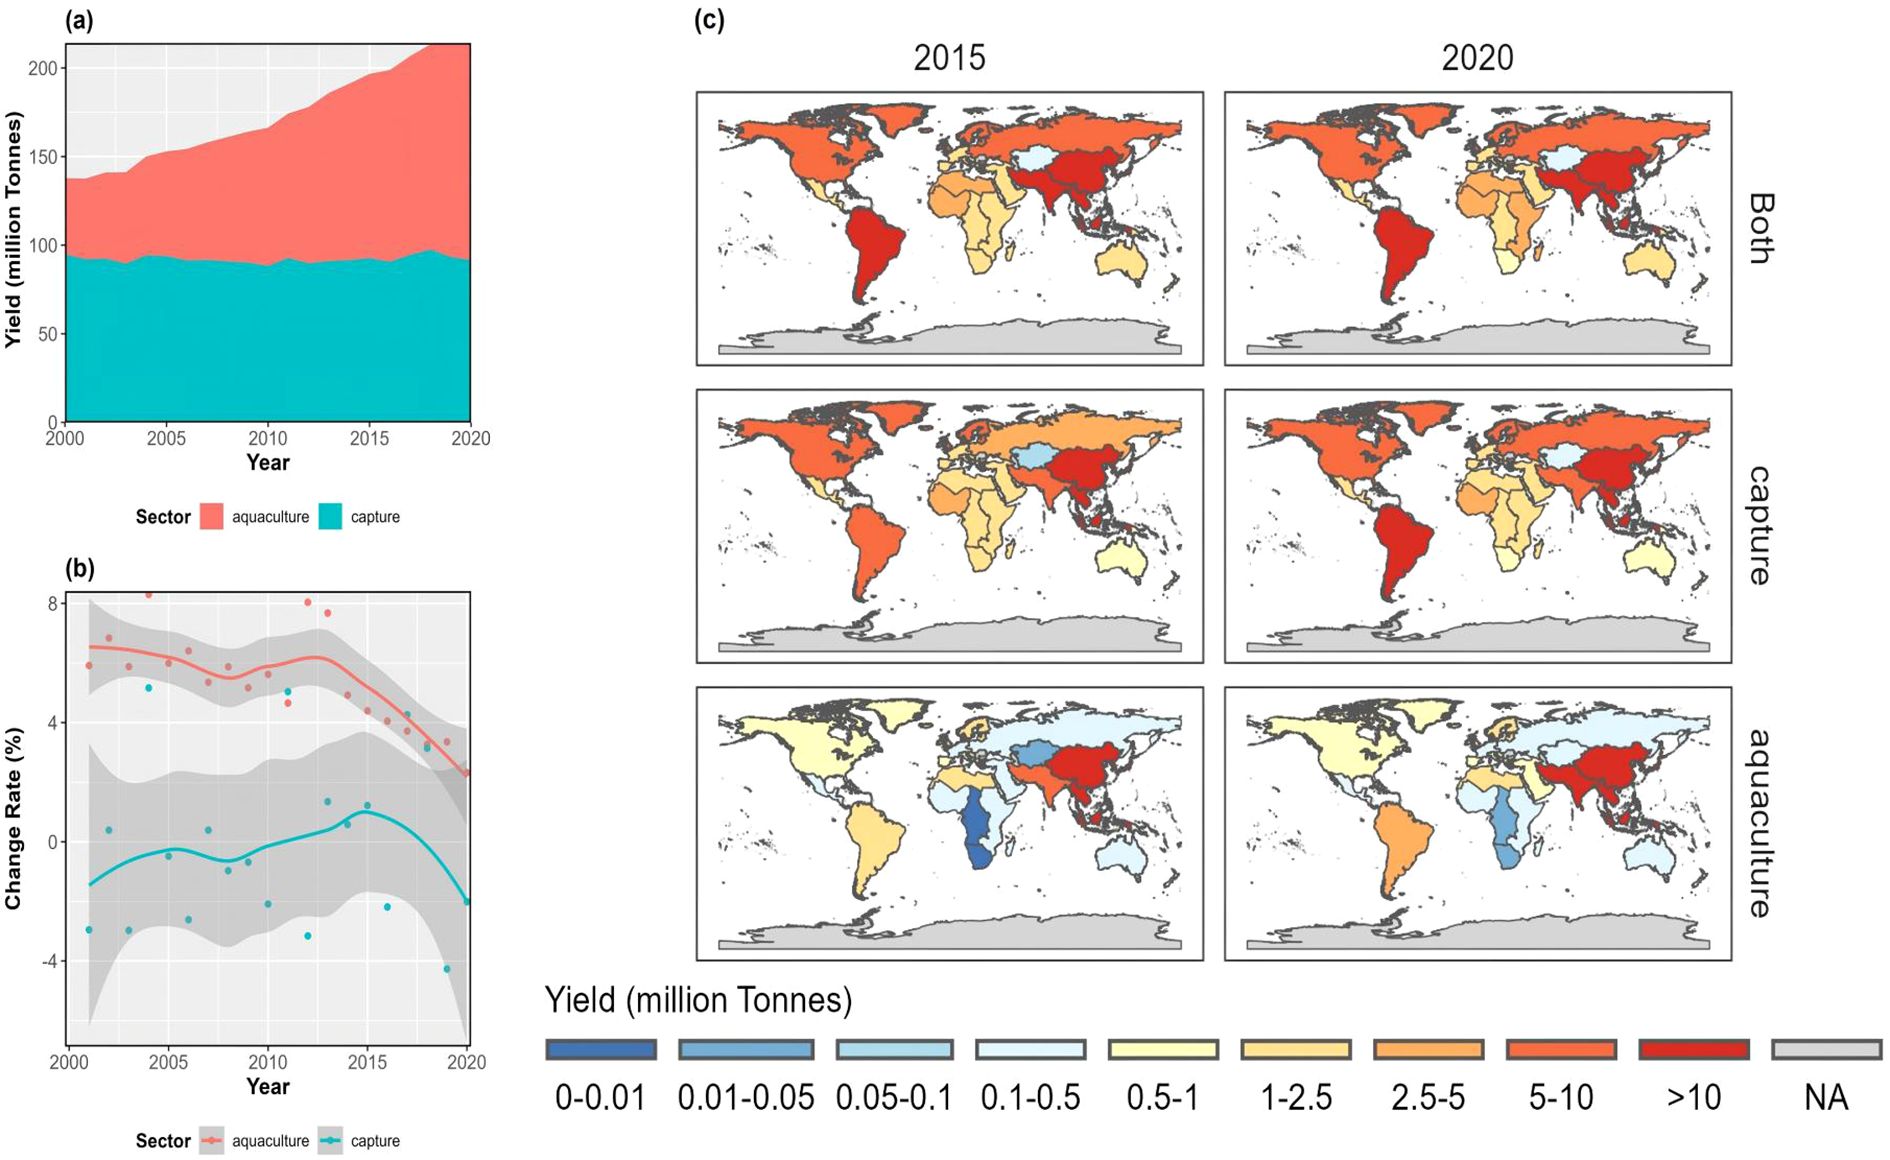
Figure 3. Spatiotemporal variation of aquatic product production at the regional scale in 2015 and 2020. (a) Global Capture and Aquaculture Production; (b) Growth Rates Capture and Aquaculture Production from 2000 to 2020 based on FAO; (c) Spatial distribution of aquatic product production.
Aquaculture production was even more concentrated than total production. In 2020, the top five aquaculture producers were China, Indonesia, India, Vietnam, and Bangladesh. Together, they accounted for 82.53 percent of global aquaculture output. China alone contributed 57.52 percent.
Seafood consumption (Supplementary Figure S1) also varied widely across regions. High-consumption areas included East, Southeast, and South Asia, as well as parts of Europe and North America. Pacific Rim countries were especially prominent. In 2020, the largest consumers were China, Indonesia, India, Japan, and the United States. China’s consumption reached 87.25 million tons, followed by Indonesia at 20.62 million tons and India at 12.57 million tons.
Over the past two decades, global seafood production has grown steadily. In 2020, total production reached 213.99 million tons. This included 91.41 million tons from capture fisheries and 122.58 million tons from aquaculture (Figure 3A). Capture fisheries have remained stable due to resource limitations. In contrast, aquaculture has become the main source of growth. Its share of total production rose from 31.21 percent in 2000 to 57.28 percent in 2020. This upward trend is likely to continue. However, growth in aquaculture has slowed. The annual growth rate exceeded 5 percent before 2010 but dropped to 2.32 percent by 2020 (Figure 3B).
4.2 Inter-regional fisheries carbon emission flow based on production and consumption
Between 2015 and 2020, global fisheries-related carbon emissions rose from 170,007 to 222,973 tons, driven primarily by growing international trade and shifting consumption patterns. Although four regions experienced emission reductions, most regions showed an increase. The regions with reductions included Eastern Europe, South Africa, Central Asia, and one unspecified region. The decrease ranged from 10 percent to 20 percent. Notably, the share of emissions under the DOS decreased from 78.21% to 70.41%, while both CBA and PBA shares increased about 4%, reflecting the rising influence of global consumption and cross-border trade (Figure 4A).
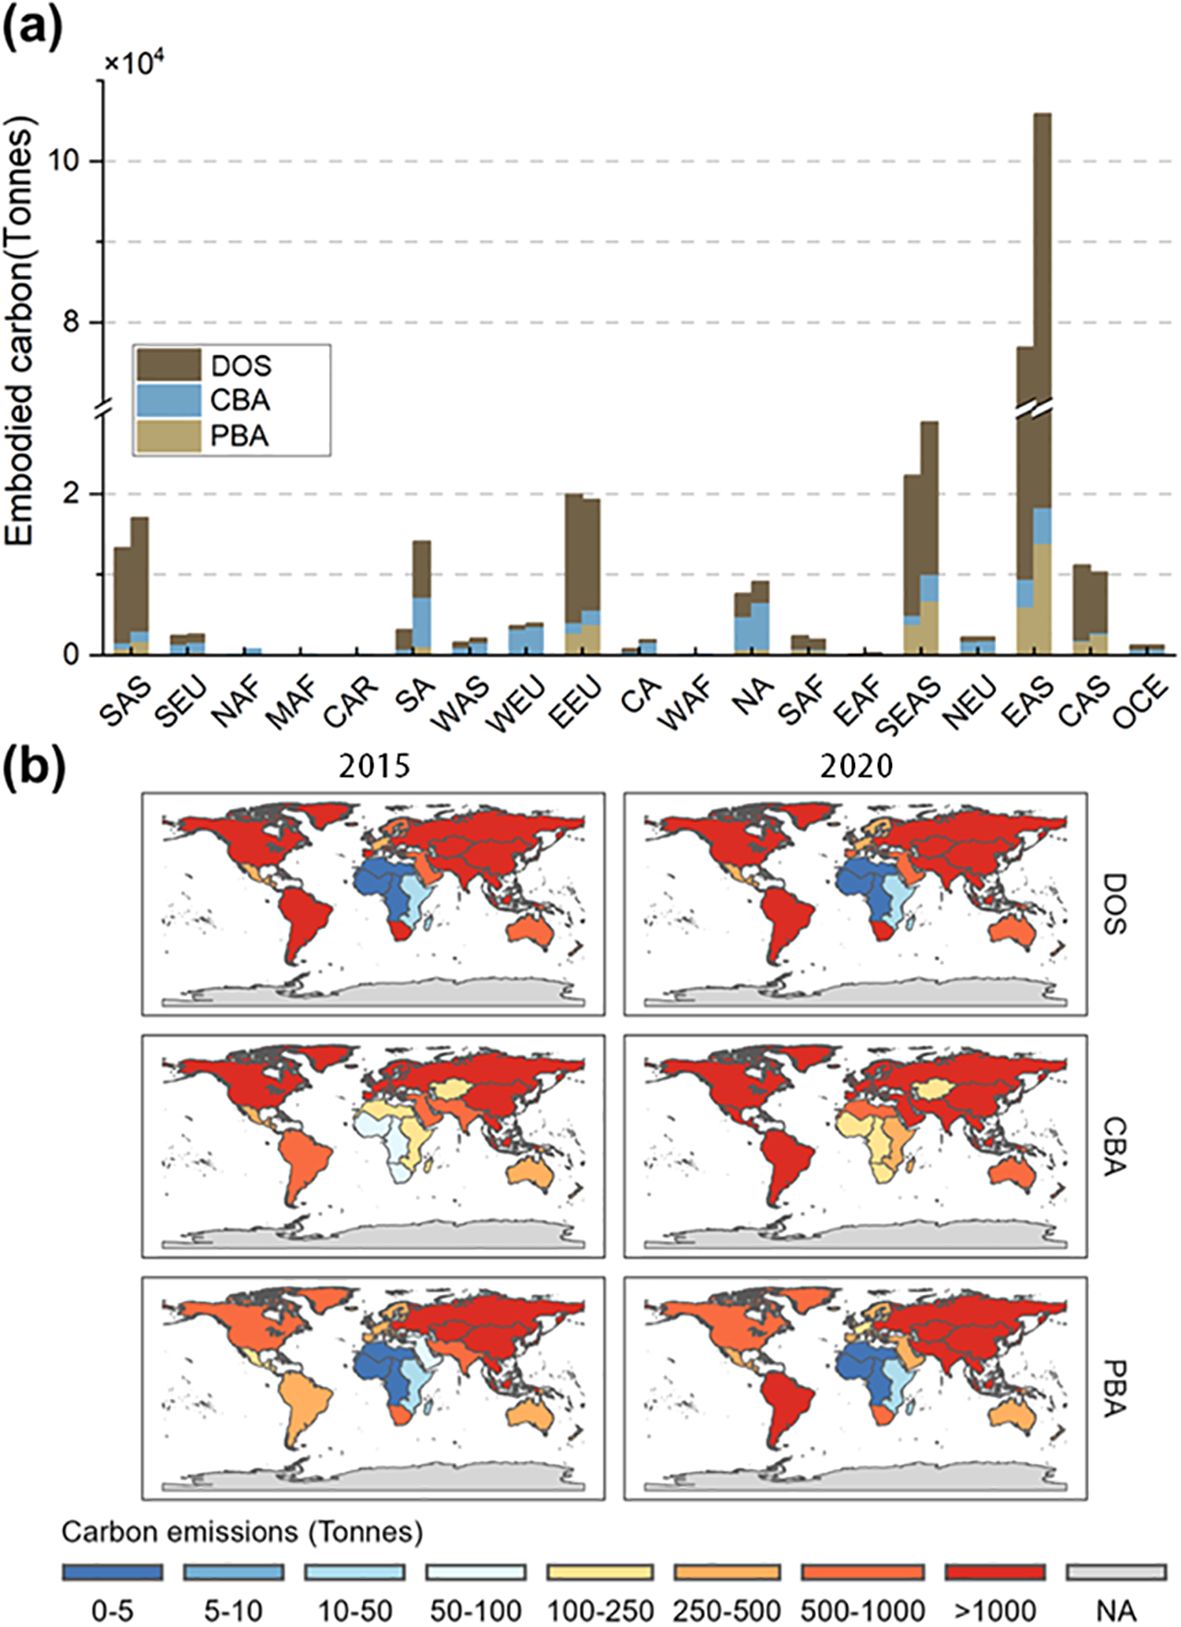
Figure 4. Total carbon emissions by three types in each region [(a) The left bar of each region represents the data for 2015, and the right bar represents the data for 2020; (b) The regional distribution of the three types of carbon emissions for 2015 and 2020].
East Asia remained the largest contributor across all accounting frameworks (DOS, CBA, and PBA), with emissions from DOS reaching 73,230 tons. Other major contributors to DOS emissions included Southeast Asia, Eastern Europe, South Asia, Central Asia, and South America. Together, these regions accounted for 97.34 percent of total DOS emissions, as shown in Figure 4B. Under CBA, North America (19.82%), East Asia (16.19%), and Western Europe (12.33%) were dominant, with ten regions cumulatively generating 90% of global CBA emissions. For PBA, emissions were highly concentrated in West Africa (34.07%), North Africa (21.57%), and Southern Europe (13.43%), with just eight regions responsible for 93.21% of global totals. Most African countries recorded zero PBA emissions, indicating low export activity and carbon emissions driven entirely by domestic consumption.
Further analysis of DOS and CBA emissions reveals that 16 of 19 regions experienced an overall increase from 153,151 tons to 191,404 tons. Despite these changes, the global spatial pattern remained largely stable. East Asia, Eastern Europe, South America, and North America consistently ranked among the highest emitters, while the fastest growth occurred in South Asia (353.29%), Central Asia (158.36%), East Africa (137.22%), and North Africa (545.61%). These growth trends highlight regional disparities in production expansion and trade integration.
The balance between DOS and CBA emissions also reflects key regional trade patterns. East and South Asia, Central Asia, and Southeast Asia had high DOS shares (61.74%-85.27%) but low local CBA shares (2.11%-8.53%), suggesting production-driven emissions serving both local and external demand. In contrast, ten regions exhibited dominant CBA emissions, ranging from 56.46% to 85.98%. These regions were mainly located in Europe and the Americas. Their DOS shares were relatively low, ranging from 8.13% to 24.02%. Oceania and Southern Europe presented a more balanced structure (~40.83% each), indicating internally oriented production and consumption systems.
PBA, which captures emissions driven by external final demand, accounted for the smallest share across regions (~15.23%). However, East Asia, Southeast Asia, and Eastern Europe collectively contributed 69.01% of total PBA emissions. From 2015 to 2020, East Asia’s PBA emissions more than doubled (from 6,409 to 13,918 tons), raising its global share from 32.29% to 41.48%. Western Asia also recorded a 180.11% increase. In contrast, 17 regions saw declining PBA shares, signaling shifting trade dependencies and export structures.
Cross-regional flow analysis based on PBA data further reveals dynamic reallocation in carbon emission burdens. South America has increasingly absorbed emissions linked to other regions’ consumption (Figure 5). For instance, its share of PBA emissions related to East Asia rose from 4.49% to 27.09%, while North America’s share dropped from 35.29% to 19.34%. Similar trends occurred in Southeast Asia and Eastern Europe, where South America and Southeast Asia took on more external demand-driven emissions. These shifts underscore the evolving geography of fisheries trade and its embedded carbon responsibilities.
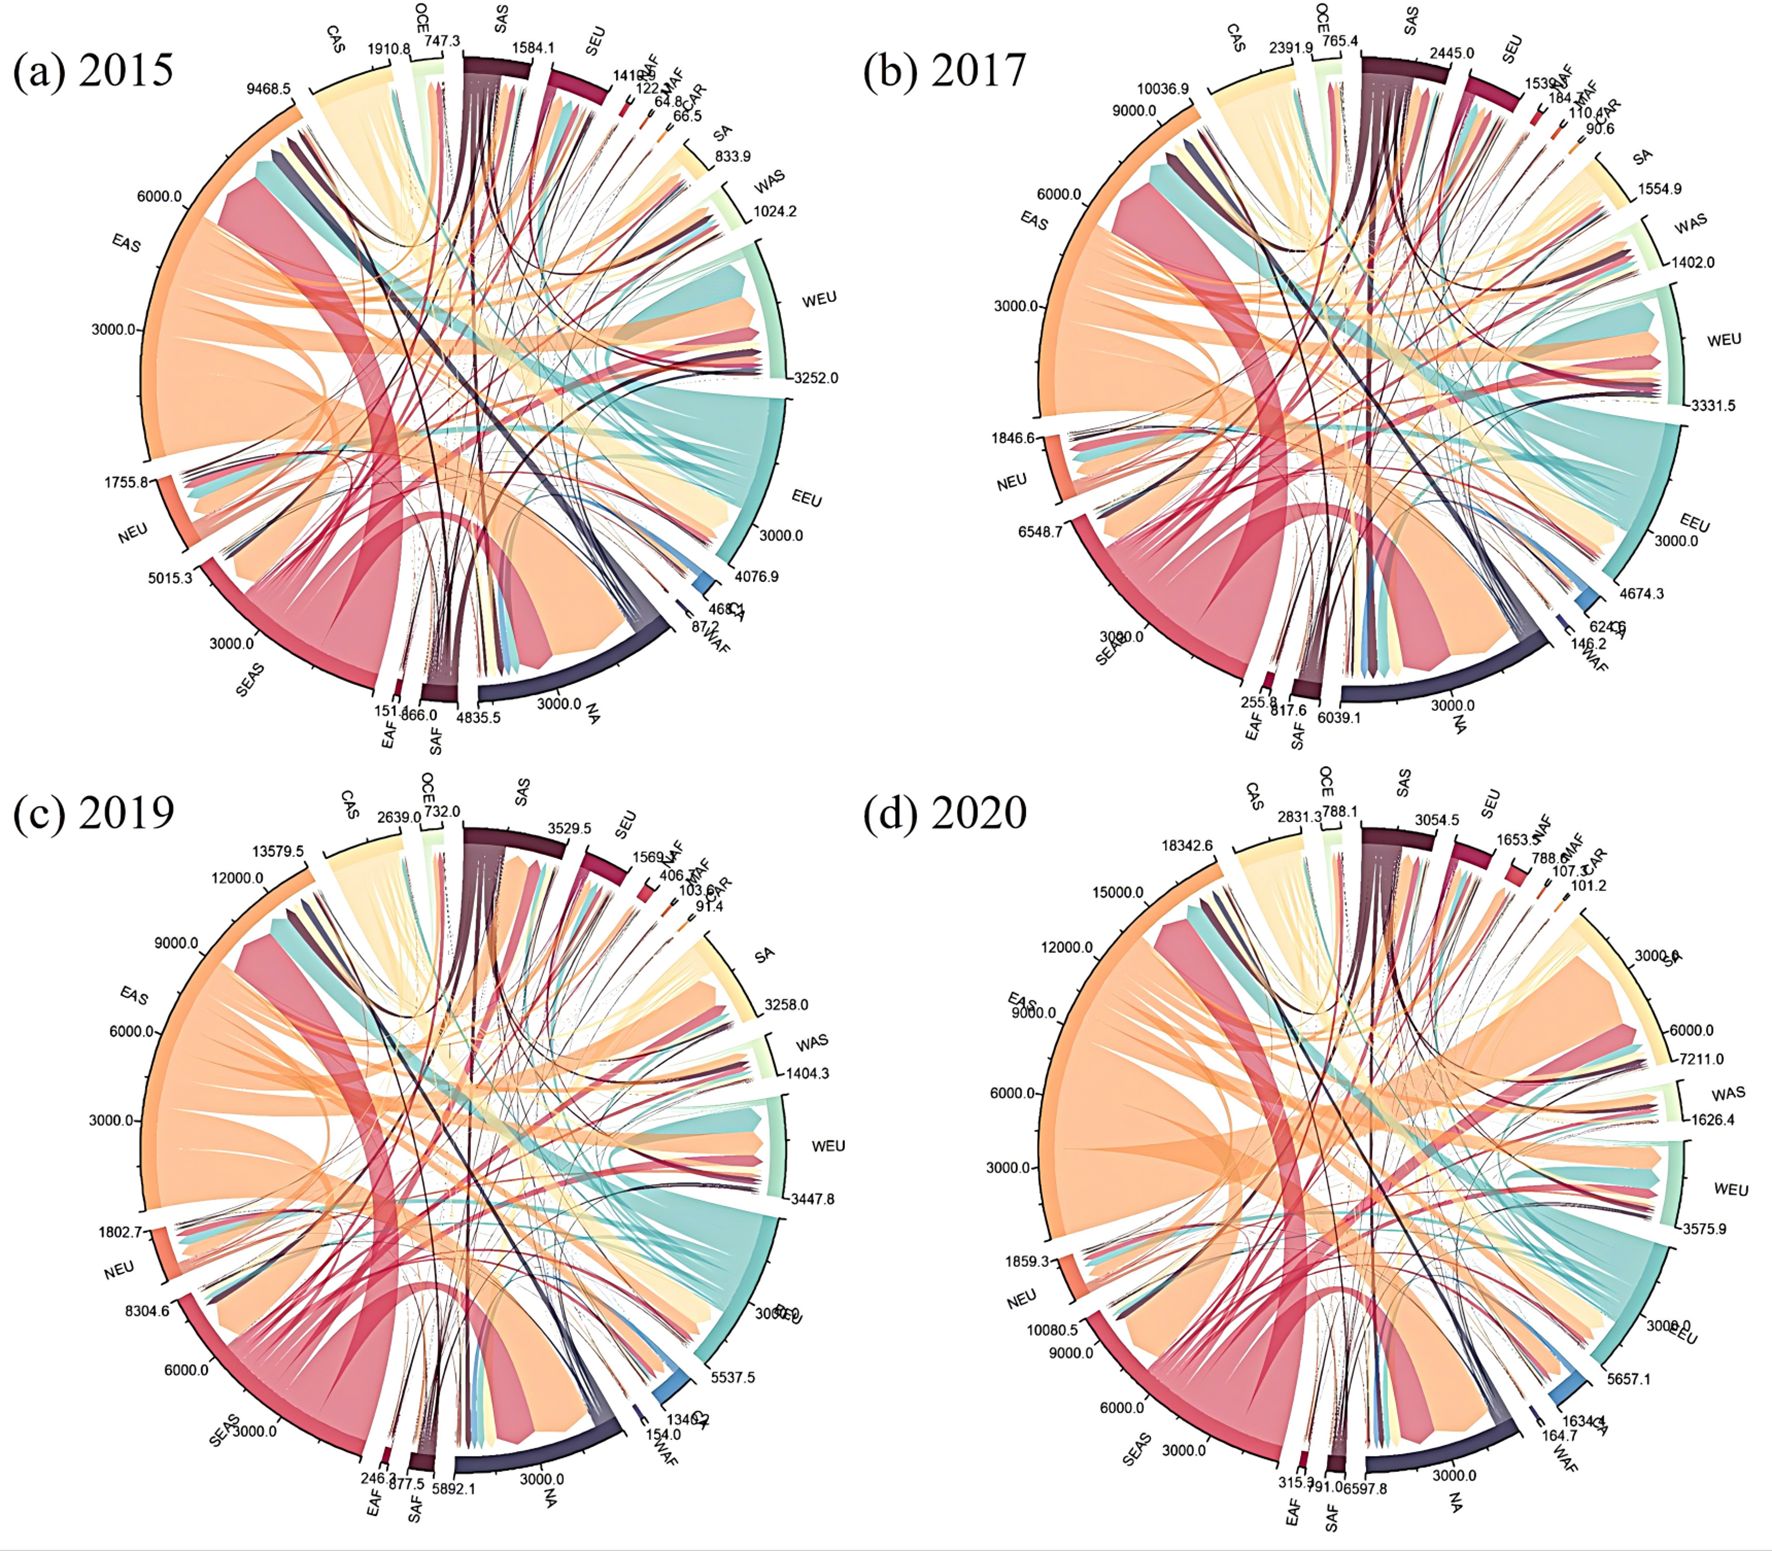
Figure 5. Implied cross-regional carbon footprint flow of PBA. (a–d) represent the flow directions and quantities of PBA for the four years from 2015 to 2020, respectively.
4.3 The carbon footprint of fish oil and fishmeal across different sectors
The carbon footprint of fishmeal and fish oil, used as intermediate goods in livestock, aquaculture, and food processing, varies significantly across countries and sectors (Figure 6). In 2020, China was the largest contributor, with over 2.09 × 10⁷ tons of emissions, driven by its intensive aquaculture and livestock industries. Other major contributors include Peru (3.50 × 10⁶ tons) and Chile (1.98 × 10⁶ tons), reflecting their roles as leading producers and exporters. In Europe and North America, Norway (3.71 × 10⁶ tons) and the United States (1.97 × 10⁶ tons) show high footprints due to salmon aquaculture and mixed livestock sectors, respectively. Southeast Asian nations like Vietnam (2.44 × 10⁶ tons) and Thailand (1.33 × 10⁶ tons) also exhibit substantial emissions, while African countries and island nations contribute marginally, with total emissions below 2.00 × 10⁶ tons, due to limited industrial demand.
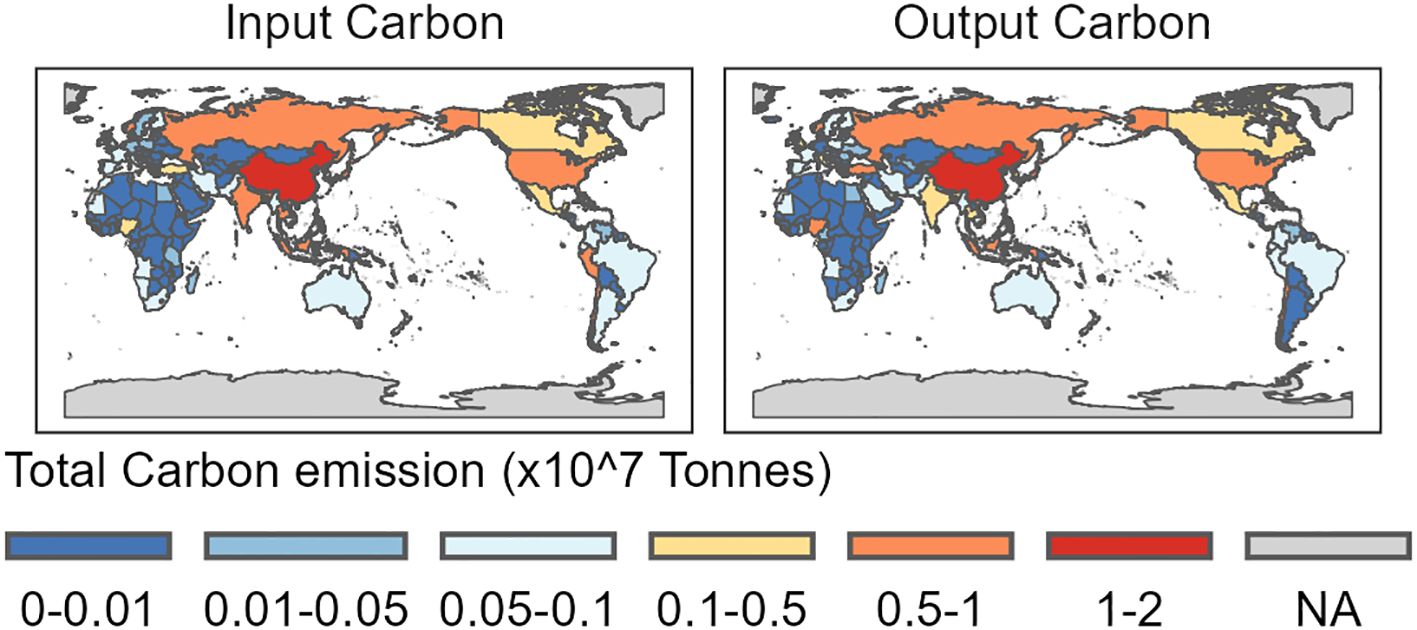
Figure 6. The carbon footprint of fish oil and fishmeal from input and output aspects.
Sector-specific analysis, as shown in Figure 7, indicates that China leads in the use of fishmeal and fish oil across four major sectors. These sectors include cattle, pigs, milk, and fisheries. This finding highlights China’s central role in global fisheries resource consumption. In the cattle sector (Figure 7A), China dominates as the top receiver, followed by Japan, Norway, Peru, and Chile. In the pig sector (Figure 7B), China again leads, with a more geographically diverse distribution, including significant exports from Norway and Chile. The milk sector (Figure 7C) shows similar trends, with China as the top receiver, and Peru, Norway, and Japan supplying large volumes to support global dairy production. In the fisheries sector (Figure 7D), the United States holds the largest footprint, reflecting high internal consumption of fishmeal and fish oil in aquaculture. Overall, China stands out as the primary consumer, while Norway, Peru, Chile, and the U.S. act as major global suppliers. These trans-regional flow patterns show the centrality of fishmeal and fish oil in supporting diverse agri-food systems and their substantial environmental footprint across global supply chains. Sector-specific analysis of region in Supplementary Figure S2, S3 in the supplement.
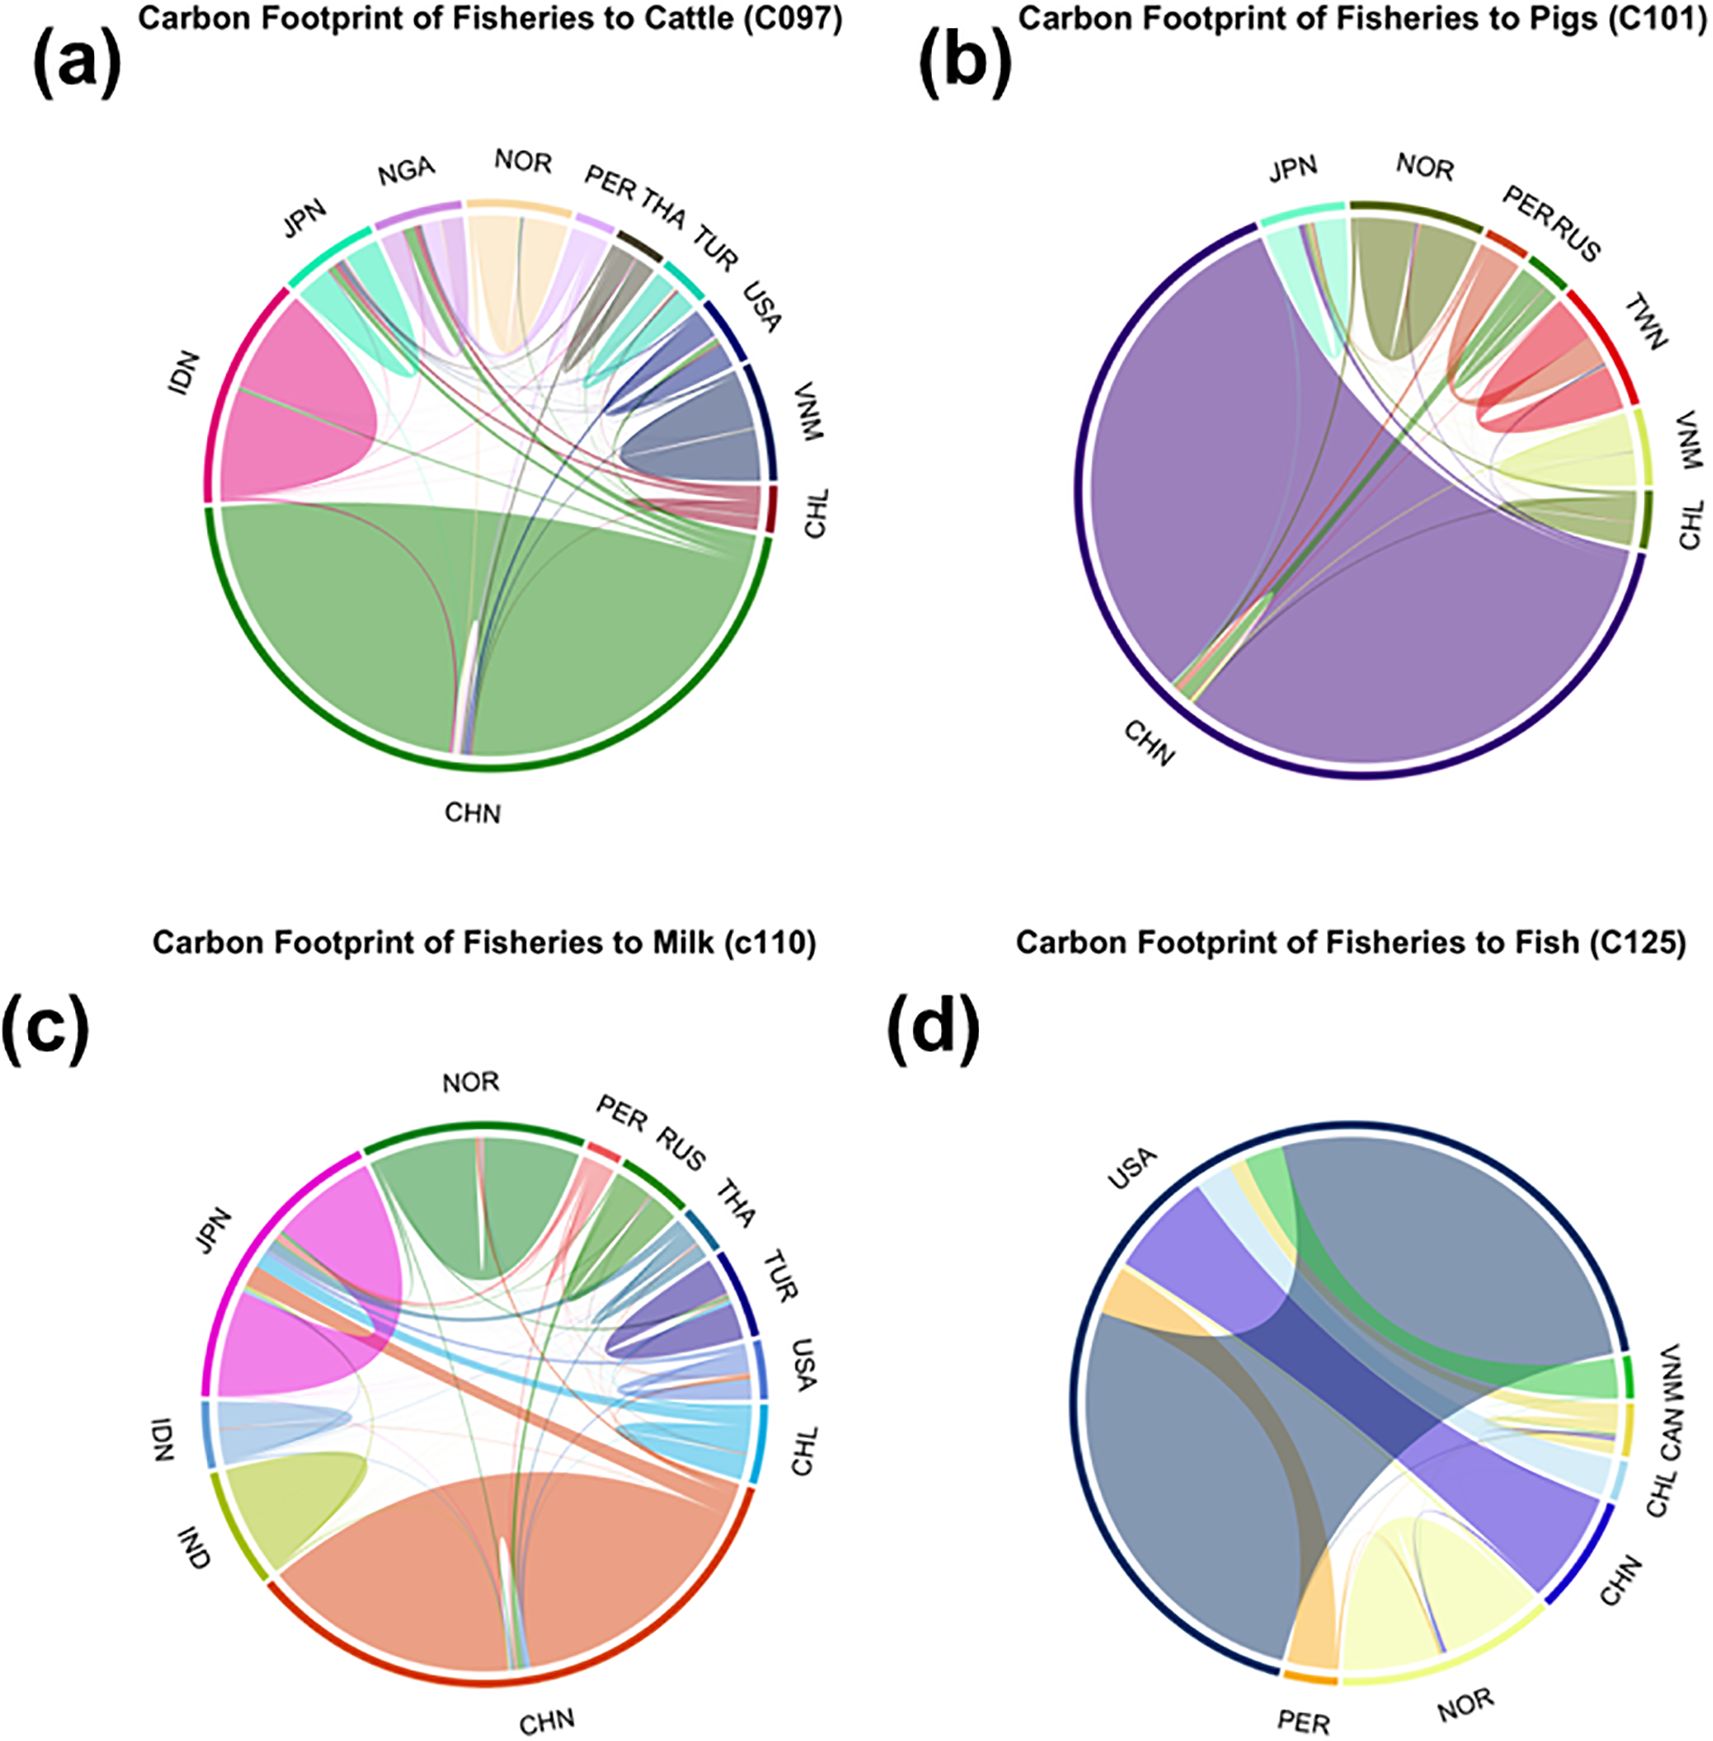
Figure 7. Footprint of fishmeal and fish oil across sectors [(a) Sector Cattle; (b) Sector Pigs; (c) Sector Milk; (d) Sector Fish].
5 Discussion
5.1 Global fisheries carbon emission responsibilities are common but differentiated
Under the guidance of the CBDR principle, global climate governance emphasizes a shared commitment to emission reduction while recognizing historical inequalities and varying national capacities. Developed countries, particular those in Europe and North America, are expected to take the lead by adopting quantified emission reduction targets and providing financial and technical support to developing nations (Boyte, 2010). Within this framework, carbon emissions from the fisheries sector should be addressed as an integral part of the global climate agenda (Zou, 2021).
The stagnation in capture fisheries (Figure 4B) signals that the ecological limits have already been reached. Therefore, future policy must prioritize ecosystem-based management and invest in restoration efforts rather than expanding wild harvests. For developing countries such as China and India, current fisheries-related emissions may be substantial. However, from a historical perspective, their cumulative carbon emissions remain comparatively low. This provides a factual basis for the justification of their development needs, particularly where fisheries inputs like fishmeal and fish oil are vital to economic growth and food security.
Nevertheless, developing countries must gradually strengthen their emission reduction commitments in accordance with national conditions, with the ultimate goal of stabilizing or reducing absolute emissions. Least developed countries (LDCs) and small island developing states (SIDS) are encouraged to formulate and report climate actions that reflect their specific vulnerabilities and resource constraints (UNFCCC, 1992). Developed countries, while managing their own development and mitigation obligations, must also fulfill treaty commitments by offering sustained support through finance, technology, and capacity building.
Figure 4A highlights the regional imbalance between aquatic production and consumption. Asia’s concentration in both supply and demand poses challenges for global food security and environmental sustainability, including risks of resource overuse and supply chain fragility. To address these concerns, policies should focus on diversifying production locations and strengthening regional supply resilience.
The recent slowdown (Figure 4C) in aquaculture growth, despite its critical role in meeting global seafood demand, also suggests emerging limitations in existing production systems. Sustainable growth will require targeted investments in technological innovation, enhanced feed conversion efficiency, and reduced environmental impacts, particularly in major producing countries.
5.2 Why is common: based on three different accounting perspectives
This study examines global fisheries-related carbon emissions using three interrelated accounting frameworks: PBA, CBA, and input-output-based accounting focused on intermediate goods. Each perspective reveals different dimensions of emission responsibilities and highlights the spatial disconnect between production, consumption, and trade activities.
The key trend shown in Figure 5 is a sharp rise in global fisheries carbon emissions. This increase is mainly driven by growing international trade and changing consumption patterns. Despite localized declines, the rise in CBA emissions highlights mounting international consumption pressures. This upward trajectory underscores growing external pressures and indicates that international consumption continues to drive environmental degradation in distant production regions. Such patterns challenge the effectiveness of current climate commitments and point to the need for integrating carbon accountability mechanisms into both trade and fisheries governance.
Notably, a clear divergence exists between PBA, DOS, and CBA results across regions. In Asia and Africa, high emissions are primarily attributed to production activities, reflecting their roles as major suppliers of aquatic products. In contrast, regions such as Europe and North America exhibit lower domestic emissions but significantly higher CBA values, revealing their dependence on imported fish products. This spatial decoupling allows consumption-intensive regions to outsource their carbon responsibilities, weakening accountability and obscuring the true drivers of emissions. Policy making must therefore evolve to include consumption-based metrics, which better capture environmental responsibility across the full supply chain and help incentivize the transition to low-carbon trade pathways.
Western Asia reflects growing concentrations of trade-related emissions. Countries in South America are also becoming major suppliers in response to external demand, particularly from Europe and East Asia, thereby assuming a growing share of global CBA-designated emissions. These shifts highlight the complex and dynamic geography of carbon flows, in which consumption in one region often leads to increased production and associated emissions in another (Peters and Hertwich, 2008; Tukker et al., 2016).
The analysis from the intermediate input perspective offers further insight into the structure of fisheries-related emissions. Fishmeal and fish oil production account for a significant portion of embedded emissions, with China alone responsible for nearly one-third of global emissions from these intermediate goods (Figure 8). This concentration results not only from China’s scale of production but also from its pivotal role in supplying feed to both domestic and international aquaculture and livestock systems. The emissions associated with processing fishmeal and fish oil frequently exceed those from direct consumption or harvesting, underscoring the hidden but substantial environmental costs embedded in global agri-food trade.
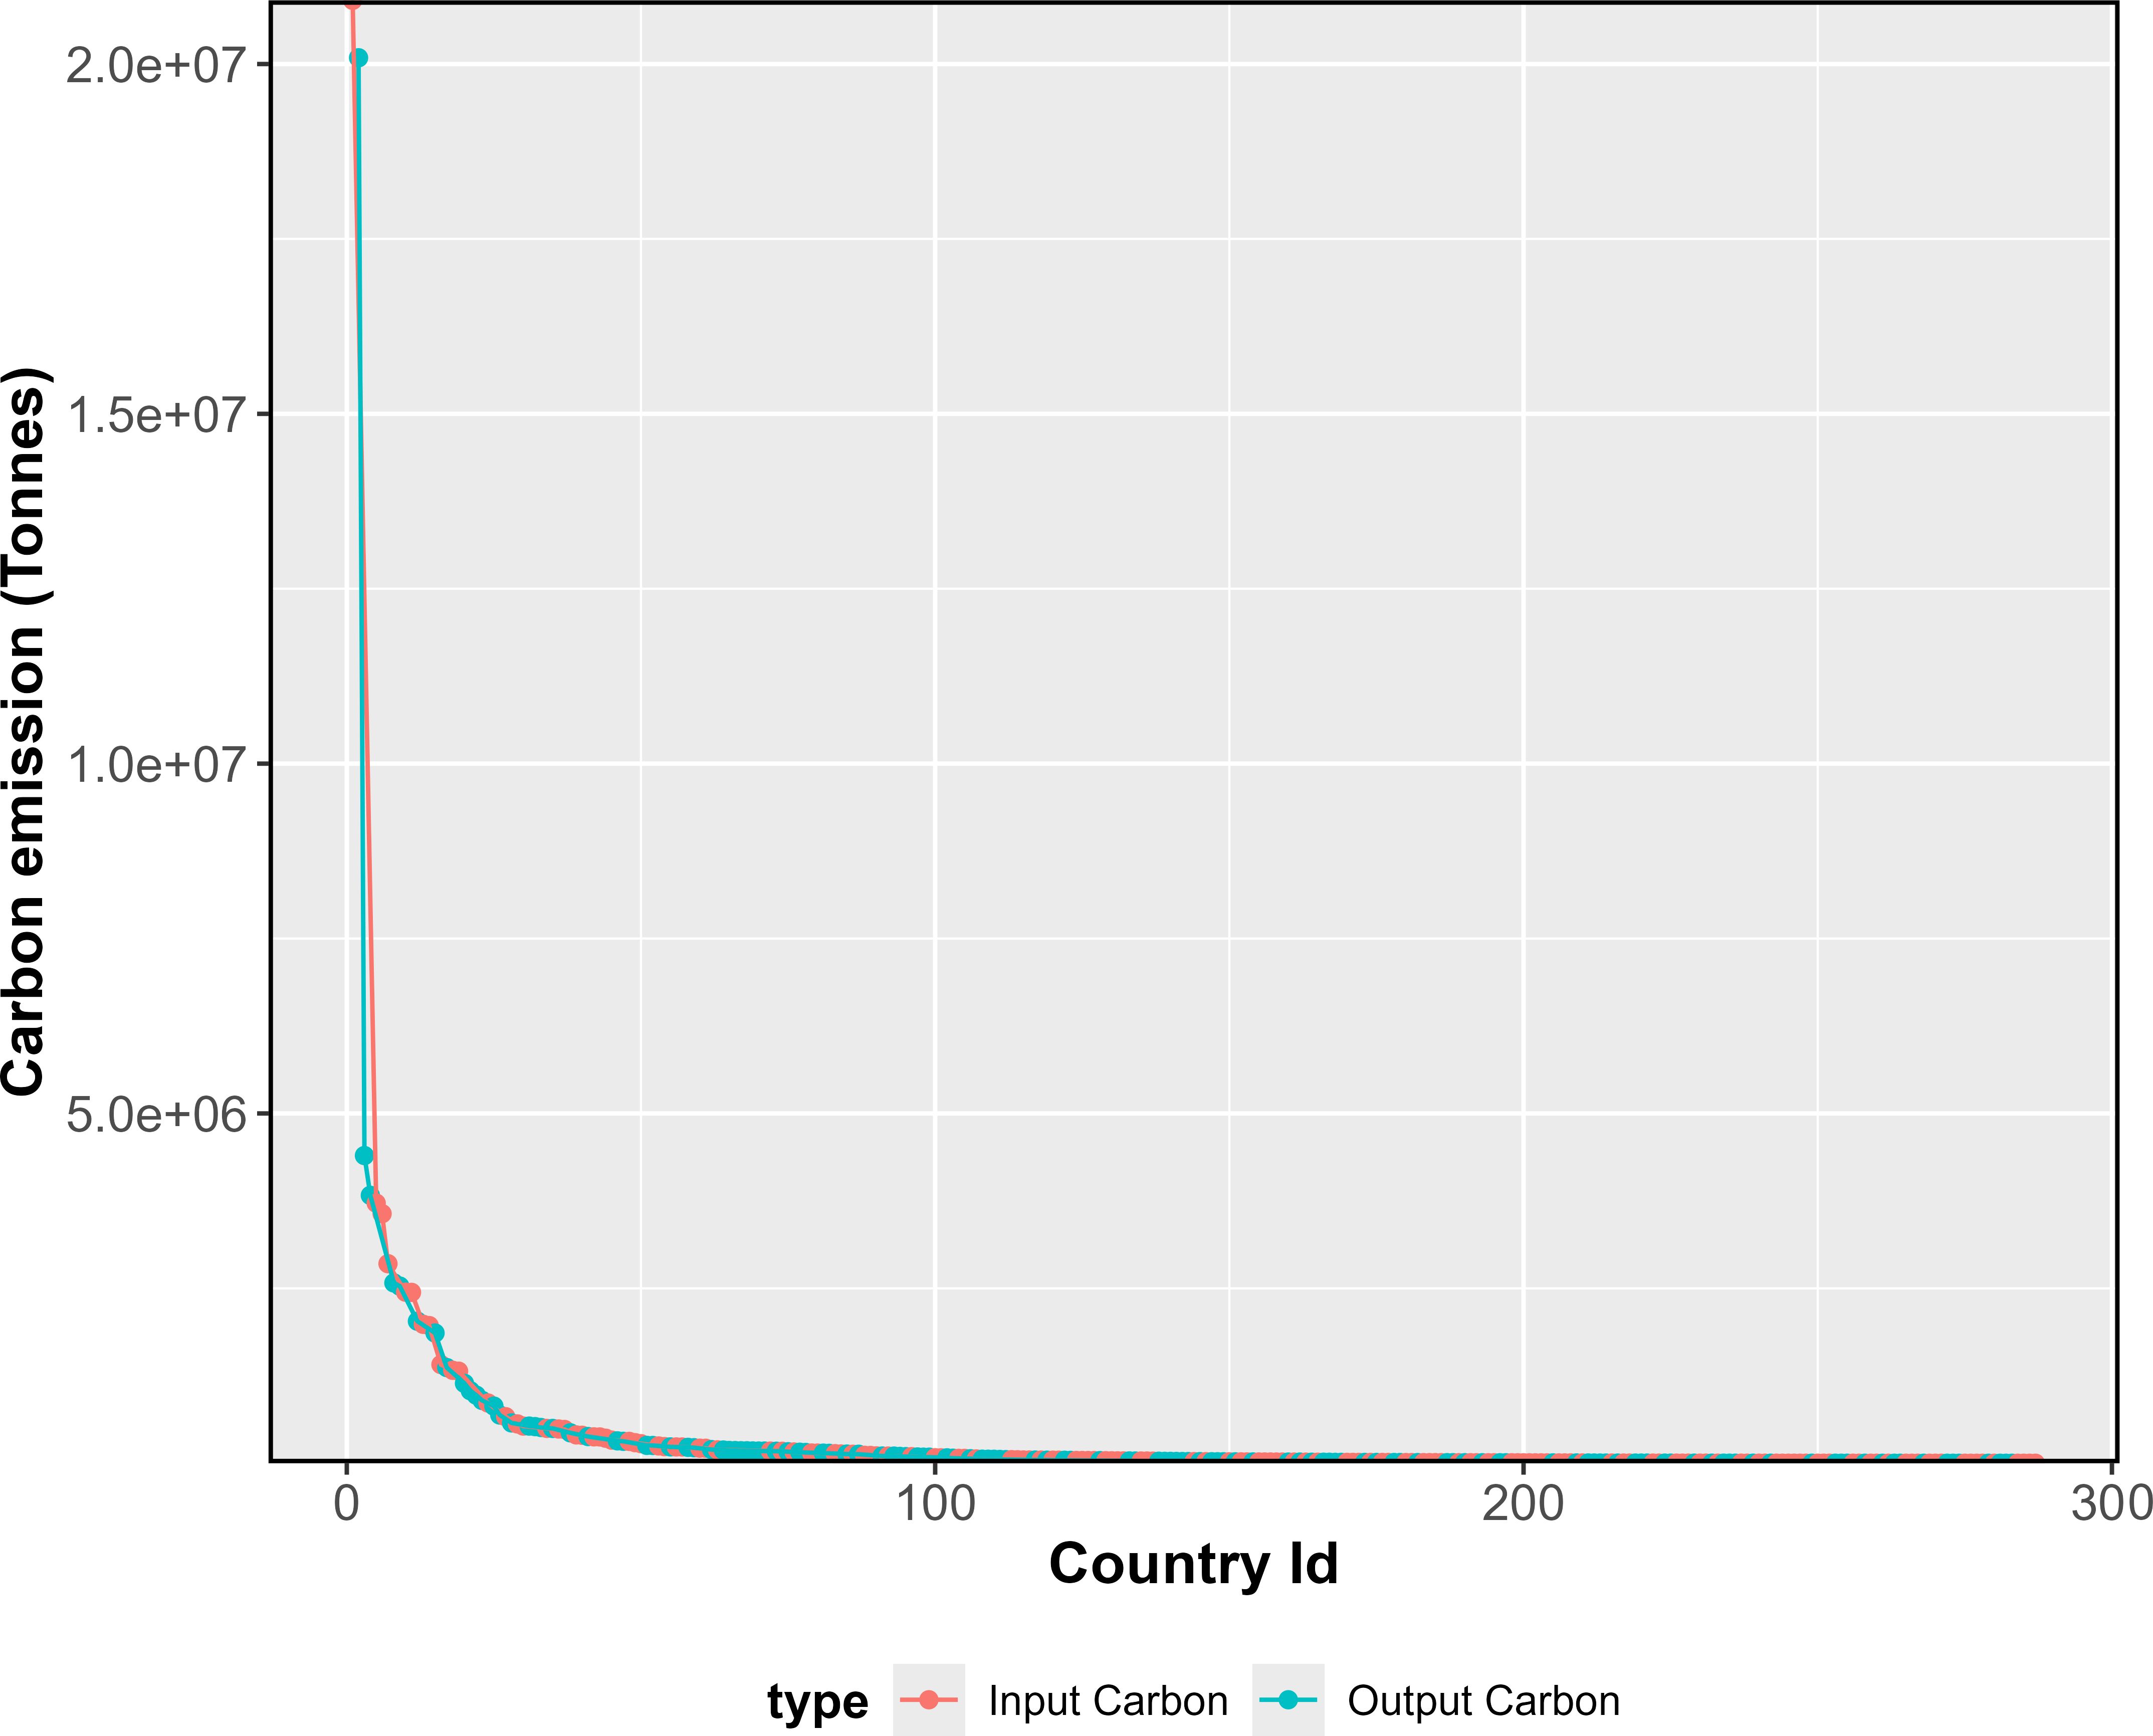
Figure 8. Scaling law of total carbon emissions from fish products (fish oil and fishmeal) based on input-output analysis across 20 global regions.
Furthermore, these emissions are intensified by energy-intensive and mechanized industrial processes, particularly in processing hubs across China and Southeast Asia (Gephart et al., 2019). These hubs function as central nodes in global seafood value chains, supplying diverse international markets while concentrating a disproportionate share of the carbon burden. This concentration of emissions reveals an underlying asymmetry: a limited number of countries bear the majority of environmental impacts generated by consumption patterns elsewhere. This disproportionate burden is driven not only by production scale but also by the intensification of global trade. As fisheries trade expands, especially in high-demand products like fishmeal and fish oil, carbon emissions from processing and transport are increasingly concentrated in a few major exporters in Asia and Latin America (Smarason et al., 2017).
Given the cross-regional entanglement of fisheries-related emissions across production, consumption, and intermediate stages, assigning responsibility based solely on territorial carbon footprints is insufficient. Instead, this study emphasizes the need for a shared responsibility framework grounded in the principle of CBDR, as recognized under the UNFCCC, Kyoto Protocol, and Paris Agreement (Rajamani, 2016; Wang and Gao, 2018). Both developed and developing countries participate in and benefit from fisheries trade and thus must collaboratively reduce emissions through technology transfer, sustainable feed alternatives, and equitable carbon governance.
5.3 How to differentiate: continuing the climate governance model under the CBDR principle
The uneven growth of fisheries-related carbon emissions across global regions raises pressing concerns for equitable climate governance. Compound annual growth rate (CAGR) projections indicate that fisheries-sector carbon emissions will increase sharply between 2020 and 2030 in Central and South America, East Africa, North Africa, and West Africa. The annual growth is expected to exceed 10.19% and reach as high as 34.44% in some cases. Meanwhile, regions such as South Africa, Northern Europe, Eastern Europe, and Oceania are expected to reduce their per capita emissions by 11.45%-37.23% (Figure 9). These divergent patterns reflect rising seafood demand and economic development in the Global South, particularly from low historical baselines (Naylor et al., 2021).
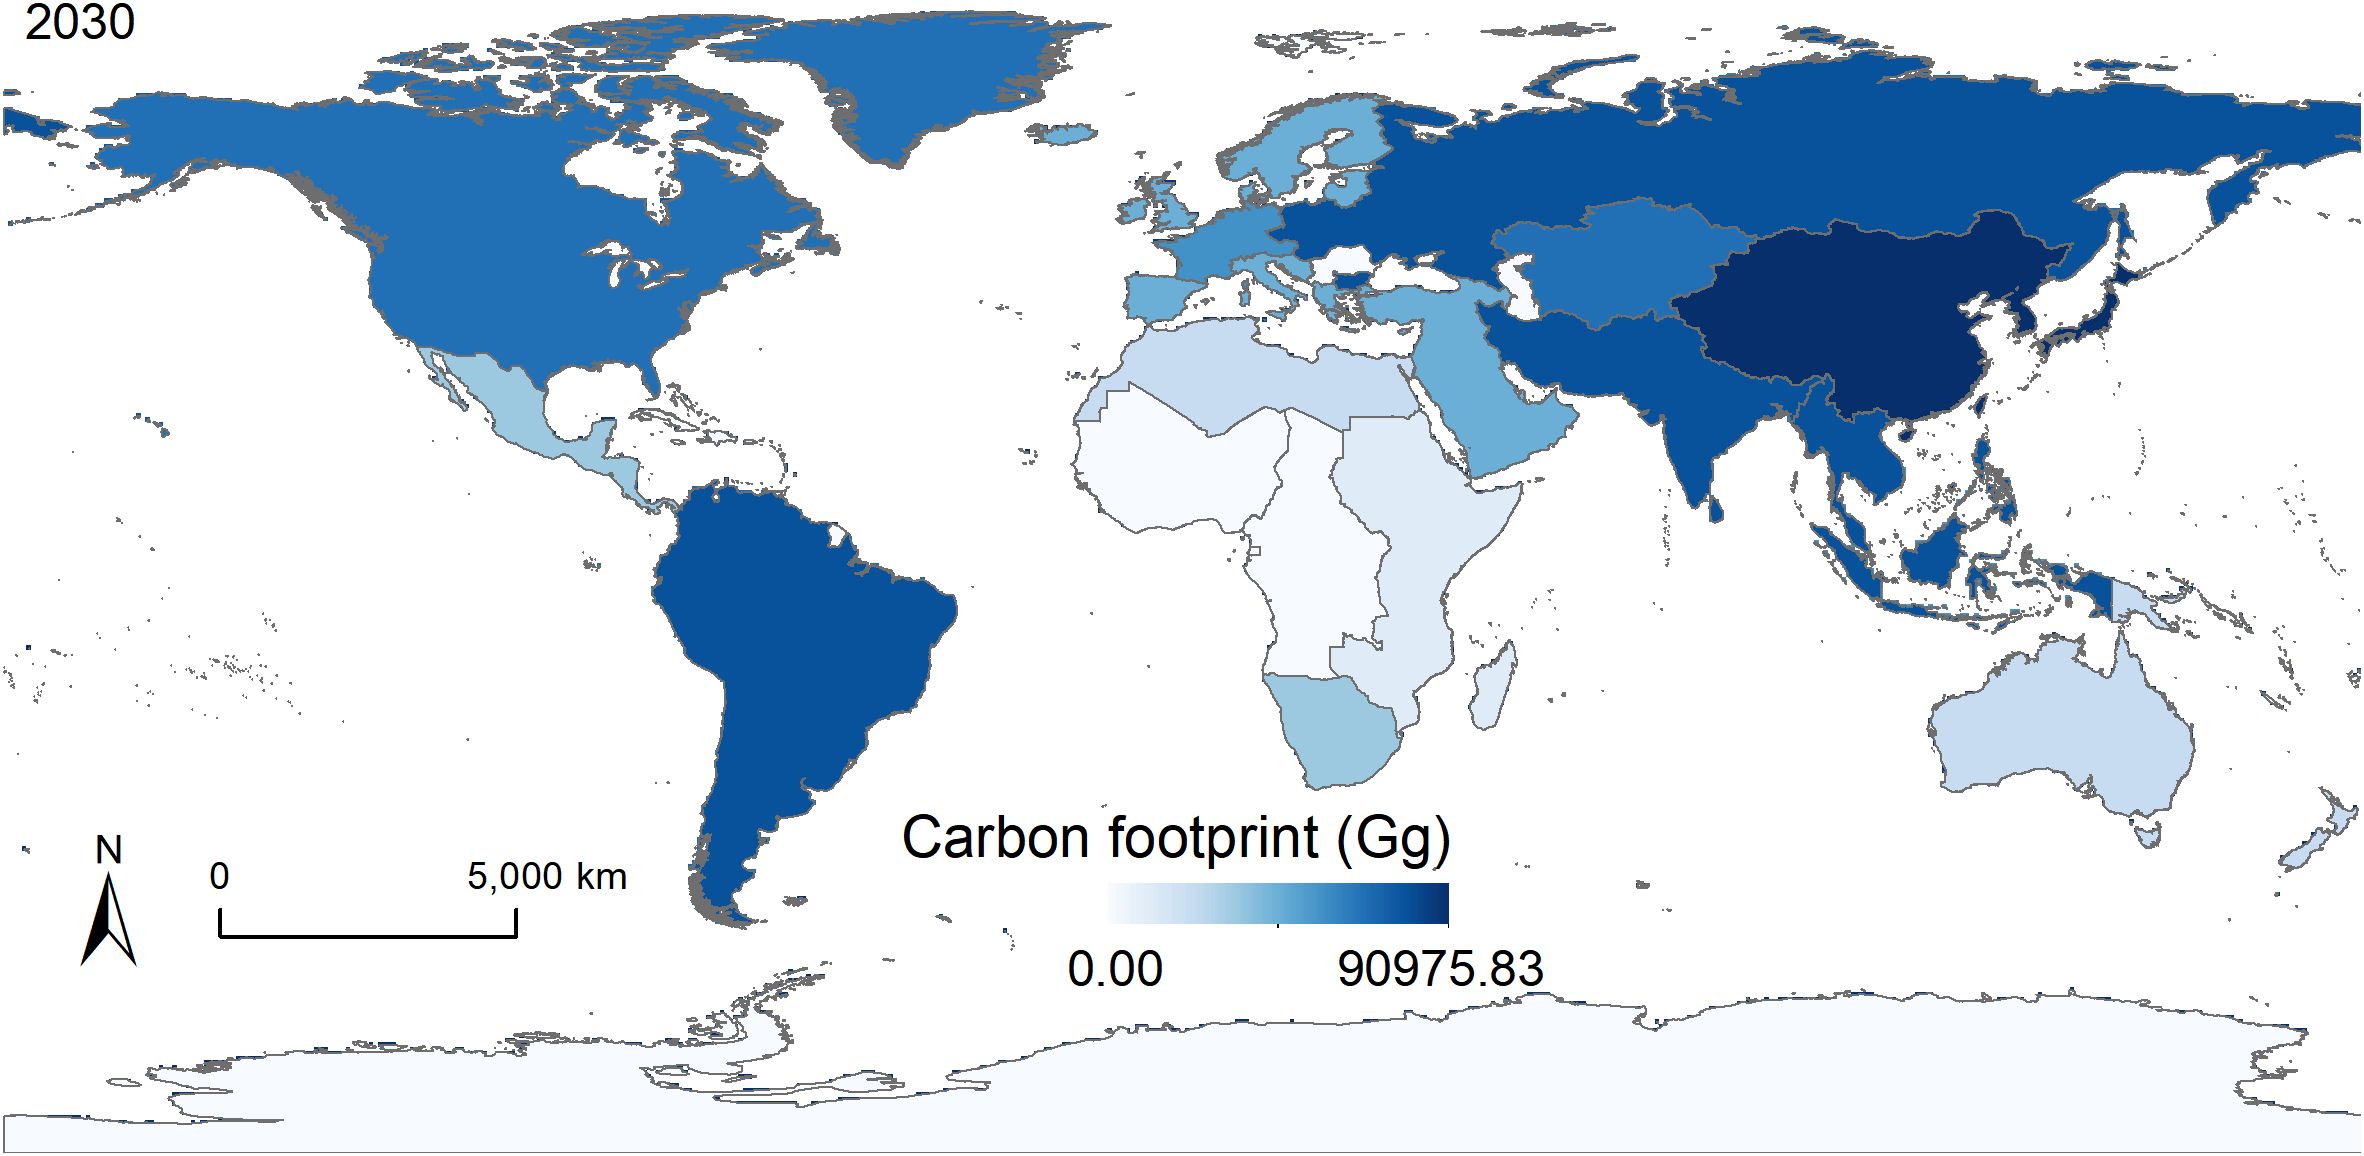
Figure 9. Carbon emissions per capita in 2030.
Such disparities reinforce the importance of CBDR, enshrined in the UNFCCC, Kyoto Protocol, and Paris Agreement (Ebbesson and Hey, 2022). Under this framework, emission reduction obligations should reflect each country’s historical emissions, developmental capacity, and socioeconomic priorities. LDCs and SIDS in Central America and sub-Saharan Africa, where fisheries remain vital for food and employment, should be allowed to formulate nationally appropriate mitigation strategies that accommodate their unique development contexts (Teh and Sumaila, 2013). Article 4 of the UNFCCC mandates that developed countries provide financial and technological support to these regions, laying the foundation for equitable climate action.
Even within the Global South, differentiation is necessary. For instance, China is a leading producer of aquaculture and feed. It accounts for a substantial share of global fisheries-related emissions, especially through fishmeal and fish oil supply chains. While still classified as a developing country, China’s scale of production suggests a capacity to assume more proactive emission reduction roles, such as investing in feed efficiency, electrified production systems, and low-carbon alternatives (Bianchi et al., 2022). Therefore, China, on the one hand, can leverage its status as a developing country to access technology transfers and financial support through North-South cooperation, for instance, by seeking technical collaboration or funding from developed countries to implement recirculating aquaculture systems and carbon-sequestration-oriented aquaculture technologies. On the other hand, it is also in a position to facilitate technology diffusion and provide financial assistance to other developing countries via South-South cooperation and the Belt and Road Initiative (BRI).
The concentrated carbon footprint of fishmeal and fish oil, especially in China Peru, Norway, and the U.S. (Figure 7), highlights critical pressure points in global agri-food supply chains. Tailored policies are needed to address both production and consumption, such as promoting sustainable feed alternatives, enhancing production efficiency, and introducing demand-side measures like carbon labeling. Sectoral differences, such as China’s dominance in multiple sectors and the U.S. focus on aquaculture, require targeted solutions.
In recent years, China has progressively integrated green standards into the BRI, aiming to ensure that Chinese-financed projects comply with climate and environmental criteria and to promote the transfer of green technologies (CCICED, 2024). By simultaneously urging developed countries to honor their CBDR commitments and fostering intra-developing country cooperation through demonstrative technology transfer initiatives, China enables differentiated pathways for carbon mitigation in the fisheries sector. This approach not only reflects the heterogeneous capacities and development needs of the Global South but also helps to institutionalize and scale up the principle of differentiated responsibilities at the global level.
Finally, developed countries must fulfill their climate commitments and provide robust support to developing regions. This includes advancing low-emission aquaculture technologies, improving cold chain logistics, and enabling carbon accounting across seafood supply chains (Jiang et al., 2023; Tran et al., 2023). As global seafood trade intensifies, carbon emission responsibilities are increasingly distributed across production, consumption, and intermediate input flows. The growing complexity of these transboundary linkages requires a robust, cooperative governance approach that goes beyond territorial emissions. Within the current climate regime, promoting international collaboration, accelerating green technological deployment, and reinforcing CBDR-based frameworks are vital for reducing the global fisheries sector’s carbon footprint in a just and effective manner (Tseng et al., 2020).
5.4 Research limitation
This study acknowledges several limitations related to the use of MRIO analysis and associated data model in the inter-sectoral dynamics of the global fisheries carbon footprint. First, although Eora26 aggregates the global economy into 26 sectors across 190 countries, offering broad coverage of economic activities and environmental extensions such as CO2 emissions and energy use, while FAO aggregated over 190 countries and regions into 20 regions for analysis their across fish production exchange across regions, therefore, the potential global fisheries are not limited in demonstrating the country-level carbon footprint. Meanwhile, although the FABIO model provides a multi-regional input-output table covering global agriculture and forestry, we only can demonstrate the potential upstream carbon footprint of fishmeal and fish oil across crops, fisheries (aquaculture& capture fishes) and four type of livestock sectors (which includes pigs, poultry, cattle, and dairy), are also limited to fully demonstrate the upstream and downstream of fish meal and fish oil across different sector for their intermediate products. Thirdly, a key limitation of this study is the temporal inconsistency across datasets. EORA26 covers 1990–2021, while FABIO is only available up to 2013. To ensure consistency, the analysis focuses on 2015–2020, aligned with FAO aquaculture data and recent EORA26 records. For fish oil and fishmeal, we estimated sectoral carbon footprints for 2020 based on FAO and FABIO, assuming constant emission intensity since 2013. This assumption, along with the outdated coverage of FABIO, may affect the precision of recent estimates and the timeliness of policy relevance. Additionally, classification mismatches between EORA’s monetary-based sectors and FABIO’s physical biomass sectors can create inconsistencies in model integration and affect the robustness of cross-model comparisons. Finally, in the supplement Supplementary Figures S2, S3, further uncertainty arises from the carbon footprint range of fishmeal (from 0.48 to 5.57 tons CO2) and fish oil (from 0.70 to 11.92 tons CO2.), and these literature-derived emission factors may also lack regional specificity and temporal accuracy. As seafood production and consumption trends evolve—particularly under the influence of technology diffusion and shifting dietary patterns—model inputs and assumptions must be continuously refined to improve relevance and accuracy in future assessments.
6 Conclusion
This study reveals the intricate carbon dynamics of the global fisheries sector, shaped by regional disparities in production, consumption, and intermediate inputs. East and Southeast Asia dominate production and bear the bulk of production-based emissions, while North America and Western Europe drive emissions through consumption. In contrast, African regions show minimal export-driven emissions but rely heavily on imports, reflecting unequal carbon responsibilities.
Fishmeal and fish oil significantly contribute to fisheries-related emissions, with China, Norway, and Peru leading in their production and export. These intermediate inputs often generate more emissions than direct production or consumption, due to energy-intensive processing and global trade.
Seafood demand is rising, especially in Latin America and Africa. As a result, per capita emissions are expected to increase rapidly. Addressing these trends requires improved carbon accounting across supply chains, inclusion of intermediate input emissions, and broader adoption of consumption-based frameworks. Promoting green technologies, international cooperation, and equity through the CBDR principle will be essential for achieving sustainable, low-carbon fisheries.
Data availability statement
Publicly available datasets were analyzed in this study. This data can be found here: The study relies on data from the Food and Agriculture Organization (FAO)’s FAOSTAT (https://www.fao.org/faostat/en/) and FISHSTAT databases to obtain global consumption, production, and trade weight data for various types of aquatic products. Based on the International Standard Statistical Classification of Aquatic Animals and Plants (ISSCAAP) provided by the FAO and its annual reports on aquatic products, this study includes freshwater fishes, diadromous fishes, marine fishes, crustaceans, mollusks, and miscellaneous aquatic animals. It excludes aquatic plants and aquatic mammals.
Author contributions
CW: Conceptualization, Formal Analysis, Methodology, Writing – original draft, Writing – review & editing. XL: Formal Analysis, Investigation, Methodology, Software, Writing – original draft. KL: Data curation, Investigation, Methodology, Writing – original draft. CZW: Funding acquisition, Supervision, Validation, Writing – original draft, Writing – review & editing. MX: Data curation, Formal Analysis, Writing – review & editing.
Funding
The author(s) declare financial support was received for the research and/or publication of this article. This research was financially supported by Sun Yat-sen University funding to interdisciplinary studies of China's Participation in Global Maritime Governance, This research was financially supported by Innovation Group Project of Southern Marine Science and Engineering Guangdong Laboratory (Zhuhai), No. SML2023SP222; National Nature Science Foundation of China, NSFC General Fund, No. 42471443, and the Southern Marine Science and Engineering Guangdong Laboratory (Zhuhai) project No. 311021018.
Conflict of interest
The authors declare that the research was conducted in the absence of any commercial or financial relationships that could be construed as a potential conflict of interest.
Generative AI statement
The author(s) declare that no Generative AI was used in the creation of this manuscript.
Any alternative text (alt text) provided alongside figures in this article has been generated by Frontiers with the support of artificial intelligence and reasonable efforts have been made to ensure accuracy, including review by the authors wherever possible. If you identify any issues, please contact us.
Publisher’s note
All claims expressed in this article are solely those of the authors and do not necessarily represent those of their affiliated organizations, or those of the publisher, the editors and the reviewers. Any product that may be evaluated in this article, or claim that may be made by its manufacturer, is not guaranteed or endorsed by the publisher.
Supplementary material
The Supplementary Material for this article can be found online at: https://www.frontiersin.org/articles/10.3389/fmars.2025.1563747/full#supplementary-material
References
Abernethy K. E., Trebilcock P., Kebede B., Allison E. H., and Dulvy N. K. (2010). Fuelling the decline in UK fishing communities? ICES J. Mar. Sci. 67, 1076–1085. doi: 10.1093/icesjms/fsp289
Ahmad A., Sheikh Abdullah S. R., Hasan H. A., Othman A. R., and Ismail N.‘ (2021). Aquaculture industry: Supply and demand, best practices, effluent and its current issues and treatment technology. J. Environ. Manage. 287, 112271. doi: 10.1016/j.jenvman.2021.112271
Auchterlonie N. (2016). Marine ingredients as a foundation for global fed aquaculture production. Aquafeed Int., 30–33. Available online at: https://theaquaculturists.blogspot.com/2016/12/12122016-marine-ingredients-as.html.
Avadí A. and Fréon P. (2013). Life cycle assessment of fisheries: A review for fisheries scientists and managers. Fisheries Res. 143, 21–38. doi: 10.1016/j.fishres.2013.01.006
Bianchi M., Hallström E., Parker R. W. R., Mifflin K., Tyedmers P., and Ziegler F. (2022). Assessing seafood nutritional diversity together with climate impacts informs more comprehensive dietary advice. Commun. Earth Environ. 3, 1–12. doi: 10.1038/s43247-022-00516-4
Boyd C. E., McNevin A. A., and Davis R. P. (2022). The contribution of fisheries and aquaculture to the global protein supply. Food Sec. 14, 805–827. doi: 10.1007/s12571-021-01246-9
Boyte R. (2010). Common but differentiated responsibilities: adjusting the. New Z. J. Environ. Law. Available online at: https://www.nzlii.org/nz/journals/NZJlEnvLaw/2010/4.html.
Bruckner M., Wood R., Moran D., Kuschnig N., Wieland H., Maus V., et al. (2019). FABIO-the construction of the food and agriculture biomass input-output model. Environ. Sci. Technol. 53, 11302–11312. doi: 10.1021/acs.est.9b03554
Cashion T., Tyedmers P., and Parker R. W. R. (2017). Global reduction fisheries and their products in the context of sustainable limits. Fish Fisheries 18, 1026–1037. doi: 10.1111/faf.12222
CCICED (2024). Green Opening-up and South-South Cooperation. Available online at: https://cciced.eco/research/special-policy-study/green-opening-up-and-south-south-cooperation/ (Accessed July 13, 2025).
Chia S. Y., Tanga C. M., Osuga I. M., Alaru A. O., Mwangi D. M., Githinji M., et al. (2019). Effect of dietary replacement of fishmeal by insect meal on growth performance, blood profiles and economics of growing pigs in Kenya. Animals 9, 705. doi: 10.3390/ani9100705
Dong S., Dong Y., Cao L., Verreth J., Olsen Y., Liu W., et al. (2022). Optimization of aquaculture sustainability through ecological intensification in China. Rev. Aquaculture 14, 1249–1259. doi: 10.1111/raq.12648
Ebbesson J. and Hey E. (Eds.) (2022). “The cambridge handbook of the sustainable development goals and international law,” in Cambridge Law Handbooks (Cambridge University Press, Cambridge). doi: 10.1017/9781108769631
Eroldoğan O. T., Glencross B., Novoveska L., Gaudêncio S. P., Rinkevich B., Varese G. C., et al. (2023). From the sea to aquafeed: A perspective overview. Rev. Aquaculture 15, 1028–1057. doi: 10.1111/raq.12740
Gephart J. A., Froehlich H. E., and Branch T. A. (2019). To create sustainable seafood industries, the United States needs a better accounting of imports and exports. Proc. Natl. Acad. Sci. 116, 9142–9146. doi: 10.1073/pnas.1905650116
Gephart J. A., Henriksson P. J. G., Parker R. W. R., Shepon A., Gorospe K. D., Bergman K., et al. (2021). Environmental performance of blue foods. Nature 597, 360–365. doi: 10.1038/s41586-021-03889-2
Glencross B., Rutherford N., and Jones B. (2011). Evaluating options for fishmeal replacement in diets for juvenile barramundi (Lates calcarifer). Aquaculture Nutr. 17, e722–e732. doi: 10.1111/j.1365-2095.2010.00834.x
Gokulakrishnan M., Kumar R., Ferosekhan S., Siddaiah G. M., Nanda S., Pillai B. R., et al. (2023). Bio-utilization of brewery waste (Brewer’s spent yeast) in global aquafeed production and its efficiency in replacing fishmeal: From a sustainability viewpoint. Aquaculture 565, 739161. doi: 10.1016/j.aquaculture.2022.739161
Halpern B. S., Frazier M., Verstaen J., Rayner P.-E., Clawson G., Blanchard J. L., et al. (2022). The environmental footprint of global food production. Nat. Sustain 5, 1027–1039. doi: 10.1038/s41893-022-00965-x
Hammer A. J., Millar C., and Hennige S. J. (2022). Reducing carbon emissions in aquaculture: Using Carbon Disclosures to identify unbalanced mitigation strategies. Environ. Impact Assess. Rev. 96, 106816. doi: 10.1016/j.eiar.2022.106816
Jiang Y., Mathias P. M., Zheng R. F., Freeman C. J., Barpaga D., Malhotra D., et al. (2023). Energy-effective and low-cost carbon capture from point-sources enabled by water-lean solvents. J. Cleaner Production 388, 135696. doi: 10.1016/j.jclepro.2022.135696
Lenzen M., Kanemoto K., Moran D., and Geschke A. (2012). Mapping the structure of the world economy. Environ. Sci. Technol. 46, 8374–8381. doi: 10.1021/es300171x
Lenzen M., Kanemoto K., Moran D., and Geschke A. (2013). Building Eora: A global multi-region input–output database at high country and sector resolution. Economic Syst. Res. 25, 20–49. doi: 10.1080/09535314.2013.769938
Long Y., Yoshida Y., Liu Q., Zhang H., Wang S., and Fang K. (2020). Comparison of city-level carbon footprint evaluation by applying single- and multi-regional input-output tables. J. Environ. Manage. 260, 110108. doi: 10.1016/j.jenvman.2020.110108
Moungsree S., Neamhom T., Polprasert S., Suwannahong K., Polprasert C., and Patthanaissaranukool W. (2024). Greenhouse gas emissions and carbon footprint of maize-based feed products for animal farming in Thailand. Environ. Sci. pollut. Res. 31, 2657–2670. doi: 10.1007/s11356-023-31408-5
Naylor R. L., Hardy R. W., Buschmann A. H., Bush S. R., Cao L., Klinger D. H., et al. (2021). A 20-year retrospective review of global aquaculture. Nature 591, 551–563. doi: 10.1038/s41586-021-03308-6
Parker R. W. R., Blanchard J. L., Gardner C., Green B. S., Hartmann K., Tyedmers P. H., et al. (2018). Fuel use and greenhouse gas emissions of world fisheries. Nat. Clim Change 8, 333–337. doi: 10.1038/s41558-018-0117-x
Parker R. W. R., Vázquez-Rowe I., and Tyedmers P. H. (2015). Fuel performance and carbon footprint of the global purse seine tuna fleet. J. Cleaner Production Carbon Emissions Reduction: Policies Technologies Monitoring Assess. Modeling 103, 517–524. doi: 10.1016/j.jclepro.2014.05.017
Peters G. P. and Hertwich E. G. (2008). CO2 embodied in international trade with implications for global climate policy. Environ. Sci. Technol. 42, 1401–1407. doi: 10.1021/es072023k
Qian Y.-F., Limbu S.M., Qiao F., Luo Y., Chen L.-Q., Zhang M.-L., et al. (2024). Seeking the best alternatives: A systematic review and meta-analysis on replacing fishmeal with plant protein sources in carnivorous fish species. Rev. Aquac. 16, 1099–1126. doi: 10.1111/raq.12888
Rajamani L. (2016). The 2015 Paris agreement: interplay between hard, soft and non-obligations. J. Environ. Law 28, 337–358. doi: 10.1093/jel/eqw015
Ruiz-Salmón I., Laso J., Margallo M., Villanueva-Rey P., Rodríguez E., Quinteiro P., et al. (2021). Life cycle assessment of fish and seafood processed products - A review of methodologies and new challenges. Sci. Total Environ. 761, 144094. doi: 10.1016/j.scitotenv.2020.144094
Smarason B. O., Ogmundarson O., Arnason J., Bjornsdottir R., and Daviosdottir B. (2017). Life cycle assessment of Icelandic arctic char fed three different feed types. Turk. J. Fish. Aquat. Sci. 17 (79-90). doi: 10.4194/1303-2712-v17_1_10
Sturla G., Ciulla L., and Rocchi B. (2023). Natural and social scarcity in water Footprint: A multiregional input–output analysis for Italy. Ecol. Indic. 147, 109981. doi: 10.1016/j.ecolind.2023.109981
Sun Y.-Y., Cadarso M. A., and Driml S. (2020). Tourism carbon footprint inventories: A review of the environmentally extended input-output approach. Ann. Tourism Res. 82, 102928. doi: 10.1016/j.annals.2020.102928
Teh L. C. L. and Sumaila U. R. (2013). Contribution of marine fisheries to worldwide employment. Fish Fisheries 14, 77–88. doi: 10.1111/j.1467-2979.2011.00450.x
Tran N., Ogello E., Outa N., Muthoka M., and Hoong Y. (2023). Promising aquaculture technologies and innovations for transforming food systems toward low emission pathways in Kenya: A review. Available online at: https://cgspace.cgiar.org/items/b0163be0-3248-4b40-bd16-92682a3c715d.
Tseng M.-L., Chiu A. S. F., Liu G., and Jantaralolica T. (2020). Circular economy enables sustainable consumption and production in multi-level supply chain system. Resources Conserv. Recycling 154, 104601. doi: 10.1016/j.resconrec.2019.104601
Tukker A., Bulavskaya T., Giljum S., de Koning A., Lutter S., Simas M., et al. (2016). Environmental and resource footprints in a global context: Europe’s structural deficit in resource endowments. Global Environ. Change 40, 171–181. doi: 10.1016/j.gloenvcha.2016.07.002
UNFCCC (1992). Treaty series (United Nations Framework Convention on Climate Change). Available online at: https://unfccc.int (Accessed July 13, 2025).
Vázquez-Rowe I., Moreira M. T., and Feijoo G. (2012). Environmental assessment of frozen common octopus (Octopus vulgaris) captured by Spanish fishing vessels in the Mauritanian EEZ. Mar. Policy 36, 180–188. doi: 10.1016/j.marpol.2011.05.002
Wang T. and Gao X. (2018). Reflection and operationalization of the common but differentiated responsibilities and respective capabilities principle in the transparency framework under the international climate change regime. Adv. Climate Change Res. 9, 253–263. doi: 10.1016/j.accre.2018.12.004
Wei C., Zhang M., Chen W., Ge Y., Wang D., Zhang D., et al. (2023). After the pandemic: the global seafood trade market forecasts in 2030. Humanit Soc. Sci. Commun. 10, 1–13. doi: 10.1057/s41599-023-02070-6
Wilting H. C., Schipper A. M., Bakkenes M., Meijer J. R., and Huijbregts M. A. J. (2017). Quantifying biodiversity losses due to human consumption: A global-scale footprint analysis. Environ. Sci. Technol. 51, 3298–3306. doi: 10.1021/acs.est.6b05296
Xu C., Su G., Zhao K., Kong X., Wang H., Xu X., et al. (2023). Societal benefits and environmental performance of Chinese aquaculture. J. Cleaner Production 422, 138645. doi: 10.1016/j.jclepro.2023.138645
Zhang Y., Rasul K., Verones F., and Hertwich E. (2025). Quantifying the differences between EXIOBASE and FABIO for land use footprint studies: the case of beef consumption in six selected countries. Environ. Res.: Food Syst. 2, 035002. doi: 10.1088/2976-601X/ade71e
Keywords: fisheries, production, consumption, carbon footprint, inter-sector carbon flow, the principle of common but differentiated responsibilities (CBDR)
Citation: Wang C, Liu X, Li K, Wei C and Xie M (2025) Inter-sectoral dynamics of the global fisheries carbon footprint: a multi-regional input-output analysis within the principle of common but differentiated responsibilities. Front. Mar. Sci. 12:1563747. doi: 10.3389/fmars.2025.1563747
Received: 22 January 2025; Accepted: 13 October 2025;
Published: 24 October 2025.
Edited by:
Stephen J. Newman, Western Australian Fisheries and Marine Research Laboratories, AustraliaReviewed by:
Yidan Xu, Maastricht University, NetherlandsJiawen Liu, University of Portsmouth, United Kingdom
Copyright © 2025 Wang, Liu, Li, Wei and Xie. This is an open-access article distributed under the terms of the Creative Commons Attribution License (CC BY). The use, distribution or reproduction in other forums is permitted, provided the original author(s) and the copyright owner(s) are credited and that the original publication in this journal is cited, in accordance with accepted academic practice. No use, distribution or reproduction is permitted which does not comply with these terms.
*Correspondence: Chunzhu Wei, d2VpY2h6aEBtYWlsLnN5c3UuZWR1LmNu