Abstract
Myostatin (Mstn), a negative regulatory factor in myocytes, has garnered significant attention. This study focused on the Mstn gene and its 24-base-pair mutant in the promoter region of the giant freshwater prawn (Macrobrachium rosenbergii), aiming to investigate the regulatory roles of Mstn and its mutant in M. rosenbergii. The research provides theoretical insights into the functional mechanisms of Mstn in crustaceans. Spatiotemporal expression patterns revealed Mstn presence throughout embryonic development and in various body tissues, with peak expression during the gastrula stage and in the hepatopancreas. During the molting cycle, Mstn expression levels decreased in the order of post-molt (A phase), pre-molt (D3 phase), and molting (E phase). Knockdown experiments targeting two genotypes within the Mstn promoter region significantly reduced growth rates and extended molting cycles compared to control group. Further trials on the F2 generation confirmed these findings, highlighting that promoter knockdown influenced the expression of three molting-related genes and slowed the growth rate of M. rosenbergii. This study clarifies the functional role of Mstn in crustacean growth and molting, providing a foundation for understanding its regulatory mechanisms and offering potential applications in aquaculture.
1 Introduction
Myostatin (Mstn), a key regulatory factor in skeletal muscle development, belongs to the Transforming Growth Factor beta (TGF-β) superfamily and encodes a class of secreted polypeptides (Beyer et al., 2013). The Mstn gene is highly conserved, comprising three exons and two introns, with exons encoding a 375-amino acid protein that becomes biologically active following post-translational modifications (Wolfman et al., 2003). Its regulatory pathway involves binding of the C-terminal mature fragment to activin type II receptors on the cell surface, initiating an intracellular signaling cascade. This process includes autophosphorylation of the activin receptor type IIB, recruitment of type I receptors (activin receptor-like kinase 4 [ALK4] and activin receptor-like kinase 5 [ALK5]), and phosphorylation of Smad2 and Smad3. The phosphorylated Smad proteins then form complexes with Smad4, translocating to the nucleus to activate the transcription of target genes (Wang et al., 2019). Studies have shown that ectopic expression of Mstn downregulates the key muscle precursor marker gene Pax-3, essential for muscle precursor proliferation, while upregulating p21, ultimately inhibiting myoblast proliferation (Amthor et al., 2002; Thomas et al., 2000). Moreover, elevated Mstn expression can induce erroneous differentiation via overactivation of myogenic differentiation antigen (MyoD) (Thomas et al., 2000). In summary, Mstn plays a central role in regulating myocyte proliferation, differentiation and muscle generation (Aiello et al., 2018; Amthor et al., 1999).
Genetic variations in the Mstn gene, including deletions, insertions, and Single Nucleotide Polymorphisms (SNPs), significantly influence muscle growth by promoting increased muscle mass and reduced fat mass, resulting in the “double-muscled” phenotype (Deng et al., 2017). For instance, a point mutation in the Mstn gene of Blonde d’Aquitaine cattle produces a stop codon, leading to a truncated, non-functional protein and muscular hypertrophy (Bouyer et al., 2014). Similarly, a mutation at the 49th amino acid of the Mstn gene in Spælsau ram lambs produces a defective Mstn protein, causing increased muscle mass and reduced fat (Boman and Våge, 2009). Comparable mutations have been identified as primary causes of muscle hypertrophy in various species, including pigs (Qian et al., 2015), rabbits (Lv et al., 2016), dogs (Mosher et al., 2007), mice (Matsakas et al., 2010), zebrafish (Acosta et al., 2005), and yellow catfish (Zhang et al., 2020). In addition to regulating the proliferation and differentiation of myocytes, Mstn exhibits other physiological functions. For instance, deletion of the Mstn gene in pigs alters intestinal structure and barrier integrity, reshapes gut microbiota composition (Qin et al., 2017), and in mammals, Mstn plays critical roles in adipocyte differentiation, lipid metabolism, and osteogenesis (Deng et al., 2017; Luo et al., 2023). In crustaceans, Mstn appears to influence molting processes (Zhuo et al., 2017), suggesting its functional diversity across species.
Molting, a key determinant of growth in crustaceans, is a cyclic process that drives stepwise growth throughout their development (Li et al., 2014). The Mstn gene has been shown to influence both muscle development and molting cycles in crustaceans. For instance, differential Mstn expression across molting stages in Homarus americanus underscores its relevance to molting regulation (MacLea et al., 2010). In Litopenaeus vannamei, injection of Mstn dsRNA delayed molting by 1.8 days, indicating that Mstn contributes to extended molting cycles in shrimp (Lee et al., 2015). Similarly, Mstn knockdown in Fenneropenaeus merguiensis significantly prolonged the molting cycle, with some individuals failing to molt entirely (Zhuo et al., 2017). These results indicate that Mstn exhibits stage-specific expression patterns and its knockdown can alter the molting cycle. Despite these insights, the molecular regulatory mechanisms of Mstn in crustaceans remain largely unexplored.
The giant freshwater prawns (Macrobrachium rosenbergii, Mr) is one of the largest freshwater shrimp species globally, valued for its economic and farming potential. According to the 2024 China Fisheries Statistical Yearbook, the farming output of M. rosenbergii exceeded 196,300 tons in 2023 (Ministry of Agriculture and Rural Affairs of the People's Republic of China, 2024). To date, only two studies have investigated the Mstn gene in M. rosenbergii. Sarasvathi et al. successfully cloned and characterized the Mstn gene in M. rosenbergii, revealing its conserved features as a member of the TGF-β superfamily and its high expression in muscle and other tissues. Notably, they observed a significant upregulation of Mstn expression following infection with infectious hypodermal and hematopoietic necrosis virus (IHHNV), suggesting its potential role in muscle growth suppression and infection-associated growth impairment (Sarasvathi et al., 2015). Further work demonstrated that Mstn knockdown enhanced muscle regeneration in M. rosenbergii (Easwvaran et al., 2019). Current research on the function of Mstn at different molting stages, embryonic development periods, and its role in the growth of M. rosenbergii remains limited. Interestingly, during our investigation of the Mstn gene cDNA in M. rosenbergii, we identified a natural 24-bp mutation in the promoter 5’UTR region (533–557 bp). However, the molecular regulatory mechanisms of this mutation in the growth and molting of M. rosenbergii remain unclear. Therefore, this study aimed to elucidate the molecular regulatory mechanisms of Mstn and its mutants in M. rosenbergii, thereby providing a foundation for understanding Mstn’s role in crustaceans.
2 Materials and methods
2.1 Primer design
We used the transcriptome data of M. rosenbergii (GenBank No: PRJNA884099) to screen the cDNA sequence of the Mstn gene (Figure 1). Specific primers for the target gene Mstn, the reference gene β-actin, and molting-related genes (Retinoid-X receptor, Krüppel-homolog1, and Ecdysone Receptor) were designed using Primer Premier 5.0 (Premier, Canada) (Table 1). The standard for primer design is as follows: the melting temperature should be between 60°C and 65°C, and the GC content should be between 50% and 55%. It is important to avoid the formation of secondary structures as much as possible.
Figure 1
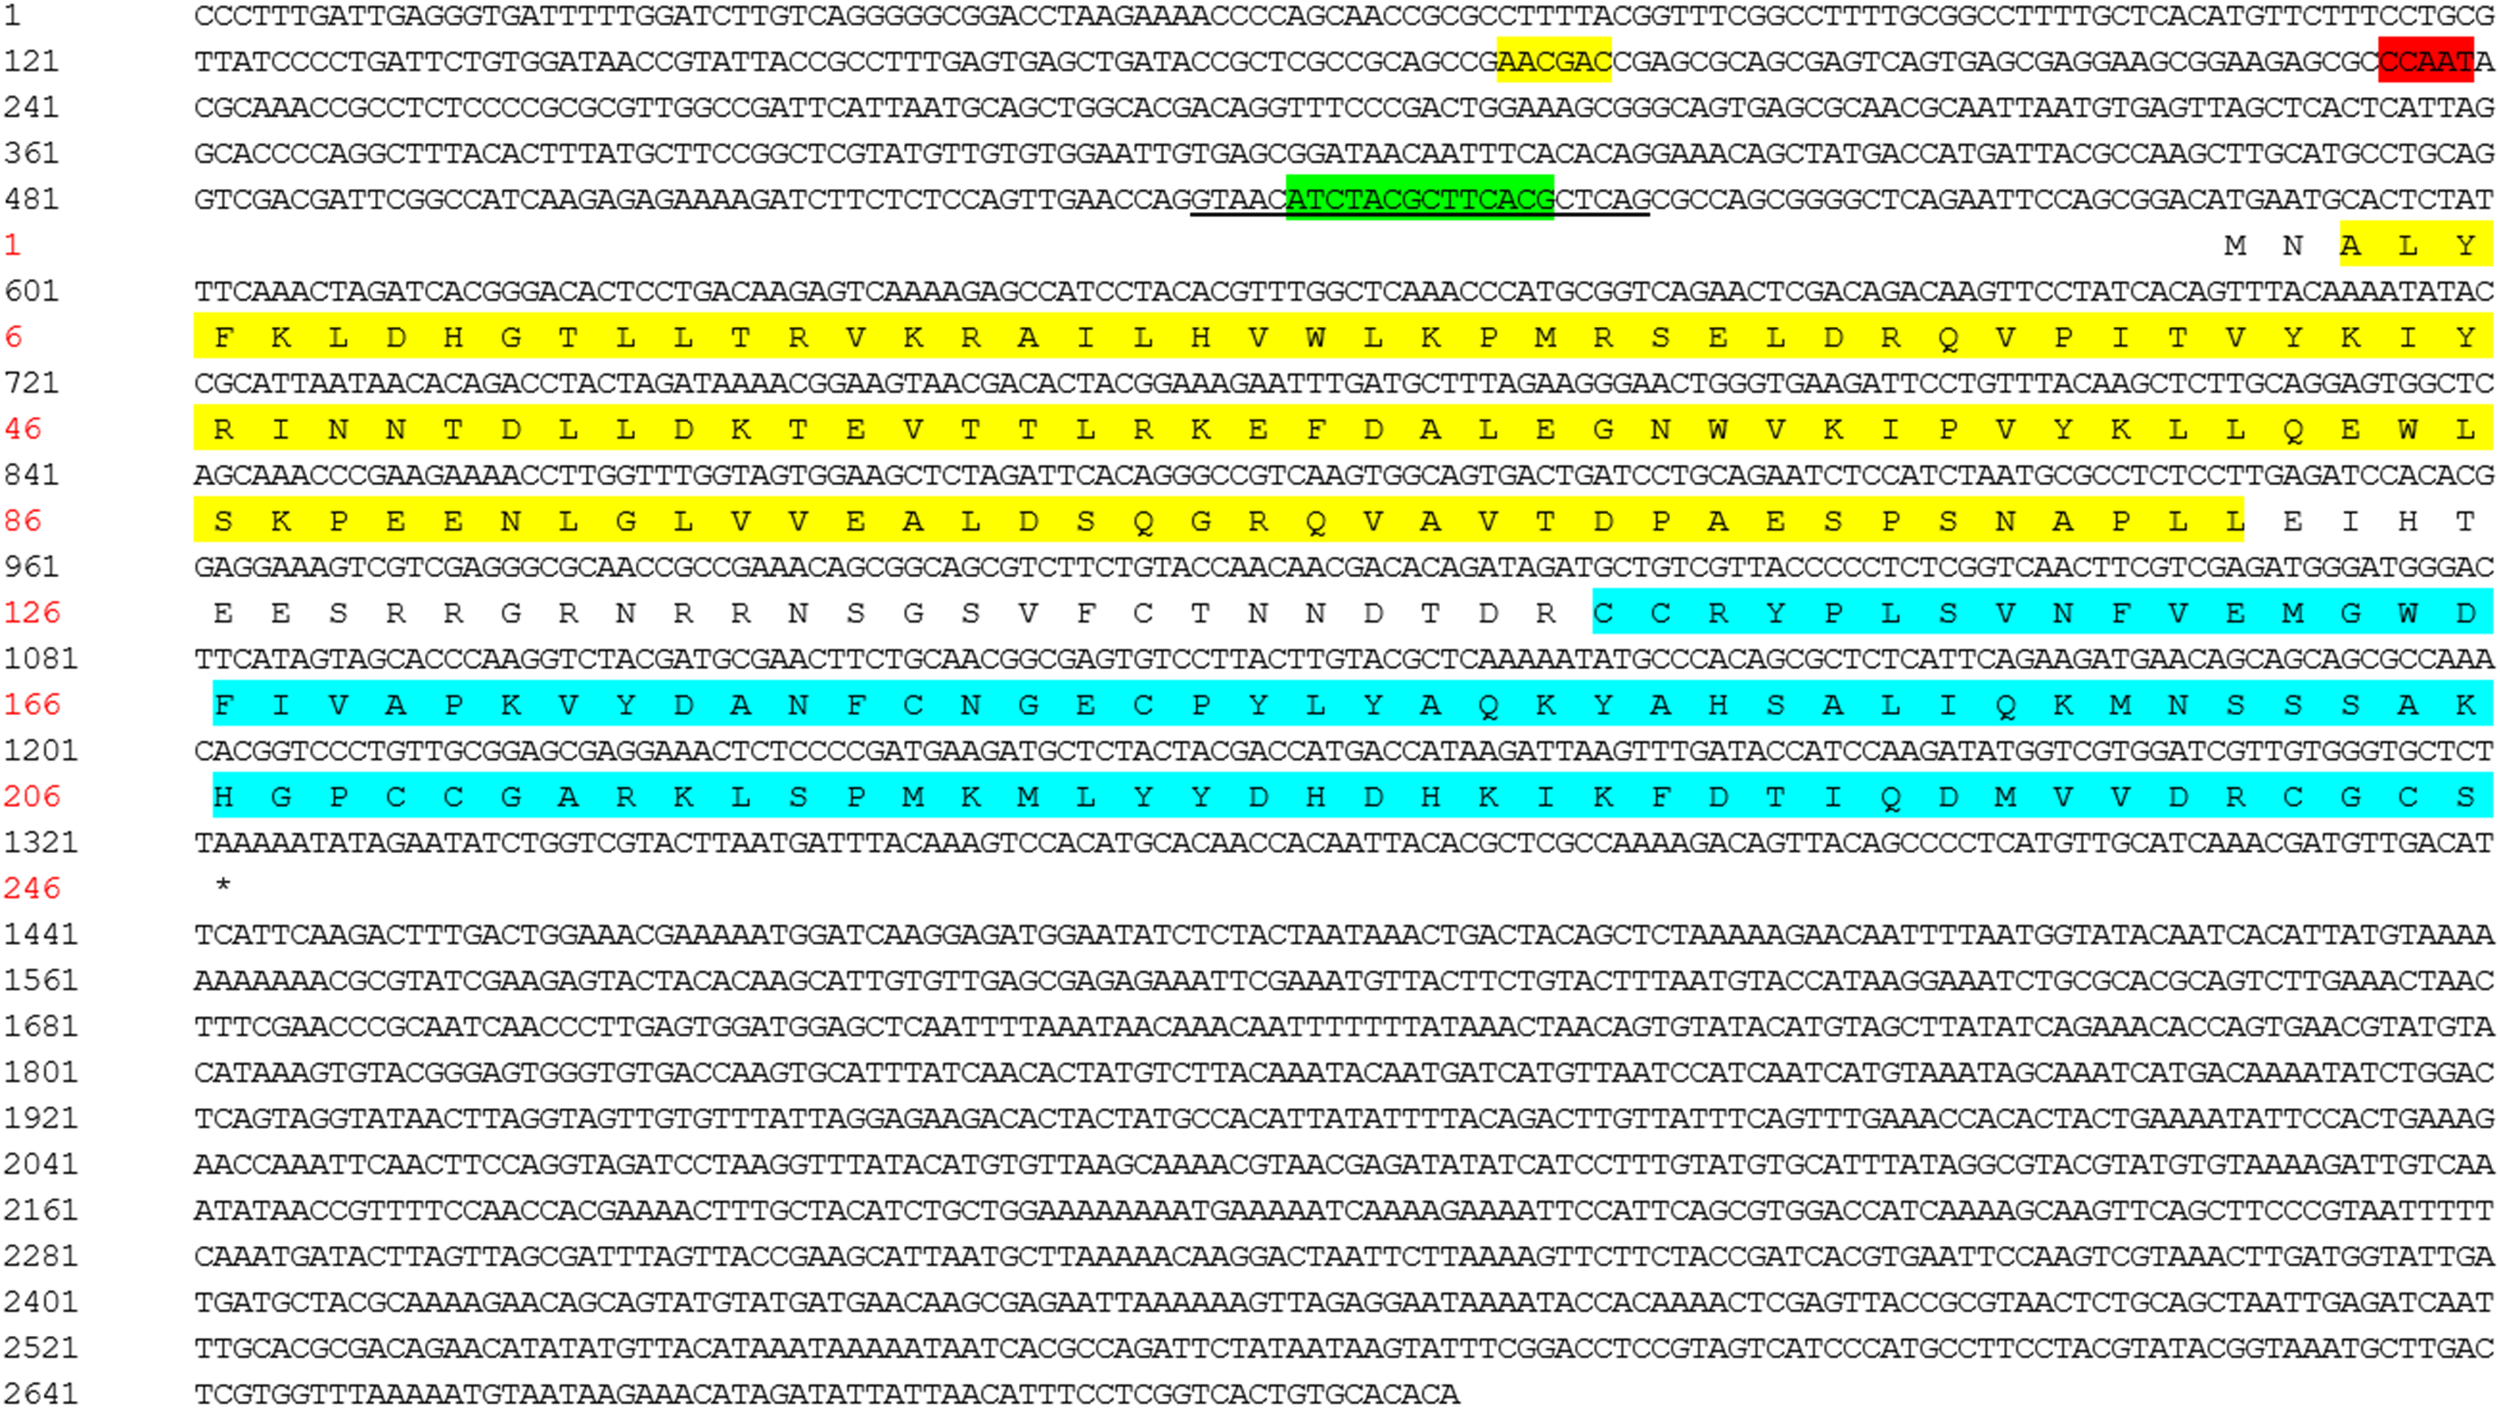
The nucleotide and inferred amino acid sequences of MrMstn cDNA. The black numbers on the left side of each line represent the positions of nucleotides, while the red numbers represent the positions of amino acids. The yellow highlighted areas in the promoter region are predicted auxin response elements, the red highlighted areas are common cis-acting elements in the promoter and enhancer regions, the green highlighted areas are short sequence elements, and the underlined areas indicate a 24 bp deletion region. In the amino acid region, the yellow highlighted areas are the TGF-β propeptide regions, and the blue highlighted areas are the mature TGF-β regions.
Table 1
| Primer | Sequence (5'–3') | Source | Annealing temperature | Application |
|---|---|---|---|---|
|
Mstn F1 Mstn R1 |
CGGCCATCAAGAGAGAAAAG GGGGGTAACGACAGCATCTA |
PRJNA884099 | 57°C | PCR, dsRNA synthesis |
|
Mstn qF1 Mstn qR1 |
TAGTAGCACCCAAGGTCTACGA TAAGAGCACCCACAACGATCCA |
PRJNA884099 | 60°C | qPCR |
|
β-actin qF1 β-actin qR1 |
CAGGGAAAAGATGACCCAGA GGAAGTGCATACCCCTCGTA |
AY626840 | 60°C | qPCR |
|
Krüppel-homolog1 qF1 Krüppel-homolog1 qR1 |
TCTCCTCTACCCCCTTAACT AATTGAAGACATCGTTGGGG |
MN545962.1 | 60°C | qPCR |
|
Ecdysone Receptor qF1 Ecdysone Receptor qR1 |
ACAGTTCAGCTCATAGTGGA CTCTCAGCATCATCACTTCG |
XM_067081775.1 | 60°C | qPCR |
|
Retinoid-X receptor qF1 Retinoid-X receptor qR1 |
GATCGGCAGTCCCCTTTGAA TTGGACACACTGGGAGAAGC |
XM_067084537.1 | 60°C | qPCR |
All primers used in this study.
2.2 Sample collection and spatiotemporal expression detection of MrMstn
Seven tissues were collected from M. rosenbergii (mean body weight 5 ± 0.32 g), including the brain (including the protocerebrum, deutocerebrum, and tritocerebrum), stomach, intestine, heart, hepatopancreas, muscle, and gonads, for detection of Mstn expression across different tissues. Additionally, samples were taken from nine different embryonic developmental stages: unfertilized eggs, fertilized eggs, cleavage stage (8 cells), early multicellular morula (64 cells), early multicellular blastula (128 cells), blastula stage (256 cells), gastrula stage, and larval stage, as described by Zhao’s method (Zhao et al., 1998) to assess Mstn expression during these stages. in M. rosenbergii. Muscle tissue samples from seven distinct molting stages—pre-molt (D1, D2, and D3 stages), molt (E stage), post-molt (A stage: 0–5 hours; B stage: 5–24 hours), and intermolt (C stage)—were collected and classified according to the method described by Lu (Lu et al., 2018). According to the findings of Covi et al. (2010), the thoracic muscle between the first and second abdominal segments was selected as the muscle tissue sampling site. Prior to sampling, the integrity of the thoracic appendage was confirmed using a stereomicroscope (Nikon, Tokyo Japan) to prevent gene expression alterations caused by muscle unloading (the same applies to subsequent procedures). For detecting Mstn expression levels in M. rosenbergii across different molting stages. Total RNA was extracted from the samples, and cDNA reverse transcription and fluorescence quantitative PCR were performed according to the protocol by Wang (Wang et al., 2023). Samples were collected in accordance with the animal collection guidelines established by the Animal Experiment Ethics Committee of the Pearl River Fisheries Research Institute, with full respect for animal welfare.
2.3 Synthesis and injection of MrMstn dsRNA in M. rosenbergii
Utilizing the upstream primer F1 and downstream primer R1 of the Mstn gene, the target fragment from the Mstn 5’UTR region was PCR-amplified. The resulting fragment was ligated into the T7 vector (TaKaRa, China) and transformed into competent Escherichia coli DH5α cells (TaKaRa, China). Positive monoclonal vectors, both normal and mutated, were screened, sequenced, and confirmed. Normal Mstn dsRNA (N-Mstn dsRNA) and mutated Mstn dsRNA (D-Mstn dsRNA) were synthesized using the T7 RNAi Transcription Kit (Vazyme Biotech, China) and stored at -80°C for subsequent RNAi experiments. All injections were performed under a stereomicroscope (Nikon, Tokyo Japan), with the injection site located between the first and second abdominal segments.
2.4 Detection of optimal time effect and injection dosage of RNAi
M. rosenbergii (mean body weight 0.86 ± 0.12 g) were injected with normal and mutated dsRNA at a concentration of 5 µg/g, while the control group received DEPC water. Based on previous studies, muscle samples were collected on days 1, 3, 5, 7, and 14, muscle tissue samples were collected from the thoracic muscle of M. rosenbergii during the intermolt stage, following the methodology established by Covi (Covi et al., 2010) (The same applies hereinafter). Total RNA was extracted, reverse transcribed into cDNA, and stored at -20°C for time-dependent detection of Mstn dsRNA expression.
Based on the optimal temporal efficacy results, control dsRNA was administered at six concentrations (0, 5, 10, 20, 40, and 100 µg/g) via injection to juvenile M. rosenbergii (body weight: 0.86 ± 0.12 g) during the intermolt stage. and after 48 h, total RNA was extracted from muscle samples, reverse transcribed into cDNA, and stored at -20°C to determine the optimal concentration of Mstn dsRNA.
2.5 The impact of the mutated region of MrMstn on growth and molting-related genes in M. rosenbergii
Based on the outcomes of the RNAi time-course and dose-response experiments, juvenile M. rosenbergii (0.02 ± 0.00g) were injected with normal and mutant MrMstn dsRNA at a concentration of 5 µg/g. The control group received DEPC water injections. The injection protocol followed the procedure described in Section 2.3, with injections administered weekly for 8 weeks. Post-injection, the shrimp were reared under standard conditions until they reached sexual maturity at 180 days. Subsequently, sexually mature M. rosenbergii from each group were paired and spawned to produce F2 larvae. The F2 larvae (1.01 ± 0.07g) were injected with the corresponding dsRNA: F2 larvae from the normal RNAi group received normal dsRNA, those from the mutant RNAi group received mutant dsRNA, and the control group larvae were injected with DEPC water. These injections were administered at 5 µg/g, following the same method described in Section 2.3, and repeated weekly for 8 weeks. The cultivation period lasted 8 weeks.
During the dsRNA injection periods for both the F1 and F2 generations, body weight measurements of M. rosenbergii were recorded weekly. For the F1 generation, body weight was reassessed at 24 weeks of age. Hepatopancreas tissues from 8-week-old F1 M. rosenbergii were collected to analyze for expression levels of three molting-related genes: Krüppel-homolog1(Kr-h1), Retinoid-X receptor(RXR), and Ecdysone Receptor(EcR) (primer sequences are shown in Table 1). For the F2 generation, hepatopancreas tissues and body weights were measured at 8 weeks, and the hepatosomatic index (HSI) was calculated as:
Where WL represents the hepatopancreas weight and WS denotes the body weight of the sampled shrimp.
2.6 Histological analysis
Muscle samples from F2 generation M. rosenbergii were collected at 8 weeks (sampling location: between the first and second abdominal segments). The samples were fixed in 4% paraformaldehyde, dehydrated, and embedded in paraffin. Using an RM (2016) microtomes (Leica, Weztlar, Germany), paraffin sections were cut at a thickness of 5 µm. The sections were deparaffinized and rehydrated with xylene and ethanol, stained with hematoxylin-eosin (HE) solution (Nanjing Jiancheng Bioengineering Institute, Nanjing, China), and sealed with neutral resin. Tissue images were obtained using a PANNORAMIC panoramic slide scanner (3DHISTECH, Hungary), and analyzed with CaseViewer 2.4 software (3DHISTECH, Hungary). Five random fields of view from each section were analyzed using Image-Pro Plus 6.0 software (Media Cybemetics, USA). The average muscle fiber area and muscle fiber density were calculated as follows:
2.7 The impact of the MrMstn gene on the molting cycle
Pre-molt stage M. rosenbergii (2.73 ± 0.99 g) were injected with normal dsRNA, mutant dsRNA, or DEPC water at a dosage of 5 µg/g. Injection were administered weekly over a rearing period spanning two molting cycles (approximately 3 weeks). Each shrimp was housed separately in a 10×10×10 cm cage. Daily observations were recorded to monitor molting status, and the molting cycles of the M. rosenbergii in each group were subsequently analyzed.
2.8 Statistical analysis
Data were analyzed using SPSS software (version 24.0; SPSS Corp., Armonk, NY, USA). One-way analysis of variance (ANOVA) was used to compare the differences among the treatment groups, with the results expressed as the mean ± standard error. The 2-ΔΔCt method was used to calculate mRNA abundance (Livak and Schmittgen, 2001). Statistical significance was defined as follows:
-
p > 0.05: no significant difference.
-
p< 0.05: significant difference.
3 Results
3.1 MrMstn cDNA and mutant sequences
The full-length cDNA sequence of the Mstn gene in M. rosenbergii measures 2,706 bp and includes an open reading frame of 738 bp, encoding 246 amino acids. The 5’ UTR spans 585 bp, and the 3’ UTR is 1,383 bp long. The encoded sequence contains a 119-amino-acid signal peptide domain and a 96-amino-acid TGF-β mature peptide domain. Sequence alignment of MrMstn cDNA revealed two isoforms: a shorter transcript lacking a 24-bp segment (533–557 bp) in the 5’UTR region compared to the longer one, with the deleted sequence encompassing a short motif (ATCTACGCTTCACG) (Figure 1).
3.2 Spatiotemporal expression analysis of the MrMstn gene in M. rosenbergii
The Mstn gene expression was highest in the hepatopancreas, followed by muscle, heart, brain, intestine, gill, and gonad tissues (Figure 2A). During different embryonic developmental stages, the expression level of this gene remained low from the unfertilized egg stage to the blastocyst stage, then significantly increased to its peak during the gastrula stage (p< 0.05). During the larval stage, the gene expression stabilized at a consistent level (Figure 2B). Thoracic muscle tissue samples were collected from M. rosenbergii at different molting stages to analyze the expression levels of Mstn. The results demonstrated that Mstn expression was significantly elevated in the late A phase (0–5 hours post-molt) but rapidly decreased in the B phase (24–48 hours post-molt) to levels similar to the intermolt phase (p < 0.05). Expression remained low until the D2 phase of pre-molt, with a slight increase observed during the D3 and E phases (Figure 2C).
Figure 2
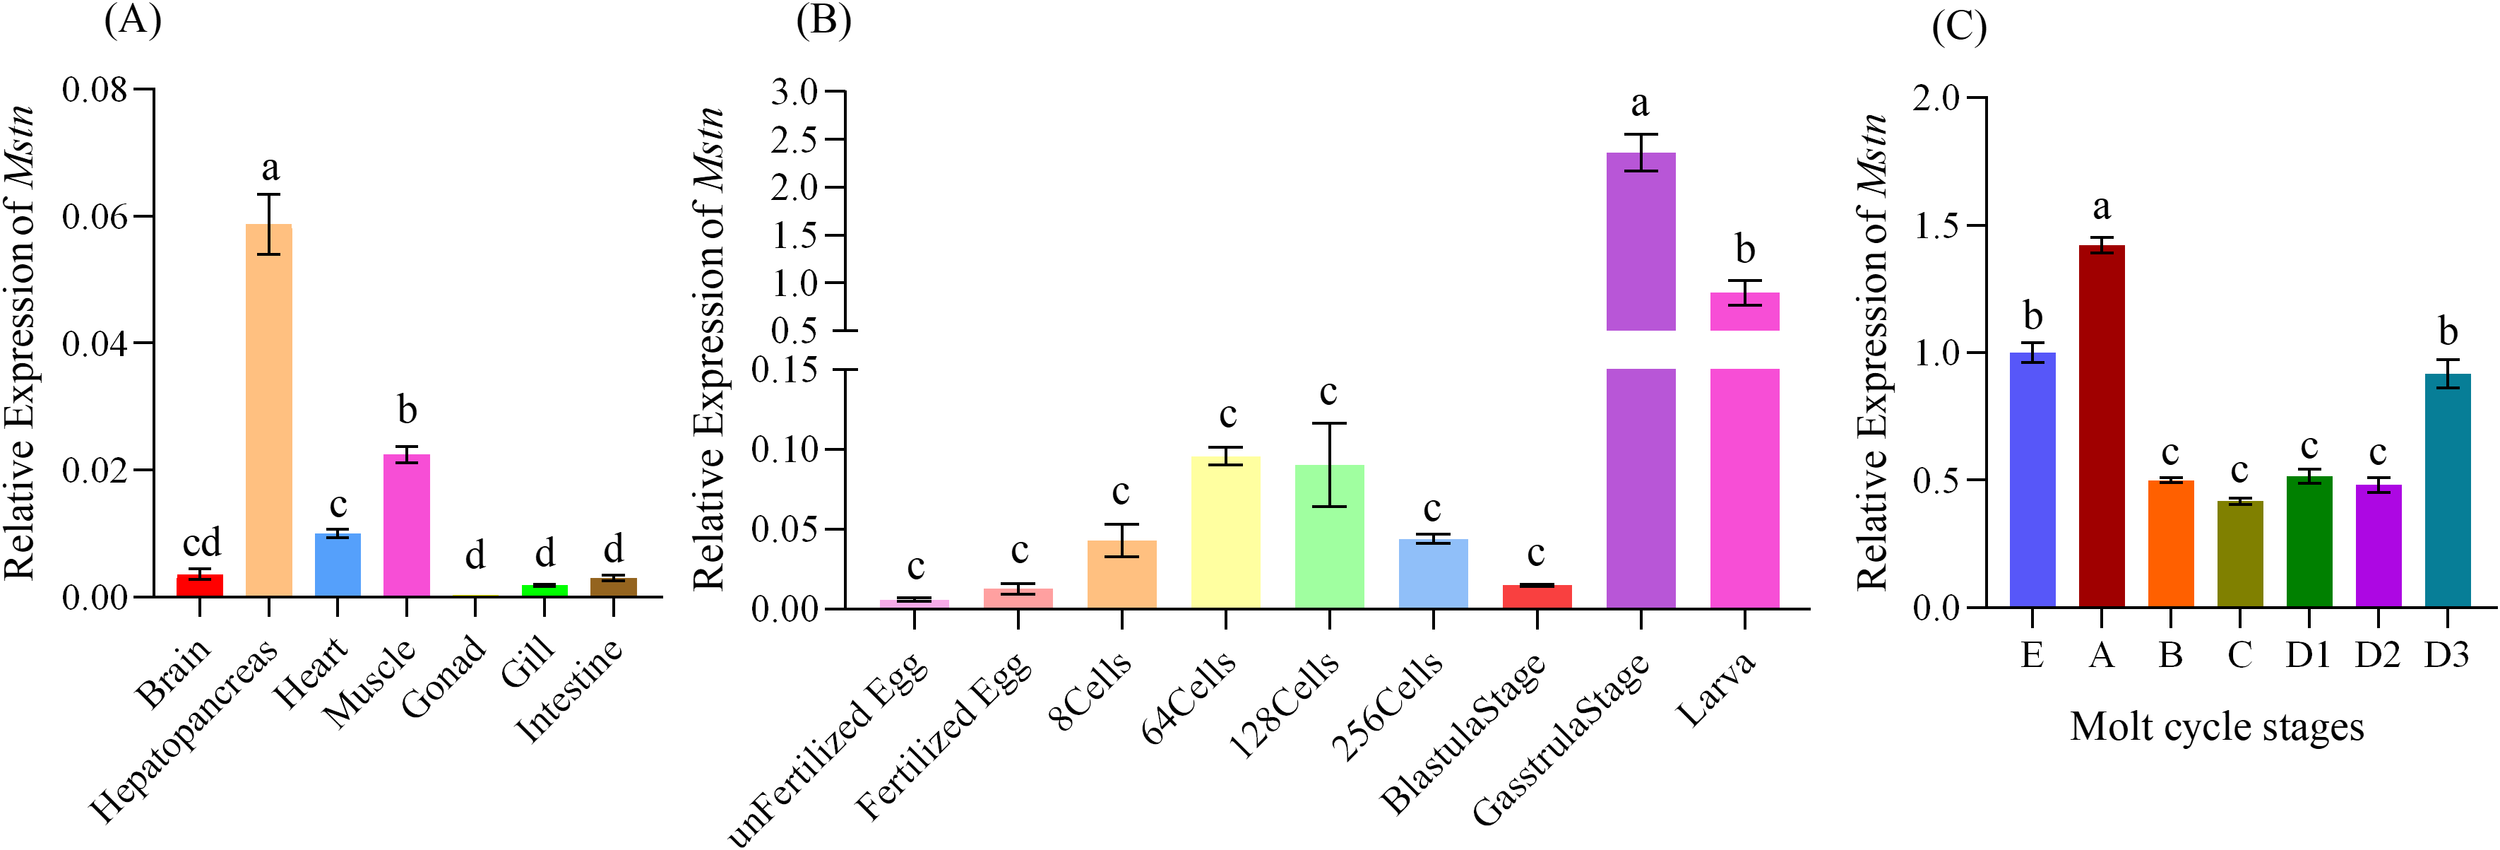
The spatiotemporal expression of MrMstn in M. rosenbergii.(A) Expression levels of Mstn among different tissues, (B) Expression levels of Mstn across nine distinct embryonic stages. (C) Expression levels of Mstn during various molting stages, with each letter representing specific phases: E: Molting stage; A and B: Post-molting stage; C: Inter-molting stage; D1, D2, and D3: Pre-molting stage, the thoracic muscle tissue of M. rosenbergii was sampled. Different letters indicate significant differences between experimental groups at the same time point (p< 0.05).
3.3 Time and dose effects of MrMstn dsRNA interference
To investigate the optimal temporal efficacy and dosage effects of MrMstn dsRNA, varying concentrations of dsRNA were administered via injection to juvenile M. rosenbergii during the intermolt stage. The RNAi time-course experiments demonstrated that both normal and mutant dsRNA significantly reduced Mstn expression levels at 1, 3, and 5 days post-injection (p< 0.01). By day 7, the mutant dsRNA group maintained significantly reduced Mstn expression levels (p< 0.01), while the normal dsRNA group showed a reduction in Mstn expression to 72.12%, which was not statistically significant. By day 14, no significant differences in Mstn expression levels were observed among the groups (p > 0.05) (Figure 3A). Dose-response experiments revealed that injecting various concentrations of dsRNA into M. rosenbergii resulted in dose-dependent reductions in Mstn expression at 48 h post-injection. The high-dose groups (40 µg/g and 100 µg/g) significantly reduced Mstn expression levels (p< 0.05), while the low-dose groups (5 µg/g, 10 µg/g, and 20 µg/g) achieved significant reductions (p< 0.01), Remarkably, the lowest dose of 5 µg/g achieved an 85.38% reduction in Mstn expression, demonstrating the highest RNAi efficiency among tested concentrations (Figure 3B).
Figure 3
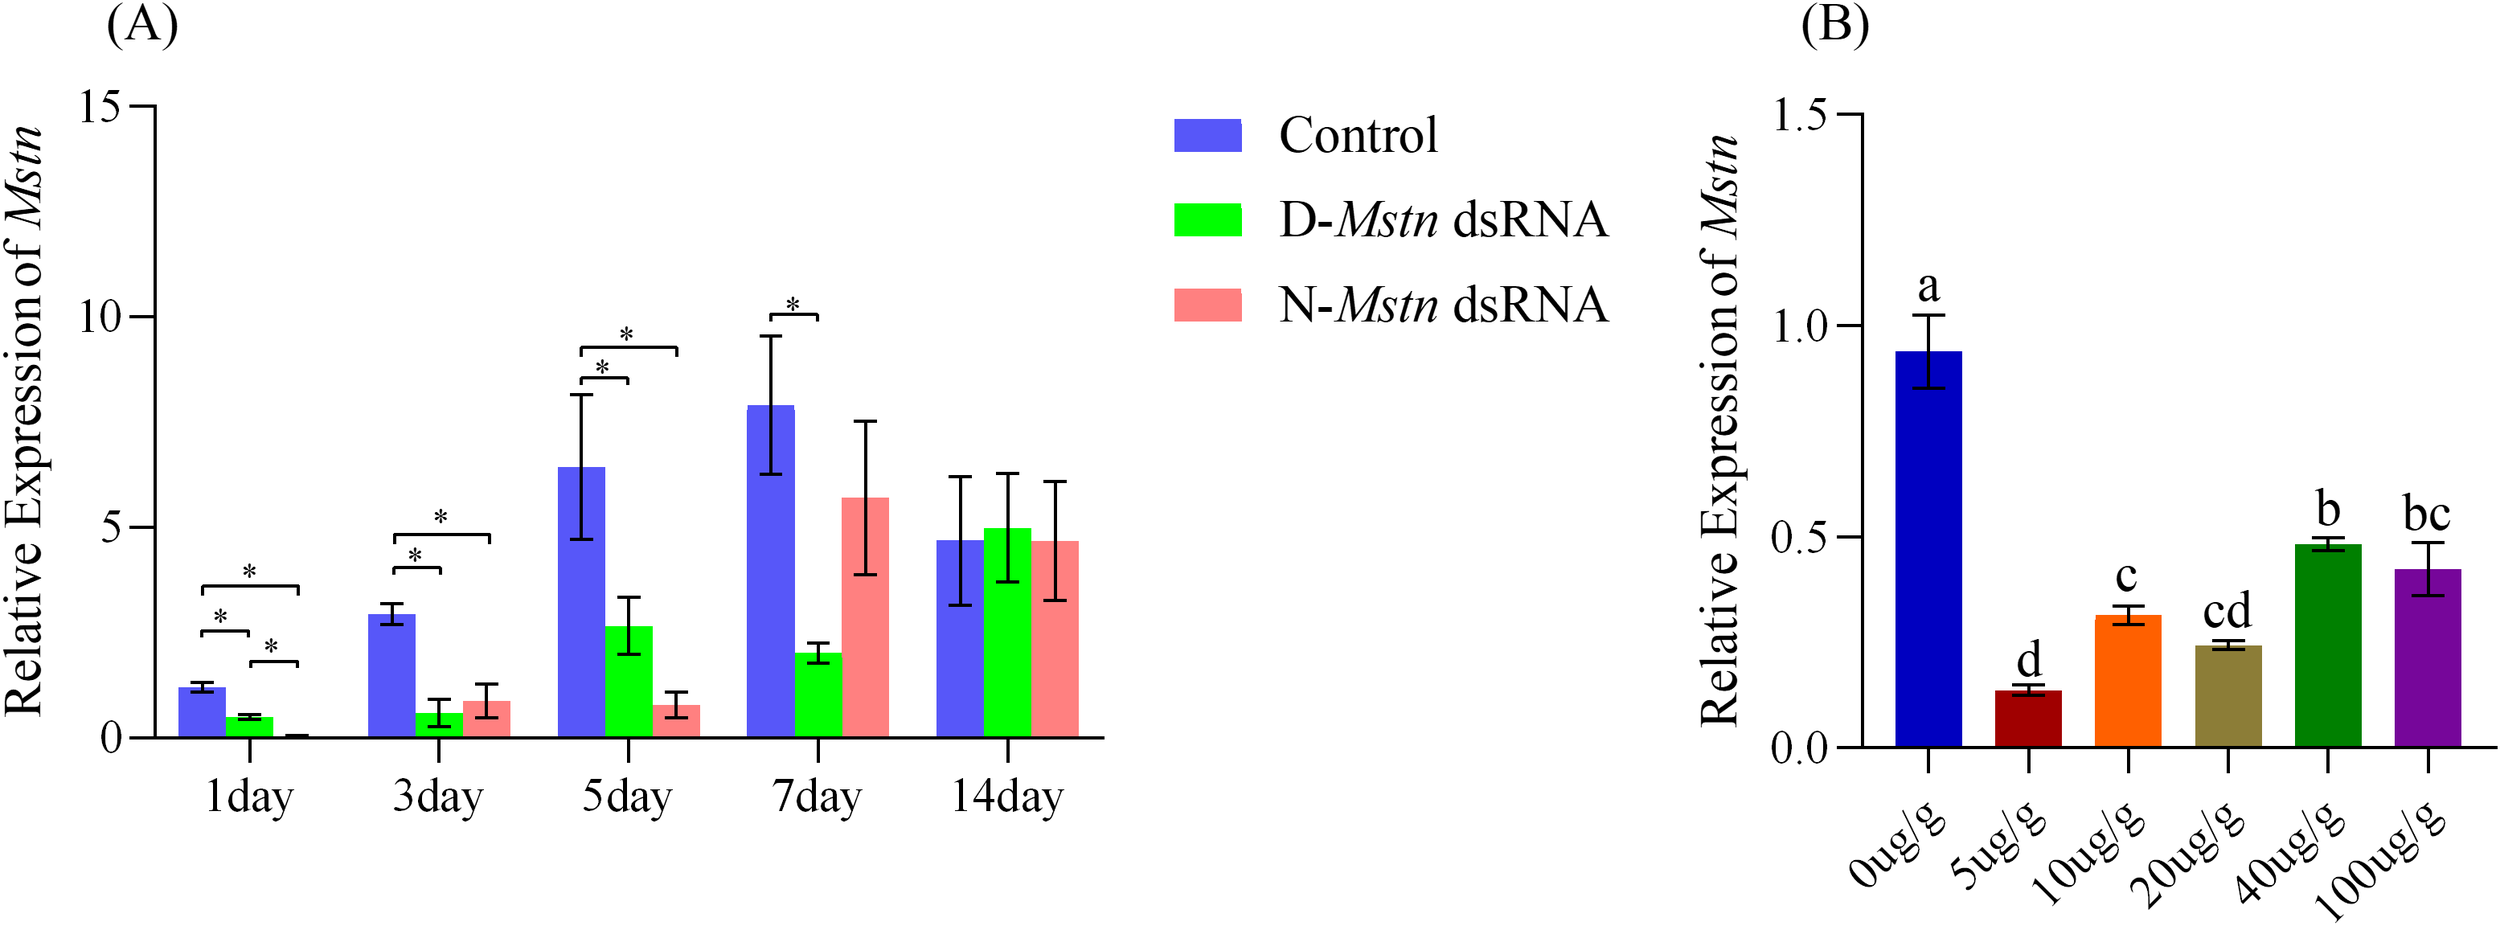
Temporal and dose-dependent effects of MrMstn dsRNA injection in juvenile M. rosenbergii during the intermolt stage. (A) Mstn expression levels at 1, 3, 5, 7, and 14 days post-injection of dsRNA; (B) Mstn expression levels following injection of dsRNA at five different concentrations. Different superscript letters and asterisks (*) between groups indicate statistically significant differences (P< 0.05) among experimental groups at the same time point.
3.4 The impact of MrMstn interference on the growth of different generations of M. rosenbergii
The growth analysis of M. rosenbergii subjected to continuous Mstn gene interference over eight weeks revealed no significant differences in shrimp weight between the mutant interference group, the normal interference group, and the control group during weeks 1 to 5 (p > 0.05). From the 6th week onward, the weight of M. rosenbergii in the mutant interference group became significantly lower than that in the normal interference and control groups (p< 0.05). Between weeks 7 and 8, the control group exhibited significantly higher weights than the normal interference group (p< 0.05) and markedly higher weights than the mutant interference group (p< 0.01). By week 8, the shrimp weight in the control group was 45.67% higher than that in the normal interference group and 66.67% higher than that in the mutant interference group (Figure 4A). Shrimp grown without interference for 24 weeks showed normal development, with the control group reaching an average weight of 23.80 ± 3.24 g. In contrast, the mutant interference group and the normal interference group recorded significantly lower weights, at 8.00 ± 1.03 g and 8.94 ± 2.14 g, respectively (p< 0.05) (Figure 4B).
Figure 4
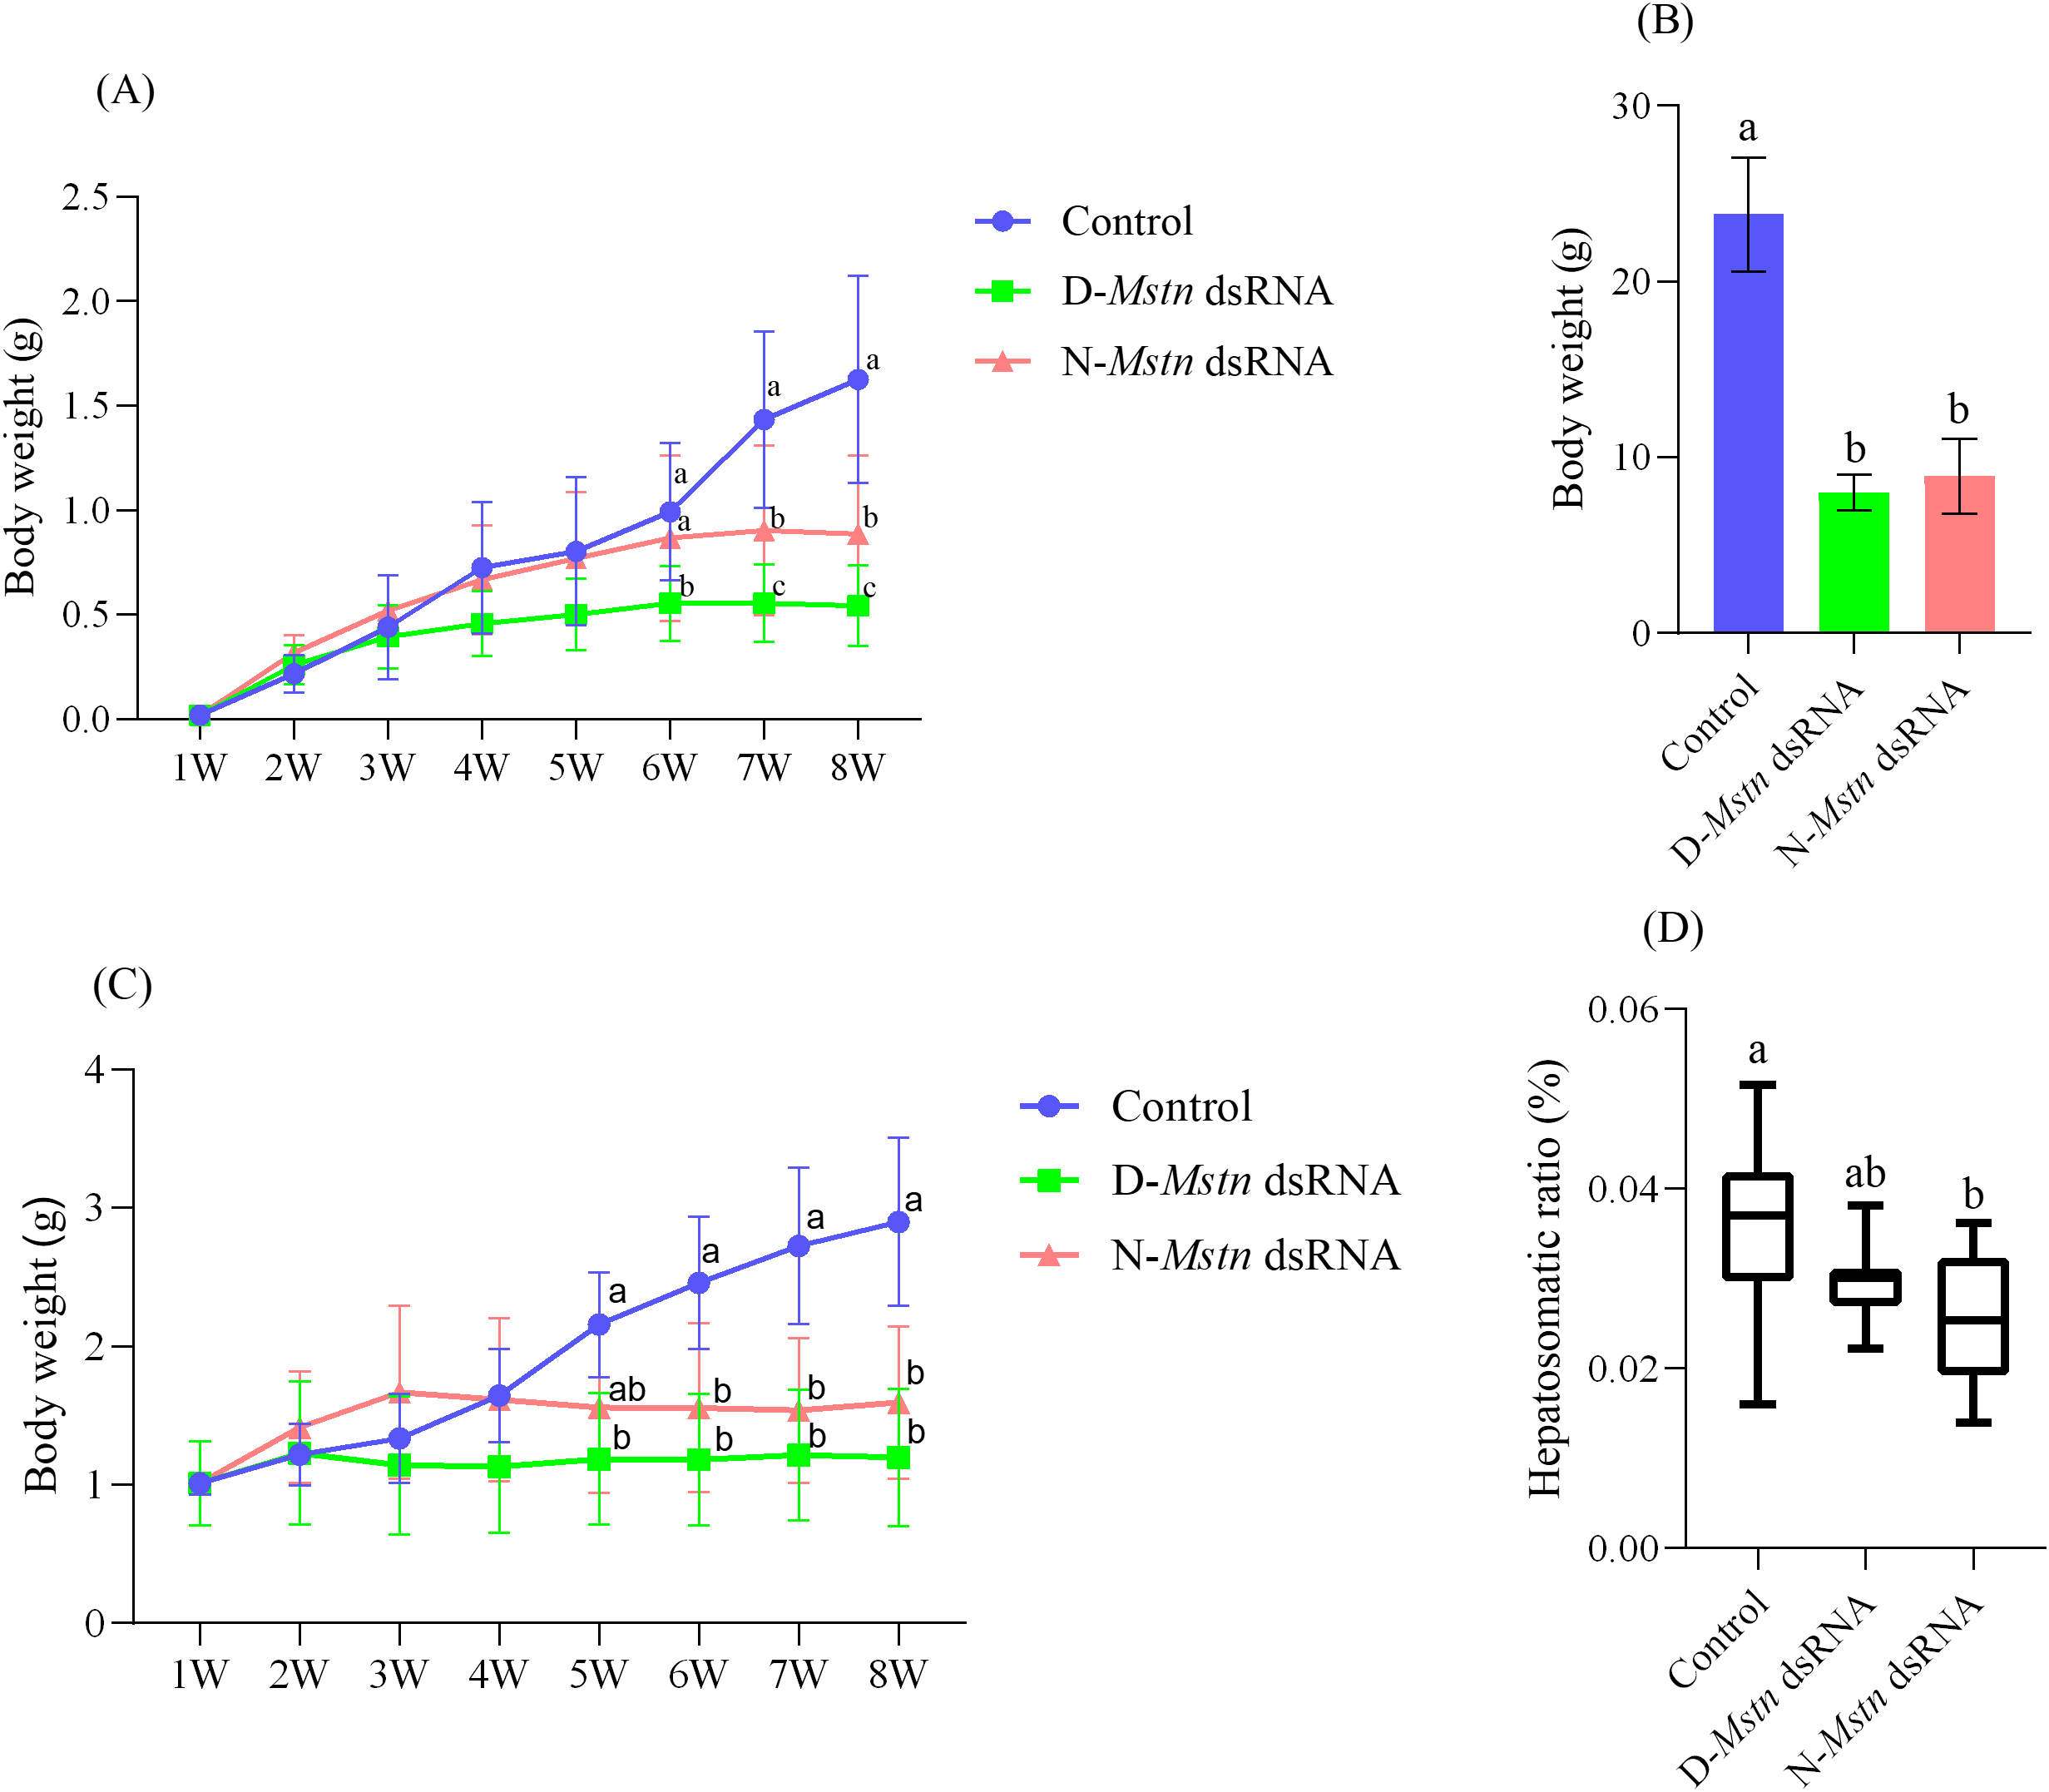
The growth condition and hepatosomatic index of M. rosenbergii following the injection of MrMstn dsRNA. (A) Trend of body weight over eight weeks between the continuous dsRNA injection group and the control group. (B) The body weight of each group in the remaining M. rosenbergii was reared to 180 days. (C) The body weight of the offspring after continuous dsRNA injection for 8 weeks in the experimental group and the control group. (D) Hepato-body ratio of the experimental group to the control group. The different letters indicated a significant difference between the experimental groups at the same time (p< 0.05).
The growth performance of F2 generation larvae, continuously interfered with for 8 weeks across F1 generation groups, revealed no significant differences in shrimp weight among the three groups from weeks 1 to 4 (p > 0.05). However, at weeks 2 and 3, shrimp in the normal interference group exhibited higher weights than those in the control and mutant interference groups. By the 5th week, shrimp in the control group showed significantly higher weights than those in the mutant interference group (p< 0.05), although no significant difference was observed between the two interference groups (p > 0.05). From weeks 6 to 8, shrimp in the control group consistently exhibited significantly higher weights compared to both interference groups (p< 0.05) (Figure 4C). The hepatosomatic index (HSI) measured at week 8 showed that shrimp in the control group had significantly higher HIS values compared to the normal interference group (p< 0.05). No significant difference in HSI was observed between the two interference groups (p > 0.05) (Figure 4D).
3.5 The impact of MrMstn interference on the muscle tissue of M. rosenbergii
Cross-sectional analysis of muscle tissue from the three shrimp groups showed normal muscle fiber structure and morphology. The muscle fibers exhibited a polygonal shape, were tightly arranged in parallel, and displayed clear boundaries. The nuclei were elliptical and positioned at the edges of the muscle fibers (Figures 5A–C). Muscle fiber counts in the selected areas indicated no significant differences among the groups: the non-interference group had 103 ± 3.2 fibers, the normal interference group had 113 ± 3.2 fibers, and the mutant interference group had 106 ± 2.4 fibers.
Figure 5
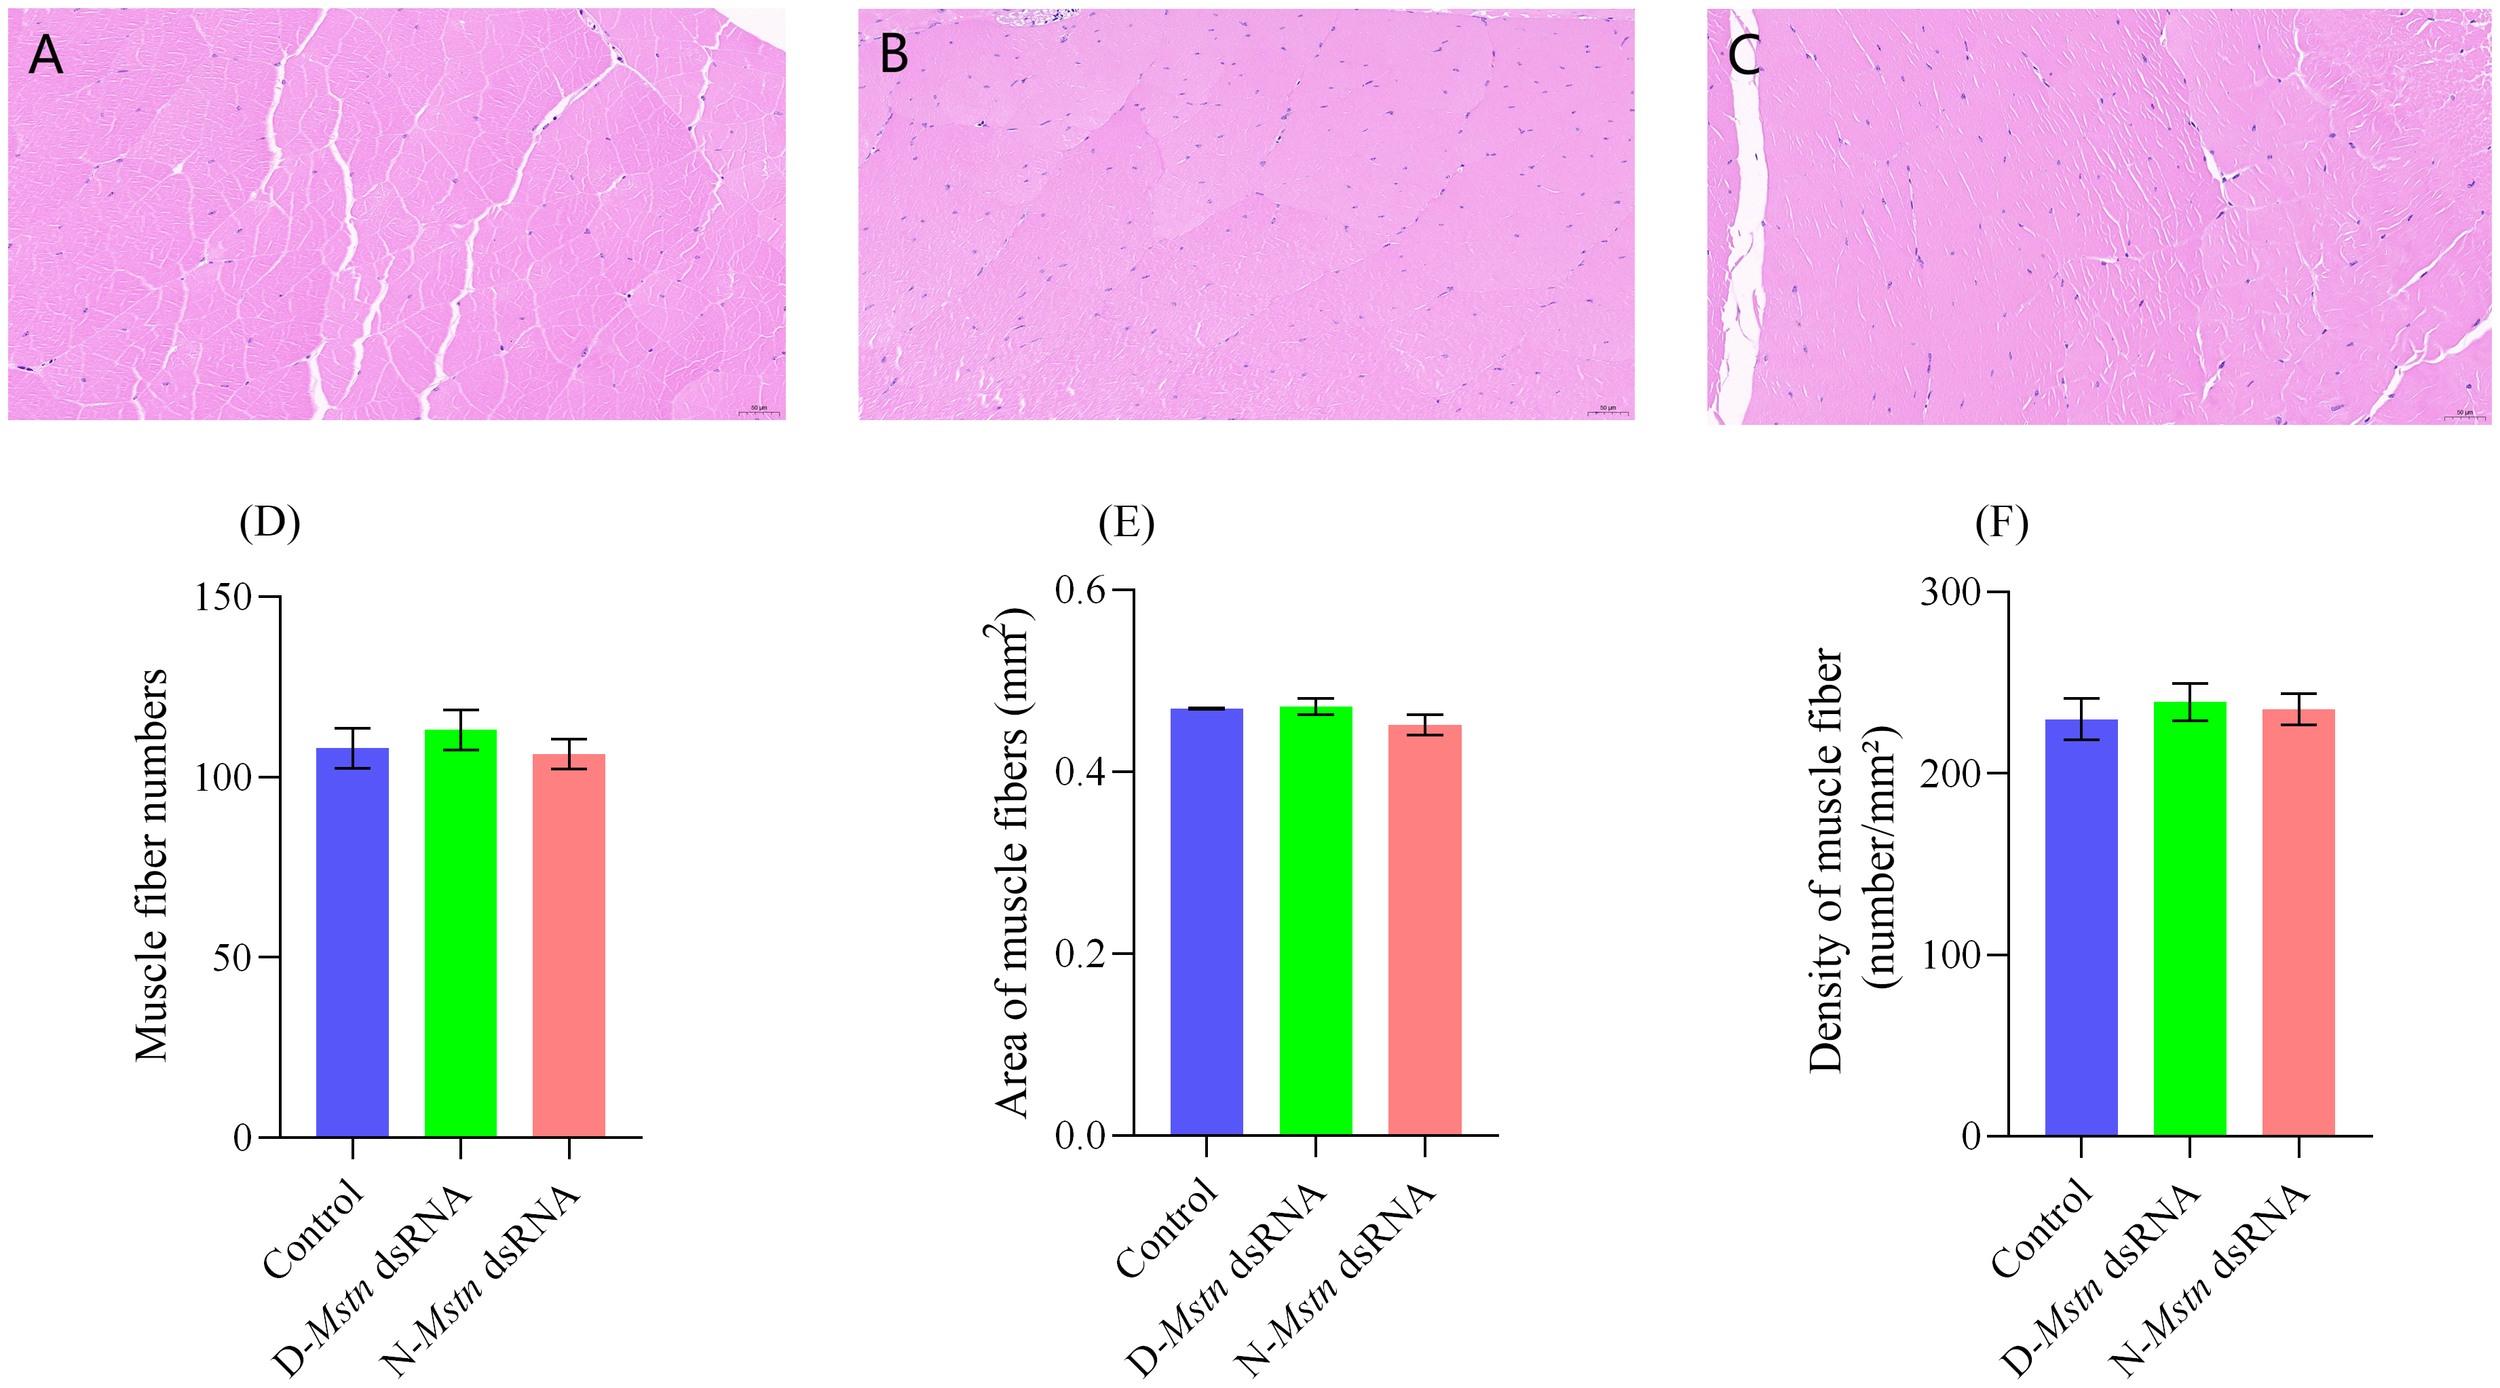
Histological staining and muscle fiber changes in M. rosenbergii following the injection of MrMstn dsRNA. (A) Control group muscle tissue. (B) Group D musculature. (C) Group N musculature. (D) Number of muscle fibers. (E) Average area of muscle fibers. (F) Muscle fiber density. There were no significant differences among the three groups at the same time (p> 0.05).
Similarly, the muscle fiber area showed no significant differences among the groups (p > 0.05) (Figure 5D): the non-interference group had a fiber area of 0.46 ± 0.01 mm², the mutant interference group had 0.47 ± 0.01 mm², and the normal interference group had 0.44 ± 0.01 mm² (p > 0.05) (Figure 5E). Muscle fiber density was also comparable, with the non-interference group showing a density of 229.8 ± 6.6 number/mm², the mutant interference group 239.5 ± 5.9 number/mm², and the normal interference group 235.4 ± 5.0 number/mm² (p > 0.05) (Figure 5F).
3.6 Expression of molting-related genes in M. rosenbergii
Expression analysis of molting-related genes in M. rosenbergii demonstrated that the expression level of the Kr-h1 gene in the control group was significantly lower than in the normal and mutant interference groups (p< 0.05) (Figure 6A). In contrast, the expression level of the RXR gene was significantly higher in the control group than in both interference groups (p< 0.05), Furthermore, the expression level of the ECR gene in the control group was significantly higher than in the mutant interference group (p< 0.05) and extremely significantly higher than in the normal interference group (p< 0.01) (Figures 6B, C).
Figure 6
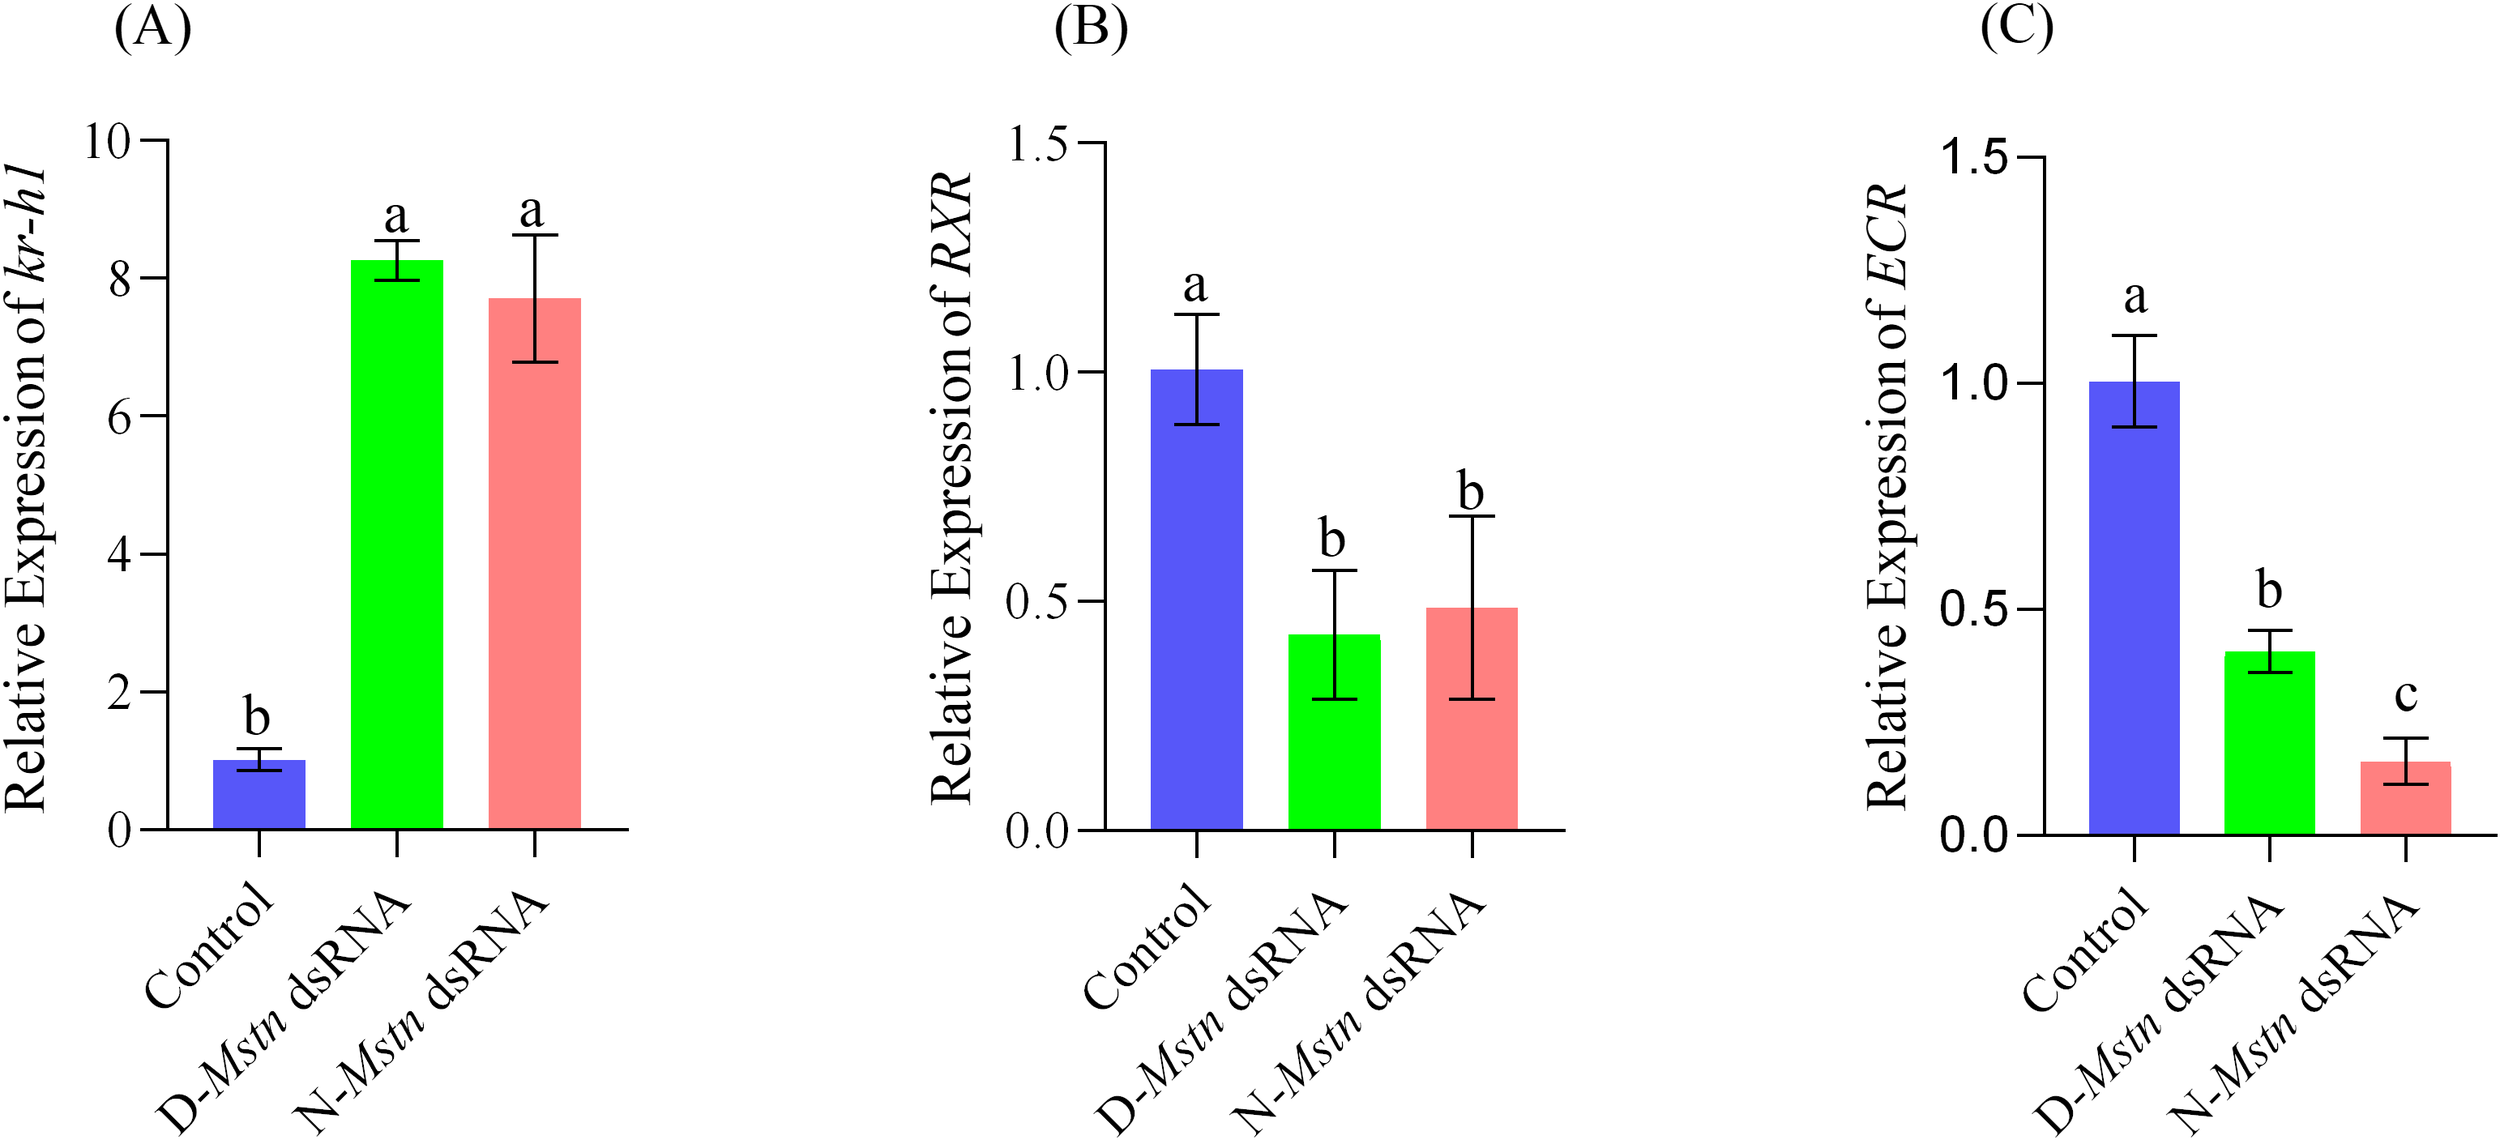
Expression levels of three molting-related genes in the hepatopancreas of M. rosenbergii during the intermolt period after injection of Mstn dsRNA. (A) Krüppel-homolog1 expression level, (B) Retinoid-X receptor expression level, (C) Ecdysone Receptor expression level. The different letters indicated a significant difference between the experimental groups at the same time (p< 0.05).
3.7 The impact of MrMstn interference on the molting cycle of M. rosenbergii
The molting cycle of M. rosenbergii was significantly affected by both normal and mutant MrMstn interference. The non-interference group exhibited a molting cycle of 12.38 ± 0.66 days, while the mutant interference group and the normal interference group had molting cycles of 16.76 ± 0.43 days and 16.92 ± 0.71 days, respectively. This indicates that the molting cycles of the mutant and normal interference groups were 4.6 and 4.5 days longer than the non-interference group, respectively. Both interference groups exhibited significantly slower molting cycles compared to the non-interference group (p< 0.05) (Figure 7).
Figure 7
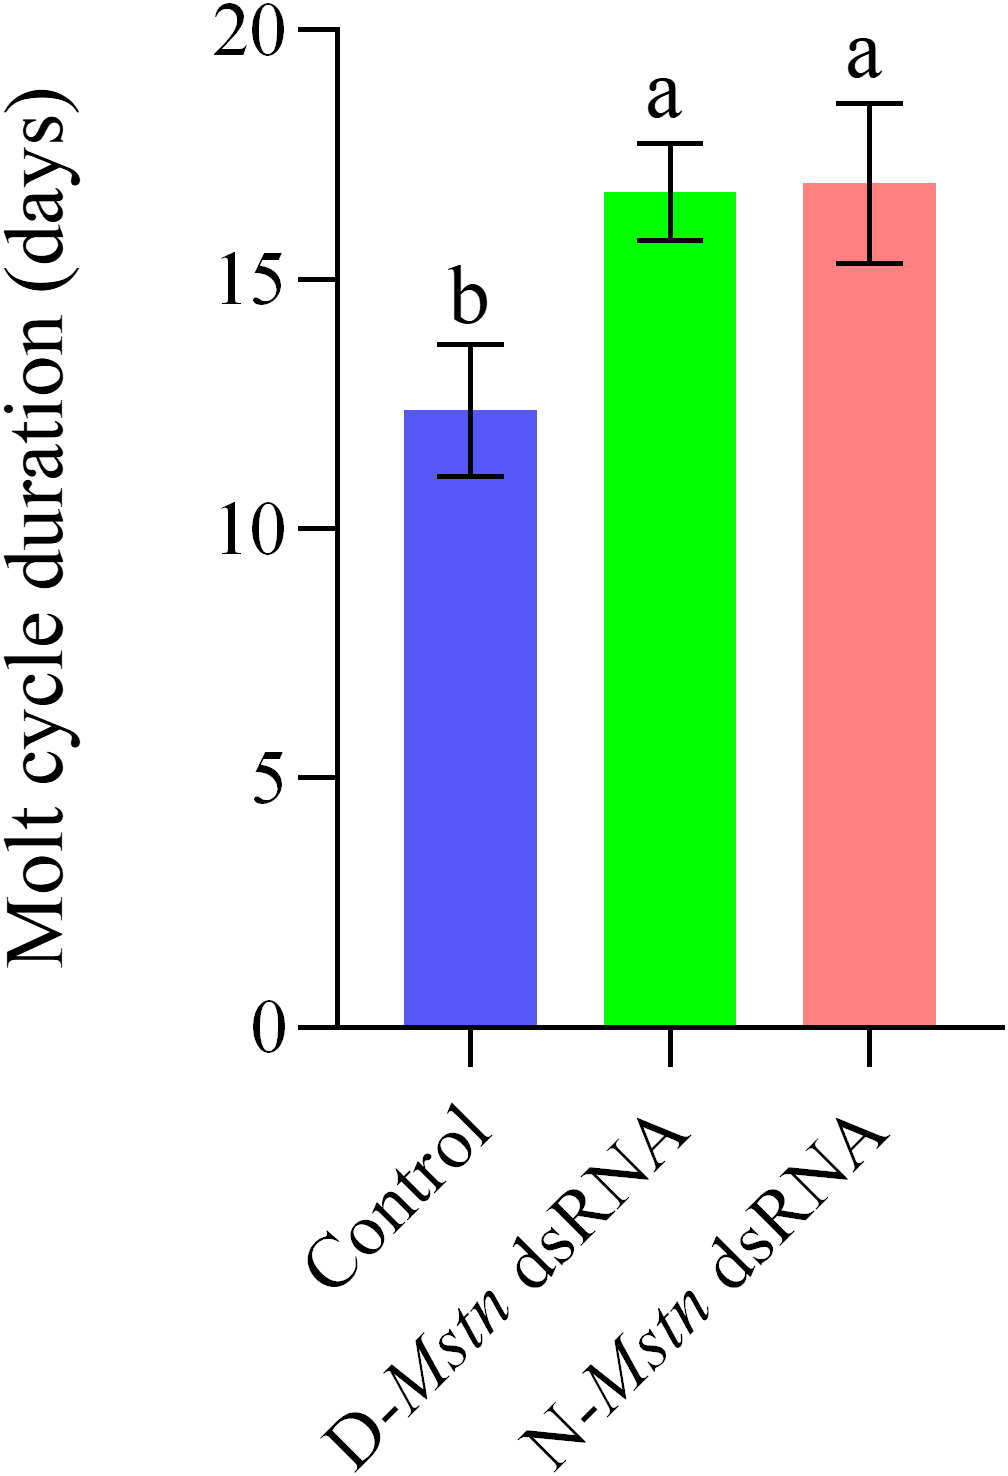
The changes in the molting cycle of M. rosenbergii following the injection of MrMstn dsRNA. The different letters indicated a significant difference between the experimental groups at the same time (p< 0.05).
4 Discussion
Current research on the functional roles of Mstn in crustaceans remains limited. This study is the first to identify a natural 24-bp deletion in the promoter region of Mstn in M. rosenbergii. RNA interference experiments demonstrated that Mstn knockdown significantly suppressed growth, prolonged the molting cycle by approximately 4.5 days, and disrupted the expression of molt-related genes. These findings suggest that Mstn may influence crustacean growth by regulating both muscle development and molting pathways, providing new insights into its multifunctional mechanisms.
It is noteworthy that in vertebrates, GDF8 (traditionally recognized as myostatin) and GDF11 (growth differentiation factor 11), both members of the TGF-β superfamily, exhibit distinct functional roles: GDF8 primarily negatively regulates skeletal muscle development (McPherron et al., 1997), while GDF11 is involved in embryonic patterning and organ homeostasis (McPherron et al., 1999). Phylogenetic studies indicate paralogous differentiation of Mstn genes in fish, such as zebrafish Mstn-1 and Mstn-2. Notably, the promoter region of Mstn-2 is enriched with muscle-specific regulatory elements, and its expression pattern is biased toward the somitogenesis stage, suggesting functional proximity to the muscle-regulatory role of GDF8 (Kerr et al., 2005). Covi et al. first reported truncated Mstn (GDF8/11) in the crustacean Gecarcinus lateralis, proposing its potential role in molting and muscle regeneration, and highlighted its broad tissue distribution consistent with the pan-expression pattern of vertebrate GDF8/11 (Covi et al., 2008). This aligns with our findings of widespread Mstn expression across tissues in M. rosenbergii. Similar truncations have also been observed in chickens (Castelhano-Barbosa et al., 2005), underscoring the evolutionary conservation of this regulatory mechanism. Based on our results (knockdown of Mstn did not induce muscle hyperplasia but significantly inhibited molting), we hypothesize that crustacean Mstn may exert dual functions by integrating GDF8-mediated muscle inhibition signaling with molting-related pathways, rather than solely acting as a muscle-negative regulator. This functional pleiotropy shares deep evolutionary ties with vertebrate paralogs (e.g., GDF11’s role in organ development), reinforcing Dobzhansky’s adage, “Nothing in biology makes sense except in the light of evolution.” These findings provide novel insights into the evolutionary diversification and functional complexity of Mstn in crustaceans.
Mstn plays a pivotal role in negatively regulating muscle growth and development. Mutations in the Mstn gene that result in loss of function of the encoded protein can lead to a “double muscling” phenotype (Acosta et al., 2005). Such mutations are relatively common in nature. For example, in Belgian Blue cattle, an 11-base pair deletion at the carboxy-terminus induces a frameshift mutation, which results in a double-muscled phenotype (Grobet et al., 1997). Similarly, a 2-base pair deletion in the third exon of the Mstn gene in American whippets causes the production of premature stop codon, leading to increased muscle mass (Mosher et al., 2007). Mstn mutations have also been associated with increase muscle mass in mice (Szabó et al., 1998), sheep (Clop et al., 2006), chickens (Zhao et al., 2015), and birds (Lee et al., 2020).
In crustaceans, long base-pair deletions in the Mstn gene have been observed. For example, in Fenneropenaeus merguiensis (Zhuo et al., 2017) and Gecarcinus lateralis (Covi et al., 2008), a 24 bp deletion occurs at the end of the first exon. In this study, we identified a natural 24 bp deletion in M. rosenbergii, but the mutation was located in the promoter region. According to predictions from the PlantCARE database (http://bioinformatics.psb.ugent.be/webtools/plantcare/html/), this deleted region contains a short sequence regulatory element associated with the transcription start site and frequency of the Mstn gene (Andersson and Sandelin, 2020). However, its precise role in M. rosenbergii remains to be investigated.
RNAi exhibits dose- and time-dependent variability across species. For example, injecting three doses (1, 10, and 100 pmol) of Mstn dsRNA into Litopenaeus vannamei revealed no significant differences in suppression across doses (Lee et al., 2015). In contrast, Procambarus clarkii treated with IAG dsRNA showed significant inhibition of IAG gene expression at high doses (0.5 µg/g and 1 µg/g), while a low dose (0.1 µg/g) had minimal effect (Ge et al., 2020). Time-course studies have also highlighted variability in RNAi effects. In Lutjanus guttatus, Mstn dsRNA significantly reduced gene expression on days 2 and 5, but the effect diminished by day 60 (Torres-Velarde et al., 2020). Similarly, interference with the TGFβ gene in the Pacific oyster sustained suppression for up to 34 days (Huvet et al., 2012). In this study, quantitative real-time PCR (qPCR) analysis determined that the optimal dsRNA dose for the Mstn gene in M. rosenbergii is 5 µg/g, with the maximum effect observed at 7 days. These findings indicate slight differences compared to other species, underscoring the variability of RNAi responses.
The ecdysone receptor (ECR) binds to the retinoid X receptor (RXR) to form a heterodimer, through which ecdysone exerts its molting function (Li et al., 2014). In this study, downregulation of ECR and RXR gene expression indicates that molting in M. rosenbergii may be inhibited. Kr-h1 encodes a transcription factor containing a C2H2 zinc finger structure that regulates the synthesis of juvenile hormone (JH) (Kayukawa et al., 2016), which in crustaceans shares functional similarities with insects, including roles in molting, metamorphosis, and diapause (Miyakawa et al., 2014). The significant alteration in Kr-h1 expression suggests that Mstn impacts molting in M. rosenbergii. Collectively, the differential expression of these three molting-related genes (ECR, RXR, and Kr-h1) demonstrates that Mstn indirectly regulates the molting process through molecular pathways, despite no direct interaction between Mstn and these genes being identified.
In mammals, mutations or silencing of the Mstn gene typically lead to muscle fiber hyperplasia or hypertrophy (Bouyer et al., 2014; Qian et al., 2015; Lv et al., 2016; Crispo et al., 2015). However, in the present study, knockdown experiments targeting both naturally mutated and normal genotypes of M. rosenbergii did not produce a “double muscling” phenotype. Muscle fiber number, fiber area, and fiber density remained unchanged across groups (Figure 6). Interestingly, knockdown of both genotypes resulted in growth stagnation during the later stages of M. rosenbergii development (Figure 4). This outcome aligns with findings in Litopenaeus vannamei (Lee et al., 2015), but contrasts with observations in Fenneropenaeus chinensis (Yan et al., 2020). Furthermore, expression analysis of molting-related genes (Kr-h1, RXR, and ECR) revealed significant changes in their expression levels following Mstn knockdown (p<0.05) (Figure 6). Additionally, the molting cycle of M. rosenbergii was significantly prolonged after knockdown (p<0.05) (Figure 7). These results suggest that the promoter mutation in the Mstn gene plays a critical role in regulating growth and molting in M. rosenbergii.
Preliminary findings indicate that the Mstn promoter mutation exists in a heterozygous state within farmed populations of M. rosenbergii. Combining the knockdown results from normal and mutant genotypes, which both led to growth stagnation, this study suggests that the homozygous genotype of the Mstn promoter mutation is likely disadvantageous for survival in natural environments. The specific regulatory mechanisms underlying this phenomenon require further investigation.
5 Conclusion
The Mstn gene, a critical regulator of muscle growth, has significant implications for muscle differentiation and molting in crustaceans– an area that remains relatively unexplored. This study identified a natural 24 bp mutation in the promoter region of the Mstn gene in M. rosenbergii, present as a heterozygous genotype within the population. Using quantitative fluorescence detection and RNAi techniques, the study characterized the expression profile of the Mstn gene across different tissues, embryonic developmental stages, and molting cycles. Furthermore, it revealed that the 5’UTR mutation in the Mstn promoter region affects growth and molting, offering insights into its regulatory role. These findings lay the groundwork for future studies on the regulatory mechanisms of the Mstn gene in crustaceans and their potential applications in aquaculture. Future research should focus on functional studies of the promoter mutation, the biological consequences of homozygous genotypes, and the broader implications of Mstn gene regulation in crustacean development and farming practices.
Statements
Data availability statement
The datasets presented in this study can be found in online repositories. The names of the repository/repositories and accession number(s) can be found below: https://www.ncbi.nlm.nih.gov/genbank/, 2918028; https://www.ncbi.nlm.nih.gov/genbank/, 2907877.
Ethics statement
The animal study was approved by Laboratory Animal Ethics Committee of Pearl River Fisheries Research Institute, CAFS. The study was conducted in accordance with the local legislation and institutional requirements.
Author contributions
QS: Data curation, Investigation, Methodology, Writing – original draft, Writing – review & editing. JW: Conceptualization, Funding acquisition, Resources, Writing – review & editing. YW: Conceptualization, Funding acquisition, Writing – review & editing. BL: Formal Analysis, Writing – review & editing. HL: Investigation, Writing – review & editing. ZM: Formal Analysis, Writing – review & editing. KH: Resources, Writing – review & editing. QZ: Methodology, Writing – review & editing. TJ: Methodology, Writing – review & editing. XM: Validation, Writing – review & editing. LY: Conceptualization, Funding acquisition, Resources, Writing – review & editing, Writing – original draft.
Funding
The author(s) declare that financial support was received for the research and/or publication of this article. This research was funded by Guangdong Basic and Applied Basic Research Foundation (2023A1515010297); Scientific Institution Basal Research Fund, PRFRI (2024SJRC1); the Scientific Innovation Fund, PRFRI (2023CXYC1); the National key R&D Program of China (No. 2022YFD2400104), Provincial special fund for rural revitalization strategy (No. 2022-spy-00-008), Central Public-interest Scientific Institution Basal Research Fund, CAFS (No. 2021SJXK3, 2022SJ-XT1, 2020TD35 and 2020ZJTD01), Scientific Innovation Fund, PRFRI (No. 2023CXYC1), China ASEAN Maritime Cooperation Fund (No. CAMC-2018F), and National Freshwater Genetic Resource Center (No. NFGR- 2020).
Acknowledgments
We thank the excellent technical support provided by Seville Company in the laboratory. We also thank scholars such as Editage for their valuable suggestions and discussions.
Conflict of interest
The authors declare that the research was conducted in the absence of any commercial or financial relationships that could be construed as a potential conflict of interest.
Generative AI statement
The author(s) declare that no Generative AI was used in the creation of this manuscript.
Publisher’s note
All claims expressed in this article are solely those of the authors and do not necessarily represent those of their affiliated organizations, or those of the publisher, the editors and the reviewers. Any product that may be evaluated in this article, or claim that may be made by its manufacturer, is not guaranteed or endorsed by the publisher.
References
1
Acosta J. Carpio Y. Borroto I. González O. Estrada M. P. (2005). Myostatin gene silenced by RNAi show a zebrafish giant phenotype. J. Biotechnol.119, 324–331. doi: 10.1016/j.jbiotec.2005.04.023
2
Aiello D. Patel K. Lasagna E. (2018). Myostatin gene: An overview of its mechanisms of action and relevance to livestock animals. Anim. Genet.49, 505–519. doi: 10.1111/age.12696
3
Amthor H. Christ B. Patel K. (1999). A molecular mechanism enabling continuous embryonic muscle growth – a balance between proliferation and differentiation. Development126, 1041–1053. doi: 10.1242/dev.126.5.1041
4
Amthor H. Huang R. McKinnell I. Christ B. Kambadur R. Sharma M. et al . (2002). The regulation and action of myostatin as a negatively regulates muscle development during avian embryogenesis. Dev. Biol.251, 241–257. doi: 10.1006/dbio.2002.0812
5
Andersson R. Sandelin A. (2020). Determinants of enhancer and promoter activities of regulatory elements. Nat. Rev. Genet.21, 71–87. doi: 10.1038/s41576-019-0173-8
6
Beyer T. A. Narimatsu M. Weiss A. David L. Wrana J. L. (2013). The TGFβ superfamily in stem cell biology and early mammalian embryonic development. Biochim. Biophys. Acta1830, 2268–2279. doi: 10.1016/j.bbagen.2012.08.025
7
Boman I. A. Våge D. I. (2009). An insertion in the coding region of the myostatin (MSTN) gene affects carcass conformation and fatness in the Norwegian Spaelsau (Ovis aries). BMC Res. Notes.2, 98. doi: 10.1186/1756-0500-2-98
8
Bouyer C. Forestier L. Ren G. Oulmouden A. (2014). Deep intronic mutation and pseudo-exon activation as a novel muscular hypertrophy modifier in cattle. PloS One9, e97399. doi: 10.1371/journal.pone.0097399
9
Castelhano-Barbosa E. C. Gabriel J. E. Alvares L. E. Monteiro-Vitorello C. B. Coutinho L. L . (2005). Temporal and spatial expression of the myostatin gene during chicken embryo development. Growth develop. aging: GDA69, 3–12. doi: 10.1007/BF03165668
10
Clop A. Marcq F. Takeda H. Pirottin D. Tordoir X. Bibé B. et al . (2006). A mutation creating a potential illegitimate microRNA target site in the myostatin gene affects muscularity in sheep. Nat. Genet.38(7), 813–818. doi: 10.1038/ng1810
11
Covi J. A. Bader B. D. Chang E. S. Mykles D. L . (2010). Molt cycle regulation of protein synthesis in skeletal muscle of the blackback land crab, Gecarcinus lateralis, and the differential expression of a myostatin-like factor during atrophy induced by molting or unweighting. J. Exp. Biol.213, 172–183. doi: 10.1242/jeb.034389
12
Covi J. A. Kim H. W. Mykles D. L. (2008). Expression of alternatively spliced transcripts for a myostatin-like protein in the blackback land crab, Gecarcinus lateralis. Comp. Biochem. Physiol. A Mol. Integr. Physiol.150, 423–430. doi: 10.1016/j.cbpa
13
Crispo M. Mulet A. P. Tesson L. Barrera N. Cuadro F. dos Santos-Neto P. C. et al . (2015). Efficient generation of myostatin knock-out sheep using CRISPR/Cas9 technology and microinjection into zygotes. PloS One10, e0136690. doi: 10.1371/journal.pone.0136690
14
Deng B. Zhang F. Wen J. Ye S. Q. Wang L. X. Yang Y. et al . (2017). The function of myostatin in the regulation of fat mass in mammals. Nutr. Metab. (long).14, 29. doi: 10.1186/s12986-017-0179-1
15
Easwvaran S. P. Bhassu S. Maningas M. B. B. Othman R. Y. (2019). Enhanced muscle regeneration in the freshwater prawn Macrobrachium rosenbergii was achieved through in vivo silencing of the myostatin gene. J. World Aquacult. Soc50, 1026–1039. doi: 10.1111/jwas.12607
16
Ge H. L. Tan K. Shi L. L. Sun R. Wang W.-M. Li Y. H. (2020). Comparison of effects of dsRNA and siRNA RNA interference on insulin-like androgenic gland gene (IAG) in red swamp crayfish Procambarus clarkii. Gene752, 144783. doi: 10.1016/j
17
Grobet L. Martin L. J. R. Poncelet D. Pirottin D. Brouwers B. Riquet J. et al . (1997). The deletion of the bovine myostatin gene causes a double-muscle phenotype in cattle. Nat. Genet.17, 71–74. doi: 10.1038/ng0997-71
18
Huvet A. Fleury E. Corporeau C. Quillien V. Daniel J. Y. Riviere G. et al . (2012). In vivo RNA interference of a gonad-specific transforming growth factor-β in the pacific oyster crassostrea gigas. Mar. Biotechnol. NY U.S.A.14, 402–410. doi: 10.1007/s10126-011-9421-4
19
Kayukawa T. Nagamine K. Ito Y. Nishita Y. Ishikawa Y. Shinoda T . (2016). Krüppel homolog 1 inhibits insect metamorphosis via direct transcriptional repression of Broad-Complex, a pupal specifier gene. J. Biol. Chem.291, 1751–1762. doi: 10.1074/jbc.M115.686121
20
Kerr T. Roalson E. H. Rodgers B. D. (2005). Phylogenetic analysis of the myostatin gene sub-family and the differential expression of a novel member in zebrafish. Evol. Dev.7, 390–400. doi: 10.1111/j.1525-142X.2005.05044.x
21
Lee J. Kim D. H. Lee K. (2020). Muscle hyperplasia in Japanese quail by single amino acid deletion in MSTN pro-peptide. Int. J. Mol. Sci.21, 1504. doi: 10.3390/ijms21041504
22
Lee J. H. Momani J. Kim Y. M. Kang C.-K. Choi J.-H. Baek H.-J. et al . (2015). Effective RNA-silencing strategy of the Lv-Mstn/GDF11 gene and its effects on the growth in shrimp, litopenaeus vannamei. Comp. Biochem. Physiol. Part B: Biochem. Mol. Biol.179, 9–16. doi: 10.1016/j.cbpb.2014.09.005
23
Li X. G. Zhou G. Gu X. H. (2014). Review of aquatic crustacean molting and its influencing factors. Chin J. Zool.49, 294–302. doi: 10.13859/j.cjz.2014.02.022.
24
Livak K. J. Schmittgen T. D. (2001). Analysis of relative gene expression data using real-time quantitative PCR and the 2(-Delta Delta C(T)) Method. Methods25, 402–408. doi: 10.1006/meth.2001.1262
25
Lu X. B. Jiang Q. Min Y. Jiang X. Yang Z. P. Sun L. S. et al . (2018). Molt staging and effect of molting frequency on growth of Macrobrachium rosenbergii growth. Freshw. Fish48, 88–93. doi: 10.13721/j.cnki.dsyy.2018.06.014
26
Luo Z. B. Han S. Yin X. J. Liu H. Wang J. Xuan M et al . (2023). Fecal transplant from myostatin deletion pigs positively impacts the gut-muscle axis. Elife12, e81858. doi: 10.7554/eLife.81858
27
Lv Q. Y. Yuan L. Deng J. C. Chen M. Wang Y. Zeng J. et al . (2016). Efficient generation of myostatin gene-mutated rabbits using CRISPR/Cas9. Sci. Rep.6, 25029. doi: 10.1038/srep25029
28
MacLea K. S. Covi J. A. Kim H. W. Chao E. Medler S. Chang E. S. et al . (2010). Myostatin from the American lobster, Homarus americanus: Cloning and effects of molting on expression in skeletal muscles. Comp. Biochem. Physiol. A Mol. Integr. Physiol.157, 328–337. doi: 10.1016/j.cbpa.2010.07.024
29
Matsakas A. Otto A. Elashry M. I. Brown S. C. Patel K. (2010). Altered primary and secondary myogenesis in myostatin-null mice. Rejuv. Res.13, 717–727. doi: 10.1089/rej.2010.1065
30
McPherron A. C. Lawler A. M. Lee S. J. (1997). Regulation of skeletal muscle mass in mice by a new TGF-p superfamily member. Nature387, 83–90. doi: 10.1038/387083a0
31
McPherron A. C. Lawler A. M. Lee S. J. (1999). Regulation of anterior/posterior patterning of the axial skeleton by growth/differentiation factor 11. Nat. Genet.22, 260–264. doi: 10.1038/10320
32
Ministry of Agriculture and Rural Affairs of the People's Republic of China . (2024). China Fishery Statistics Yearbook (Beijing: China Agriculture Press).
33
Miyakawa H. Toyota K. Sumiya E. Iguchi T . (2014). Comparison of JH signaling in insects and crustaceans. Curr. Opin. Insect Sci.1, 81–87. doi: 10.1016/j.cois.2014.04.006
34
Mosher D. S. Quignon P. Bustamante C. D. Sutter N. B. Mellersh C. S. Parker H. G. et al . (2007). A Mutation in the myostatin Gene Increases Muscle Mass and Enhances Racing Performance in heterozygote Dogs. PloS Genet.3, e79. doi: 10.1371/journal.pgen
35
Qian L. Tang M. Yang J. Wang Q. Cai C. Jiang S. et al . (2015). Targeted mutations in myostatin by zinc finger nucleases result in a double-muscle phenotype in Meishan pigs. Sci. Rep.5, 14435. doi: 10.1038/srep14435
36
Qin Y. Peng Y. Zhao W. Pan J. Ksiezak-Reding H. Cardozo C. et al . (2017). Myostatin inhibits osteoblastic differentiation by suppressing osteocyte-derived exosomal microRNA-218: A novel mechanism in muscle-bone communication. J. Biol. Chem.292, 11021–11033. doi: 10.1074/jbc.M116.770941
37
Sarasvathi P. E. Bhassu S. Maningas M. B. B. Othman R. Y. (2015). Myostatin: A potential growth-regulating gene in the Giant River prawn Macrobrachium rosenbergii. Joint World Aquacult. Soc.46 (6), 624–634. doi: 10.1111/Jwas
38
Szabó G. Dallmann G. Müller G. Patthy L. Soller M. Varga L. (1998). The deletion of the myostatin gene causes compact (Cmpt) hypermuscular mutations in mice. Mamm. Genome.9, 671–672. doi: 10.1007/8
39
Thomas M. Langley B. Berry C. Sharma M. Kirk S. Bass J. et al . (2000). Myostatin, a negative regulator of muscle growth, inhibited myoblast proliferation. J. Biol. Chem.275, 40235–40243. doi: 10.1074/jbc.M004356200
40
Torres-Velarde J. Llera-Herrera R. Ibarra-Castro L. García-Gasca T. García-Gasca A. (2020). Post-transcriptional silencing of myostatin-1 in the spotted rose snapper (Lutjanus guttatus) promotes muscle hypertrophy. Mol. Biol. Rep.47, 443–450. doi: 10.1007/s11033-019-05147-1
41
Wang Y. K. Li H. R. Wei J. Hong K. H. Zhou Q. Y. Liu X. L. et al . (2023). Effects of acute salinity stress on osmoregulation, physiological metabolism, antioxidant capacity, immunity, and apoptosis in Macrobrachium rosenbergii. Antioxid. (baseline)12, 1836. doi: 10.3390/antiox12101836
42
Wang Z. Pan Y. Bi Y. Lei C. Z. Chen H. Lan X. Y. (2019). Mechanisms and mutations of MSTN in animals. China Cattle Sci.45, 22–32. doi: 10.1007/s11427-018-9408-x
43
Wolfman N. M. Mcpherron A. C. Pappano W. N. Davies M. V. Song K. Tomkinson K. N. et al . (2003). Activation of latent myostatin by BMP-1/tolloid family of metalloproteinases. Proc. Natl. Acad. Sci. U.S.A.100, 15842–15846. doi: 10.1073/pnas.2534946100
44
Yan Y. Lu X. Kong J. Meng X. Luan S. Dai P. et al . (2020). Molecular characterization of myostatin and its inhibitory function on myogenesis and muscle growth in Chinese Shrimp, Fenneropenaeus chinensis. Gene758, 144986. doi: 10.1016/j.gene.2020.144986
45
Zhang X. C. Wang F. Dong Z. J. Dong X. H. Chi J. Chen H. G. et al . (2020). A new strain of yellow catfish carrying genome edited myostatin alleles exhibits double muscling phenotype with hyperplasia. Aquaculture523, 735187. doi: 10.1016/j.aquaculture.2020.735187
46
Zhao Y. L. Wang Q. Du N. S. Lai W. (1998). Embryonic development of the giant freshwater prawn macrobrachium rosenbergii(Crustacea: Decapoda). Morphogenesis of the external structures of the embryo. Acta Zool. Sin.03, 2–9.
47
Zhao Z. H. Li S. F. Huang H. Y. Li C. M. Wang Q. B. Xue L. G. (2015). The myostatin gene(MSTN) and its relationship with muscle fiber traits in chickens. J. Anhui Agric. Univ.1672, 42: 733–737.
48
Zhuo R. Q. Zhou T. T. Yang S. P. Chan S. F. (2017). Characterization of a molt-related myostatin gene (FmMstn) from the banana shrimp Fenneropenaeus merguiensis. Gen. Comp. Endocrinol.248, 55–68. doi: 10.1016/j.ygcen.2017.03.010
Summary
Keywords
Macrobrachium rosenbergii , myostatin , RNAi, molt, growth
Citation
Su Q, Wei J, Wang Y, Liufu B, Li H, Mai Z, Hong K, Zhou Q, Jiao T, Mu X and Yu L (2025) Role of myostatin promoter mutations in growth and molting regulation of Macrobrachium rosenbergii. Front. Mar. Sci. 12:1565567. doi: 10.3389/fmars.2025.1565567
Received
23 January 2025
Accepted
28 April 2025
Published
20 May 2025
Volume
12 - 2025
Edited by
Ivana Veneza, Federal University of Western Pará, Brazil
Reviewed by
Gang Zhai, University of Chinese Academy of Sciences, China
Joseph A. Covi, University of North Carolina Wilmington, United States
Updates
Copyright
© 2025 Su, Wei, Wang, Liufu, Li, Mai, Hong, Zhou, Jiao, Mu and Yu.
This is an open-access article distributed under the terms of the Creative Commons Attribution License (CC BY). The use, distribution or reproduction in other forums is permitted, provided the original author(s) and the copyright owner(s) are credited and that the original publication in this journal is cited, in accordance with accepted academic practice. No use, distribution or reproduction is permitted which does not comply with these terms.
*Correspondence: Lingyun Yu, lysnp@163.com
Disclaimer
All claims expressed in this article are solely those of the authors and do not necessarily represent those of their affiliated organizations, or those of the publisher, the editors and the reviewers. Any product that may be evaluated in this article or claim that may be made by its manufacturer is not guaranteed or endorsed by the publisher.