 Xuelun Huang
 Li Yan
 Jianjun Xu
 Shaojun Zheng
- 1Laboratory for Coastal Ocean Variation and Disaster Prediction, College of Ocean and Meteorology & South China Sea Institute of Marine Meteorology, Guangdong Ocean University, Zhanjiang, Guangdong, China
- 2Shenzhen Institute of Guangdong Ocean University, Shenzhen, Guangdong, China
The El Niño-Southern Oscillation (ENSO) and Indian Ocean Dipole (IOD) coupling exhibits important globe climate impacts. The relationship of ENSO with the IOD’s eastern pole (EP) and western pole (WP) and its interdecadal variation have not been determined. Based on observations and reanalysis datasets, this study reveals that the ENSO and IOD-EP relationship significantly weakened, while the ENSO and IOD-WP relationship strengthened after 2000. Changes in ENSO-IOD-EP connection outweigh that in ENSO-IOD-WP connection. The El Niño-positive IOD (pIOD) coupling weakened and the La Niña-negative IOD (nIOD) coupling strengthened. In addition, the changes in El Niño-pIOD coupling dominate. From the atmospheric view, an anomalous ascending branch of Walker circulation in the Maritime Continent intensified after 2000. The new status of Walker circulation favored weakened wind easterlies and SST warming in IOD-EP, which hindered the development of pIOD events but promoted the development of nIOD events. From the oceanic wave process view, the equatorial and extra-equatorial downwelling Rossby waves both favored SST warming in IOD-WP after 2000, which promoted the generation of pIOD events but hindered the generation of nIOD events. The equatorial Rossby waves reflected by Kelvin waves may be even more dominant in regulating the evolution of IOD events. The presence of the Seychelles thermocline dome region amplifies the impact of oceanic wave processes. Using information flow, a causal analysis verifies that the influence of atmospheric processes on IOD-EP decreased and the influence of oceanic wave processes on IOD-WP increased. Such weakened ENSO-IOD-EP connection can be attributed to the weakened wind easterlies in pIOD events associated with the La Niña-like condition in Pacific and the declined Bjerknes feedback induced by the deepened thermocline condition in IOD-EP. While the strengthened ENSO-IOD-WP connection can be attributed to the strengthened downwelling Rossby waves in pIOD events, which were related to IO Basin (IOB) warming induced by El Niño in the previous year. Increased consecutive El Niños associated with La Niña-like condition are favorable for an enhanced ENSO-pIOD-WP connection. Under the background of ENSO properties transition occurring around 2000, our research will contribute to a better understanding on the ENSO-IOD coupling and its implications.
1 Introduction
The Indian Ocean Dipole (IOD) is a major interannual climate mode in the tropical Indian Ocean (TIO, Saji et al., 1999; Webster et al., 1999). IOD events can exert significant climatic, ecological, and socioeconomic influences (e.g., Ashok et al., 2003; Doi et al., 2022; Lim and Hendon, 2017; Izumo et al., 2010; Lu et al., 2018; Qiu et al., 2014; Saji and Yamagata, 2003; Thushara and Vinayachandran, 2020; Yang et al., 2015; Zhang et al., 2022). For a positive IOD (pIOD) event, the dipole mode of a sea surface temperature (SST) anomaly is associated with a negative pole off the Sumatra coast in the east and a positive pole in the west, and vice versa for a negative IOD (nIOD) event. Following wind-thermocline-SST feedback, i.e., the Bjerknes feedback (Bjerknes, 1969), the IOD evolves. The IOD typically peaks in boreal autumn (e.g., Saji et al., 1999; Webster et al., 1999).
The El Niño-Southern Oscillation (ENSO) is the dominant interannual climate mode in the tropical Pacific Ocean (e.g., Philander, 1990; Wallace et al., 1998), which strongly affects the regional and global climate (e.g., Alexander et al., 2002; Lau and Nath, 2003). The ENSO peaks in boreal winter (e.g., Philander, 1990; Rasmusson and Carpenter, 1982).
ENSO and the IOD each exert significant climatic influences, and variations in their coupled interactions also carry substantial global climate implications. For instance, the IOD can fasten the phase transition of ENSO when they are co-occurring (Kug and Kang, 2006; Luo et al., 2010; Izumo et al., 2010; Kug and Ham, 2012). Naturally, the connection between ENSO and IOD has received considerable interest (e.g., Hong et al., 2008; Izumo et al., 2010; Zhang et al., 2021). The specific coupling between ENSO and IOD is as follows. During the autumn of El Niño (or La Niña) developing years, positive (or negative) IOD events tend to occur in the TIO. They are positively connected.
The IOD mode contains the IOD eastern pole (IOD-EP) and IOD western pole (IOD-WP). ENSO influences the IOD-EP and IOD-WP by modulating the Walker circulation, especially the IOD-EP. This is the atmospheric process viewpoint. Although there may have been some other factors inducing the IOD (e.g. Allan et al., 2001; Hong et al., 2008), ENSO indeed plays an important role in triggering the IOD. Many studies indicate that ENSO can regulate the equatorial zonal wind anomalies over the eastern TIO, thereby promoting the formation of IOD (Annamalai et al., 2003; Behera et al., 2006; Klein et al., 1999; Liu et al., 2017; Meyers et al., 2007; Stuecker et al., 2017; Venzke et al., 2000; Zhang et al., 2015; Zheng et al., 2010).
Oceanic Rossby waves influence the IOD-WP. This is the oceanic wave process viewpoint. It is worth noting that there is a thermocline dome region where the thermocline is the shallowest in the southwestern tropical Indian Ocean. This dome is also known as the Seychelles thermocline dome (e.g., Xie et al., 2002; Yokoi et al., 2012). The presence of the dome region amplifies the impact of oceanic wave processes. These extra-equatorial Rossby waves are relevant to the Indian Ocean basin-wide (IOB) mode. IOB is forced by ENSO in the previous year. During the spring-summer of El Niño (or La Niña) following year, IOB warming (or cooling) occurs (e.g., Xie et al., 2002; Xie et al., 2009). In some years, the tropical Indian Ocean is affected by both IOB and IOD. The IOB modulates the status of SST in the TIO in spring-summer and then modulates the formation of IOD, increasing the complexity of IOD generation. Previous studies have mainly focused on extra-equatorial Rossby waves, however, this study will further investigate the influence of equatorial Rossby waves.
In recent decades, the mean state of the tropical Pacific Ocean and ENSO properties has also changed. For example, the mean state of the tropical Pacific changed around 2000 (e.g., Wang et al., 2023; Hu et al., 2020). The interdecadal shift of ENSO happened in 1999/2000, with a decrease in the strength and an increase in its frequency (Hu et al., 2020). Central Pacific El Niño occurrence increased (Yeh et al., 2009). Mixed-type El Niño occurred after 2000 (Chen et al., 2023). Consecutive La Niña events increased after 2000 (Wang et al., 2023). These changes in ENSO properties may have induced changes in the relationship between ENSO and IOD. For example, a weak El Niño in 2019 corresponded to a strong positive IOD event (e.g., Doi et al., 2020; Du et al., 2020; Lu and Ren, 2020).
A previous study suggested that the relationship between ENSO and IOD weakened since 2000 and emphasized the effect of precipitation anomalies over the northwestern Pacific (Ham et al., 2016). The changes in the ENSO-IOD-EP connection and the ENSO-IOD-WP connection may be different. The interdecadal variation in the relationship between ENSO and IOD-EP, and that between ENSO and IOD-WP, were not discussed in the previous study, remaining unclear. In addition, El Niño-pIOD and La Niña-nIOD coupling may exhibit asymmetry, which has not been examined before. The challenge lies in understanding the combined processes by which ENSO influences IOD-EP and IOD-WP under the new climatic background.
Therefore, this study aims to reveal how ENSO events affect IOD-EP and IOD-WP before and after 2000, from the perspectives of atmospheric and oceanic wave processes. The different contributions of IOD-EP and IOD-WP to the generation of IOD were investigated, including a causal analysis. The El Niño-pIOD and La Niña-nIOD couplings were also examined, respectively. The changes in the mechanisms by which ENSO affects IOD under the new context are carefully explored.
The remainder of this article is organized as follows. Section 2 describes the data and methods used in this study. Section 3.1 analyzes the changes in the relationship between ENSO and the eastern and western poles of IOD. Section 3.2 examines the causes of the relationship changes through analyses of atmospheric and oceanic wave processes. Section 3.3 employs information flow to verify the results. The mean state changes in the Pacific Ocean and Indian Ocean are presented in Section 3.4. Section 4 provides the summary and discussion.
2 Data and methods
We employed the monthly dataset of National Oceanic and Atmospheric Administration (NOAA) Extended Reconstructed SST Version 5 (ERSSTv5, Huang et al., 2017) covering the period 1979–2022. The atmospheric circulation data were obtained from the monthly National Centers for Environmental Prediction-National Center for Atmospheric Research (NCEP-NCAR) reanalysis (NCEP1, Kalnay et al., 1996). We analyzed the sea level pressure (SLP) and horizontal and vertical wind from 1000 hPa to 100 hPa from 1979 to 2022. We also examined the sea level anomaly (SLA), provided by the daily dataset of the Archiving, Validation and Interpretation of Satellite Oceanographic (AVISO). The AVISO SLA data were downloaded from the website https://data.marine.copernicus.eu/product/SEALEVEL_GLO_PHY_L4_MY_008_047/description. The zonal wind stress (Taux) and depth of 20°C (D20) monthly mean data were from the Ocean Reanalysis System 5 (ORAS5, Zuo et al., 2019). The ocean temperature monthly data were obtained from the Global Ocean Data Assimilation System (GODAS, Behringer, 2007).
The IOD index was defined as the difference of the averaged sea surface temperature anomalies (SSTA) between the tropical western IO (50°E-70°E, 10°S-10°N) and the tropical southeastern IO (90°E-110°E, 10°S-0°) (Saji et al., 1999). The SST anomalies were obtained by removing the seasonal cycles from the SST data. The IOD-WP index and IOD-EP index were also calculated, respectively. The Niño 3.4 index was used to represent ENSO, i.e., the averaged SSTA in the tropical central-eastern Pacific Ocean (170°W-120°W, 5°S-5°N). We analyzed the respective atmospheric processes and oceanic wave processes that affect IOD. The former reflects the atmospheric bridge by which ENSO influences the IOD. The latter (i.e., Kelvin and Rossby waves) reflects the internal impacts within the IO on IOD.
This study also uses information flow (IF) to measure the causality (Liang, 2014, 2016). For two time series, Xi and Xj, the information flow from Xj to Xi can be expressed as follows:
In Equation 1, Cij is the covariance between Xi and Xj (i,j=1,2), Ci,dj is the covariance between Xi and X’j, and X’j is the first-order Euler forward finite difference approximation of dXj/dt. For time series with a specific time interval, if the IF is calculated by formula (1), then the units for IF will naturally be nats per specific time interval (Liang, 2014). Here, for monthly data, the corresponding units are nats per month.
IF2→1 can be zero or non-zero. When IF2→1 is zero, it indicates that the evolution of X1 is independent of X2. Significant IF values signify that they are different from zero and the IF values are credible. An IF2→1 with a small amplitude (i.e., the absolute value of IF) may also be statistically significant, implying that this small influence of X2 on X1 is convincing. An IF2→1 with a large amplitude may not pass the confidence test. We usually pay attention to the statistically significant IF with a large amplitude.
The IF can be either positive or negative with acceptable confidence. A positive IF2→1 means X2 induces more uncertainty in X1. A negative IF2→1 indicates that X2 tends to stabilize X1, causing X1 to be more certain. Regardless of IF sign, a statistically significant IF with a large amplitude represents a large credible impact.
3 Results
3.1 Relationship between ENSO and IOD-EP (IOD-WP)
To examine the interdecadal variation of the ENSO-IOD relationship, Figure 1a displays the 15-year running correlation between the Niño34 index and the IOD index in September-November (SON). The results show that the relationship between ENSO and IOD rapidly weakened after 2000 (Figure 1a), implying a transition from a “close” to a “less close” coupling. The changes in the relationship occurred around 2000. Generally, the mean state of tropical Pacific changed at the start of the 21st century, i.e., 1999/2000 (e.g., Wang et al., 2023; Hu et al., 2020). In addition, no IOD events occurred between 2000 and 2004, and there was only one pIOD event that occurred before 1989 (Figure 1b). Taking these factors into consideration comprehensively, the study period is divided into two subperiods: pre-2000 and post-2000 for brevity, i.e., P1 period (1979–1999) and P2 period (2000–2022).
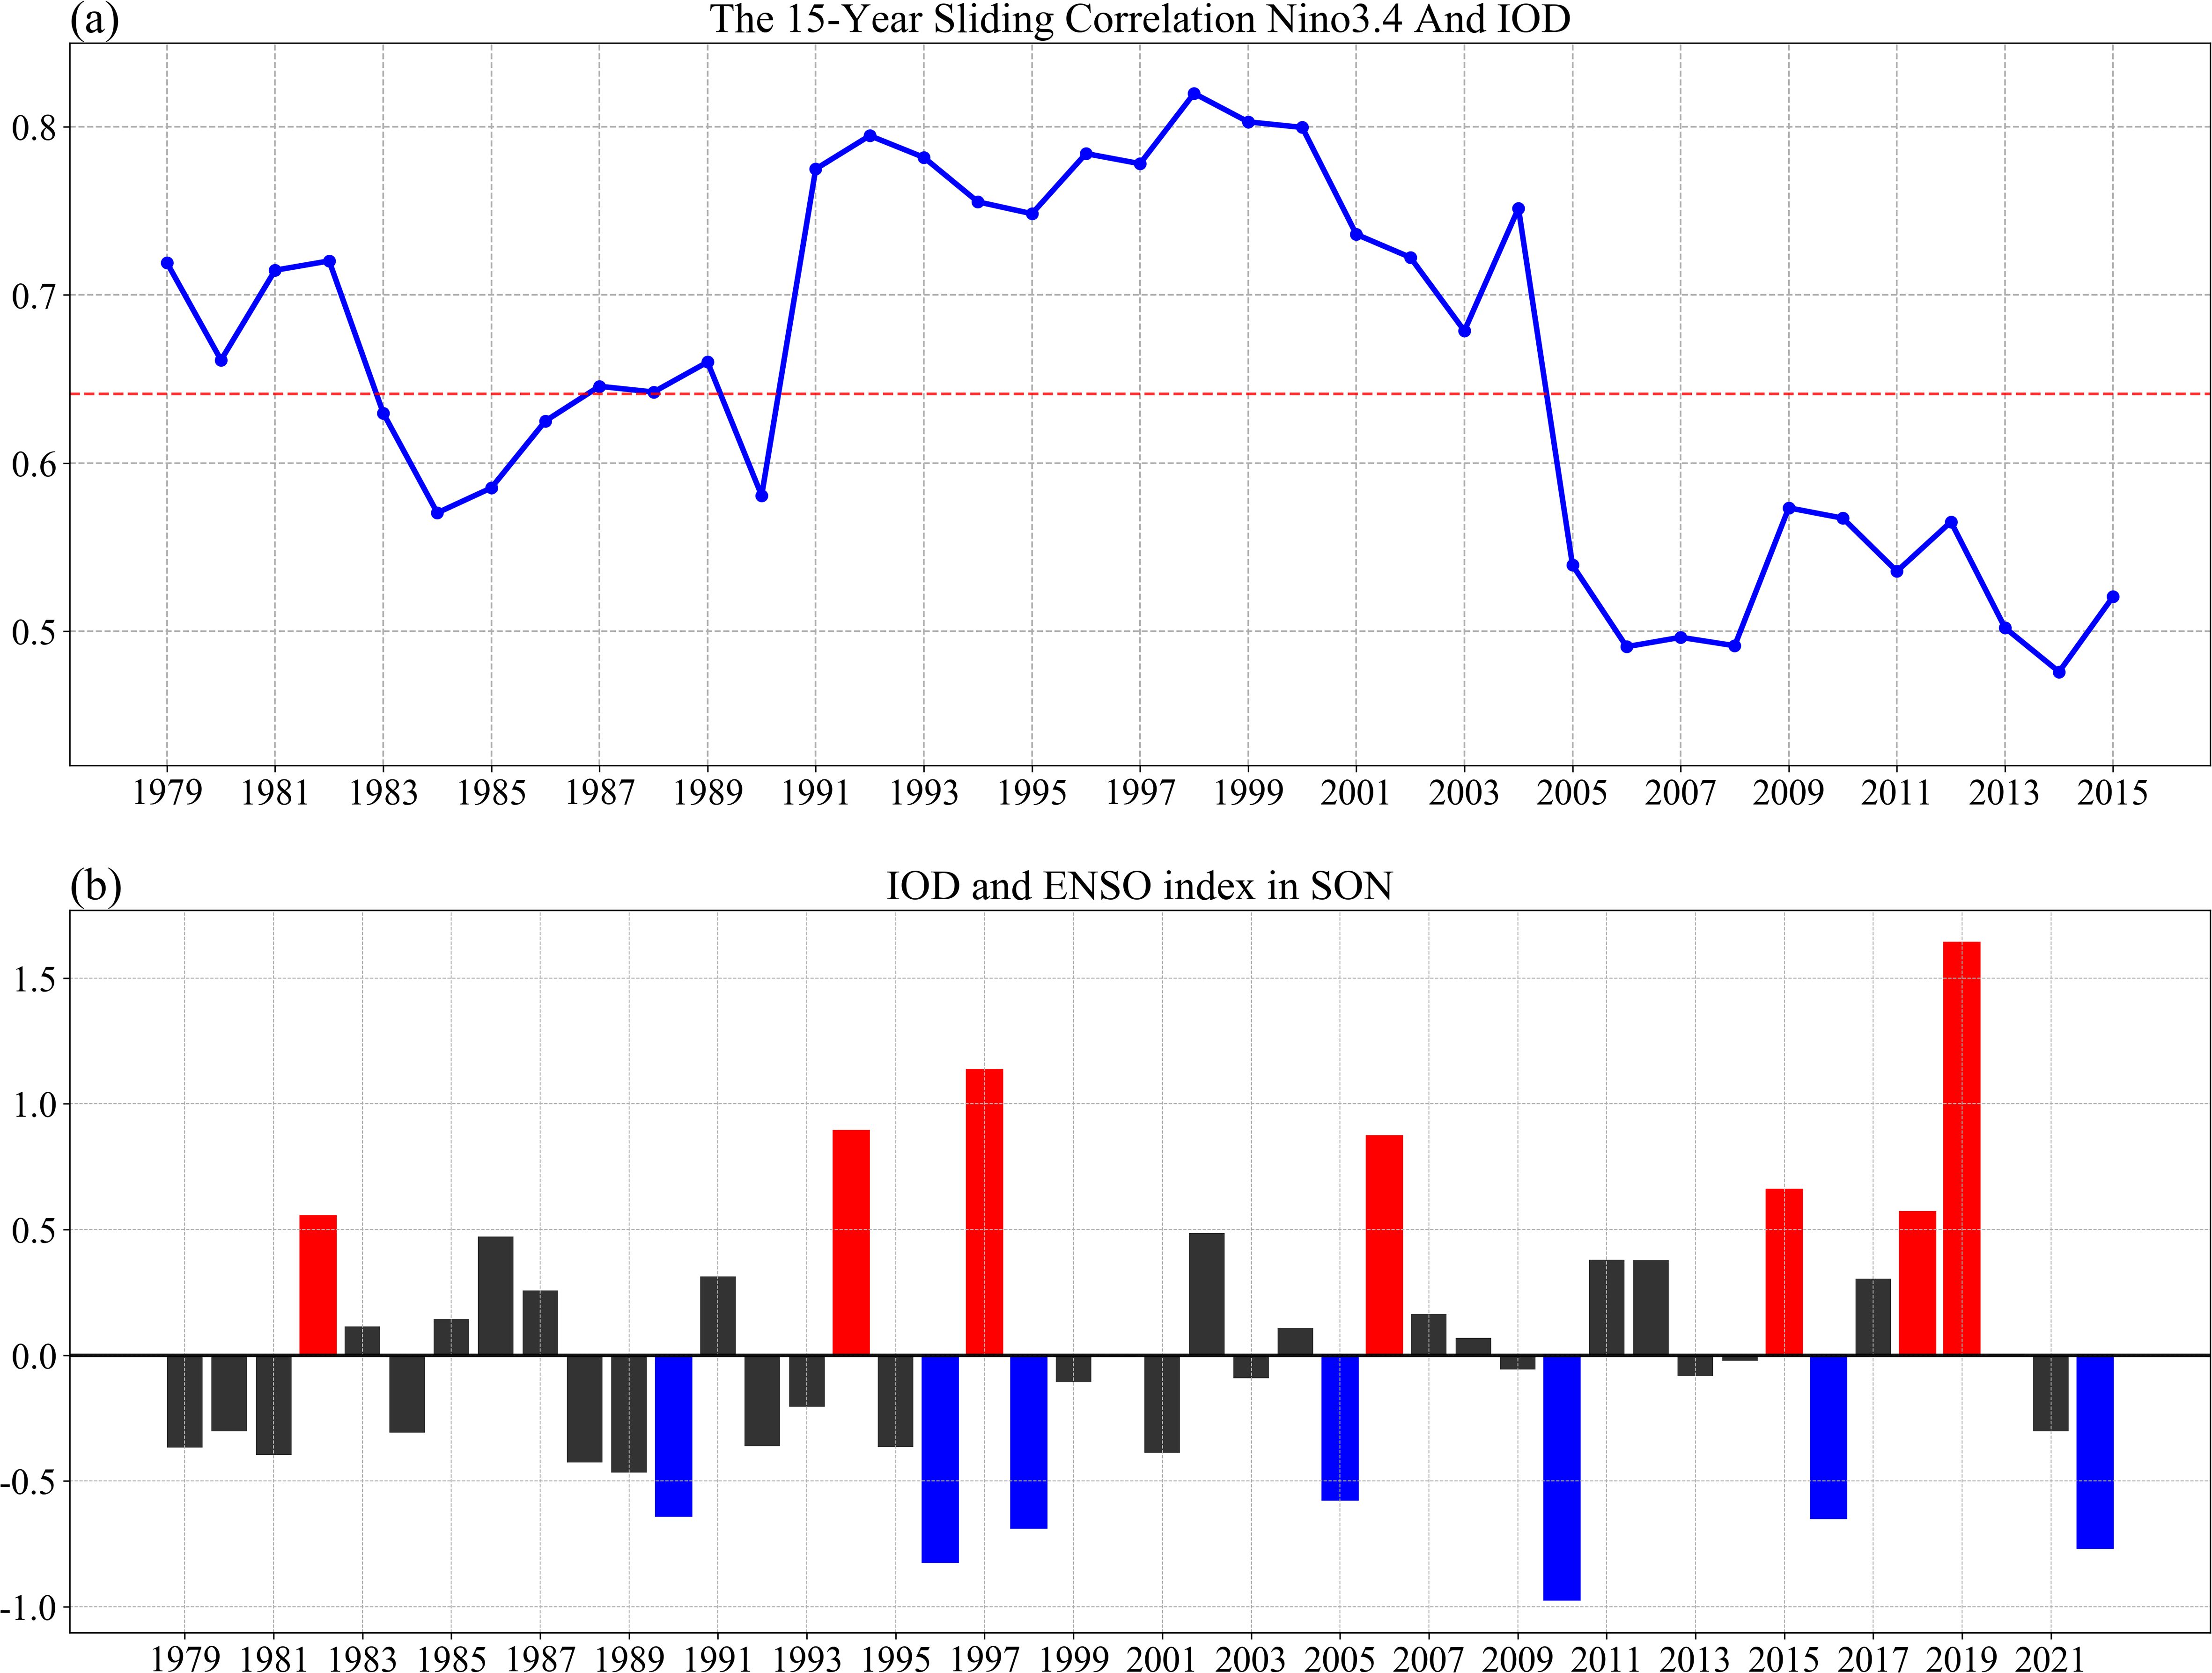
Figure 1. (a) The 15-year running correlation between the Niño34 index and the IOD index during the SON season. The red dashed line denotes the statistical significance at a 99% confidence level. (b) Time series of IOD index (units: °C), with pIOD events (red bars) and nIOD events (blue bars). All are based on the ERSST.
Using the IOD index in SON, the pIOD events and nIOD events were selected (Figure 1b). If the SON IOD index value of a year exceeded +0.5 (-0.5) °C, +0.92 (-0.92) std, this year was defined as a pIOD (nIOD) event. There were three pIOD events (1982, 1994, and 1997) in the P1 period and four pIOD events (2006, 2015, 2018, and 2019) in the P2 period. There were three nIOD events (1990, 1996, and 1998) in the P1 period and four nIOD events (2005, 2010, 2016, and 2022) in the P2 period. The years of the pIOD and nIOD events in two subperiods are also listed in Table 1.
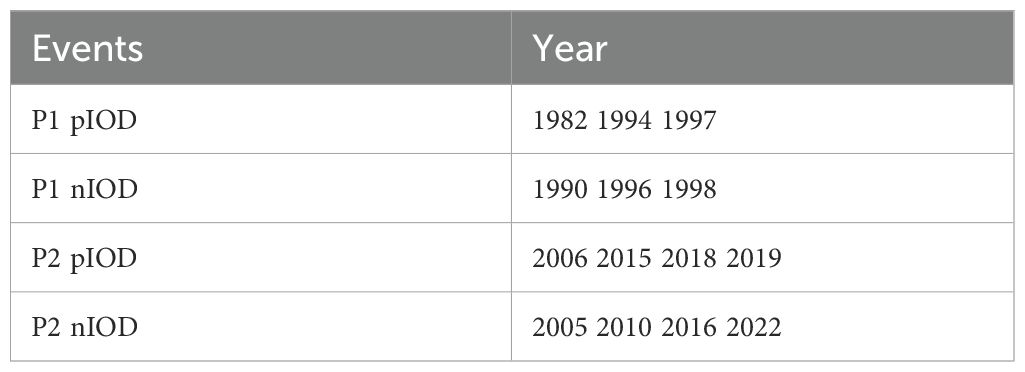
Table 1. Years of pIOD and nIOD events during the P1 (1979-1999) and P2 (2000-2022) subperiods.
The time evolution of the IOD, IOD-EP, IOD-WP, and ENSO indices before and after 2000 are shown in Figure 2. The amplitude of the IOD index reached its maximum in the SON season (i.e., boreal autumn) compared to other seasons. Thus, the IOD events were phase-locked in the SON season. Focusing on the pIOD events (Figures 2a, b), the associated SON Niño34 index was approximately 1.67°C in the P1 period (green line in Figure 2a) and 1.12°C in the P2 period (green line in Figure 2b), respectively. This implies that El Niño was stronger during the P1 than the P2 period. For the SON season, the decrease in pIOD amplitude mainly occurred in October. The amplitude of the overall pIOD index between the P1 and P2 periods did not change much in the SON season. The difference in the individual pIOD-EP index (or pIOD-WP index) between the P1 and P2 periods was statistically significant. The contribution of IOD-EP and IOD-WP to the generation of pIOD changed before and after 2000 (Figures 2a, b). In the P1 period, pIOD events were generated primarily due to the SSTA cooling in IOD-EP, while the IOD-WP SSTA was very small (Figure 2a). Conversely, in the P2 period, pIOD events were generated mainly due to the SSTA warming in IOD-WP, while the IOD-EP SSTA cooling was secondary (Figure 2b).
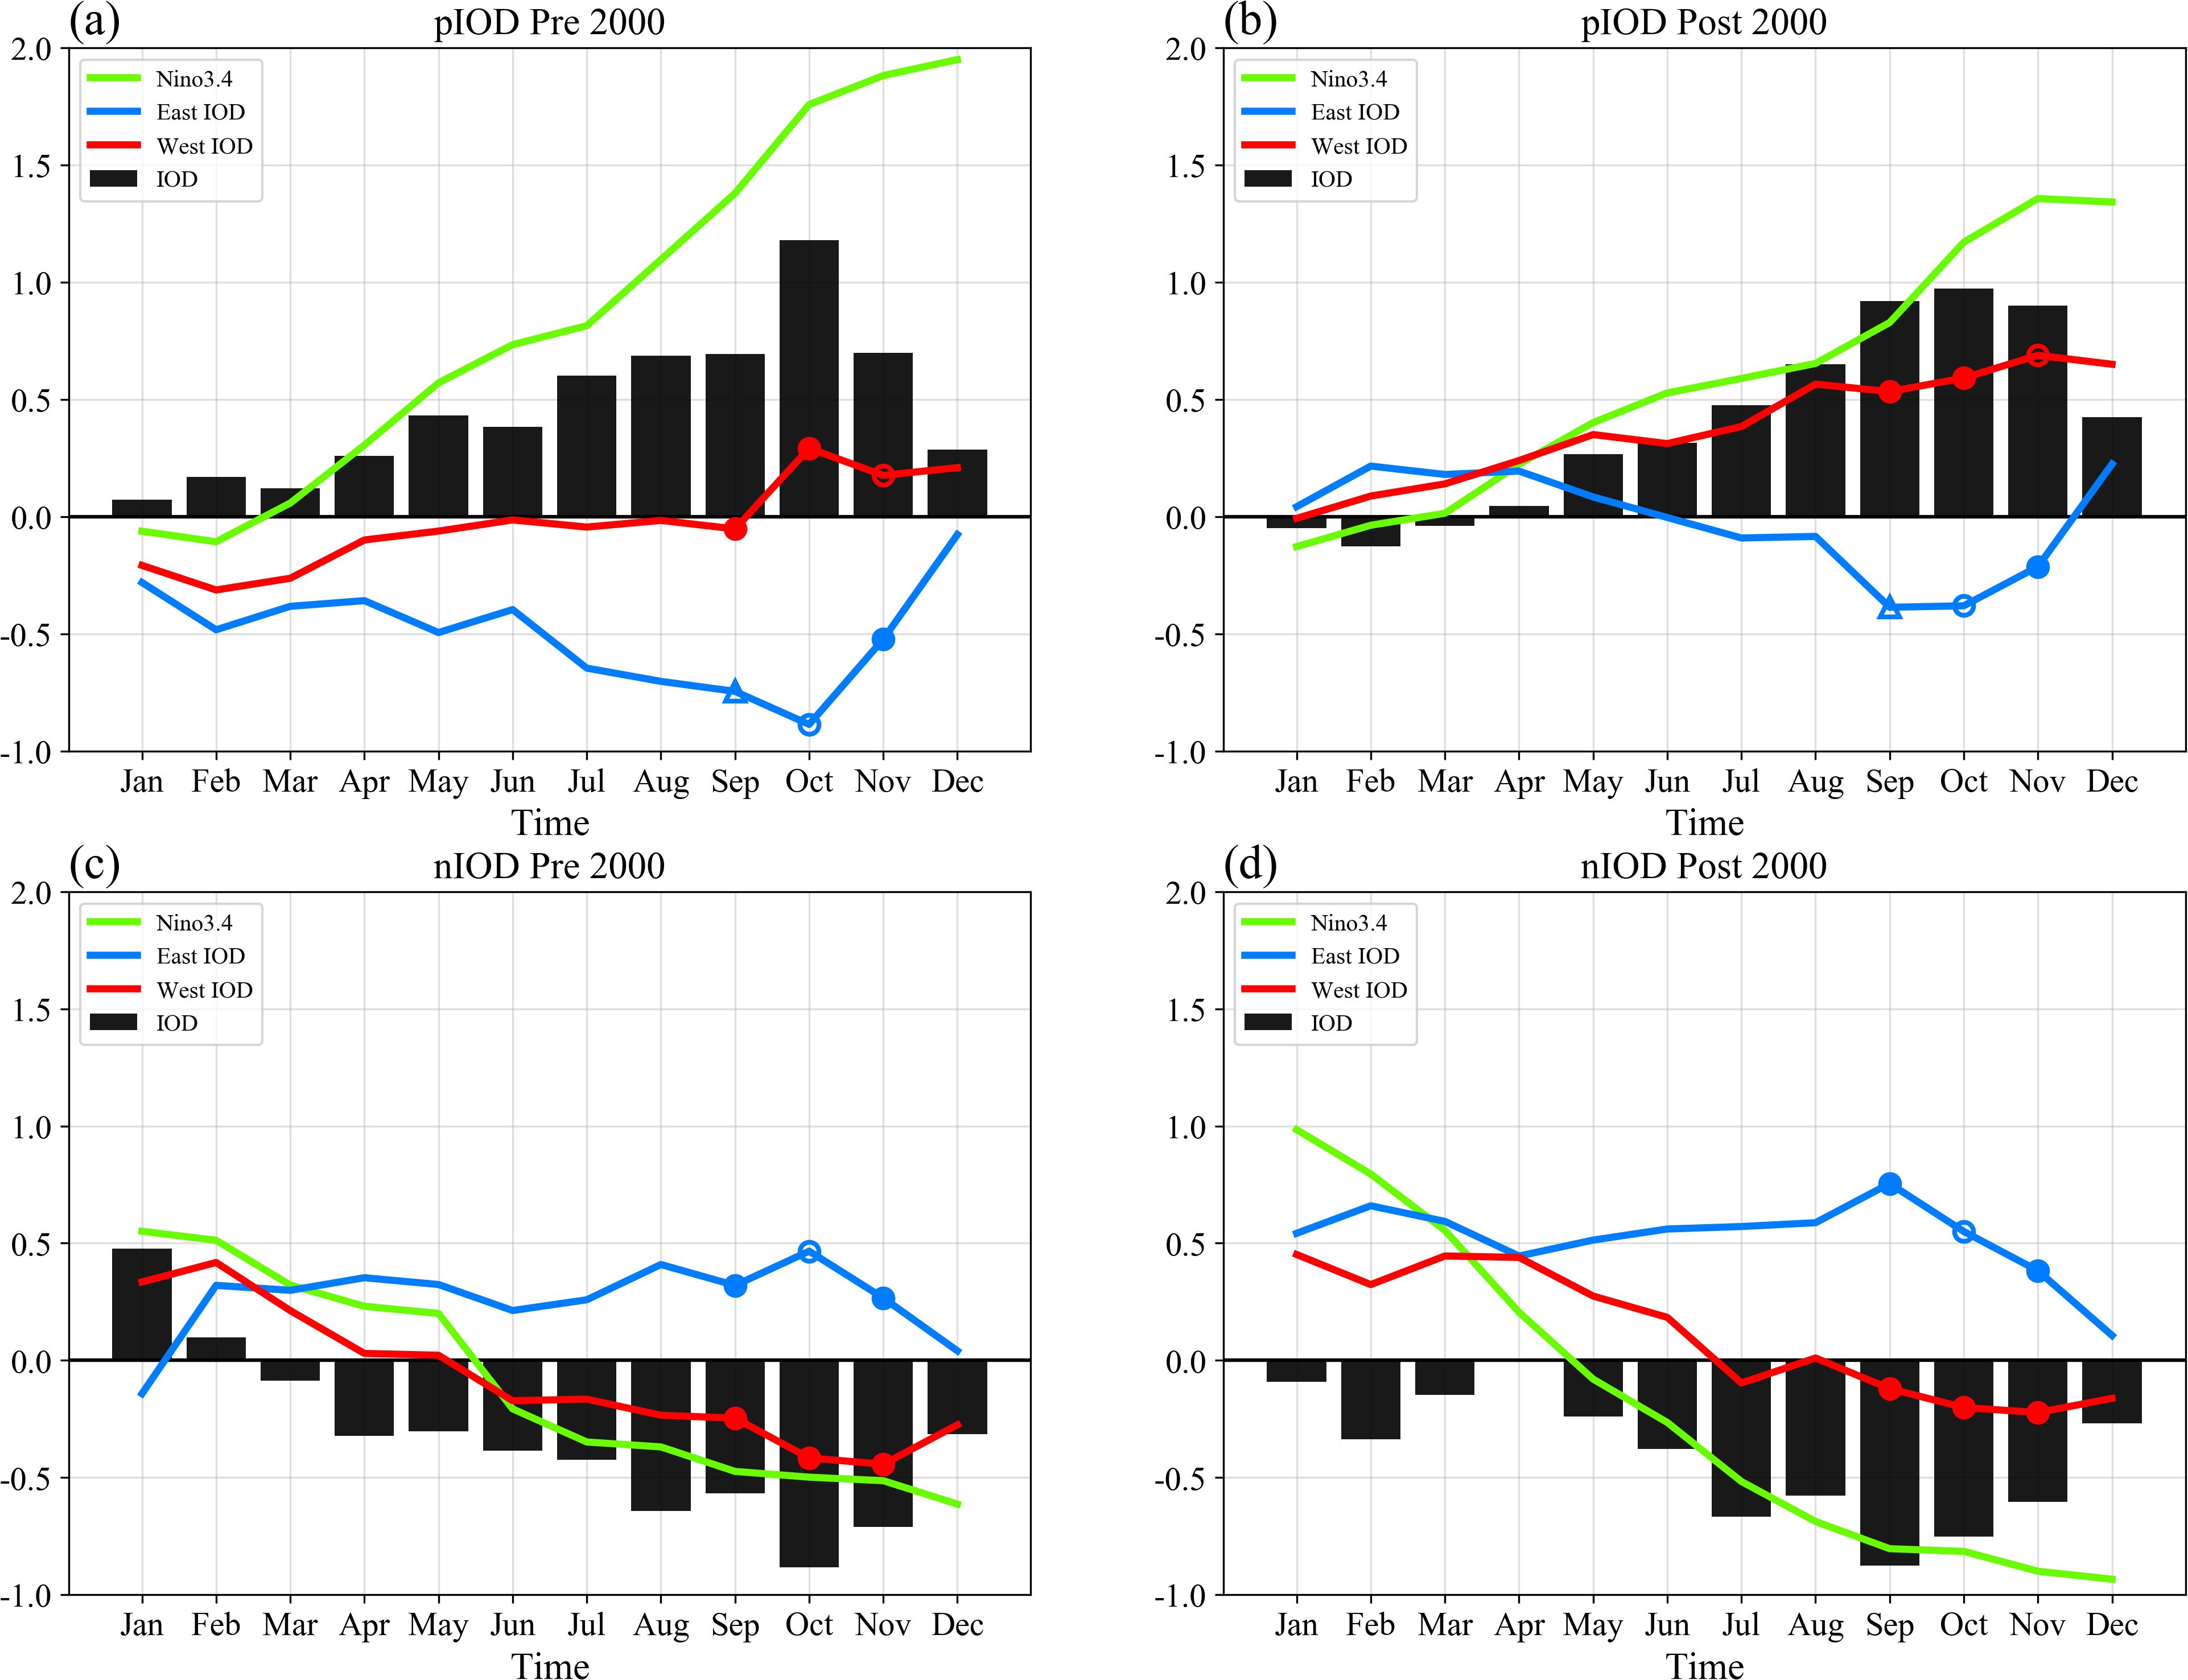
Figure 2. The evolution of the monthly Niño34 index (green line), IOD eastern pole (IOD-EP) index (blue line), IOD western pole (IOD-WP) index (red line), and IOD index (black bar) for the composite of pIOD events (a) from 1979 to 1999 and (b) from 2000 to 2022. (c) as in (a), and (d) as in (b), but for the composite of nIOD events. The triangles, open circles, and solid circles denote that the differences of indices are statistically significant at the 85%, 90%, and 95% confidence level, respectively. All are based on the ERSST.
Focusing on nIOD events (Figures 2c, d), the nIOD events exhibited the largest amplitude in October and were phase-locked in the SON season in the P1 period. The largest amplitude of nIOD occurred in September in the P2 period, i.e., the peak value of the nIOD index in the P2 period happened 1 month earlier than in the P1 period. Considering that the nIOD amplitude in November was comparable to that in August in the P2 period, we studied the nIOD in the SON season in the P2 period. The contribution of IOD-EP and IOD-WP to the generation of pIOD also changed before and after 2000 (Figures 2c, d). In the P1 period, the nIOD events were generated due to both the SSTA warming of IOD-EP and the SSTA cooling of IOD-WP (Figure 2c). However, in the P2 period, nIOD events were generated mainly due to the SSTA warming in IOD-EP, while the IOD-WP SSTA was small (Figure 2d).
The global upper ocean exhibited robust warming (Lyman et al., 2010), including the Indian Ocean (Du and Xie, 2008). Taking pIOD events as an example (Figures 2a, b), in the SON season, even though the overall pIOD amplitude (black bar) did not change much, the individual pIOD-WP index (red line) substantially changed, and the individual pIOD-EP index (blue line) also substantially changed. Specifically, compared to that in the P1 period (Figure 2a), the pIOD-WP index (red line) shifted to a warmer status in the P2 period (Figure 2b), as did the pIOD-EP index (blue line). This is consistent with Indian Ocean warming. Such a shift to a warmer status was also valid for the individual nIOD-WP index and nIOD-EP index (Figures 2c, d).
To further examine the change in the general ENSO-IOD, ENSO-IOD-EP, and ENSO-IOD-WP relationships, scatter plots are shown in Figure 3. The correlation between ENSO and IOD reached 0.76 in the P1 period (Figure 3a), but it decreased to 0.53 in the P2 period (Figure 3d). Such a weakening of the relationship between ENSO and IOD was primarily attributed to the contribution of IOD-EP (Figure 3e). The correlation between ENSO and IOD-EP was -0.61 during the P1 period (Figure 3b), but it significantly fell to -0.23 during the P2 period (Figure 3e). For example, extreme ENSO events did not correspond to the extreme SSTA of IOD-EP during the P2 period. In the P1 period, the correlation between ENSO and IOD-WP was 0.64 (Figure 3c), and, instead of a decrease, it slightly increased to 0.67 during the P2 period (Figure 3f).
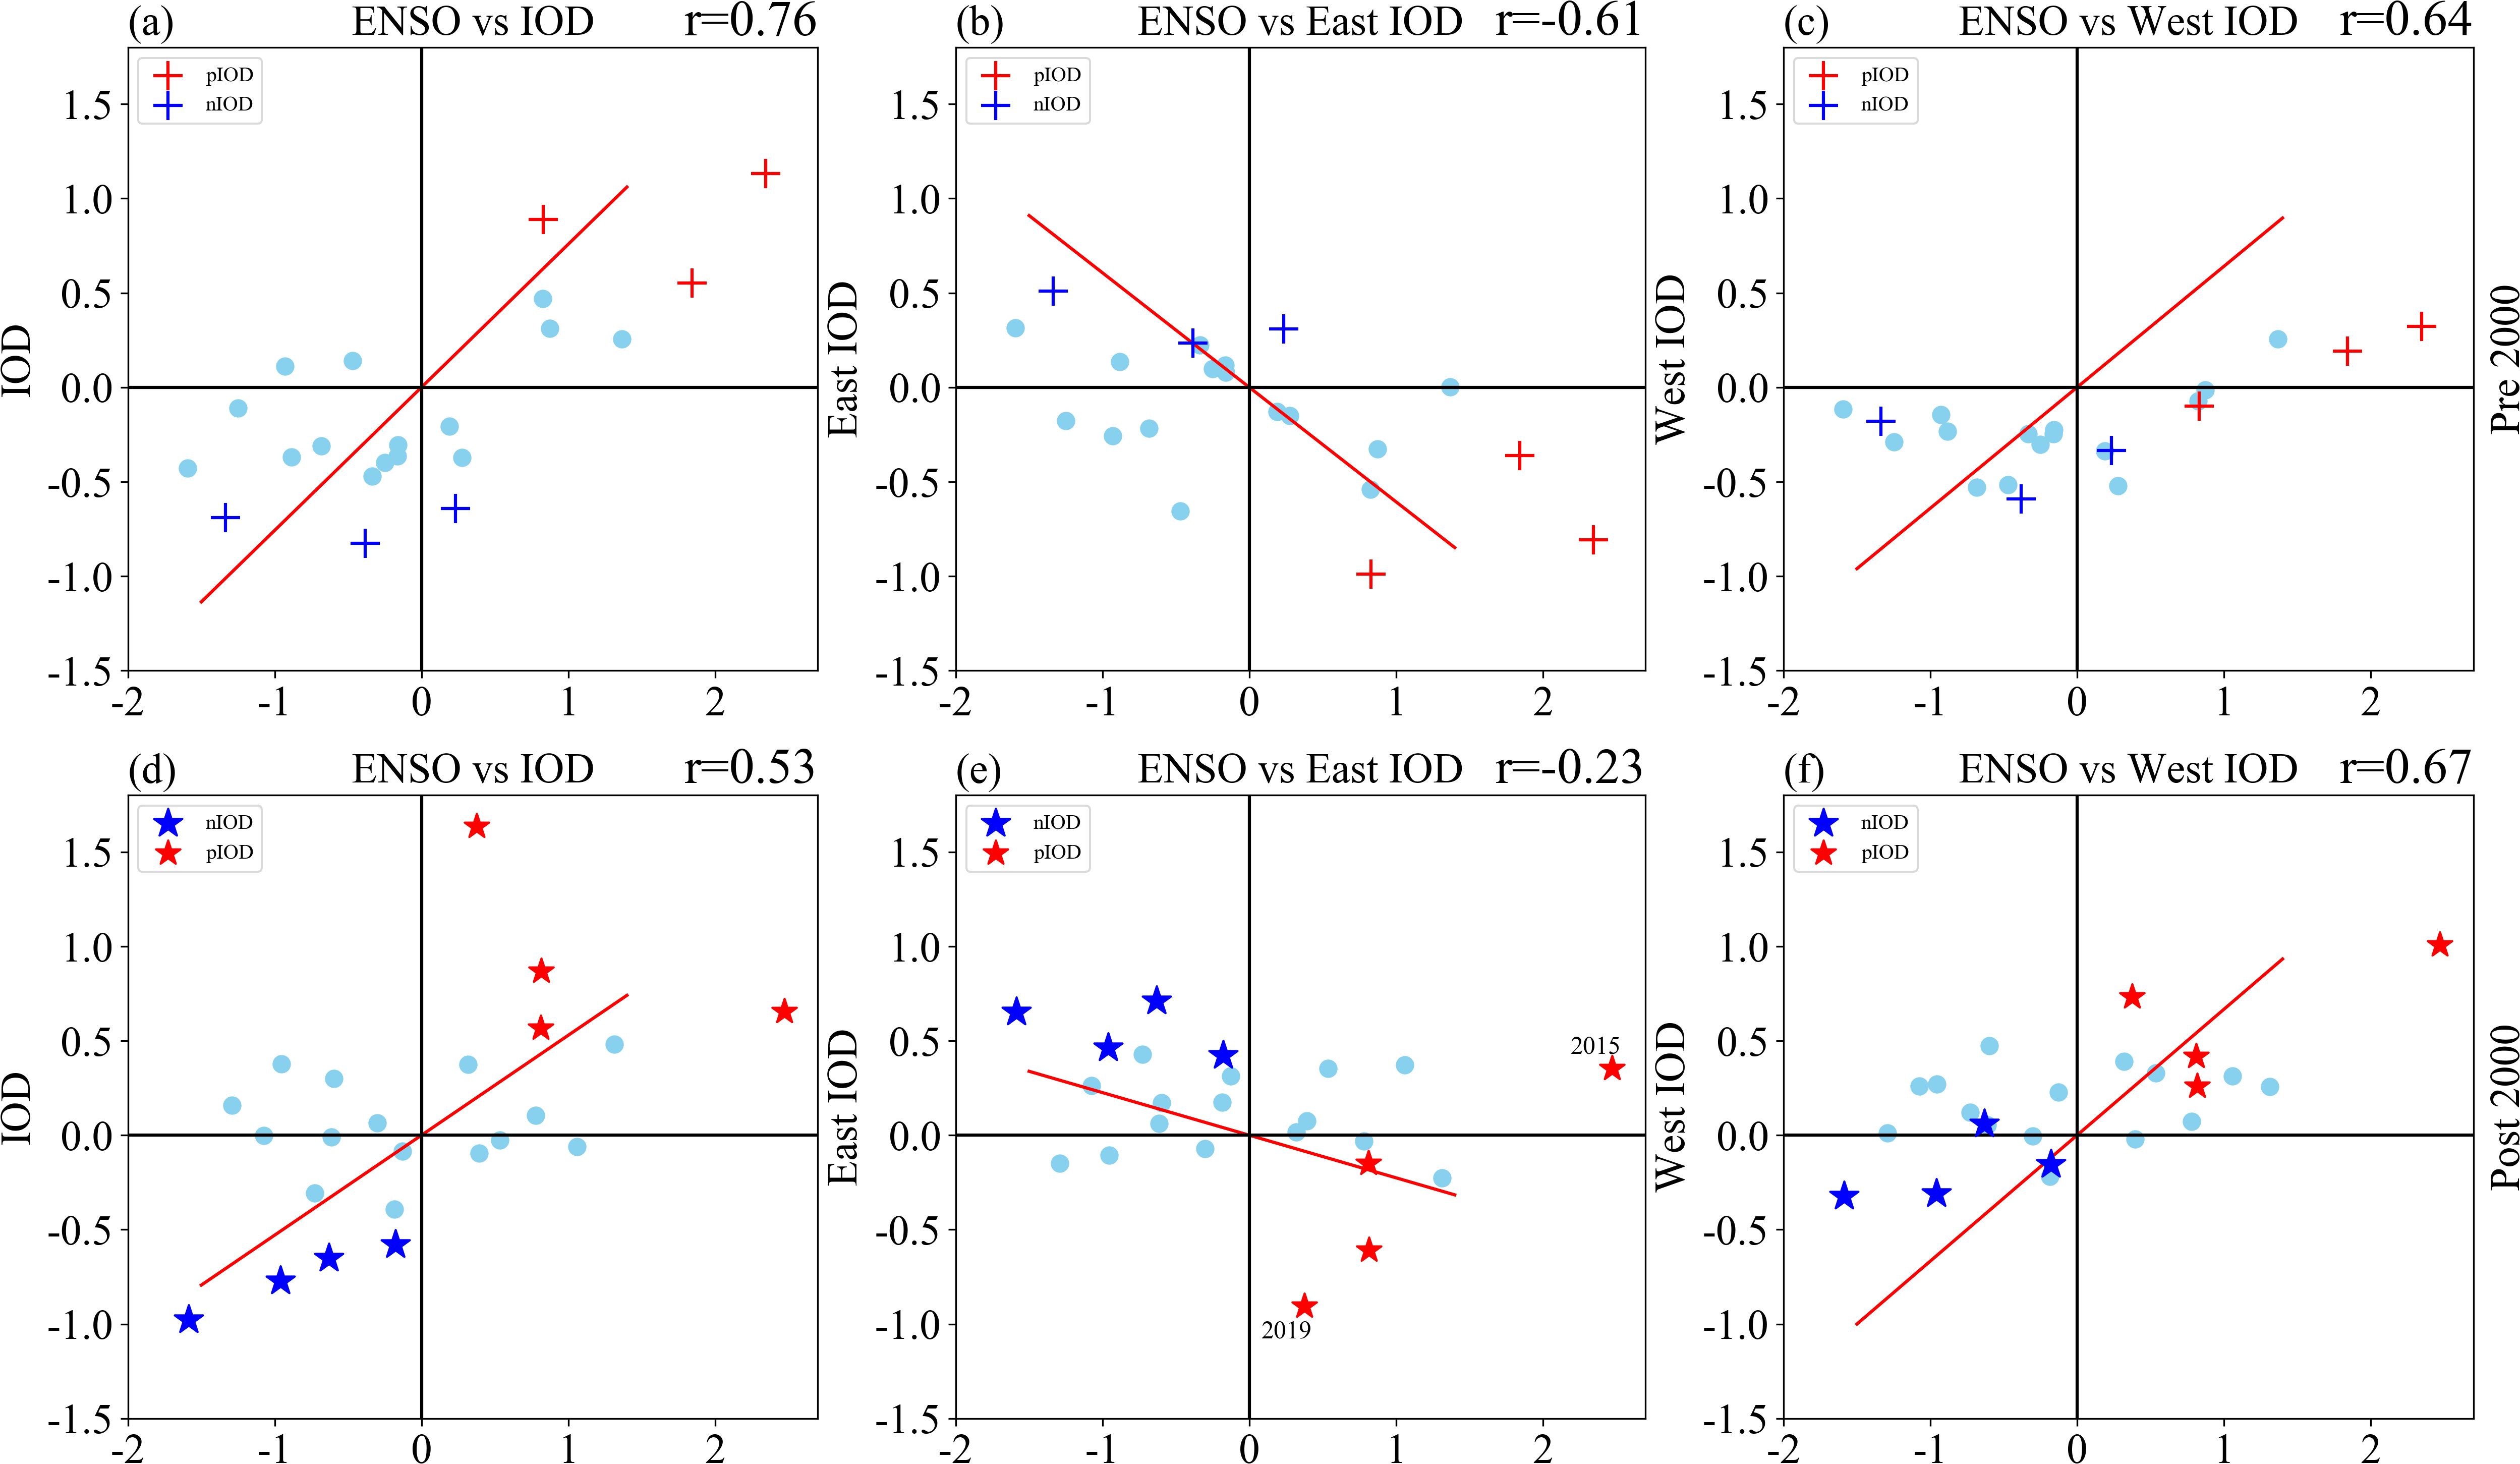
Figure 3. The scatter diagrams for the Niño34 index versus (a) the IOD index, (b) the IOD eastern pole (IOD-EP) index, and (c) the IOD western pole (IOD-WP) index in SON during the P1 subperiod. (d) as in (a), (e) as in (b), and (f) as in (c), but during the P2 subperiod. The units for these indices are °C. All are based on the ERSST.
During the P1 and P2 periods (Figures 3a, d), the Niño34 index and IOD index were highly correlated. In most cases, IOD covaried with the ENSO. This is valid for the Niño34 and IOD-WP indices during the P1 and P2 periods (Figures 3c, f) and valid for Niño34 and IOD-EP indices before 2000 (Figure 3b). It is interesting to find that there was a huge scatter in Figure 3e. This huge scatter was associated with some special years, such as 2015 and 2019. In 2015 (2019), an extreme (a weak) El Niño corresponded to a moderate (an extreme) pIOD event. This huge scatter contributed partially to the decoupling of ENSO and IOD-EP. Besides this huge scatter, all the years that the strength of the Niño34 index (including El Niño or La Niña) did not match the strength of the IOD index (including pIOD or nIOD) also contributed to the decoupling of ENSO and IOD-EP after 2000 (Figure 3e).
During 1979–1999, ENSO influenced the interannual SST anomalies in both IOD-EP and IOD-WP (Figure 4a). After 2000, this connection between ENSO and SSTA in IOD-EP remarkably decreased (Figure 4b). The significant negative regression coefficient near Java and Sumatra, which was emerging in the P1 period in the 95% confidence test, disappeared in the P2 period. In contrast, the influence of ENSO on the SSTA in IOD-WP strengthened after 2000 (Figure 4b), especially in the equatorial western-central Indian Ocean. These results (Figures 4a, b) are consistent with those in the scatter plots (Figure 3).
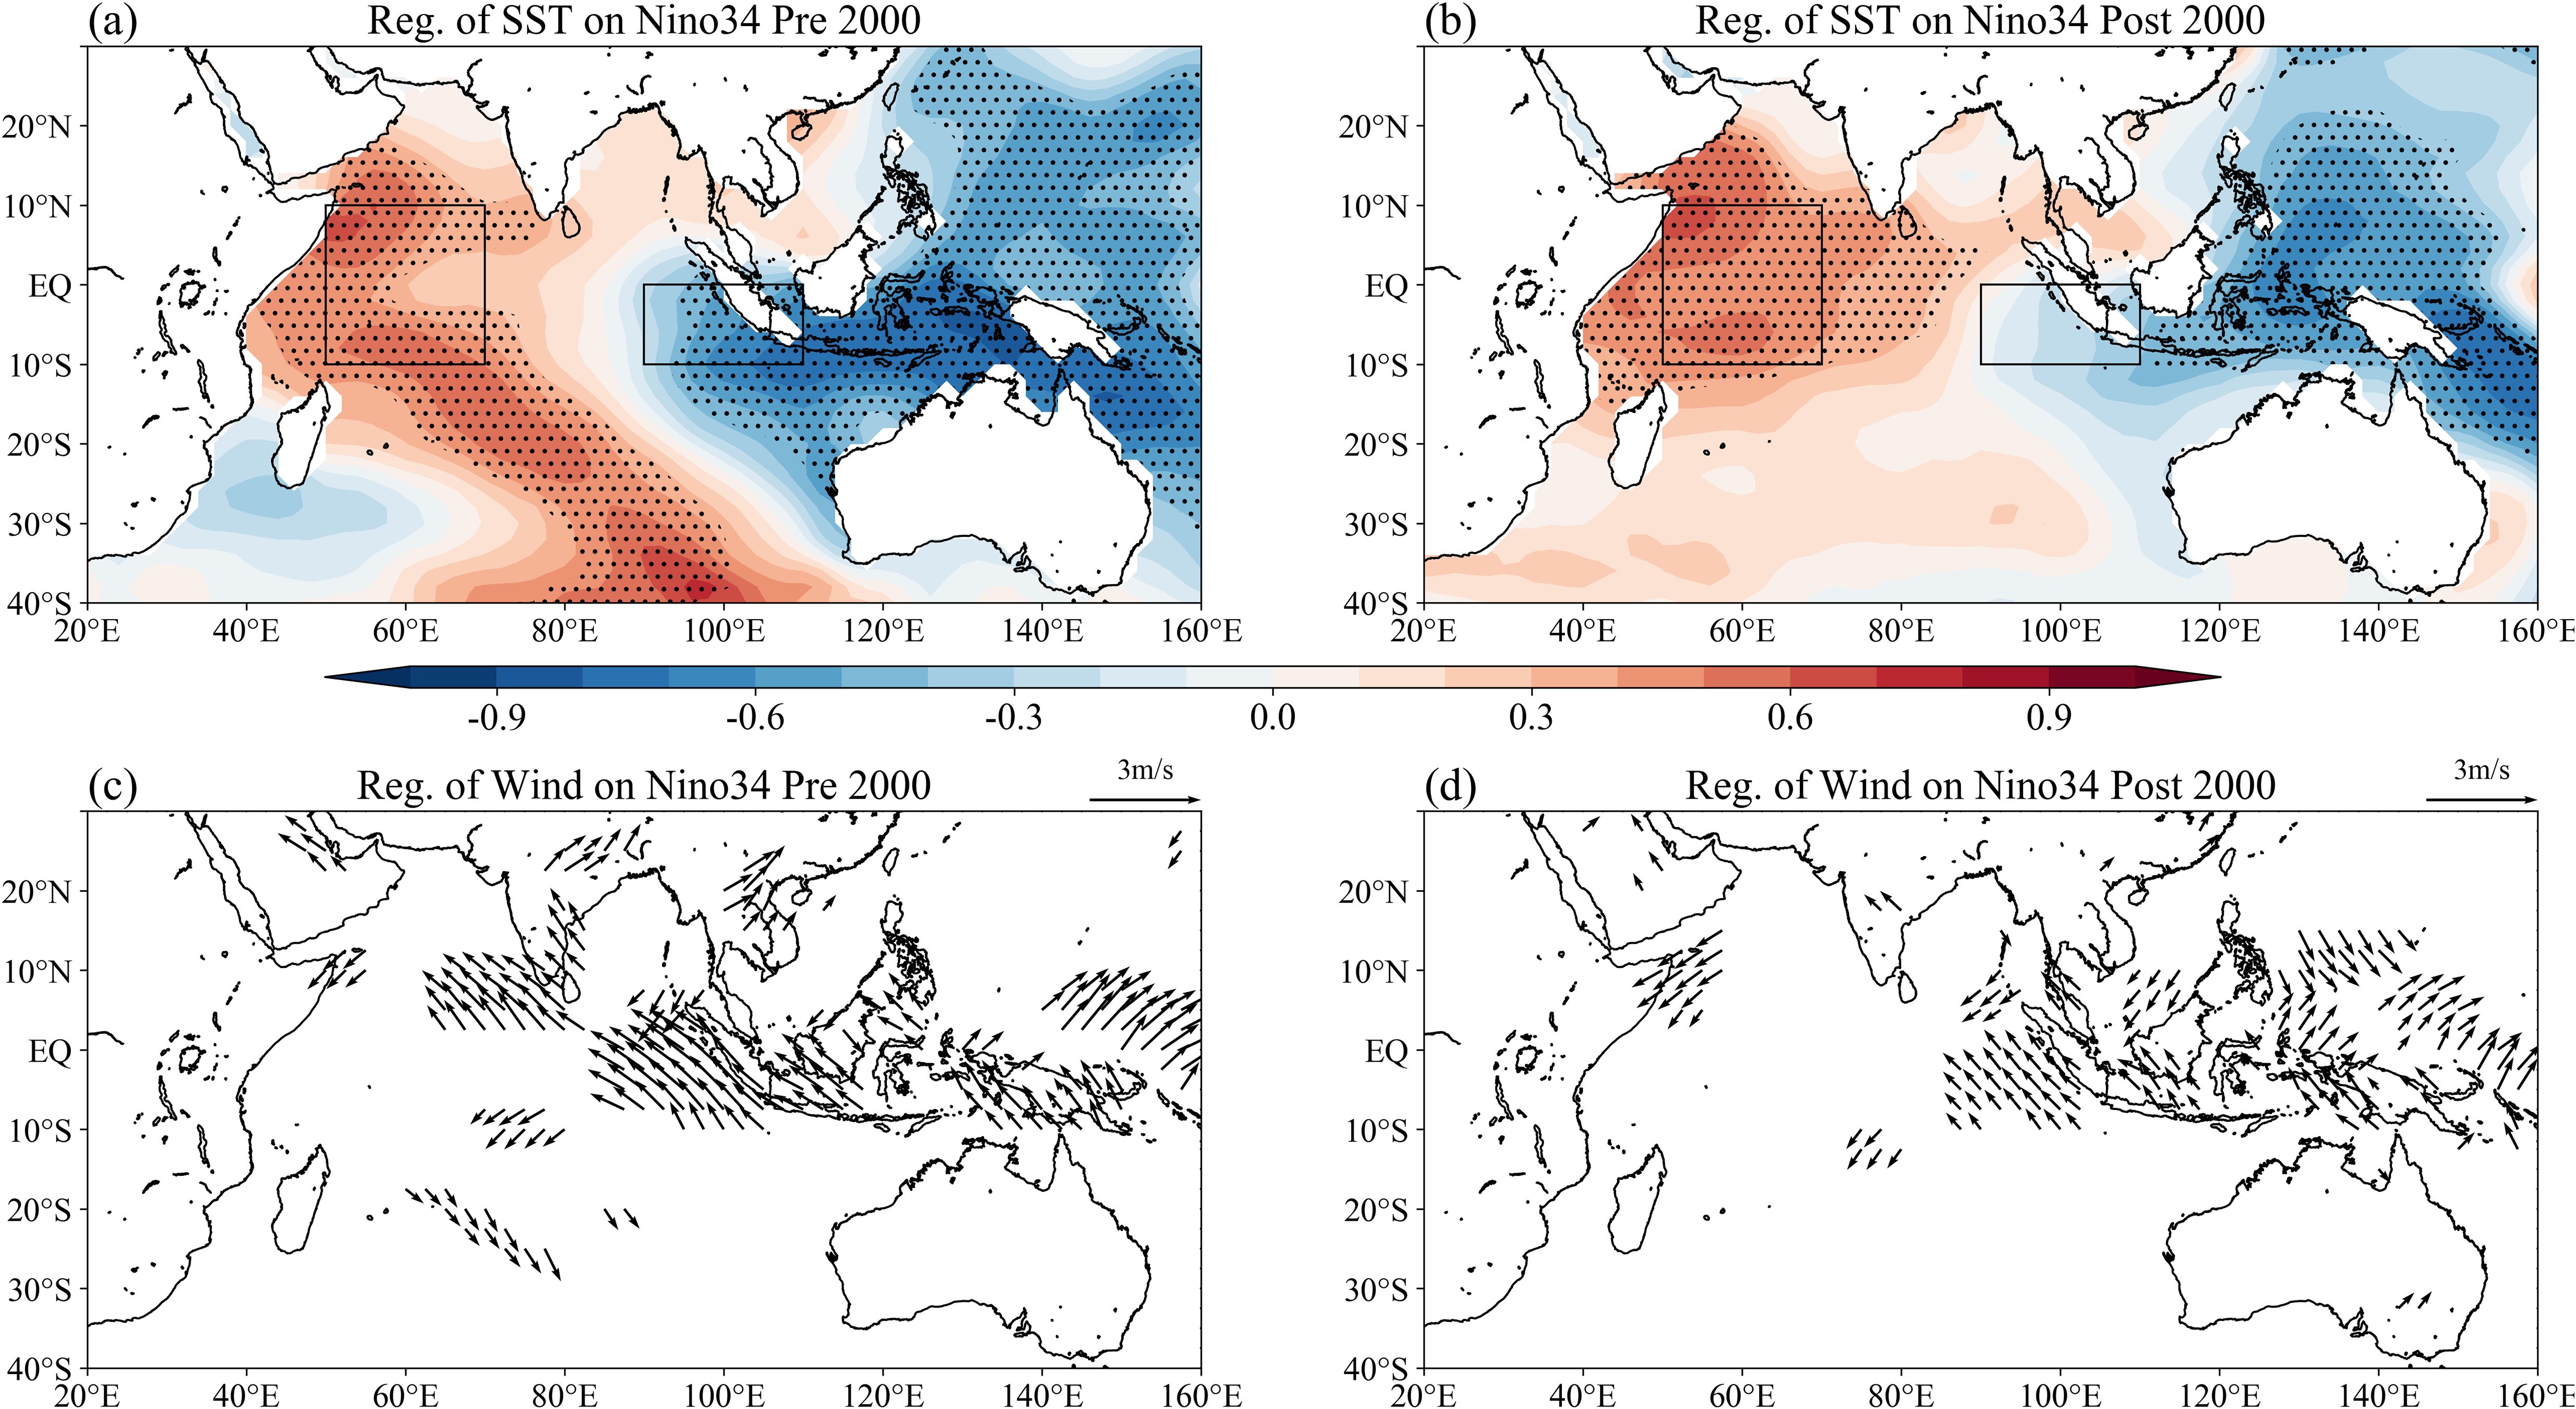
Figure 4. Regression of SSTA on the Niño34 index in SON during (a) the P1 subperiod and (b) the P2 subperiod. The dotted areas indicate that the correlations are significant at a 95% confidence level. The black boxes denote the western and eastern poles of IOD. Regression of surface winds on the Niño34 index in SON during (c) the P1 subperiod and (d) the P2 subperiod. The areas where the correlations pass the confidence test at the 95% confidence level are shown. All these indices are normalized. The SST is based on the ERSST; the surface wind is based on the NCEP1.
This point is also reflected in the connection between ENSO and anomalous wind fields (Figures 4c, d). After 2000, like SSTA, the influences of ENSO on the surface winds near Java and Sumatra also weakened with a shrinking “significant correlation” region. In contrast, the influences of ENSO on the surface winds along the eastern coast of Africa strengthened after 2000. During autumn, although the southwesterly winds weaken compared to those in summer, the climatological wind field remains predominantly southwesterly (Cherchi et al., 2007), accompanied by the associated East African Coastal Current (Zheng et al., 2024). The anomalous northeasterly winds associated with El Niño weakened the climatic southwesterly winds along the eastern coast of Africa, resulting in decreased upwelling and SST warming in IOD-WP.
3.2 Atmospheric processes and oceanic wave processes
To explore the mechanisms of the changes in this relationship, this section will analyze atmospheric processes and oceanic wave processes. Considering the asymmetrical effect of ENSO on the IOD events, we discuss both pIOD and nIOD events.
3.2.1 Atmospheric processes: ENSO influencing IOD-EP in different periods
In the atmospheric process analysis, the SST, wind, and SLP are all anomalies on the interannual timescales. The vertical motion branch of the Walker circulation in the Maritime Continent region can be regarded as a bridge for ENSO to influence IOD. We first examined the positive events. During the P1 period, the anomalous descending branch located in the MC area was very strong (Figure 5a) and affected by strong El Niño events (Figures 2a, 5c). During the P2 period, the anomalous descending branch in the MC area had greatly weakened (Figure 5b) and was affected by weak El Niño events (Figures 2b, 5d).
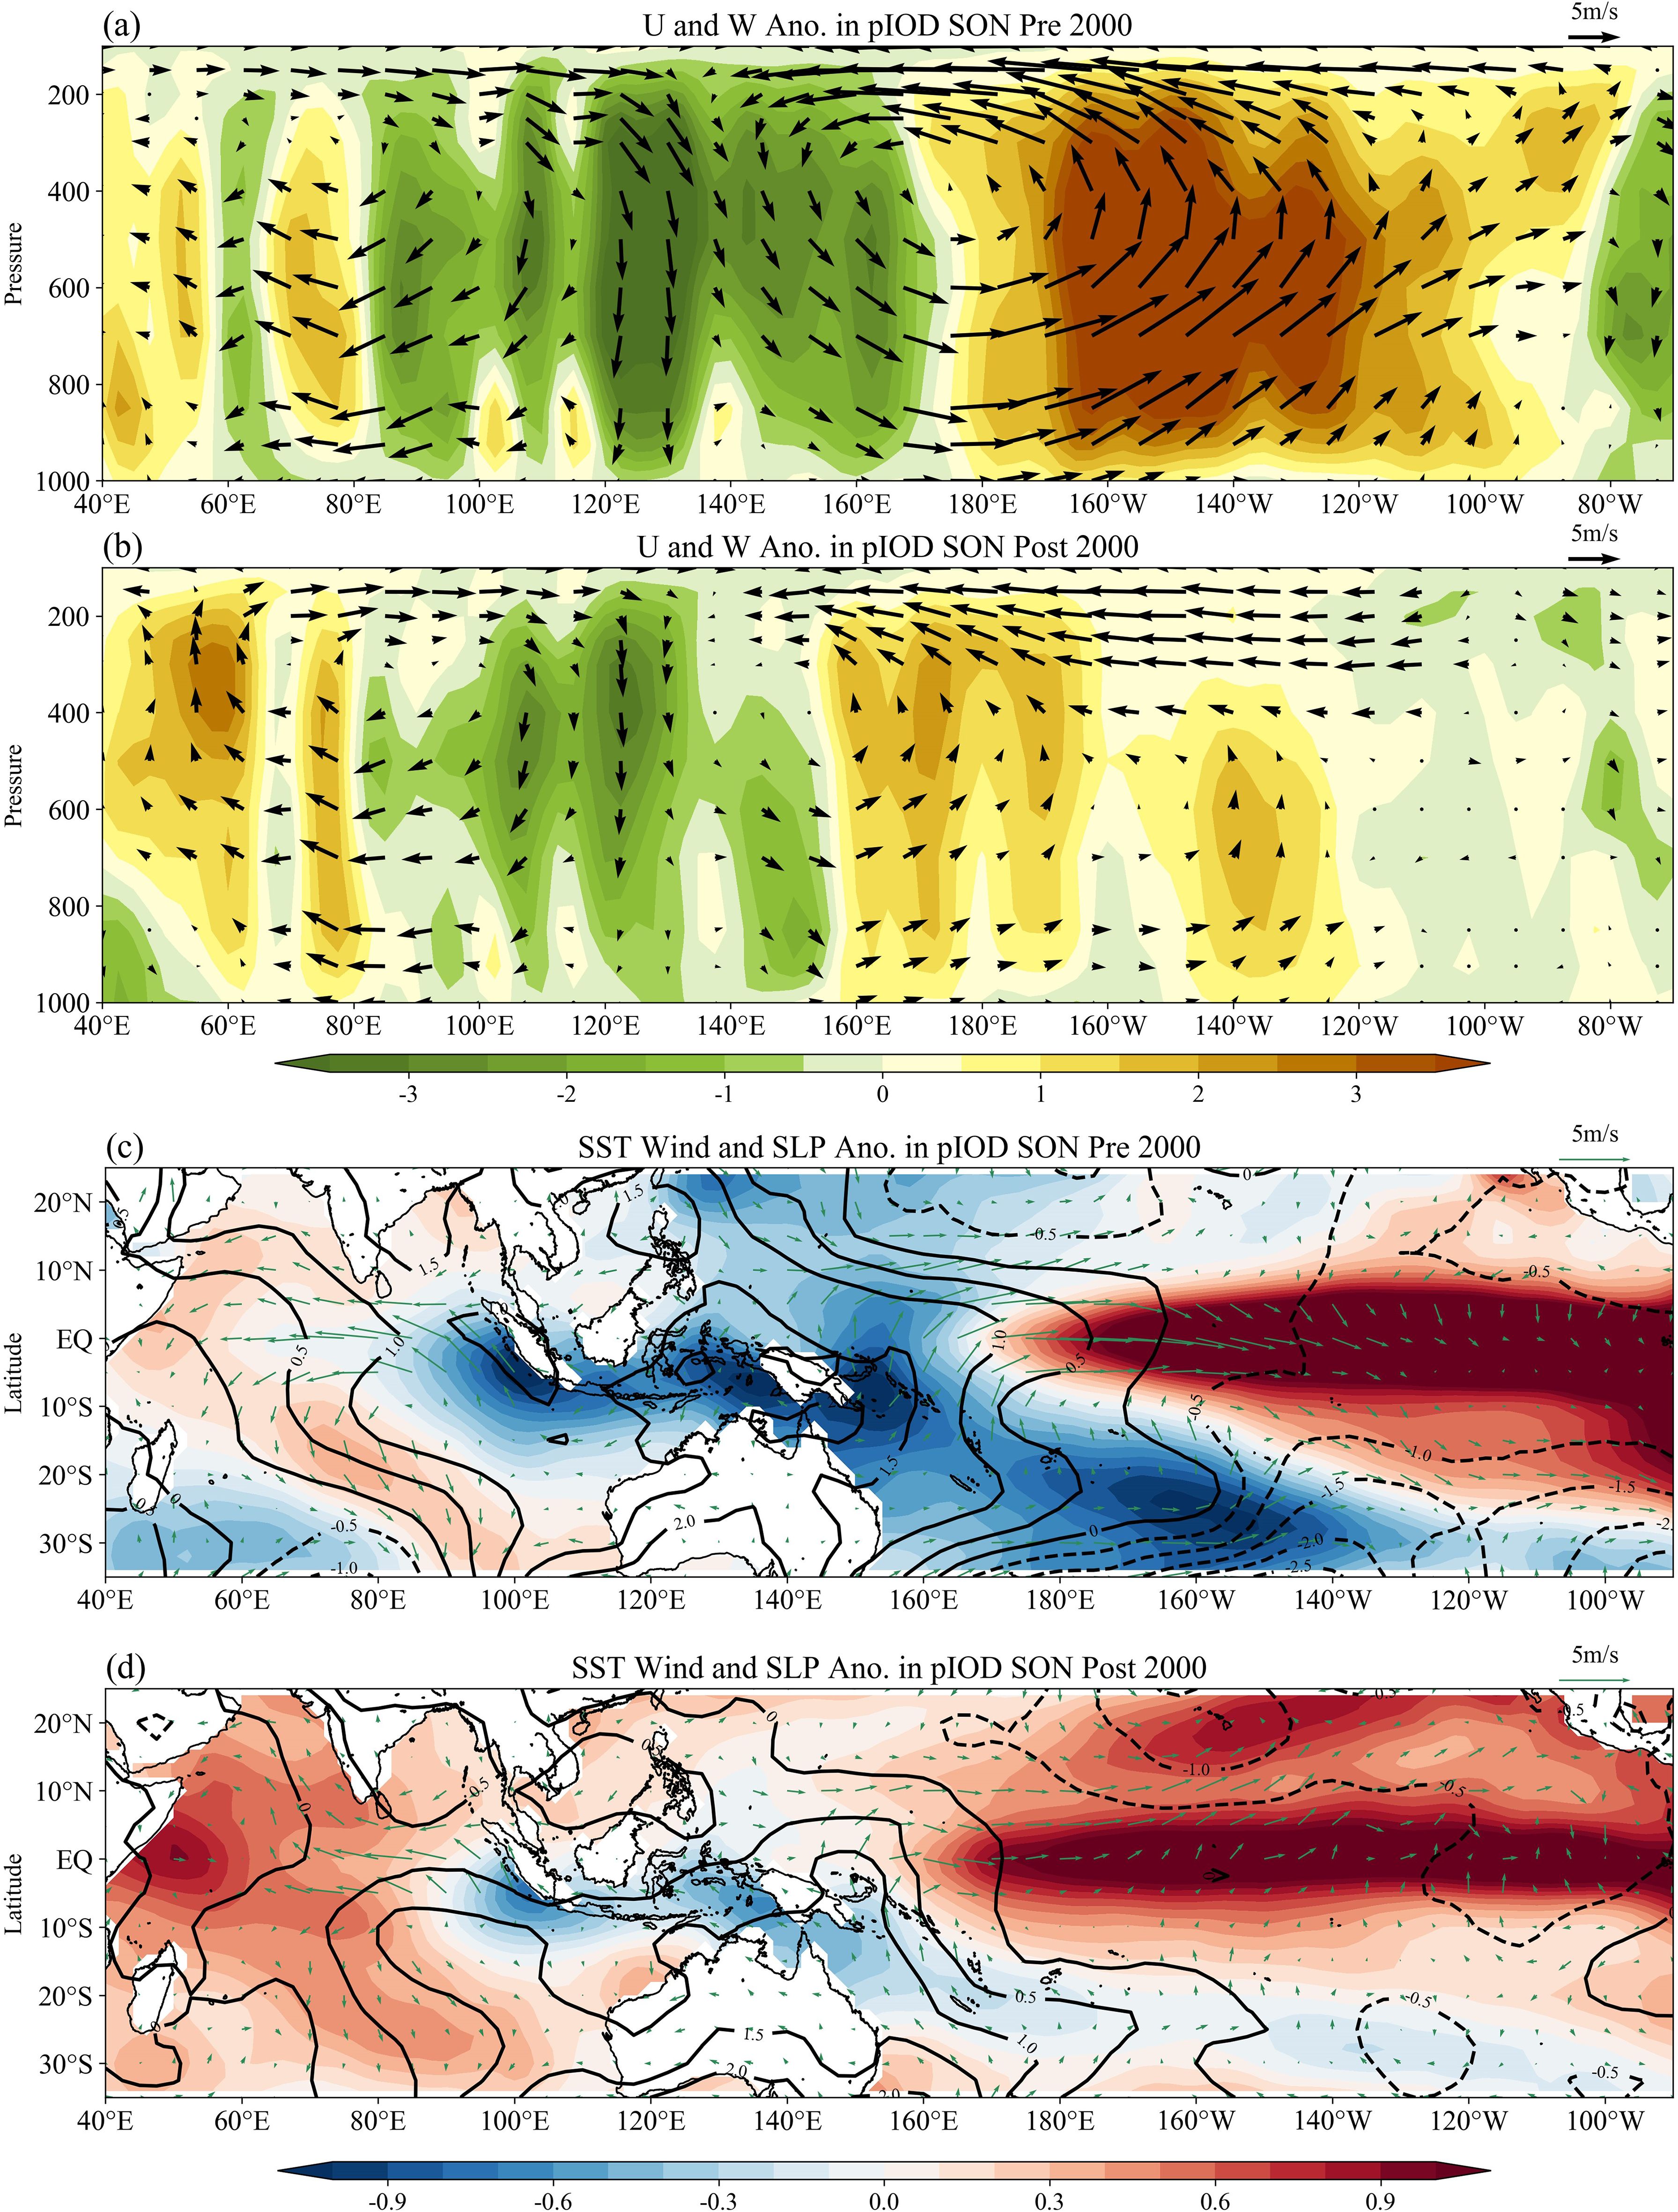
Figure 5. Walker circulation anomalies (black vector, units: m/s) and vertical velocity anomalies (shaded, units: 10–2 Pa/s) in SON for the composite of pIOD events during (a) the P1 period and (b) the P2 period. The Walker circulation anomalies are within a certain latitude band (2°S-2°N). Spatial patterns of anomalous SST (shaded, units: °C), surface winds (green vector, units: m/s), and SLP (contour, units: hPa) in SON for the composite of pIOD events during (c) the P1 period and (d) the P2 period. The SST is based on the ERSST; the Walker circulation, surface wind, and SLP are based on the NCEP1.
The horizontal wind field, SLP, and SST in the Indo-Pacific region also exhibited the atmospheric processes. Before 2000 (Figure 5c), El Niño displayed strong intensity and the western Pacific was warmer and the eastern Pacific was colder than normal during El Niño. Consequently, the anomalous sinking branch of Walker circulation in the MC region was strong, and the intense southeasterly wind anomalies in the eastern IO led to strong upwelling and SST cooling, which favors an intense EP of pIOD events. After 2000 (Figure 5d), the strength of El Niño weakened, and the zonal SST and SLP gradient over the tropical Pacific also weakened. As a result, the anomalous sinking branch of Walker circulation in the MC region decreased and the easterly wind anomalies and upwelling in IOD-EP weakened, which favors a weakened SST cooling in IOD-EP. Overall, the connection between El Niño and pIOD-EP decreased after 2000. In addition, after 2000 (Figure 5d), the weaker surface winds in the central equatorial Indian Ocean corresponded to a weakened SST cold tongue in the central Indian Ocean during pIOD events, which may have induced weak SST warming in the western Indian Ocean. After 2000, the anomalous northeasterly winds off the eastern African coast strengthened (Figure 4d), which were also conducive to the SST warming in IOD-WP. The variation of SST in IOD-WP was also influenced by oceanic wave processes.
We then examined the negative events. The changes in the relationship between La Niña and nIOD were the opposite, as the nIOD-associated La Niña events strengthened after 2000. During the P1 period, the anomalous ascending branch located in the MC area was very weak (Figure 6a), affected by weak La Niña conditions (Figures 2c, 6c). During the P2 period, the anomalous ascending branch in the MC area strengthened (Figure 6b) and was affected by strong La Niña events (Figures 2d, 6d).
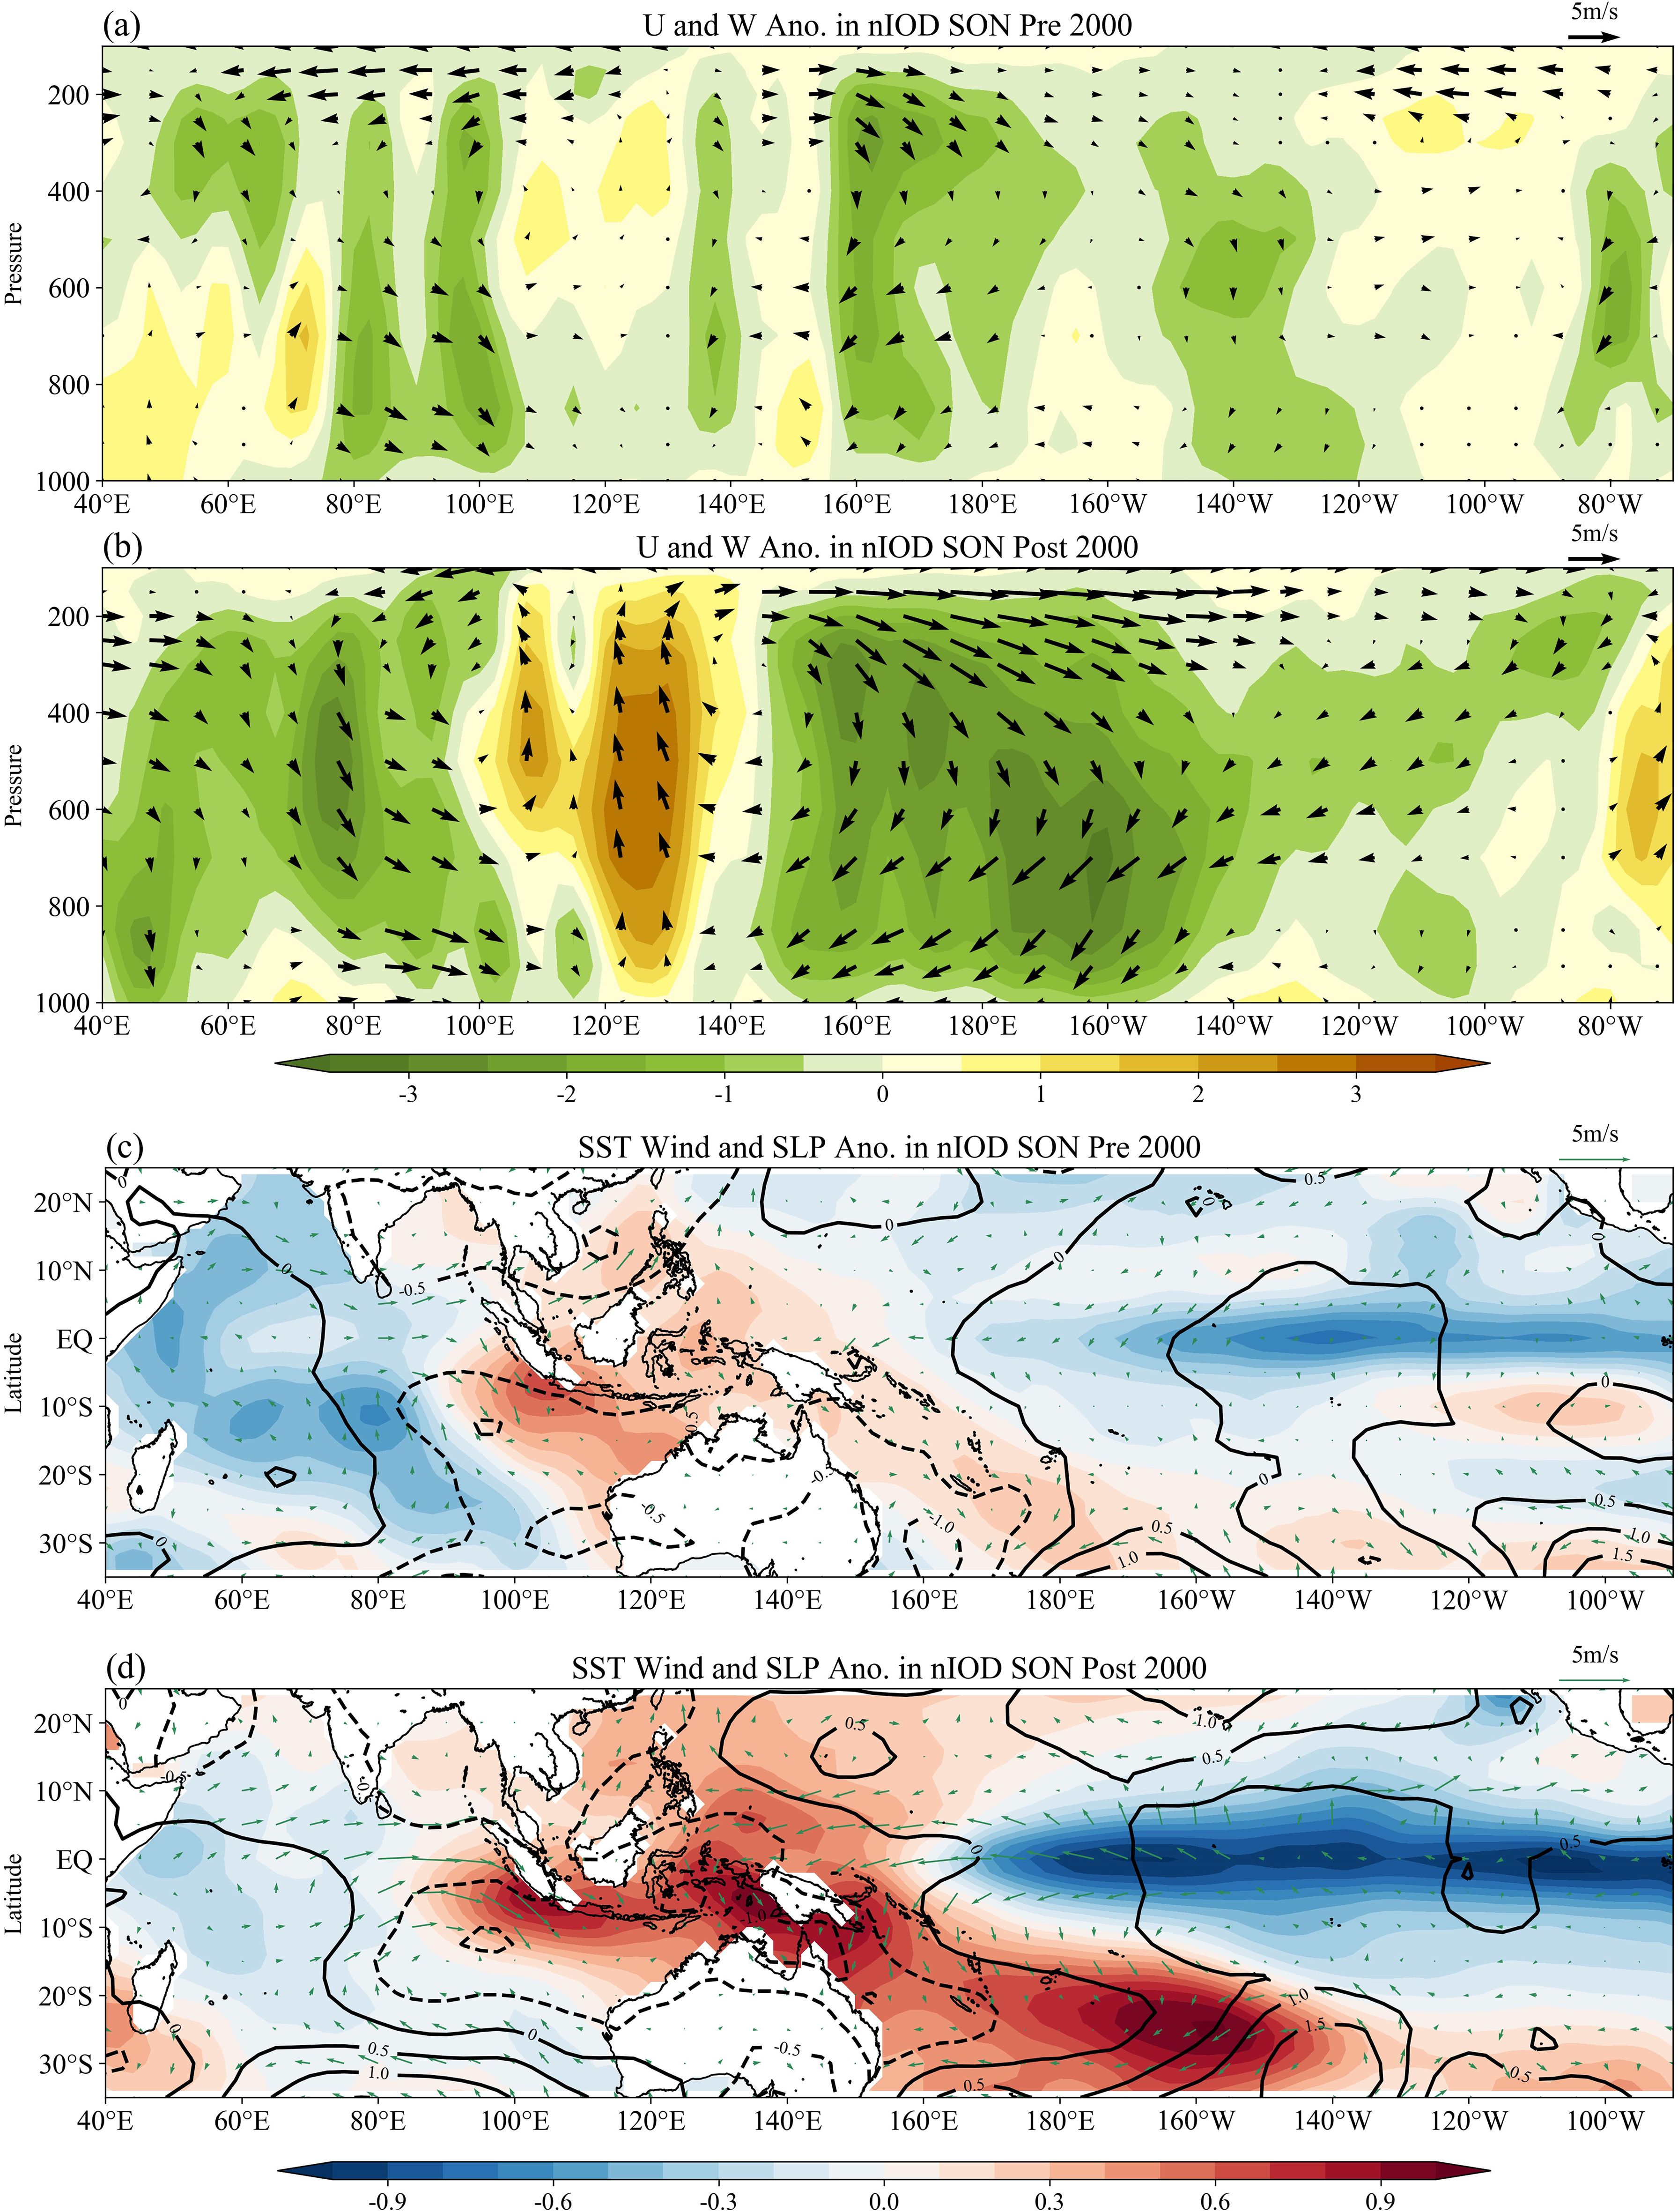
Figure 6. Walker circulation anomalies (black vector, units: m/s) and vertical velocity anomalies (shaded, units: 10-2 Pa/s) in SON for the composite of nIOD events during (a) P1 period; and (b) P2 period. The Walker circulation anomalies are within a certain latitude band (2°S-2°N). Spatial patterns of anomalous SST (shaded, units: °C), surface winds (green vector, units: m/s) and SLP (contour, units: hPa) in SON for the composite of nIOD events during (c) P1 period; and (d) P2 period. The SST is based on the ERSST; the Walker circulation, surface wind and SLP are based on the NCEP1.
The spacial pattern of horizontal wind field, SLP, and SST in the Indo-Pacific region are exhibited in Figures 6c. Before 2000 (Figure 6c), there was a weak zonal SST gradient over the tropical Pacific, i.e., a weak La Niña condition. Subsequently, the anomalous ascending branch of Walker circulation in the MC region was weak, and the weak westerly wind anomalies and SST warming emerged in the eastern IO, which favors a relatively weak EP of nIOD events. After 2000 (Figure 6d), the associated La Niña condition strengthened, including a strengthened zonal SST and SLP gradient over the tropical Pacific. As a result, the anomalous ascending branch of Walker circulation in the MC region intensified, and the westerly wind anomalies in IOD-EP were enhanced, which favors strengthened SST warming in IOD-EP. Overall, the connection between La Niña and nIOD-EP increased after 2000.
In short, the connection between El Niño and the pIOD-EP decreased after 2000 (Figure 5), while the connection between La Niña and the nIOD-EP increased after 2000 (Figure 6). The weakening of the relationship between ENSO and IOD-EP (Figure 3e) can be attributed to the weakening connection between El Niño and pIOD-EP (Figure 5).
3.2.2 Oceanic wave processes: internal processes within the IO influencing IOD-WP in different periods
3.2.2.1 Equatorial and extra-equatorial Rossby waves
The above section suggests that the atmospheric processes induced by ENSO events mainly directly impacted the IOD-EP. This section depicts the influences of Rossby waves on the IOD-WP. Rossby waves can be further divided into two types: (1) equatorial Rossby waves reflected by the Kelvin waves, and (2) Rossby waves in the extra-equatorial region.
In the oceanic wave process analysis, the SLA daily data were sea level anomalies on the interannual timescales. Figures 7a–d demonstrate the effects of Rossby waves reflected by Kelvin waves on IOD-WP. In the Pacific Ocean, the delayed-oscillator theory is described (Battisti, 1988; Suarez and Schopf, 1988). In the Indian Ocean, there is also a mutual transformation between Rossby waves and Kelvin waves. At the western boundary, westward propagating Rossby waves transform into coastal Kelvin waves and reflect as Kelvin waves in the equatorial region. At the eastern boundary, equatorial eastward propagating Kelvin waves reflect as equatorial Rossby waves. For the pIOD events (Figures 7a, b), in the P2 period, the strength of equatorial oceanic waves (including Kelvin waves and Rossby waves) was stronger than that in period P1. In spring, the downwelling Kelvin waves associated with the SST warming in the western IO propagated eastward and were reflected as downwelling Rossby waves at the eastern boundary. The equatorial downwelling Rossby waves then propagated westward. In autumn, these downwelling Rossby waves reached the western IO. Stronger downwelling Kelvin waves induce stronger downwelling Rossby waves, and these intensified downwelling Rossby waves were conducive to the SST warming in IOD-WP and hence the generation of pIOD events. For the nIOD events (Figures 7c, d), the downwelling Kelvin waves were also intensified after 2000, which induced intensified downwelling Rossby waves during the P2 period. These intensified downwelling Rossby waves weakened the SST cooling in IOD-WP and hence weakened the generation of nIOD events during the P2 period. In addition, the SST warming in nIOD-EP caused by the Walker circulation was very pronounced, and the equatorial SST gradient was still formed. Following the Bjerknes feedback, the nIOD events can still occur even if they are affected by oceanic wave processes that are not conducive to the SST cooling in nIOD-WP.
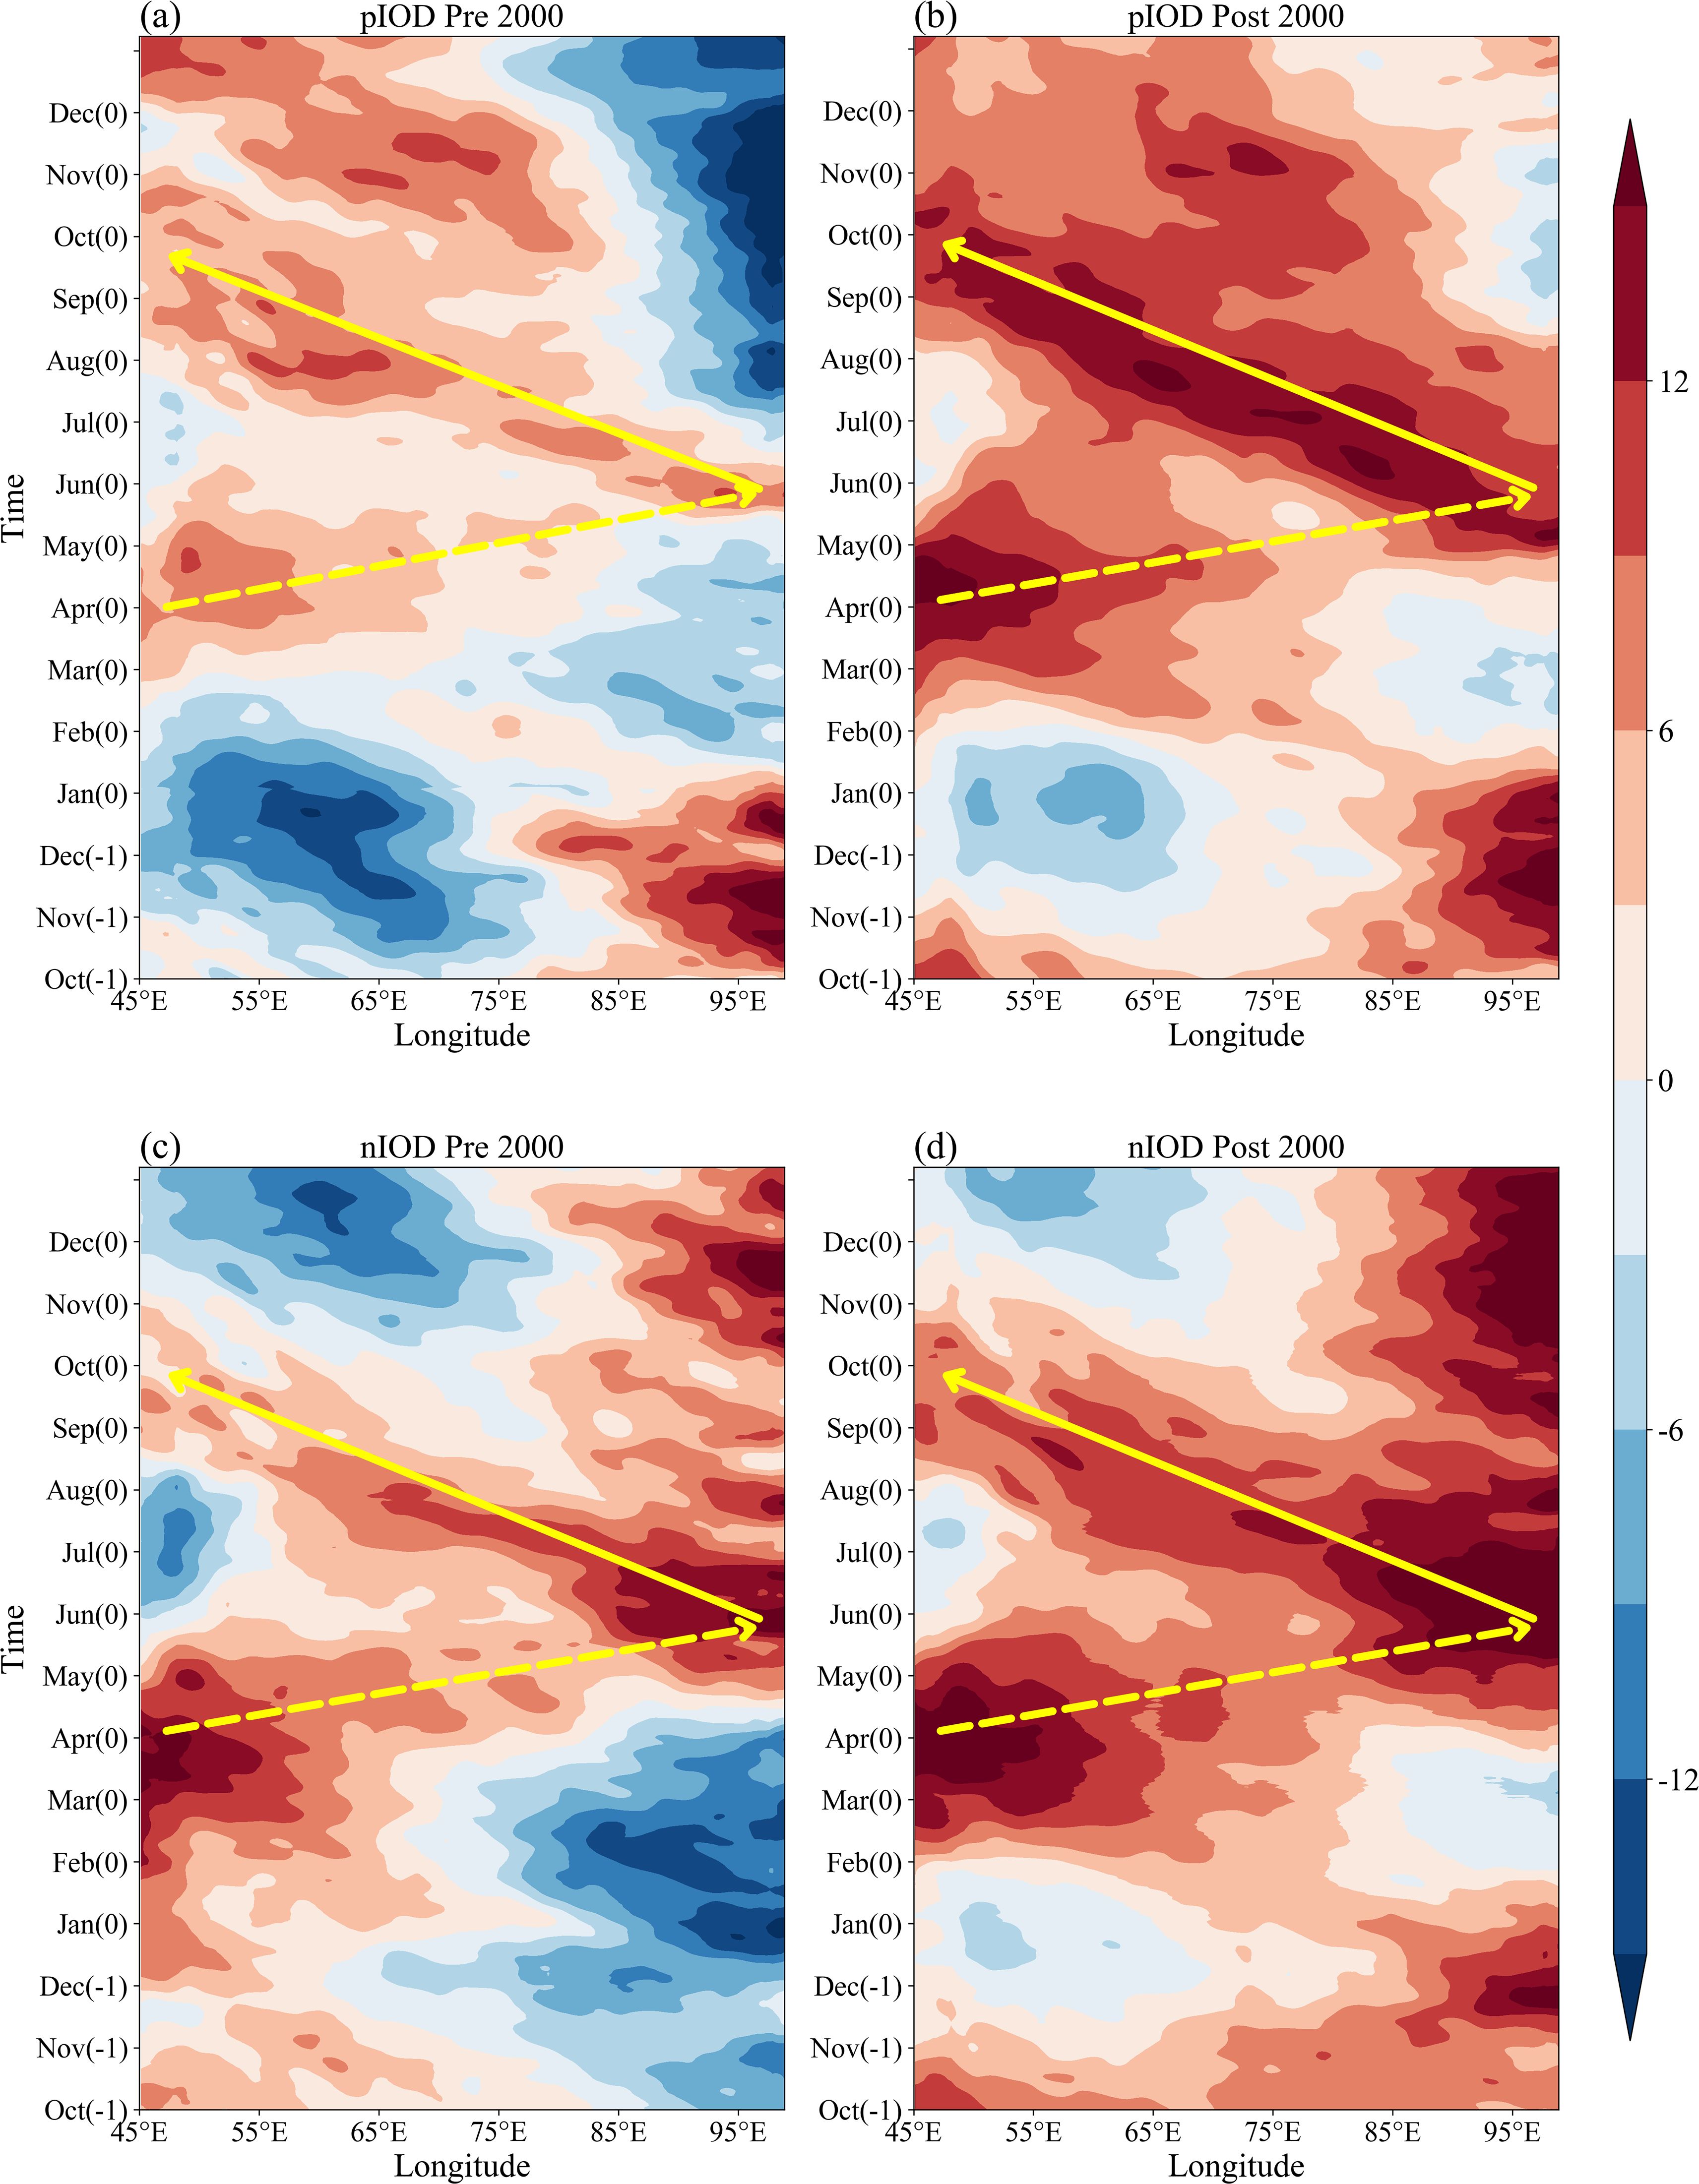
Figure 7. The time evolution of meridional mean sea level anomaly (SLA, units: cm) in equatorial IO (5°S-5°N) for the composite of pIOD events during (a) the P1 period and (b) the P2 period. (c) as in (a), and (d) as in (b), but for the composite of nIOD events. The SLA data are based on the AVISO. The dashed yellow arrows indicate the Kelvin waves, and the solid yellow arrows indicate the Rossby waves. The numbers in parentheses following the months are 0 for the year of IOD and -1 for the previous year of IOD.
Figures 8a–d depict the influence of extra-equatorial Rossby waves on IOD-WP. These waves, which originate outside the equator, can be triggered by wind stress anomalies. The origins of these wind stress anomalies can be traced back to the preceding autumn and winter seasons (Masumoto and Meyers, 1998; Rao et al., 2002; Xie et al., 2002). The warming (cooling) of the western and central TIO basin during the spring of the El Niño (La Niña) the following year can be explained by the theory relevant to the generation of the IOB mode (Xie et al., 2002). During March-May for pIOD events after 2000 (Figure 8b), the tropical central and western IO experienced downwelling Rossby waves and a warming of SST. These downwelling Rossby waves propagated westward and warmed the SST in IOD-WP in SON, which was favorable for the generation of pIOD events. During March-May for nIOD events after 2000 (Figure 8d), the tropical central and western IO also experienced downwelling Rossby waves and a warming of SST. These downwelling Rossby waves propagated westward and warmed the SST in IOD-WP in SON, which was unfavorable for the generation of nIOD events.
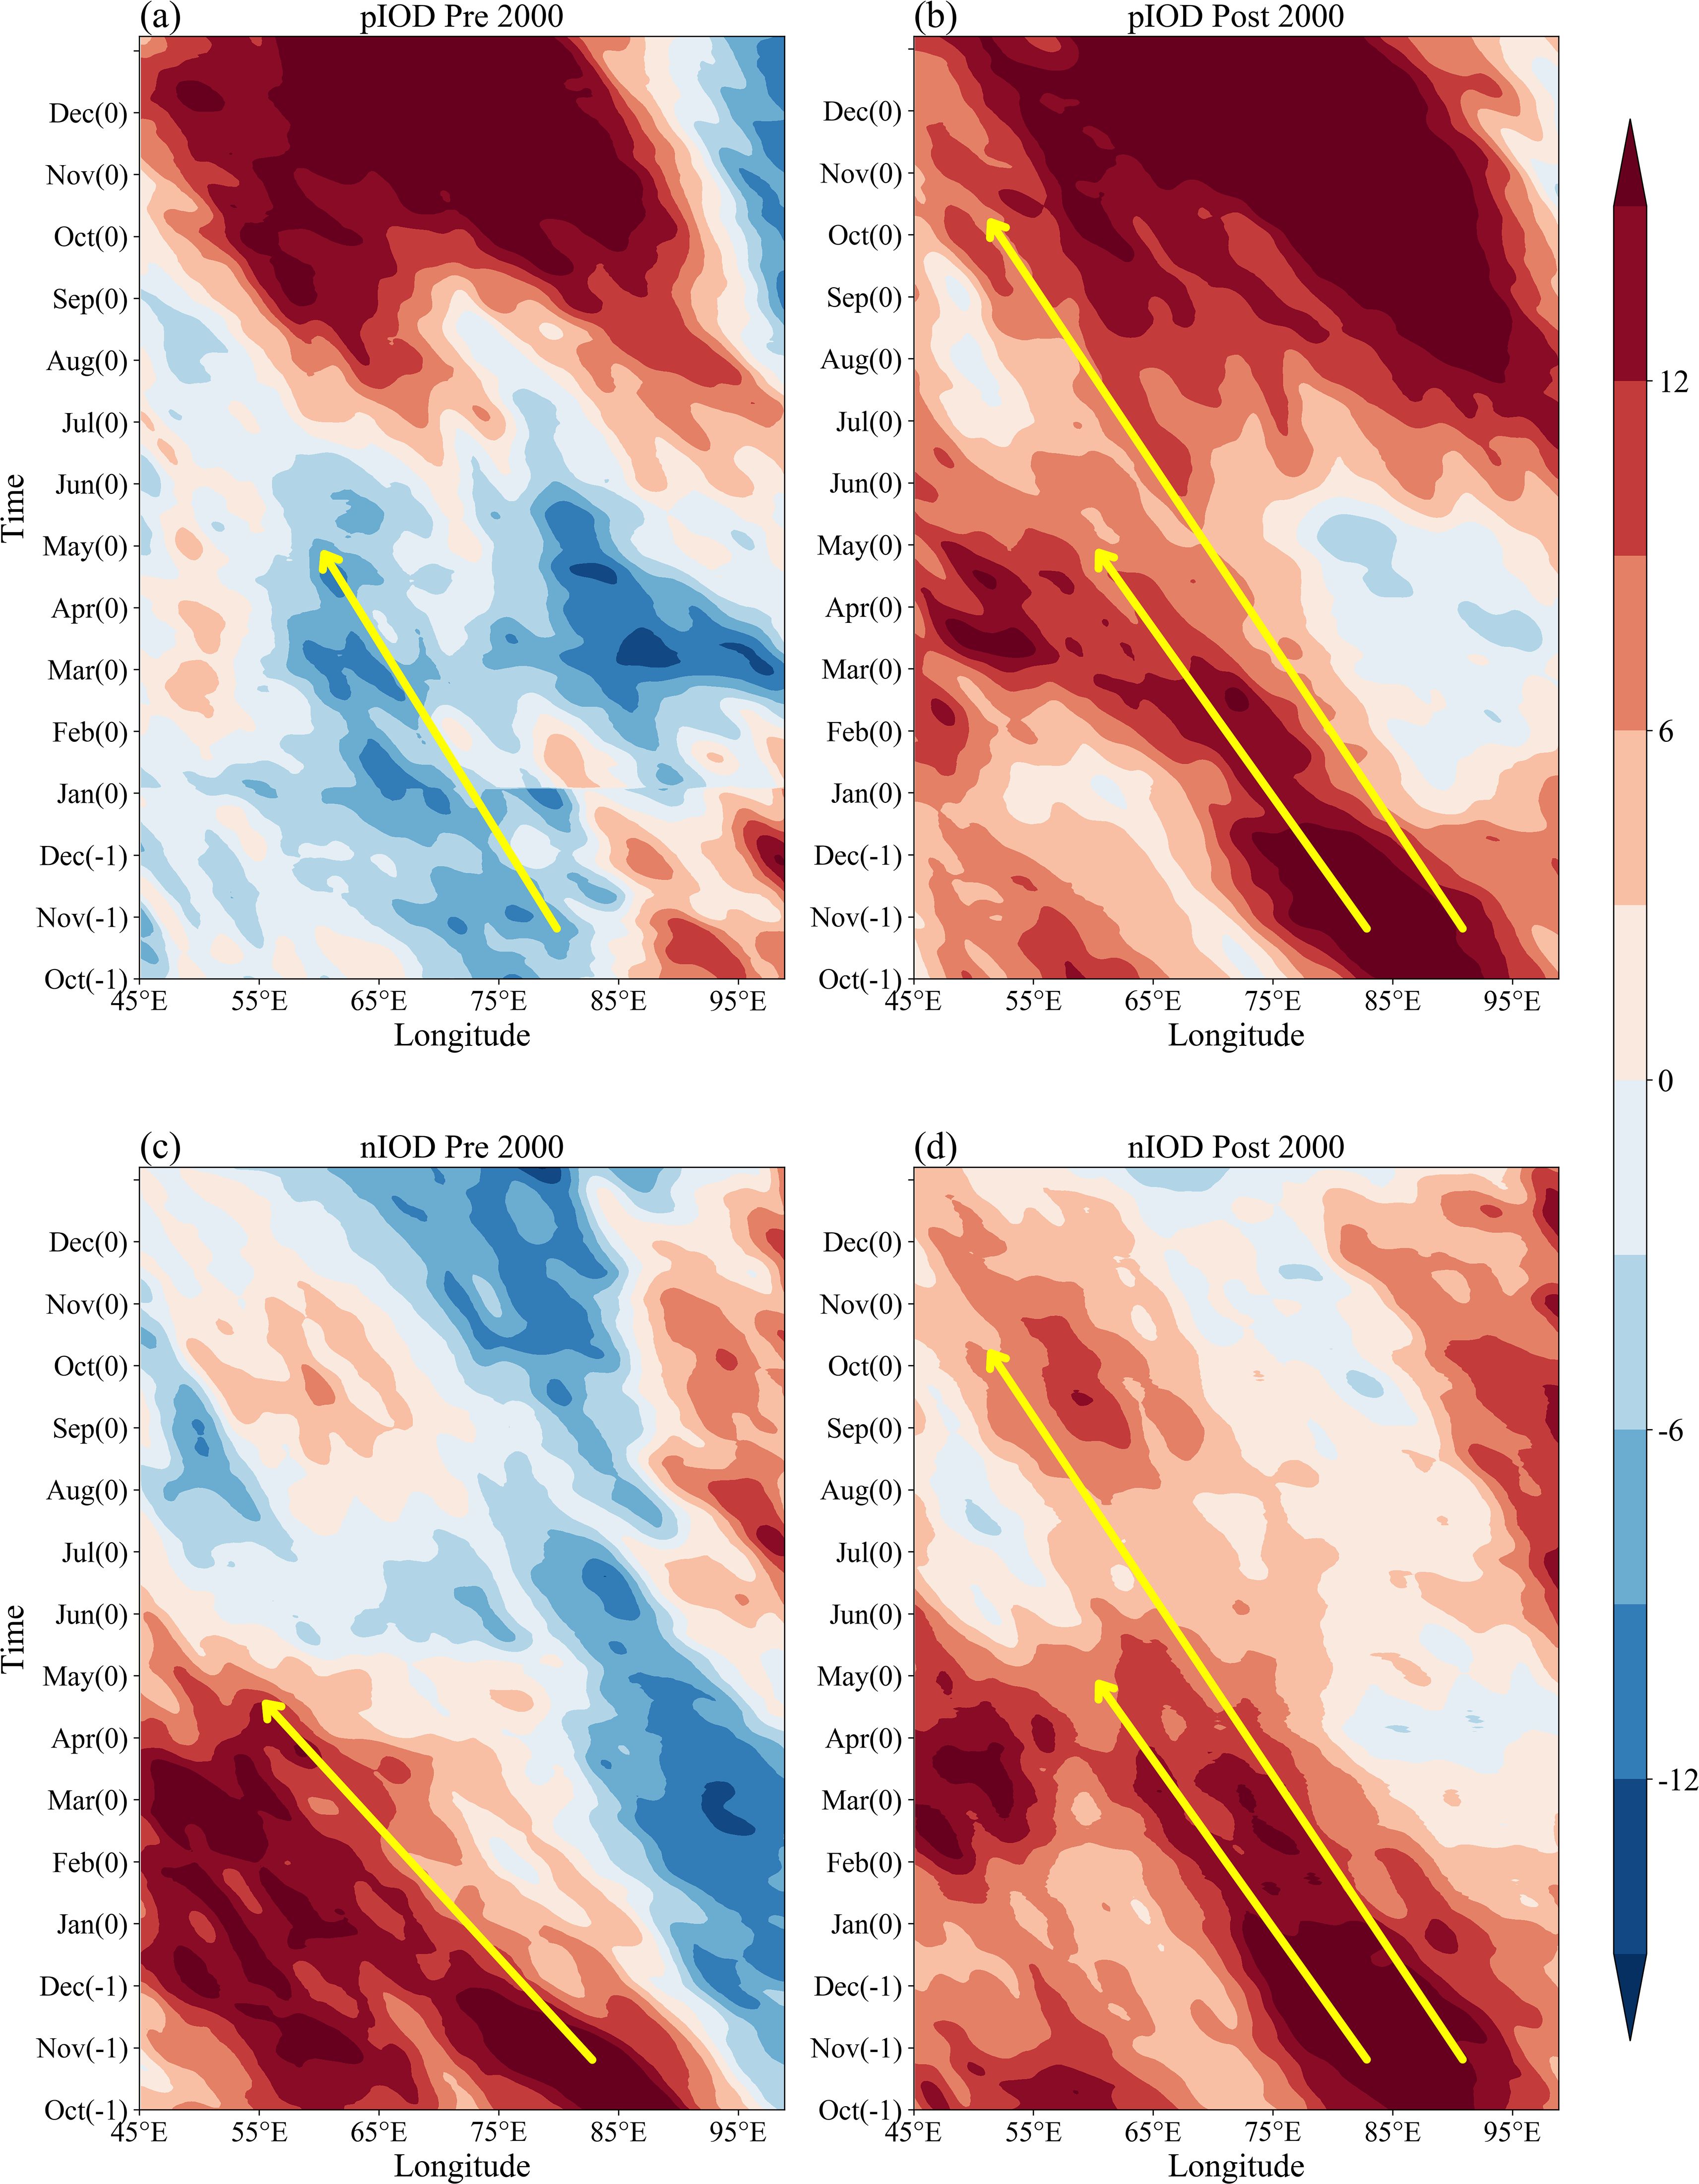
Figure 8. The time evolution of meridional-mean sea level anomaly (SLA, units: cm) in extra-equatorial IO (6°S-10°S) for the composite of pIOD events during (a) the P1 period and (b) the P2 period. (c) as in (a), and (d) as in (b), but for the composite of nIOD events. The SLA data are based on the AVISO. The solid yellow arrows indicate the Rossby waves. The numbers in parentheses following the months are 0 for the year of IOD and -1 for the previous year of IOD.
The big change was the strength of Rossby waves before and after 2000. We first focused on the strength of the equatorial Rossby waves. For pIOD events, equatorial downwelling Kelvin waves were weak before 2000, resulting in reflected weak downwelling Rossby waves (Figure 7a). The big difference is that the intensity of equatorial downwelling Kelvin waves increased, and the intensity of equatorial downwelling Rossby waves consequently increased after 2000 (Figure 7b). For nIOD events, the difference is that the equatorial downwelling Kelvin waves were stronger in the later period, so the intensity of equatorial downwelling Rossby waves was also stronger than that in the earlier period (Figures 7c, d). The enhancement of equatorial downwelling Rossby waves (Figure 7) promotes the warming of IOD-WP, which is beneficial for the formation of pIOD events but not conducive to the formation of nIOD events.
The extra-equatorial downwelling (upwelling) Rossby waves cause the SST warming (cooling) in the central and western tropical Indian Ocean during spring. When the strength of the extra-equatorial Rossby waves is high, part of them can affect the SST in the central and western Indian Ocean during autumn. For pIOD events, the extra-equatorial Rossby waves appeared as weak upwelling Rossby waves before 2000 (Figure 8a), while extra-equatorial Rossby waves appeared as downwelling Rossby waves after 2000 (Figure 8b). This change is equivalent to an enhancement of downwelling Rossby waves. For nIOD events, the extra-equatorial Rossby waves were downwelling Rossby waves before 2000 (Figure 8c); there was an increase in the strength of downwelling Rossby waves after 2000 (Figure 8d). The SST warming in the central tropical Indian Ocean was stronger in post-2000 period compared to that prior to 2000.
In general, the promoting influence of equatorial and extra-equatorial Rossby waves on the pIOD-WP strengthened after 2000 (Figures 7a, b, 8a, b), while the hindering influence of equatorial and extra-equatorial Rossby waves on the nIOD-WP also strengthened after 2000 (Figures 7c, d, 8c, d). This was valid for both equatorial and extra-equatorial Rossby waves.
3.2.2.2 Discussion on Rossby waves and IOB
IOB warming (cooling) is characterized by the positive (negative) SSTA over the basin-wide tropical IO during boreal spring, which is the leading pattern over the tropical IO on the interannual timescale (e.g., Alexander et al., 2002; Xie et al., 2002). IOB usually lags ENSO by one to two seasons. The second IOB warming (or cooling) may persist through the summer. Here, we mainly focus on the first IOB warming (or cooling) in spring.
Considering that there is a certain relationship between IOB and ENSO, we examined the correlation between the ND(-1)J(0) Niño34 index and MAM(0) SST anomalies in the tropical Indo-Pacific region (Figure 9a). The results suggest that significant positive correlations between the SST anomalies and Niño34 index emerge in the basin-wide tropical IO when SST anomalies lag ENSO by 4 months (Figure 9a). This means that during the spring of El Niño (La Niña) following year, SST warming (cooling) will appear in the basin-wide tropical IO. Figure 9b indicates that in the preceding autumn of IOB warming, the counter-clockwise circulation of surface wind anomalies emerges over the southern tropical Indian Ocean (SIO). In the southern hemisphere, counter-clockwise circulation corresponds to the anticyclonic circulation, which is centered near (80°E, 10°S). This anticyclonic circulation will excite downwelling Rossby waves in the eastern SIO.
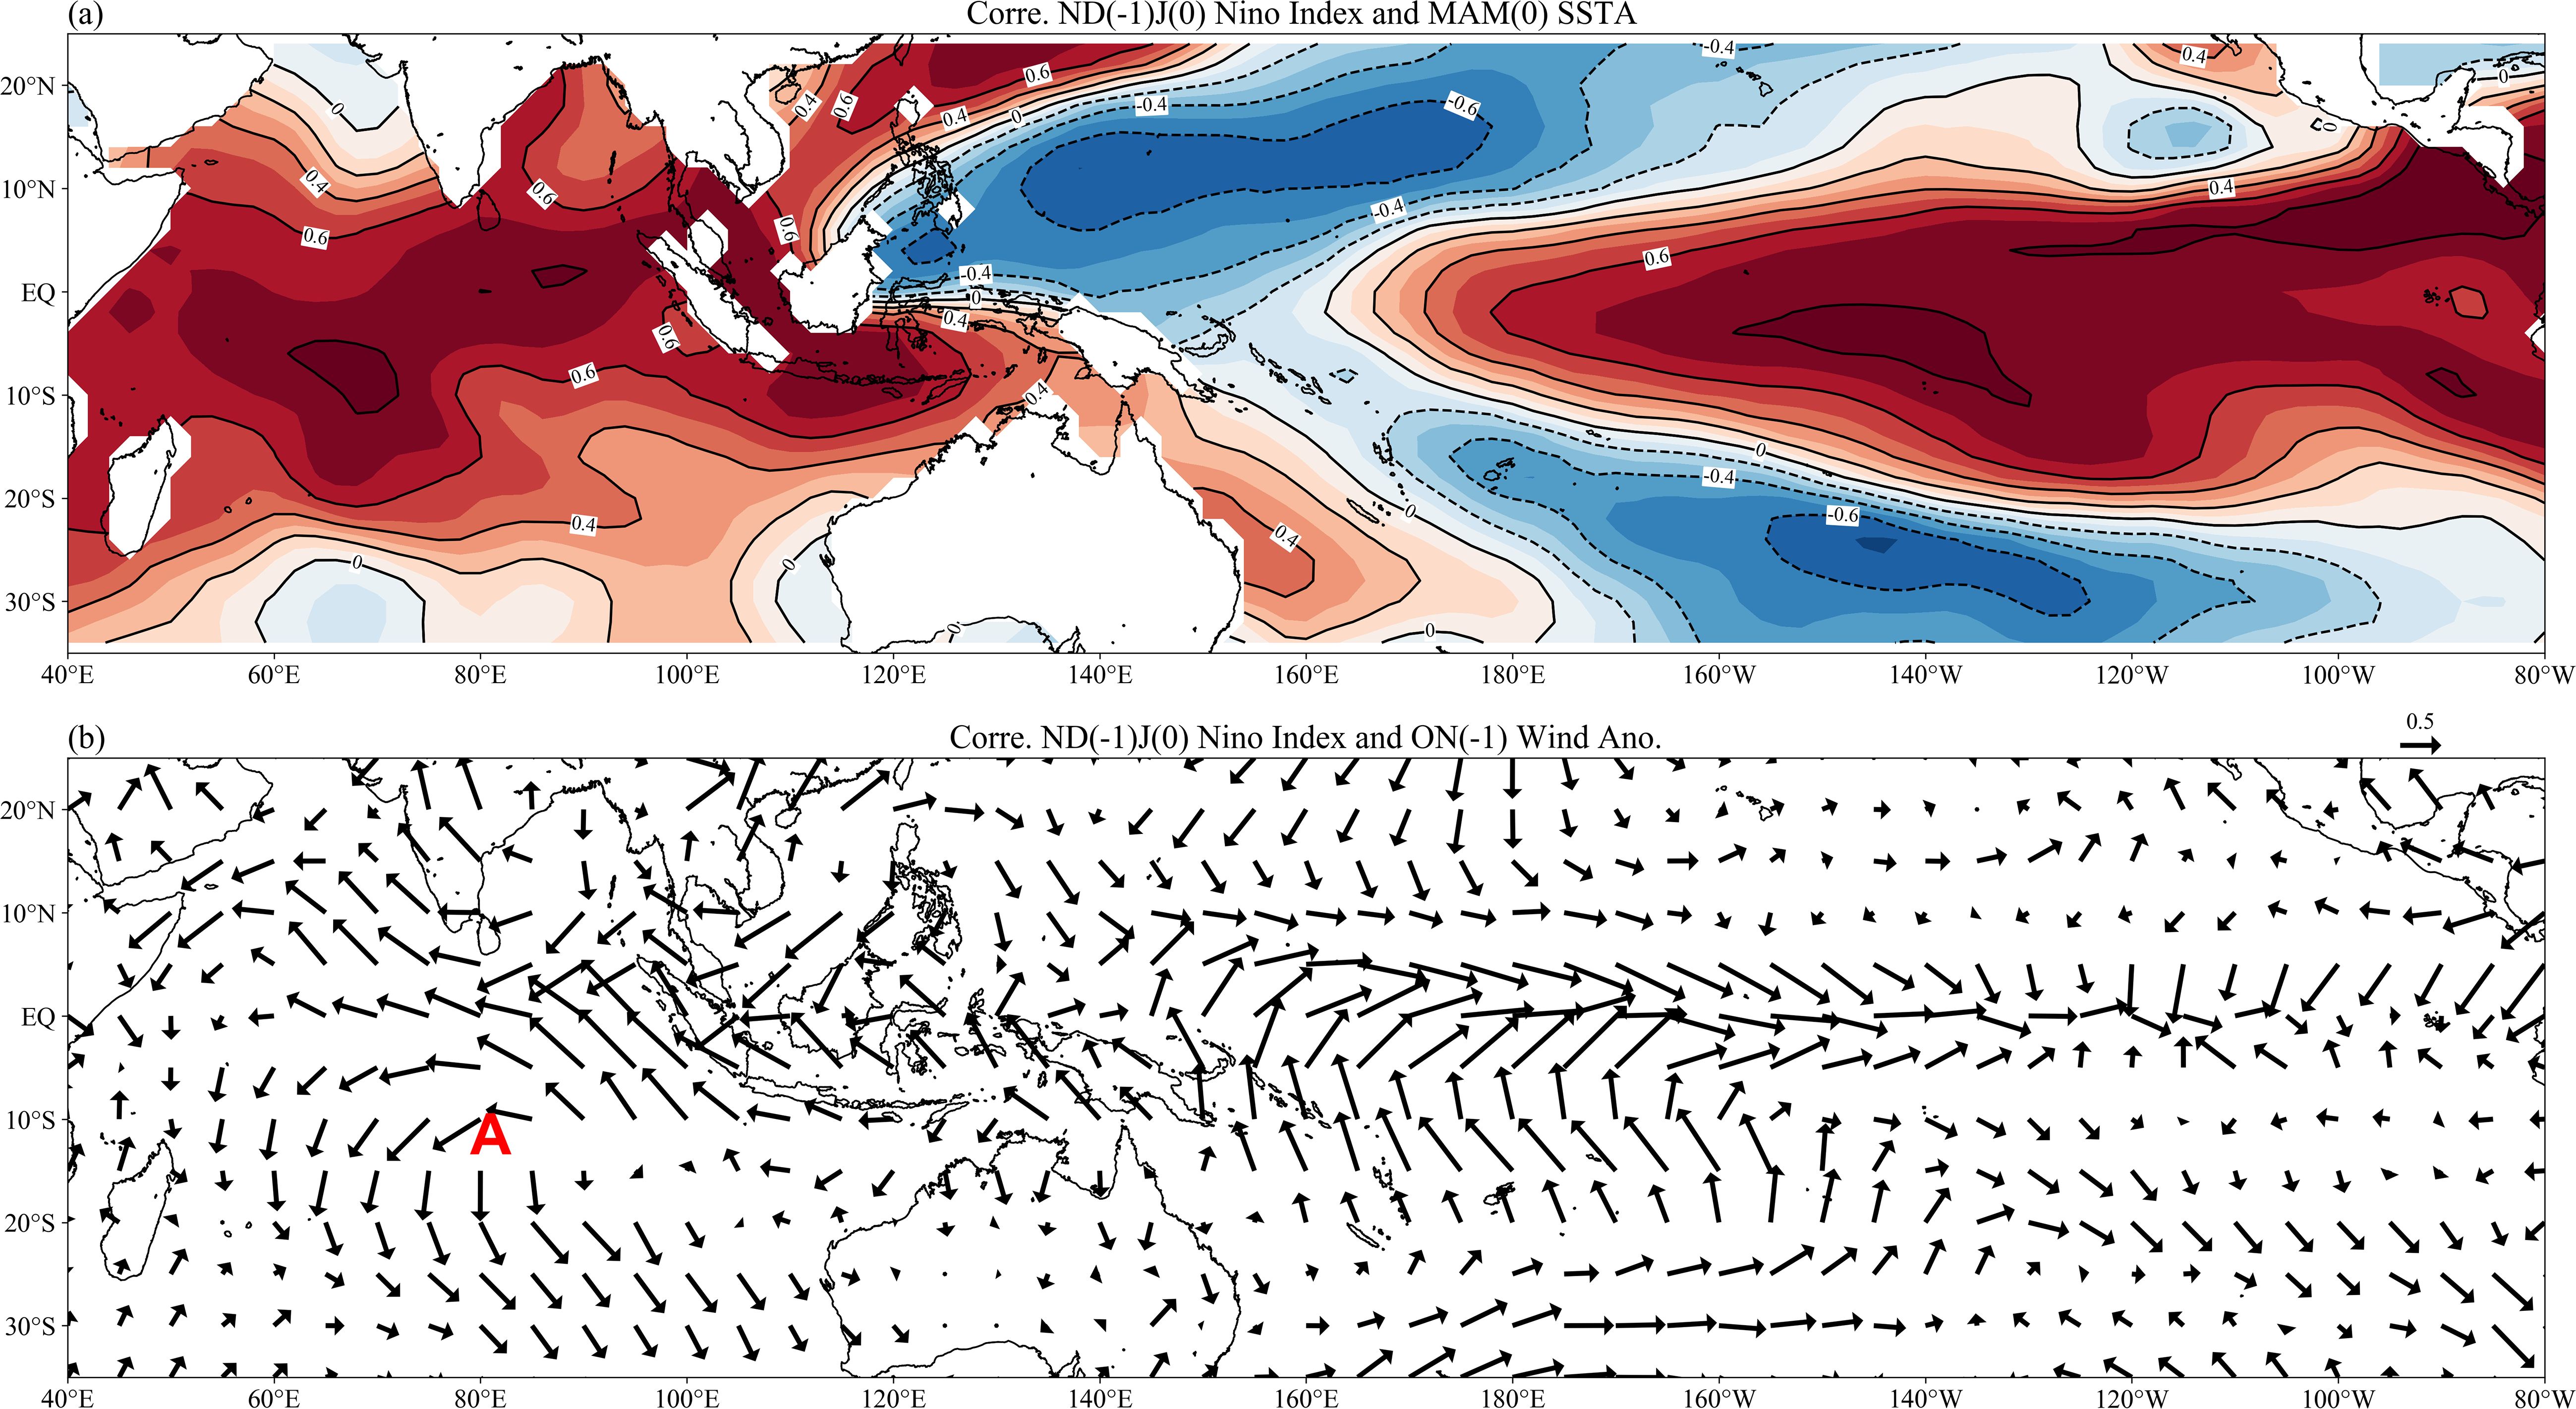
Figure 9. (a) The correlations between the ND(-1)J(0) Niño34 index and MAM(0) SST anomalies during 1979–2022. (b) The correlations between the ND(-1)J(0) Niño34 index and ON(-1) surface wind anomalies. The Niño34 index and SST are based on the ERSST; the surface winds are based on the NCEP1. The letter A stands for anticyclonic circulation. The ND(-1)J(0), MAM(0), and ON(-1) represent November(-1)-January(0), March(0)-May(0), and October(-1)-November(-1), respectively. The numbers in parentheses following the months are 0 for the year of IOB and -1 for the previous year of IOB.
These downwelling Rossby waves propagate westward, as shown in Figure 8. It is worth noting that there is a thermocline dome region where the thermocline is the shallowest in the western SIO. This dome is also known as the Seychelles thermocline dome (e.g., Xie et al., 2002; Yokoi et al., 2012). The shallow thermocline favors the influence of the subsurface ocean on SST, resulting in the largest variability in SST. The dome region approximately covers (5°S-12°S, 55°E-80°E). Therefore, when the downwelling Rossby waves propagate westward and reach the shallow thermocline region in the western SIO, the warming effect of the downwelling Rossby waves on SST is amplified. The SST warming is not confined to the extra-equatorial western IO (e.g., the region (6°S-10°S, 50°E-70°E)) as the equatorial western IO will also warm up in the following spring.
From the above, it can be seen that El Niño (La Niña) in the preceding winter causes an anticyclonic (cyclonic) circulation in the eastern SIO, triggering downwelling (upwelling) Rossby waves in the extra-equatorial region. These Rossby waves propagate westward and cause the IOB warming (cooling) in the following spring.
The effects of IOB on IOD represent the impacts of ENSO in the previous year on IOD. In both the equatorial and extra-equatorial regions, strengthened SST warming is related to previous ENSO events. For pIOD events, there were zero (two) associated consecutive El Niños that occurred in the P1 (P2) subperiods. For nIOD events, there was one (two) associated consecutive La Niñas that occurred in the P1 (P2) subperiods. During the P2 period, for pIOD events, the strengthened SST warming in the central and western IO in spring was caused by the consecutive El Niños after 2000. For nIOD events, the strengthened SST warming of the central and western IO in spring was caused by the transition from El Niño to La Niña, and there were more consecutive La Niñas occurring following the El Niño after 2000, which extends the warming effect of El Niño in the central and western IO in its decaying spring. Besides oceanic wave processes, SST in IOD-WP was also affected by the accumulation of waters in the South IO caused by wind stress.
3.2.3 Discussion on atmospheric and oceanic wave processes
Wind forcing can affect the IOD-WP, and the oceanic waves can also affect the IOD-EP. In the equatorial region (5°S-5°N), Bjerknes positive feedback promotes the stronger one. Here we mainly investigate the influence of atmospheric processes on IOD-EP and the influence of oceanic wave processes on IOD-WP. There are some possible explanations.
For IOD-EP, the impact of wind forcing on it outweighs that of oceanic waves. The wind anomalies associated with Walker circulation directly affect the IOD-EP and its influence is significant (Figures 4c, d). The equatorial Kelvin waves reach the eastern boundary in May-June and exert a limited impact on the IOD-EP in autumn, whereas the Walker circulation persistently affects the IOD-EP throughout the summer and autumn seasons.
For IOD-WP, the impact of oceanic waves is dominant. The presence of a thermocline dome region (where the thermocline is the shallowest) in the western Indian Ocean amplifies the impact of oceanic wave processes. Besides, the correlation between ENSO and wind anomalies over the equatorial western pole was weak, with ENSO primarily affecting wind anomalies over the equatorial eastern pole (Figures 4c, d).
Besides these two perspectives, the mixed layer heat balance budget analysis is an interesting and important perspective (e.g., Qu, 2003; Kug et al., 2009), which deserves further investigation in future studies.
The zonal winds along the eastern and central equatorial Indian Ocean were investigated (Figure 10). For pIOD events, before 2000 (Figure 10a), the intensity of easterly wind anomalies along the eastern and central equatorial IO (67°E-97°E) reached 2.5 m/s during the SON season. After 2000 (Figure 10b), the intensity of easterly wind anomalies along the eastern and central equatorial IO decreased during the SON season. The regions where there were easterly wind anomalies with an intensity of 2.5 m/s shrank to between 75°E-95°E. This is consistent with the weakened easterly wind anomalies in the eastern and central equatorial IO shown in Figure 5.
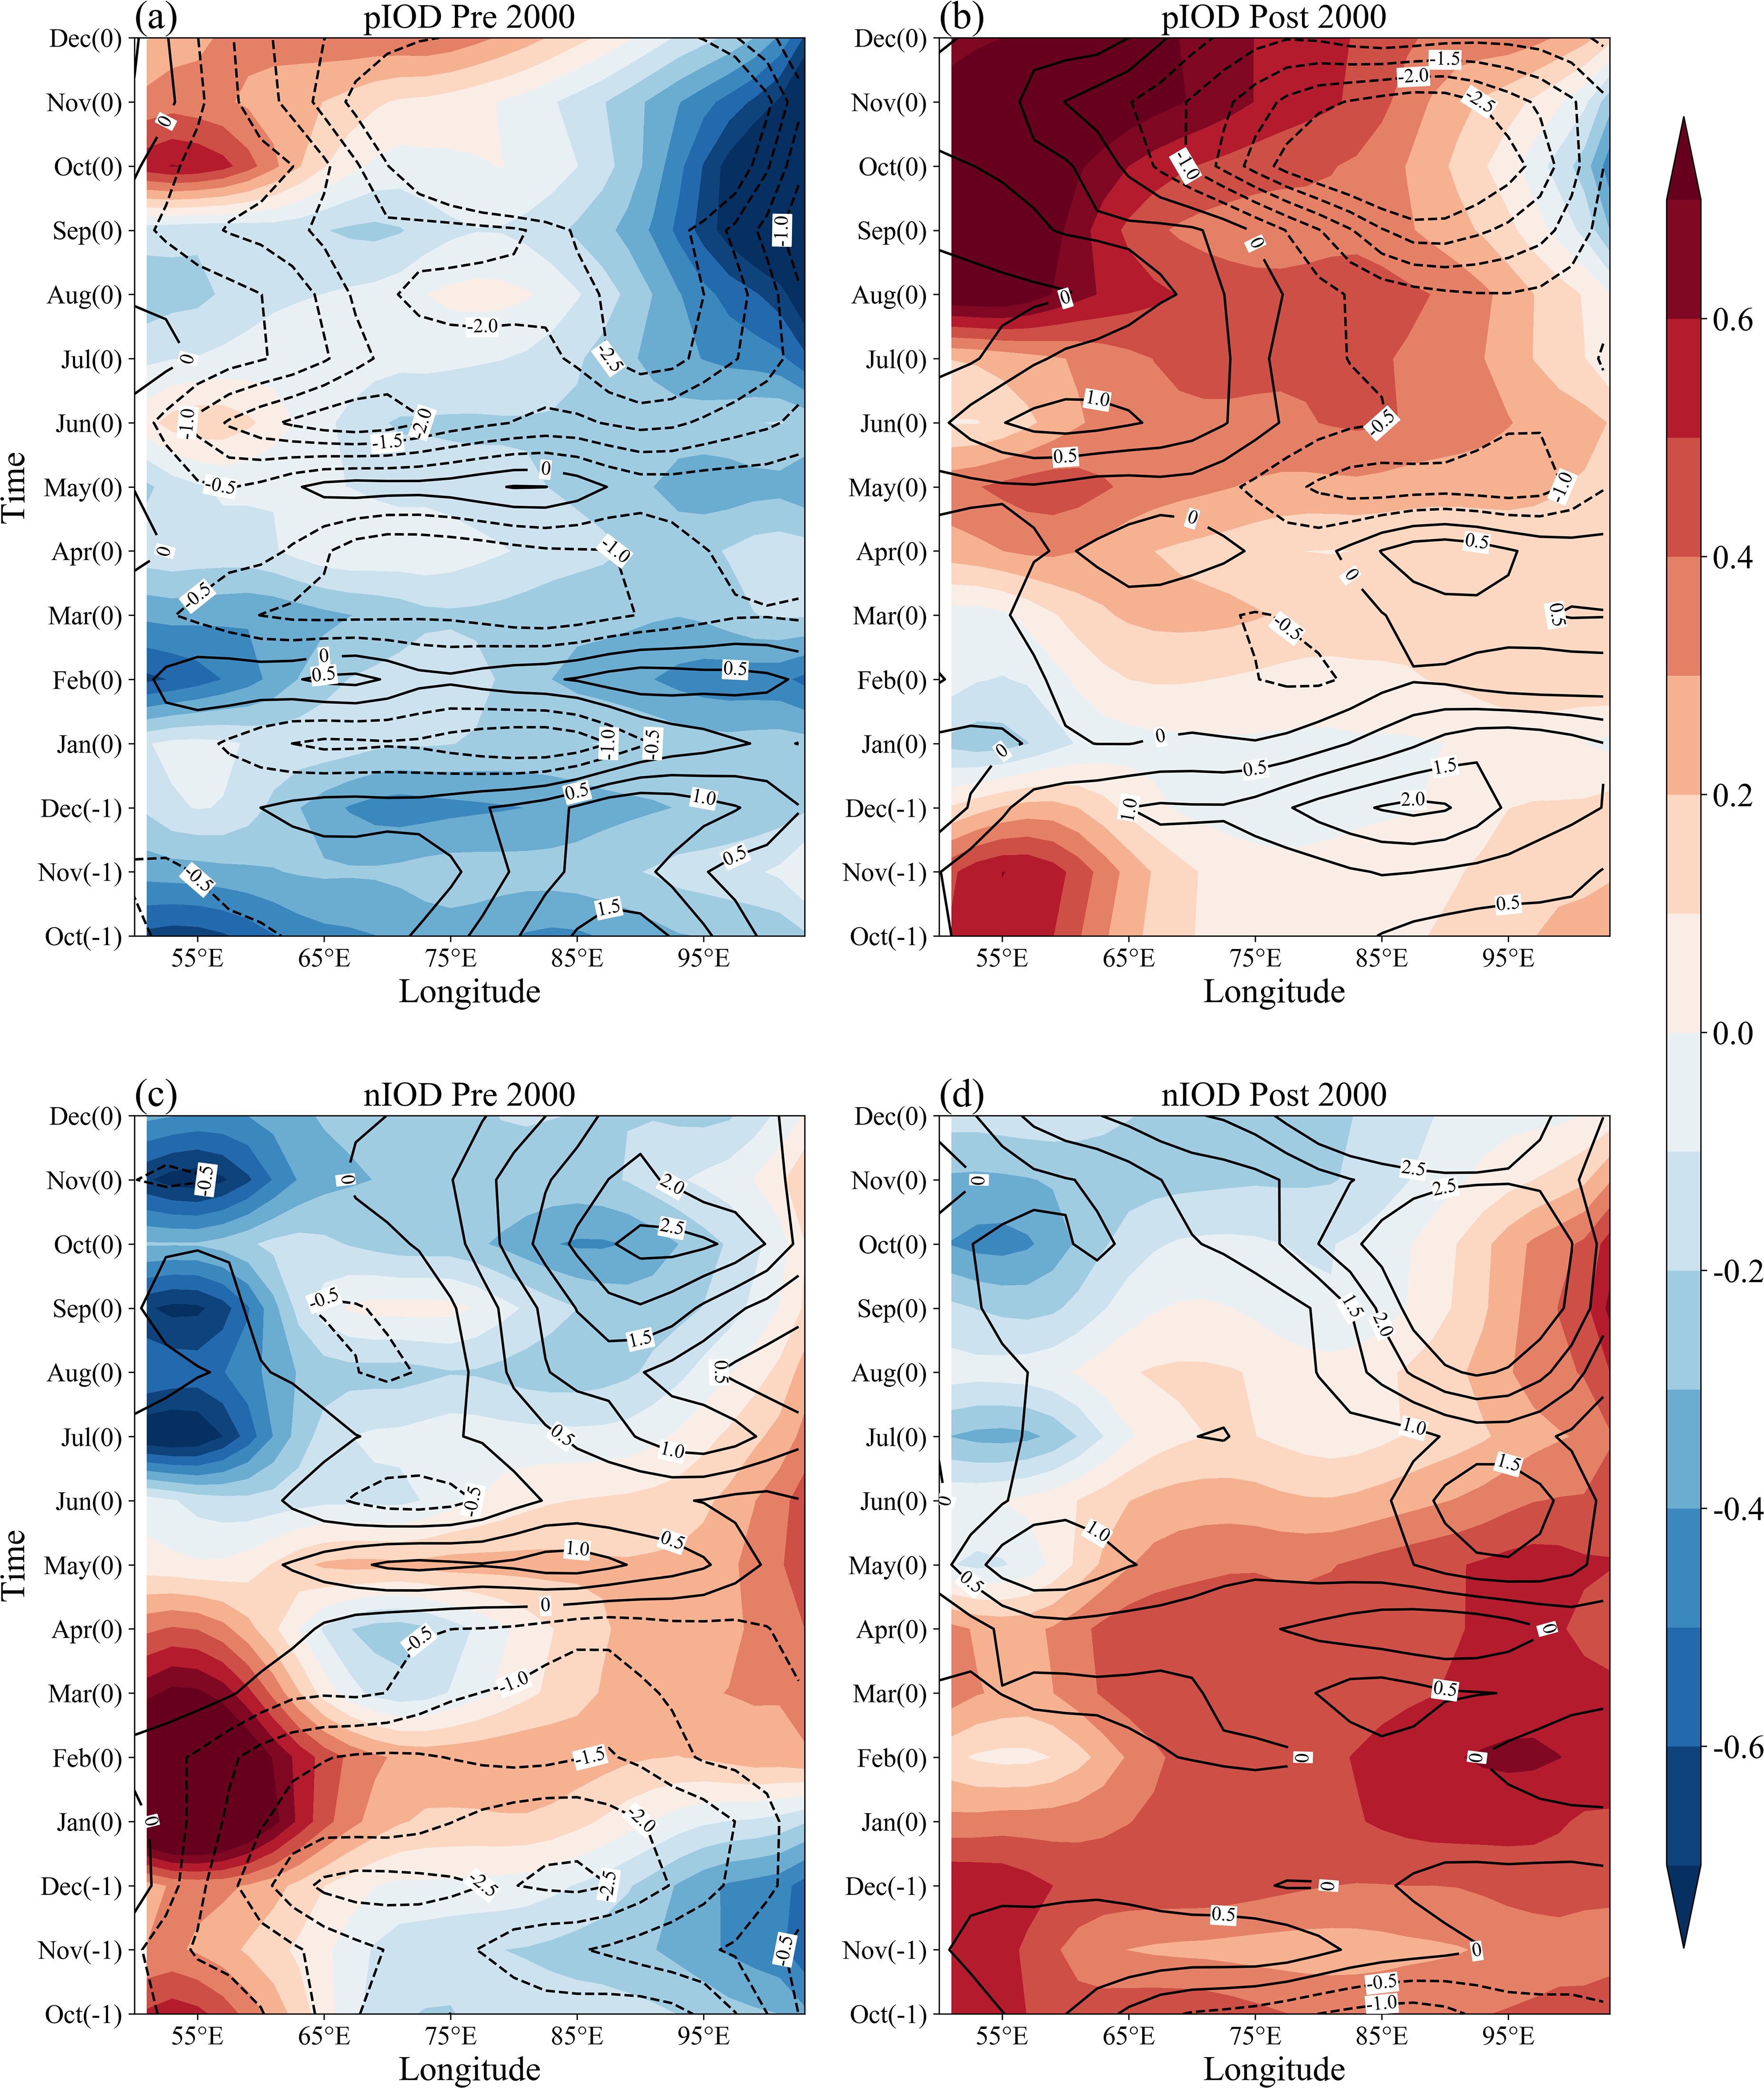
Figure 10. The time evolution of meridional-mean SST anomalies (shaded, units: °C) and meridional-mean surface zonal wind anomalies (contour, units: m/s) in equatorial IO (5°S-5°N) for the composite of pIOD events during (a) the P1 period and (b) the P2 period. (c) as in (a), and (d) as in (b), but for the composite of nIOD events. The SST is based on the ERSST; the surface zonal wind is based on the NCEP1. The numbers in parentheses following the months are 0 for the year of IOD and -1 for the previous year of IOD.
We then examined the zonal winds in nIOD events. Compared to that during the P1 period (Figure 10c), the westerly wind anomalies in the eastern and central equatorial IO strengthened during the P2 period (Figure 10d). During the SON season, the westerly anomalies with an intensity of 2.5 m/s or more extended to the region between 85°E-97°E. This was consistent with the strengthened westerly wind anomalies in the eastern and central equatorial IO shown in Figure 6.
We also checked the wind field to discuss the Rossby waves that emerge in the eastern equatorial Indian Ocean (Figure 11). During May-June, the downwelling Kelvin waves were reflected as downwelling Rossby waves at the eastern boundary (Figure 7). During May-June, these equatorial Rossby waves in the eastern Indian Ocean may also be wind forced (Figure 11). The results indicate that for pIOD events (Figures 11a, b) during the two subperiods, the easterly wind anomalies at the equator were larger than the easterly wind anomalies near the equator in the Northern Hemisphere. Thus, the equatorial wind anomalies (0°-5°N) in the eastern Indian Ocean exhibit anticyclonic wind shears. These anticyclonic wind shears are weak, which may result in weak Rossby waves. The equatorial Rossby waves may partially originate from wind field forcing for pIOD events. For nIOD events (Figures 11c, d) during the two subperiods, there were no anticyclonic wind field observed in the equatorial eastern Indian Ocean. It seems that wind forcing did not contribute to the downwelling Rossby waves at the equator for nIOD events.
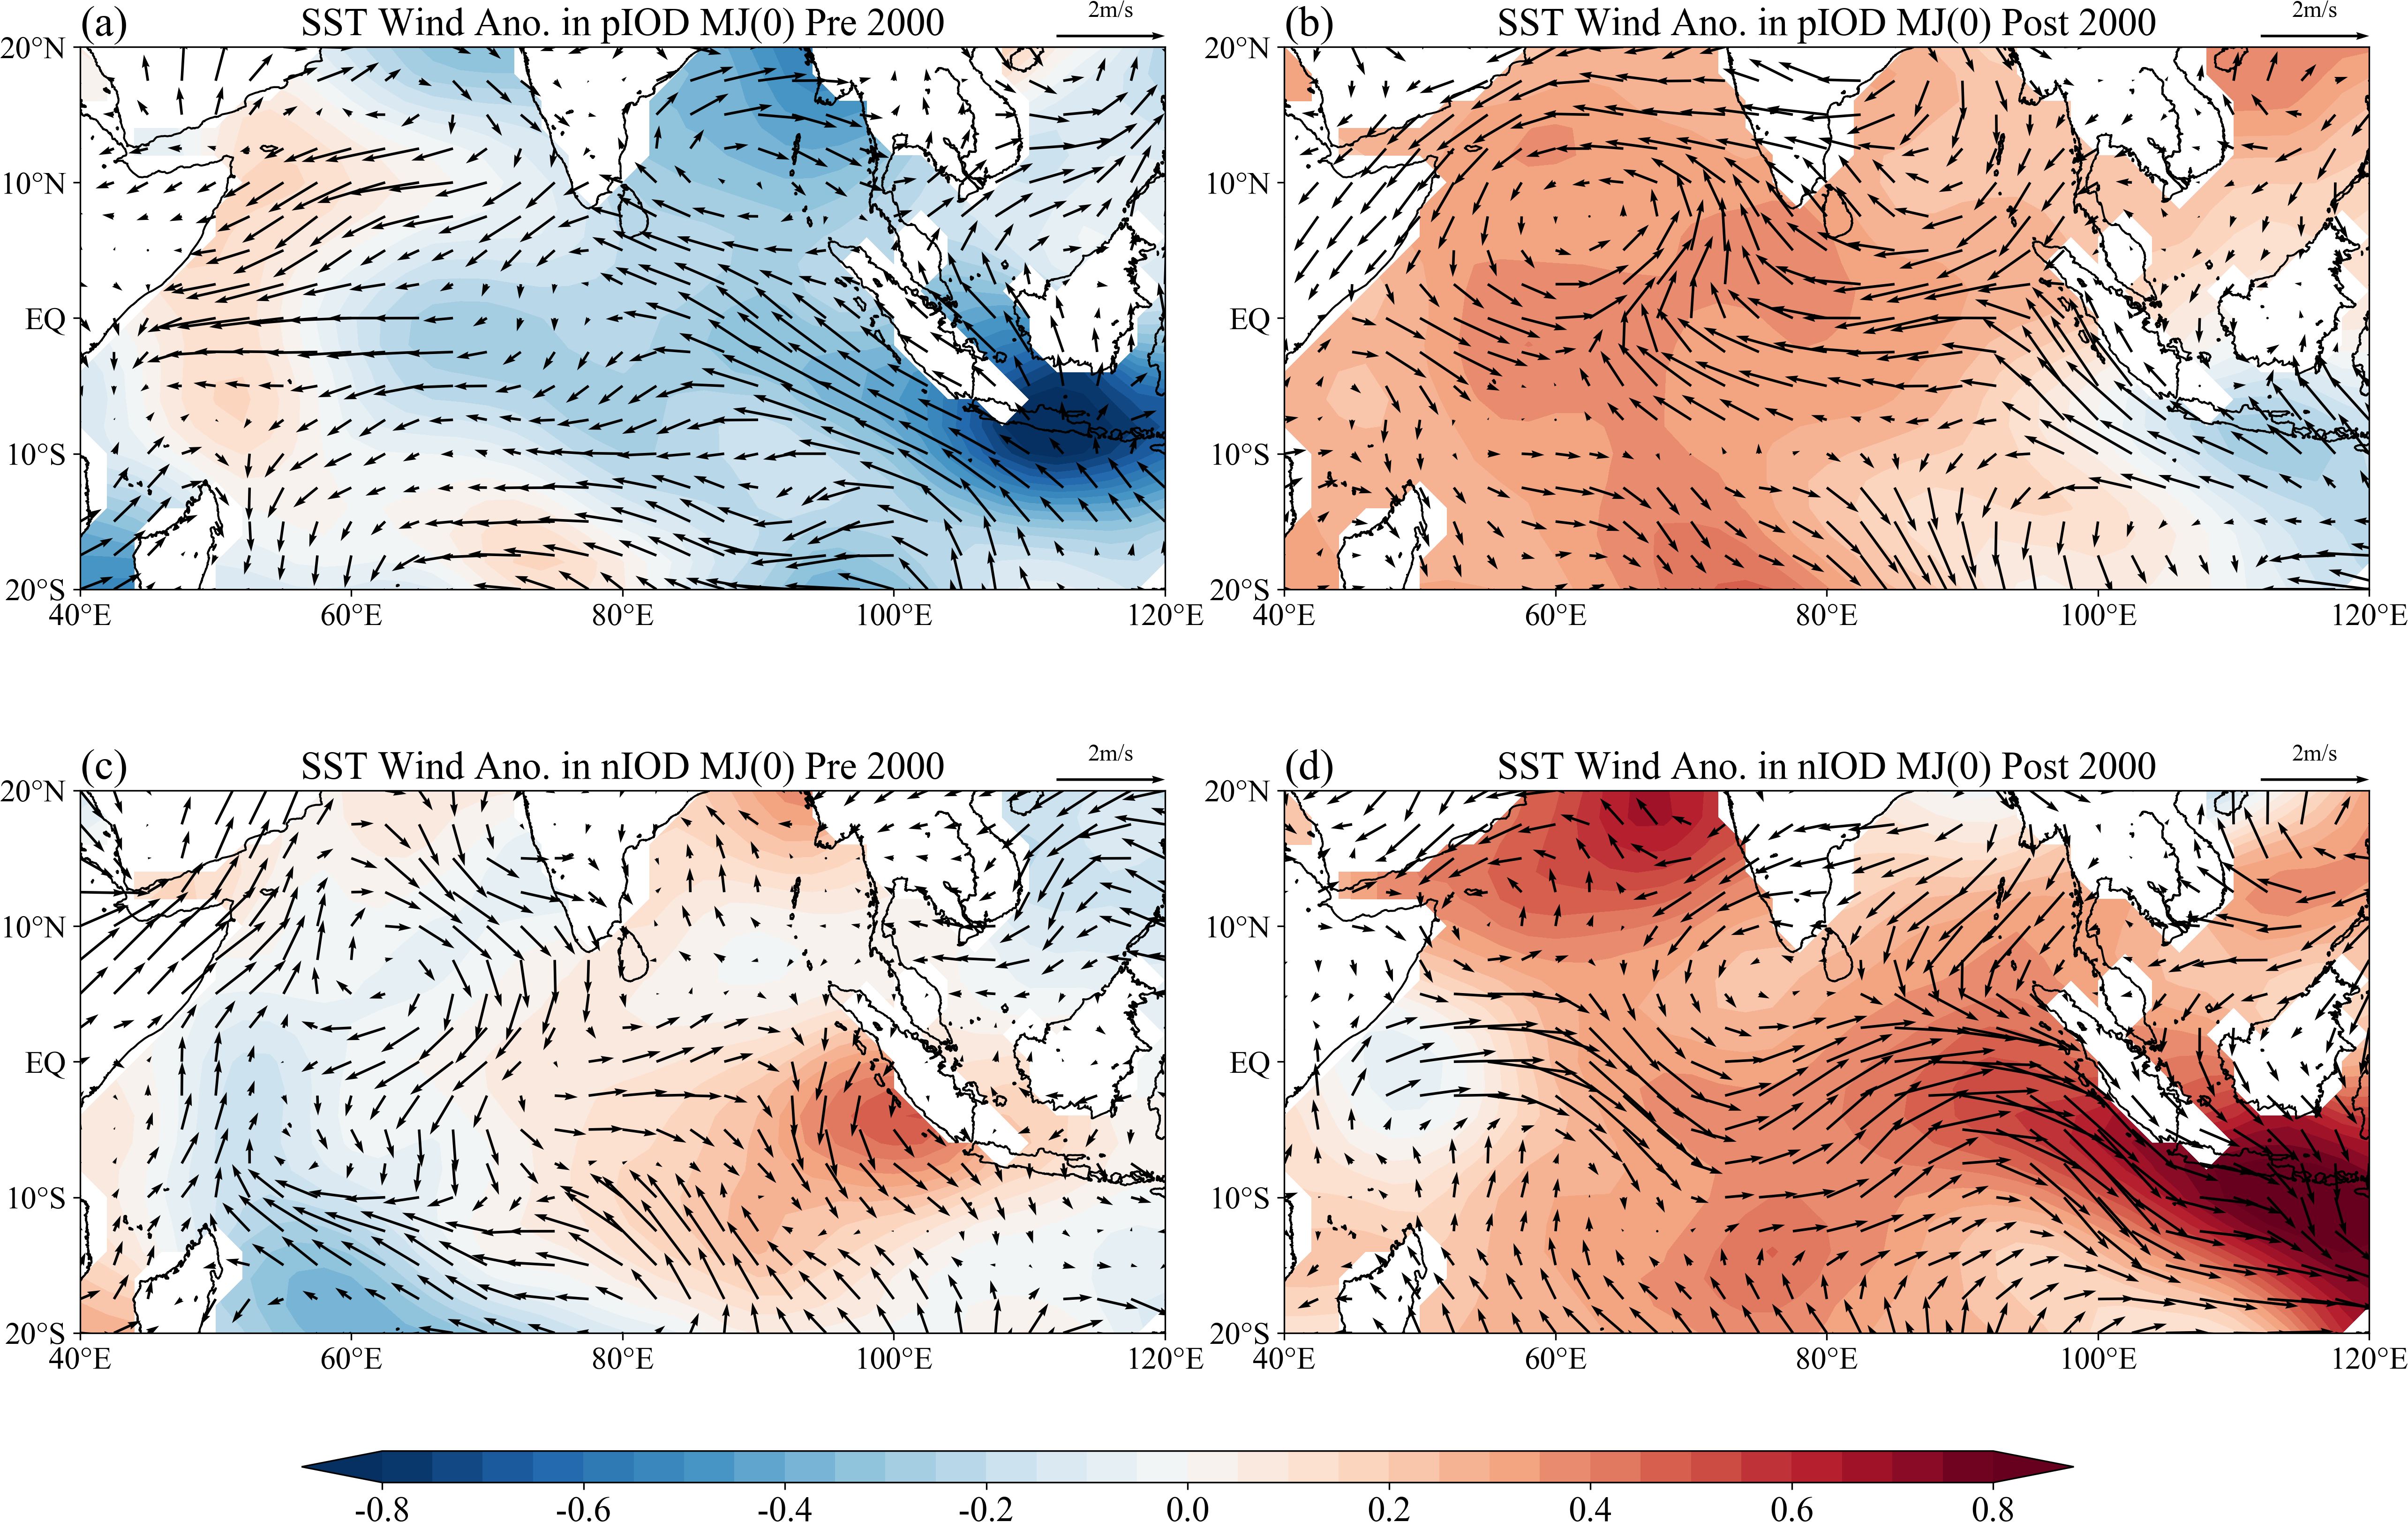
Figure 11. Spatial pattern of anomalous SST (shaded, units: °C) and surface winds (black vector, units: m/s) in MJ(0) for the composite of pIOD events during (a) the P1 period and (b) the P2 period. (c) as in (a), (d) as in (b), but for the composite of nIOD events. The SST is based on ERSST; the surface wind is based on the NCEP1. The numbers in parentheses following the months are 0 for the year of IOD.
3.3 Information flow perspective
We calculated the IF from zonal wind stress to SST of IOD-EP and IOD-WP during the two periods (Figure 12) to illustrate the interdecadal changes in the influences of atmospheric processes. For the variable D20 based on the ORAS5 dataset, we used the ORAS5 Taux data. This was to ensure that both wind field and thermocline data in the analysis of IF were obtained from the same data source. The positive (negative) IF values from Taux to SST imply that Taux tends to cause SST more uncertainty (certainty). This was valid for IF values from D20 to SST. Regardless of IF sign, a statistically significant IF with a large amplitude (i.e., the absolute value of IF) represents a large credible impact.
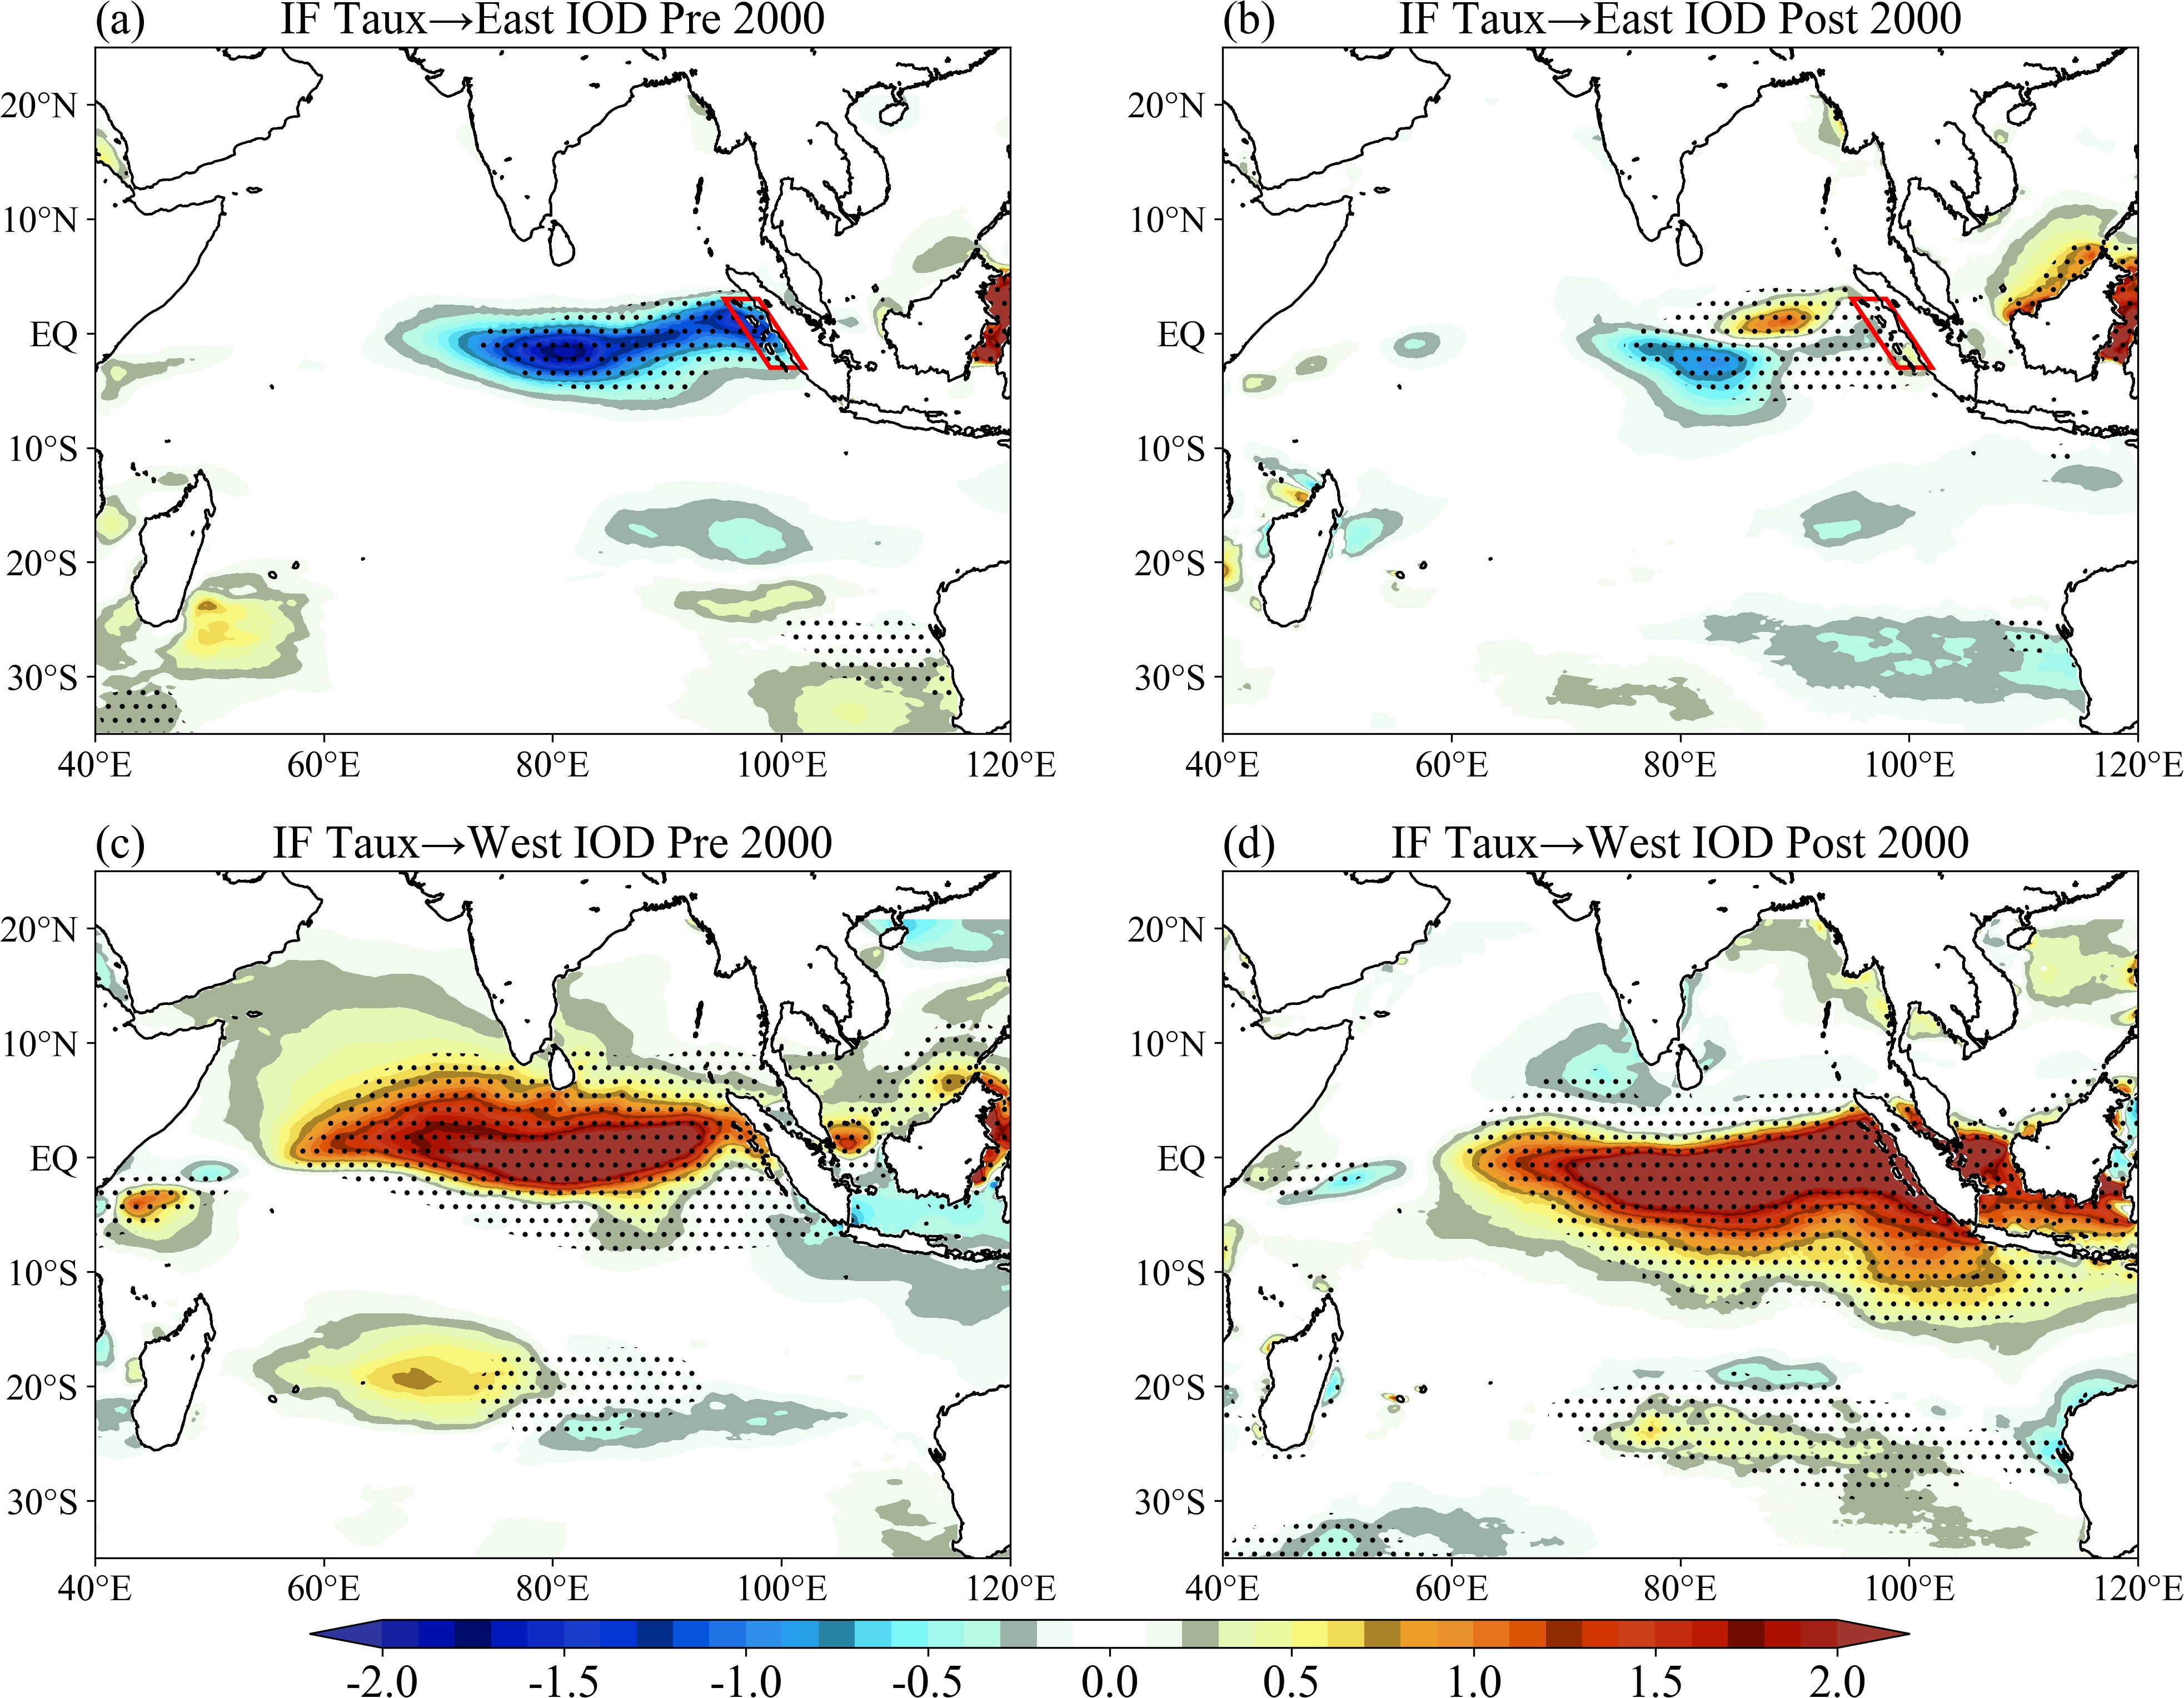
Figure 12. Information flow (IF, units: 10–2 nats/month) from Taux to IOD-EP index during (a) the P1 period and (b) the P2 period. (c) as in (a), and (d) as in (b), but for IF from Taux to IOD-WP index. The dotted areas indicate that information flows pass the confidence test at a 95% confidence level. The red box denotes the key area offshore of Sumatra Island within the 3°S-3°N latitude band. The IOD-EP and IOD-WP indices are based on the ERSST; the zonal wind stress (Taux) is based on the ORAS5.
Compared with that in the P1 period (Figure 12a), the information flow from zonal wind stress to SST in IOD-EP provides evidence that the influence of atmospheric processes on IOD-EP decreased in the P2 period (Figure 12b). The high-value regions of information flow in IOD-EP were weakened in the P2 period. Specifically, in the P1 period (Figure 12a), the high-value area of information flows extended to the coast of Sumatra Island, as shown in the red box. The impact of coastal upwelling near Sumatra Island on SST in IOD-EP was crucial for the generation of IOD. In the P2 period (Figure 12b), the information flows from wind stress in the coastal areas near Sumatra Island were very small and were not conducive to the variation of upwelling along the coast. The weakening of the relationship between ENSO-associated zonal wind stress and IOD-EP was confirmed from the IF perspective (Figures 12a, b). As shown in Figures 12c, d, the zonal wind stress east of 60°E and within the 10°N-10°S latitude band influenced the SST in IOD-WP. In the equatorial Indian Ocean (5°N-5°S), the SST anomalies in IOD-WP were further amplified through wind-thermocline-SST positive feedback. Although the zonal wind stress in most areas near the equatorial central and eastern IO exerted an impact on SST in IOD-WP (Figures 12c, d), the high IF value areas exhibit variations in intensity and location over different periods. The area that exerted influence on SST of IOD-WP shifted eastward from the central IO to the eastern IO and MC region. It is well-known that the wind anomalies in the eastern IOD and MC regions are closely related to changes in ENSO. This implies that the strengthening relationship between ENSO and IOD-WP in the later period was partly related to atmospheric processes. The impact of water transport caused by zonal wind stress in the eastern and central IO on the SST in IOD-WP increased in the P2 period.
The information flows from thermocline depth (D20) to SST of IOD-EP and IOD-WP during the two periods are shown in Figure 13, illustrating the interdecadal changes in influences of subsurface oceanic processes. Revealed by the IF, the influence of D20 on SST in IOD-EP also weakened during the P2 period (Figure 13b). Such a decreased influence of D20 was consistent with the weakening influence of zonal wind on SST in IOD-EP. This implies a weakened Bjerknes feedback after 2000, which was associated with a deepening of D20 in equatorial eastern IO during the P2 period. More details will be provided in the next section. Unlike the changes in IOD-EP, the influence of D20 on SST in IOD-WP generally strengthened during the P2 period (Figure 13d). Compared with that before 2000 (Figure 13c), the amplitude of IF intensified in the equatorial and northern part of IOD-WP after 2000 (Figure 13d). Among them, these equatorial intensified IFs in IOD-WP (Figure 13d) can be partly attributed to the strengthened equatorial Rossby waves (Figure 7) and partly to the water transport caused by zonal wind. Specifically, in the P2 period, the amplitude of information flow from D20 to SST in IOD-WP increased in the equatorial Indian Ocean, as shown in the green box (Figure 13d). This indicates an increase in the influence of equatorial Kelvin waves and Rossby waves reflected by Kelvin waves in the later period. Additionally, the influence of extra-equatorial Rossby waves related to IOB also increased in the P2 period, as shown in the blue box (Figure 13d). The northern region of IOD-WP is located in the Arabian Sea. The large IF values in the Arabian Sea may be associated with the Indian Ocean warming and the strengthened northeasterly wind anomalies associated with ENSO during the P2 period.
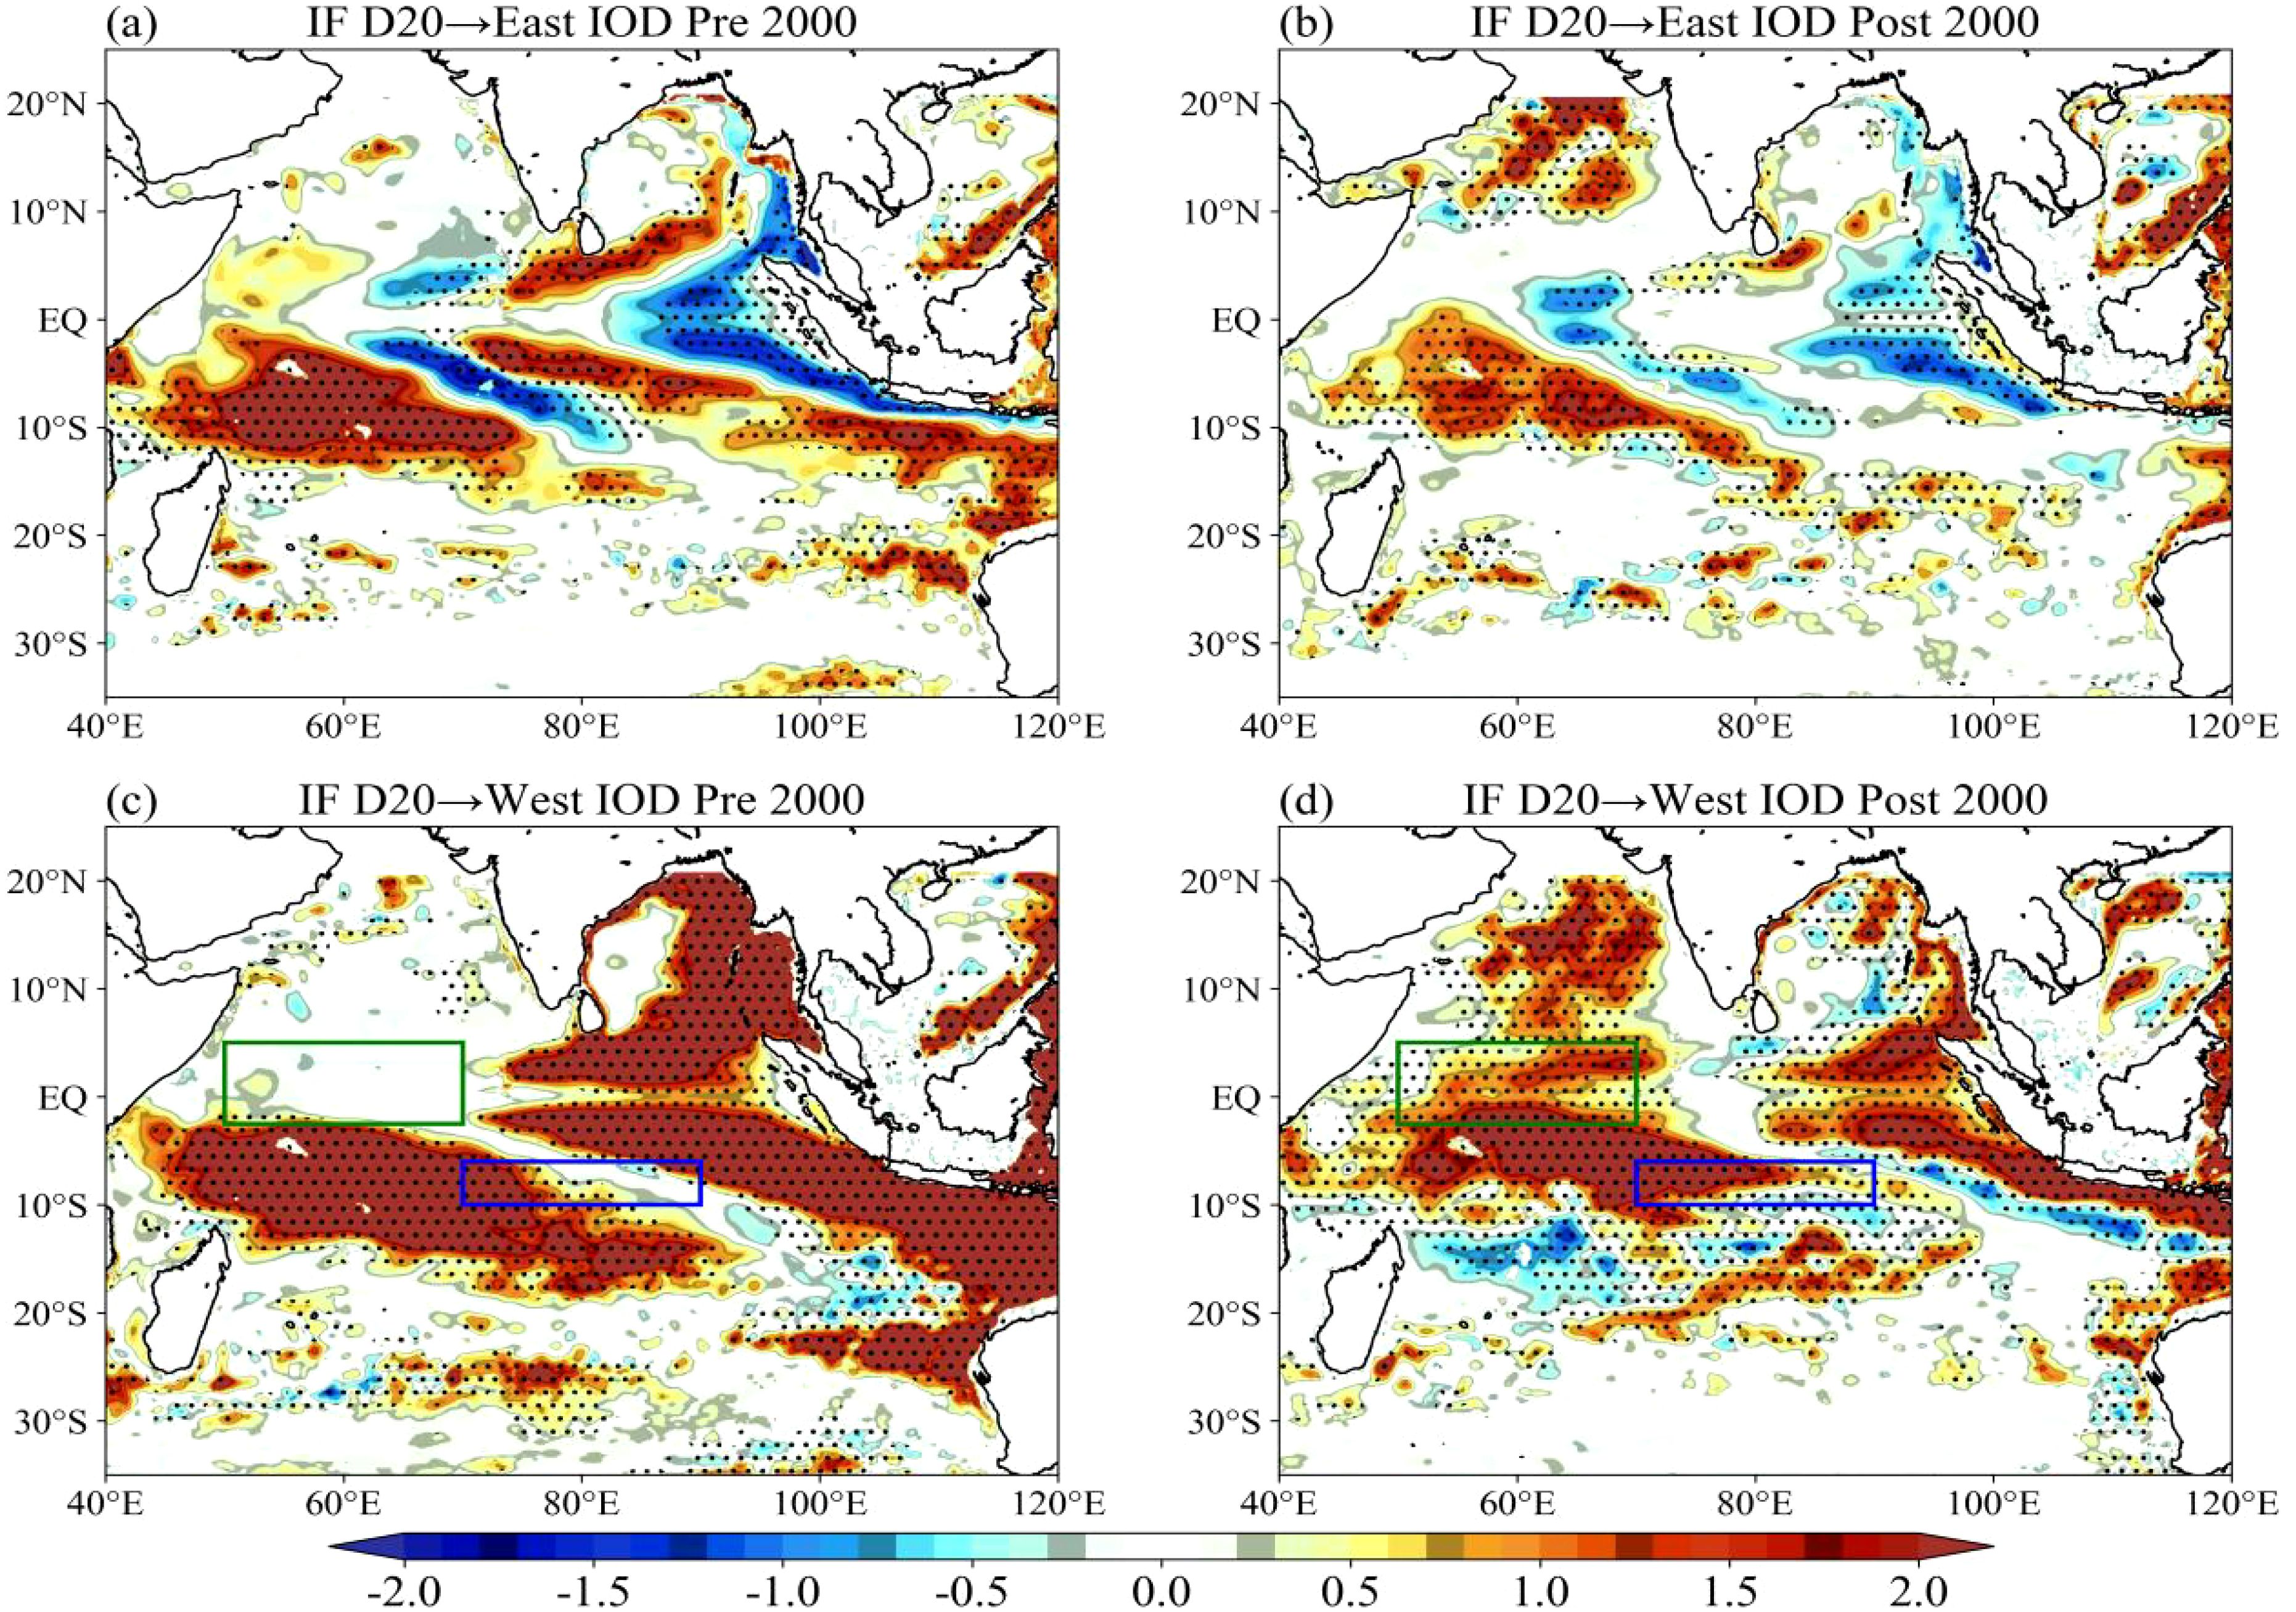
Figure 13. Information flows (IF, units: 10–2 nats/month) from D20 to IOD-EP index during (a) the P1 period and (b) the P2 period. (c) as in (a), and (d) as in (b), but for IFs from D20 to IOD-WP index. The dotted areas indicate that information flows pass the confidence test at a 95% confidence level. The green box denotes the key area within the 50°E-70°E, 2.5°S-5°N region, the blue box denotes the key area within the 70°E-90°E, 10°S-6°S region. The IOD-EP and IOD-WP indices are based on the ERSST; the D20 is based on the ORAS5.
We also examined the IF values based on Taux and D20 monthly anomalies (figures not shown). The results based on monthly anomalies are consistent with those based on the original Taux and D20 monthly data. Considering the consistency and the IF results based on original monthly data are relatively representative, here we mainly report the IF results of original Taux and D20 monthly data.
3.4 Mean state change in the Pacific Ocean and Indian Ocean
By observing the ocean temperature profiles in the equatorial IO and Pacific Ocean (PO) during two periods (Figure 14), the reason for the change in Walker circulation was found. In the tropical PO, the thermocline (20 °C isothermal depth) deepened in the west and shoaled in the east after 2000, i.e., the PO underwent La Niña-like changes after 2000. This mean state change in the PO is consistent with previous studies (Wang et al., 2023; Hu et al., 2020). The warming of the western PO and the cooling of the eastern PO further increased the SST gradient, which strengthened the equatorial easterly wind anomalies in the western PO and the anomalous upward motion of Walker circulation in the MC region. Such intensified anomalous upward motion was consistent with the weakened (enhanced) anomalous descending (ascending) branch of Walker circulation in pIOD (nIOD) events (Figures 5 and 6). They are equivalent.
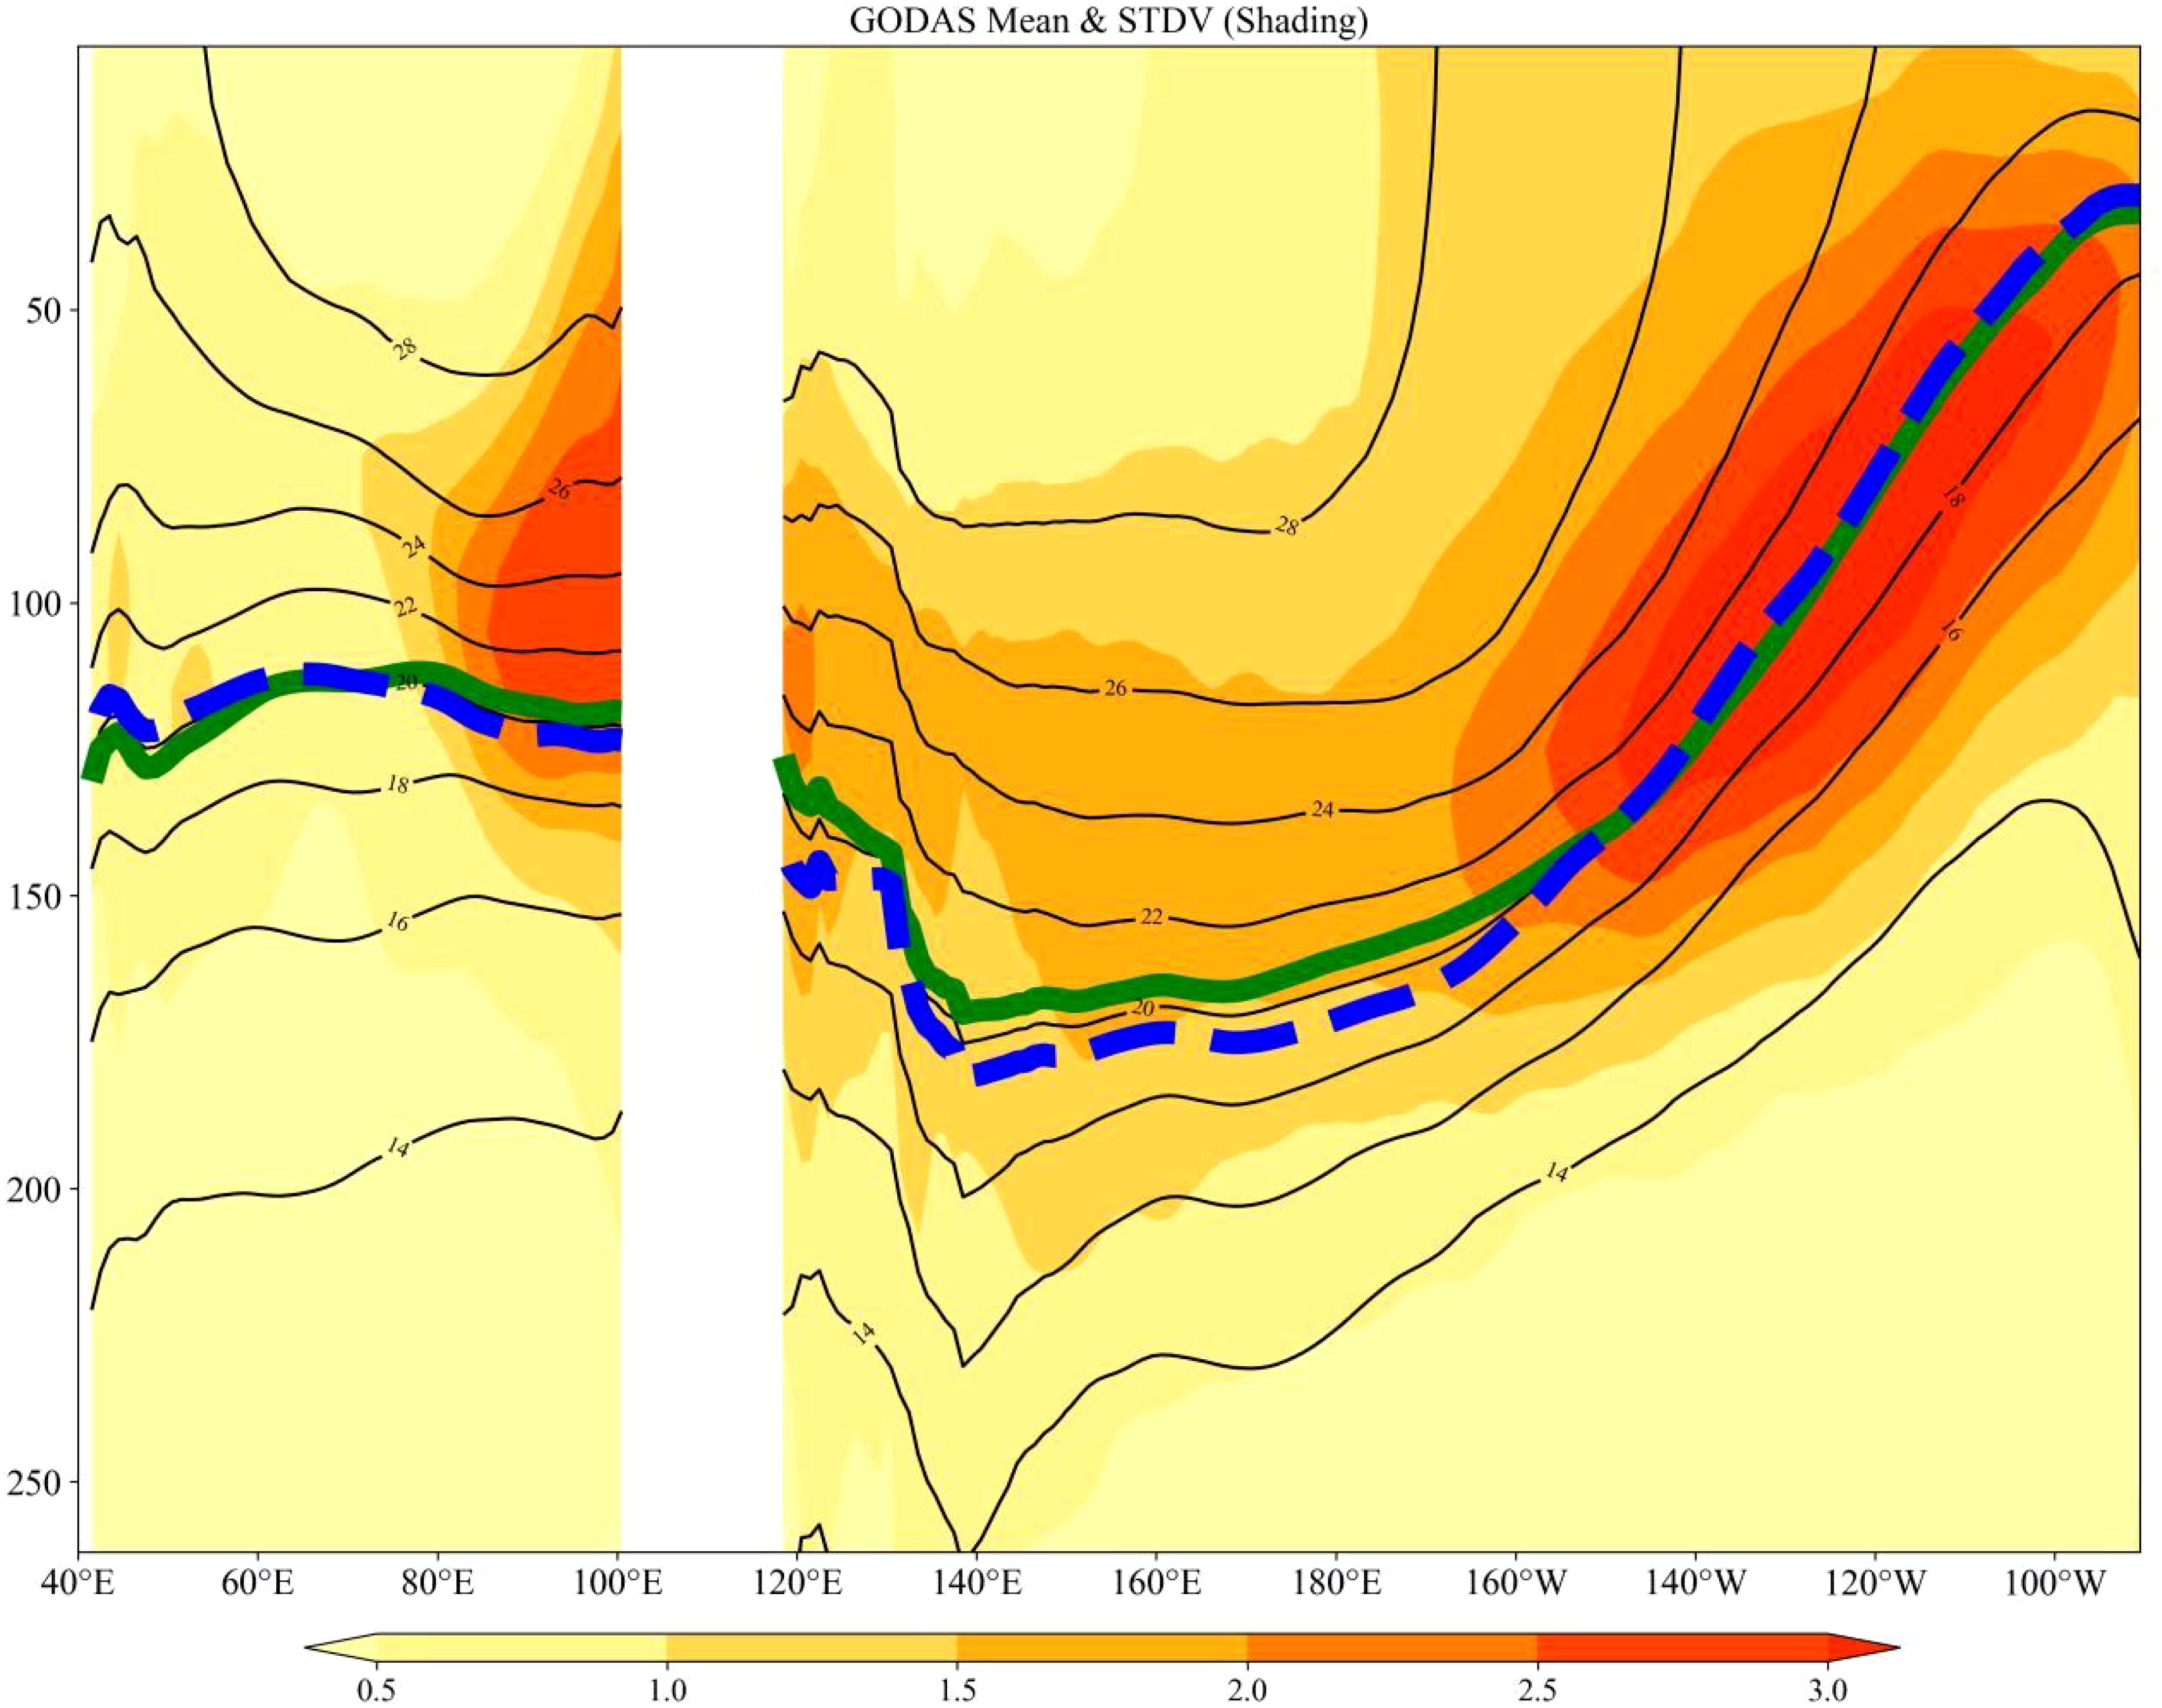
Figure 14. The average ocean temperature (contours; units: °C) and standard deviation (color shaded; units: °C) in the equatorial Indian Ocean and Pacific Ocean from 1979 to 2022. The green solid line (blue dashed line) represents the 20°C isotherm during the P1 (P2) period. The ocean temperature is based on the GODAS.
Accompanying this intensified anomalous upward motion of Walker circulation, equatorial westerly wind anomalies also strengthened in IOD-EP. This reduction in equatorial easterly wind anomalies in IOD-EP weakened El Niño-pIOD coupling and strengthened La Niña-nIOD coupling. It seems that the positive event coupling is dominant for the whole ENSO-IOD coupling, hence, the overall ENSO-IOD coupling is weakened.
This study suggests that the IO underwent an nIOD-like change after 2000. Unlike in the PO, in the tropical IO, the thermocline deepened in the east and shoaled in the west after 2000. The deepened thermocline in IOD-EP was crucial for the weakening relationship between ENSO and IOD-EP, because the deepened thermocline induced decreased Bjerknes positive feedback. This was consistent with the weakened causality from Taux to SST in IOD-EP and the weakened causality from D20 to SST in IOD-EP.
4 Summary and discussion
The ENSO-IOD connection exhibits complexity. This study examines the response of SST in IOD-EP and IOD-WP to ENSO during two different periods, respectively. Our results reveal that the impact of ENSO on IOD-EP significantly weakened, while the relationship between ENSO and IOD-WP strengthened after 2000.
Here, we mainly analyzed the regulating mechanism of atmospheric processes (oceanic wave processes) on IOD-EP (IOD-WP). From the atmospheric process perspective, the anomalous ascending branch of the Walker circulation in MC was enhanced after 2000, and both pIOD and nIOD events were affected by this. The new status of Walker circulation favored the weakened wind easterlies and SST warming in IOD-EP, which hindered the development of pIOD events but promoted the development of nIOD events. Thus, influenced by atmospheric processes, the El Niño-pIOD-EP coupling weakened and La Niña-nIOD-EP coupling enhanced. The changes in the El Niño-pIOD-EP connection outweigh the changes in the La Niña-nIOD-EP connection.
From the oceanic wave process perspective, the equatorial and extra-equatorial downwelling Rossby waves both favored the SST warming in IOD-WP after 2000, which promoted the generation of pIOD events but hindered the generation of nIOD events. Thus, influenced by oceanic wave processes, the El Niño-pIOD-WP relationship was enhanced and the La Niña-nIOD-WP relationship weakened. As for IOD-EP, the changes in the El Niño-pIOD-WP connection also outweigh the changes in the La Niña-nIOD-WP connection.
The generation of IOD events depends on the net combined effect of atmospheric processes and oceanic wave processes. The impact of atmospheric processes and oceanic wave processes can be consistent or the opposite. When the influence of atmospheric and oceanic wave processes is opposite, the generation of IOD events depends on which process is stronger. As long as one of the atmospheric processes or the oceanic wave processes is strong enough, following Bjerknes feedback, the pIOD events can occur. Although the impact of atmospheric processes weakened, the impact of oceanic wave processes strengthened, thus, the pIOD events still occurred after 2000. The same mechanism is also valid for the generation of nIOD events. Oceanic wave processes are unfavorable for the generation of nIOD, while the atmospheric process associated with the new Walker circulation was very favorable for the generation of nIOD after 2000.
The information flow analysis also verified that the influence of atmospheric processes on IOD-EP decreased, and the influence of oceanic wave processes on IOD-WP increased. Such a weakened ENSO-IOD-EP connection can be attributed to the weakened wind easterlies in pIOD events associated with the La Niña-like condition in the PO and the decreased Bjerknes feedback induced by the deepened thermocline condition in IOD-EP. The strengthened ENSO-IOD-WP connection can be attributed to the strengthened downwelling Rossby waves in pIOD events. These downwelling Rossby waves in pIOD events were related to IOB warming, which was induced by the El Niño in the previous year. Thus, increased consecutive El Niños contributed to the enhanced ENSO-pIOD-WP connection. The increased consecutive El Niños were also associated with the La Niña-like condition in the PO.
A previous study has shown that the relationship between ENSO and IOD has weakened since 2000 (Ham et al., 2016). Our results also show a weakened ENSO-IOD coupling after 2000, consistent with this previous study. In addition, this article investigated the relationship between ENSO and the eastern and western poles of IOD, respectively, and found that the relationship between ENSO and IOD-EP (IOD-WP) weakened (strengthened), extending the results of Ham et al. (2016). Previous studies mainly discussed the impact of ENSO on IOD in the same year (e.g., Meyers et al., 2007; Zhang et al., 2015; Stuecker et al., 2017). This study further discusses the regulation of IOB on IOD, i.e., the influence of ENSO in the previous year on IOD. Past studies paid more attention to extra-equatorial Rossby waves (e.g., Masumoto and Meyers, 1998; Xie et al., 2002) in the Indian Ocean, while this study suggests that the equatorial Rossby waves reflected by Kelvin waves may be even more dominant in regulating the evolution of IOD events. El Niño and La Niña exhibit evident asymmetries, and normally, the SST anomalies of El Niño are stronger than those of La Niña (e.g., An and Jin, 2004; Timmermann et al., 2018). The climatic impacts of El Niño and La Niña are also asymmetrical (e.g., Chou and Lo, 2007; Ng et al., 2019). This study further extends the results of asymmetrical responses to ENSO by analyzing the El Niño-pIOD and La Niña-nIOD coupling.
In future work, it will be important to diagnose the relative contributions of oceanic processes and air-sea exchanges in regulating interannual SST variability in the Indian Ocean. A mixed layer heat budget analysis (e.g., Rao and Sivakumar, 2000; Du et al., 2009) has been widely used in several regions in the Indian Ocean, e.g., the Bay of Bengal (Girishkumar et al., 2013) and the Arabian Sea (Sabu and Revichandran, 2011; Jofia et al., 2023). For the IOD eastern and western pole regions, future studies analyzing the horizontal advection, the vertical entrainment, and the net heat flux would help to further quantify the oceanic and atmospheric factors. In addition, the latent heat flux and shortwave radiation flux in the net heat flux could be further analyzed in detail.
This article explores the distinct contributions of IOD-EP and IOD-WP to the development of IOD, including causal analysis. It highlights the varying impacts of atmospheric processes on IOD-EP and those of oceanic wave processes on IOD-WP. The important impact of equatorial oceanic Rossby waves in regulating IOD-WP was revealed. In addition, this study clarifies the asymmetry in El Niño-pIOD and La Niña-nIOD coupling. The role of IOB in affecting the formation of IOD was also investigated. Since the early 2000s, the western Pacific and eastern Indian Ocean have experienced a deepened thermocline and warming, leading to a rise in consecutive El Niños and consecutive La Niñas. Against the background of the ENSO property transition occurring around 2000, our research contributes to a better understanding of the ENSO-IOD coupling and its implications.
Data availability statement
The original contributions presented in the study are included in the article/supplementary material. Further inquiries can be directed to the corresponding author.
Author contributions
XH: Data curation, Formal Analysis, Methodology, Visualization, Writing – original draft. LY: Conceptualization, Formal Analysis, Funding acquisition, Methodology, Supervision, Writing – original draft, Writing – review & editing. JX: Formal Analysis, Funding acquisition, Writing – review & editing. SZ: Formal Analysis, Funding acquisition, Writing – review & editing.
Funding
The author(s) declare that financial support was received for the research and/or publication of this article. This study was jointly supported by the National Natural Science Foundation of China (72293604, 42130605), program for scientific research start-up funds of Guangdong Ocean University (R19061), the Innovative Team Plan for Department of Education of Guangdong Province (2023KCXTD015), and First-class Discipline Plan of Guangdong Province (010202032401).
Conflict of interest
The authors declare that the research was conducted in the absence of any commercial or financial relationships that could be construed as a potential conflict of interest.
Generative AI statement
The author(s) declare that no Generative AI was used in the creation of this manuscript.
Publisher’s note
All claims expressed in this article are solely those of the authors and do not necessarily represent those of their affiliated organizations, or those of the publisher, the editors and the reviewers. Any product that may be evaluated in this article, or claim that may be made by its manufacturer, is not guaranteed or endorsed by the publisher.
References
Allan R., Chambers D., Drosdowsky W., Hendon H., Latif M., Nicholls N., et al. (2001). Is there an Indian Ocean dipole and is it independent of the El Niño-Southern Oscillation?. CLIVAR exchanges 6 (3), 18–22.
Alexander M. A., Blade I., Newman M., Lanzante J. R., Lau N.-C., and Scott J. D. (2002). The atmospheric bridge: The influence of ENSO teleconnections on air-sea interaction over the global oceans. J. Climate 15, 2205–2231. doi: 10.1175/1520-0442(2002)015<2205:TABTIO>2.0.CO;2
An S. I. and Jin F.-F. (2004). Nonlinearity and asymmetry of ENSO. J. Climate 17, 2399–2412. doi: 10.1175/1520-0442(2004)017<2399:NAAOE>2.0.CO;2
Annamalai H., Murtugudde R., Potemra J., Xie S. P., Liu P., and Wang B. (2003). Coupled dynamics over the Indian Ocean: spring initiation of the Zonal Mode. Deep Sea Res. Part II: Topical Stud. Oceanography 50, 2305–2330. doi: 10.1016/s0967-0645(03)00058-4
Ashok K., Guan Z., and Yamagata T. (2003). Influence of the Indian Ocean Dipole on the Australian winter rainfall. Geophysical Res. Lett. 30 (15), 1821. doi: 10.1029/2003GL017926
Battisti D. S. (1988). Dynamics and thermodynamics of a warming event in a coupled tropical atmosphere–ocean model. J. Atmospheric Sci. 45, 2889–2919. doi: 10.1175/1520-0469(1988)045<2889:DATOAW>2.0.CO;2
Behera S. K., Luo J. J., Masson S., Rao S. A., Sakuma H., and Yamagata T. (2006). A CGCM study on the interaction between IOD and ENSO. J. Climate 19, 1688–1705. doi: 10.1175/JCLI3797.1
Behringer D. W. (2007). “The Global Ocean Data Assimilation System (GODAS) at NCEP,” in 11th symposium on integrated observing and assimilation systems for the atmosphere, oceans, and land surface, San Antonio, TX (45 Beacon Street, Boston, MA 02108-3693: American Meteorological Society). Available online at: http://ams.confex.com/ams/87ANNUAL/techprogram/paper_119541.htm (Accessed January 16, 2007).
Bjerknes J. (1969). Atmospheric teleconnections from the equatorial Pacific. Monthly Weather Rev. 97, 163–172. doi: 10.1175/1520-0493(1969)097,0163:ATFTEP.2.3.CO;2
Chen Y., Yan L., Xu J., Zheng S., Chen G., and Lin P. (2023). Climate impacts of 2009/2010 mixed-type El Niño on double ITCZs over the eastern Pacific Ocean. Front. Marine Sci. 10. doi: 10.3389/fmars.2023.1114809
Cherchi A., Gualdi S., Behera S., Luo J. J., Masson S., Yamagata T., et al. (2007). The influence of tropical Indian ocean SST on the Indian summer monsoon. J. Climate 20, 3083–3105. doi: 10.1175/JCLI4161.1
Chou C. and Lo M.-H. (2007). Asymmetric responses of tropical precipitation during ENSO. J. Climate 20, 3411–3433. doi: 10.1175/JCLI4197.1
Doi T., Behera S. K., and Yamagata T. (2020). Wintertime impacts of the 2019 super IOD on East Asia. Geophysical Res. Lett. 47, e2020GL089456. doi: 10.1029/2020GL089456
Doi T., Behera S. K., and Yamagata T. (2022). On the predictability of the extreme drought in East Africa during the short rains season. Geophysical Res. Lett. 49, e2022GL100905. doi: 10.1029/2022GL100905
Du Y. and Xie S.-P. (2008). Role of atmospheric adjustments in the tropical Indian Ocean warming during the 20th century in climate models. Geophysical Res. Lett. 35, L08712. doi: 10.1029/2008GL033631
Du Y., Xie S.-P., Huang G., and Hu K. (2009). Role of air-sea interaction in the long persistence of El Niño–induced North Indian Ocean warming. J. Climate 22, 2023–2038. doi: 10.1175/2008JCLI2590.1
Du Y., Zhang Y., Zhang L. Y., Tozuka T., Ng B., and Cai W. (2020). Thermocline warming induced extreme Indian Ocean dipole in 2019. Geophysical Res. Lett. 47, e2020GL090079. doi: 10.1029/2020GL090079
Girishkumar M. S., Ravichandran M., and McPhaden M. J. (2013). Temperature inversions and their influence on the mixed layer heat budget during the winters of 2006–2007 and 2007–2008 in the Bay of Bengal. J. Geophysical Research: Oceans 118, 2426–2437. doi: 10.1002/jgrc.20192
Ham Y.-G., Choi J.-Y., and Kug J.-S. (2016). The weakening of the ENSO–Indian Ocean Dipole (IOD) coupling strength in recent decades. Climate Dynamics 49, 249–261. doi: 10.1007/s00382-016-3339-5
Hong C.-C., Lu M.-M., and Kanamitsu M. (2008). Temporal and spatial characteristics of positive and negative Indian Ocean dipole with and without ENSO. J. Geophysical Res. 113, D08107. doi: 10.1029/2007JD009151
Hu Z. Z., Kumar A., Huang B., Zhu J., L’Heureux M., McPhaden M. J., et al. (2020). The interdecadal shift of ENSO properties in 1999/2000: A review. J. Climate 33, 4441–4462. doi: 10.1175/JCLI-D-19-0316.1
Huang B., Thorne P. W., Banzon V. F., Boyer T., Chepurin G., Lawrimore J. H., et al. (2017). Extended reconstructed sea surface temperature, version 5 (ERSSTv5): upgrades, validations, and intercomparisons. J. Climate 30, 8179–8205. doi: 10.1175/JCLI-D-16-0836.1
Izumo T., Vialard J., Lengaigne M., de Boyer Montegut C., Behera S. K., Luo J.-J., et al. (2010). Influence of the state of the Indian Ocean dipole on the following year’s El Niño. Nat. Geosci. 3, 168–172. doi: 10.1038/ngeo760
Jofia J., Girishkumar M. S., Ashin K., Sureshkumar N., Shivaprasad S., and Pattabhi Ram Rao E. (2023). Mixed layer temperature budget in the Arabian Sea during winter 2019 and spring 2019: The role of diapycnal heat flux. J. Geophysical Research: Oceans 128, e2022JC019088. doi: 10.1029/2022JC019088
Kalnay E., Kanamitsu M., Kistler R., Collins W., Deaven D., Gandin L., et al (1996). The NCEP/NCAR 40-Year Reanalysis Project. Bull. Am. Meteorol. Soc. 77 (3), 437–472. doi: 10.1175/1520-0477(1996)077<0437:TNYRP>2.0.CO;2
Klein S. A., Soden B. J., and Lau N.-C. (1999). Remote sea surface temperature variations during ENSO: evidence for a tropical atmospheric bridge. J. Climate 12, 917–932. doi: 10.1175/1520-0442(1999)012<0917:RSSTVD>2.0.CO;2
Kug J.-S. and Ham Y.-G. (2012). Indian Ocean feedback to the ENSO transition in a multi-model ensemble. J. Climate 25, 6942–6957. doi: 10.1175/JCLI-D-12-00078
Kug J. S., Jin F. F., and An S. I. (2009). Two types of El Nino events: cold tongue El Nino and warm pool El Nino. J. Climate 22, 1499–1515. doi: 10.1175/2008JCLI2624.1
Kug J.-S. and Kang I.-S. (2006). Interactive feedback between the Indian ocean and ENSO. J. Climate 19, 1784–1801. doi: 10.1175/JCLI3660.1
Lau N.-C. and Nath M. J. (2003). Atmosphere–ocean variations in the Indo-Pacific sector during ENSO episodes. J. Climate 16, 3–20. doi: 10.1175/1520-0442(2003)016<0003:AOVITI>2.0.CO;2
Liang X. S. (2014). Unraveling the cause-effect relation between time series. Phys. Rev. E Stat. Nonlin Soft Matter Phys. 90, 52150. doi: 10.1103/PhysRevE.90.052150
Liang X. S. (2016). Information flow and causality as rigorous notions ab initio. Phys. Rev. E 94, 52201. doi: 10.1103/PhysRevE.94.052201
Lim E.-P. and Hendon H. H. (2017). Causes and predictability of the negative Indian Ocean Dipole and its impact on La Niña during 2016. Scientific Reports 7 (1), 12619. doi: 10.1038/s41598-017-12674-z
Liu Q., Fan L., Wang C., and Guo F. (2017). Indian ocean dipole modes associated with different types of ENSO development. J. Climate 30, 2233–2249. doi: 10.1175/jcli-d-16-0426.1
Lu B. and Ren H. L. (2020). What caused the extreme Indian Ocean Dipole event in 2019? Geophysical Res. Lett. 47 (11), e2020GL087768. doi: 10.1029/2020GL087768
Lu B., Ren H.-L., Scaife A.-A., Wu J., Dunstone N., Smith D., et al. (2018). An extreme negative Indian Ocean Dipole event in 2016: Dynamics and predictability. Climate Dynamics 51, 89–100. doi: 10.1007/s00382-017-3908-2
Luo J.-J., Zhang R., Behera S. K., Masumoto Y., Jin F.-F., Lukas R., et al. (2010). Interaction between el niño and extreme Indian ocean dipole. J. Climate 23, 726–742. doi: 10.1175/2009jcli3104.1
Lyman J. M., Good S. A., Gouretski V. V., Ishii M., Johnson G. C., Palmer M. D., et al. (2010). Robust warming of the global upper ocean. Nature 465, 334–337. doi: 10.1038/nature09043
Masumoto Y. and Meyers G. (1998). Forced Rossby waves in the southern tropical Indian Ocean. J. Geophysical Research: Oceans 103, 27589–27602. doi: 10.1029/98JC02546
Meyers G. A., McIntosh P. C., Pigot L., and Pook M. J. (2007). The years of El Niño, La Niña, and interactions with the tropical Indian Ocean. J. Climate 20, 2872–2880. doi: 10.1175/JCLI4152.1
Ng C. H. J., Vecchi G. A., Muñoz Á.G., and Murakami H. (2019). An asymmetric rainfall response to ENSO in East Asia. Climate Dynamics 52, 2303–2318. doi: 10.1007/s00382-018-4253-9
Philander S. G. (1990). El Niño, La Niña, and the Southern Oscillation (San Diego, California: Academic Press).
Qiu Y., Cai W. J., Guo X. G., and Ng B. (2014). The asymmetric influence of the positive and negative IOD events on China’s rainfall. Sci. Rep. 4, 4943. doi: 10.1038/srep04943
Qu T. (2003). Mixed layer heat balance in the western North Pacific. J. Geophysical Res. 108, 3242. doi: 10.1029/2002JC001536
Rao S. A., Behera S. K., Masumoto Y., and Yamagata T. (2002). Interannual variability in the subsurface tropical Indian Ocean with a special emphasis on the Indian Ocean Dipole. Deep-Sea Res. Part II 49, 1549–1572. doi: 10.1016/S0967-0645(01)00158-8
Rao R. R. and Sivakumar R. (2000). Seasonal variability of near-surface thermal structure and heat budget of the mixed layer of the tropical Indian Ocean from a new global ocean temperature climatology. J. Geophysical Research: Oceans 105, 995–1015. doi: 10.1029/1999JC900220
Rasmusson E. M. and Carpenter T. H. (1982). Variations in tropical sea-surface temperature and surface wind field associated with the Southern Oscillation/El Niño. Monthly Weather Rev. 110, 354–384. doi: 10.1175/1520-0493(1982)110<0354:VITSST>2.0.CO;2
Sabu P. and Revichandran C. (2011). Mixed layer processes of the Arabian Sea Warm Pool during spring intermonsoon: a study based on observational and satellite data. Int. J. Remote Sens. 32, 5425–5441. doi: 10.1080/01431161.2010.501350
Saji N. H., Goswami B. N., Vinayachandran P., and Yamagata T. (1999). A dipole mode in the tropical Indian Ocean. Nature 401, 360–363. doi: 10.1038/43854
Saji N. H. and Yamagata T. (2003). Structure of SST and surface wind variability during Indian Ocean dipole mode events: COADS observations. J. Climate 16, 2735–2751. doi: 10.1175/1520-0442(2003)016,2735:SOSASW.2.0.CO;2
Stuecker M. F., Timmermann A., Jin F. F., Chikamoto Y., Zhang W., Wittenberg A. T., et al. (2017). Revisiting ENSO/Indian Ocean Dipole phase relationships. Geophysical Res. Lett. 44, 2481–2492. doi: 10.1002/2016gl072308
Suarez M. J. and Schopf P. S. (1988). A delayed action oscillator for ENSO. J. Atmospheric Sci. 45, 3283–3287. doi: 10.1175/1520-0469(1988)045<3283:ADAOFE>2.0.CO;2
Thushara V. and Vinayachandran P. N. (2020). Unprecedented surface chlorophyll blooms in the southeastern arabian sea during an extreme negative Indian ocean dipole. Geophysical Res. Lett. 47, e2019GL085026. doi: 10.1029/2019GL085026
Timmermann A., An S.-I., Kug J.-S., Jin F.-F., Cai W., Capotondi A., et al. (2018). El niño—Southern oscillation complexity. Nature 559, 535–545. doi: 10.1038/s41586-018-0252-6
Venzke S., Latif M., and Villwock A. (2000). The coupled GCM ECHO-2.: part II: Indian ocean response to ENSO. J. Climate 13, 1371–1383. doi: 10.1175/1520-0442(2000)013<1371:TCGE>2.0.CO;2
Wallace J. M., Rasmusson E. M., Mitchell T. P., Kousky V. E., Sarachik E. S., and Von Storch H. (1998). On the structure and evolution of ENSO related climate variability in the tropical Pacific: Lessons from TOGA. J. Geophysical Res. 103, 14,241–14,259. doi: 10.1029/97JC02905
Wang B., Sun W., Jin C., Luo X., Yang Y.-M., Li T., et al. (2023). Understanding the recent increase in multiyear La Niñas. Nat. Climate Change 13, 1075–1081. doi: 10.1038/s41558-023-01801-6
Webster P. J., Moore A. M., Loschnigg J. P., and Leben R. R. (1999). Coupled ocean–atmosphere dynamics in the Indian Ocean during 1997–98. Nature 401, 356–360. doi: 10.1038/43848
Xie S.-P., Hu K., Hafner J., Tokinaga H., Du Y., Huang G., et al (2009). Indian Ocean Capacitor Effect on Indo–Western Pacific Climate during the Summer following El Niño. J. Climate 22 (3), 730–747. doi: 10.1175/2008JCLI2544.1
Xie S.-P., Annamalai H., Schott F. A., and McCreary J. P. (2002). Structure and mechanisms of South Indian Ocean climate variability. J. Climate 15, 864–878. doi: 10.1175/1520-0442(2002)015<0864:SAMOSI>2.0.CO;2
Yang Y., Xie S.-P., Wu L., Kosaka Y., Lau N.-C., and Vecchi G. A. (2015). Seasonality and predictability of the Indian ocean dipole mode: ENSO forcing and internal variability. J. Climate 28, 8021–8036. doi: 10.1175/JCLI-D-15-0078.1
Yeh S.-W., Kug J.-S., Dewitte B., Kwon M.-H., Kirtman B. P., and Jin F.-F. (2009). El Niño in a changing climate. Nature 461, 511–514. doi: 10.1038/nature08316
Yokoi T., Tozuka T., and Yamagata T. (2012). Seasonal and interannual variations of the SST above the Seychelles Dome. J. Climate 25, 800–814. doi: 10.1175/JCLID-10-05001.1
Zhang L., Shi R., Fraedrich K., and Zhu X. (2022). Enhanced joint effects of ENSO and IOD on Southeast China winter precipitation after 1980s. Climate Dynamics 58, 277–292. doi: 10.1007/S00382-021-05907-5
Zhang W., Wang Y., Jin F.-F., Stuecker M. F., and Turner A. G. (2015). Impact of different El Niño types on the El Niño/IOD relationship. Geophysical Res. Lett. 42, 8570–8576. doi: 10.1002/2015gl065703
Zhang Y., Zhou W., and Li T. (2021). Impact of the Indian ocean dipole on evolution of the subsequent ENSO: relative roles of dynamic and thermodynamic processes. J. Climate 34, 3591–3607. doi: 10.1175/JCLI-D-20-0487.1
Zheng X.-T., Xie S.-P., Vecchi G. A., Liu Q., and Hafner J. (2010). Indian ocean dipole response to global warming: analysis of ocean–atmospheric feedbacks in a coupled model. J. Climate 23, 1240–1253. doi: 10.1175/2009jcli3326.1
Zheng C., Zheng S., Feng M., Xie L., Wang L., Zhang T., et al. (2024). Interannual variability of the east African coastal current associated with El Niño–Southern Oscillation. J. Climate 37, 4613–4631. doi: 10.1175/JCLI-D-23-0563.1
Keywords: ENSO, IOD’s eastern pole (EP) and western pole (WP), IOB, asymmetry in change, Seychelles thermocline dome, regulation of atmospheric (oceanic wave) processes on IOD-EP (IOD-WP), Kelvin waves and Rossby waves, information flow
Citation: Huang X, Yan L, Xu J and Zheng S (2025) The interdecadal variation of the relationship between ENSO and the IOD’s eastern and western poles around 2000. Front. Mar. Sci. 12:1565878. doi: 10.3389/fmars.2025.1565878
Received: 23 January 2025; Accepted: 16 April 2025;
Published: 23 May 2025.
Edited by:
Matthieu Le Hénaff, Atlantic Oceanographic and Meteorological Laboratory (NOAA), United StatesReviewed by:
Kandaga Pujiana, University of Miami, United StatesAnnalisa Cherchi, National Research Council (CNR), Italy
Copyright © 2025 Huang, Yan, Xu and Zheng. This is an open-access article distributed under the terms of the Creative Commons Attribution License (CC BY). The use, distribution or reproduction in other forums is permitted, provided the original author(s) and the copyright owner(s) are credited and that the original publication in this journal is cited, in accordance with accepted academic practice. No use, distribution or reproduction is permitted which does not comply with these terms.
*Correspondence: Li Yan, eWFubGlAZ2RvdS5lZHUuY24=