 Olga Luengo-S1,2*
 Belén Rosado3
 Vanessa Jiménez-Morales4
 Amós de Gil2
 Jesús Gómez-Enri1Miguel Bruno1
 Manuel Berrocoso2,3
- 1Department of Applied Physics, University of Cádiz, Centro Andaluz Superior de Estudios Marinos (CASEM), Puerto Real, Spain
- 2Instituto Universitario de Investigación Marina (INMAR), Puerto Real, Spain
- 3Laboratory of Astronomy, Geodesy and Cartography. Department of Mathematics, Sciences Faculty, University of Cádiz, Puerto Real, Spain
- 4Department of Theoretical and Kosmos Physics. University of Granada, Granada, Spain
This study investigates seawater temperature patterns on Livingston and Deception Islands in Antarctica, where LIVMAR and DECMAR oceanographic stations are located, respectively. The research spans the period from 2015 to 2024, focusing on seasonal variations, long-term trends, and differences between the two stations. Seawater temperature data were analysed over a ten-year period, allowing for the examination of seasonal cycles, temperature extremes, and anomalies. Particular attention was paid to identifying influences from local geophysical features such as volcanic activity and glacial melt. Over these ten years, minimum temperatures have decreased, with DECMAR notably failing to record temperatures below the freezing point during the last two winters. The analysis reveals pronounced seasonality in both locations, with higher temperature peaks during the austral summer. DECMAR consistently registers higher maximum temperatures compared to LIVMAR, attributed to the volcanic activity of Deception Island. This volcanic influence introduces thermal anomalies, delays in minimum temperature occurrence, and greater variability in summer signals due to increased subsurface water flow within the volcanic plumbing system. During the austral winters, the stations exhibit distinct patterns. LIVMAR shows earlier and more variable temperature drops, while DECMAR demonstrates shorter but more stable freezing periods. These differences may result from freshwater input from the Johnson Glacier, which modifies local freezing conditions at Livingston Island, combined with the geothermal influence of Deception Island. The study identifies an overall upward trend in seawater and air temperatures, aligning with global and regional climate change patterns. The reduction in the frequency of extreme low temperature events that occurred between 2020 and 2022 during the volcano-tectonic event in the Bransfield Strait due to the eruption of the Orca volcano highlights the environmental changes affecting the South Shetland Islands region. This work underscores the importance of local geophysical processes, such as volcanic activity and glacier melt, in the regional thermal dynamics. While the similarities between LIVMAR and DECMAR reflect overarching climatic drivers, the observed differences illustrate the complexity introduced by local factors.
1 Introduction
The Southern Ocean has undergone significant changes in recent decades, resulting in major impacts on global climate. It has absorbed a large amount of climate change-related heat, which has been taken from the atmosphere and stored in its subsurface water masses (Frölicher et al., 2015; Auger et al., 2021; Intergovernmental Panel on Climate Change (IPCC), 2022). The western Antarctic Peninsula is a warming spot in Antarctica (Jones et al., 2016; Vorrath et al., 2020), experiencing a rise in atmospheric temperature of 0.54°C during the 20th century (Vaughan et al., 2003; Turner et al., 2005; Steig et al., 2009) and a minor cooling trend from 2000 to 2010 (Turner et al., 2020; Carrasco et al., 2021). Additionally, between the 1990s and the 2000s, subsurface temperatures in various water bodies around the western Antarctic peninsula experienced an increase of up to 1°C (Cook et al., 2016).
The Bransfield Strait is a semi-enclosed region located in the Atlantic sector of the Southern Ocean, at the boundary of the Weddell Sea and Drake Passage, separating the South Shetland Islands from the Antarctic Peninsula (Huneke et al., 2016). At the shelf slope, hydrographic data-based estimates of relative geostrophic circulation indicated the presence of the Bransfield Current (BC), a strong baroclinic current flowing northeastward along the South Shetland Islands (SSI) slope (Sangrà et al., 2017; Veny et al., 2022). Sangrà et al. (2011, 2017) propose that the BC surrounds the northeastern tip of the SSI and recirculates southwestwards along the northern flank of the SSI, within the Drake Passage, this model is based on in situ hydrographic observations and laboratory experiments, suggesting that the BC behaves as a buoyant gravity current. In addition, Veny et al. (2022) state that the BC is a circulation pattern present throughout the year in the Bransfield Strait.
Water masses in the strait are primarily influenced by freshwater runoff from the islands and two distinct water sources: water from the Bellingshausen Sea (Transitional Bellingshausen Water, TBW), which flows into the strait from the west and is pushed against the SSI, and modified water from the Weddell Sea (Transitional Weddell Water, TWW), which enters from the east and moves along the Antarctic Peninsula forming the Antarctic Coastal Current (CC) (Tokarczyk, 1987; García et al., 1994; Sangrà et al., 2017; Pérez et al., 2019; Seliverstova et al., 2023; Veny et al., 2022). The less dense and warmer water (TBW) flows over the denser and colder water (TWW) driven by the buoyancy-induced pressure gradient and constrained by the Coriolis force (Sangrà et al., 2011, 2017; Veny et al., 2022). The Peninsular Front (PF) forms when TBW and TWW encounter, also there is an anticyclonic eddy system (AE) between the BC and the PF, and a modified warmer Circumpolar Deep Water (CDW) tongue beneath the Bransfield Front (Sangrà et al., 2011, 2017).
Coastal surface waters in Antarctic regions, which interact with the atmosphere and are altered by meteoric water (mostly from glacial melt), are generally much colder than the upper circumpolar deep water (Klinck, 1998; Barnes et al., 2006). This source of meteoric water provides up to 5% of the near-surface ocean during the austral summer. Seasonality is meaningful, with freezing-point temperatures during the winter beginning to rise as solar forcing increases, reaching the warmest waters during the summer and lower salinities (Lenn et al., 2003; Clarke et al., 2008; Meredith et al., 2008).
For long-term series, the acquisition of any environmental or oceanographic variables in Antarctica is complex. This is especially true in the austral winter, when widespread sea ice and reduced daylight hinder operations (Venables et al., 2023). Therefore, conducting observations throughout the year is of significant scientific importance. Longer records of near-shore temperatures in these regions show a marked seasonal cycle with a pattern where there is a marked variation in temperature between summer maxima and winter minima (Barnes et al., 2006).
Sea ice forms during the winter, but its presence and persistence can vary according to changes in air temperature and the strength and direction of the wind (Venables et al., 2023). One of the conditions for the generation of the sea ice is water temperature; freezing point of surface water in these polar waters is considered to be around -1.9°C (Jacobs et al., 1992; Hofmann et al., 1996; Hunt et al., 2003; Joughin and Padman, 2003; Damini et al., 2022). The freezing point of water is a function of salinity, thus the input of glacial ice melt will act to influence further sea ice production (Meredith et al., 2008). In addition, it is pressure-dependent, freezing point decreases with increasing pressure (Foldvik and Kvinge, 1974). Mahoney et al. (2011) conducted a study in McMurdo (Antarctica) where they also mention that the freezing point of the surface of the ocean is a function of salinity and for their study it varies between -1.8°C and -1.9°C for salinities between 33.7 and 34.8 psu. Hunt et al. (2003) obtained seawater temperature records for 2020 at Cape Armitage site and for two consecutive years at McMurdo station; both sites belong to McMurdo Sound. Maximum temperatures reached values of -0.3°C (Cape Armitage) and -0.4°C (McMurdo station); and the lowest temperatures at around -1.8°C. Cárdenas et al. (2018) recorded a water temperature ranging between -1.7° and 3.0°C from January 2016 to February 2017 around Doumer Island (Western Antarctic Peninsula).
This article aims to present a detailed analysis of seawater temperature dynamics around Deception Island, an active volcanic system, and Livingston Island, a non-volcanic landmass, both located within the South Shetland Archipelago, Antarctica. Based on a decade-long dataset, the study examines temporal variations in seawater temperature and investigates the influence of volcanic activity, geodynamic processes, and climatic factors. The findings provide valuable insights into the local and regional drivers of thermal variability in Antarctic waters.
2 Study area
The study focuses on the Bransfield Strait where Deception and Livingston Islands are located, the stations are based in these islands due to the presence of the two Spanish Antarctic Research Stations Juan Carlos I in Livingston Island and Gabriel de Castilla in Deception Island and, of course, because of its exceptional geodynamic characteristics. The South Shetland archipelago is located in the Bransfield Strait, about 100 km away from the Antarctic Peninsula. This region is considered a very tectodynamically complex area due to the interaction of several tectonic plates; two main tectonic plates: The South American plate and Antarctic plate; and three microplates: Scotia, Phoenix and South Shetland (Henriet et al., 1992; Lawver et al., 1996; Baraldo, 1999; González-Casado et al., 2000; Bohoyo et al., 2002; Ramírez, 2007). The central Bransfield Basin has a tectonic configuration associated with active subduction and an expansive back-arc center forming a NE-SW-axis spreading rift (Figure 1A) (Barker, 1982; Grad et al., 1992; Barker and Austin, 1998; Martí et al., 2013). Besides, it is characterised by the presence of active volcanism with emerging volcanoes (Deception, Penguin and Bridgeman; Smellie et al., 1990); and numerous submarine volcanic edifices which can be seen in Figure 1B (Orca, Three Sisters etc; Barker and Austin, 1998; Almendros et al., 2020; Dählmann et al., 2001).
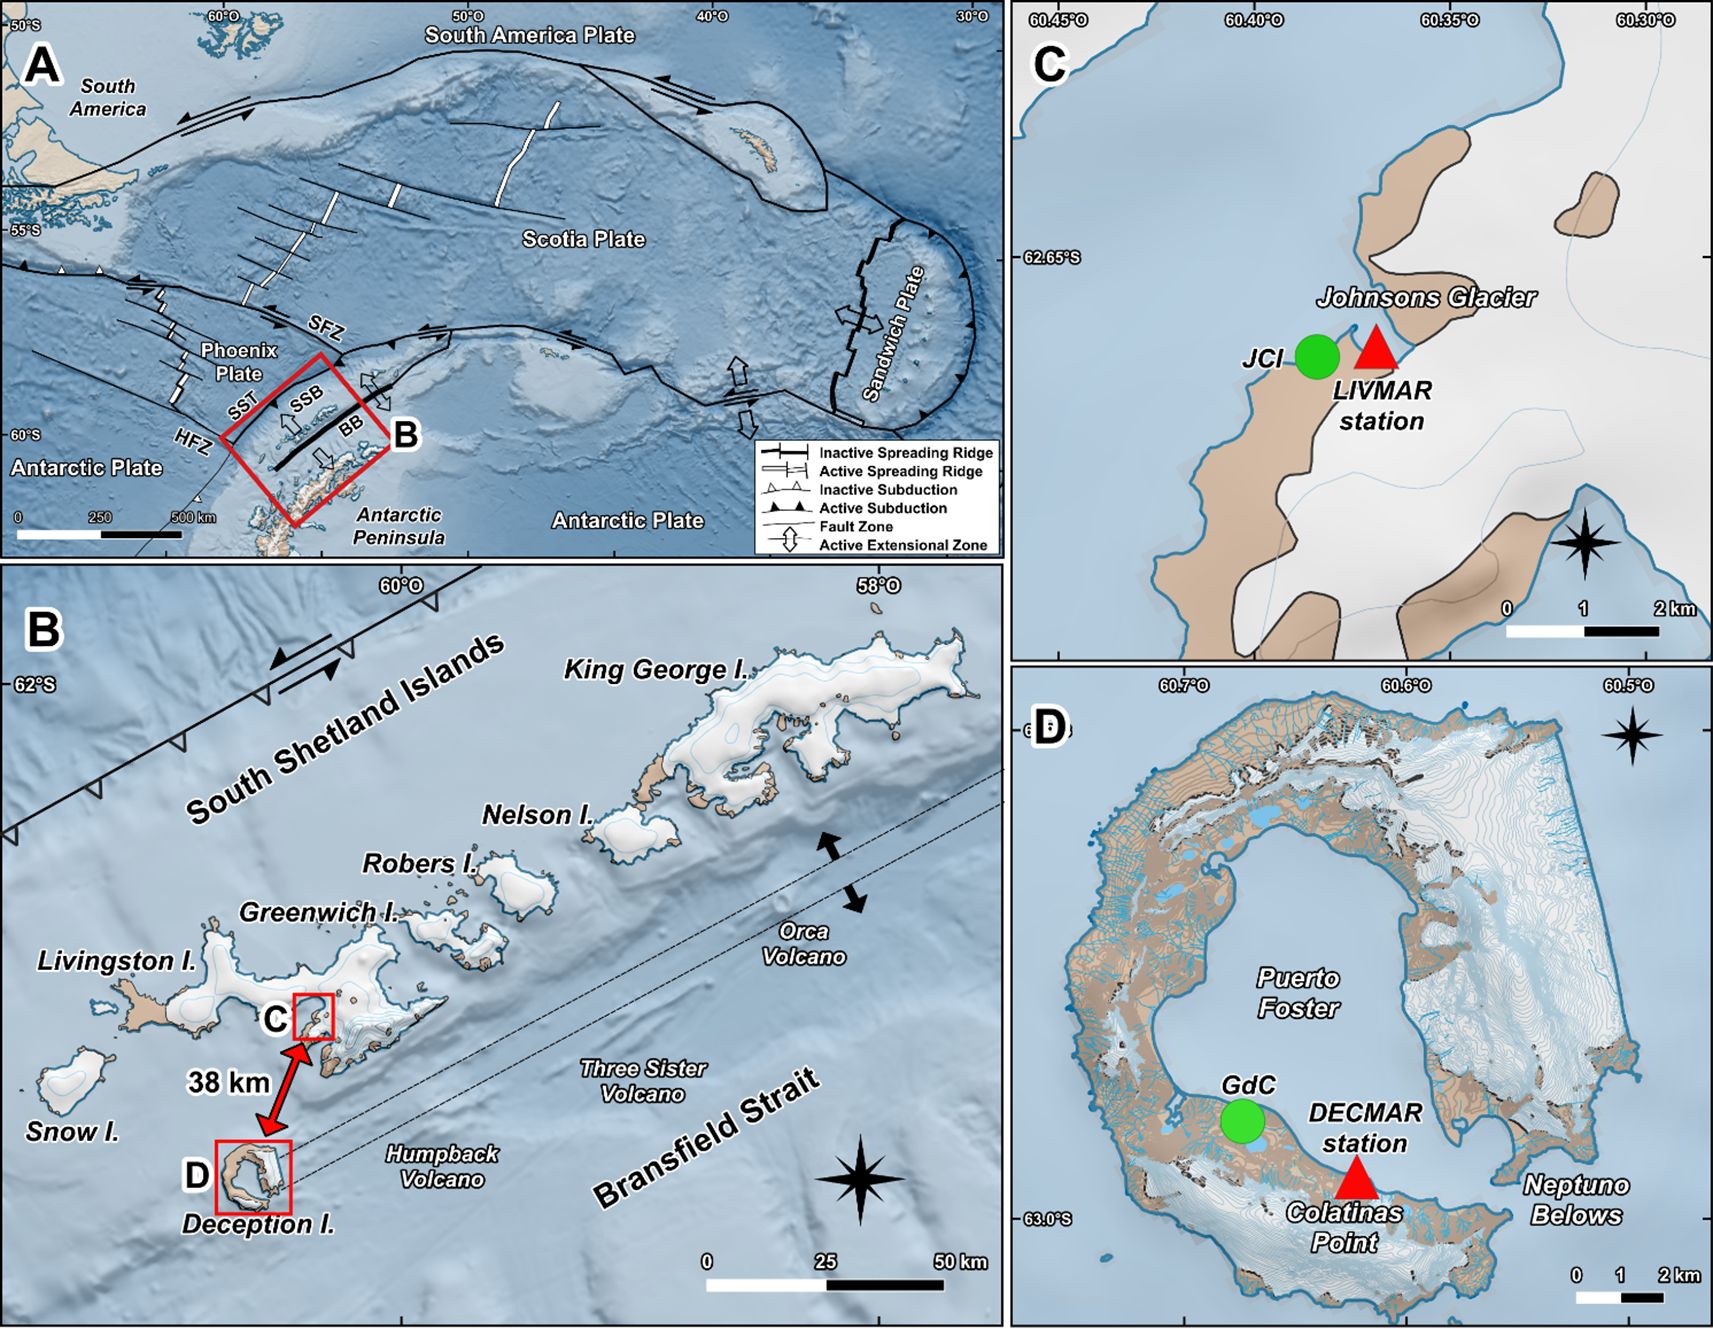
Figure 1. (A) Antarctic region, simplified bathymetric map and tectonic setting of the region. Morphological features: SSB (South Shetland Block), SST (South Shetland Trench), BB (Bransfield Basin), HFZ (Hero Fracture Zone), SFZ (Shackleton Fracture Zone). (B) South Shetland Archipelago including: King George, Nelson, Robert, Greenwich, Livingston, Deception, Snow, Low and Smith islands. Submarine volcanoes; Humpback, Three Sisters and Orca. (C) Livingston Island, tide gauge at LIVMAR station at Johnsons Cove (red triangle) and JCI atmospheric station (green dot). (D) Deception Island, tide gauge at DECMAR station at Colatinas Point (red triangle) and GdC atmospheric station (green dot). Maps have been made with Quantarctica package for QGIS from the Norwegian Polar Institute. https://npolar.no/quantarctica/#toggle-id-6.
Deception Island is a horseshoe-shaped active volcano located in the southern limit of the Bransfield Basin (Figure 1D); it has a central flooded caldera, Port Foster, which opens onto Bransfield Strait through a shallow and narrow sill called Neptune Bellows (Smith et al., 2003). This volcanic island has registered three eruptive periods over the last two centuries: 1818-1828, 1906–1912 and 1967-1970 (Smellie, 2001) and this volcanic activity has been monitored by geophysical and geodetic techniques (Rosado et al., 2019; Jiménez-Morales et al., 2022). At the surface, the main indicators of current volcanic activity are the existence of fumarolic areas and thermal springs (Berrocoso et al., 2018). Despite this, about 57% of the island’s land surface is currently covered by ice (Smith, 2005). As an active volcano area, it possesses special physico-chemical properties where waters present water temperature, turbidity and volcanic related chemistry (Elderfield, 1972; Barnes and Conlan, 2007; Caselli et al., 2007; Martín, 2021) as well as its geodynamic activity (Jiménez Morales et al., 2017; Rosado et al., 2019). Flexas et al. (2017) describes that a strong seasonal influence governs the hydrodynamic circulation inside Port Foster. During summer, due to the atmospheric warming of the sea surface a thermocline is generated leading to a two-layer laminar structure. In the upper layer, circulation is anticlockwise, while in the deeper layer, it is clockwise (Flexas et al., 2017). As autumn arrives, this configuration transitions into a single homogeneous water column, with temperatures near freezing (around -1.85°C) by the end of winter (Lenn et al., 2003). According to Vidal et al. (2012) salinity values in Port Foster were around 33.6-33.7 psu.
Livingston Island is the second largest island of the South Shetland Islands (Figures 1B, C); it has a surface area of 974 km2. The island is covered with glaciers and ice caps, with approximately 90% of its surface permanently covered by ice, and only the west side and some coastal areas are snow-free in the summer (Calleja et al., 2019; Sugiyama et al., 2019; Recondo et al., 2022). In one of these ice-free areas, called the Hurd Peninsula (Sugiyama et al., 2019), the JCI base is located. Johnson Cove Bay, according to Vidal et al. (2011), has salinity values around 33.5 psu.
Moreover, it is worth noting that the Bransfield Strait region experienced intense seismic activity centred around the Orca submarine volcano, which began in August 2020 and lasted for approximately one year (Rosado et al., 2023; Poli et al., 2021). This seismic sequence comprised more than 80.000 earthquakes, primarily located to the northeast of the Orca volcano, with depths reaching up to 10 km (Rosado et al., 2023; Cesca et al., 2022). According to Poli et al. (2021), this seismic swarm is one of the largest ever recorded along a spreading ridge, with an inferred volcanic origin. The seismic activity was characterised by two significant energy release phases. The first occurred in November 2020 and included the highest number of events exceeding magnitude 4, along with an initial largest earthquake of 5.9 Mw near Orca (Rosado et al., 2023). The second peak took place in January 2021, featuring the biggest earthquake of the swarm, reaching 6.9 Mw and located further east (Rosado et al., 2023). This seismic episode was accompanied by a displacement of up to ~11 cm towards the northwest on King George Island, suggesting magma intrusion as the primary mechanism driving this complex activity (Cesca et al., 2022).
3 Data
3.1 Oceanographic stations
During the 2007/2008 survey, the Astronomy and Geodesy Laboratory of the University of Cádiz (LAGC) began recording tide levels at Deception Island. However, at Livingston Island, data collection did not begin until the 2009/2010 survey. The establishment of a definite system for recording the time series on both islands required several years of testing. At first rigid cables were used for tying the instruments, and due to the harsh weather conditions during the austral winter and the formation of the ice sheet hindered the data acquisition. Lei et al. (2018) show similar problems with the sensor anchoring cable and massive sea ice. Likewise, Pytharouli et al. (2018), find jumps in their records and mention that they could be due to changes in the datum or instrument failures. Finally, after several attempts, flexible mooring ropes were used, allowing for relatively continuous long-term records on both islands since 2015.
Data from two stations located on Deception Island (DECMAR in Figure 2D, 62°59’19.02”S 60°37’18.45”W) and Livingston Island (LIVMAR in Figure 2C, 62°39’38.70”S 60°22’11.62”W) are used. The location of LIVMAR station is at Johnsons Cove, at the base of the tide glacier Johnsons, and DECMAR station is at Colatinas Point near Neptune Bellows.
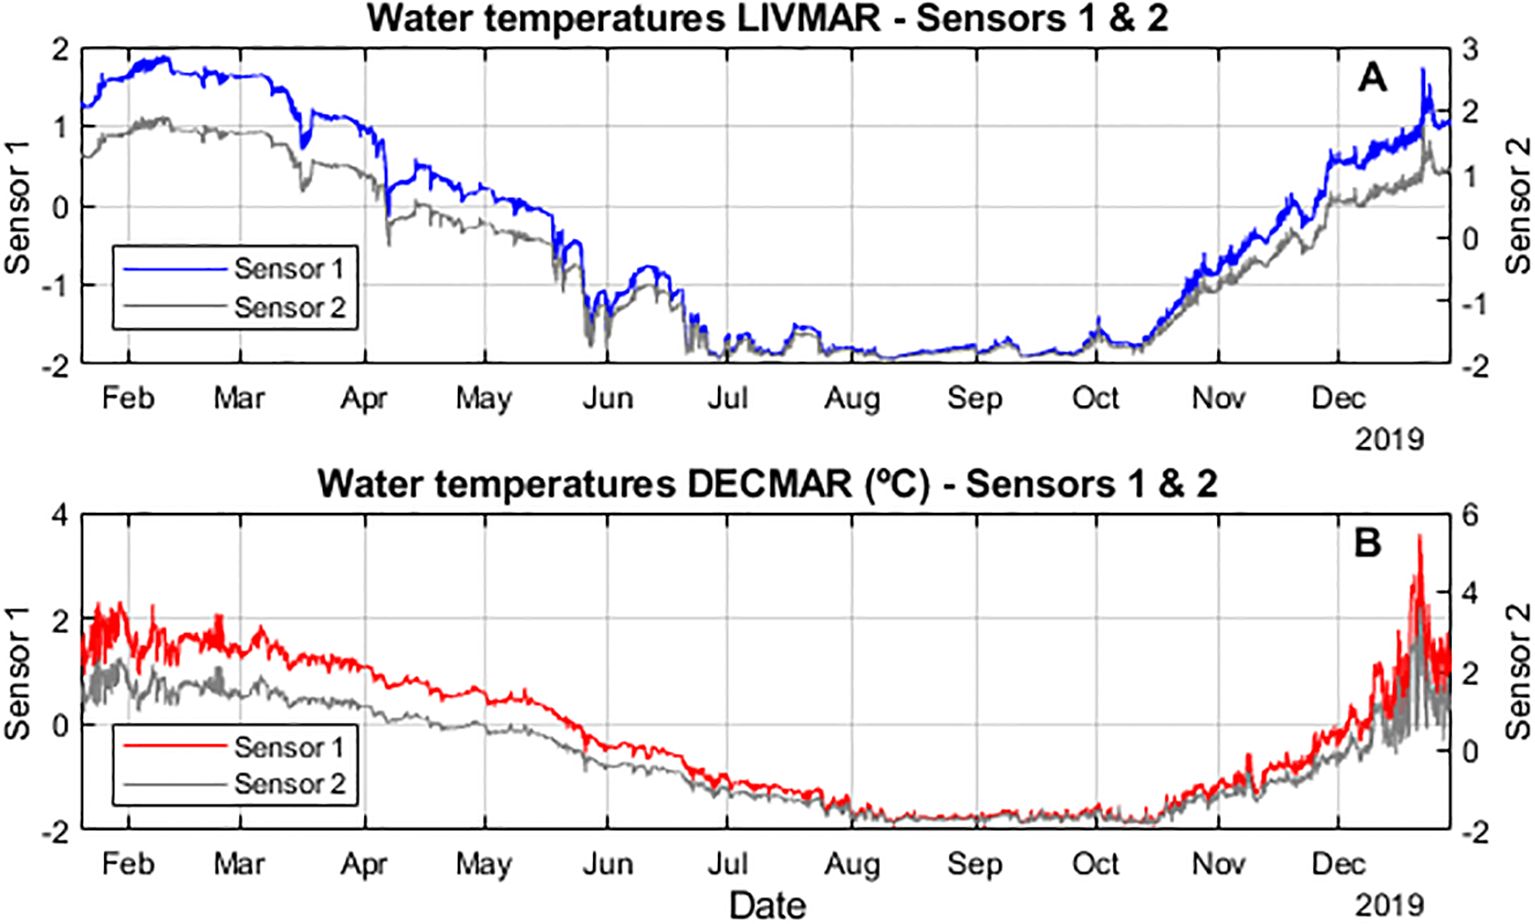
Figure 2. (A) Temperature records at the LIVMAR station with the two sensors at anchor from December of 2018 to February 2020 (blue corresponds to Sensor 1 and grey to Sensor 2). The Y-axes are not equal, otherwise it would not be seen that both records are equal. (B) Temperature records at the DECMAR station with the two sensors at anchor from December of 2018 to February 2020 (red corresponds to Sensor 1 and grey to Sensor 2). In both cases, the plots for sensors 2 have been shifted to display the similitude of both data sets.
Both stations have two pressure and temperature AQUAlogger 520PT sensors, moored at a depth of 10 m. Due to the unavailability of remote data, each station has two instruments that record simultaneously in order to have duplicate data in case of failure of one instrument, Figure 2 shows that the two series are identical. For better visualisation in Figures 2A, B, the axes of Sensor 1 (left) and Sensor 2 (right) have been displaced, as otherwise the series would overlap. They do not have the same values between stations, as DECMAR reaches higher temperatures.
These sensors record temperatures with an accuracy of ± 0.05 °C and resolutions of 0.007°C. They were programmed to record 3 data with a time sampling of 20 minutes and a burst of 5 seconds. This is the shortest possible sampling interval that allows battery operation for a full year (Figure 2), as battery replacement can only be performed during the austral summer. The sensors that are anchored each year have been previously calibrated by the company supplying the equipment to ensure the reliability of the records. Continuous data has been available since 2015 for both islands.
3.2 Atmospheric stations
The Spanish Meteorological Agency (AEMET) has two meteorological stations located next to LIVMAR station (JCI in Figure 1C, 62°39’47”S 60°23’16”W) and next to DECMAR station (GdC in Figure 1D, 62°58’37.16’’S 60°40’3.63’’ W). AEMET started meteorological data acquisition in 1988 supporting the Spanish bases with weather forecastings. The stations are equipped with HMP155 Vaisala sensors that measure air temperature at 10-minute intervals, with an accuracy of ±0.35°C. The sensors are positioned 12 metres above sea level (a.s.l.).
The air temperature series has been downloaded from AEMET OpenData from 2015 to 2025. Since raw data are often missing or of poor quality due to technical issues or adverse weather conditions (e.g., snow, ice, wind), the dataset is filtered to minimise errors (Recondo et al., 2022). In addition, in order to have the data at the same interval as the water temperature data, they were averaged every 20 min (Figure 3).
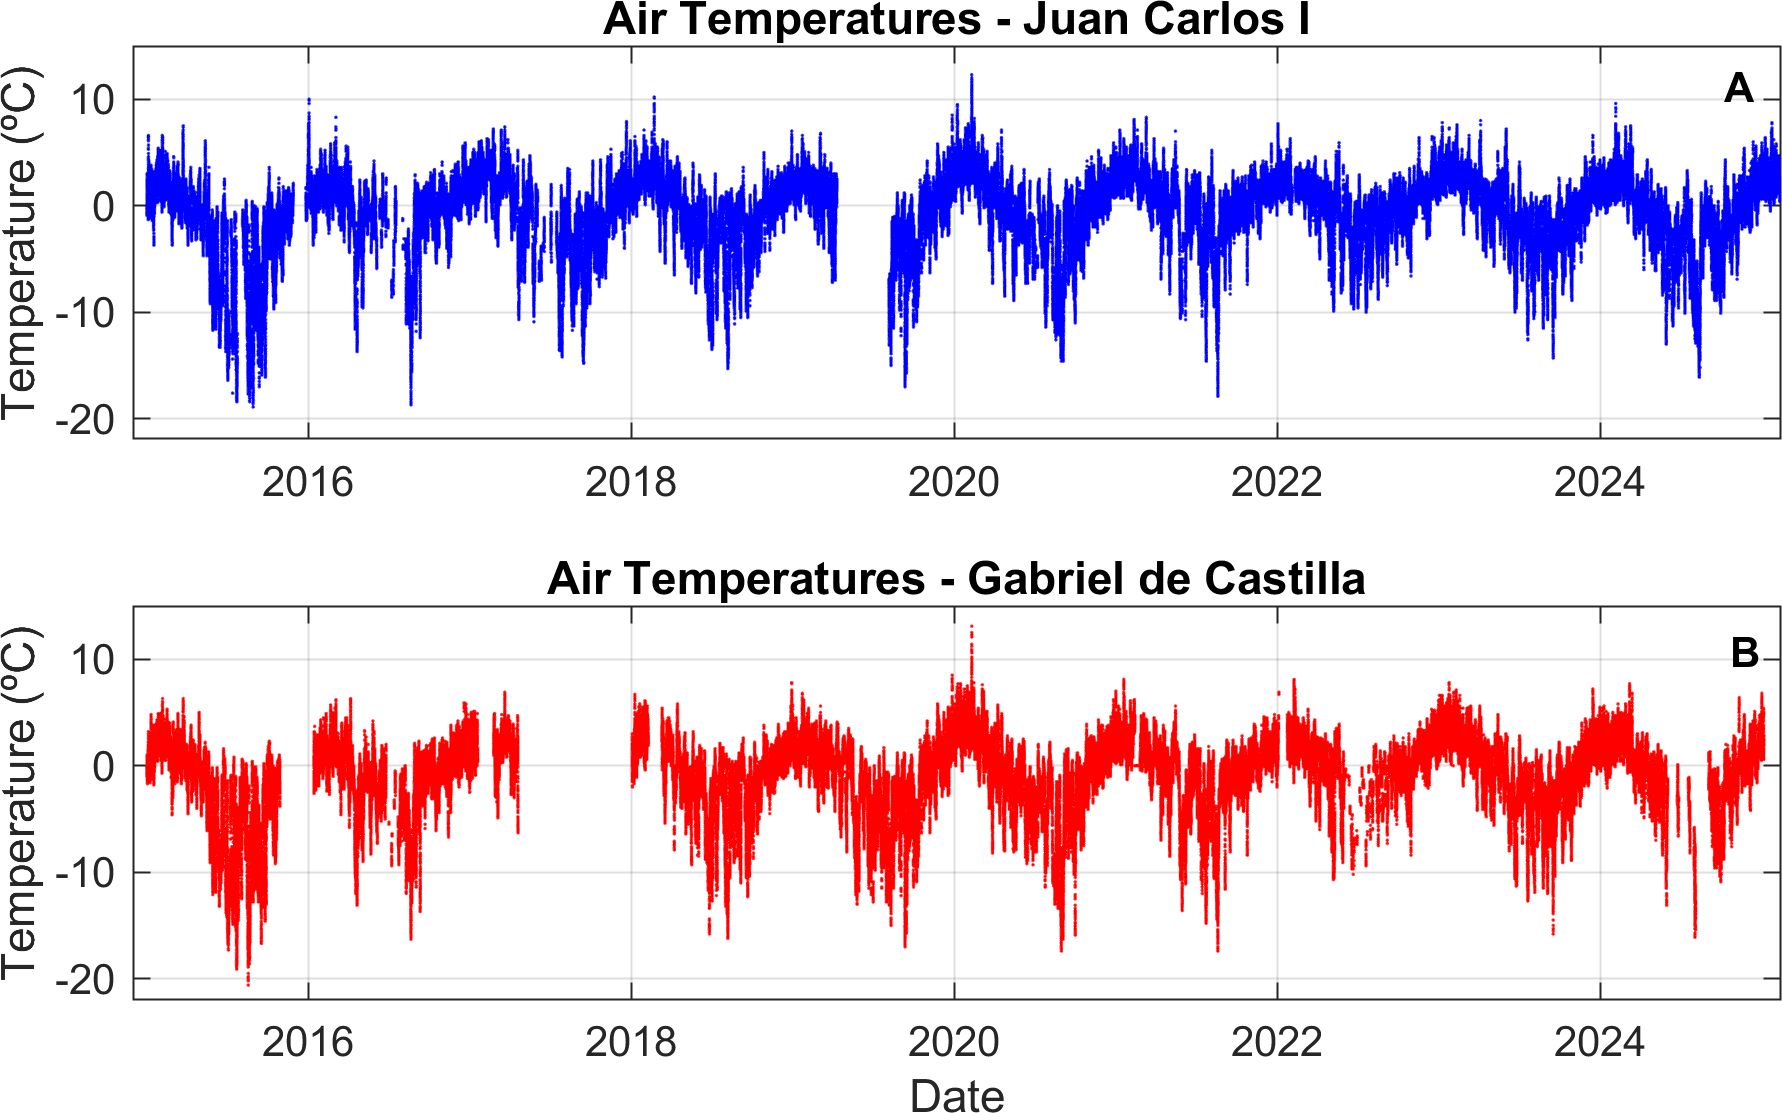
Figure 3. (A) Air temperature at Livingston Island sampled every 20 min from December 2014 to December 2022 (JCI, blue). (B) Air temperature at Deception Island sampled every 20 min from December 2014 to December 2022 (GdC, red). The gaps in the record are due to missing or anomalous data.
4 Methodology and results
The series are obtained on an annual basis, with the initial step involving the merging of the data. Once continuous data are established, both descriptive and analytical analyses are performed. Furthermore, monthly temperature averages are calculated to offer a more detailed foundation for the analysis, thereby facilitating the identification of seasonal trends and patterns.
Moreover, the temperature series were analysed using the procedure followed by an STL (Seasonal and Trend decomposition procedure based on LOESS) decomposition. The STL method is an iterative technique that decomposes time series data into three components: trend, seasonality, and residuals. It allows for flexibility in specifying the amount of variation in the trend and seasonal components and produces robust estimates that are not distorted by transient outliers (Cleveland et al., 1990; Sanchez-Vazquez et al., 2012). The core of STL is the use of LOESS smoothing, a local polynomial regression technique, to estimate these components iteratively. The STL procedure comprises two iterative stages: internal and external. First, the seasonal component is estimated by grouping data points based on their seasonal indices (e.g., months or weeks) and applying LOESS smoothing to capture periodic variations. This seasonal component is subtracted from the original data to isolate a preliminary trend-cycle component, which is further smoothed over a larger window to estimate the trend. Finally, the residuals are calculated by removing the trend and seasonal components from the original data. These steps are repeated iteratively, refining each component until convergence is achieved. To carry out this decomposition of the series, it was adapted the R program developed by Hafen (2016) based on the description of the methodology of Cleveland et al. (1990).
In addition, the Root Mean Squared Error (RMSE) and Pearson’s correlation coefficient (r) between the DECMAR/LIVMAR and GdC/JCI series were calculated in order to see their similarity.
4.1 Temperature time series
The temperature series for both islands since 2011 are shown below (Figure 4), in this and the following figures, blue represents LIVMAR station (Figure 4A) and red DECMAR station (Figure 4B); gaps in the series represent the lack of data. Before starting the comparison between islands, it should be noted that during the austral winter of 2012, at DECMAR station recorded anomalous temperatures, reaching peaks of up to 10°C (Figure 4B). The detection was favoured, as it started during the austral winter when Puerto Foster was covered by sea ice, thereby reducing heat exchange at the water-atmosphere interface (Berrocoso et al., 2018). According to this study, these anomalies result from the periodic advection of water previously heated in the island’s interior by the injection of submarine magma, which aligns with the higher volcanic activity recorded. Given the presence of sea ice within the bay during the winter of 2018, which inhibited heat loss through water-atmosphere exchange, Berrocoso et al. (2018) confirmed that water masses passing through the Fumarole Bay area warmed significantly and exhibited notable peaks when exiting the bay, coinciding with low tide. This is consistent with the circulation patterns described by Flexas et al. (2017). However, in other winters, such favourable conditions were not observed, and no volcanic activity of comparable magnitude was recorded.

Figure 4. (A) Water temperature series at LIVMAR station (blue). (B) Water temperature series at DECMAR station (red), where temperature anomalies are due to volcanic activity. Gaps in the graphs are due to missing data caused by equipment power failures.
Except for 2012 austral winter at DECMAR, the rest of the years show a clear seasonal variation, reaching the minimums during the austral winter and the maximums in the austral summer. However, the two islands differ in magnitude. Deception reaches higher temperatures during summers (around 4°C) than Livingston (2°C). During winters, temperatures are similar, but have a longer duration in Livingston, this could be due to local behaviour as Deception Island is a volcano.
The analysis now focuses on December 2014 to February 2025 as this is the time period for which continuous data from both stations are available (LIVMAR Figure 5A and DECMAR Figure 5B). The highest recorded temperatures at LIVMAR occurred during January 2023 (2.59°C). Regarding DECMAR, the highest temperature is 3.69°C, observed in January 2017 and January 2025. The lowest temperatures recorded were for DECMAR -1.94°C in August 2017 and for LIVMAR -1.97°C in August 2020.

Figure 5. (A) Water temperature records for the period December 2014 to February 2025 at stations LIVMAR (blue). (B) Water temperature records for the period December 2014 to February 2025 at DECMAR station (red).
The temperatures recorded during the austral summers (Figure 6A) exhibit a similar pattern on both islands. However, temperatures are consistently higher at DECMAR (1.1°C approximately more than LIVMAR), which could be due to the volcanic character of the island. For both islands, the first two summers (2014/2015 and 2015/2016) recorded the lowest temperatures, while the summers of 2016/2017, 2019/2020, and 2022/2023 saw the highest temperatures.
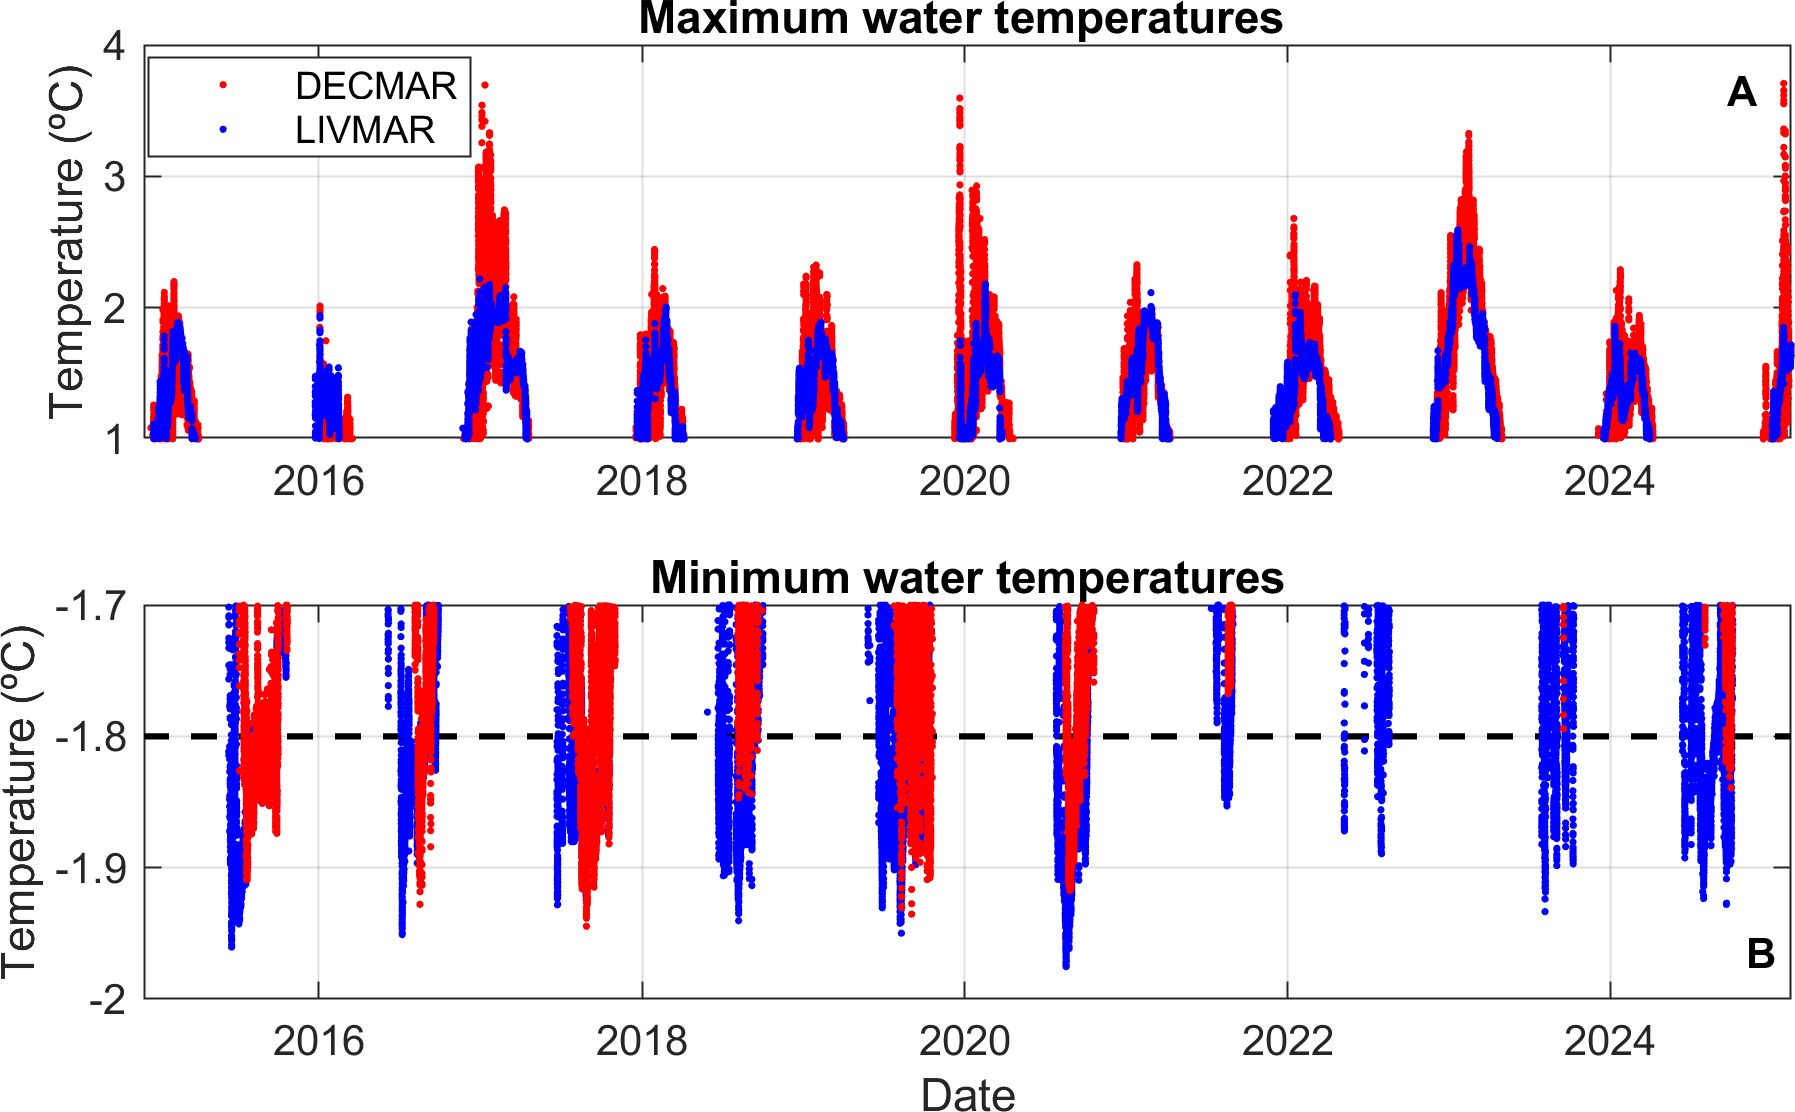
Figure 6. (A) Maximum water temperature records at LIVMAR (blue) and DECMAR (red) stations during austral summers between December 2014 to February 2023. (B) Water temperature records below -1.8°C at LIVMAR (blue) and DECMAR (red) stations during austral winters between December 2014 to February 2023. The black dashed line indicates a temperature of -1.8°C, the freezing point.
Focusing now on the lows (Figure 6B), minimum temperatures are first reached in LIVMAR station in June or July, instead in DECMAR station occurs in July or August; the rise in temperature is usually on similar dates. Based on the salinities recorded during an austral summer on both islands (Vidal et al., 2012), it could be established that in the bays where the oceanographic stations are located the freezing point is around -1.8°C. During the austral winters of 2015 and 2017, both islands experienced the longest period with temperatures near to the freezing point (Figure 6). On both islands the duration of low water temperatures during the austral winter is variable. As can be seen in Figure 6, during the austral winters of 2021, 2022 and 2023 in Deception Island there were no occurrences of temperatures below -1.8°C. However, during the winter of 2024 temperatures below -1.8°C appears again at DECMAR. Periods of temperatures below -1.8°C, although shorter in DECMAR, are more continuous than in LIVMAR, where temperatures below -1.8°C start earlier but oscillate.
For a more comprehensive analysis of the summer seasons, they have been plotted overlapping in Figure 7 (DECMAR red and LIVMAR blue), where beginning and end of the austral summer are indicated by vertical dashed lines. DECMAR station shows more oscillations in maximum temperatures than LIVMAR, reaching oscillations of up to 1.44°C by January 2020 (Figure 7F). Despite these differences in the magnitude of the temperature oscillations between stations, they behave in a similar way, since when the temperature rises or falls in one of the stations it occurs in the other, although with a different amplitude. This can be clearly seen in Figure 7B, for example, that when the temperature drops in February 2016 it also drops at DECMAR; and in Figure 7F when it rises at DECMAR in December 2019 it also rises at LIVMAR, although to a lesser extent.
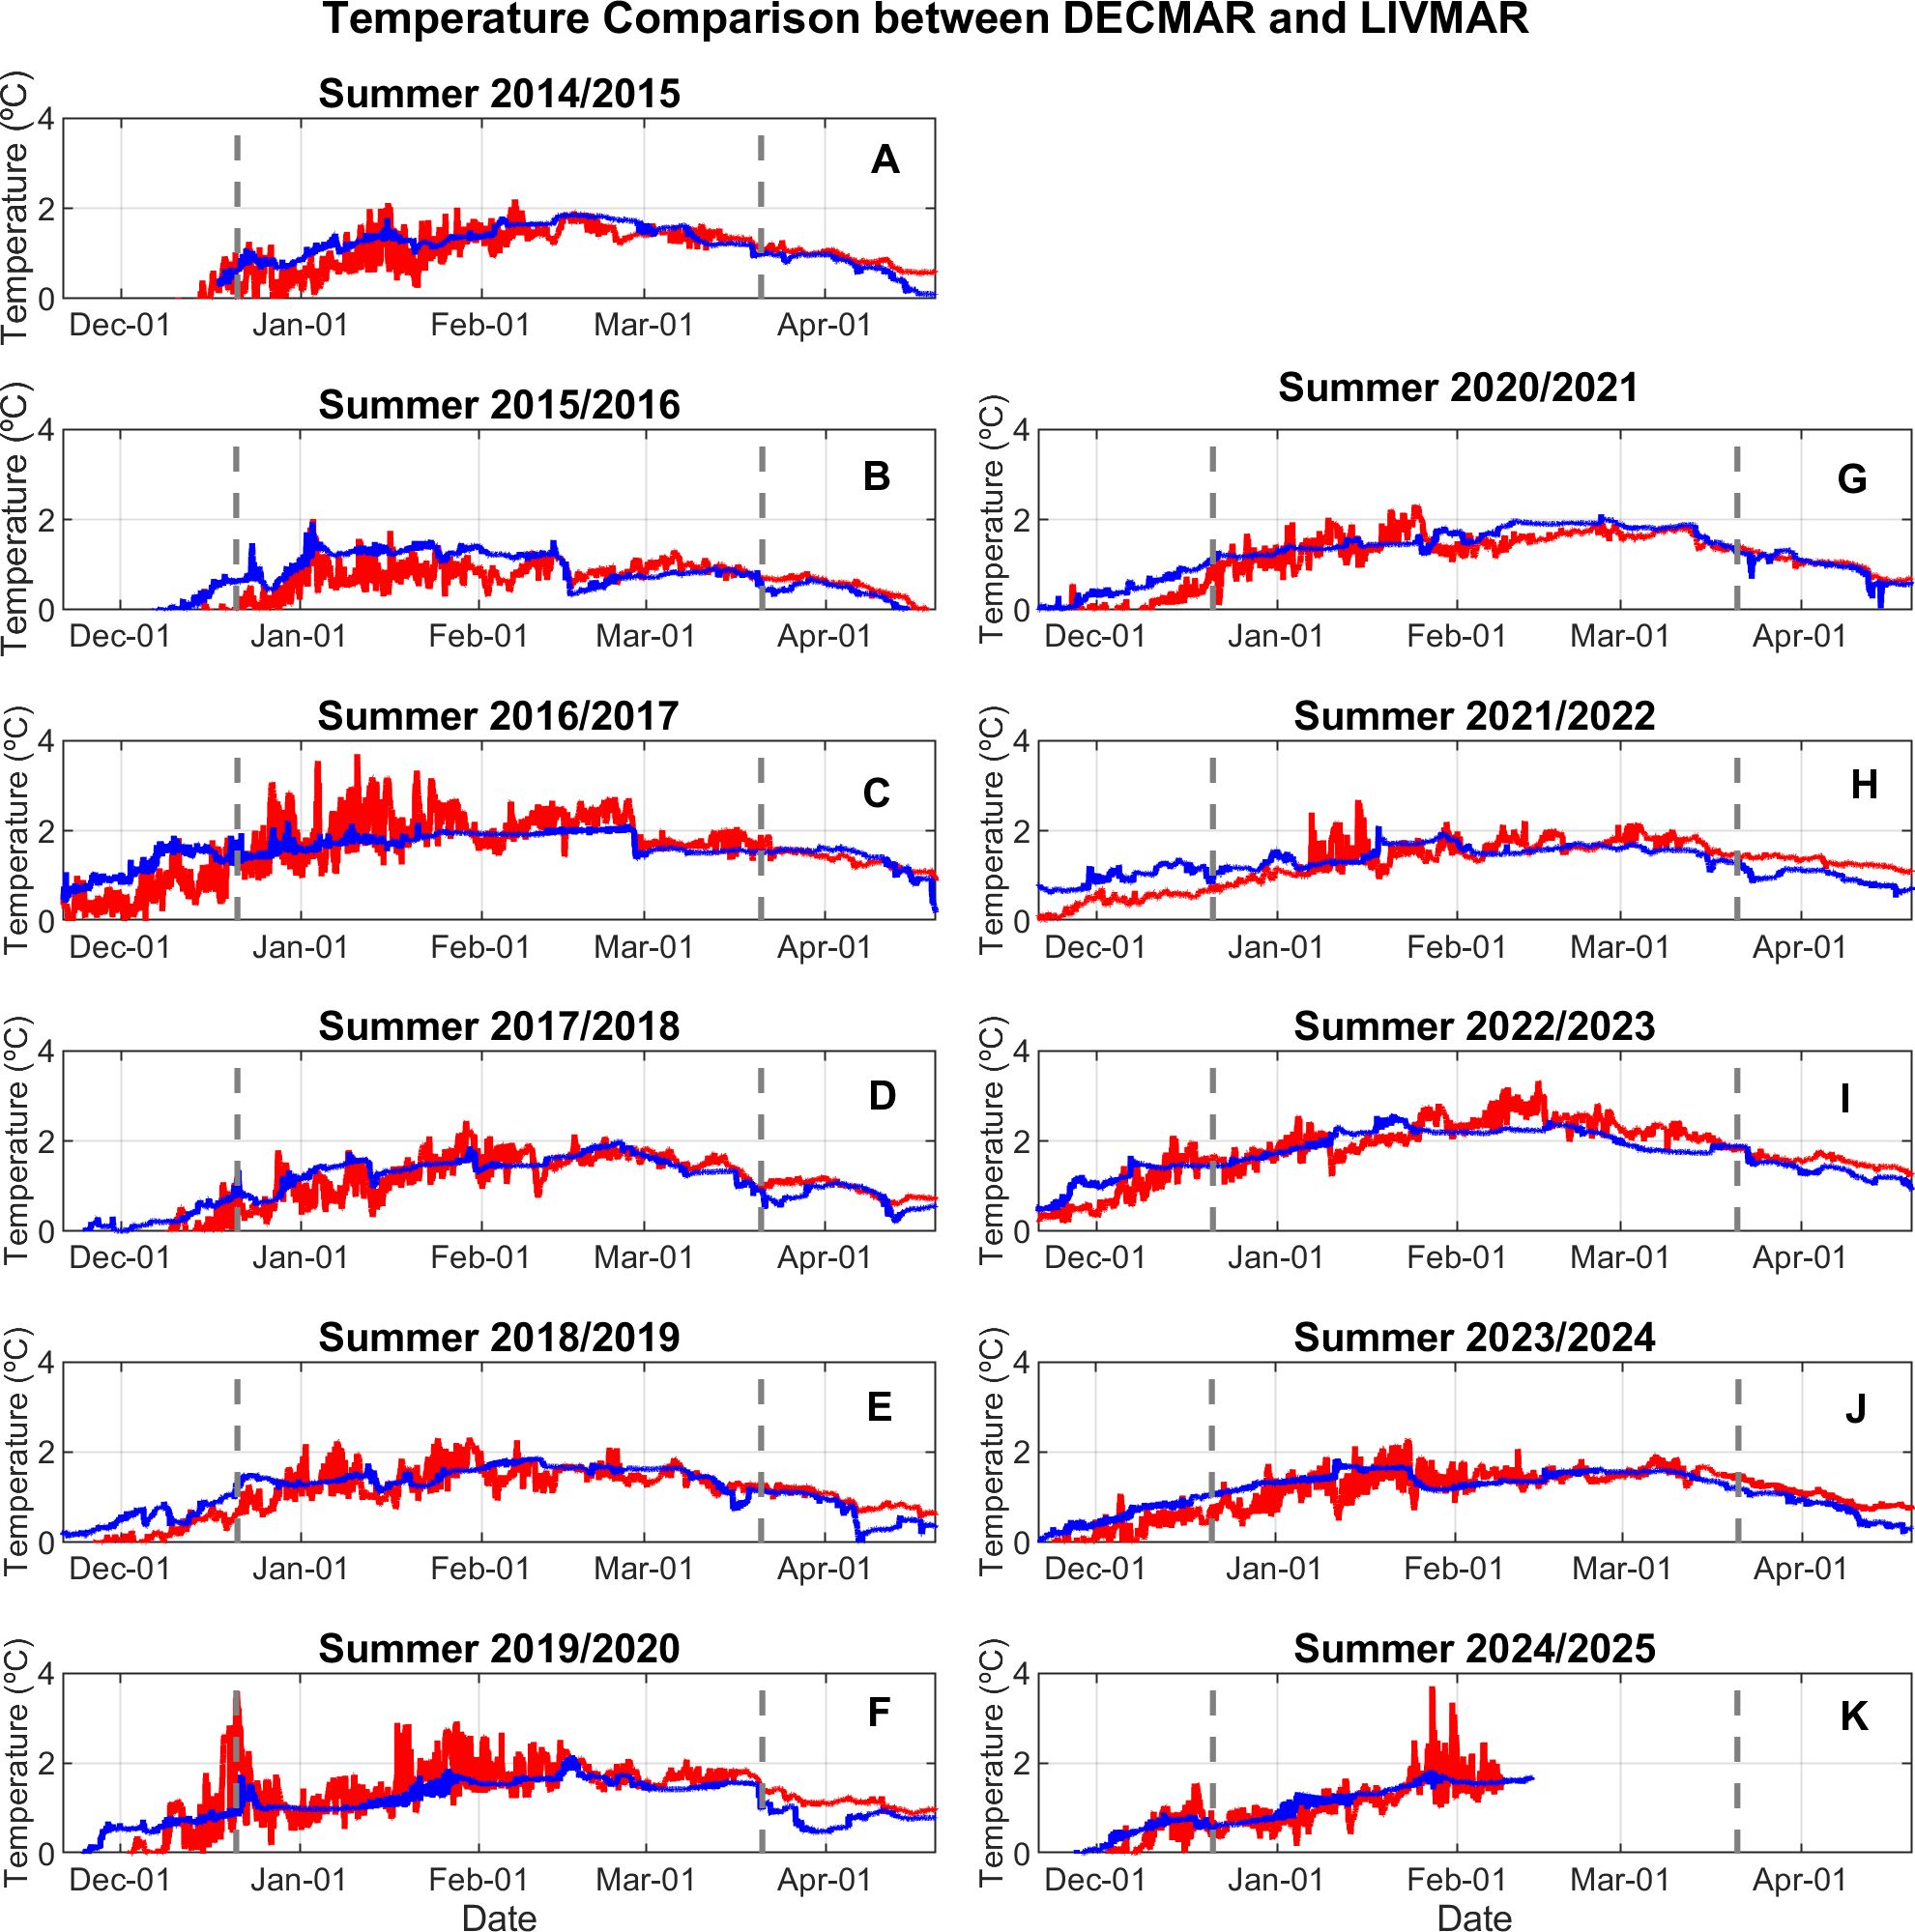
Figure 7. Graphs of austral summers from 2014 to 2025 are presented (from A-K). The red lines represent the DECMAR station, while the blue lines correspond to the LIVMAR station. The dashed vertical lines mark the start and end of the austral winter (December 21 and March 20, respectively). November and April are also included to show the temperature trends before and after summer.
Also, maximum temperatures have decreased over the years, and DECMAR oscillations have decreased, but this could be due to volcanic activity. It could be suggested that the summer season is brought forward each year with the exception of summer 2016/2017. Pre-summer temperatures increase earlier at LIVMAR than at DECMAR.
To provide a clearer understanding of the austral winter, Figure 8 presents an overlay of water temperatures for both stations (DECMAR in red and LIVMAR in blue) from November to October each year. These months were chosen to encompass the winter season as well as an additional month at the start and end, offering a more comprehensive view. In this figure, grey shadow zone indicates temperatures below -1.8°C and vertical dashed lines austral winter.
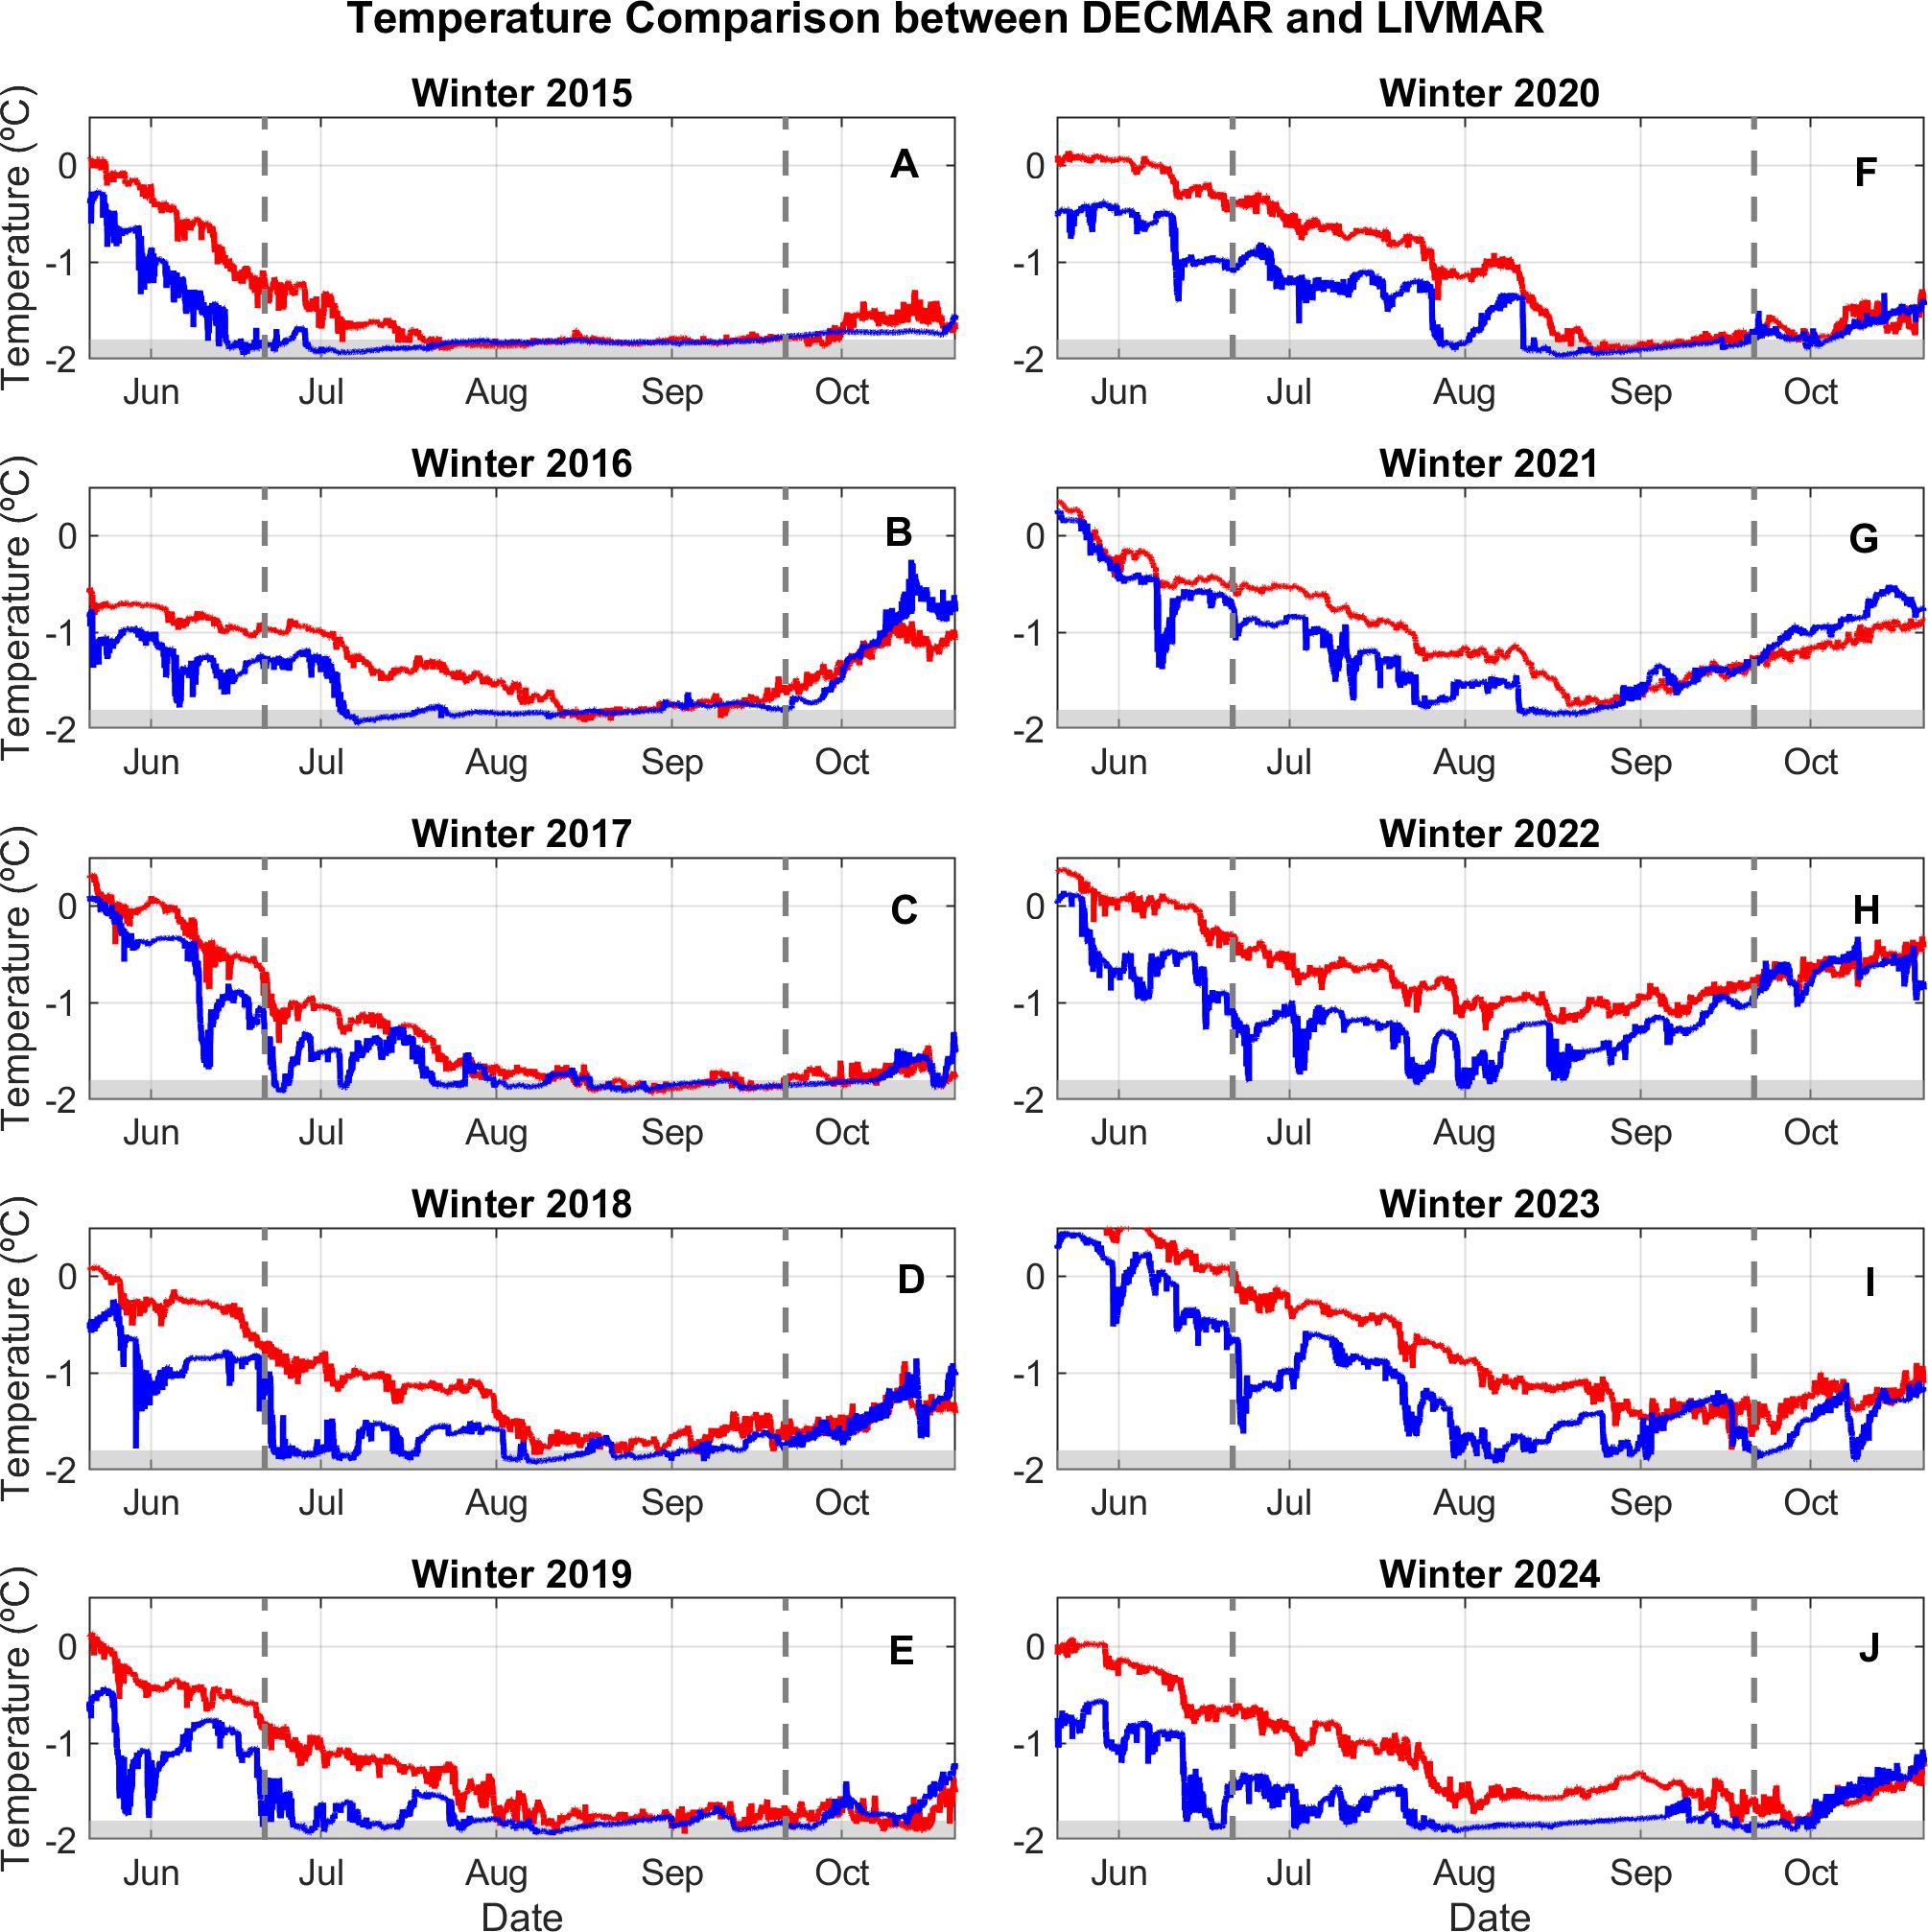
Figure 8. Graphs of austral winters from 2015 to 2024 are presented (from A-J). The red lines represent the DECMAR station, while the blue lines correspond to the LIVMAR station. The shaded grey area highlights temperatures below -1.8°C. The dashed vertical lines mark the start and end of the austral winter (June 22 and September 23, respectively). May and October are also included to show the temperature trends before and after winter.
From 2015 to 2017 (Figures 8A–C), winter temperatures were more stable and consistently lower, with the onset of cooler temperatures occurring slightly later each year. From 2018 onwards, temperatures became more variable, with greater fluctuations throughout the winter months. The winters of 2019 (Figure 8E) and 2020 (Figure 8F) exhibited somewhat more stability in parts of the season. However, in 2021 (Figure 8G) and 2022 (Figure 8H), temperatures declined only marginally, failing to reach the minimums observed in DECMAR.
The most notable difference between the two stations is that DECMAR consistently exhibits higher temperatures than LIVMAR and reaches its minimum temperatures later. These graphs also confirm that at LIVMAR low temperatures appear later and later each year, starting in early July in 2016 (Figure 8B) and in mid-August in 2022 (Figure 8H). DECMAR is more unstable due to its volcanic nature, however, LIVMAR also presents oscillations. During the winter of 2024 it seems that both islands start to recover their usual behaviour reaching temperatures below -1.8°C again at DECMAR and more continuously at LIVMAR.
If the number of records of temperatures below -1.8°C were classified into days, Figure 9 would be obtained. This figure shows a general decrease in the number of such records over the years for both stations, although this trend is not continuous. The two islands show similar patterns, with the exception of 2020, during which the number of records decreases at LIVMAR but increases at DECMAR. In 2021 and 2022, LIVMAR records its lowest values, while DECMAR does not record any temperatures below this threshold. As it was said previously, during winter of 2024 it seems to be recovering to normal.

Figure 9. Evolution over the years of the number of data in which the temperature record temperatures equal to or below -1.8°C for each station. LIVMAR station is blue and the DECMAR station is red. From 2021 to 2023 there is no data under -1.8°C at DECMAR station.
Figure 10 shows the monthly means for both islands from January 2015 to December 2024. Monthly averages have been made for each station to see the behaviour over the years, a minimum of 90% of the total data was required for a 20-minute sampling frequency to compute the monthly average.
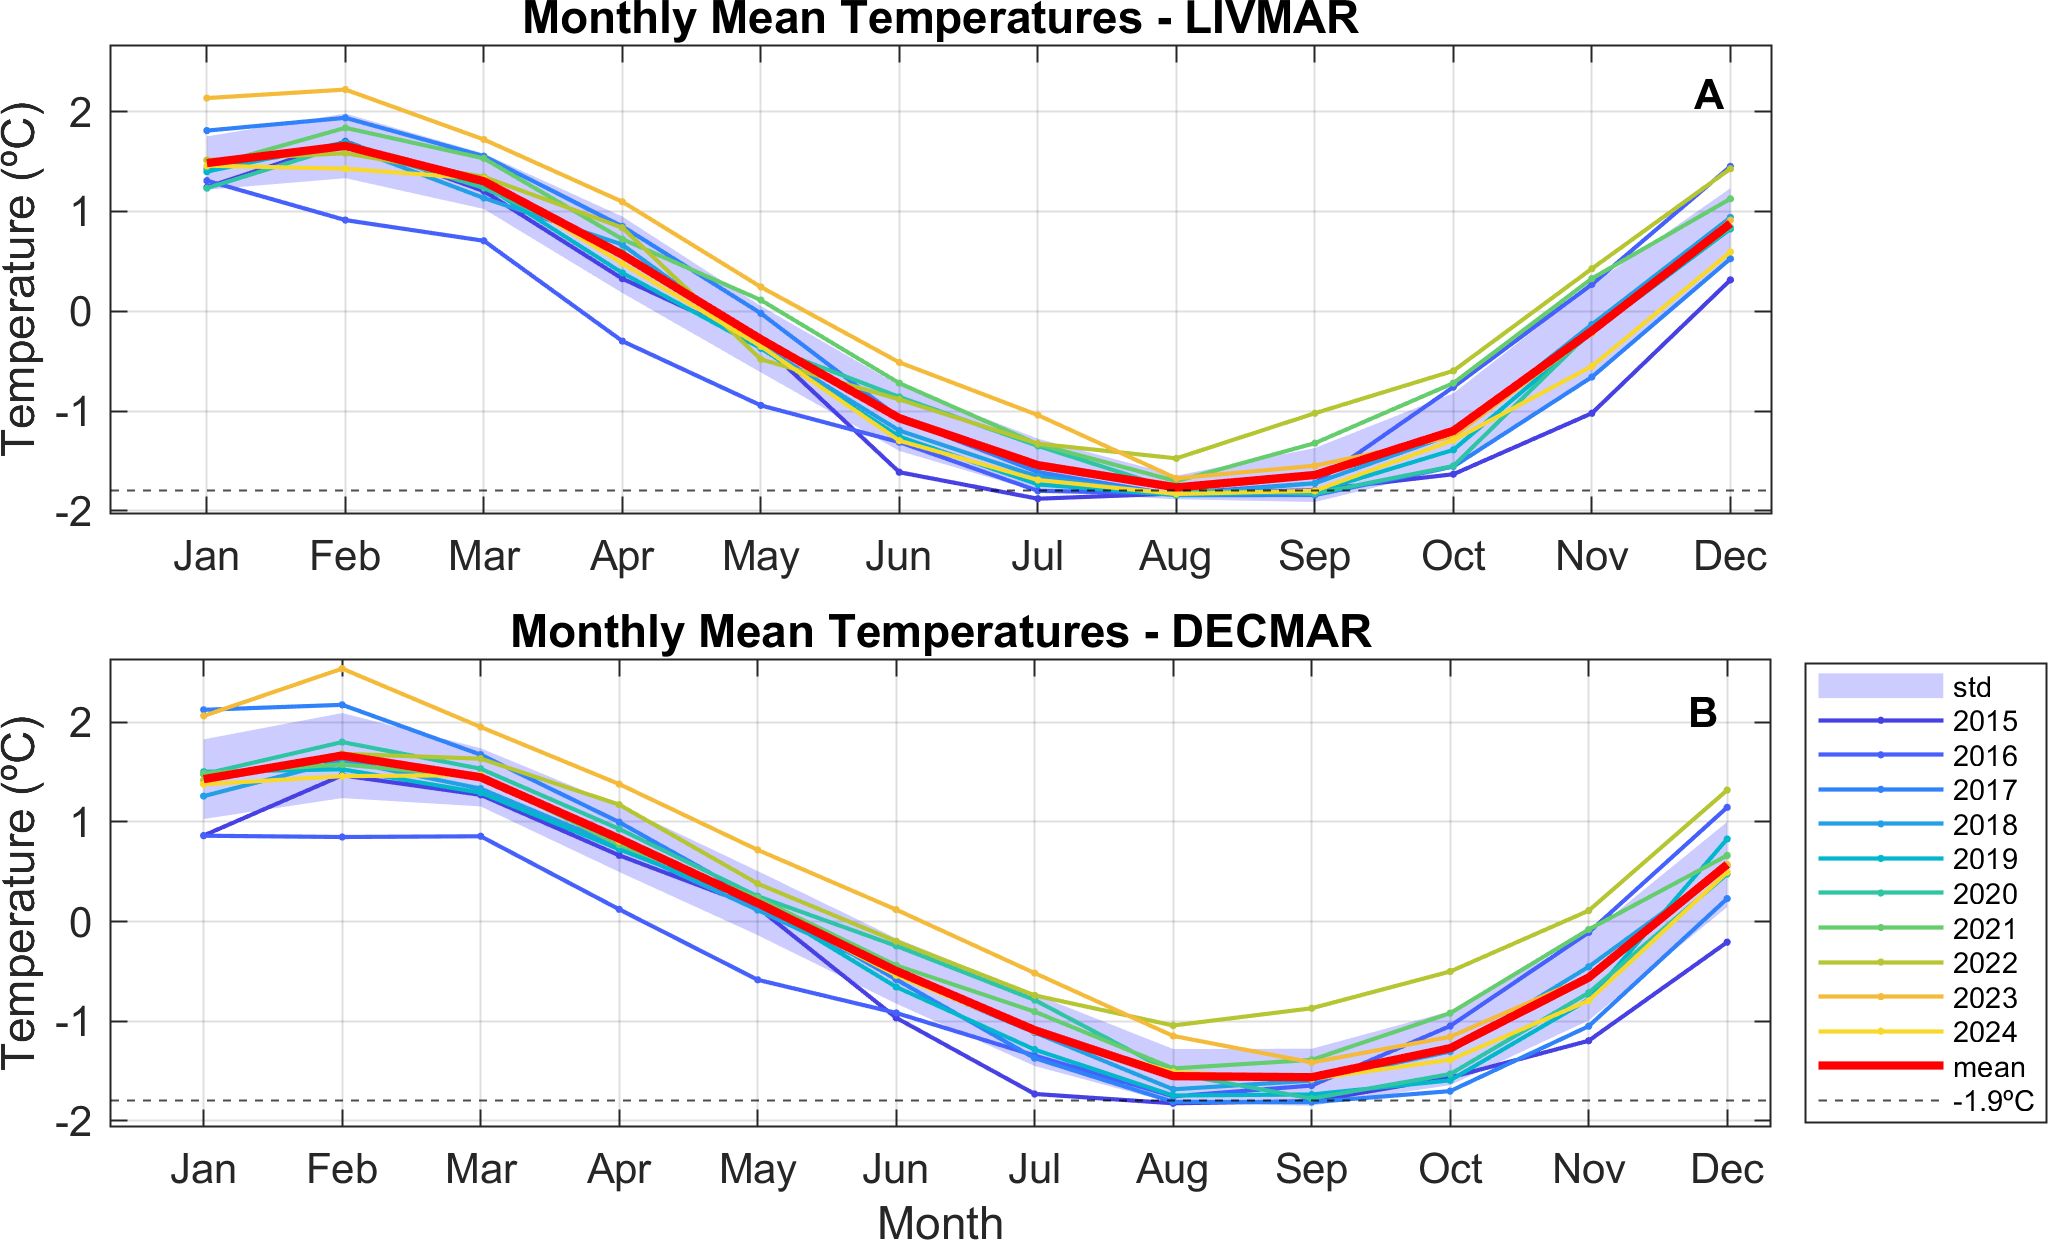
Figure 10. (A) Monthly averages of water temperatures from January 2015 to December 2024 at LIVMAR station. The blue shaded area corresponds to the standard deviation. (B) Monthly averages of water temperatures from January 2015 to December 2024 at DECMAR station. The black dashed line indicates a temperature of -1.8°C, the freezing point. The blue shaded area corresponds to the standard deviation and red line to the mean of all years.
In both graphs (LIVMAR and DECMAR, Figures 10A, B), the red line represents the monthly mean, and a trend of increasing winter temperatures has been observed in recent years. During summer, maximum temperatures in DECMAR are consistently higher than in LIVMAR, reaffirming the influence of volcanic activity on Deception Island.
In the early years of the record (2015–2017), winter temperatures reached lower values; however, in more recent years, there has been a decline in the occurrence of extremely cold temperatures. In DECMAR, winter temperatures barely reach the -1.9°C threshold in recent years, indicating a reduction in the duration of periods with temperatures near seawater freezing levels.
In LIVMAR, the standard deviation narrows in winter, particularly in August, suggesting lower variability and greater thermal stability. In contrast, DECMAR exhibits a wider and relatively consistent standard deviation throughout the year, except between March and May, when it decreases. This indicates that temperatures in DECMAR are more variable, likely due to the influence of volcanic and oceanographic processes. Notably, the months exhibiting the most pronounced temperature differences are from October to December in LIVMAR, and from July to December in DECMAR.
Moreover, DECMAR has shown a more pronounced increase in summer temperatures in recent years (2021–2024). In LIVMAR, variations are more stable, with a lower amplitude of fluctuation, reinforcing the idea that DECMAR’s thermal dynamics are more strongly influenced by geothermal factors.
Subsequently, the monthly averages for both stations are presented together (Figure 11). As observed with the 20-minute interval temperature data, the behaviour of temperatures at both stations in the monthly means is remarkably similar, likely reflecting regional climatic patterns. At the LIVMAR station, temperatures decrease earlier than at DECMAR as the winter season sets in, and also reach lower values. These differences fluctuate over the years, with the most significant disparity occurring in 2022. For minimum temperatures, the graph clearly shows that winters are getting shorter and temperatures are gradually increasing in the winters of 2021, 2022 and 2023, with a recovery in 2024. Maximum temperatures tend to occur at the DECMAR station, but these too exhibit variability, which may be influenced by local factors, particularly the volcanic characteristics of Deception Island. Furthermore, it is again that temperatures are rising in both stations.
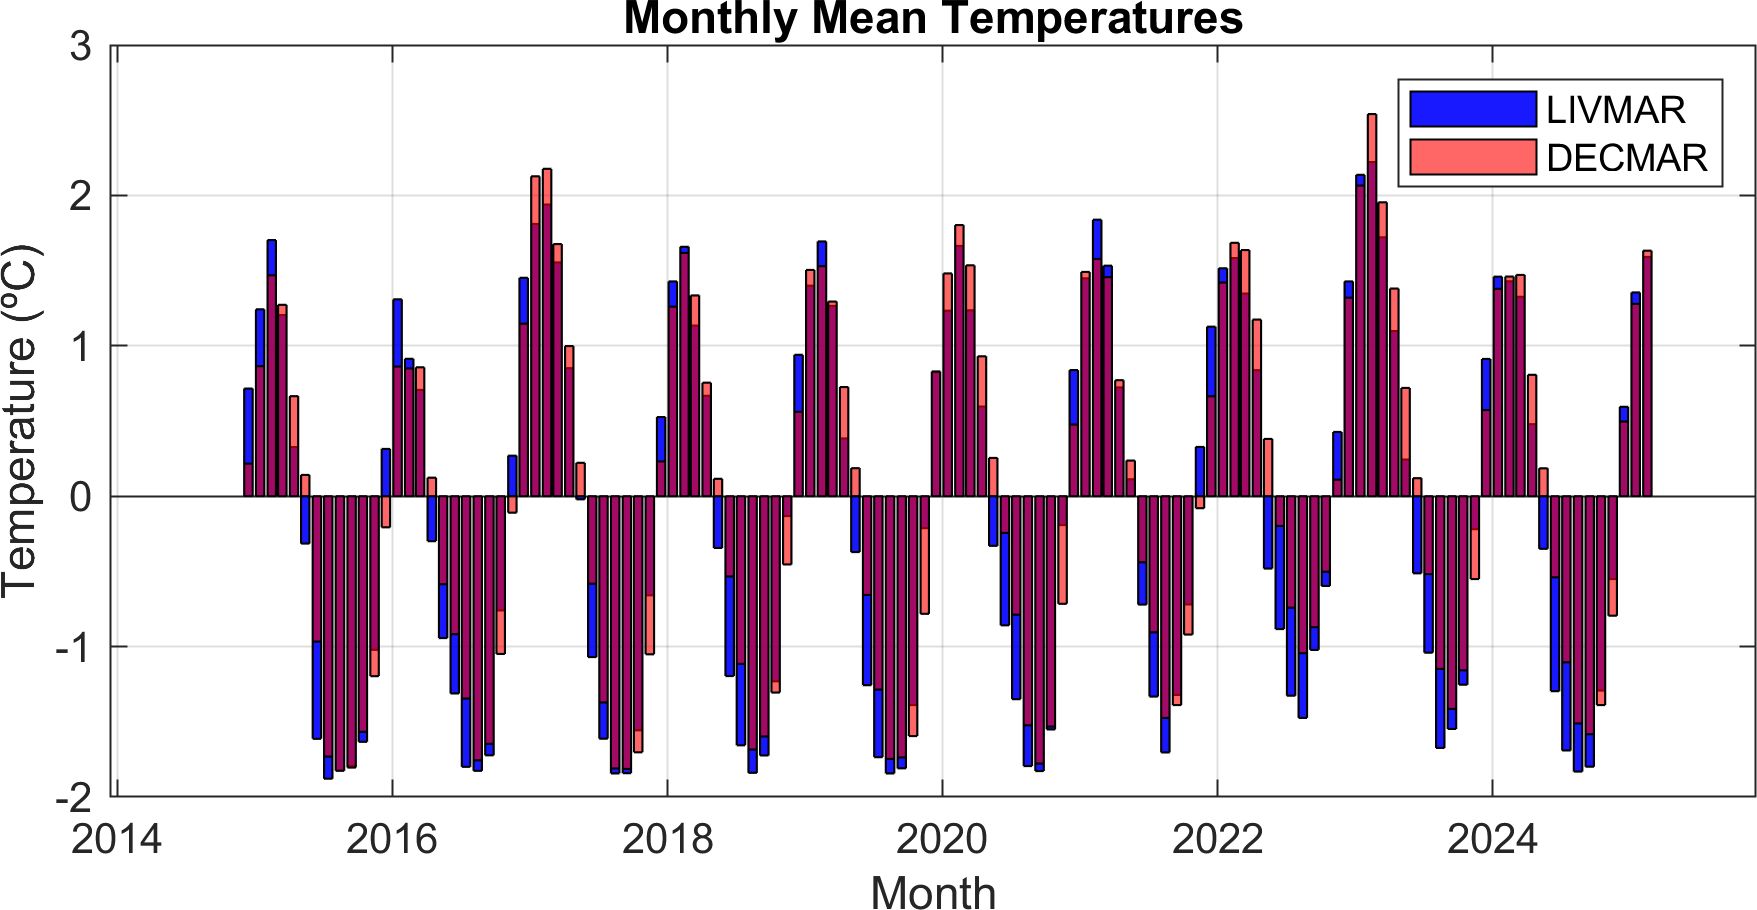
Figure 11. Monthly mean temperatures superimposed of LIVMAR (blue) and DECMAR (red) stations.
After the winter period, temperatures begin to rise earlier at LIVMAR. Although DECMAR recorded the highest values in the previous analysis of the 20-minute interval temperatures, when assessing the monthly averages, the temperatures between the two island stations become more comparable. While DECMAR consistently reaches the highest maxima, over the years, the station with the highest monthly average during spring and summer shifts between the two islands.
4.2 Statistical description of the series
The STL decomposition has been applied to the temperature time series of the DECMAR and LIVMAR stations (Figure 12). The results, displayed from top to bottom, include: the raw temperature series (Figure 12A), the trend (Figure 12B), the seasonality (Figure 12C), and the residuals (Figure 12D).
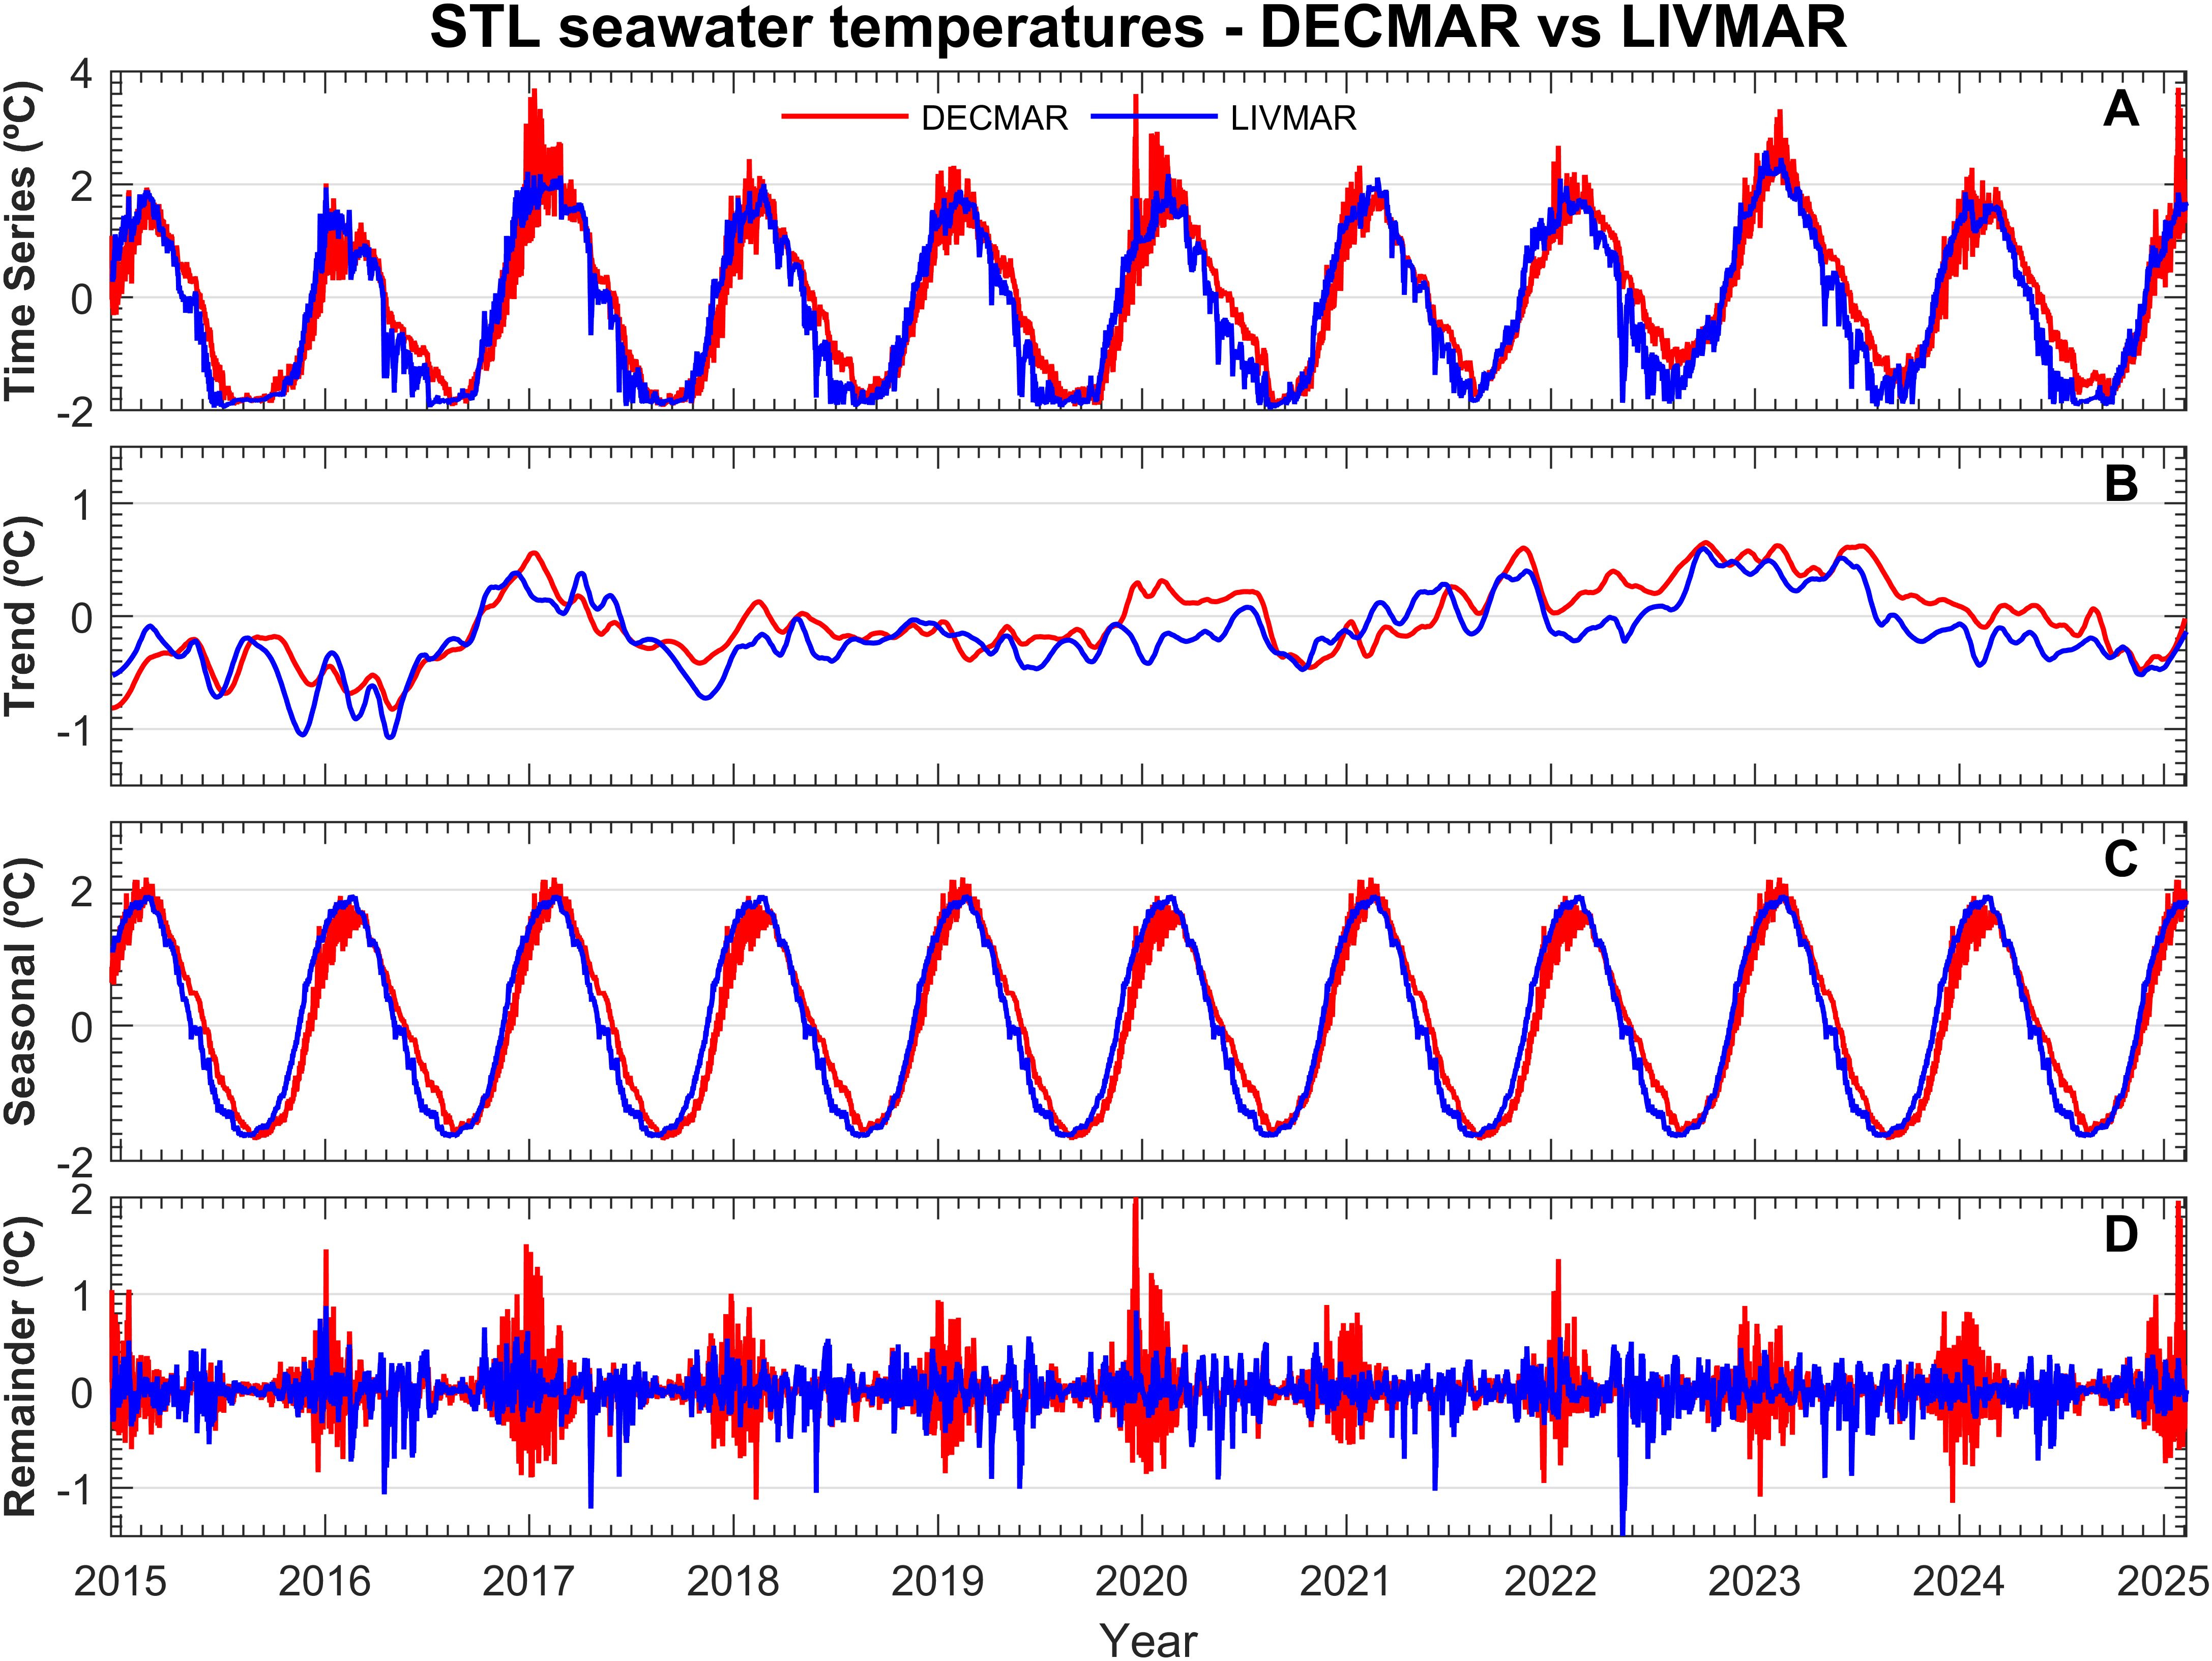
Figure 12. STL decomposition to DECMAR (red) and LIVMAR (blue) stations. (A) Raw series of seawater temperatures. (B) Trend of the series. (C) Seasonal component of the records. (D) Remainder of the series.
As illustrated in Figure 12B, the trends of both series exhibit similar behaviours, with notable exceptions in the maximum peaks of DECMAR during the summers of 2017 and 2020, and abrupt changes in the minimum temperatures of LIVMAR during the winter of 2022. Additionally, throughout 2022, a noticeable rise in the DECMAR trend is observed in comparison to that of LIVMAR. Additionally, temperature variations in DECMAR and LIVMAR were analysed in specific time intervals to evaluate the impact of the geodynamic of the Bransfield rift over the seawater series (see Table 1). Three distinct phases can be observed: the first (2015-2017) is characterised by strong fluctuations, with a trend increase followed by a decrease between 2016 and 2017. The second phase (2018-2022) shows a constant upward trend, reaching its peak between 2021 and 2022. Finally, the third phase (2023-2025) exhibits a downward trend, eventually stabilising at levels similar to those of 2018.

Table 1. Slope (°C/year) and total temperature change (°C) for each period.
Through the application of the STL, it is once again evident that the seasonality of both islands is pronounced, with slight variations between them (Figure 12C). The seasonality recorded at DECMAR shows a specific pattern during the months of December and January with large temperature oscillations during which the maximum annual temperatures are reached. However, in LIVMAR, despite reaching its maximums also in this period, it does not show oscillations of such magnitude.
The remainder of both series (Figure 12D) reveal significant differences. On one hand, LIVMAR has a constant noise throughout the series with some small exceptions during the summers. On the other hand, DECMAR has a similar behaviour to LIVMAR during the winters, while in the summers there is more noise as a consequence of the large oscillations described in Figure 12C.
In terms of similarity, the DECMAR and LIVMAR series exhibited an RMSE of 0.4°C and an r-value of 0.95, indicating a strong correlation. Similarly, the GdC and JCI meteorological series yielded an RMSE of 1.69°C and an r-value of 0.88, also demonstrating a high degree of similarity.
To assess long-term trends, linear regressions were applied to determine the temperature increase across different seasons over the 10-year period. The results indicate a rise of 0.42°C in DECMAR, 0.28°C in LIVMAR, 1.18°C in JCI, and 0.77°C in GdC.
5 Discussion
The data collected from 2011 to 2025 at the LIVMAR (Livingston Island) and DECMAR (Deception Island) stations provide a detailed insight into the variations in water temperatures across both islands. The observed differences between the stations highlight the impact of local factors, such as volcanic activity on Deception Island, and its influence on regional behaviour. During 2012, Deception Island exhibited notable thermal anomalies attributable to the advection of water heated by submarine magma, consistent with increased volcanic activity (Berrocoso et al., 2018). This phenomenon demonstrates how local geophysical processes can significantly affect the surrounding seawater temperatures.
Analysis of the 2014–2025 period reveals a pronounced seasonality, with temperature peaks during the austral summer and troughs in the winter, aligned with findings from other studies (Clarke et al., 2008; Lenn et al., 2003; Meredith et al., 2008). Maximum temperatures were consistently recorded in the austral summers, with DECMAR exhibiting higher peaks (up to 3.69°C) compared to LIVMAR (2.59°C), this disparity can be linked to the volcanic activity on Deception Island, which adds heat to the surrounding seawater (Berrocoso et al., 2018; Moreno-Vacas and Almendros, 2021). In addition, in 2016 a sudden increase in temperature is observed in both stations (Figure 7C) due to the strong tectonic activity located between Livingston and Deception Islands (Almendros et al., 2018; Moreno-Vacas and Almendros, 2021), reaches its peak at the beginning of 2017 and decreases throughout that same year. Also, during the austral summer 2019/2020 (Figure 7F), an increase in Deception Island water temperatures is seen, and also a small rise in Livingston Island, this could be related to regional changes due to volcanic activity recorded at the Orca submarine volcano in August 2020 (Almendros et al., 2020; Cesca et al., 2022; Rosado et al., 2023).
As it is mentioned in the Introduction section, this region is characterised by a complex ocean circulation (see Figures 13A, B; Sangrà et al., 2011, 2017; Veny et al., 2022). Authors such as Johnson, (1998), Juteau (2005) and Kolbusz et al. (2024) mention that in oceanic ridges and subduction zones, due to geothermal heating, seawater can warm up, allowing it to rise and be replaced by cooler, denser water. Furthermore, Rodrigo et al. (2018) show that there is a hydrothermal anomaly in the vicinity of the Orca volcano of ~0.08°C, confirming a flow of hydrothermal activity from the crater floor of the seamount. Furthermore, they suggest that there is a hydrothermal influence outside the volcano, perhaps related to subsidiary structures of the Orca seamount, or due to the dispersion of hydrothermal plumes from other volcanic structures of the Bransfield Fault and/or active volcanoes in the region (e.g. Deception Island). This could explain why the water temperature of the BC is warmer than the other surrounding water masses.
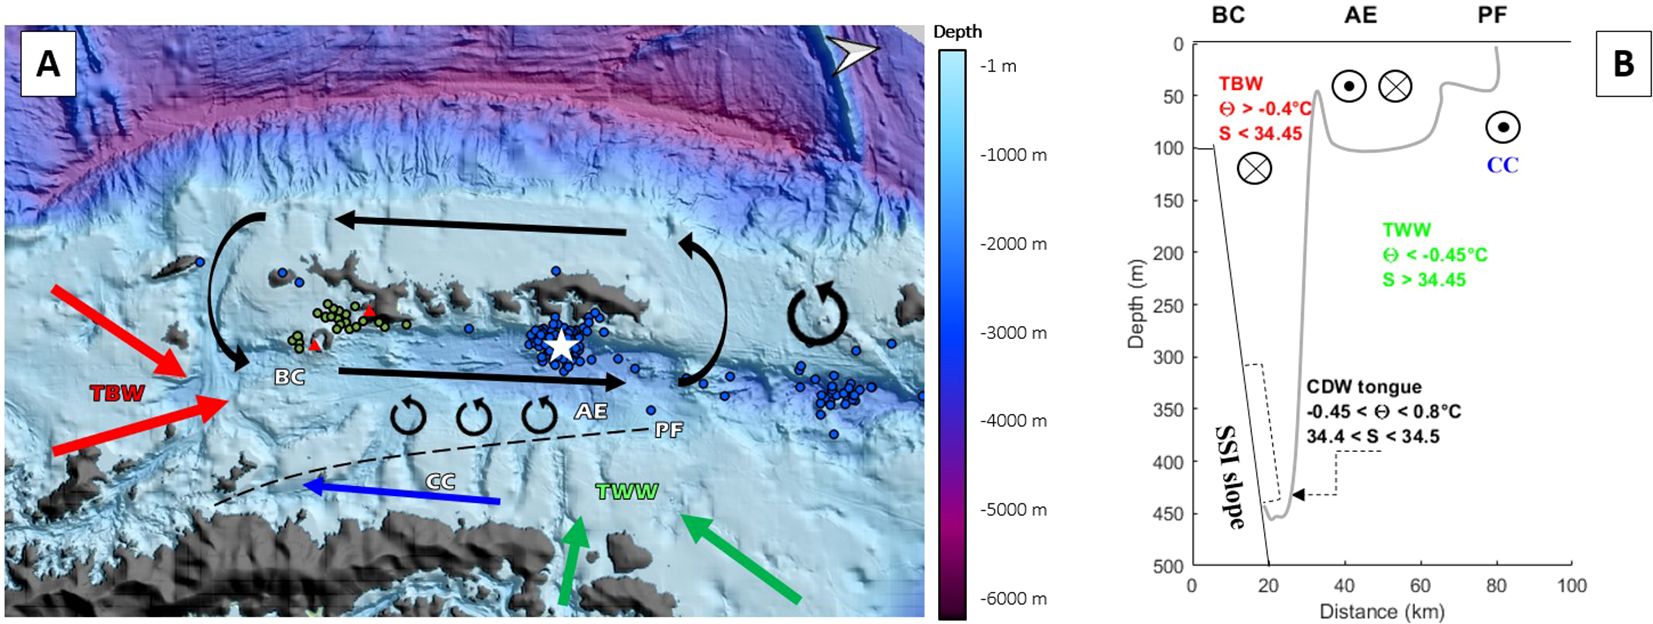
Figure 13. (A) Bathymetric map of the Bransfield Strait and circulation pattern as described in Sangrà et al., 2011, 2017 and Veny et al., 2022. The bathymetry used is from the International Bathymetric Chart of the Southern Ocean (IBSCO). Green dots are locations of the seismic swarm of 2015 (adapted from Almendros et al., 2018). The white star is the location of Orca volcano and the blue dots are the locations of the earthquakes higher than 4 Mw from USGS catalogue during this period of geodynamic activity. Red triangles are the locations of the oceanographic stations DECMAR and LIVMAR. (B) Sketch profile of the main components of the currents in the Bransfield Strait adapted from Sangrà et al., 2011 and Veny et al., 2022. The acronyms are: TBW (Transitional Bellingshausen Water, red), BC (Bransfield Current), CC (Antarctic Coastal Current), AE (Anticyclonic Eddy), PF (Polar Front), TWW (Transitional Weddel Water, green), SSI (South Shetland Islands) and CDW tongue (Circumpolar Deep Water).
Considering the circulation around the SSI and the above-mentioned literature on rift and subduction zone waters, it is suggested that the BC has warmer water as the water, as it passes through the entire fracture zone and submarine volcanoes, increases its temperature, and even more so at a time of volcano-tectonic activity. Moreover, focusing on this seismic/geodetic event of the Orca volcano and its impact on the Bransfield region would confirm the rise in sea water temperatures during the winters at the DECMAR and LIVMAR stations between 2021 and 2022, until the volcano-tectonic system decreases its activity. Figure 6 shows that LIVMAR recovers in 2023, but DECMAR does not return to near-freezing temperatures until 2024.
Returning to the description of the waters surrounding the islands, also, the reason for the higher noise in the remainder DECMAR signal during the summer could be due to the increased flow of water through the plumbing system of the volcano, which causes an increase in volcanic activity due to differences in the temperature of the ground and water (Caselli et al., 2007; Jiménez Morales et al., 2017). Furthermore, authors such as Anderson et al. (2021) find that the residue is related to weather variations.
During the austral winters, minimum temperatures show significant differences between the two stations. At LIVMAR, temperatures drop earlier and fluctuate more, whereas at DECMAR, periods below -1.8°C are shorter but more continuous. In areas close to glaciers, the input of meltwater can contribute to a lower salinity in surface waters (Ribeiro et al., 2021; Purich and England (2023)). This lower salinity may lead to increased stratification of the water column, which in turn may reduce mixing with warmer water in deeper layers (Ribeiro et al., 2021; Purich et al., 2018). As a result, surface temperatures in the immediate vicinity of glaciers may reach lower values (Truffer and Motyka, 2016).
The mean value of the distribution of monthly means suggests that although there is not so much difference in January and February maximum temperatures between the stations, temperatures fall earlier at LIVMAR and reach their minimums in August (being lower than at DECMAR). While at DECMAR, the minimums are reached between August and September, and temperatures rise later.
Although the general behaviour is a slight rise in water temperatures, 3 phases of trend behaviour have been identified over the ten years. The first rising phase (2015-2017) is related to the volcano-tectonic activity recorded at Bransfield (Almendros et al., 2018; Moreno-Vacas and Almendros, 2021; see Figure 13A). The second rise occurred from 2018 to 2023, coinciding with the volcanic activity at Bransfield due to the Orca volcano process (Figure 13A). And finally, the third phase, lowering, which shows the cessation of the eruption of the Orca seamount volcano. Also, air temperatures have increased over these ten years of study. These results are consistent with those of Turner et al. (2021), whose study in the western Antarctic Peninsula shows an increase in air temperatures as the number of days with maximum temperatures increases and the number of days with minimum temperatures decreases. Furthermore, they state that there is a clear relationship between low air temperatures and the presence of sea ice. Meredith and King (2005) also state that the evolution of climate is clearly related to trends in temperature and salinity of Antarctic waters. After analysing the trend of the seawater series, it has been found that the Orca volcanic activity in August 2020 has a strong influence on the total trend of these ten years of study for both stations and that during the last two years the system recovers values from 2018/2019.
The differences in air temperature trends between stations could be attributed to missing data in the series, as GdC lacks records for two warming periods and one cooling period, while JCI is missing data for one cooling period. Additionally, these discrepancies may be influenced by factors identified by Recondo et al. (2022) and Turner et al. (2021) in their study of multiple Antarctic stations in recent years, potentially linked to variables such as station altitude. Recondo et al. (2022) and Oliva et al. (2017) report that atmospheric temperatures in the South Shetland Islands region oscillated between warming and cooling phases during the period from 2006 to 2015. These findings align with the observed pattern in Figure 12B, where seawater temperatures show three phases with alternating upward and downward trends, although the overall picture is one of rising temperatures.
6 Conclusions
The DECMAR and LIVMAR station time series show marked seasonality in water temperature, with peaks in summer and lows in winter. The two stations differ in that DECMAR experiences higher maxima due to thermal anomalies typical of an active volcano, and its minimum temperatures are less stable. In contrast, LIVMAR has lower maximum temperatures, as well as lower and more stable winter temperatures, with its records being influenced by the Johnson Glacier.
Air and seawater temperatures are correlated over the 10 years of the study, both series have a marked seasonality and show a slight increase over the years. However, water temperature is influenced by tectonic and/or volcanic geodynamic activity due to the subduction process of the Phoenix microplate and the spreading rift of the Bransfield Basin. This geodynamic activity causes a rise in the temperature of the surrounding waters, which, carried by the Bransfield Current (BC) flowing around the South Shetland Islands (SSI), reaches the DECMAR and LIVMAR stations.
In addition, the 2015 and 2020 volcanic events in the Bransfield Strait have been identified in the seawater temperature series as always having a higher impact on Deception Island than on Livingston Island. Two different geodynamic processes have been recorded between 2015 and 2025: between 2015/2017 there was a volcano/tectonic swarm between Livingston and Deception Islands; and a second geodynamic process in 2020/2024 around the area of the Orca seamount in the vicinity of King George Island.
In summary, the analysis of water temperature behaviour highlights both regional climatic influences and the key role of local factors, such as volcano-tectonic activity and freshwater inputs, in shaping thermal patterns. While similarities between the two stations suggest general climatic factors, differences in magnitude, oscillation, and seasonal dynamics underscore the complexity introduced by localised processes. The observed reduction in freezing temperature records, alongside trend changes in maximum and minimum temperatures, reflect the environmental changes occurring in the region. These results highlight the need for continued monitoring to better understand the interaction between climate change and geological activity in polar systems. Ultimately, this work contributes to a broader understanding of polar thermal dynamics, with implications for both climate and geophysical research.
Data availability statement
The datasets presented in this study can be found in online repositories. The names of the repository/repositories and accession number(s) can be found below: http://cndp.utm.csic.es/geonetwork/srv/eng/catalog.search#/metadata/CNDP_GDC_20160101_GEO2OCEAN_ST.
Author contributions
OL-S: Conceptualization, Data curation, Formal analysis, Investigation, Methodology, Software, Validation, Visualization, Writing – original draft. BR: Conceptualization, Data curation, Formal analysis, Supervision, Writing – review & editing. VJ-M: Conceptualization, Investigation, Supervision, Visualization, Writing – review & editing. AG: Conceptualization, Data curation, Resources, Writing – review & editing. JG-E: Conceptualization, Funding acquisition, Supervision, Writing - review & editing. MiB: Data curation, Investigation, Methodology, Writing - review & editing. MaB: Conceptualization, Funding acquisition, Project administration, Resources, Supervision, Writing – review & editing, Investigation.
Funding
The author(s) declare that financial support was received for the research and/or publication of this article. This research was supported by two projects: “Monitoring and surveillance of active geodynamic processes using GNSS geodetic deformation in different scenarios (Antarctica, Gulf of Cadiz and Latin America) (2017-2022) (ref.: ctm2017-84210-r) by the Spanish Ministry of Economy, Industry and Competitiveness”; and “Maintenance of geodetic, geothermal and oceanographic time series during the 2016-2017, 2017-2018, 2018-2019, 2019-2020, 2020-2021 and 2021-2022 campaigns (Deception and Livingston Islands, Antarctica) by the Spanish Polar Committee (Spanish Ministry of Science and Innovation). This article is part of a thesis supported by the Ph.D. Program: “Earth and Marine Science” of the University of Cádiz (Spain) and University of Ferrara (Italy). The open access fee was co-funded by the QUALIFICA Project (QUAL21-0019, Junta de Andalucía) and the Internal Research Program of the University of Cadiz (PLAN PROPIO-UCA 2025–2027).
Acknowledgments
The authors would like to thank the reviewers for their suggestions to improve the article. In addition, they thank the Agencia Estatal de Meteorología for providing the atmospheric temperature data. And also, thanks to the staff of the Spanish Antarctic Research Stations for their support during the fieldwork. Special thanks to Joan Riba and Conxita Avila for their support in recovering the tide gauges in order to complete the series.
Conflict of interest
The authors declare that the research was conducted in the absence of any commercial or financial relationships that could be construed as a potential conflict of interest.
Generative AI statement
The author(s) declare that no Generative AI was used in the creation of this manuscript.
Publisher’s note
All claims expressed in this article are solely those of the authors and do not necessarily represent those of their affiliated organizations, or those of the publisher, the editors and the reviewers. Any product that may be evaluated in this article, or claim that may be made by its manufacturer, is not guaranteed or endorsed by the publisher.
References
Almendros J., Carmona E., Jiménez V., Díaz-Moreno A., and Lorenzo F. (2018). Volcano-tectonic activity at deception island volcano following a seismic swarm in the bransfield rift, (2014–2015). Geophys. Res. Lett. 45, 4788–4798. doi: 10.1029/2018GL077490
Almendros J., Wilcock W., Soule D., Teixidó T., Vizcaíno L., Ardanaz O., et al. (2020). BRAVOSEIS: Geophysical investigation of rifting and volcanism in the Bransfield strait, Antarctica. J. South Am. Earth Sci. 104, 102834. doi: 10.1016/j.jsames.2020.102834
Anderson E. J., Stow C. A., Gronewold A. D., Mason L. A., McCormick M. J., Qian S. S., et al. (2021). Seasonal overturn and stratification changes drive deep-water warming in one of Earth’s largest lakes. Nat. Commun. 12, 1688. doi: 10.1038/s41467-021-21971-1
Auger M., Morrow R., Kestenare E., Sallée J.-B., and Cowley R. (2021). Southern Ocean in-situ temperature trends over 25 years emerge from interannual variability. Nat. Commun. 12, 514. doi: 10.1038/s41467-020-20781-1
Baraldo A. (1999). Evolución geológica de la isla Decepción, islas Shetland del Sur, Antártida. Available online at: https://hdl.handle.net/20.500.12110/tesis_n3174_Baraldo (Accessed March 15, 2024).
Barker P. F. (1982). The Cenozoic subduction history of the Pacific margin of the Antarctic Peninsula: ridge crest–trench interactions. J. Geol. Soc 139, 787–801. doi: 10.1144/gsjgs.139.6.0787
Barker D. H. N. and Austin J. A. (1998). Rift propagation, detachment faulting, and associated magmatism in Bransfield Strait, Antarctic Peninsula. J. Geophys. Res. Solid Earth 103, 24017–24043. doi: 10.1029/98JB01117
Barnes D. K. A. and Conlan K. E. (2007). Disturbance, colonization and development of Antarctic benthic communities. Philos. Trans. R. Soc B Biol. Sci. 362, 11–38. doi: 10.1098/rstb.2006.1951
Barnes D. K. A., Fuentes V., Clarke A., Schloss I. R., and Wallace M. I. (2006). Spatial and temporal variation in shallow seawater temperatures around Antarctica. Deep Sea Res. Part II Top. Stud. Oceanogr. 53, 853–865. doi: 10.1016/j.dsr2.2006.03.008
Berrocoso M., Prates G., Fernández-Ros A., Peci L. M., De Gil A., Rosado B., et al. (2018). Caldera unrest detected with seawater temperature anomalies at Deception Island, Antarctic Peninsula. Bull. Volcanol. 80, 41. doi: 10.1007/s00445-018-1216-2
Bohoyo F., Galindo-Zaldívar J., Maldonado A., Schreider A. A., and Suriñach E. (2002). Basin development subsequent to ridge-trench collision: the Jane Basin, Antarctica. Mar. Geophys. Res. 23, 413–421. doi: 10.1023/B:MARI.0000018194.18098.0d
Calleja J. F., Corbea-Pérez A., Fernández S., Recondo C., Peón J., and De Pablo M.Á. (2019). Snow albedo seasonality and trend from MODIS sensor and ground data at johnsons glacier, livingston island, maritime Antarctica. Sensors 19, 3569. doi: 10.3390/s19163569
Cárdenas C. A., González-Aravena M., and Santibañez P. A. (2018). The importance of local settings: within-year variability in seawater temperature at South Bay, Western Antarctic Peninsula. PeerJ 6, e4289. doi: 10.7717/peerj.4289
Carrasco J. F., Bozkurt D., and Cordero R. R. (2021). A review of the observed air temperature in the Antarctic Peninsula. Did the warming trend come back after the early 21st hiatus? Polar Sci. 28, 100653. doi: 10.1016/j.polar.2021.100653
Caselli A. T., Badi G., Bonatto A. L., Bengoa C. L., Agusto M. R., Bidone A., et al. (2007). Seismic activity and an anomalous fumarolic chemical composition due to seal effect in the volcanic system of Deception Island (Antarctica). Rev. Asoc. Geol. Argent. 62, 545–552. Available at: https://bibliotecadigital.exactas.uba.ar/collection/paper/document/paper_00044822_v62_n4_p545_Caselli (Accessed January 23, 2024).
Cesca S., Sugan M., Rudzinski Ł., Vajedian S., Niemz P., Plank S., et al. (2022). Massive earthquake swarm driven by magmatic intrusion at the Bransfield Strait, Antarctica. Commun. Earth Environ. 3, 1–11. doi: 10.1038/s43247-022-00418-5
Clarke A., Meredith M. P., Wallace M. I., Brandon M. A., and Thomas D. N. (2008). Seasonal and interannual variability in temperature, chlorophyll and macronutrients in northern Marguerite Bay, Antarctica. Deep Sea Res. Part II Top. Stud. Oceanogr. 55, 1988–2006. doi: 10.1016/j.dsr2.2008.04.035
Cleveland R. B., Cleveland W. S., McRae J. E., and Terpenning I. J. (1990). STL: A seasonal-trend decomposition procedure based on loess. J. Off. Stat. 6, 3–33.
Cook A. J., Holland P. R., Meredith M. P., Murray T., Luckman A., and Vaughan D. G. (2016). Ocean forcing of glacier retreat in the western Antarctic Peninsula. Science 353, 283–286. doi: 10.1126/science.aae0017
Dählmann A., Wallmann K., Sahling H., Sarthou G., Bohrmann G., Petersen S., et al. (2001). Hot vents in an ice-cold ocean: Indications for phase separation at the southernmost area of hydrothermal activity, Bransfield Strait, Antarctica. Earth Planet. Sci. Lett. 193, 381–394. doi: 10.1016/S0012-821X(01)00535-0
Damini B. Y., Kerr R., Dotto T. S., and Mata M. M. (2022). Long-term changes on the Bransfield Strait deep water masses: Variability, drivers and connections with the northwestern Weddell Sea. Deep Sea Res. Part Oceanogr. Res. Pap. 179, 103667. doi: 10.1016/j.dsr.2021.103667
Elderfield H. (1972). Effects of volcanism on water chemistry, Deception Island, Antarctica. Marine Geology 13, M1–M6. doi: 10.1016/0025-3227(72)90066-7
Flexas M. M., Arias M. R., and Ojeda M. A. (2017). Hydrography and dynamics of port foster, deception island, Antarctica. Antarct. Sci. 29, 83–93. doi: 10.1017/S0954102016000444
Foldvik A. and Kvinge T. (1974). Conditional instability of sea water at the freezing point. Deep Sea Res. Oceanogr. Abstr. 21, 169–174. doi: 10.1016/0011-7471(74)90056-4
Frölicher T. L., Sarmiento J. L., Paynter D. J., Dunne J. P., Krasting J. P., and Winton M. (2015). Dominance of the southern ocean in anthropogenic carbon and heat uptake in CMIP5 models. J. Clim. 28, 862–886. doi: 10.1175/JCLI-D-14-00117.1
García M. A., López O., Sospedra J., Espino M., Gràcia V., Morrison G., et al. (1994). Mesoscale variability in the Bransfield Strait region (Antarctica) during Austral summer. Ann. Geophys. 12, 856–867. doi: 10.1007/s00585-994-0856-z
González-Casado J. M., Giner Robles J. L., and López-Martínez J. (2000). Bransfield Basin, Antarctic Peninsula: Not a normal backarc basin. Geology 28, 1043. doi: 10.1130/0091-7613(2000)28<1043:BBAPNA>2.0.CO;2
Grad M., Guterch A., and Środa P. (1992). Upper crustal structure of Deception Island area, Bransfield Strait, West Antarctica. Antarct. Sci. 4, 469–476. doi: 10.1017/S0954102092000683
Hafen R. (2016). stlplus: enhanced seasonal decomposition of time series by loess. 0.5.1. doi: 10.32614/CRAN.package.stlplus
Henriet J. P., Meissner R., Miller H., and The Grape Team (1992). Active margin processes along the Antarctic Peninsula. Tectonophysics 201, 229–253. doi: 10.1016/0040-1951(92)90235-X
Hofmann E. E., Klinck J. M., Lascara C. M., and Smith D. A. (1996). ““Water mass distribution and circulation west of the Antarctic Peninsula and including Bransfield Strait,”,” in Antarctic Research Series. Eds. Hofmann E. E., Ross R. M., and Quetin L. B. (American Geophysical Union, Washington, D. C). doi: 10.1029/AR070p0061
Huneke W. G. C., Huhn O., and Schröeder M. (2016). Water masses in the Bransfield Strait and adjacent seas, austral summer 2013. Polar Biol. 39, 789–798. doi: 10.1007/s00300-016-1936-8
Hunt B. M., Hoefling K., and Cheng C.-H. C. (2003). Annual warming episodes in seawater temperatures in McMurdo Sound in relationship to endogenous ice in notothenioid fish. Antarct. Sci. 15, 333–338. doi: 10.1017/S0954102003001342
Intergovernmental Panel on Climate Change (IPCC) (2022). The Ocean and Cryosphere in a Changing Climate: Special Report of the Intergovernmental Panel on Climate Change, 1st Edn. Cambridge: Cambridge University Press doi: 10.1017/9781009157964
Jacobs S. S., Helmer H. H., Doake C. S. M., Jenkins A., and Frolich R. M. (1992). Melting of ice shelves and the mass balance of Antarctica. J. Glaciol. 38, 375–387. doi: 10.3189/S0022143000002252
Jiménez Morales V., Almendros J., and Carmona E. (2017). Detection of long-duration tremors at Deception Island volcano, Antarctica. J. Volcanol. Geotherm. Res. 347, 234–249. doi: 10.1016/j.jvolgeores.2017.09.016
Jiménez-Morales V., Almendros J., and Carmona E. (2022). Long-term evolution of the seismic activity preceding the 2015 seismic crisis at deception island volcano, Antarctica, (2008-2015). Surv. Geophys. 43, 959–994. doi: 10.1007/s10712-021-09690-0
Johnson G. (1998). Deep water properties, velocities, and dynamics over ocean trenches. J. Mar. Res. 56, 344. Available at: https://elischolar.library.yale.edu/journal_of_marine_research/2273 (Accessed January 19, 2025).
Jones J. M., Gille S. T., Goosse H., Abram N. J., Canziani P. O., Charman D. J., et al. (2016). Assessing recent trends in high-latitude Southern Hemisphere surface climate. Nat. Clim. Change 6, 917–926. doi: 10.1038/nclimate3103
Joughin I. and Padman L. (2003). Melting and freezing beneath Filchner-Ronne Ice Shelf, Antarctica. Geophys. Res. Lett. 30, 2003GL016941. doi: 10.1029/2003GL016941
Juteau T. (2005). Las dorsales oceánicas: vulcanismo, hidrotermalismo y yacimientos de metales de mañana. DYNA 80, 65–69. Available at: https://revista-dyna.com/index.php/DYNA/article/view/5952 (Accessed March 15, 2025).
Klinck J. M. (1998). Heat and salt changes on the continental shelf west of the Antarctic Peninsula between January 1993 and January 1994. J. Geophys. Res. Oceans 103, 7617–7636. doi: 10.1029/98JC00369
Kolbusz J., Zika J., Pattiaratchi C., and Jamieson A. (2024). Water properties and bottom water patterns in hadal trench environments. Ocean Science 20 (1), 123–140. doi: 10.5194/os-20-123-2024
Lawver L. A., Sloan B. J., Barker D. H. N., Ghidella M., Von Herzen R. P., Keller R. A., et al. (1996). Distributed, active extension in bransfield basin, antarctic peninsula: evidence from multibeam bathymetry. Gsa Today 6, 1–6.
Lei J., Li F., Zhang S., Xiao C., Xie S., Ke H., et al. (2018). Ocean tides observed from A GPS receiver on floating sea ice near chinese zhongshan station, Antarctica. Mar. Geod. 41, 353–367. doi: 10.1080/01490419.2018.1454370
Lenn Y.-D., Chereskin T. K., and Glatts R. C. (2003). Seasonal to tidal variability in currents, stratification and acoustic backscatter in an Antarctic ecosystem at Deception Island. Deep Sea Res. Part II Top. Stud. Oceanogr. 50, 1665–1683. doi: 10.1016/S0967-0645(03)00085-7
Mahoney A. R., Gough A. J., Langhorne P. J., Robinson N. J., Stevens C. L., Williams M. M. J., et al. (2011). The seasonal appearance of ice shelf water in coastal Antarctica and its effect on sea ice growth. J. Geophys. Res. Oceans 116, 2011JC007060. doi: 10.1029/2011JC007060
Martí J., Geyer A., and Aguirre-Diaz G. (2013). Origin and evolution of the Deception Island caldera (South Shetland Islands, Antarctica). Bull. Volcanol. 75, 732. doi: 10.1007/s00445-013-0732-3
Martín R. (2021). Benthic marine algae from South Shetland Islands (Antarctica): biodiversity and evolutionary patterns [dissertation] (University of Barcelona). Available at: http://diposit.ub.edu/dspace/handle/2445/184229 (Accessed October 5, 2024).
Meredith M. P., Brandon M. A., Wallace M. I., Clarke A., Leng M. J., Renfrew I. A., et al. (2008). Variability in the freshwater balance of northern Marguerite Bay, Antarctic Peninsula: Results from δ18O. Deep Sea Res. Part II Top. Stud. Oceanogr. 55, 309–322. doi: 10.1016/j.dsr2.2007.11.005
Meredith M. P. and King J. C. (2005). Rapid climate change in the ocean west of the Antarctic Peninsula during the second half of the 20th century. Geophys. Res. Lett. 32, 2005GL024042. doi: 10.1029/2005GL024042
Moreno-Vacas A. and Almendros J. (2021). On the origin of recent seismic unrest episodes at Deception Island volcano, Antarctica. J. Volcanol. Geotherm. Res. 419, 107376. doi: 10.1016/j.jvolgeores.2021.107376
Oliva M., Navarro F., Hrbáček F., Hernández A., Nývlt D., Pereira P., et al. (2017). Recent regional climate cooling on the Antarctic Peninsula and associated impacts on the cryosphere. Sci. Total Environ. 580, 210–223. doi: 10.1016/j.scitotenv.2016.12.030
Pérez L. F., Hernández-Molina F. J., Lodolo E., Bohoyo F., Galindo-Zaldívar J., and Maldonado A. (2019). Oceanographic and climatic consequences of the tectonic evolution of the southern scotia sea basins, Antarctica. Earth-Sci. Rev. 198, 102922. doi: 10.1016/j.earscirev.2019.102922
Poli P., Cabrera L., Flores M. C., Báez J. C., Ammirati J. B., Vásquez J., et al. (2021). Volcanic Origin of a Long‐Lived Swarm in the Central Bransfield Basin, Antarctica. Geophys. Res. Lett. 49 (1). doi: 10.1029/2021gl095447
Purich A. and England M. H. (2023). Projected impacts of antarctic meltwater anomalies over the twenty-first century. J. Clim. 36, 2703–2719. doi: 10.1175/JCLI-D-22-0457.1
Purich A., England M. H., Cai W., Sullivan A., and Durack P. J. (2018). Impacts of broad-scale surface freshening of the southern ocean in a coupled climate model. J. Clim. 31, 2613–2632. doi: 10.1175/JCLI-D-17-0092.1
Pytharouli S., Chaikalis S., and Stiros S. C. (2018). Uncertainty and bias in electronic tide-gauge records: Evidence from collocated sensors. Measurement 125, 496–508. doi: 10.1016/j.measurement.2018.05.012
Ramírez M. E. (2007). “Modelización de la deformación superficial en áreas volcánicas mediante la teoría de wavelets,” in Aplicación al volcán decepción (University of Cádiz). Available at: https://dialnet.unirioja.es/servlet/tesis?codigo=51985 (Accessed June 12, 2024).
Recondo C., Corbea-Pérez A., Peón J., Pendás E., Ramos M., Calleja J. F., et al. (2022). Empirical models for estimating air temperature using MODIS land surface temperature (and spatiotemporal variables) in the hurd peninsula of livingston island, Antarctica, between 2000 and 2016. Remote Sens. 14, 3206. doi: 10.3390/rs14133206
Ribeiro N., Herraiz-Borreguero L., Rintoul S. R., McMahon C. R., Hindell M., Harcourt R., et al. (2021). Warm modified circumpolar deep water intrusions drive ice shelf melt and inhibit dense shelf water formation in vincennes bay, east Antarctica. J. Geophys. Res. Oceans 126, e2020JC016998. doi: 10.1029/2020JC016998
Rodrigo C., Blamey J. M., Huhn O., and Provost C. (2018). Is there an active hydrothermal flux from the Orca seamount in the Bransfield Strait, Antarctica? Andean Geol. 45, 344. doi: 10.5027/andgeoV45n3-3086
Rosado B., Fernández-Ros A., Berrocoso M., Prates G., Gárate J., De Gil A., et al. (2019). Volcano-tectonic dynamics of Deception Island (Antarctica): 27 years of GPS observation, (1991–2018). J. Volcanol. Geotherm. Res. 381, 57–82. doi: 10.1016/j.jvolgeores.2019.05.009
Rosado B., Pérez-Peña A., Barba P., Ramírez-Zelaya J., Carmona E., Martín R., et al. (2023). Analysis of GNSS time series recorded on south shetland island and antarctic peninsula during the geodynamic activity in 2020 of the orca underwater volcano (Brandfield sea rift, Antarctica). Eng. Proc. 39, 25. doi: 10.3390/engproc2023039025
Sanchez-Vazquez M. J., Nielen M., Gunn G. J., and Lewis F. I. (2012). Using seasonal-trend decomposition based on loess (STL) to explore temporal patterns of pneumonic lesions in finishing pigs slaughtered in England 2005–2011. Prev. Vet. Med. 104, 65–73. doi: 10.1016/j.prevetmed.2011.11.003
Sangrà P., Gordo C., Hernández-Arencibia M., Marrero-Díaz A., Rodríguez-Santana A., Stegner A., et al. (2011). The Bransfield current system. Deep Sea Res. Part Oceanogr. Res. Pap. 58, 390–402. doi: 10.1016/j.dsr.2011.01.011
Sangrà P., Stegner A., Hernández-Arencibia M., Marrero-Díaz Á., Salinas C., Aguiar-González B., et al. (2017). The bransfield gravity current. Deep Sea Res. Part Oceanogr. Res. Pap. 119, 1–15. doi: 10.1016/j.dsr.2016.11.003
Seliverstova A. M., Zuev O. A., Polukhin A. A., Chultsova A. L., Masevich A. V., and Mukhametianov R. Z. (2023). Hydrological and hydrochemical structure of the waters of the bransfield strait in january 2022. Oceanology 63, 510–522. doi: 10.1134/S0001437023040161
Smellie J. L. (2001). Lithostratigraphy and volcanic evolution of Deception Island, South Shetland Islands. Antarct. Sci. 13, 188–209. doi: 10.1017/S0954102001000281
Smellie J. L., Baker P. E., and Thomson J. W. (1990). “D. Graham land and south shetland islands,” in Antarctic research series. pp. 302–359. doi: 10.1029/AR048p0302
Smith R. I. L. (2005). The thermophilic bryoflora of Deception Island: unique plant communities as a criterion for designating an Antarctic Specially Protected Area. Antarct. Sci. 17, 17–27. doi: 10.1017/S0954102005002385
Smith K. L., Baldwin R. J., Glatts R. C., Chereskin T. K., Ruhl H., and Lagun V. (2003). Weather, ice, and snow conditions at Deception Island, Antarctica: long time-series photographic monitoring. Deep Sea Res. Part II Top. Stud. Oceanogr. 50, 1649–1664. doi: 10.1016/S0967-0645(03)00084-5
Steig E. J., Schneider D. P., Rutherford S. D., Mann M. E., Comiso J. C., and Shindell D. T. (2009). Warming of the Antarctic ice-sheet surface since the 1957 International Geophysical Year. Nature 457, 459–462. doi: 10.1038/nature07669
Sugiyama S., Navarro F. J., Sawagaki T., Minowa M., Segawa T., Onuma Y., et al. (2019). Subglacial water pressure and ice-speed variations at Johnsons Glacier, Livingston Island, Antarctic Peninsula. J. Glaciol. 65, 689–699. doi: 10.1017/jog.2019.45
Tokarczyk R. (1987). Classification of water masses in the Bransfield Strait and southern part of the Drake Passage using a method of statistical multidimensional analysis. Pol. Polar Res. 8, 333–366.
Truffer M. and Motyka R. J. (2016). Where glaciers meet water: Subaqueous melt and its relevance to glaciers in various settings. Rev. Geophys. 54, 220–239. doi: 10.1002/2015RG000494
Turner J., Colwell S. R., Marshall G. J., Lachlan-Cope T. A., Carleton A. M., Jones P. D., et al. (2005). Antarctic climate change during the last 50 years. Int. J. Climatol. 25, 279–294. doi: 10.1002/joc.1130
Turner J., Lu H., King J., Marshall G. J., Phillips T., Bannister D., et al. (2021). Extreme temperatures in the antarctic. J. Clim. 34, 2653–2668. doi: 10.1175/JCLI-D-20-0538.1
Turner J., Marshall G. J., Clem K., Colwell S., Phillips T., and Lu H. (2020). Antarctic temperature variability and change from station data. Int. J. Climatol. 40, 2986–3007. doi: 10.1002/joc.6378
Vaughan D. G., Marshall G. J., Connolley W. M., Parkinson C., Mulvaney R., Hodgson D. A., et al. (2003). Recent rapid regional climate warming on the Antarctic Peninsula. Clim. Change 60, 243–274. doi: 10.1023/A:1026021217991
Venables H., Meredith M. P., Hendry K. R., Ten Hoopen P., Peat H., Chapman A., et al. (2023). Sustained year-round oceanographic measurements from Rothera Research Station, Antarctica 1997–2017. Sci. Data 10, 265. doi: 10.1038/s41597-023-02172-5
Veny M., Aguiar-González B., Marrero-Díaz Á., and Rodríguez-Santana Á. (2022). Seasonal circulation and volume transport of the Bransfield Current. Prog. Oceanogr. 204, 102795. doi: 10.1016/j.pocean.2022.102795
Vidal J., Berrocoso M., and Fernández-Ros A. (2012). Study of tides and sea levels at Deception and Livingston islands, Antarctica. Antarct. Sci. 24, 193–201. doi: 10.1017/S095410201100068X
Keywords: seawater temperature, time series, seasonal variation analysis, South Shetland Islands, Antarctica, Orca seamount volcano
Citation: Luengo-S O, Rosado B, Jiménez-Morales V, de Gil A, Gómez-Enri J, Bruno M and Berrocoso M (2025) Long-term seawater temperature records at Livingston and Deception Islands, Antarctica. Front. Mar. Sci. 12:1566852. doi: 10.3389/fmars.2025.1566852
Received: 25 January 2025; Accepted: 22 April 2025;
Published: 15 May 2025.
Edited by:
Anna Olivé Abelló, Spanish National Research Council (CSIC), SpainReviewed by:
Ángeles Marrero-Díaz, University of Las Palmas de Gran Canaria, SpainAlejandro Corbea-Pérez, University of León, Spain
Copyright © 2025 Luengo-S, Rosado, Jiménez-Morales, de Gil, Gómez-Enri, Bruno and Berrocoso. This is an open-access article distributed under the terms of the Creative Commons Attribution License (CC BY). The use, distribution or reproduction in other forums is permitted, provided the original author(s) and the copyright owner(s) are credited and that the original publication in this journal is cited, in accordance with accepted academic practice. No use, distribution or reproduction is permitted which does not comply with these terms.
*Correspondence: Olga Luengo-S, b2xnYS5sdWVuZ29AdWNhLmVz