 Robert T. Leaf
 Wei Wu
 Ray M. Mroch
 Robert Trigg1
- 1School of Ocean Science and Engineering, The University of Southern Mississippi, Ocean Springs, MS, United States
- 2National Oceanic and Atmospheric Administration (NOAA), National Marine Fisheries Service, Beaufort, NC, United States
Policymakers in the northern Gulf of America have proposed various spatial closures in recent years as a management tool for the Gulf Menhaden Brevoortia patronus fishery. In this work, we aim to understand how the seasonal movement of the stock will impact the efficacy of spatial restrictions by examining the short-term impacts of simulated area closures of 1.6, 3.2, and 4.8 km adjacent to land on the commercial Gulf Menhaden fishery using commercial logbook data from 2006 to 2009 and 2011. We used bootstrap resampling (n = 1,000) of trip-level data to describe five descriptive metrics. These were the mean set-specific catch per unit effort (CPUE, metric tons, mt set-1), the mean number of sets deployed on each trip, the mean trip-specific CPUE (mt minute-1), the median distance (km) traveled to the first set, and the median distance (km) traveled among subsequent sets (for trips with at least two sets). We explored the impacts of closures by comparing the month-specific distributions of the descriptive metrics from all trips to those calculated using only those trips with all sets outside of a particular restricted area. Using the simulation, we evaluated the resulting spatial differences in fishing effort that would occur. The results of the simulation indicated that, in all restriction scenarios for all months, the spatial restrictions served to increase the travel distance to the first set and to reduce the mean number of sets taken. Set-specific and trip-specific CPUE are reduced in the restriction scenarios. We found that the reduction of total harvest (mt) for the 1.6 km restriction regime was 4.3 to 7.2%, 9.1 to 12.0% in the 3.2 km restriction regime, and 12.7 to 15.4% in the 4.8 km restriction regime. This work provides information about the impacts on the fishery that result from area closures. Such information is necessary to evaluate the efficacy and impacts of spatial closures for the Gulf Menhaden fishery.
Introduction
The Gulf Menhaden Brevoortia patronus fishery is one of the largest and longest-operating fisheries in the United States. The fishery constitutes a substantial part of the total annual commercial landings (9.44% to 14.1%) in the United States (Vaughan et al., 2007). In addition to their role as a target of the fishery, the Gulf Menhaden stock in the northern Gulf of America (GoA) provides a variety of ecosystem services including transporting nutrients within marine food webs and supporting higher tropic level species (Deegan et al., 1990; Rabalais et al., 2002; Vaughan et al., 2007). Gulf Menhaden are characterized as “forage fish” (Geers et al., 2014; Sagarese et al., 2016a) because they are a food source for a variety of fishes of recreational and commercial importance (Oshima and Leaf, 2018; Leaf and Oshima, 2019), marine mammals, and birds in the GoA. Although Gulf Menhaden range from Veracruz, Mexico to Cape Sable, Florida (Nelson and Ahrenholz, 1986), they are most abundant in the waters of Louisiana and Mississippi (Lassuy, 1983) and this is the area where commercial fishing occurs (SEDAR, 2013). The stock’s presence in nearshore coastal waters is seasonal, the stock moves into the nearshore coastal zone in the spring and then moves offshore during the fall (Roithmayr and Waller, 1963).
The Gulf Menhaden fishery has been in operation since the late 1800s (Nicholson, 1978). Since its inception the fishing power has increased and the stock is now targeted by large (≤ 60 m) purse-seine vessels from ports located in Mississippi (n = 1) and Louisiana (n = 3 during the project period, 2006 to 2009 and 2011, Vaughan et al., 2007). The purse seine vessels target schools of Gulf Menhaden close to shore in water depths that allow the bottom of the purse seine net to make contact with the bottom. A total of 55% of the harvest occurred within three miles of shore, and 93% from within 10 miles of shore (Smith et al., 2002).
The fishing season starts on the third Monday of April and ends on 1 November annually (SEDAR, 2013). Fishing operations occur during daylight hours because some of the fishing activity is directed by spotter planes that locate schools of fish (Smith et al., 2002). State and local (county-level) governments have implemented various spatial restrictions and catch quotas on the fishery. Alabama allows fishing by purse seine south of a line stretching from South Rigolets to Bayou LaBatre Channel marker “19” and west of a line from this channel marker south to Dauphin Island. No fishing may occur in any waters within 1.6 km (one mile) of land in Alabama (SEDAR, 2013). Fishing in Mississippi is not allowed within 1.6 km (one mile) of the Mississippi barrier islands or the shores of two of the three counties on the state’s coast (Harrison and Hancock, SEDAR, 2013). A similar restriction was proposed by the third coastal county’s (Jackson County) Board of Supervisors, though it was not approved (Nelson, 2016a, 2016b). In Louisiana, areas landward of the “Inside-Outside Shrimp Line”, defined in Louisiana Revised Statutes 56:495 (http://legis.la.gov/legis), are closed to commercial Gulf Menhaden fishing. Exceptions to this restriction are in Breton and Chandeleur Sounds, defined in Louisiana Title 76 §307 (2014). An additional closed area at Grand Isle, LA, within 150 m (500 ft) from shore is enforced from the beginning of May to 15 September. The state of Texas prohibits fishing within 800 m (one-half mile) of shore. In addition to spatial restrictions, Texas and Florida also enforce quotas on the Gulf Menhaden harvest in their states’ waters. In March 2008, Texas established a Total Allowable Catch (TAC) on menhaden catches in the Texas Territorial Sea, defined as the waters off Texas out to nine nautical miles. The TAC is 31.5 million pounds per year, which is approximately the five-year average of harvest in Texas’ waters from 2002 to 2006. Florida enforces an annual quota from state waters of 1 million pounds per year on the commercial fishery for Gulf Menhaden inside the line that divides the inland and coastal waterways in Escambia and Santa Rosa counties (SEDAR, 2013).
The Gulf Menhaden fishery is managed through the coordination efforts of the Gulf States Marine Fisheries Commission and no harvest limits are imposed in the state waters of Louisiana, Mississippi, or Alabama. These are the states in which most of the harvest occurs (SEDAR, 2018, Table 1). In recent years, there has been increasing recognition of the role that forage fish populations play in provisioning upper trophic levels (Cury et al., 2011; Sagarese et al., 2016a). This, along with concerns about bycatch taken in the purse seine gear, are some of the primary concerns of recreational fishery stakeholders in the region. Shark and Red Drum bycatch has been a concern because of the co-occurrence of these taxa with the purse seine fishery (Powers et al., 2013; Drymon et al., 2020). Recent work (Raborn et al., 2025) to understand the magnitude and composition of bycatch in the state waters of Louisiana has indicated that the bycatch for all species was approximately 3.6% of the weight of the commercial fishery, below the 5% legal threshold for the state. Raborn et al. (2025) reported that Atlantic Croaker, Sand Seatrout, Spot, White Shrimp, Hardhead Catfish, and Gafftopsail Catfish made up the majority (89%) of incidentally catch fish. Red Drum, Black Drum, Gafftopsail Catfish, and Blacktip Sharks were most abundant species that were released. The industry continues to innovate and standardize methods to reduce mortality of incidentally caught species (F. Kuttel, Westbank Fishing LLC, personal communication) through the use of improvements in the excluder cage that serve to pump fish from the seine into the hold of the vessel.
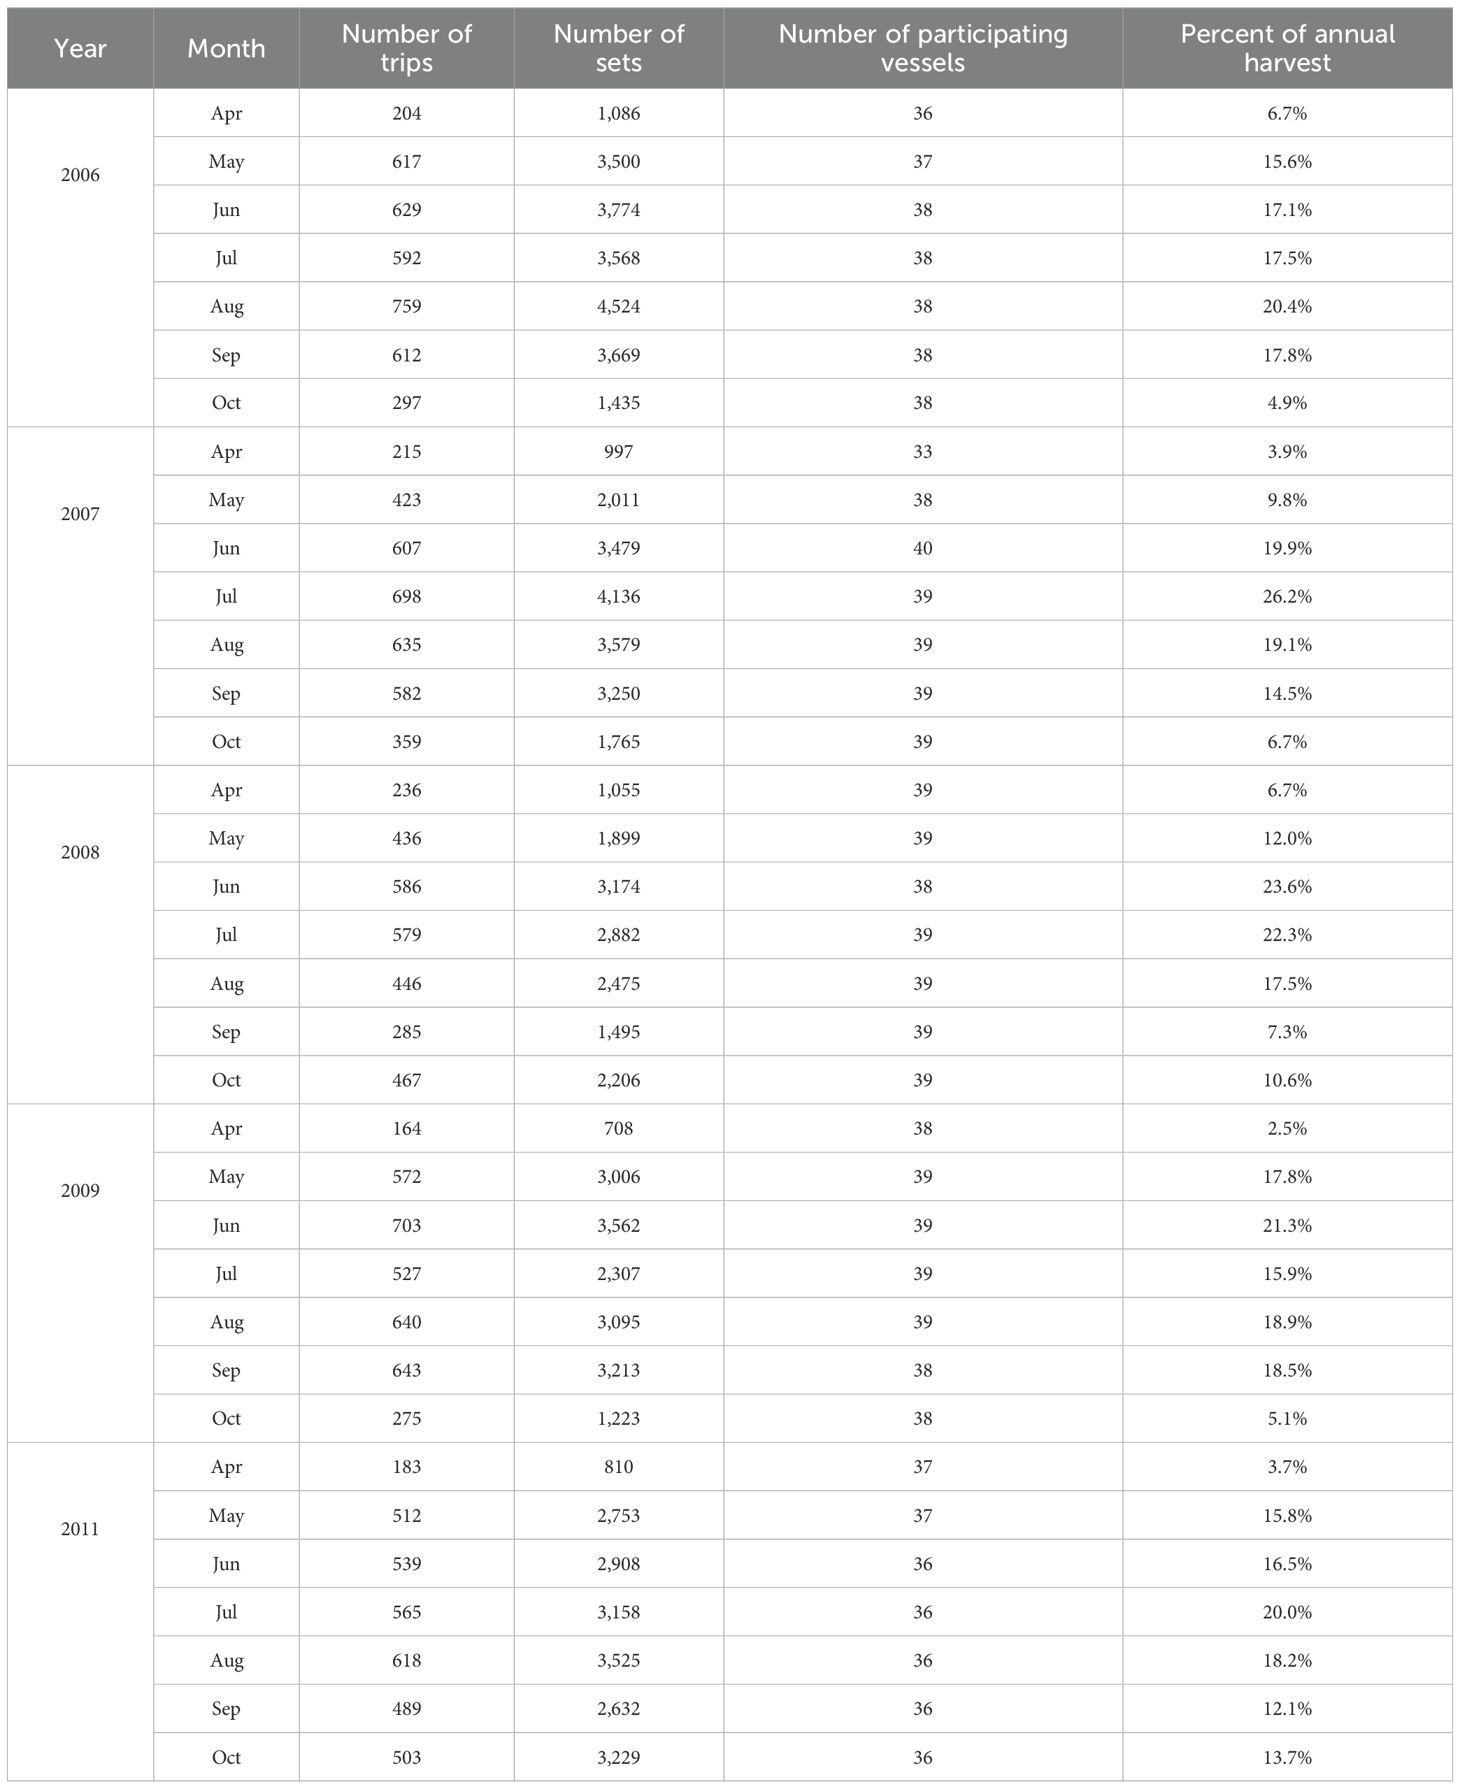
Table 1. Summary table of the month-specific number of trips, number of sets, number of participating vessels, and percent of annual harvest reported for each month from the five years of Captain’s Daily Fishing Report data (2006 to 2009, and 2011).
User conflicts in the Atlantic Menhaden fishery in the U.S. mid-Atlantic are well documented (Blomo et al., 1988; Collins, 1997). The conflicts in the Gulf Menhaden fishery are similar; they are fundamentally centered on differences in opinion about how the commonly-held living marine resource should be allocated. Recreational fishers are primarily concerned with maintaining a forage base for sport fishes, reducing bycatch, and ensuring that their fishing experience does not include interactions with purse seine operations. To accomplish these goals, there is increased interest in using spatial closures.
It is not clear, however, what impacts such closures will have on the fishery’s realized harvest and how the spatial and temporal dynamics of the fleet may change with the imposition of spatial regulations. Confronted with spatial closures, fishers will alter their behavior to maximize the opportunities that remain available to them. Previous studies show both the benefits and unintended consequences of spatial closures as a fishery management tool (Abbott and Haynie, 2012). Benefits include habitat protection (Turner et al., 1999), increased biodiversity and biomass within spatial closure (Lester et al., 2009), reductions of bycatch (Hobday and Hartmann, 2006), and potential yield spillovers to open areas (Roberts et al., 2001; Gell and Roberts, 2003). However, spatial closures in multispecies environments can alter fishermen’s targeting behavior, potentially increasing the bycatch of species not intended for primary protection, thereby affecting overall ecosystem outcomes (Abbott and Haynie, 2012). Simulation models of fleet movement dynamics have been used to evaluate the spatial dynamics of fisheries and the impacts of proposed regulations. These include analyses to understand the efficacy of closures for reducing capture of undersized fish (Woods et al., 2018), minimizing effort displacement when areas are closed to reduce bycatch (Hoos et al., 2019), and understanding the tradeoffs between harvest and bycatch under different spatial closure types. In the Gulf Menhaden fishery, it is not clear how spatial closures will impact the total harvest of fish or how closures will impact the movement and efficiency dynamics of the purse seine fishery. An aspect of interest to us in this work is to understand how the seasonal movement of the stock will impact the efficacy of spatial restrictions. We hypothesize that spatial restrictions will result in increased travel distance from the vessels’ home port to the fishing grounds and this will impact harvest in two ways. The first is that increased travel to the fishing grounds will lead to a reduction in the number of sets that vessels will take on a trip because more time will be spent sailing to fishing areas. The second impact will be that by excluding fishing in preferred nearshore areas trip-specific and set-specific catch per unit effort will be reduced. In this work, we use a bootstrap simulation procedure to understand the impacts of candidate spatial closures on harvest and the movement and fishing dynamics of the commercial Gulf Menhaden fishery.
Materials and methods
The primary source of information used in this analysis is fishery-dependent data obtained from NOAA Fisheries and collected from the Gulf Menhaden fishery (Vaughan et al., 1996), called the Captain’s Daily Fishing Reports (CDFRs). These are logbook-type data that are voluntarily provided to NOAA Fisheries by the Gulf Menhaden fishing industry, and compliance with the data collection program is near 100% (SEDAR, 2013). The CDFR data were collected from the vessels operating from reduction plants located at Moss Point, Mississippi; Empire, Louisiana; Abbeville, Louisiana; and Cameron, Louisiana (Figure 1). The data consists of the spatial and temporal characteristics of a vessel’s fishing activity. CDFRs data were available to us from 2006 to 2009 and 2011 (the CDFR data for 2010 is not publicly available due to legal issues associated with the impacts to the fishery by the Deepwater Horizon oil spill that began on 20 April 2010). To our knowledge, this subset of data is representative of the current dynamics of the fishery, though there has been at least one plant closure, in Cameron, Louisiana. The CDFR are records of daily effort information from a single vessel and consist of a unique and anonymized vessel identification code, the reduction plant of departure and processing, the location (latitude and longitude) of each set, the time of day that each set was taken, and the estimated harvest of fish caught in each set (mt). Prior to analysis, we performed quality control on the CDFR data, and records for trips were excluded if data fields of location, estimated harvest, vessel identification, or reduction plant of departure were missing. Trip records with sets indicating zero metric tons of harvest were also removed as these were confounded with missing data for some records, these composed n = 125 records. Data from the entire trip was removed if any net set location was reported outside the spatial domain of the fishery from 94.694° W to 88.003° W and from 28.782° N to the coastlines of Texas, Louisiana, Mississippi, and Alabama in the northern Gulf of America. Using the location of the vessels’ port of departure and set locations, we calculated the distance traversed (km) between the port of departure and the first set taken on the trip and between successive sets as well as the total trip distance. We used the ‘gdistance’ library in R (van Etten, 2017) to construct a transition raster with impassible boundaries. The transition raster was used to calculate the minimum distance traversed by a vessel that must necessarily navigate around land. In addition, to qualitatively evaluate the spatial extent of the area fished by a vessel on a trip, we determined that grid squares (0.05° latitude × 0.05° longitude) that sets were made (Figure 1).
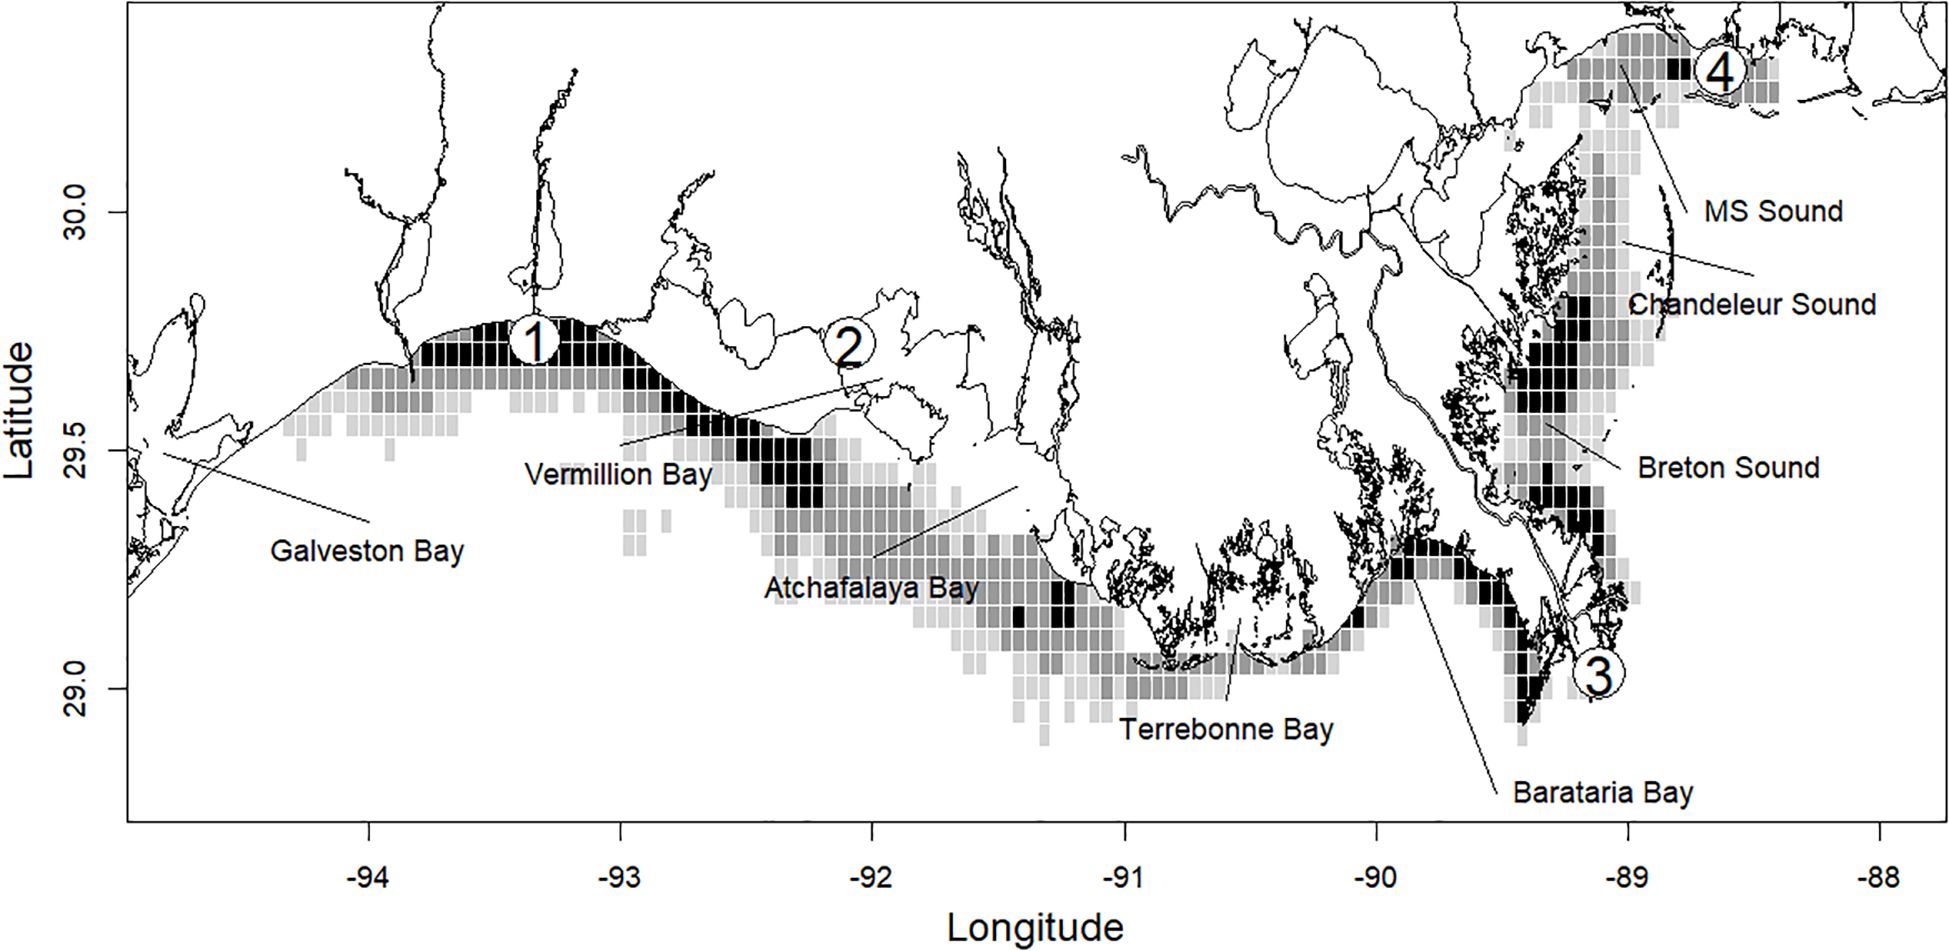
Figure 1. Study region in the northern Gulf of America. Shading of 0.05° × 0.05° dimension grid squares indicates the relative number of sets recorded in the grid square from years of the Captain’s Daily Fishing Report data used in this work. Darker shading indicates a greater relative number of sets. Approximate locations of reduction facilities are denoted with numbered points; 1. Cameron, Louisiana, 2. Abbeville, Louisiana, 3. Empire, Louisiana, and 4. Moss Point, Mississippi.
To describe the fishery and movement dynamics in the current regime we calculated five metrics. For each, we fit models to describe the underlying distribution and facilitate predictions. The first metric is the mean set-specific Catch per Unit Effort (CPUE, mt set-1) in each bootstrap sample. The mean CPUE, mt set-1 was determined by fitting a lognormal distribution to these values. The second metric is the mean number of sets per trip. The mean number of sets deployed on each trip was estimated by fitting a negative binomial PMF (Figure 2B):
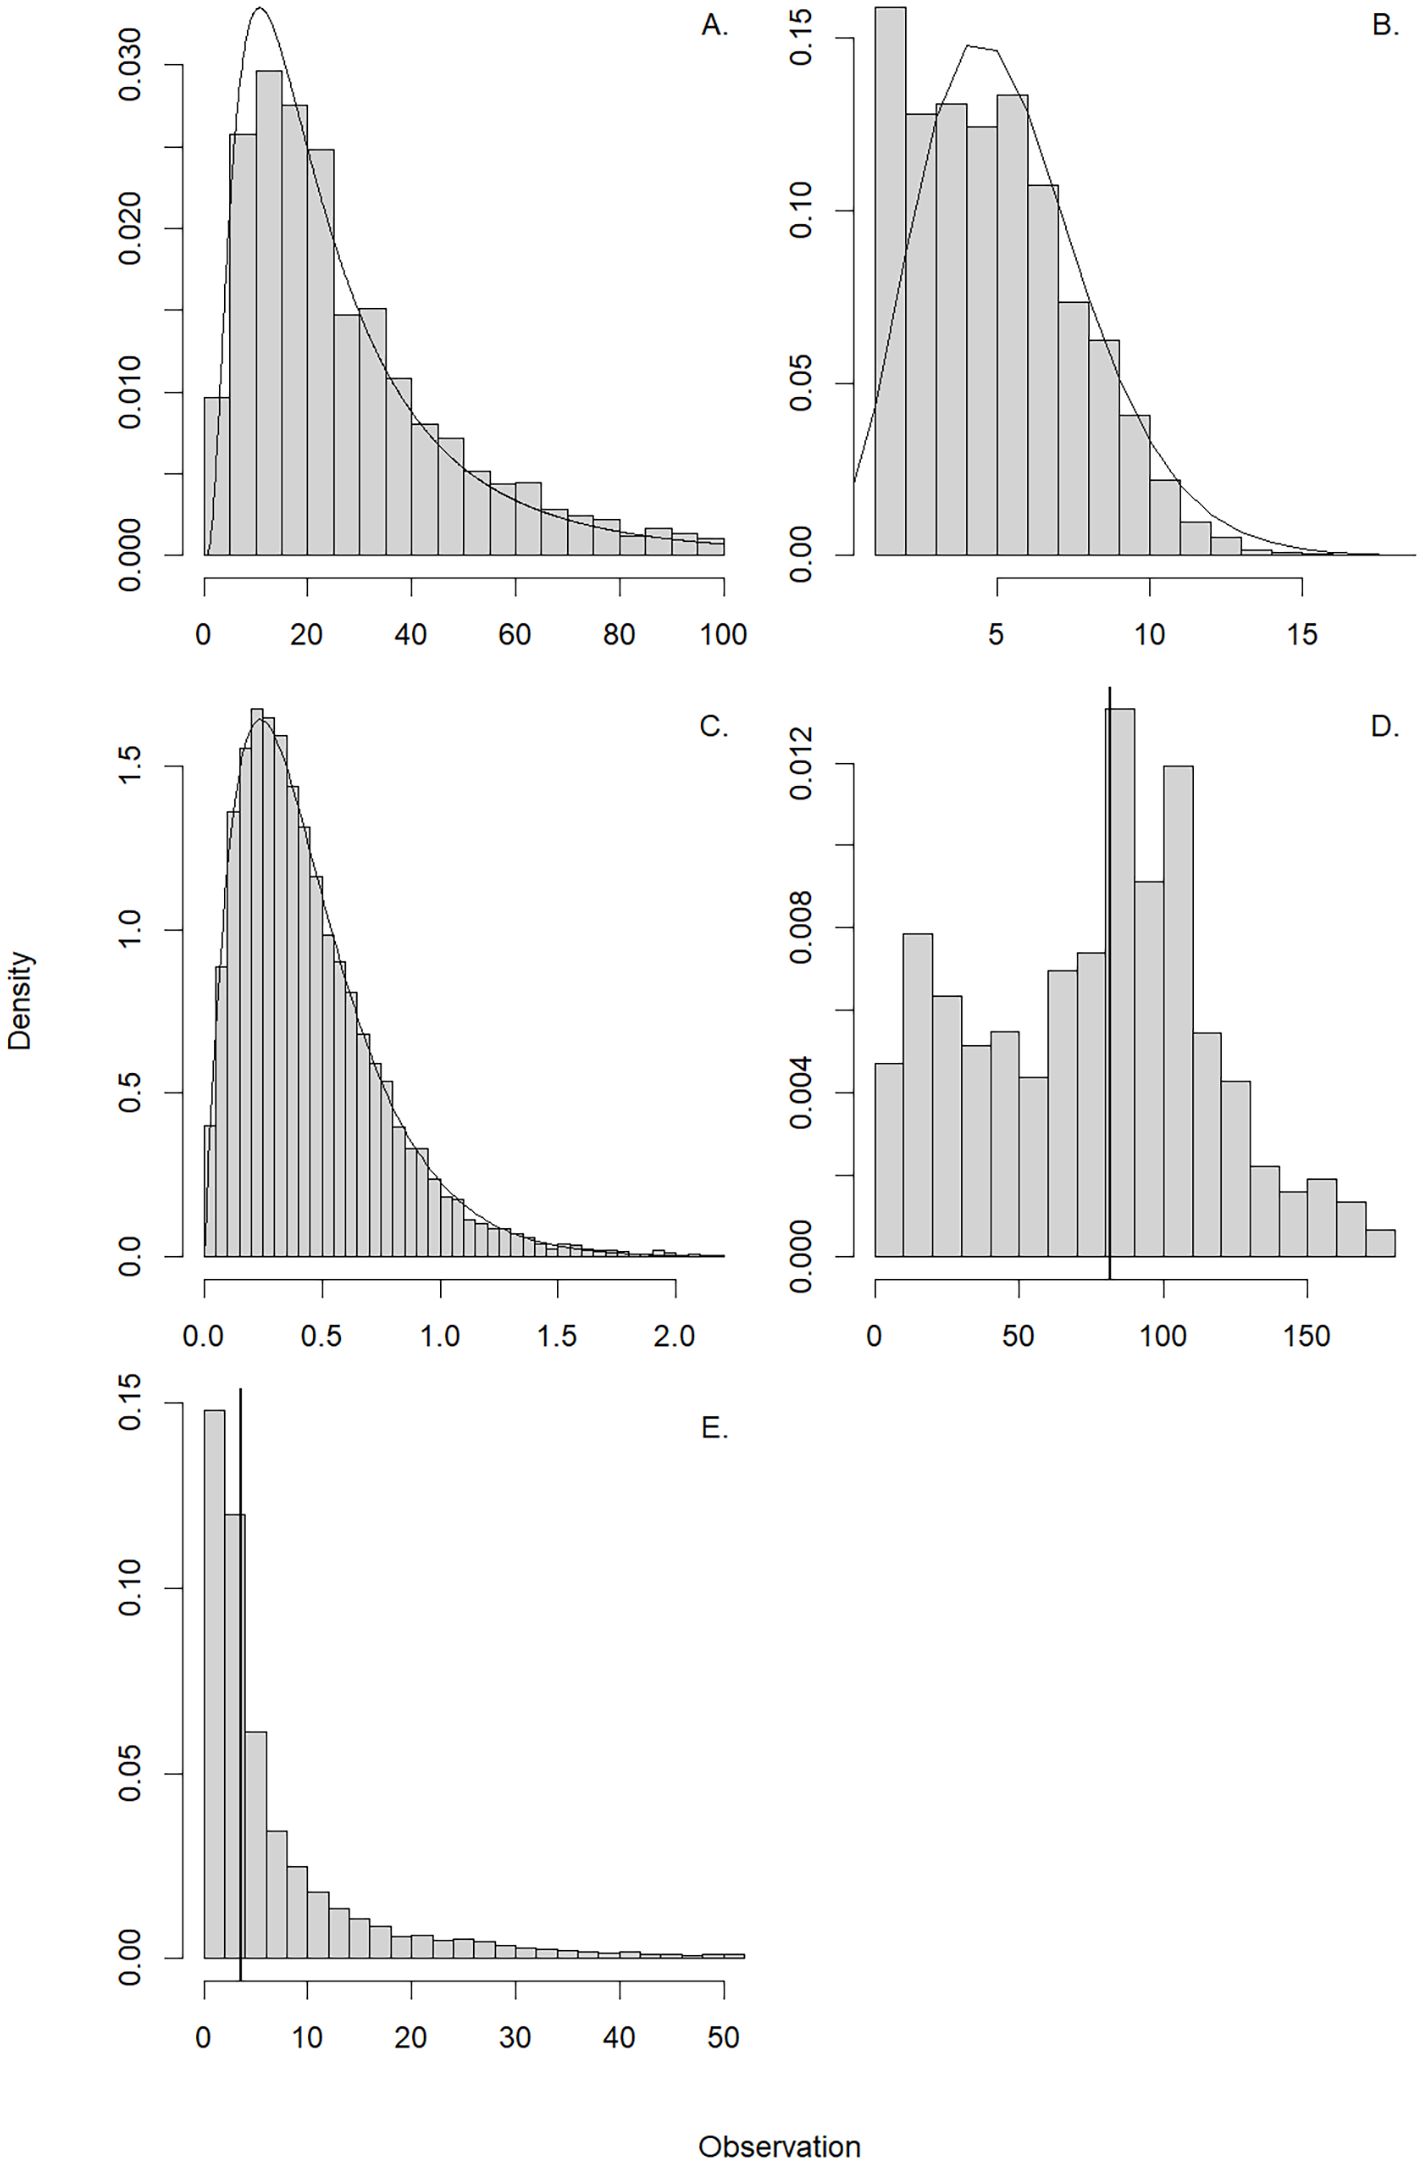
Figure 2. The density of bootstrapped (n = 1,000) values of state variables of trips from July (displayed for visualization). (A) is the distribution of the observed set-specific Catch per Unit Effort (CPUE, mt set-1) modeled with a lognormal PDF, (B) is the distribution of the sets per trip modeled with a negative binomial PMF. (C) is the trip-specific CPUE (mt minute-1) modeled using a Gamma PDF. (D, E) are the distance traveled to the first and subsequent sets (set number ≥ 2) with vertical lines representing the 50th percentiles of the distributions.
The parameter r is the number of successes, k is the number of failures, and p is the probability of success. The mean value of the number of sets deployed per trip is . The third metric is the mean set-specific CPUE (mt set-1) per trip. The mean trip-specific catch-per-effort (mt minute-1) was modeled using a Gamma PDF (Figure 2C):
The denominator for the trip-specific CPUE is the number of minutes for each set. The Gamma PDF has two parameters: α, the shape parameter and β, the rate parameter. The Gamma function (α) is a generalization of the factorial (n-1)! for all real numbers. The mean estimate of trip-specific CPUE is . Finally, we described two movement metrics to understand how travel distance was impacted. First is the distance traveled to the first set and the second is the distance traveled between subsequent sets after the first set was made (set number ≥ 2). Because no probability density functions fit these data well, we applied empirical estimates directly from bootstrapping: the median of the bootstrap samples (Figures 2D, E).
We explored the impacts of spatial restrictions, including the current regime, and then simulated an additional 1.6 km (one mile), 3.2 km (two mile), and 4.8 km (three mile) restriction adjacent to land, using a bootstrap approach with 1,000 simulations. The number of sampled trips in each month is equal to the number of trips taken by the fishery in each month (April to October) in the current restriction regime using the year-aggregated data. The inventory of year-aggregated Captain’s Daily Fishing Report data includes 16,616 trips that comprise 82,326 individual sets (Table 1). Each bootstrap sample comprises 16,616 (sampled with replacement) trips. For each simulation of the restriction regimes, we removed trips with at least one set that occurred within an area of spatial restriction.
We evaluated the impacts of the simulated closures on the five metrics by comparing the 95% intervals (2.5th to 97.5th percentiles) of each summary statistic with those derived from bootstrap resampling of the trips from the current restriction regime. We calculated a month-specific overlap of each summary statistic. The overlap index (%) is calculated by determining the percent of those summary statistics that are within the bounds of 2.5th and 97.5th percentiles of the restriction scenario and the current restriction scenarios. We evaluated spatial differences in fishing effort under each restriction regime by examining the difference (positive and negative anomalies) in the number of sets in each grid square (0.05° latitude × 0.05° longitude) relative to that of the current restriction regime. Finally, to understand the aggregate impact of the restriction regimes, we calculated the 2.5th, 50th, and 97.5th quantiles of the percent change in the total harvest (mt) between the simulated restrictions and the current restriction regime.
Results
Gulf Menhaden fishing effort (number of sets) in the northern Gulf of America is allocated throughout the coastal zone (Figure 1). Relatively large numbers of sets are made between Galveston Bay and Vermillion Bay, in the area of Barataria Bay, Breton and Chandeleur Sound, and Mississippi Sound. These areas are adjacent to the locations of the reduction facility ports at Cameron, Abbeville, and Empire in Louisiana and Moss Point, Mississippi. We did not detect contrast among year-specific patterns for the data used in this analysis (2006 to 2009, and 2011, Table 1) in the number of trips, the number of sets, the number of participating vessels, or the distribution of harvest as a percent of total among years. In each year, the number of trips and sets is maximum from June to September. The number of trips and sets made were greatest in Louisiana state waters and the second greatest effort in the fishery is allocated in Mississippi’s waters (Tables 2A, B). Fishing effort in Texas and Alabama is comparatively small (Figure 1).
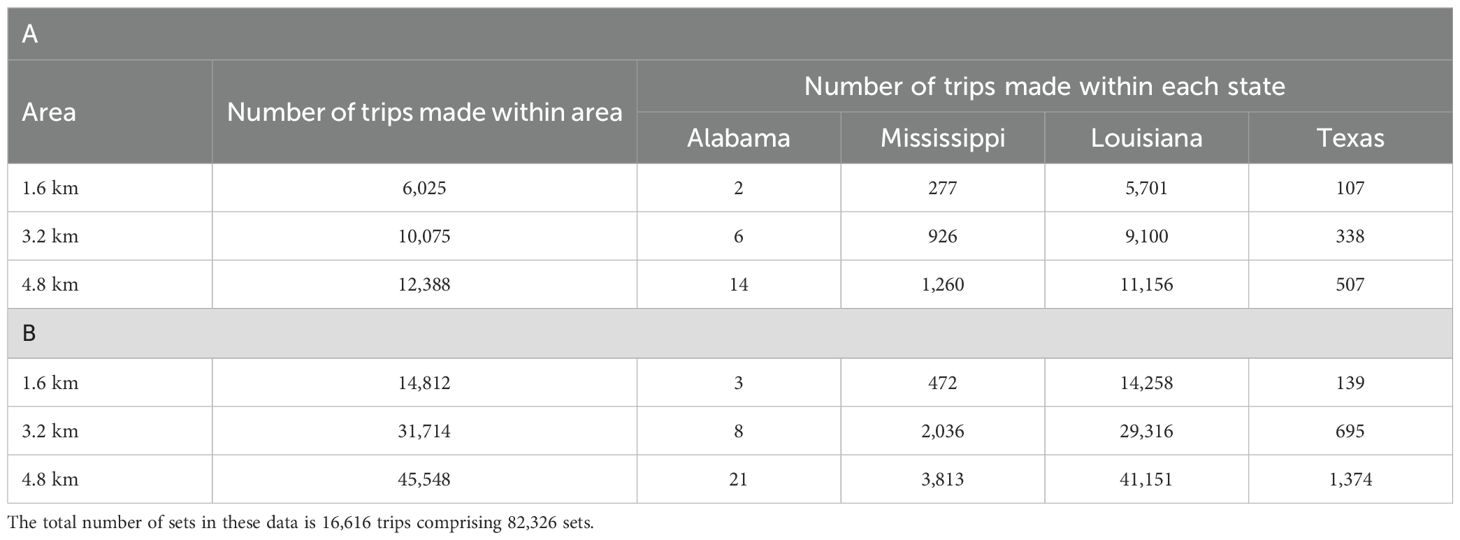
Table 2. Evaluation of the (A) number of trips and (B) number of sets made within distance to land of 1.6, 3.2, and 4.8 km in the northern Gulf of America from the Captain’s Daily Fishing Report.
We qualitatively evaluated the distribution of the statistics derived from fitting the PDF, PMF, and estimated medians. The lognormal PDF used to model set-specific CPUE (mt set-1, Figure 2A) and the Gamma PDF used to model trip-specific CPUE (mt min-1, Figure 2C) fit the data well. The negative binomial PMF underestimated the number of sets in a trip when the trip had few (one or two) sets (Figure 2C). The distance traveled to the first set of the day was variable and ranged from short (< 10 km) to long (> 100 km) distances (Figure 2D). The distance between sets, after the first set was taken, exhibited a decrease in density with increasing distance, representing long distance travel was rare but existed (Figure 2E).
Given the current restriction regime, we found that the set-specific CPUE increased from April and has a peak in the middle of the season (July) and is lowest in September (Figure 3). The greatest overlap in set-specific CPUE was between the current and the 1.6 km restriction regime in June to August. The overlap is minimum (16%) in April. The mean set-specific CPUE per trip in the 1.6 km restriction in the early (April and May) and late (September and October) months of the season exceeds that of the current restriction regime for these months. Similar patterns in monthly set-specific CPUE were observed in the 3.2 km restriction regime. The set-specific CPUE in the 4.8 km restriction regime was greater and had 0% overlap with that of the current restriction regime in April. In June and July, the set-specific CPUE in the 4.8 km restriction regime was reduced relative to that of the current restriction regime and the overlap was 0%.
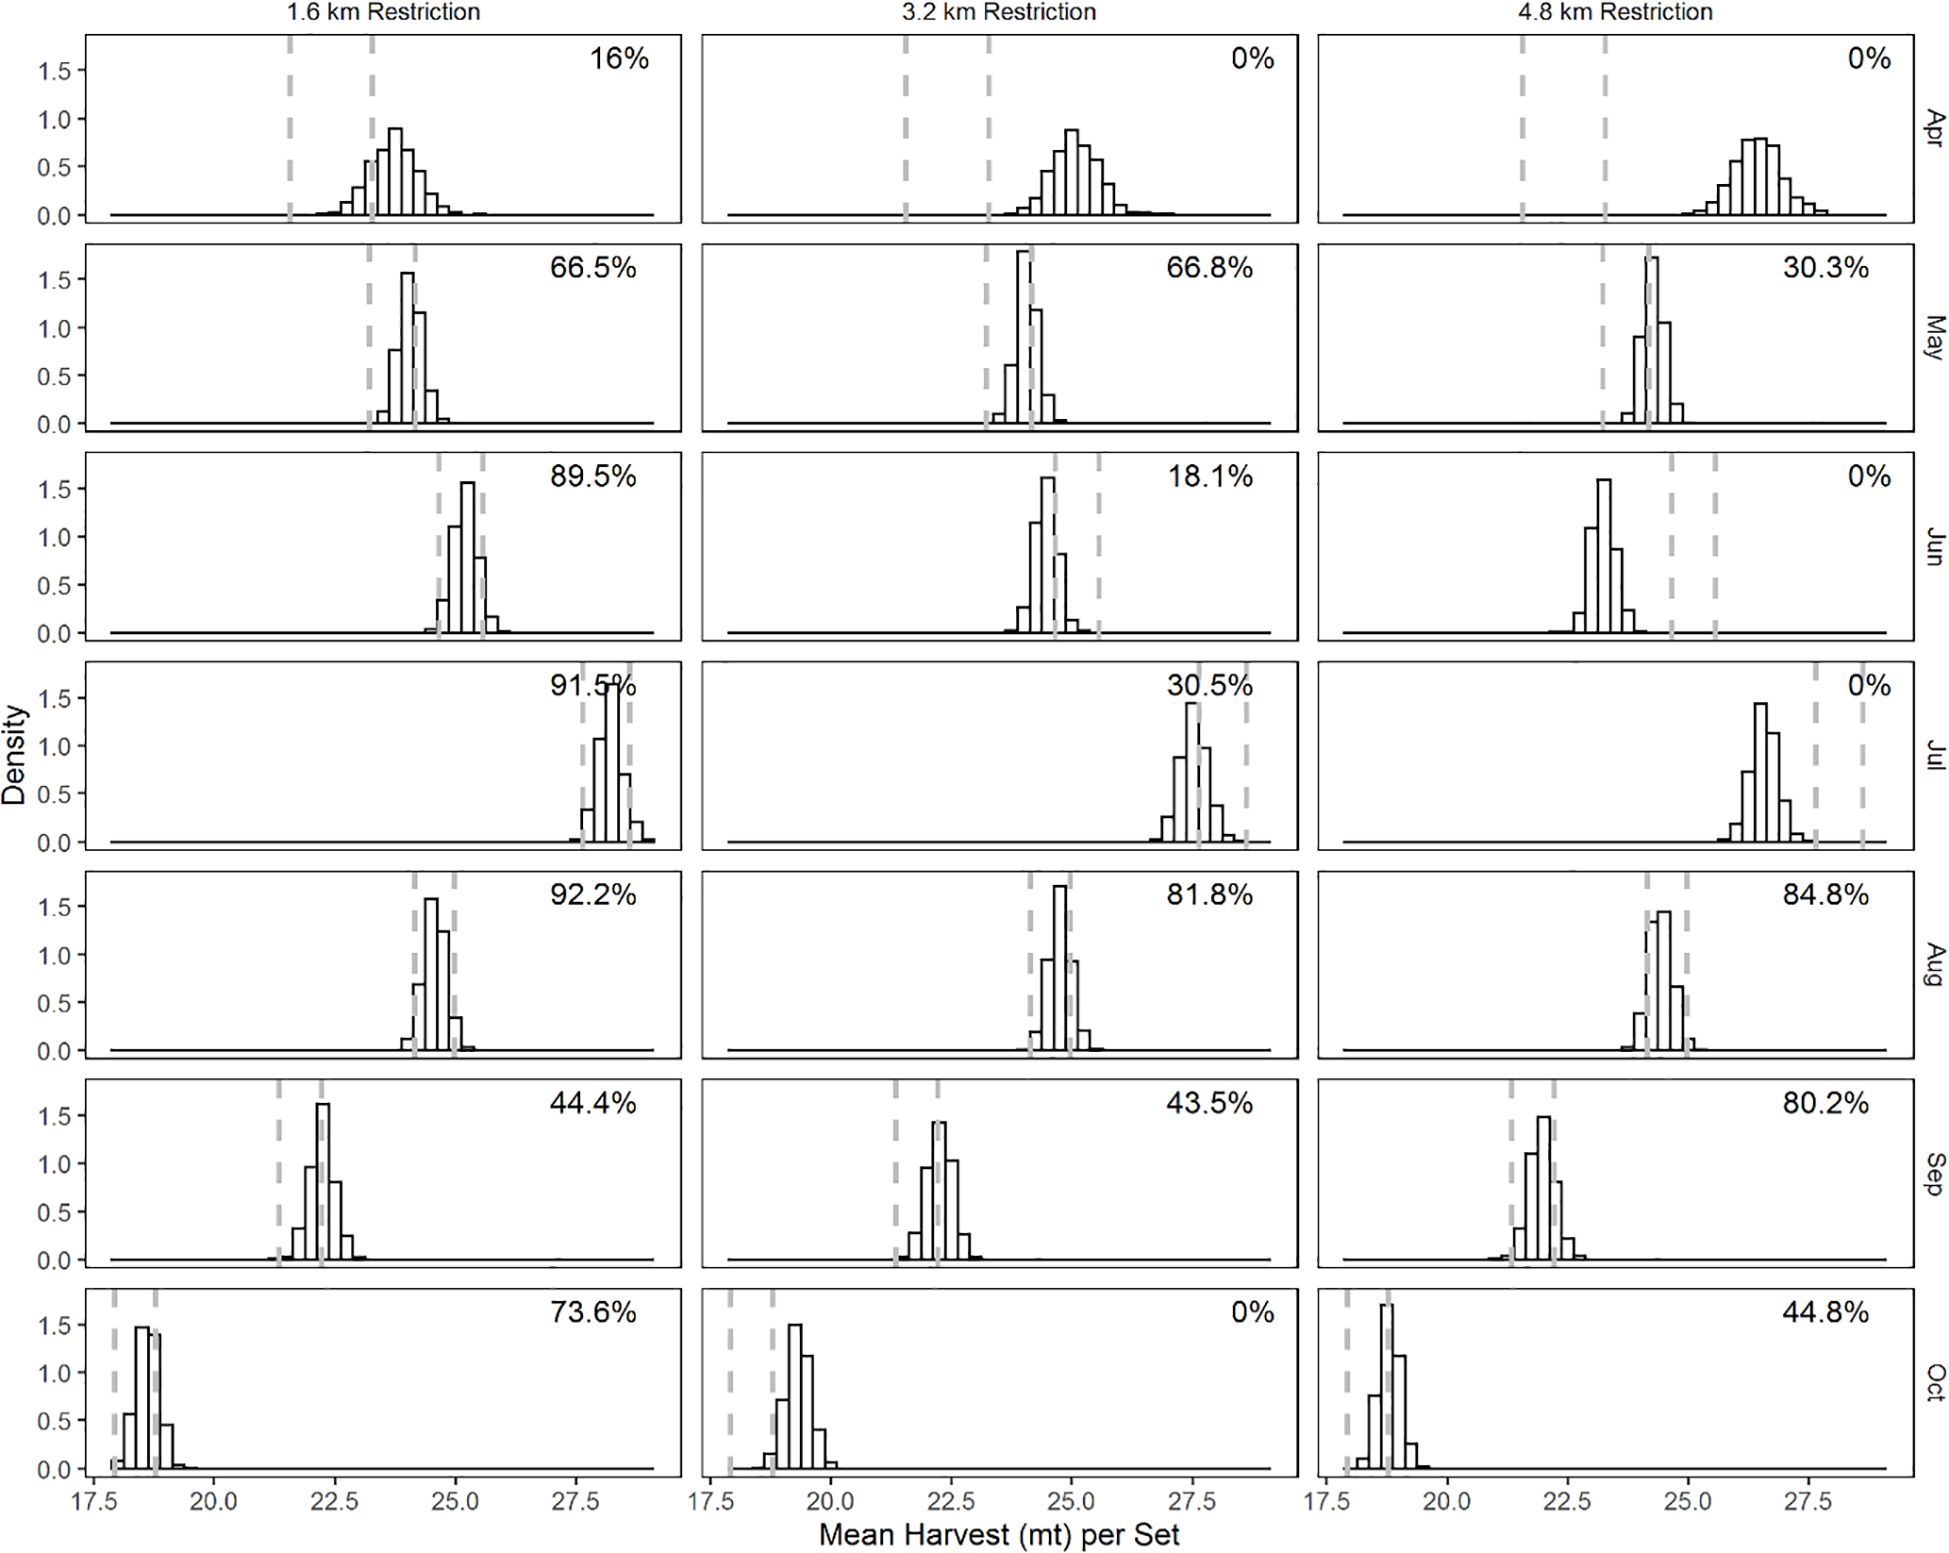
Figure 3. Month-specific distribution of set-specific CPUE (mt set-1) from bootstrap samples. Restriction regimes are in columns and months in rows. The dashed vertical lines are the 2.5 and 97.5 percentile values of the set-specific CPUE from the bootstrapped samples of the current restriction regime. The numbers on the top right indicate the proportion of bootstrap samples in the restriction scenarios that lie between 2.5 and 97.5 percentile values in the current scenario, and thereafter.
The mean number of sets per trip exhibited variation and differed from that observed in each of the restriction regime simulations (Figure 4). The mean number of sets in each trip, in the current restriction regime, varied from a low of 4.7 in April to greater than 5.2 in May to October. We found that the imposition of each of the three simulated spatial restrictions served to reduce the mean number of sets per trip and the overlap was 0% for all months, for all simulated restriction regimes.
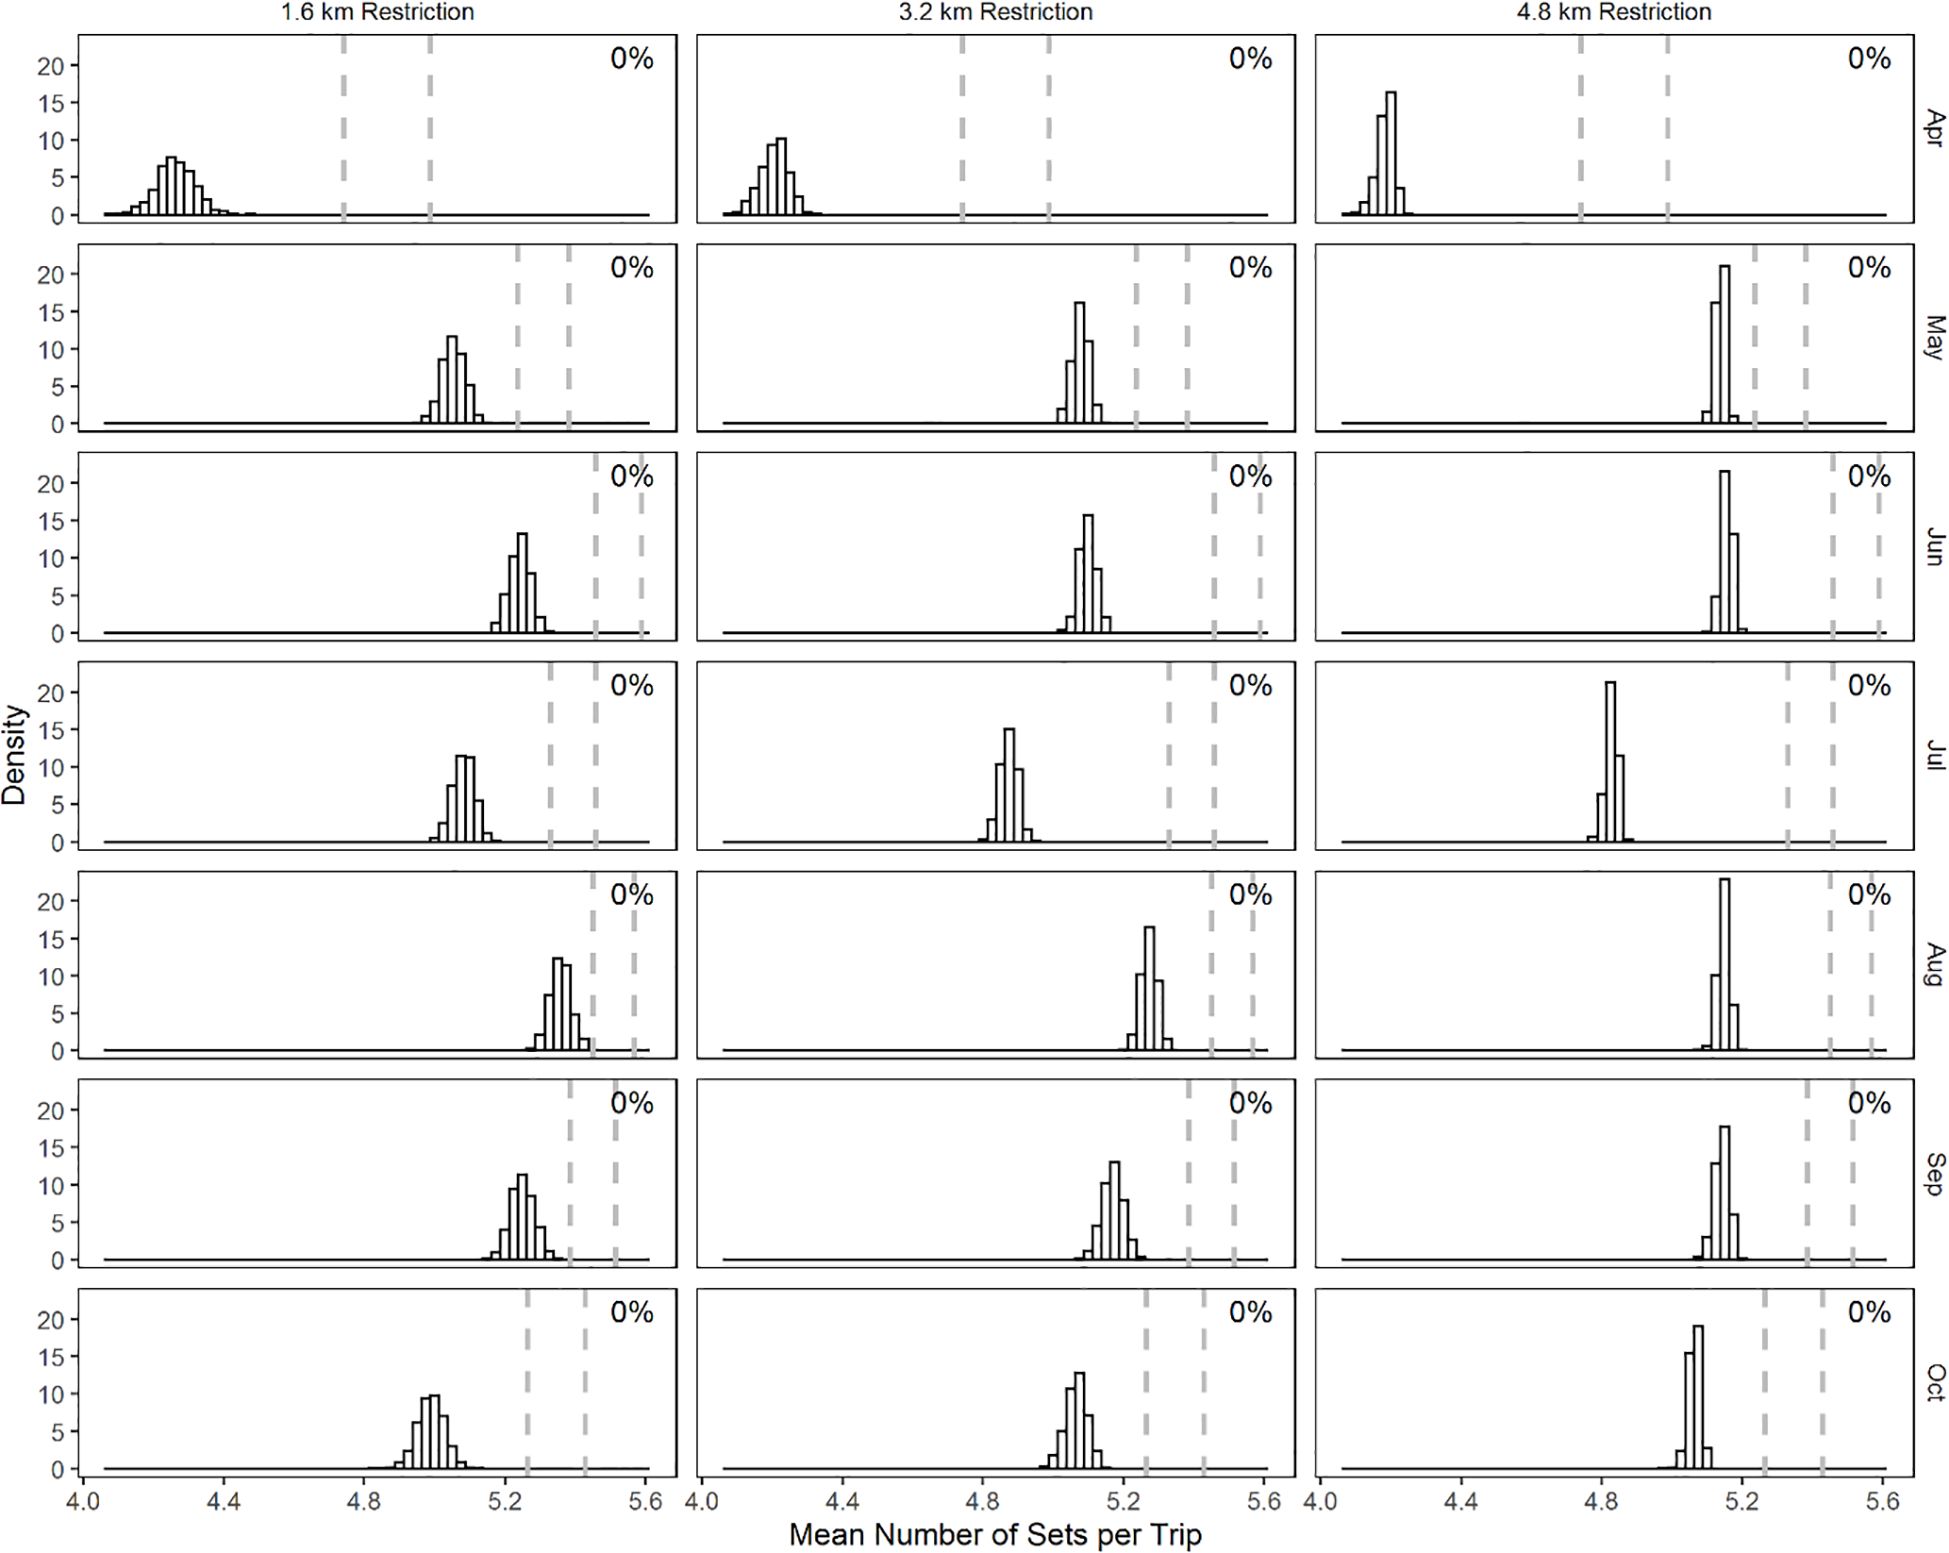
Figure 4. Month-specific distribution of the mean number of sets taken each trip from bootstrap samples. Restriction regimes are in columns and months in rows. The dashed vertical lines are the 2.5 and 97.5 percentile values of the mean number of sets taken each trip from the bootstrapped samples of the current restriction regime.
Estimates of trip-specific CPUE (mt minute-1) indicated variability and contrast in estimates depending on the restriction regime (Figure 5). The greatest mean trip-specific CPUE is found from June to August for all restriction regimes evaluated. There is similarity between trip-specific CPUE between the current regime and the simulated 1.6 km restriction regime. For the 3.2 km and 4.8 km restriction regimes, there was reduced trip-specific CPUE in June and July and these exhibited minimal overlap with the CPUE of the current regime (0 to 1.1%). The trip-specific CPUE of the 4.8 km regime in April was greater and had 0% overlap with the trip-specific CPUE of the current regime.
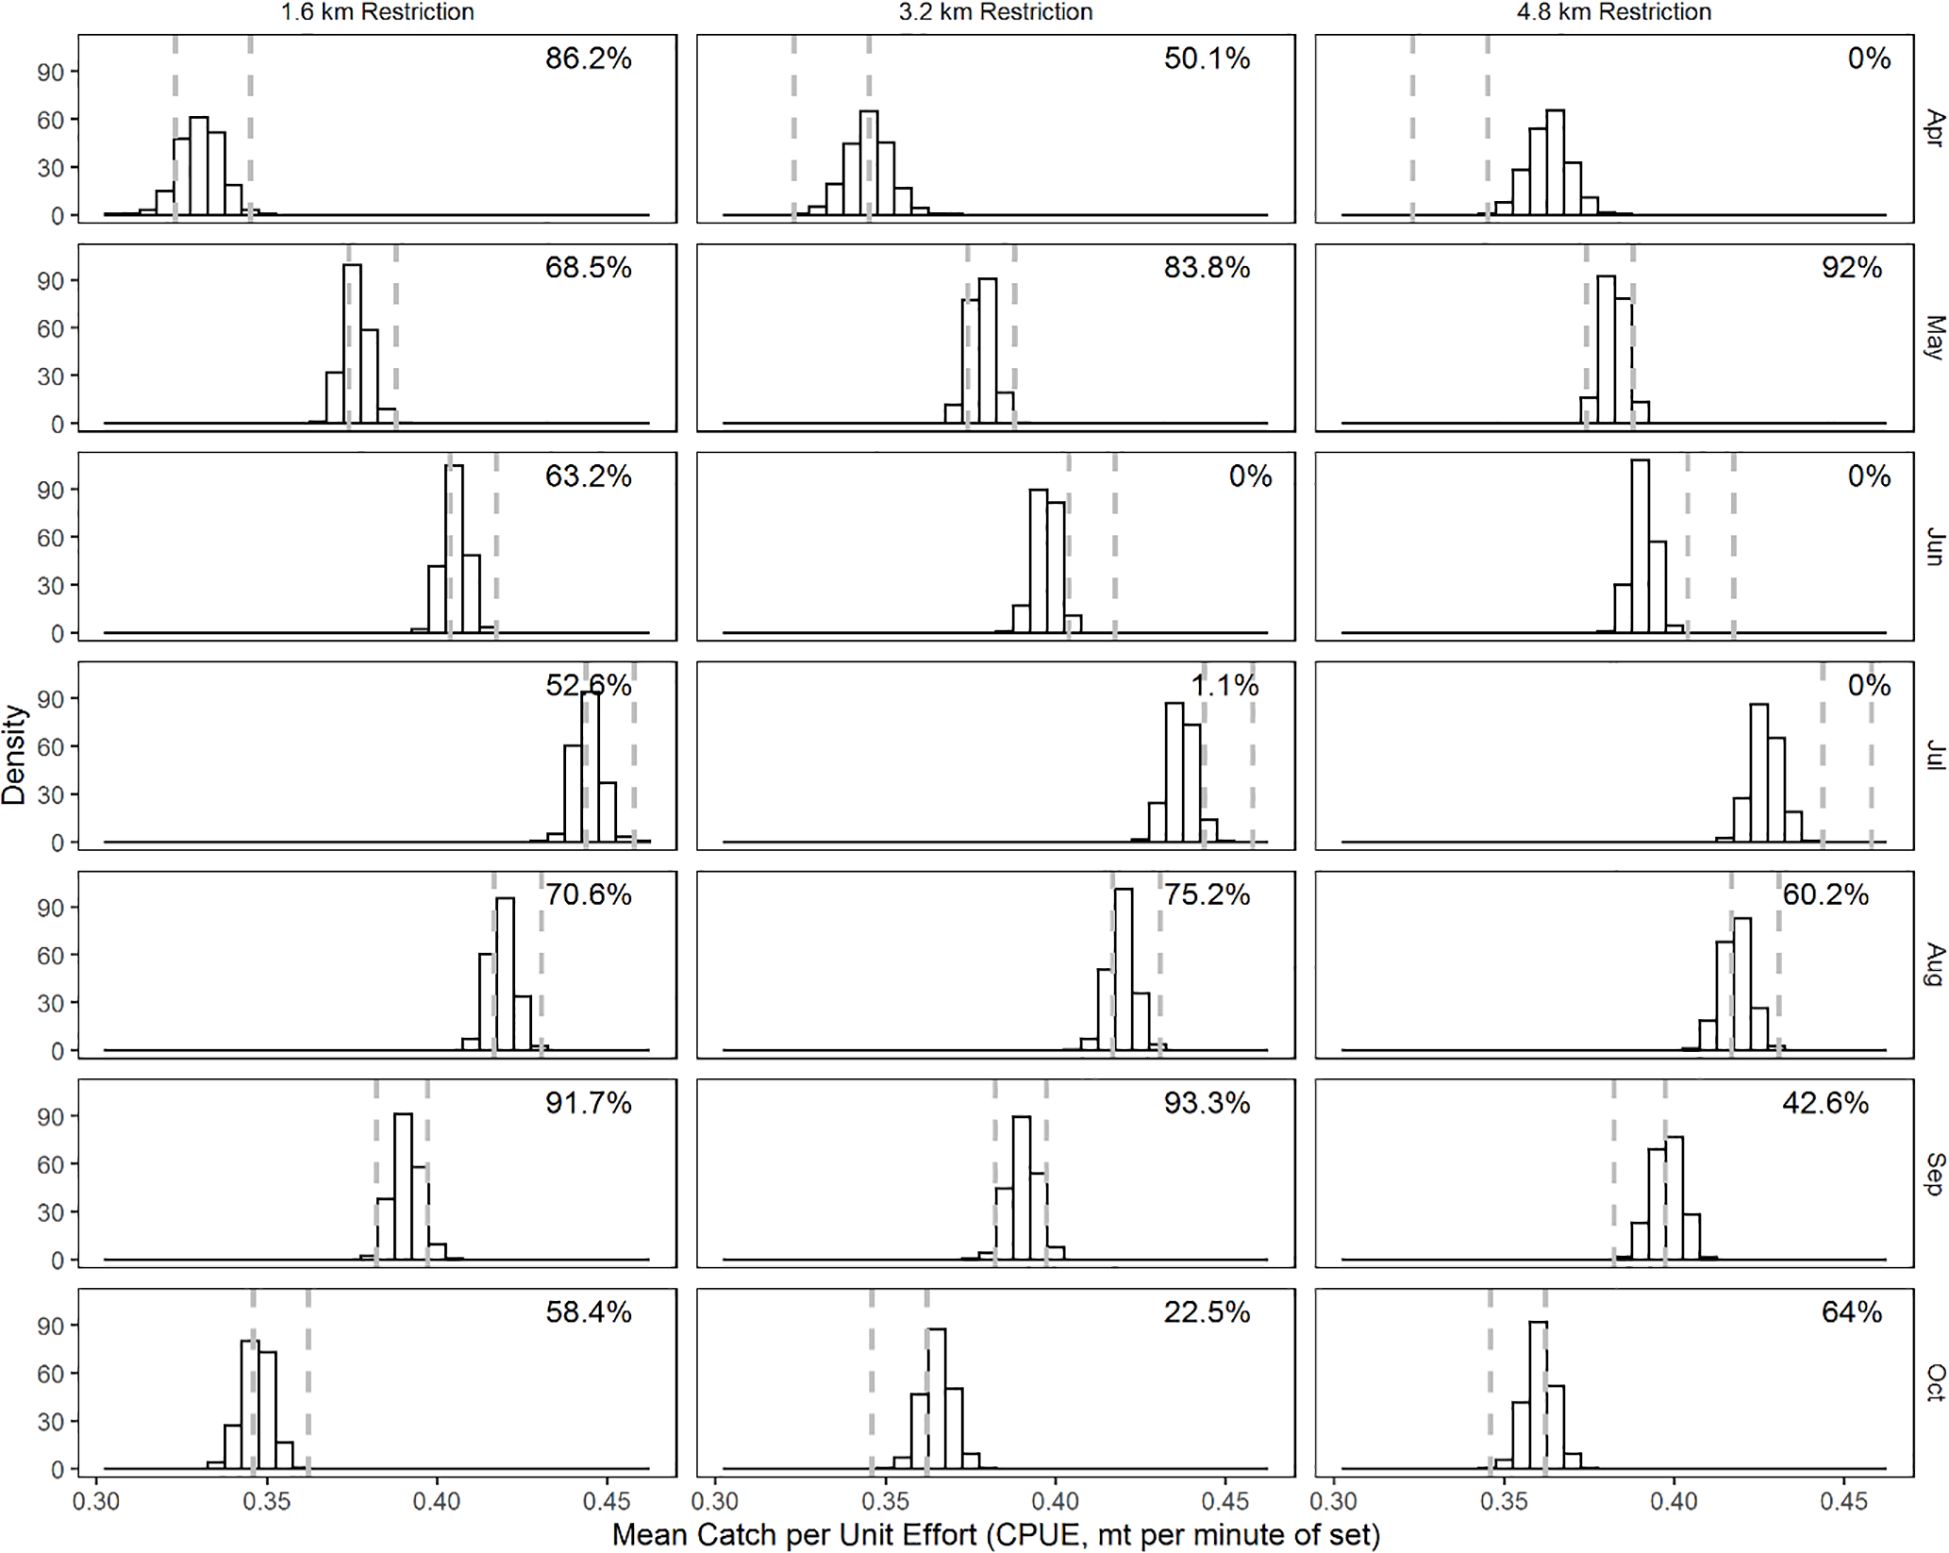
Figure 5. Month-specific distribution of the mean trip-specific CPUE (mt min-1) from bootstrap samples. Restriction regimes are in columns and months in rows. The dashed vertical lines are the 2.5 and 97.5 percentile values of the mean trip-specific CPUE of the bootstrapped samples of the current restriction regime.
Our analysis of vessel movement indicated that the restriction regimes were impactful to (Figure 6). The distance traveled to the first set in the 1.6 km restriction regime was similar to the distance traveled in the current restriction scenario (overlap of 9.4 to 95.1%) for all months except October, where the overlap was 0%. The impact of the 3.2 km restriction regimes served to increase travel distance to the first set in all months and resulted in 0% overlap for all months except in the 3.2 km restriction for July, where the overlap was 80.1%. The 4.8km restriction regime increased travel distance to the first set, such that there was no overlap in any month.
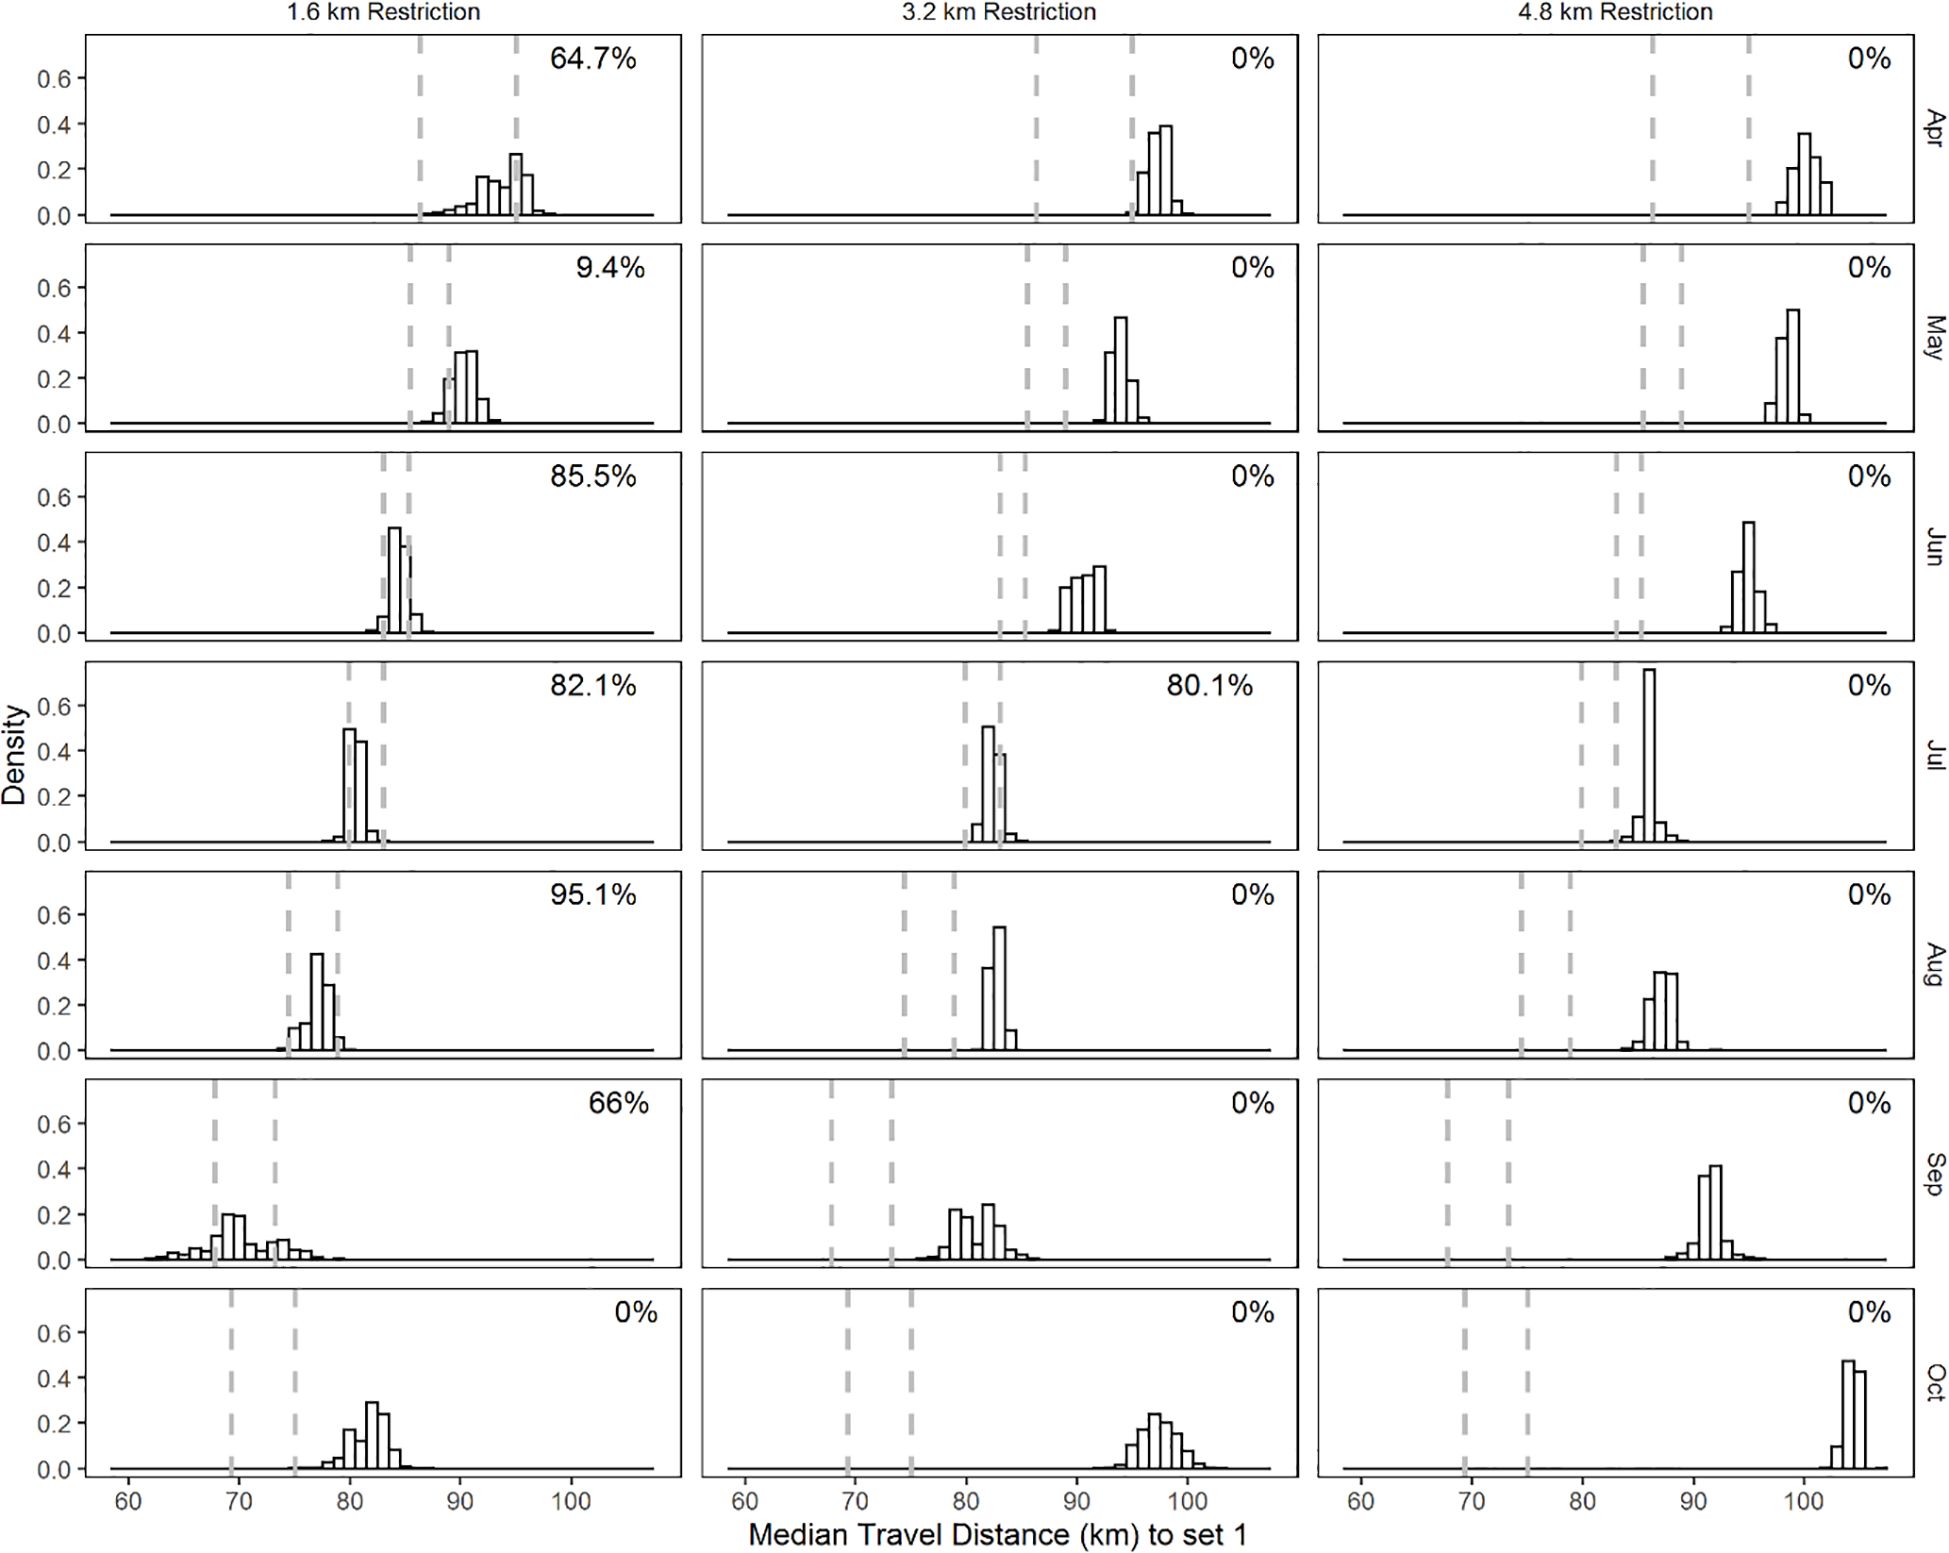
Figure 6. Month-specific distribution of the 50th percentile of the distance (km) traveled from the port of origin to the first set of the day from bootstrap samples. Restriction regimes are in columns and months in rows. The dashed vertical lines are the 2.5 and 97.5 percentile values of the 50th percentile of the distance (km) traveled from the port of origin to the first set of the day of the bootstrapped samples of the current restriction regime.
The distance traveled statistic between successive sets (set 2+) exhibited much less contrast for each simulated restriction regime relative to the current restriction scenario (Figure 7). The overlap index of the distance traveled for the 1.6 km and current restriction regime ranged from 6.2 to 91.6%. We observed similarity in the distance traveled for the 3.2 km and the current restriction regime, ranging from 14.3 to 93.9%. Except for August in the 4.8 km restriction regime, overlap with the current restriction regime was high, ranging from 13.7 to 94.7%.
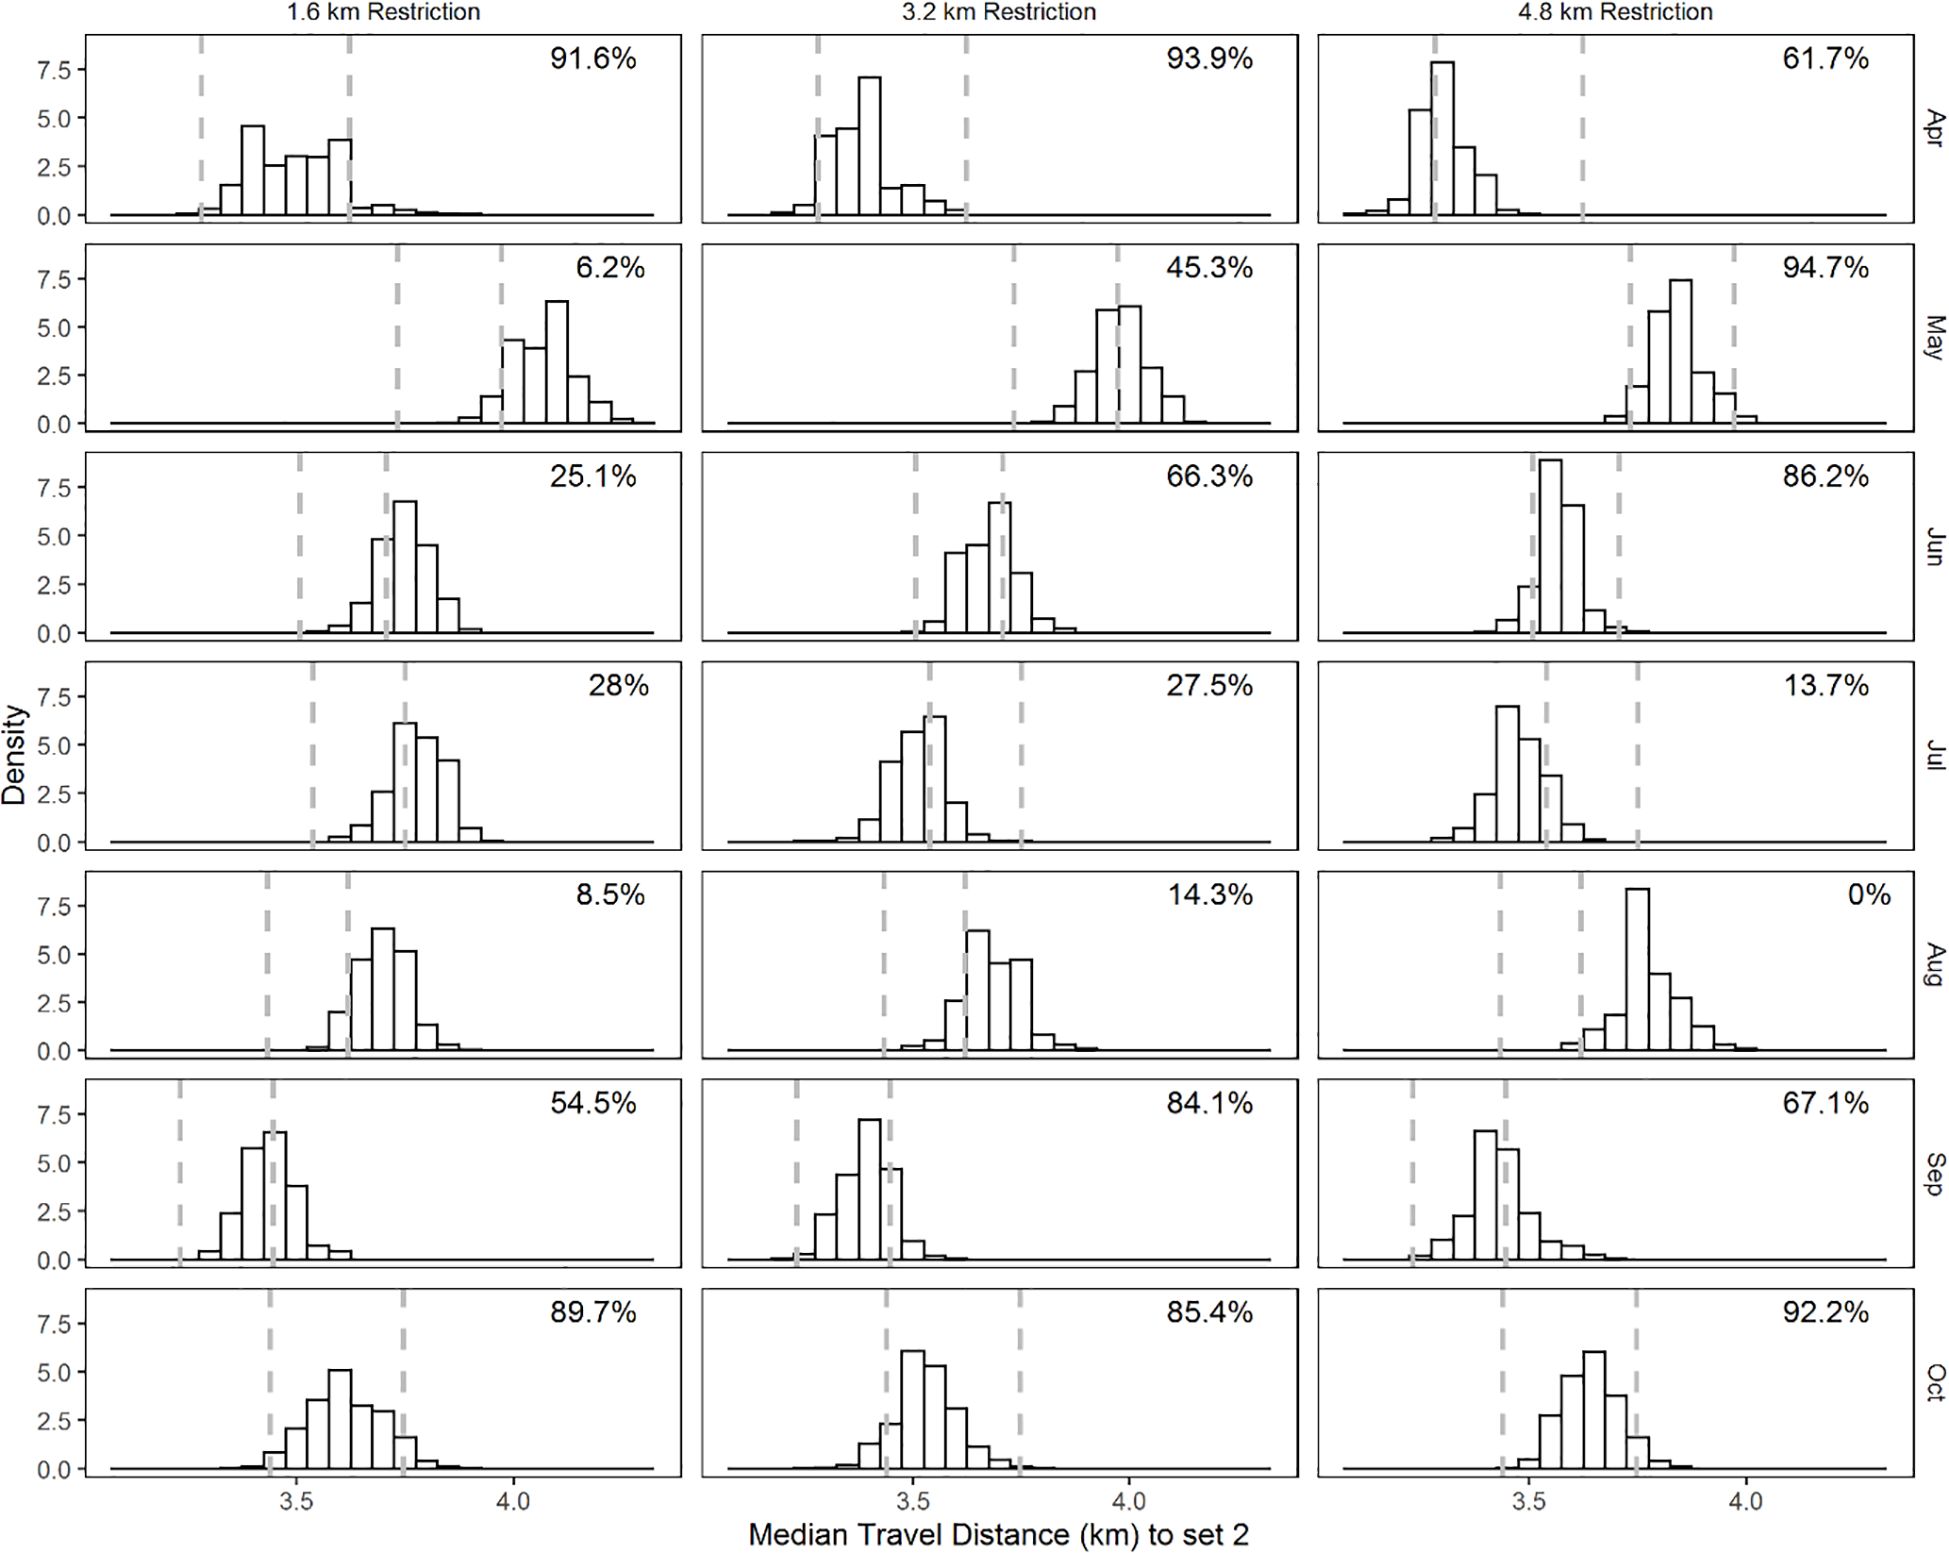
Figure 7. Month-specific distribution of the 50th percentile of the distance (km) traveled between successive sets (set 2+) from bootstrap samples. Restriction regimes are in columns and months in rows. The dashed vertical lines are the 2.5 and 97.5 percentile values of the 50th percentile of the distance (km) traveled between successive sets (set 2+) of the bootstrapped samples of the current restriction regime.
The spatial distribution of contrast in sets indicated that the candidate restriction regimes each had impacts on the spatial allocation of sets. The 1.6 km restriction results in increases in the concentration of fishing effort relative to the current restriction regime in the Chandeleur and Breton Sounds and in the region adjacent to and east of Atchafalaya Bay toward Galveston Bay (Figure 8A). The 1.6 km restriction resulted in reduced sets allocated, relative to the current restriction scenario, in Mississippi Sound, coastal areas in Chandeleur and Breton Sounds, adjacent to Barataria Bay, and in the nearshore region adjacent and east of Atchafalaya Bay toward Galveston Bay (Figure 8B). As the zone of restriction increased to 3.2 km and 4.8 km, the spatial extent of positive anomalies in Mississippi, Chandeleur, and Breton Sounds are reduced (Figures 8C, E), and the allocation of seats is increased in the region west of Terrebonne Bay. Reductions in nearshore harvest occur throughout the region (Figures 8D, F).
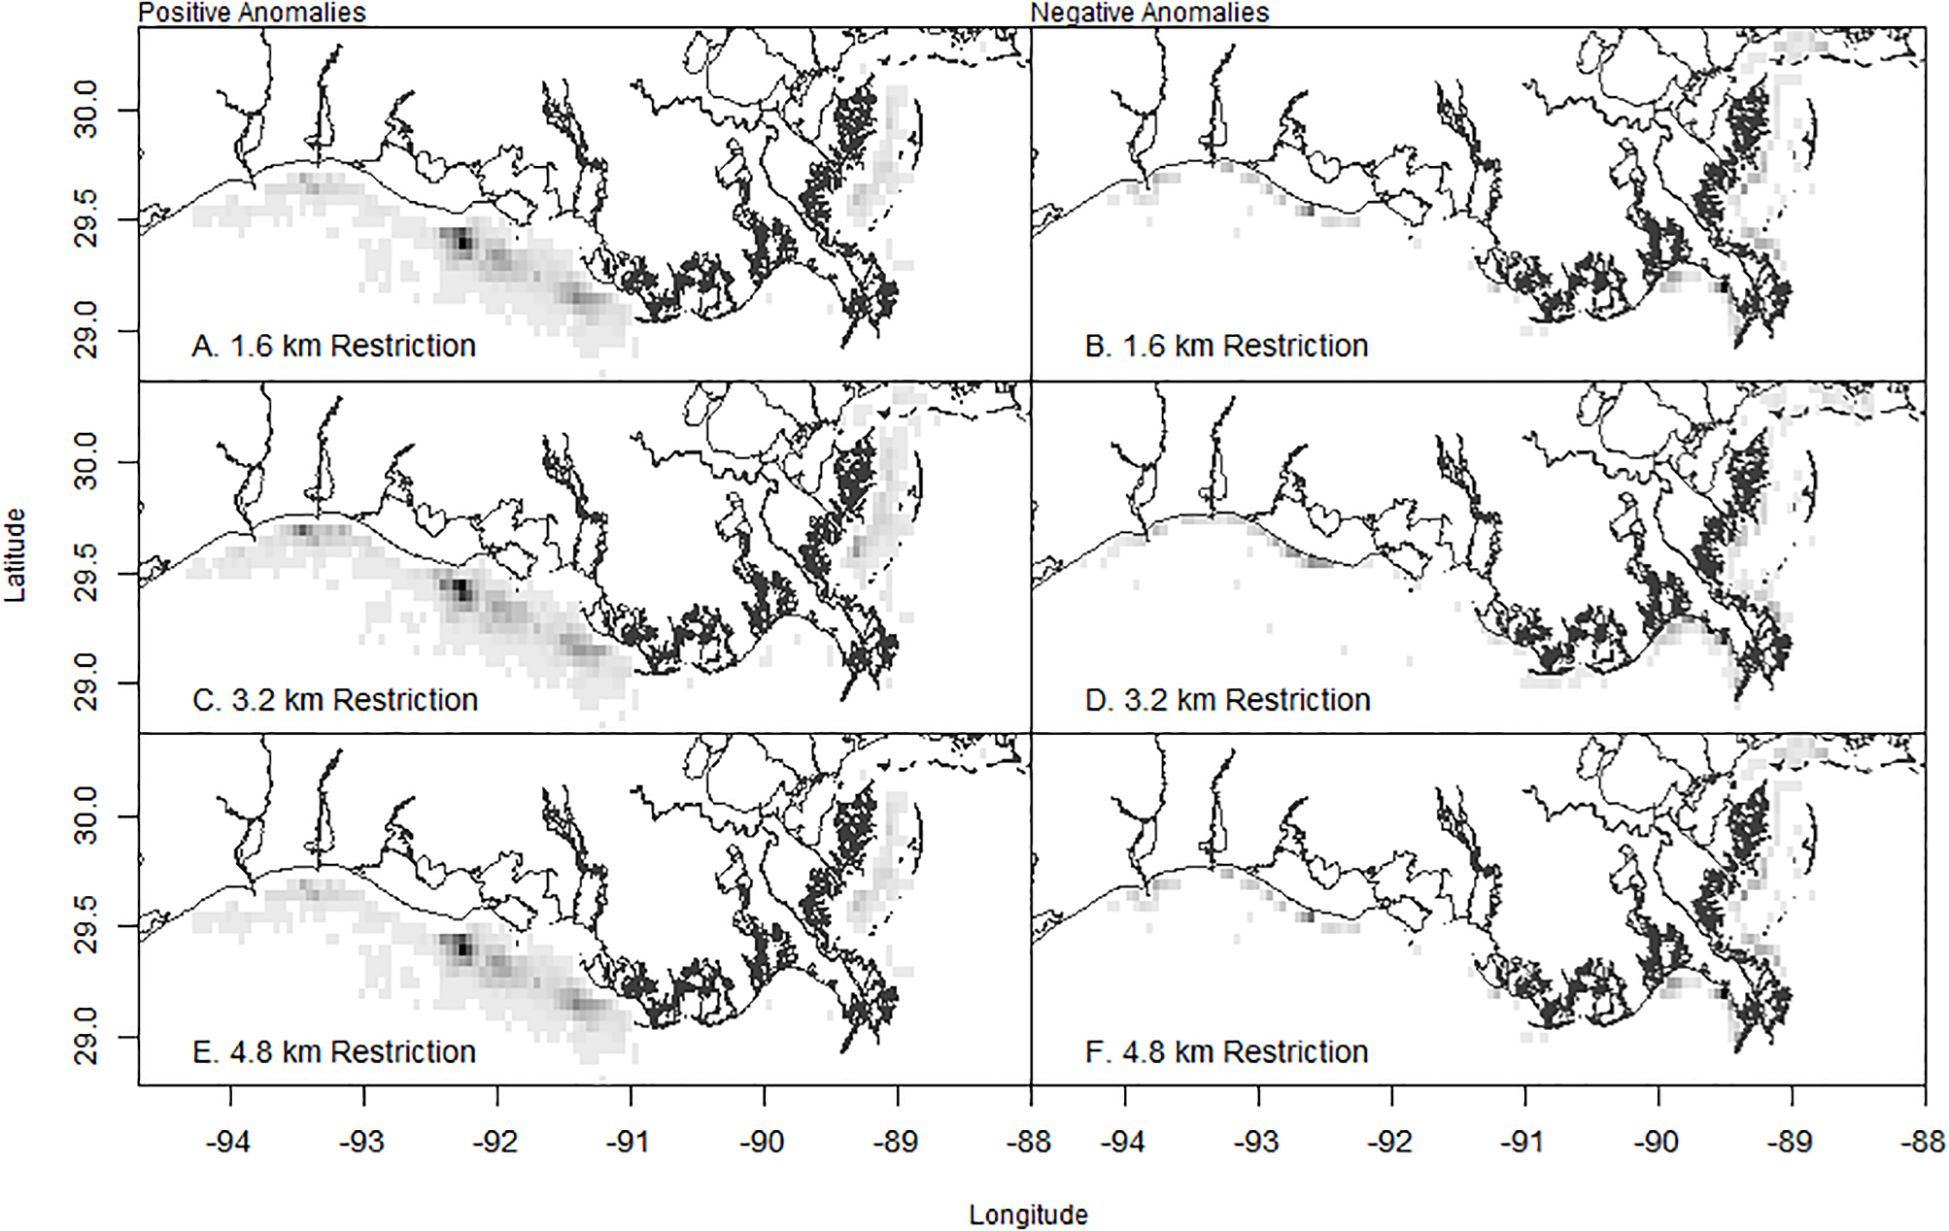
Figure 8. Spatial distribution of positive (A, C, E) and negative (B, D, F) anomalies of sets in the 1.6 km, 3.2 km, and 4.8 km restriction regimes relative to the set allocation of the current spatial restriction regime. The quartiles of the observations are presented where the colors white (1st quartile of records), light gray (2nd quartile of records), dark gray (3rd quartile of records), and black (4th quartile) are the increase (positive anomalies) or decrease (negative anomalies) of sets using 0.05° × 0.05°-dimension grid squares.
The restriction regimes resulted in a reduction in total harvest. The 95% confidence interval on the percent reduction in total harvest for the 1.6 km restriction regime was 4.3 to 7.2% and for the 3.2 km restriction regime, the 95% interval on the percent reduction of total harvest was 9.1 to 12.0%. The 4.8 km restriction regime resulted in the largest percent change in harvest, the 95% interval was a 12.7 to 15.4% reduction.
Discussion
Understanding the movement and harvest dynamics of fishers is necessary if managers are to make informed decisions about amending or instituting restrictions (Little et al., 2004) and understanding the behavior of fishers is often overlooked in this context (Hilborn, 1985). Although the current, state-based harvest control policies of the Gulf Menhaden fishery include spatial restrictions and quotas, it is spatial restrictions that serve as the primary harvest control mechanism for the fishery because the majority of sets are taken in Louisiana’s and Mississippi’s state waters. In recent years, only a small proportion of effort has been allocated to the state waters of Florida and Texas. In this work, we analyze the harvest and movement dynamics of the Gulf Menhaden fishery to understand the impacts of additional candidate spatial closures on the fishery. Such an analysis is relevant given recent efforts to implement spatial restrictions, notably Louisiana House Bill No. 535 (http://legis.la.gov/legis) presented in the 2021 legislative session. This legislation proposed to create an exclusion zone for commercial Gulf Menhaden fishing that begins at the coastal boundary and extends one-half mile (0.8 km) seaward from land. In addition to the one-half-mile exclusion zone, an additional exclusion zone of two miles (3.2 km) is proposed between Caminada Pass and Barataria Pass. Spatial exclusion zones have been proposed in Mississippi’s state waters. In 2016, the Mississippi Commission on Marine Resources, the body charged with instituting policy on fishing in the state, opposed a request from Jackson County, Mississippi, supervisors to restrict commercial Gulf Menhaden fishing within one mile of the shoreline. Spatial restrictions in the coastal zone, especially for the Gulf Menhaden fishery, will likely continue to be an approach that regulatory authorities will consider. Our analysis, using 1.6 to 3.2 km restrictions, is intended to understand the impact of using a range of restrictions from those similar to those currently employed and proposed (~1.6 km) and more restrictive (> 1.6 km) closed areas.
The benefits to the ecosystem using spatial restrictions on the Gulf Menhaden fishery are not well understood. The deleterious ecosystem impacts of mobile ground gear have been documented (Dimarchopoulou et al., 2018) as well as the positive impacts of marine protected areas for some demersal species (Williams et al., 2010; Huvenne et al., 2016). In the nearshore soft bottom environment in the northern Gulf of America, it is unclear what benefits, in terms of the reduction of impacts of the benthic environment, might occur from the exclusion of purse seine fishing. Similarly, it is not clear what the benefits of spatial restrictions may be in reducing the impacts of incidental bycatch. Previous work (de Silva et al., 2001) on the interaction between Gulf Menhaden purse seine gear and the bycatch of sharks (families Carcharhinidae and Sphyrnidae) indicates that an annual bycatch of approximately 30,000 sharks occurred during two seasons of Gulf Menhaden fishing (1994 and 1995). There was a high temporal pattern in the bycatch, with the greatest shark interactions occurring early in the fishing season (April and May). There are observations of catch per unit effort of Red Drum and a suite of shark species in areas where the purse seine fishery operates (Powers et al., 2013; Drymon et al., 2020). It is not clear, however, how differences in the catchability of the gears used to target these fishes, primarily longline, compared to that of a purse seine. Purse seine gears are considered non-selective in terms of size-selectivity (Marçalo et al., 2018). However, from a species composition perspective, work in the Mediterranean purse seine fishery targeting small pelagics indicated that discarded quantities were 2.2 to 4.6% of the total catch (Tsagarakis et al., 2012).
In this work we focus on leveraging existing fishery-dependent data to understand the implications of closures to the fishery in the short term without accounting for how closure may increase fish productivity or reduce bycatch, and with the assumption that the trips with sets in closed areas will shift to accessible areas. We hypothesized that the imposition of spatial restrictions would result in increased travel distance from the vessels’ home port to the fishing grounds. This would impose limitations on effort, resulting in a reduction in the number of sets that vessels can make during the fishing day, a decrease in the movement distance between successive sets, and a decrease in catch per unit effort (CPUE). Our primary findings presented in this work generally support this claim: We found that the travel distance to the first set was increased, especially in the 3.2 km and 4.8 km restriction scenarios. Set-specific and trip-specific CPUE are generally reduced but exhibit similarity with those of the current restriction regime, primarily in the 3.2 km and 4.8 km restriction scenarios. The patterns are likely due to the seasonal movement of the stock into and out of the coastal zone in the early and later parts of the fishing season, which are the times of the year during which the stock is moving inshore (in the spring) and offshore (in the fall). We recognize that the analysis of overlap that we have performed may be sensitive to the models used to summarize the distribution of count variables and to provide point estimates of continuous variables. Our choice of using the negative binomial distribution to model the number of sets that vessels can make during the fishing day is positively biased. Our use of the median value of the movement distance between successive sets may result in biases as well.
Our description of the spatial dynamics of the fishery coincides with those provided by others (Smith et al., 2002; Langseth et al., 2014) who have described the nearshore nature of the fishery. The purse seine gear is deployed in shallow water and fishers prefer to have the lead line (the bottom of the purse seine) on or in the soft sediment of the bottom when harvesting fish. In a spatial analysis of the fishery, Smith et al. (2002) reported that 55% of the harvest occurred within three miles (4.8 km) of shore and 93% of harvest came from within 10 miles (16.1 km) of shore. Thus, imposition of restrictions of one to three miles (1.6 to 4.8 km) around all land in the region has an impact on the number of observed trips and sets that can be made, especially in Louisiana and Mississippi state waters. The fishery targets the stock (age-1 and age-2 y, SEDAR, 2013, 2018) in the nearshore coastal zone as the stock migrate seasonally inshore. The fishery has a temporal component with a relatively consistent peak occurring in June to September. Fish move offshore in the fall and winter to spawn, but the timing and extent of offshore movement varies. Previous work has shown that age-0 Gulf Menhaden move from Lake Pontchartrain, Louisiana in August or September (Suttkus, 1956). The greatest migration of juveniles from estuaries at Port Aransas, Texas, occurred from November through May (Copeland, 1965). Individuals move offshore to spawn and recent work (Brown-Peterson et al., 2017) has shown that the winter, offshore reproductive season is protracted, lasting 5.5-months (October to March) in the north-central GoA. The intra-annual analysis of trip and harvest magnitude provide insight into the interaction of the timing and extent of the seasonal movement dynamics of the stock in the coastal zone and the fishery. For each year examined, the number of trips and harvest are maximum in June to September indicating that the catchability of the stock is maximized in the nearshore at that time.
We found that the models used to describe the harvest and movement dynamics differed in their fit to the data. The underestimate of the set numbers when the set numbers are low can become problematic in assessment of the new restriction scenarios. The set numbers for the restriction scenario tend to be low. Conversely, the overestimate when set numbers are high can become a problem in the current scenario when set numbers tend to be higher. Both may contribute to the 0% overlaps of set numbers between current and new restriction scenarios. The impact of this overestimate of the number of multi-set trips may affect the analysis of the relationships of the set distance and trip distance variables, and could serve to deflate the impact of successful, single-set trips.
Our analysis indicated that the distance traveled from the reduction plant to the location of the first set was highly variable. This result indicates that vessels, during the season, target the stock throughout its nearshore range, some taking very long, > 100 km, movement to the first set of the trip. The role of spotter planes has been well documented (Ruttan and Tyedmers, 2007); between 65 and 75% of all the sets made in the Gulf Menhaden fishery through the mid-1990s were directed by spotter plane (Smith, 1991; Smith et al., 2002). Smith (1991) noted that spotter planes fly over the fishing grounds prior to the next day’s fishing and direct the fishing fleet to areas of high concentration of Gulf Menhaden. The observed long-distance travel to the first set of the trip is likely an effect of the spotter plane’s direction to these locations. Spotter planes are able to survey large swaths of the fishing grounds to detect the stock. Similarly, once vessels have made the first set there is a high probability that they will move only very short distances in making subsequent sets, either exploiting the same school of fish or moving to schools of fish in the area.
Our analysis of the statistics of the current restriction regime indicates that harvest and movement dynamics vary during the fishing season. The difference in statistics among the restriction regime scenarios and months allows an understanding of the interaction of the seasonal movement of the stock and the fishery. Our observation that the implementation of a 1.6 km restriction regime resulted in a greater mean harvest per set in the early part of the fishing season indicates that the stock has not yet moved into the nearshore in the early spring and has moved out of the coastal zone by the early fall. However, in the summer months, each of the restriction regimes resulted in reduced mean harvest per set. Our analysis of the number of sets taken per trip indicates that for all months, for all restriction regimes, fishers expend less effort per trip. An aspect of this analysis that we did not consider because of the nature of the bootstrap simulation is the impact of the compensatory behavior of the fish. Fish schools may exhibit density dependence in their spatial distribution. In situations of nearshore exclusion, the greater unfished density could result in the redistribution of schools into an open area. The fine-scale movement of menhaden schools is not well understood, and it is not clear to what extent aggregation behavior represents shoaling (independent movement by fish in the simple aggregation of fish attracted to stimuli) and schooling, the mutual attraction of individual fish to one another (Pavlov and Kasumyan, 2000).
Our finding of a marked increase in travel distance to the first set for the 3.2 km and 4.8 km restriction regimes indicates that the costs associated with vessel movement will increase, perhaps substantially. Of consideration to the fishing industry are the imposed cost of movement to the first set and among subsequent sets of the trip. Economic costs to the fishing industry are comprised of fixed and variable costs (Daurès et al., 2013). Variables costs, such as fuel, are linked to fishing effort, whereas fixed costs are constant and not impacted by the level of fishing effort (e.g., wages, repairs, and maintenance). For many fisheries, fuel costs are a major constraint to their profitability (Daurès et al., 2013; Parker et al., 2015). Parker et al. (2015) documented that fleet-specific fuel costs range from 5.5 to 34.9% of total operating revenues and reported that the cost of fuel and lubricants in purse seine fleets is estimated to be 10.8% of total revenue. In addition to the increased costs to the fishery, the environmental impacts of energy consumption have received increased attention in fishery operations (Schau et al., 2009) although small pelagic fisheries (like Gulf Menhaden) are among the least environmentally impactful ways to obtain animal protein (Hilborn et al., 2018). We find that the distance traveled between successive sets (set 2+) exhibited much less contrast for each simulated restriction regime relative to the current restriction scenario, likely as a result of the aggregation dynamics of the stock in the coastal zone and the improvements in fishing power as a result of spotter planes and communication among vessel captains. The Gulf Menhaden fishery is currently composed of two vertically integrated fishing concerns where vessels are either owned or leased, thus there is likely extensive cooperation among fishing captains.
The exclusion of fishing in the nearshore coastal zone under the various restriction regimes evaluated, serves to concentrate the intensity of fishing (allocation of sets) to regions peripheral to the exclusion areas in the nearshore. In each of the scenarios there is a positive reallocation of sets west of Terrebonne Bay, Louisiana. We show that there is a reduction in total harvest and the magnitude of the reduction in harvest is dependent on the size of the restriction zone. Our analysis of the spatial impacts of restrictions indicate that fishers will likely allocate their effort to regions just adjacent to the restriction region. Previous work (Kellner et al., 2007) has shown that the strategy of ‘fishing the line’ or fishing immediately outside a region restricted to fishing is an optimal strategy for fishers exploiting the spillover of living marine resources from marine protected areas. Because we did not model the movement dynamics of the stock, in response to fishing, our estimates of the spatial analysis of the intensity of fishing may be more uniformly distributed than what may happen in practice. An implication of the change in spatial allocation is the impacts on the monitoring system of the fishery. The model used for the assessment of Gulf Menhaden is an age-structured model that uses fishery-dependent estimates of age composition for the determination of selectivity (SEDAR, 2018) and are the only information about age composition of the stock. Altering the spatial patterns of the fishery through restriction may impact the continuity of the estimates of age composition in ways that are not well understood.
In this work we use simulation of five years of data to understand the impacts to the fishery of candidate spatial closures. We find that the magnitude of the reduction in harvest could be large and for the 4.8 km restriction, result in a decrease to the harvest of 12.7 to 15.4%. A primary consideration of the impact of proposed regulations, not evaluated here, is that vessels originating from different plants will be impacted by spatial closures differently due to the spatial and temporal distribution of the stock in the region. Our analysis did not examine the plant-specific impacts of regulations and presupposes that fishers will exploit the entire range of the stock. Because of the vertically integrated nature of the fishery, where most vessels have ‘home’ ports, it is likely that some fishers will be more deleteriously impacted than others by spatial regulation because of the location of their plant relative to the distribution of the stock. Spatial closures are thus a regulation that will have asymmetric impacts on fishers. We note that an implicit assumption in this analysis is that for those trips that would have been excluded because of spatial restrictions, the fishers would make a trip outside the restriction zone. If excluded trips are not reallocated outside the restriction zone, then the estimates in the magnitude of harvest we report would be biased. Thus, the magnitude in reduction in harvest that we report should be considered minimum estimates given the assumptions used in the analysis. Changes in the distribution of the reduction factories (the Cameron, Louisiana factory is now permanently closed), the quality of the data used in this work (the CDFR data were not originally digitally recorded but are now recorded digitally), and uncertainty about the distribution of the stock in areas that are not currently fished are all sources of uncertainty in the data used in the modeling approach and impact the estimates in the reduction of harvest.
Another issue to resolve before implementing fishery regulations is to understand the impacts on the resource and the management system. Our work shows that the fishers will have to make longer movements, depending on the month, and that set-specific CPUE will be reduced. The restriction on effort, imposed by the spatial restriction, will impact fishers by necessitating greater fuel and perhaps maintenance costs. Given the status determination in recent years that the stock is not overfished and that overfishing is not occurring, evidence of other benefits to the ecosystem is the primary motivation for closures. There continues to be significant information gaps in the primacy of Gulf Menhaden in predator diets. These aspects should be explored prior to making regulatory changes, especially in Louisiana’s state waters where most of the harvest is made. An additional need is to better understand the needs and desires of recreational and commercial fishers in the region, through investigation of the sociological and human dimensions of resource use. A management strategy that considers fisher behavior should be explored to maximize outcomes for the larger fishing community that includes recreational and commercial participants and the sustainability of the resource.
Data availability statement
The original contributions presented in the study are included in the article/supplementary material. Further inquiries can be directed to the corresponding author.
Author contributions
RL: Conceptualization, Data curation, Formal Analysis, Investigation, Methodology, Writing – original draft, Writing – review & editing, Funding acquisition, Project administration, Resources, Software, Supervision, Validation, Visualization. WW: Validation, Visualization, Writing – review & editing. RM: Investigation, Methodology, Visualization, Writing – original draft. RT: Formal Analysis, Methodology, Writing – original draft. DD: Formal Analysis, Methodology, Writing – original draft.
Funding
The author(s) declare that no financial support was received for the research, and/or publication of this article.
Conflict of interest
The authors declare that the research was conducted in the absence of any commercial or financial relationships that could be construed as a potential conflict of interest.
Generative AI statement
The author(s) declare that no Generative AI was used in the creation of this manuscript.
Any alternative text (alt text) provided alongside figures in this article has been generated by Frontiers with the support of artificial intelligence and reasonable efforts have been made to ensure accuracy, including review by the authors wherever possible. If you identify any issues, please contact us.
Publisher’s note
All claims expressed in this article are solely those of the authors and do not necessarily represent those of their affiliated organizations, or those of the publisher, the editors and the reviewers. Any product that may be evaluated in this article, or claim that may be made by its manufacturer, is not guaranteed or endorsed by the publisher.
Author disclaimer
The scientific results and conclusions, as well as any views or opinions expressed herein, are those of the author(s) and do not necessarily reflect those of NOAA or the Department of Commerce.
References
Abbott J. K. and Haynie A. C. (2012). What are we protecting? Fisher behavior and the unintended consequences of spatial closures as a fishery management tool. Ecol. Appl. 23, 762–777. doi: 10.1890/11-1319.1
Blomo V. J., Orbach M., and Maiolo J. R. (1988). Competition and conflict in the U.S. Atlantic coast menhaden industry. Am. J. Econ Sociology 47, 41–60. doi: 10.1111/j.1536-7150.1988.tb02005.x
Brown-Peterson N. J., Leaf R. T., Schueller A. M., and Andres M. J. (2017). Reproductive dynamics of Gulf menhaden (Brevoortia patronus) in the northern Gulf of America: effects on stock assessments: Suppl. Fig. 2 and Suppl. Table. Fishery Bull. 115, 284–299. doi: 10.7755/FB.115.3.2
Collins R. C. (1997). The menhaden fishery controvery: a convening analysis (VSG-97-05). Institute for Environmental Negotiation, University of Virginia, and Virginia Sea Grant College Program.
Copeland B. J. (1965). Fauna of the Aransas Pass Inlet, Texas. I. Emigration as shown by tide trap collections. Publications Institute Mar. Sci 10, 9–21.
Cury P. M., Boyd I. L., Bonhommeau S., Anker-Nilssen T., Crawford R. J. M., Furness R. W., et al. (2011). Global seabird response to forage fish depletion - One-third for the birds. Science 334, 1703–1706. doi: 10.1126/science.1212928
Daurès F., Trenkel V. M., and Guyader O. (2013). Modelling the fishing costs of French commercial vessels in the Bay of Biscay. Fisheries Res. 146, 74–85. doi: 10.1016/j.fishres.2013.03.022
Deegan L. A., Peterson B. J., and Portier R. (1990). Stable isotopes and cellulase activity as evidence for detritus as a food source for juvenile Gulf menhaden. Coast. Estuar. Res. Fed. 13, 14–19. doi: 10.2307/1351427
de Silva J. A., Condrey R. E., and Thompson B. A. (2001). Profile of shark bycatch in the U.S. Gulf of america menhaden fishery. North Am. J. Fisheries Manage. 21, 111–124. doi: 10.1577/1548-8675(2001)021<0111:POSBIT>2.0.CO;2
Dimarchopoulou D., Dogrammatzi A., Karachle P. K., and Tsikliras A. C. (2018). Spatial fishing restrictions benefit demersal stocks in the northeastern Mediterranean Sea. Sci. Rep. 8, 5967. doi: 10.1038/s41598-018-24468-y
Drymon J. M., Dedman S., Froeschke J. T., Seubert E. A., Jefferson A. E., Kroetz A. M., et al. (2020). Defining sex-specific habitat suitability for a northern gulf of america shark assemblage. Front. Mar. Sci 7, 35. doi: 10.3389/fmars.2020.00035
Geers T. M., Pikitch E. K., and Frisk M. G. (2014). An original model of the northern Gulf of America using Ecopath with Ecosim and its implications for the effects of fishing on ecosystem structure and maturity. Deep-Sea Res. Part II: Topical Stud. Oceanography 129, 1–13. doi: 10.1016/j.dsr2.2014.04.014
Gell F. R. and Roberts C. M. (2003). Benefits beyond boundaries: the fishery effects of marine reserves. Trends Ecol. Evol. 18, 448–455. doi: 10.1016/S0169-5347(03)00189-7
Hilborn R. (1985). Fleet dynamics and individual variation: why some people catch more fish than others. Can. J. Fisheries Aquat. Sci. 42, 2–13. doi: 10.1139/f85-001
Hilborn R., Banobi J., Hall S. J., Pucylowski T., and Walsworth T. E. (2018). The environmental cost of animal source foods. Front. Ecol. Environ. 16, 329–335. doi: 10.1002/fee.1822
Hobday A. J. and Hartmann K. (2006). Near real-time spatial management based on habitat predictions for a longline bycatch species. Fisheries Manage. Ecol. 13, 365–380. doi: 10.1111/j.1365-2400.2006.00515.x
Hoos L. A., Buckel J. A., Boyd J. B., Loeffler M. S., and Lee L. M. (2019). Fisheries management in the face of uncertainty: Designing time-area closures that are effective under multiple spatial patterns of fishing effort displacement in an estuarine gill net fishery. PloS One 14, e0211103. doi: 10.1371/journal.pone.0211103
Huvenne V. A. I., Bett B. J., Masson D. G., Le Bas T. P., and Wheeler A. J. (2016). Effectiveness of a deep-sea cold-water coral Marine Protected Area, following eight years of fisheries closure. Biol. Conserv. 200, 60–69. doi: 10.1016/j.biocon.2016.05.030
Kellner J. B., Tetreault I., Gaines S. D., and Nisbet R. M. (2007). Fishing the line near marine reserves in single speices and multispecies fisheries. Ecol. Appl. 17, 1039–1054. doi: 10.1890/05-1845
Langseth B. J., Purcell K. M., Craig J. K., Schueller A. M., Smith J. W., Shertzer K. W., et al. (2014). Effect of changes in dissolved oxygen concentrations on the spatial dynamics of the Gulf Menhaden fishery in the northern Gulf of America. Mar. Coast. Fisheries 6, 223–234. doi: 10.1080/19425120.2014.949017
Lassuy D. R. (1983). Species profiles: life histories and environmental requirements (Gulf of America): Gulf menhaden (The Team). U.S. Fish Wildl. Serv. Bioi. Rep. FWS/ OBS-82/11.2, 13 p
Leaf R. T. and Oshima M. C. (2019). Construction and evaluation of a robust trophic network model for the northern Gulf of America ecosystem. Ecol. Inf. 50, 13–23. doi: 10.1016/j.ecoinf.2018.12.005
Lester S. E., Halpern B. S., Grorud-Colvert K., Lubchenco J., Ruttenberg B. I., Gaines S. D., et al. (2009). Biological effects within no-take marine reserves: a global synthesis. Mar. Ecol. Prog. Ser. 384, 33–46. doi: 10.3354/meps08029
Little L. R., Kuikka S., Punt A. E., Pantus F., Davies C. R., Mapstone B. D., et al. (2004). Information flow among fishing vessels modelled using a Bayesian network. Environ. Model. Softw. 19, 27–34.
Marçalo A., Breen M., Tenningen M., Onandia I., Arregi L., and Gonçalves J. M. S. (2018). Mitigating slipping-related mortality from purse seine fisheries for small pelagic fish: Case studies from european atlantic waters. Eur. Landing Obligation: Reducing Discards Complex Multi-Species Multi-Jurisdictional Fisheries, 297–318. doi: 10.1007/978-3-030-03308-8_15
Nelson K. (2016a). Jackson County supervisors vote to keep menhaden boats one mile out (Biloxi, Mississippi: Sun Herald).
Nelson K. (2016b). CMR denies Jackson County’s request for 1-mile menhaden fishing limit (Biloxi, Mississippi: Sun Herald).
Nelson W. R. and Ahrenholz D. W. (1986). Populaiton and fishery characteristics of gulf menhaden, brevoortia patronus. Fishery Bull. 84, 311–325.
Nicholson W. R. (1978). Gulf menhaden, Brevoortia patronus, purse seine fishery: catch, fishing activity, and age and size composition 1964–1973. NOAA Tech. Rep. NMFS SSRF-722, 1–8.
Oshima M. C. M. and Leaf R. R. T. (2018). Understanding the structure and resilience of trophic dynamics in the northern Gulf of America using network analysis. Bull. Mar. Sci 94, 21–46. doi: 10.5343/bms.2017.1056
Parker R. W. R., Hartmann K., Green B. S., Gardner C., and Watson R. A. (2015). Environmental and economic dimensions of fuel use in Australian fisheries. J. Cleaner Production 87, 78–86. doi: 10.1016/j.jclepro.2014.09.081
Pavlov D. S. and Kasumyan A. O. (2000). Patterns and mechanisms of schooling behavior in fish: a review. J. Ichthyology 40, S163.
Powers S., Hightower C., and Drymon M. (2013). Age composition and distribution of red drum (Sciaenops ocellatus) in offshore waters of the north central gulf of america: an evaluation of a stock under a federal harvest moratorium. Page Fishery Bull. 110, 283–292. doi: 10.7755/FB.110.3.2
Rabalais N. N., Turner R. E., and Scavia D. (2002). Beyond science into policy: gulf of america hypoxia and the mississippi river. BioScience 52, 129. doi: 10.1641/0006-3568(2002)052[0129:BSIPGO]2.0.CO;2
Raborn S., Mudrak P., and Naisbett-Jones L.. (2025). Characterization of bycatch for the menhaden purse seine fishery occurring off the coast of Louisiana (LGL Report No. 9, Final Report). LGL Ecological Research Associates, Inc. Unpublished report prepared for the Gulf States Marine Fisheries Commission.
Roberts C. M., Bohnsack J. A., Gell F., Hawkins J. P., and Goodridge R. (2001). Effects of marine reserves on adjacent fisheries. Science 294, 1920–1923. doi: 10.1126/science.294.5548.1920
Roithmayr C. M. and Waller R. A. (1963). Seasonal occurrence of brevoortia patronus in the northern gulf of america. Trans. Am. Fisheries Soc. 92, 301–302. doi: 10.1577/1548-8659(1963)92[301:SOOBPI]2.0.CO;2
Ruttan L. M. and Tyedmers P. H. (2007). Skippers, spotters and seiners: Analysis of the “skipper effect“ in US menhaden (Brevoortia spp.) purse-seine fisheries. Fisheries Res. 83, 73–80. doi: 10.1016/j.fishres.2006.08.022
Sagarese S. R., Nuttall M. A., Geers T. M., Lauretta M. V., Walter J. F. III, Serafy J. E., et al. (2016a). Quantifying the trophic importance of Gulf Menhaden within the northern Gulf of America ecosystem. Mar. Coast. Fisheries: Dynamics Management Ecosystem Sci 8, 23–45. doi: 10.1080/19425120.2015.1091412
Schau E. M., Ellingsen H., Endal A., and Aanondsen S. A. A. (2009). Energy consumption in the Norwegian fisheries. J. Cleaner Production 17, 325–334. doi: 10.1016/j.jclepro.2008.08.015
Smith J. W. (1991). The Atlantic and gulf menhaden purse seine fisheries: Origins, Harvesting technologies, biostatistical monitoring, recent trends in fisheries statistics, and forecasting. Mar. Fisheries Rev. 53, 28–41.
Smith J. W., Hall E. A., McNeill N. A., and O’Bier W. B. (2002). The distribution of purse-seine sets and catches in the gulf menhaden fishery in the northern Gulf of America 1994-98. Gulf America Sci 20, 2.
Suttkus R. D. (1956). Early life history of the Gulf menhaden, Brevoortia patronus. Pages 390–406 Louisiana. Trans. North Am. Wildlife Conf. 21, 390–406.
Tsagarakis K., Vassilopoulou V., Kallianiotis A., and Machias A. (2012). Discards of the purse seine fishery targeting small pelagic fish in the eastern Mediterranean Sea. Scientia Marina 76, 561–572. doi: 10.3989/scimar.03452.02B
Turner S. J., Thrush S. F., Hewitt J. E., Cummings V. J., and Funnell G. (1999). Fishing impacts and the degradation or loss of habitat structure. Fisheries Manage. Ecol. 6, 401–420. doi: 10.1046/j.1365-2400.1999.00167.x
van Etten J. (2017). R package gdistance: distances and routes on geographical grids. J. Stat. Software Articles 76, 1–21. doi: 10.18637/jss.v076.i13
Vaughan D. S., Levi E. J., and Smith J. W. (1996). Population characteristics of gulf menhaden, Brevoortia patronus. NOAA Tech. Rep. NMFS 125, 1–18.
Vaughan D. S., Shertzer K. W., and Smith J. W. (2007). Gulf menhaden (Brevoortia patronus) in the U.S. Gulf of America: Fishery characteristics and biological reference points for management. Fisheries Res. 83, 263–275. doi: 10.1016/j.fishres.2006.10.002
Williams A., Schlacher T. A., Rowden A. A., Althaus F., Clark M. R., Bowden D. A., et al. (2010). Seamount megabenthic assemblages fail to recover from trawling impacts. Mar. Ecol. 31, 183–199. doi: 10.1111/j.1439-0485.2010.00385.x
Keywords: spatial closures, fleet movement, effort displacement, Gulf Menhaden (Brevoortia patronus), catch per unit effort (CPUE)
Citation: Leaf RT, Wu W, Mroch RM, Trigg R and Duval D (2025) Examining the impacts of spatial closures in the Gulf Menhaden fishery. Front. Mar. Sci. 12:1567714. doi: 10.3389/fmars.2025.1567714
Received: 27 January 2025; Accepted: 09 October 2025;
Published: 12 November 2025.
Edited by:
Erlend Moksness, Blue Growth & Marine Services, NorwayReviewed by:
David Chagaris, University of Florida, United StatesTannaz Alizadeh Ashrafi, UiT The Arctic University of Norway, Norway
Copyright At least a portion of this work is authored by Ray M. Mroch on behalf of the U.S. Government and as regards Dr. Mroch and the U.S. Government, is not subject to copyright protection in the United States. Foreign and other copyrights may apply. This is an open-access article distributed under the terms of the Creative Commons Attribution License (CC BY). The use, distribution or reproduction in other forums is permitted, provided the original author(s) or copyright owner(s) are credited and that the original publication in this journal is cited, in accordance with accepted academic practice. No use, distribution or reproduction is permitted which does not comply with these terms.
*Correspondence: Robert T. Leaf, cm9iZXJ0LmxlYWZAdXNtLmVkdQ==