 Steffen S. Bach1*†
 David P. Robinson2,3
 Mohammed Y. Al Jaidah1
 Simon J. Pierce4,5Prasad Thoppil6
 Christoph A. Rohner4*
- 1Qatar Whale Shark Project, Qatar Ministry of Municipality and Environment, Research Department, Doha, Qatar
- 2Sharkwatch Arabia, Research Department, Dubai, United Arab Emirates
- 3Sundive Research, Research Department, Byron Bay, NSW, Australia
- 4Marine Megafauna Foundation, Research Department, West Palm Beach, FL, United States
- 5University of the Sunshine Coast, School of Science, Technology and Engineering, Sippy Downs, QLD, Australia
- 6Ocean Sciences Division, U.S. Naval Research Laboratory, Stennis Space Center, Hancock County, MS, United States
Whale sharks seasonally aggregate near oil and gas platforms in Qatar to feed on fish spawn, creating one of the world’s largest aggregations of the species. We used passive acoustic telemetry to examine their fine-scale movements, residency, and seasonality and investigate whether the platforms influence their space use in this area. Tags had a mean retention of 161 ± 186 days (standard deviation, SD) and 32 of the 117 tags were recorded in multiple years in the acoustic array (21 stations). Most detections were recorded from May to September, confirming that this whale shark aggregation is seasonal. Whale sharks stayed up to 77 consecutive days in the array (mean = 16 ± 12.51 days) and had a mean residency index Rmax of 0.31. Although most detections (65%) were made at a single receiver located near a platform, here designated P1, an ‘open water’ receiver near this location also had a high proportion of total detections (8.5%). Receivers at other platforms, located away from this specific site, had relatively few detections. The distance from P1, identified as the center of the aggregation, was the main explanatory variable in a GAM. Whale shark aggregations were routinely observed feeding on tuna spawn at the surface at this location, with the eggs (and hence whale sharks) moving with the current through the day, and moving through the array as they did so. Whale sharks then swam against the current in the late afternoon and at night to relocate back to near the presumed tuna spawning site, close to P1, again in the early morning. Rather than being generally associated with platforms, whale sharks were clearly associated with a specific feeding location close to P1. Our results highlight the importance of this small feeding area for whale sharks, which face a high threat level in the region.
Introduction
Marine pelagic species live in a vast environment that, despite seeming homogenous, is characterized by spatiotemporal variation in biological, chemical, and physical parameters (Sims et al., 2008). These heterogeneous conditions result in a patchy resource landscape, with biological diversity and productivity concentrated in relatively small areas, such as in fronts, near seamounts and oceanic islands, or even around anthropogenic structures (Acha et al., 2015; Rowden et al., 2010; Snodgrass et al., 2020). These productive areas influence the distribution of pelagic animals and can be preferred aggregation sites (Morato et al., 2010). These aggregation sites are commonly important to the ecology and social behaviors of marine species (Genin, 2004; Magurran, 1990; Ritz et al., 2011; Sims et al., 2000). Such aggregations may, however, also increase a species vulnerability to human-induced threats (Tobin et al., 2013), and targeted fishing of aggregations can result in severe population declines (Rose and Kulka, 1999; Srinivasan et al., 2012). Fish aggregating devices (FADs) exploit the same principle and target commercially important species, such as tuna (Fonteneau et al., 2000). Managing the exploitation of aggregation sites, and ensuring their persistence, is therefore an important consideration in the conservation of threatened pelagic species.
Whale sharks Rhincodon typus aggregate in ~30 currently known hotspots, termed ‘constellations’, in tropical and subtropical waters around the world (Norman et al., 2017b; Rohner et al., 2022). Aggregation sites are important to whale sharks that are otherwise solitary and wide-ranging, and these sites are thus often focal areas for conservation management of this Endangered species (IUCN Red List of Threatened Species; Pierce and Norman, 2016). Many constellations are seasonal and are driven by high prey availability (Nelson and Eckert, 2007; Rohner et al., 2015). Prey taxa vary among sites and include small fishes, sergestids, euphausiids, mysids, copepods, crab larvae, chaetognaths, and fish eggs, among others (Rohner et al., 2022). Feeding in high-density, but ephemeral, prey patches is likely to be crucial to whale shark nutrition, as they may undergo long periods of fasting between productive feeding bouts (Wyatt et al., 2019). Examining their residency and small-scale movements within an aggregation site can thus improve our understanding of the importance of these sites and aid in their protection.
Although whale sharks are often seasonally sighted at the surface in constellations, passive acoustic telemetry has revealed that some whale sharks may be present, but not sighted, at other times (Cagua et al., 2015), emphasizing the importance of sightings-independent methods to examine seasonality and habitat use. The percentage of sharks that remained in the constellation areas throughout the year varied among different study sites, highlighting the need for site-specific investigations (Cagua et al., 2015; Cochran et al., 2019; Norman et al., 2017a). Satellite-tagged whale sharks may move 1000’s of kilometers away from aggregation sites (Robinson et al., 2017; Hearn et al., 2022), though many individuals return to constellations in subsequent seasons (Norman et al., 2017b; Robinson et al., 2016). Their fine-scale movements and temporal shifts in space use within constellations are less understood. Off Mafia Island in Tanzania, the whale shark core habitat shifted over the year, from feeding areas close to shore during the main sighting season, to a few kilometers offshore between seasons (Rohner et al., 2020). Elsewhere, studies have typically focused on seasonality and residency rather than fine-scale movements.
Segregation by sex and size is a ubiquitous characteristic among whale shark constellations. There is a substantial bias towards male sharks at most locations, and small (0.6–3 m total length TL) or large (>8 m TL) individuals are rarely seen at most sites (Araujo et al., 2022; Rohner et al., 2022). One exception to the sexual segregation has been documented in the Red Sea, where juvenile females and males occur in an even ratio. Passive acoustic telemetry and satellite tagging showed no differences in residency or wider-scale movements between the juveniles of both sexes (Cochran et al., 2019). Another exception is the offshore island of St Helena in the mid-Atlantic, where mostly large, mature whale sharks are sighted (Acuña-Marrero et al., 2014; Perry et al., 2020). At present, it is unclear whether these large sharks display temporal changes to their habitat use within constellations, or how their small-scale movements compare to those of smaller individuals.
One of the largest whale shark constellations in the world has been documented in oil and gas fields off the coast of Qatar in the Arabian Gulf. Whale sharks seasonally gather here from May–Sep and primarily feed on freshly-spawned fish eggs from mackerel tuna (Euthynnus affinis) (Robinson et al., 2013). Densities of up to 100 sharks in a 1 km2 area have been reported (Robinson et al., 2013). More males (69%) than females are seen off Qatar, and there is an unusually large proportion of mature males (63% of males) and even some large females, unlike the juvenile bias in other regional hotspots (Norman et al., 2017b), making it possible to examine small-scale habitat use and residency across a broad size range of sharks in a population for the first time.
The whale shark constellation in Qatar occurs in an area of active oil and gas extraction known as the Al Shaheen field and the North field. The first reports of this constellation were made by workers on oil and gas platforms, and it is unknown whether whale sharks aggregated in this area before the establishment of platforms (Robinson et al., 2013). Platforms elsewhere have also reported the presence of whale sharks (McKinney et al., 2012; Thomson et al., 2021; D’Antonio et al., 2025) and more generally attract migratory animals, such as tuna, billfish, and sharks (Snodgrass et al., 2020). To test whether it is the platforms specifically that attract the sharks, or whether the platforms are simply in the general area in which fish eggs are available, or attract spawning tuna that are protected from fishing here, observations at and around several platforms are needed.
To that end, we used passive acoustic telemetry to examine whale shark movements within their aggregation site in Qatar. Receivers were placed both near platforms and away from platforms, in open water, to test for an association between whale sharks and these structures. We also investigated whale shark residency and the seasonality of this constellation, and examined the core habitat and the timing of their movements between stations in the receiver array.
Methods
Study area
The Arabian Gulf, ‘the Gulf’ hereafter, is an almost enclosed sea that is connected to the Gulf of Oman and the Indian Ocean by the narrow Strait of Hormuz in the east (Figure 1A). Located in the arid sub-tropics and surrounded by deserts, the Gulf is one of the warmest and most saline waters on earth (Reynolds, 1993; Sheppard et al., 2010). Surface water temperatures fluctuate strongly across seasons, from 20°C in winter to up to 35°C in summer in the deeper, central areas, where whale sharks have been sighted around oil and gas platforms (Robinson et al., 2013, 2017). Platforms in the study area are located ~80 km north-east off the coast of Qatar, where water depth ranges from 50–70 m (Figure 1A). The first fixed platforms related to the Al Shaheen oil field were established in 1996, while the latest was put in place in 2009. There are 34 structures in total, with some interconnected through gangways, resulting in 9 separate platform locations. The subsurface section of the platform structures occupies on average an area of 2,500 m2. Whale sharks have mostly been sighted in this area between May–September, here termed the “season” (Robinson et al., 2013).
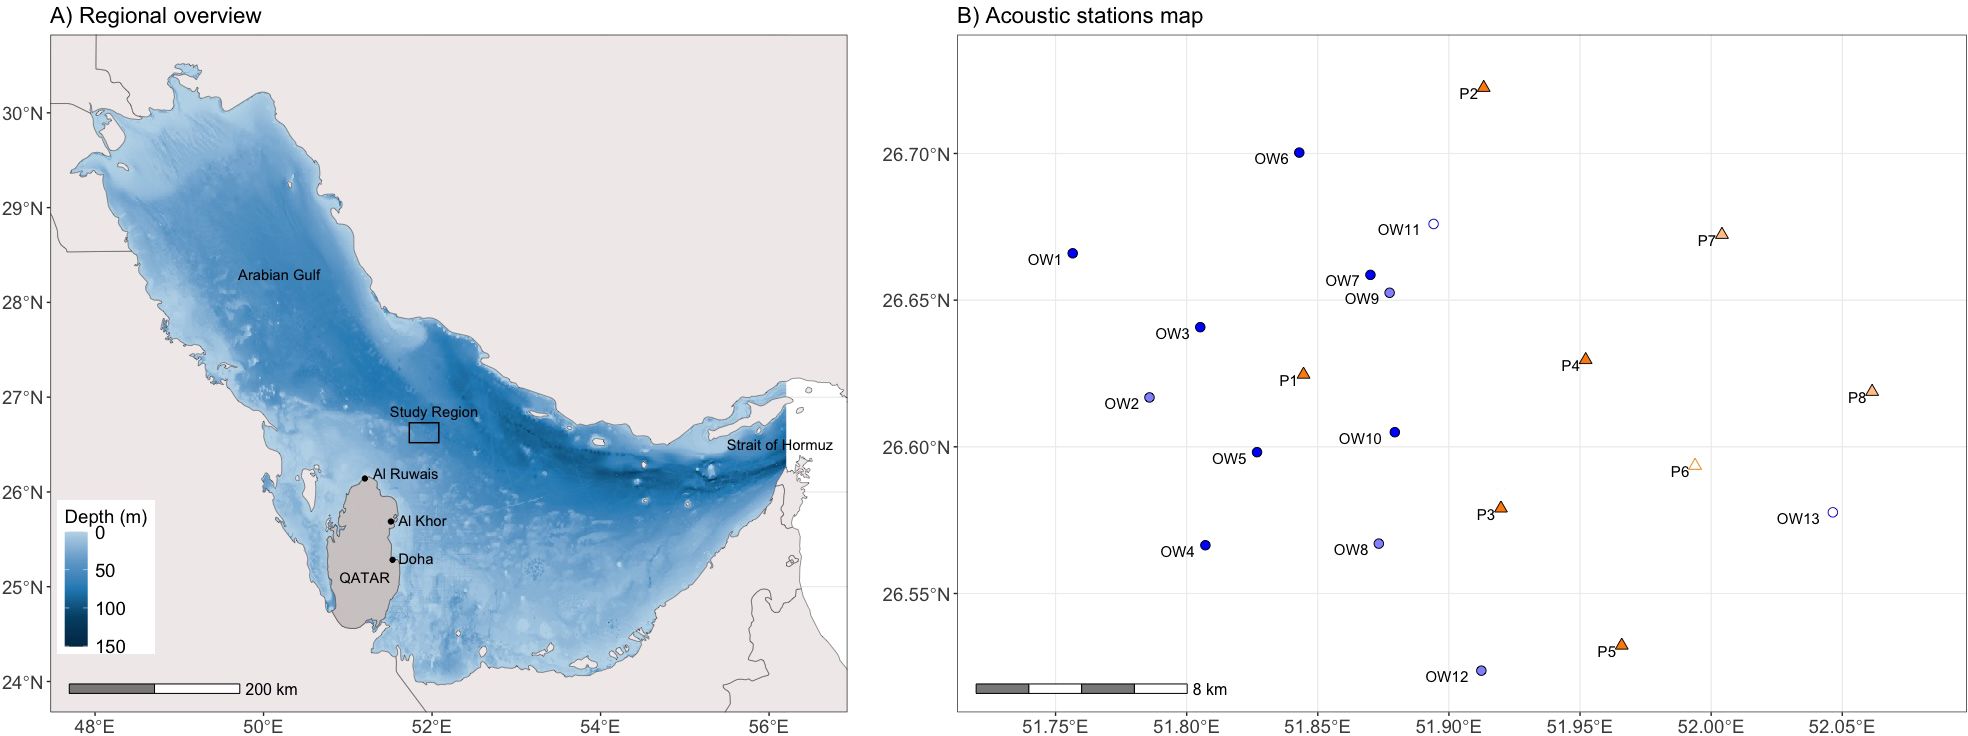
Figure 1. (A) Regional overview map. (B) The acoustic receiver array off Qatar with platform-associated stations (P1–P8, orange triangles) and open water stations (OW1–OW13, blue circles). Empty symbols indicate stations that were lost before the first data download, and the light colors represent stations that were only used in the first season (2012/13).
Acoustic array
Acoustic monitoring equipment was deployed, and whale sharks were tagged during 49 boat-based surveys between 2012–2016. The point of departure was the port of Al Khor or Al Ruwais on the north coast of Qatar (Figure 1A). Permissions for fieldwork and data collection on whale sharks were given by the Qatar Ministry of Municipality and Environment. Analyses were conducted in R version 4.3.1 (R Core Team, 2022).
Acoustic receivers (Innovasea, VR2W) were deployed at 21 stations (Figure 1B). To test whether whale sharks had an affinity for underwater structures, 8 receivers were deployed ~200 m off platforms (here named P1–P8, east to west) and 13 receivers were located at a minimum of 4 km away from platforms in open water (OW1–OW13). Receivers in open water were placed around the area where most whale sharks were seen surface feeding in previous surveys (Robinson et al., 2013). In the first season (2012), the array comprised 12 stations at seven platforms and five open water locations. The array was then adjusted from the second season onwards (2013–2016) to remove stations with few detections in the east of Al Shaheen, and add stations around P1, as P1 recorded the most detections (74%) in the first season, to examine the sharks’ finer-scale space use in that area. There were 12 stations at five platforms and seven open water locations from 2013 onwards.
Stations were in deep water (40–60 m) and required acoustic releases to retrieve receivers. We attached receivers to a cement anchor (>20 kg) with an acoustic release (SubSeaSoncic AR-60-E Acoustic Release Unit) and four trawl floats with a total buoyancy of 18.8 kg (600 meters working depth and 30 kg m-1 impact strength). Receivers were thus located ~4 m above the sandy seafloor. To retrieve receivers, the acoustic releases were activated with a transducer (SubSeaSonic Acoustic Release Interrogator Model ARI-60), thereby detaching from the anchor and floating to the surface by the attached floats. Receivers were regularly downloaded and redeployed, but some gaps in the coverage exist due to operational constraints (Supplementary Figure S1). We focused receiver deployments on the tuna spawning season from May–Sep, when whale sharks formed aggregations (Robinson et al., 2013), but also had some receivers active in other months to test if whale sharks were present in the non-spawning season (Supplementary Figure S1). Receivers at three stations (P6, OW11, and OW13) were lost before any data could be downloaded and were excluded from the analyses. Considering the homogenous and flat underwater topography of the area, we assumed that all receivers had a similar detection radius. An informal range test was performed using a high-frequency sentinel tag deployed for 5 min in ~5 m depth at a distance of up to 2 km away from the receiver in 200 m increments. This test was repeated at several stations and indicated a ~1,000 m detection radius, including at platform stations, suggesting that platform noise (low frequency) or benthic marine life associated with pipelines (that connect all platforms along the seafloor) did not significantly influence detection capability for pelagic whale sharks. It is possible that there was an occlusion zone at the platform itself, which we could not test, as boats are not allowed within 200 m of the platform. It is also possible that noise from support and supply vessels, which irregularly use the area, influenced detections.
Whale shark tagging
Whale sharks were encountered and tagged with acoustic tags (Innovasea V16-4L, 69 kHz, transmission power: 152–158 dB re 1 uPa @1 m) at the surface during their feeding aggregations. We were unable to photo-ID some (23 of 125) of the tagged individuals, and it is therefore possible that some of these individuals were tagged more than once over the course of the study, after they lost their initial tag. We visually determined the sex and estimated the total length (TL) of most (82%) tagged sharks (Supplementary Table S1). Tags were connected with a 10–15 cm long dyneema tether to a titanium dart, which was inserted into the skin below the 1st dorsal fin of the shark. In 2012 and 2013 we used a pole spear to attach tags (n = 43), and in 2014–2016 we used a pneumatic spear gun to deploy the tags (n = 82) in an attempt to improve tag retention and to effectively tag larger individuals. Tags had an expected battery life of 2,516 days but often fell out of the shark prematurely (Table 1). Tag #72 fell off the shark next to station P1 on 18 Aug 2015 (continuous detections from then on) so we removed all detections thereafter before analyzing the data. Tag retention was defined as the number of days between tag deployment and its last detection in the array. Therefore, retention is a minimum estimate, as whale sharks likely migrated away from the array with their tags attached and did not return, or lost their tags elsewhere before returning.
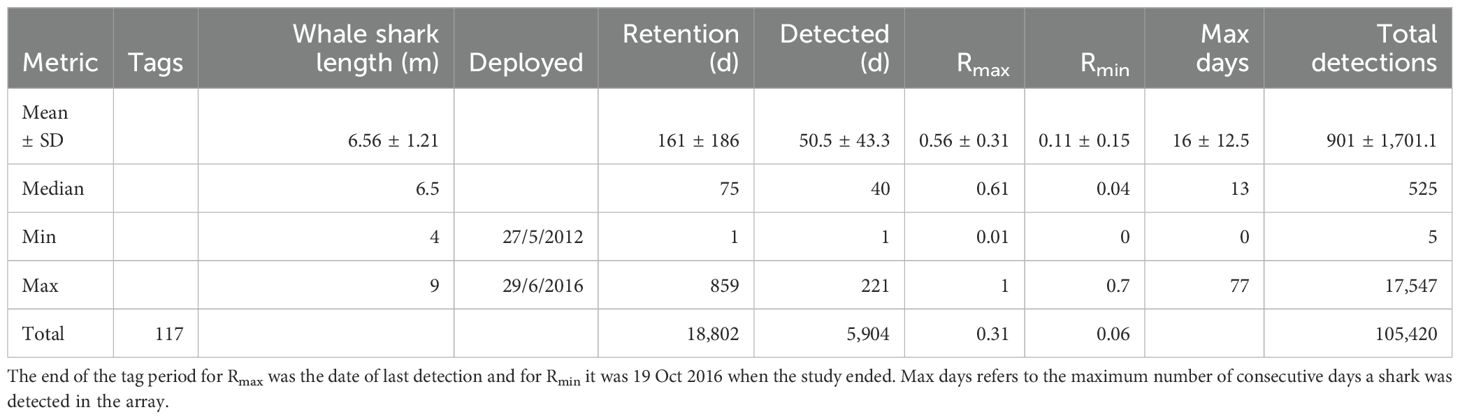
Table 1. Summary of whale sharks tracked in this study (43 females; 57 males; 17 unknown sex).
Residency
To investigate the importance of the feeding aggregation area to tagged whale sharks, we calculated two commonly-used residency indices, Rmax and Rmin (Cochran et al., 2019; Rohner et al., 2020). Rmax was the proportion of days a shark was detected in the array over the number of days between tag deployment and its last detection. Indices were calculated for each shark individually and for all sharks combined (not the mean of the individual scores) based on the sum of detection and deployment days. The advantage of Rmax is that it considers premature tag detachment, which occurs frequently with external tags on whale sharks (Rohner et al., 2020). A potential disadvantage is that it may overestimate residency for individuals that lose their tags quickly. To test this potential bias on the combined residency estimate, we also calculated RmaxS only for individuals with >30 day between the first and last detection (n = 90), thus excluding those with early tag loss (n = 27). As the result was similar (0.30) to the overall Rmax (0.31) we continued with Rmax. Rmin was the proportion of days a shark was detected over the number of days between tag deployment and the end of the study, 19 Oct 2016, when the last receiver was recovered. This index ignores premature tag detachment and is thus likely to be an underestimate of residency overall. Due to tag loss, individuals tagged nearer to the end of the study will have a higher Rmin than those tagged at the start of the study. We also calculated the number of consecutive days sharks were detected in the array. The number of seasons in which each shark was detected was a longer-term measure of site fidelity, although it was biased by the relatively short tag retention. Although these metrics are termed ‘residency’ in acoustic telemetry studies, they are measuring seasonal site fidelity in our study, as evidenced by the strong seasonal pattern in whale shark presence.
Space use
We first investigated the overall daily space use for all whale sharks combined. We used centers of activity (COA), calculated as one location per 24 h, using the V-Track package (Campbell et al., 2012). These COA are position estimates based on weighted means of the number of detections at stations over a time period. They can thus be spread across the array, estimating the location of animal activity at a continuous spatial scale, rather than being restricted to receiver locations only (Simpfendorfer et al., 2002). We then calculated their core (50%; “core habitat”) and extent (95%; “extent home range”) kernel utilization distributions (KUD) based on the COA locations using the adehabitat package (Calenge, 2006).
Association with platforms
To test whether platform location influenced where whale sharks aggregate, we constructed generalized additive models (GAM) in the mgcv package (Wood, 2011), with the relative number of detections per day per station as the response variable, i.e. the number of detections at a station divided by the number of active tags. Tags are defined as active on a day if the day is between tag deployment and the last detection, as per Rmax, to account for tag loss over the course of the study. Predictors included station type (platform or open water) as a categorical variable, and distance from station P1 and day of year as continuous variables. The distance from P1 was used because the space use analysis showed that it is the center of the aggregation (Figure 1B). Day of year was used to account for the seasonal effect and was modelled with a cyclic cubic regression spline to wrap around at the boundary from the last to the first day of the year. Current direction was not included because it had little variation (see “temporal patterns” below). We constructed seven models (all combinations of predictors) and compared their performance with AIC to select the best model. We highlight that the large detection radius means that whale sharks detected at a platform receiver may not have been in very close proximity to the platform structure (up to 1.2 km away), but were closer to platforms than at open water receivers, which were at least 4 km away from platforms.
Seasonality
We examined seasonal trends in whale shark visitation to compare with visual and satellite telemetry results that have shown that whale sharks frequent Al Shaheen between May–Sep (Robinson et al., 2016, 2017). We binned the total number of detections per active tag in the whole array per month and compared the May–Sep mean to the Oct–Apr mean with a t test. We used this relative measure to account for the different number of tags active in the different months. We also binned the number of unique tags detected per month and the percentage of detected tags from the number of available tags in that month, with the end of tag attachment taken as the last detection, as per Rmax. To investigate fine-scale variations in space use over the season, we calculated habitat use metrics, including the 50% and 95% core KUD, for the two seasons, and also for each month within the whale shark season from May–Sep.
Temporal patterns
Day and night were assigned for each detection by deriving the sunset and sunrise time for each day with the StreamMetabolism package (Sefick, 2016). We wanted to assess how whale sharks move within the aggregation site over the course of the day. Previous surveys have shown that whale sharks consistently feed on fish eggs at this site (Robinson et al., 2013). Since fish eggs drift at the surface with the current, we set out to examine whether whale sharks move with the eggs. Our field observations during surveys confirmed this and showed that the predominant current flows from northwest to southeast. We therefore optimized the receiver locations in 2013, after the initial first season, to have two transects of acoustic receivers from north-west to south-east and from north-east to south-west. We then binned detections every 30 min and calculated the proportion of detections for each 30-min bin at each station. To investigate if the peak of activity follows the drift of eggs with the current, we then created five Hierarchial Generalized Additive Models (HGAM) (Pedersen et al., 2019) with the mgcv package (Wood, 2011). The response variable was the proportion of detections per 30-min bin and the predictors were the 30-min bins nested within station with a factor-smooth interaction term to model the interaction with station and a cyclic spline to wrap around at the boundaries as the first (00:00 h) and last (23:30h) bins are next to each other (Supplementary Table S3). Models varied in how they incorporated station effects: either as random effects, global smoothers with station-specific deviations, or station-specific smoothers with or without a global pattern (Supplementary Table S3). We used a normal distribution (gaussian) appropriate for a continuous response variable, and used the Restricted Maximum Likelihood (REML) method for estimating parameters in the HGAM. The best model was selected based on examination of the raw data, an AIC comparison, and inspection of model outputs (Pedersen et al., 2019) (Supplementary Table S3, Supplementary Figures S4, S5). Two models had similar results and were within 2 AIC scores: model GS with a global smoother and group-level smoothers that have the same wiggliness, and model S without a global smoother but with group-level smoothers with the same wiggliness. Since overall trends were not common to all stations (e.g. station OW10, Supplementary Figure S4) we used model S as the best model as it made sense for our data. We then predicted the fit and the standard error to plot how the proportion of detections at each station along the northwest-to-southeast transect varies over the course of the day. The proportion of detections, rather than the number of detections, allowed us to compare stations with different levels of activity. We also derived the movement segments of whale sharks among stations, and defined a move as an occurrence of an individual being detected at a subsequent station within 3h of its first detection at the original station. This time step was used because whale sharks moved slowly through the array while feeding on drifting fish eggs, and shorter time steps resulted in few movement trajectories. We then selected the first detection at each station within a move to assess at what time of day these moves occurred.
Currents
To assess the likely path of floating fish eggs after a spawning event, likely occurring near the seafloor, we mapped surface currents in the area based on a regional, high-resolution ocean model for the Gulf region for the months of May–October during 2012–2016, overlapping with the seasonal whale shark sightings in this study. The details of the model configuration are given in Thoppil and Hogan (2010a). Briefly, the numerical model is the HYbrid Coordinate Ocean Model (HYCOM) with 1-km horizontal resolution and 16 hybrid layers in the vertical axis. The model domain extends northward from 22.7°N and westward from 59.4°E and has 1,217 × 945 × 16 grid points. The eastern boundary is treated closed but relaxed towards the Generalized Digital Environmental Model version 3 (GDEM3) seasonally varying temperature and salinity climatology. The surface forcing for the model comes from the three-hourly, 0.5° atmospheric fields of winds, air temperature, humidity, precipitation and solar radiation. Surface salinity is being relaxed to the GDEM3 climatology. This configuration of the Gulf model (no tidal forcing) has previously been used for other studies (Thoppil and Hogan, 2009, 2010a, 2010b). These studies have demonstrated the model’s ability to reproduce many salient features of the circulation and water masses in the Gulf, including the evolution of a series of cyclonic eddies during summer.
Results
A total of 125 acoustic tags were deployed between May 2012 and June 2026. Eight tags, most deployed towards the end of the study in 2016 (Supplementary Table S1), were never recorded on the receivers, leaving 117 tags for analysis (Table 1). These were deployed on 43 females, 57 males, and 17 sharks of unknown sex (Table 1). Tracked whale sharks ranged from 4–9 m in total length, with a mean of 6.6 m (± 1.21 m SD). Males (6.7 ± 1.2 m) were similar in size to females (6.3 ± 1.2 m; t = 1.6965, df = 89.7, p = 0.009). Tag retention, from deployment to the last detection, ranged from 1–859 days, with a mean of 161 ± 186 days and a median of 75 days. The entire acoustic array reported a total of 105,420 detections from 117 tags over the duration of the study, from 5 June 2012 to 8 October 2016 (Table 1).
Residency
Tagged whale sharks were routinely detected in the acoustic array, with ~105,000 detections recorded over the study duration. The highest maximum number of consecutive days a shark was detected in the array was 77 days, with a mean ± sd = 16 ± 12.51 days for all sharks. Half of all sharks were detected on at least 14 consecutive days, and 12 sharks were detected on over 30 consecutive days. The residency index Rmax, the proportion of days a shark was detected in the array between tag deployment and its last detection, ranged from 0.01 to 1, with a mean of 0.56 ± 0.31 for individual sharks (Table 1). For all sharks combined, the Rmax was 0.31. Although tags that had a short retention generally had a higher Rmax, the 32 tags detected in multiple seasons, thus including the inter-seasonal months with no or very few detections, still had a relatively high combined Rmax of 0.21. The more conservative Rmin that ignores tag loss, for which tag retention was calculated as the number of days from tag deployment to the end of the study, was much lower at 0.06 for all sharks combined (Table 1).
The residency index Rmax varied with size, with large whale sharks (≥8 m TL; combined Rmax = 0.51) being more resident than small (≤5 m; 0.25) and medium-sized (6–7 m; 0.26) individuals. However, large whale sharks also had a shorter mean tag retention (80.9 days) than small (191.4 days) and medium (214.6 days) individuals. Females (combined Rmax = 0.31) had a similar residency level to males (0.27).
Space use within the aggregation site
Whale sharks had a defined hotspot in their daily space use around station P1 (Figure 2). Station P1 recorded 65% of all detections within the array, followed by stations OW10 (8.5%) and P3 (8.1%) to the south-east of P1 (Table 2). When taking the variable effort into consideration, the same three stations had the highest number of detections per day of recording, although OW10 (16.4 detections day-1) was twice as important as P3 (8.9 detections day-1; Table 2). Relative numbers also showed that OW3 was more important than OW5 even though they had a similar number of total detections.
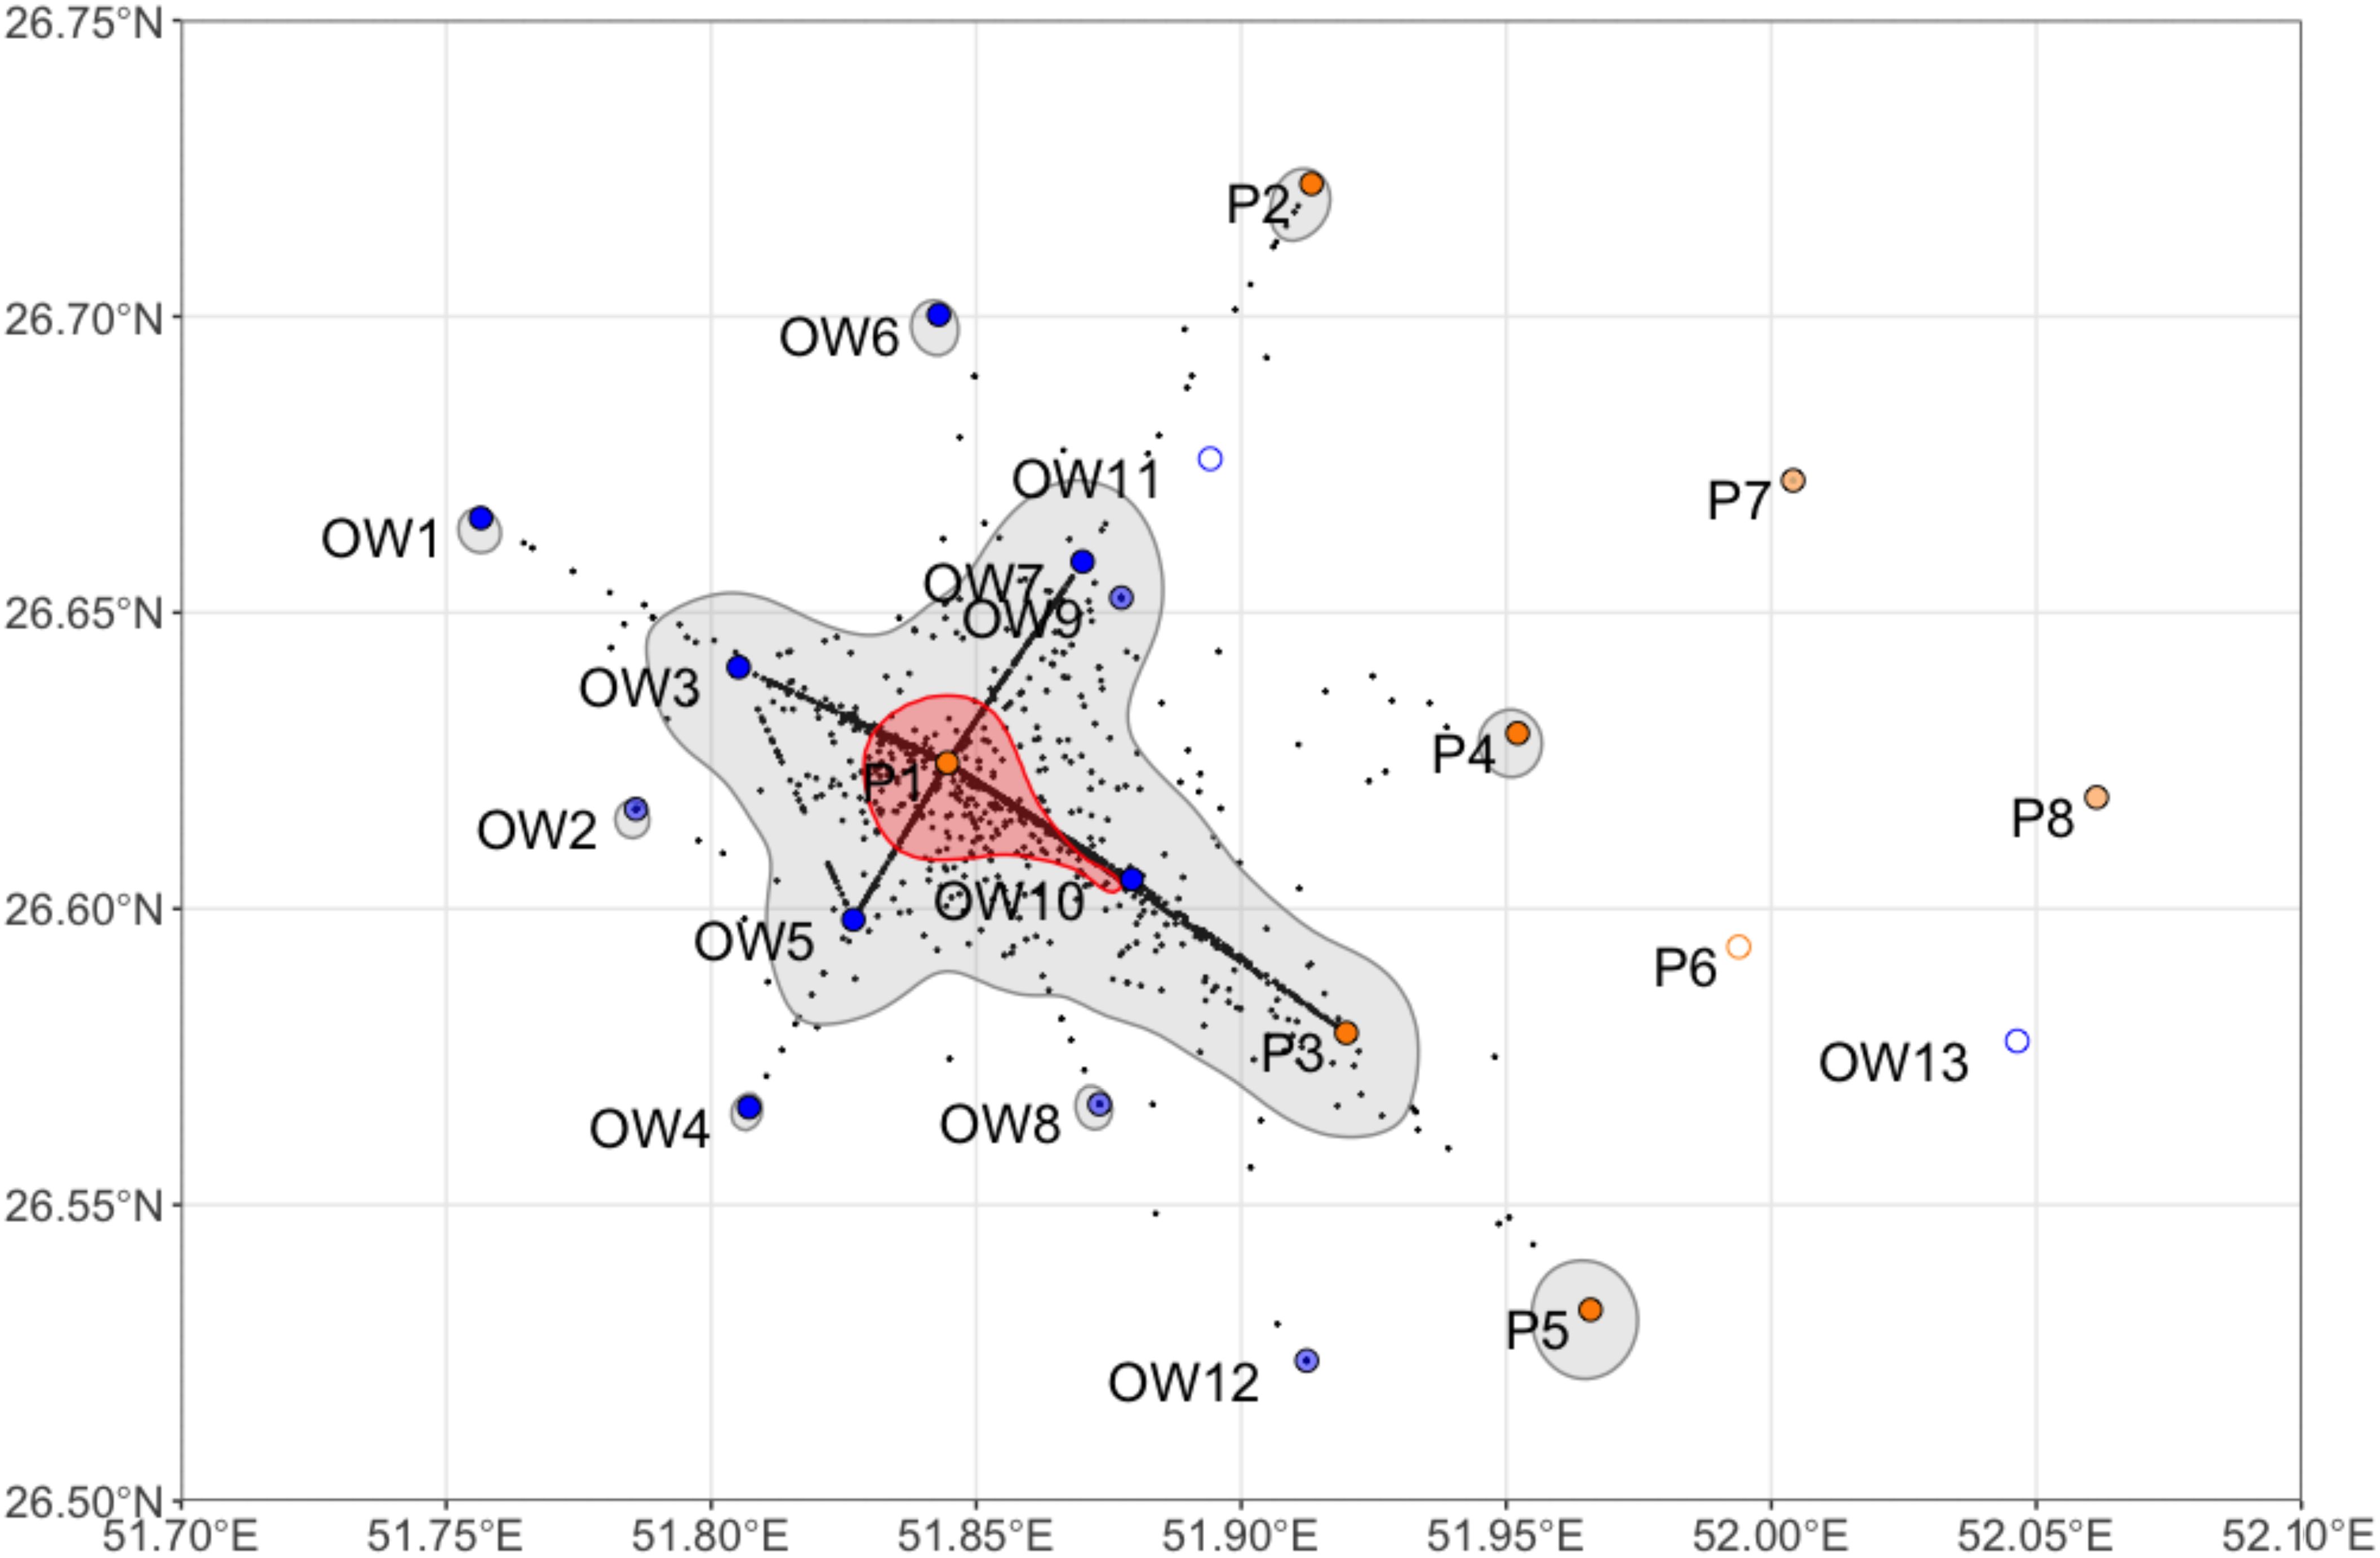
Figure 2. Daily space use of all whale sharks combined over the entire study period, with core (50%; red) and extent (95%; grey) kernel utilization distributions and centers of activity per 24 h period (black dots). Stations at platforms (P) and in open water (OW) are shown. Empty circles indicate stations that were lost before the first data download, and the light colors represent stations that were only used in the first season (2012/13).
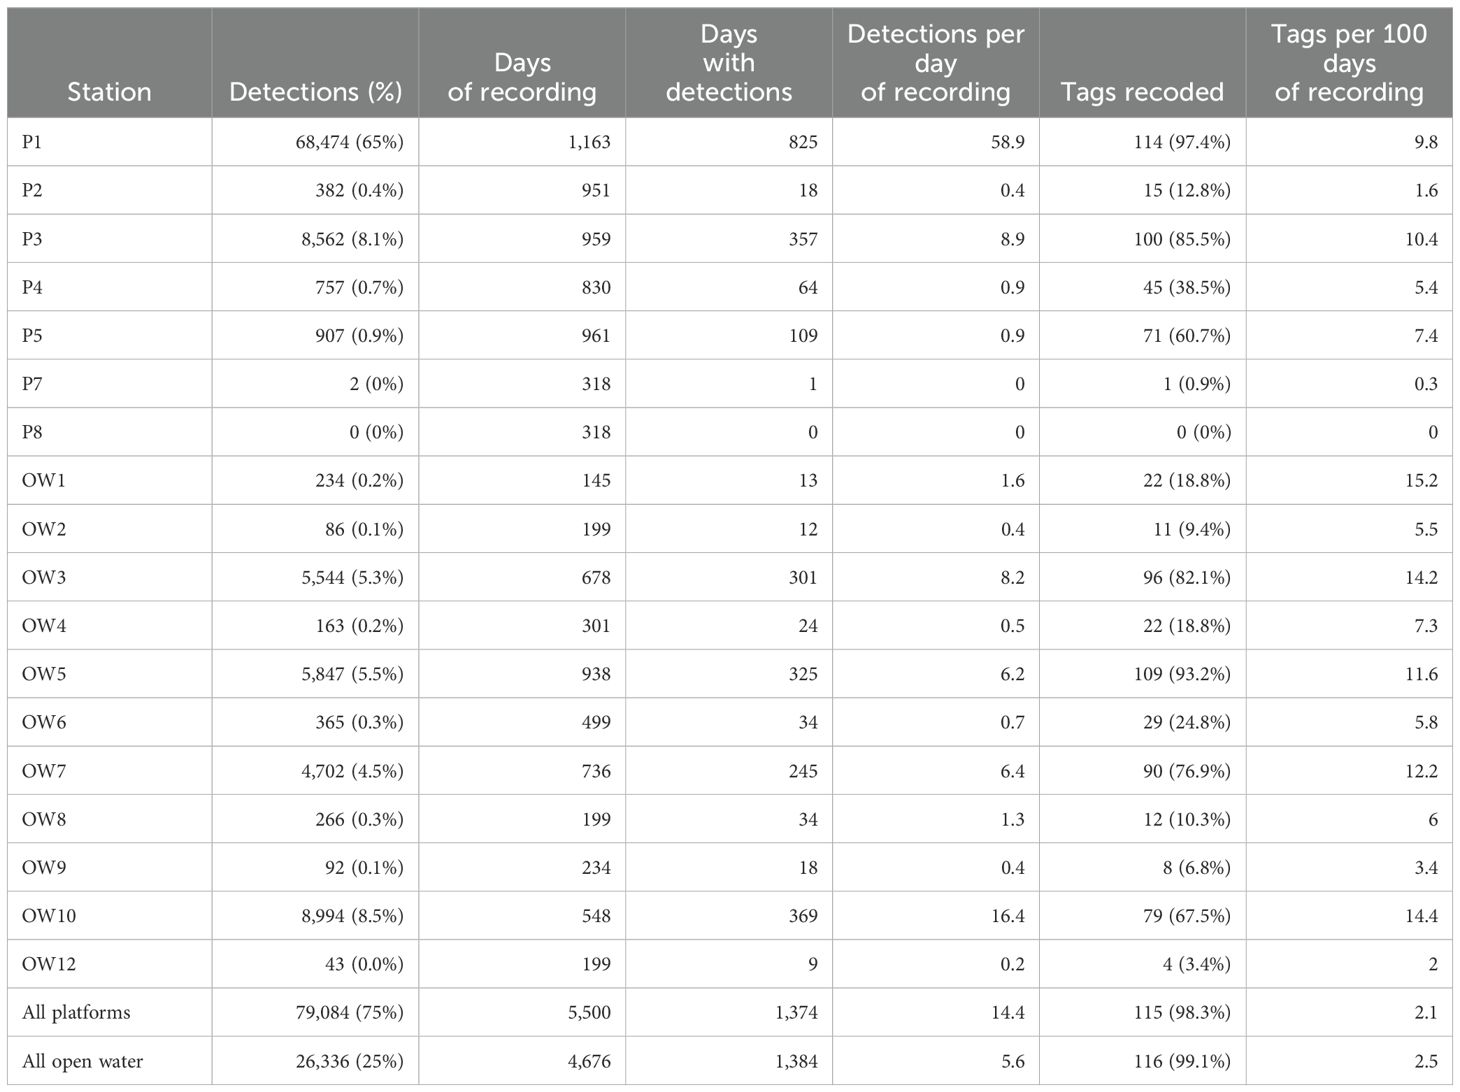
Table 2. Activity metrics for all stations in the whale shark aggregation area.
Most individual tags were detected at P1, where 114 of 117 tags were recorded (Table 2). Other stations with high numbers of detections (P3, OW3,5,7,10) also recorded many individual tags. The main exception was P5 at the southeast corner of the array which had few detections (0.9% of total) but recorded relatively many individual tags (71 of 117). Relative to the number of days of recording, OW1 stood out with 22 tags recorded in only 145 days.
The core habitat of whale sharks was concentrated around P1 and extended to OW10 to the south-east (Figure 2). The extent home range was around the core habitat, also extending to the south-east. Most stations outside of the main daily space use area also had a small, separate extent home range surrounding them, with the exception of two platforms in the north-east and OW12 in the south.
Association with platforms
The best GAM examining the number of relative detections was model 1 which explained 25.1% of the deviance and included distance from P1 (p < 0.001), day of year (p < 0.001) and station type (p < 0.001) as predictors (Supplementary Table S2). Most relative detections were made at station P1 with a sharp drop in detections even at relatively short < 5 km distances from P1, a radius including five open water stations (Figure 3). There was a clear seasonal signal, with most relative detections made from mid-April to end of September (Figure 3). There were fewer detections in open water compared to platforms (estimate = -0.31, t = -8.8, p < 0.001). Although station type was supported in model 1, model 2 with distance from P1 and day of year as predictors, excluding station type, also explained 25% of the deviance, suggesting that receiver location (close to a platform, or in open water) is less influential than the specific distance from P1, and seasonality. Raw data showed that there were more relative detections at platforms (3.7 detections per day per active tag, n = 10,195 station days) than in open water (1.2), but the trend was reversed when excluding detections from P1 (n = 9,015), with fewer relative detections at platforms (1.1).
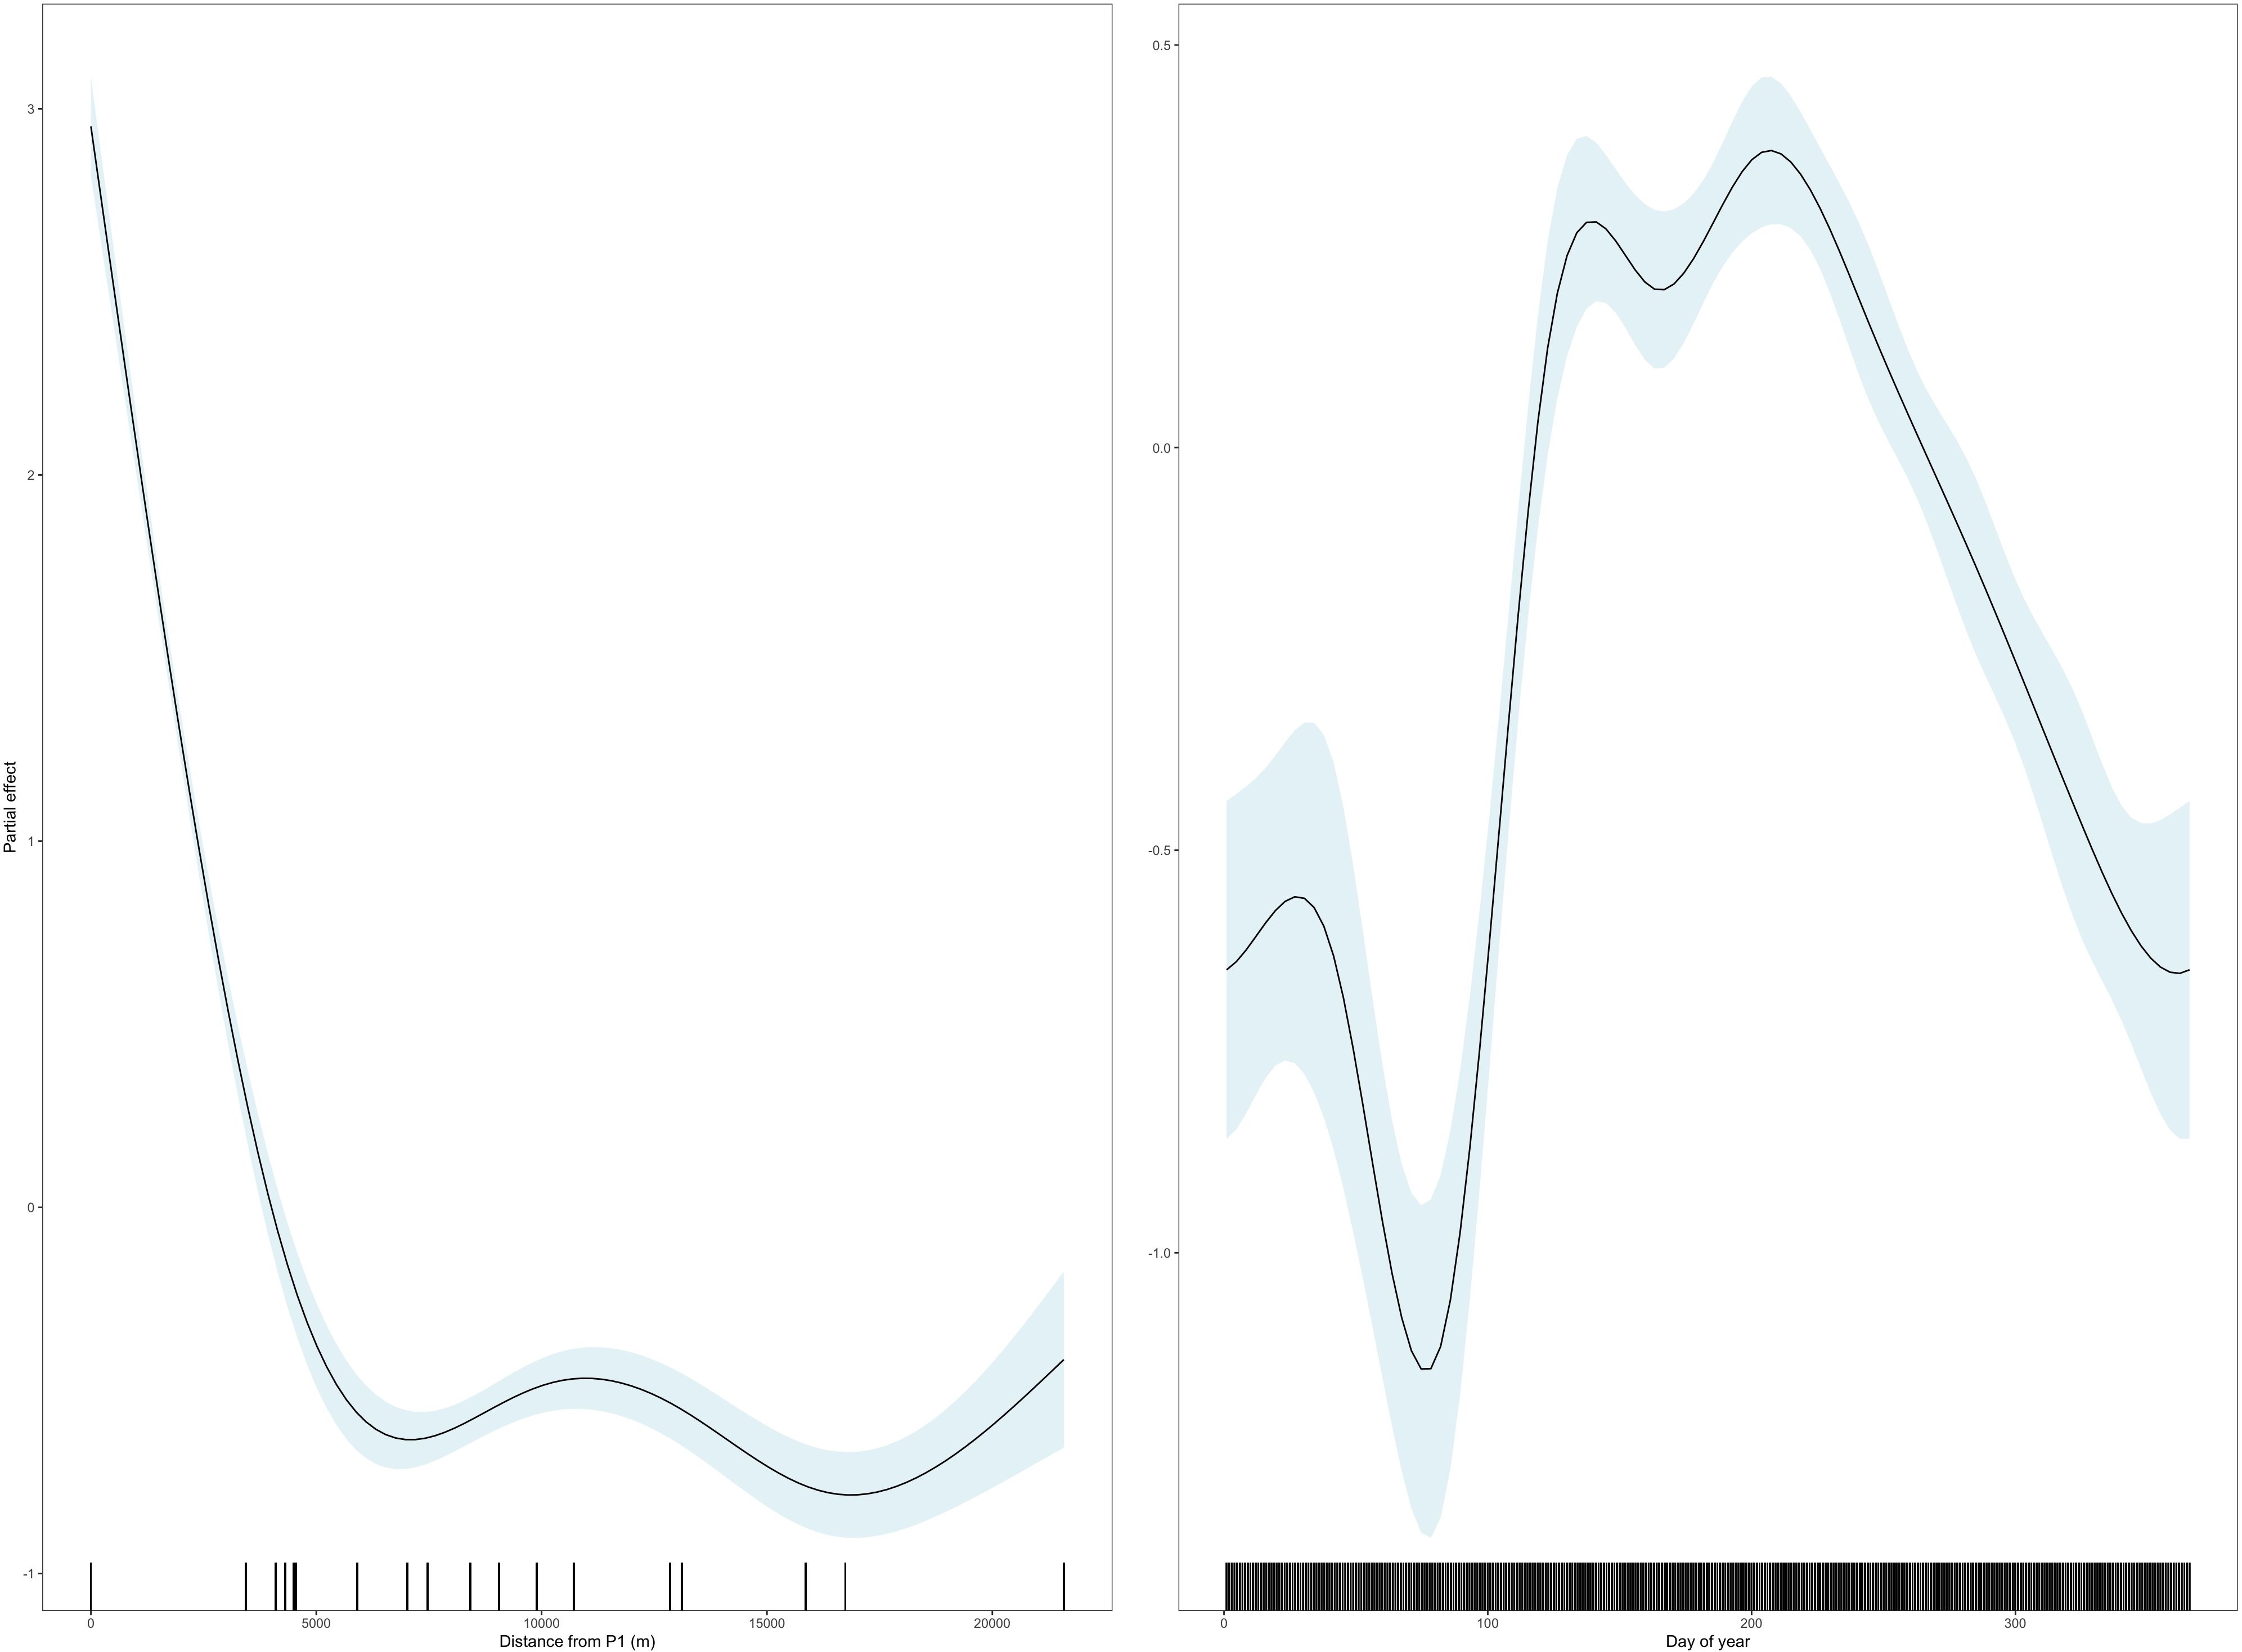
Figure 3. Model output from the best GAM (model 2) showing the partial effect of distance from P1 (left) and day of year (right) on the relative number of detections per day per station. The rug plot is shown in black along the x axis.
Seasonality
Whale shark detections in the array were highest from May–Sep, with a peak of 28,447 detections (27% of all detections) in July. Whale sharks were detected in every month of the year, however at lower levels between Oct–Apr (8.7% of detections) than between May–Sep (91.3%; t = 5.99, df = 4.46, p = 0.003). Timing of tagging had little influence on this seasonal trend, with the number of detections per active tag highest in July (265.9), although they were still relatively high in April and October (i.e. the start and end of the season), respectively (Figure 4). The number of individual tags detected in the array had a similar seasonal trend, with a maximum of 122 tags recorded in July. The highest percentage of tags detected from all active tags was in June (94%) and was >75% from April to August (Figure 4). While the overall seasonality trend was seen in all years, there was some variation among the trends for each year of the study (Supplementary Figure S2). Most detections per active tag were recorded in July 2013, 2015, and 2016, and in June 2012 and August 2014. The 2014 season extended longer than usual, with a relatively high number of detections per active tag in October and November (Supplementary Figure S2). Activity spaces varied between the main whale shark season (May–Sep) and the rest of the year (Oct–Apr), with a less defined space use in the latter. Within the main season there was no variation in space use among months. P1 was the center of a small core habitat in all months from May–Sep (Supplementary Figure S3).
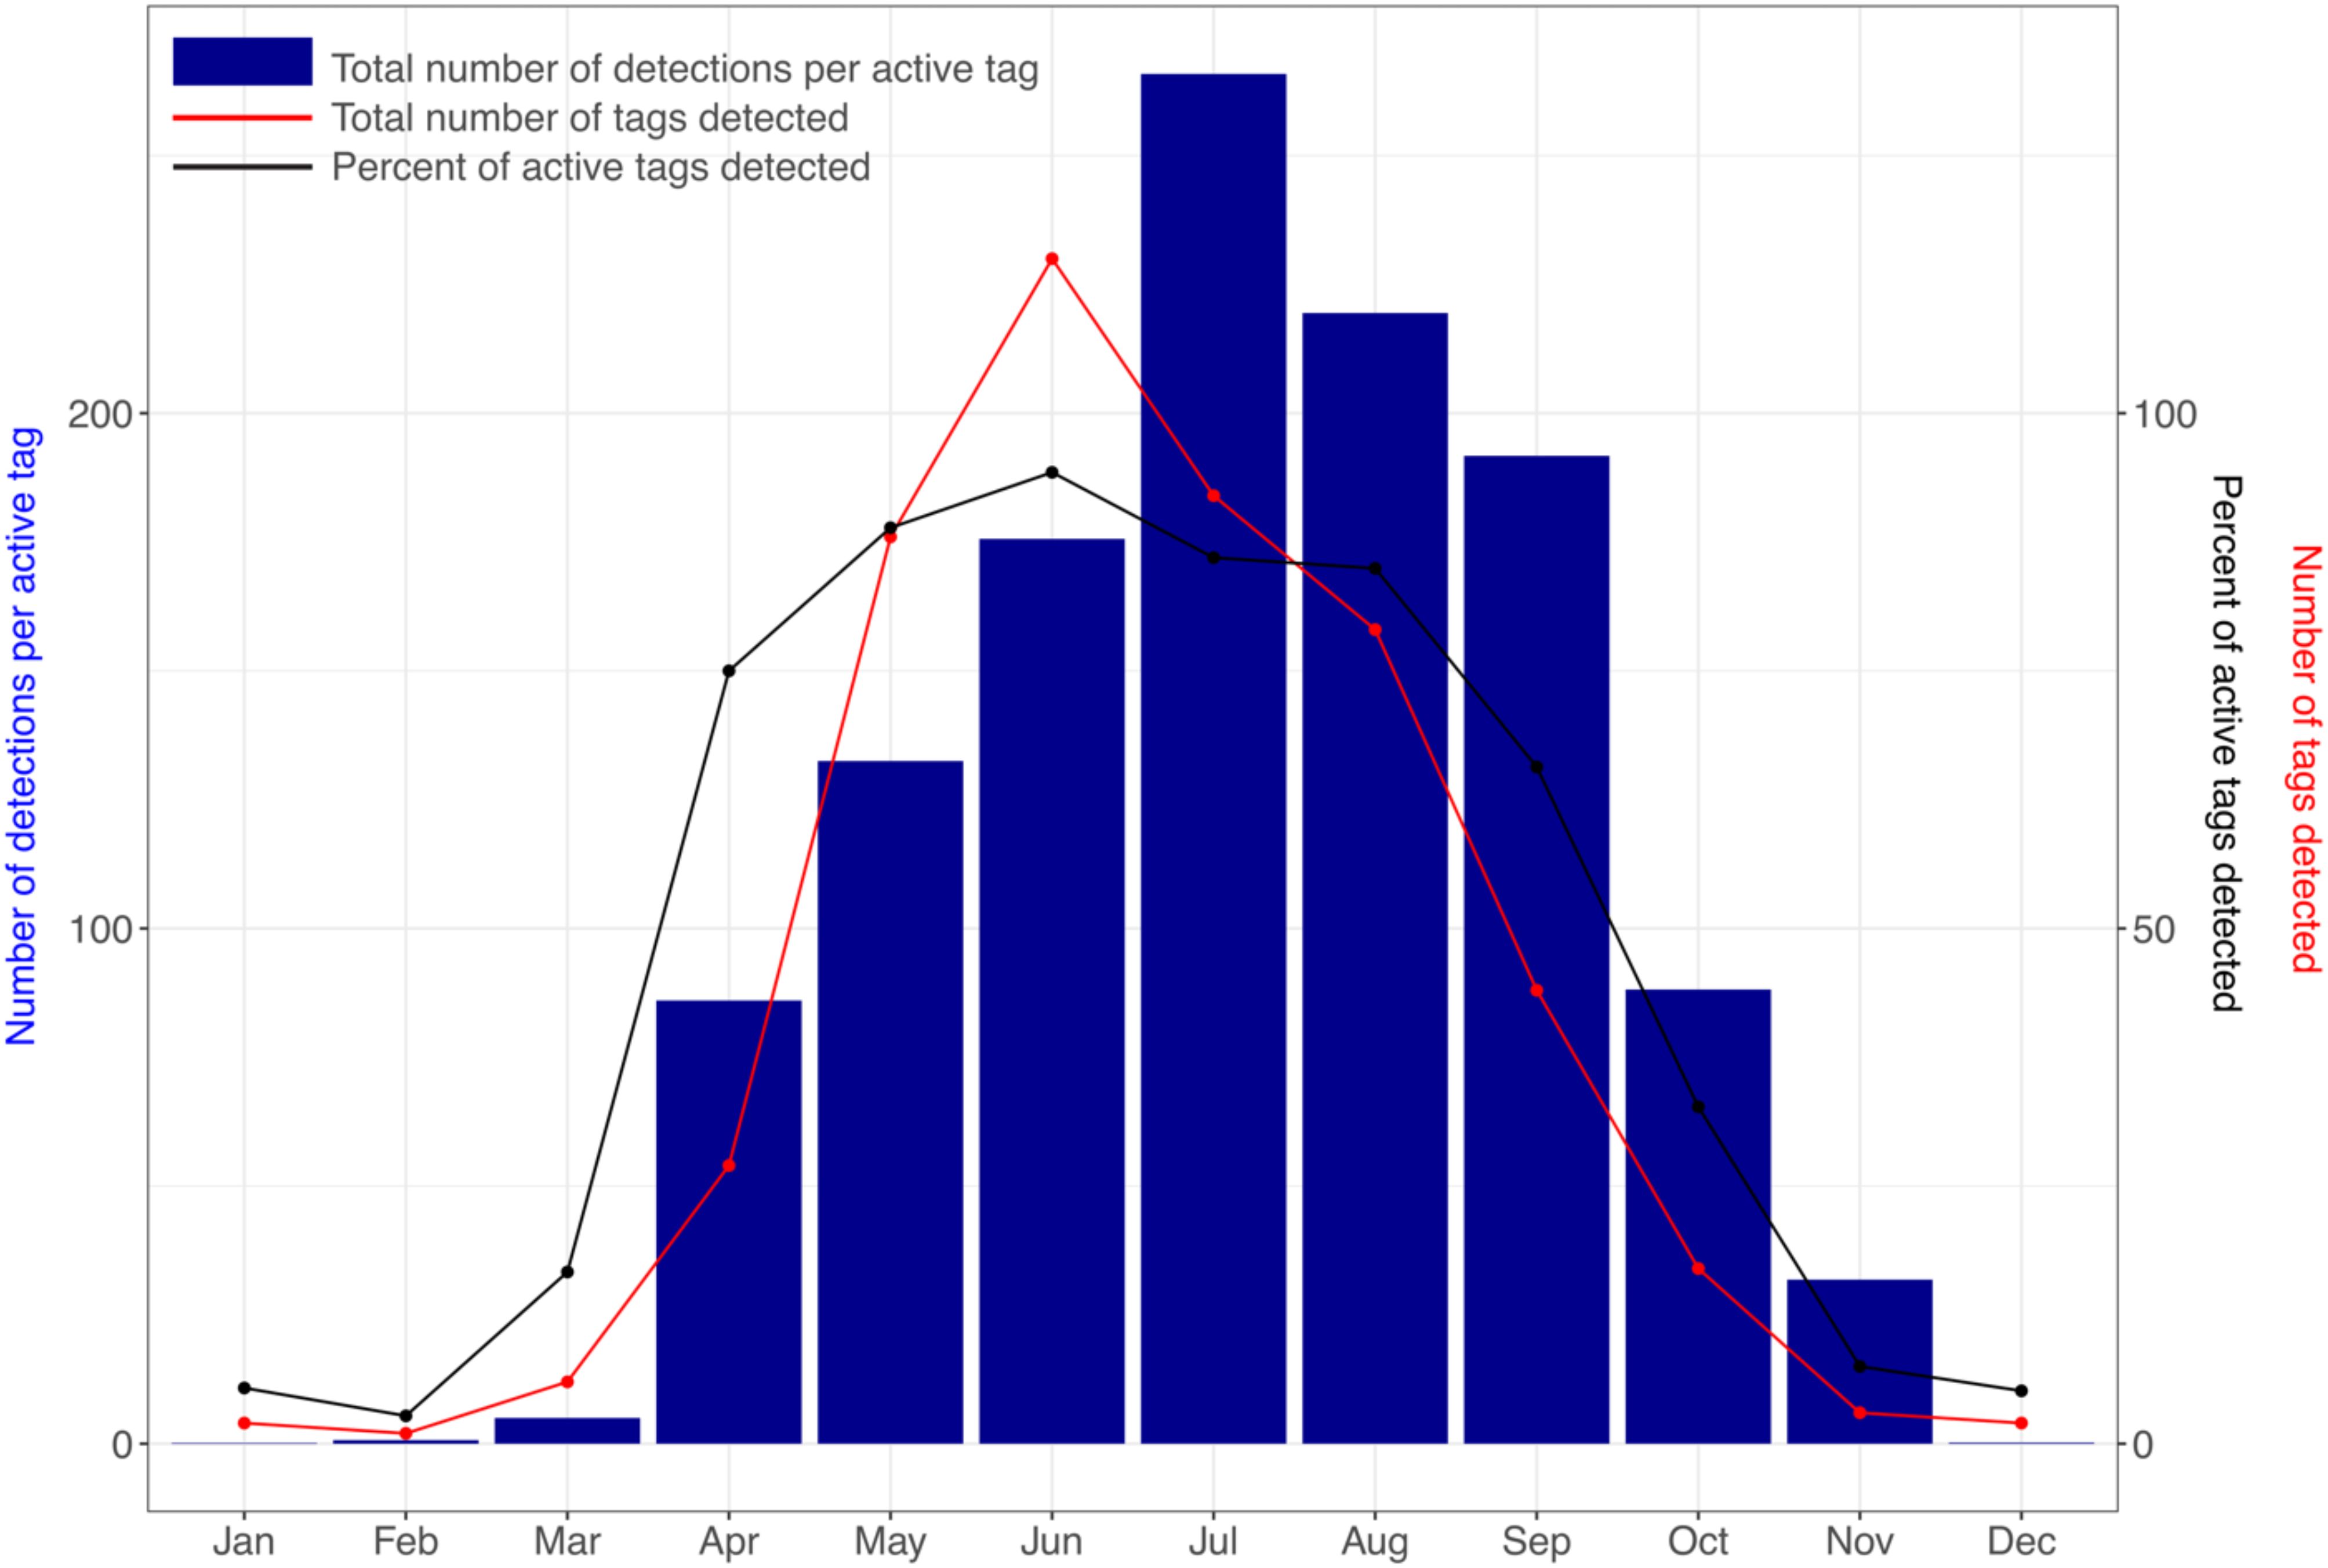
Figure 4. The overall number of detections per active tag (blue bars) made in the whole acoustic array by all tags combined and summed per month, with the number of tags (red) and the percentage of tags from the active tags (black) detected in the array per month.
Temporal trends
Whale shark detections were made throughout the day (n = 53,819) and night (n = 51,601), with only a slight trend towards fewer detections from early morning to midday. There were some interesting spatial differences in the temporal trends within the array. In their core habitat most detections were recorded at P1 (37%) between midnight and 6 am, followed by a sharp decline to the minimum at 11:30 am and a slow rise to midnight (Figure 5). Detections for five stations in a transect line from north-west to south-east (stations OW3, P1, OW10, P3 and P5) binned by 30 minutes showed that the peak of shark detections moved from north-west to south-east over the course of the day (Figure 5). Model selection (Supplementary Table S3) resulted in the S-type of the five HGAMs as the best model. The proportion of whale shark detections varied significantly with time of day in different ways across the five stations (smooth interaction term, edf = 27.37, ref.df = 44, F = 19.34, p > 0.001). The model explained 80.6% of the deviance and 78.1% of the variance after adjusting for the number of predictors. The peaks in the proportion of whale shark detections were most pronounced for the stations at the extremities of the transect (i.e. station OW3, P3 and P5), indicating that whale sharks move the opposite way through the central stations at night (Figure 5).
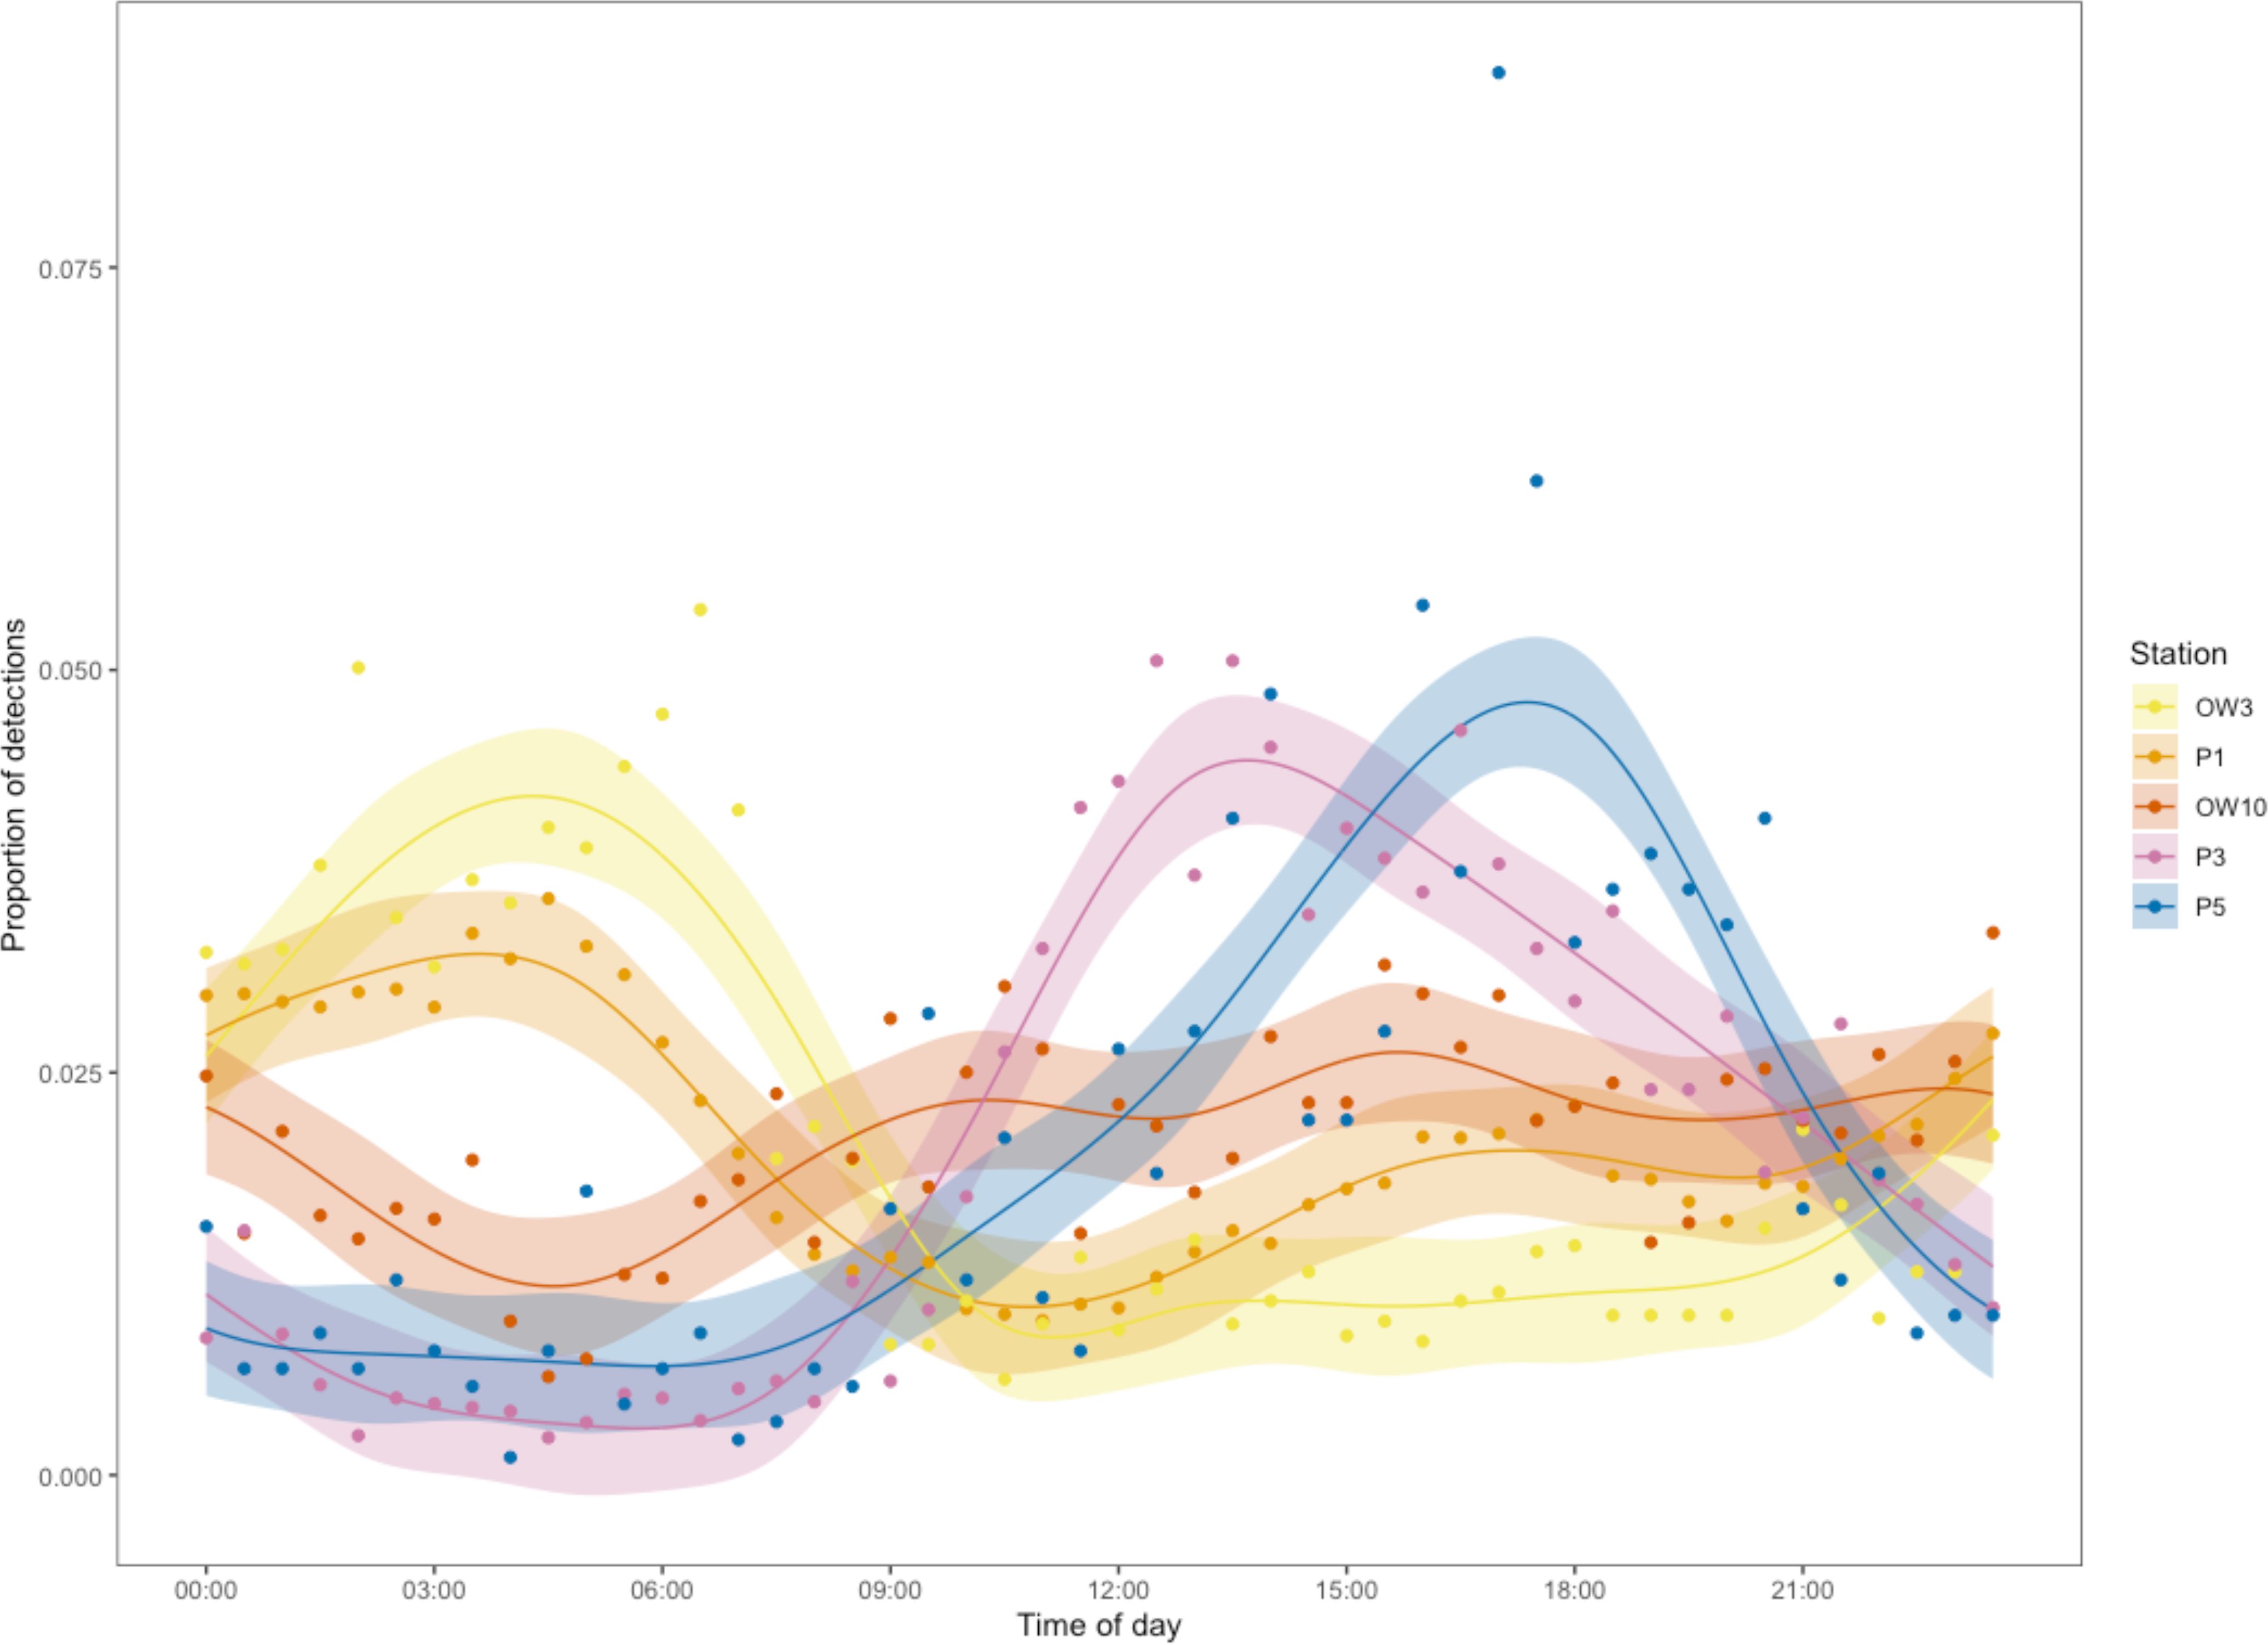
Figure 5. Predicted proportions of detections from a HGAM per 30-min bin for each of the five stations along the north-west to south-east transect (stations OW3, P1 OW10, P3, P5) with the standard error in the same color. The raw 30-min binned data are also shown (dots).
Individual moves between stations were most frequent from OW10 to P1 (n = 239), followed by moves from OW3 to P1 (n = 94), OW5 to P1 (n = 93) and P1 to OW10 (n = 86; Table 3). There was again a clear pattern with the predominant north-west to south-east current direction, with sharks mostly arriving at the downstream station during the morning (P1, OW5, OW10) and the afternoon for the stations further downstream (P3, P5; Table 3). Sharks mostly swam against the predominant current during the evening and night.
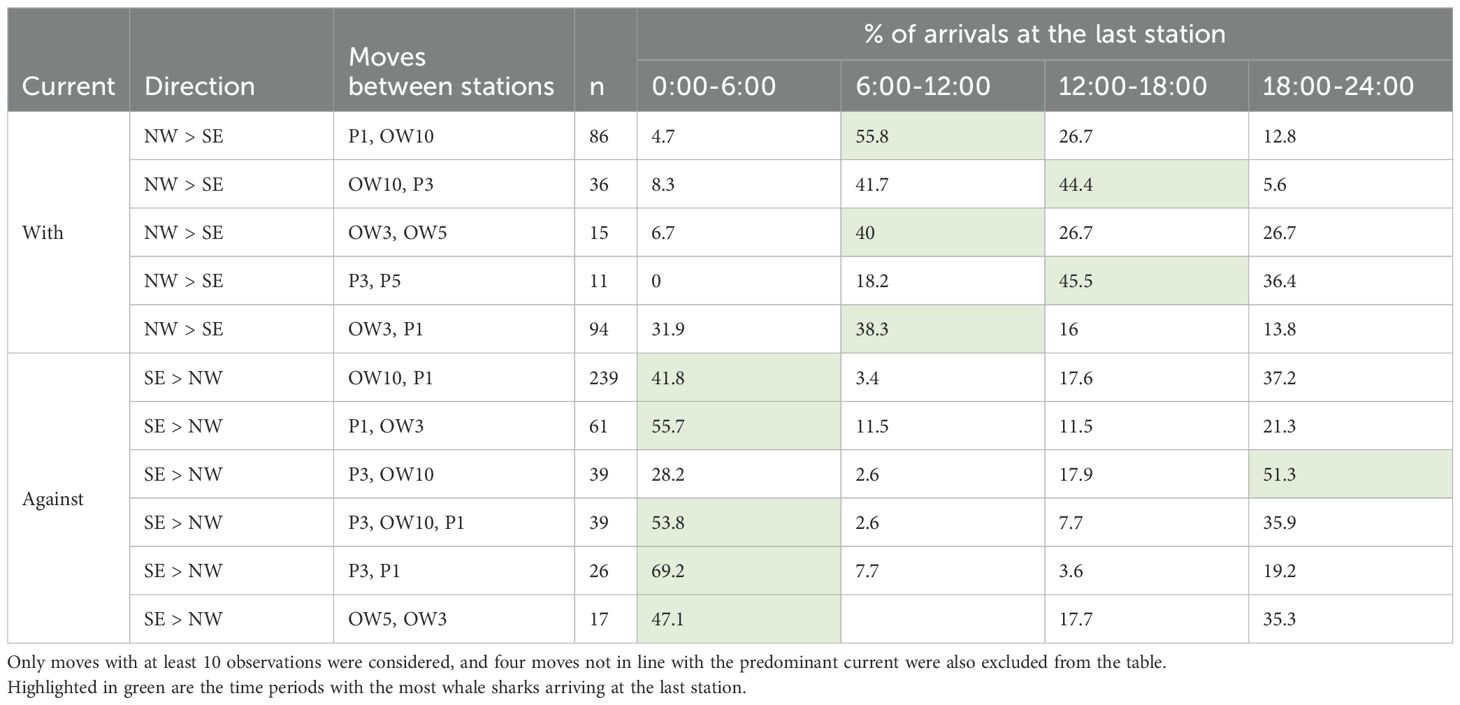
Table 3. The number of occurrences of moves between stations within a 3 h window (n), and the relative frequency of first detection times at the last station binned into night, morning, afternoon, and evening.
Currents
In the Gulf area, the currents in the upper 40 m in the HYCOM model varied widely (Figure 6). This general circulation pattern was consistent with the long-term currents in this region (Thoppil and Hogan, 2009). However, within the acoustic array, the current direction was consistent during the whale shark season May–October, flowing to the southeast (Figure 6).
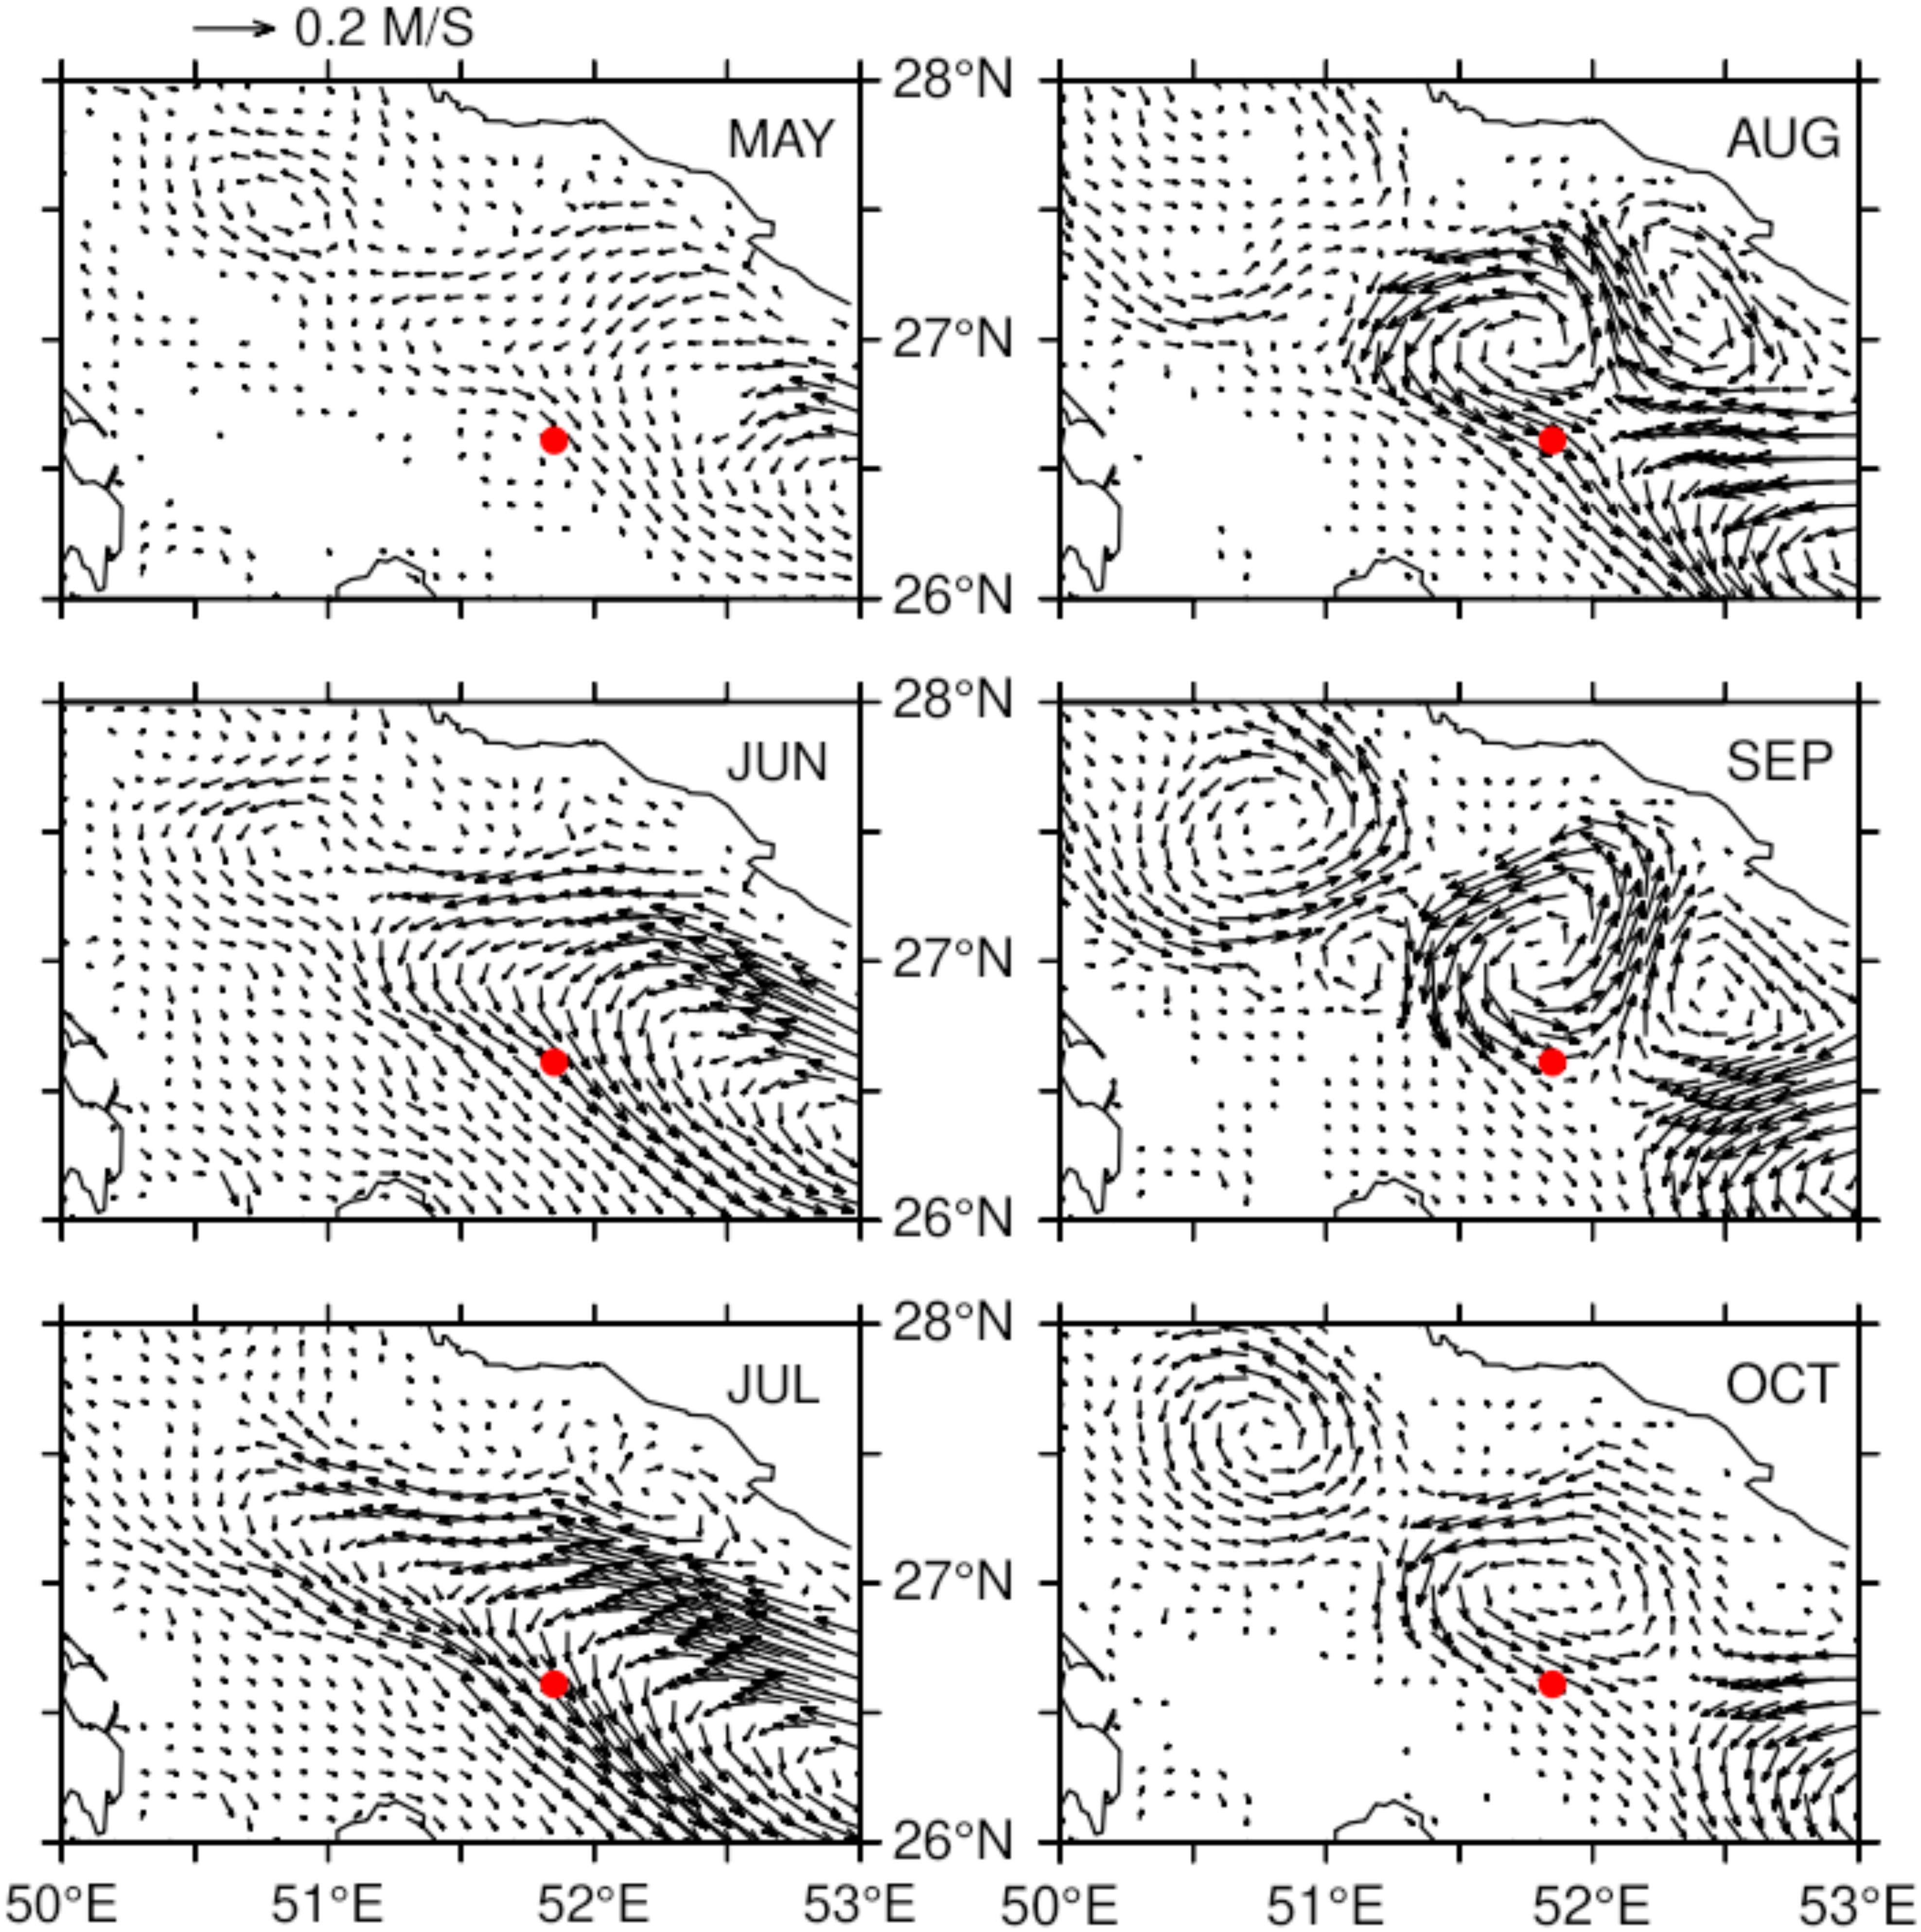
Figure 6. Monthly mean currents averaged in the upper 40 m calculated during 2012–2016 from a 1-km regional Hybrid Coordinate Ocean Model (HYCOM; Thoppil and Hogan, 2010a). The red circle indicates the location of the acoustic array.
Discussion
Whale sharks exhibited a high degree of seasonal residency to a relatively small core habitat area, adjacent to one of the platforms (P1) within the Al Shaheen field. The sharks appear to be targeting a specific spawning area for mackerel tuna located close to P1, with the tuna eggs providing a reliable and energy-dense food source. Receivers in open water near station P1 recorded more detections than other platforms in the acoustic array, highlighting that whale sharks here do not simply aggregate around structures. Individual whale sharks repeatedly returned to this spawning area each afternoon or overnight, then fed on drifting eggs at the surface between ~7 am and ~12 pm. Even though mean tag retention was 161 days, 27% of sharks were detected in two or more seasons, suggesting that a high proportion of whale sharks return each year; this is supported by the 41% inter-annual sighting rate of photo-identified sharks (Robinson et al., 2016) and 58% of satellite-tagged sharks that were photo-identified in subsequent years after tagging (Robinson et al., 2017) during fieldwork at Al Shaheen from 2011–14. This area is clearly an important seasonal habitat for this globally Endangered species. Al Shaheen was recently listed as an Important Shark and Ray Area (ISRA) based on the feeding criterion for whale sharks and also including other shark species (www.sharkrayareas.com/eatlas), emphasizing the importance of spatial management for both whale sharks and the mackerel tuna spawning area.
Residency
Whale sharks had high residency to this small site in the Gulf, with a combined Rmax of 0.31. This residency index means that whale sharks were detected on 31% of possible days; high, considering that this is a highly mobile species that routinely swims 1,000s of km away from aggregation sites (Hearn et al., 2022). While Rmax can overestimate residency for sharks that were only detected within a single season, it was still high (0.21) for the 32 sharks that were detected in multiple seasons. The aggregation site off Qatar is thus clearly an important interannual habitat for whale sharks in the region. Elsewhere, acoustic telemetry estimated a shorter combined Rmax of 0.11 off St Helena (Perry et al., 2020) and 0.16 off Ningaloo Reef (Norman et al., 2017a). The constellations in Qatar and St Helena both comprise a high proportion of large, mature sharks, but St Helena sharks appear to be less resident, perhaps because feeding opportunities are rare there (Perry et al., 2020). Whale sharks in the Red Sea constellation were often feeding and had a similar Rmax to those in Qatar (0.26; Cochran et al., 2019), which suggests that residency is higher when feeding is the main driver of the aggregation. This is further supported by the passive acoustic study from Mafia Island in Tanzania, where whale sharks feed in high-density plankton patches, which found an even higher Rmax of 0.39 (Rohner et al., 2020, 2015).
Whale sharks off Isla Contoy in Mexico aggregate in large numbers to surface-feed on little tunny (Euthynnus alletteratus) eggs (de la Parra Venegas et al., 2011) in a similar manner to sharks at Al Shaheen, with tuna egg biomass at Al Shaheen sometimes even higher than the former (Robinson et al., 2013). The potential daily calorific intake of sharks at Isla Contoy is estimated to greatly exceed that needed for basal metabolic rate (Tyminski et al., 2015; Wyatt et al., 2019), or indeed the mean ration for whale sharks in aquaria (Dove et al., 2021), indicating that the tuna spawning event in Al Shaheen is a rich feeding opportunity for months at a time. The high residency and whale shark space use infers that this fish spawning event takes place on an almost daily basis throughout the May–September season in a predictable daily cycle, likely making Al Shaheen one of the most productive whale shark feeding sites on the planet. This is reflected by the high residency we observed, with half of all sharks having consecutive daily detections for at least two weeks, and 12 individuals (10.3%) having consecutive daily detections for over a month. However, there were also days during the main season with few whale sharks detected, when most were outside of the array. Some of them may have moved ~120 km to a nearby location in Saudi Arabia where a secondary whale shark hotspot was identified in a satellite tagging study, with sharks also frequenting that site during the same months as in Al Shaheen (Robinson et al., 2017). To better understand why whale sharks leave the area during the season, it will be important to assess fish egg density in the area over time, as it is possible that tuna spawning fluctuates over the season. It is likely that this whale shark aggregation is almost entirely driven by the mackerel tuna spawning events (Robinson et al., 2016) so, if the mackerel tuna were to stop spawning at this location in the future, for whatever reason, that whale sharks will presumably stop aggregating in Al Shaheen.
Sexual and size-based segregation
Like many whale shark aggregations (Rohner et al., 2022), Al Shaheen is biased (~69%) toward male sharks (Prebble et al., 2018; Robinson et al., 2016). We tried to tag a more equal mix of male to female sharks in this study – 57% of the known-sex sharks were males – to facilitate a comparison of behavior between the sexes. Females (combined Rmax = 0.31) had a similar residency level to males (0.27). Although male sharks have a larger mean TL (7.25 m) than females (6.44 m) at Al Shaheen (Robinson et al., 2016), this did not appear to influence the results observed in the present study. One of the hypotheses put forward for sexual segregation in whale sharks is a desire for females to avoid male harassment, in the form of undesired courtship or mating attempts (Rohner et al., 2022). We did not record such behavior during our field work, which focused on feeding aggregations during the morning, but it is possible that this may occur at other times of the day when the sharks are not feeding at the surface. It is plausible that the benefits of the rich food source outweigh any drawbacks for the female sharks that do choose to frequent the site.
Space use
Satellite tracking showed that the Al Shaheen area is the hotspot of whale shark activity within the Gulf (Robinson et al., 2017). Here, we expand on this by identifying the small core habitat within this area, located around station P1. This station recorded by far the most detections (65%) and almost all of the tagged sharks (97%). The location of the activity hotspot was stable, both within the season and across years. As whale sharks aggregate at Al Shaheen to feed on fish eggs (Robinson et al., 2013), this indicates that the mackerel tuna consistently spawn in the same area. It is possible that the platform structure at P1 acts as a fish aggregating device (FAD) (Robinson et al., 2013). However, the exact location and extent of the mackerel tuna spawning ground is yet to be established. Our results indicate that it is near platform P1, where most whale sharks were detected, or slightly north-west (upcurrent) of it. The indirect protection of tuna around Al Shaheen, due to no fishing being allowed in this sensitive zone for several decades, likely plays a part in the large spawning aggregation, as evidenced by the high density of fish eggs (Robinson et al., 2013). There are also distinct hydrological characteristics in the area that could help explain the general area of the spawning ground. Hydrographic fronts in the area are formed by mesoscale cyclonic eddies carrying Indian Ocean water along the Iranian coast (Thoppil and Hogan, 2010a). At the same time, water from the northern part of the Gulf is transported along the Saudi Arabian coast to the northern tip of Qatar (Thoppil and Hogan, 2010a). It is possible that these currents are mixing in the Al Shaheen area, resulting in increased productivity and food availability for the spawning mackerel tuna.
Links between biophysical drivers of high prey densities and whale shark space use have also been identified elsewhere. At Ningaloo Reef in Australia, the whale shark core area was similar in size to the one observed in Al Shaheen and directly adjacent to a large reef passage where oceanographic frontal zones and a mesoscale eddy enhanced prey density and aggregation (D’Antonio et al., 2024). Similarly, whale sharks predictably aggregate in a small area to feed on fish eggs off Isla Mujeres in Mexico, with the spawning ground located in an area dominated by the Loop Current (de la Parra Venegas et al., 2011). This current flows through the Yucatan Channel and creates a hydrographic front where warm water from the Caribbean Sea meets nutrient-rich water from the Gulf of Mexico, creating mesoscale eddies that influence larval fish distribution (Lindo-Atichati et al., 2012). Understanding why the spawning ground in Al Shaheen is restricted to a relatively small area, and ensuring the protection of the tuna from potential fisheries exploitation, will be important to help the tuna stock in the Gulf and protect this important feeding area for whale sharks. Even though the exact spawning area has not been delimited at this stage, the small extent of this area means that spatial management could proceed with the information available now.
Association with platforms
Whale sharks were detected on receivers at oil and gas platforms, and on receivers in open water. Station P1, located at a two-platform structure connected by a gangway, was the center of the relatively small whale shark core habitat and had by far the most detections. Open water station OW10, ~4 km southeast of P1, registered the second-most detections and was on the edge of the core habitat. OW stations 3, 5, and 7 were also located within 4 km of P1 but recorded fewer detections than P1 and OW10. The only platform with significant numbers of detections other than P1 was P3, located downstream and southeast of P1 and OW10. This underlines the importance of the currents that influence the drifting fish eggs on which the sharks feed here (Robinson et al., 2013). Although platforms can provide habitat for a variety of species, they do not appear to be a particular attraction for whale sharks in this area. The best GAM was model 1 which included distance from P1, day of year, and station type as predictors. The inclusion of station type is likely to be driven by the importance of P1, as the presumed tuna spawning area is adjacent to this platform. The high proportion of detections at P1 meant our models could not definitively disentangle platform presence from whale shark activity. However, the GAMs also showed that the best model (#1) and second-best model (#2), that excluded station type, explained the same percentage of the deviance (25.1% and 25%, respectively), indicating that station type (platform-associated or in open water) was less influential than distance from P1 and seasonality. Feeding as the main driver of whale shark presence and movement within this aggregation area is further supported by previous surveys that observed whale sharks to be feeding on fish eggs whenever aggregations are encountered (Robinson et al., 2013), and by our daily observations during field work for this study. The feeding opportunity in turn may be influenced by platforms. However, in the wider Gulf area, there are more than 800 platforms (Sheppard et al., 2010) and we are not aware of any others at which whale sharks are regularly seen, let alone to aggregate and feed near as frequently as they do around P1 in Al Shaheen. A second likely whale shark aggregation in the Gulf is ~120 km to the north-west of the Al Shaheen oil field, close to the reef plateau of the Rennie Schoals in Saudi Arabia waters (Robinson et al., 2017). Here, the nearest platform is at the Abu Sa’afa field, ~10 km distant.
While it is established that whale sharks aggregate at Al Shaheen to feed on fish eggs (Robinson et al., 2013), it remains unclear whether the spawning tuna aggregate here only since the platforms were constructed, or have done so before artificial structures were built. Other studies suggested that it is unlikely for tuna to alter their spawning locations in response to structures being built, but this was based partly on the assumption of their short-term association with structures (Snodgrass et al., 2020). By contrast, tuna spawn for several months at Al Shaheen. The relatively shallow bathymetry of the Gulf may not provide other typical aggregation areas for tuna, such as seamounts (Holland et al., 1999), which could further increase the importance of these human-made structures for tuna spawning here. It is thus possible that platform P1 acts like a fish aggregating device (FAD) for the tuna, which then spawn there, but it is unclear why the one platform stands out among the many others. A more detailed analysis of the ecology and spawning behavior of mackerel tuna at Al Shaheen is needed to better understand their relationship with structures and their influence on whale sharks. Additionally, examining how currents interact with platforms, particularly with P1 in our array, and potentially influence fish egg entrainment and retention, could be a future research topic.
Seasonality
The results from this passive acoustic telemetry study confirm the seasonality observed for this aggregation through visual surveys and with satellite tags (Robinson et al., 2013, 2017). The main whale shark season at Al Shaheen is from May–September, with additional high activity in April and October in some individual years. During November–March, few whale sharks were detected. As such, passive acoustic telemetry confirmed the pattern seen with other methods; that this aggregation is distinctly seasonal. A similar result was seen for whale sharks at Shib Habil in the Red Sea (Cochran et al., 2019). It is plausible that, in general, whale shark aggregations driven by fish spawning are seasonal, as fish spawning is also seasonal, for example during Apr–Sep for mackerel tuna in southwestern India (Rao, 1964), particularly if no other whale shark prey are available near these locations during other times of the year. The start and duration of fish spawning may be influenced by biophysical variables, leading to years with high detections earlier or later than the main whale shark season. A better understanding of the drivers of mackerel tuna spawning at Al Shaheen will benefit the understanding of whale shark ecology at this site.
Temporal trends
Visual observations showed that whale sharks are feeding at the surface from ~7am to ~12pm (Robinson et al., 2013), suggesting that they may leave the Al Shaheen area until the next morning. Satellite tags also showed that they stay shallower in the morning and swim deeper during the rest of the day and night when they are at Al Shaheen, indicating that they only surface-feed during the morning (Robinson et al., 2017). Here, we found no difference in detections between the day and night, clarifying that the sharks do stay within the area covered by the acoustic stations.
We also found that the peak in relative detections moved with the predominant current over the course of the day, starting in the north-west (stations OW3, P1) during the night and early morning and ending in the south-east in the afternoon (P3, P5), before the sharks swam against the current back towards the start point. Detections increased again at OW3 and P1 from late afternoon and over the night, indicating that whale sharks return to the location in anticipation of the spawning. Movements, defined as being detected at a subsequent station within 3h of first being detected at a station, were largely with the current during the day between 6am–6pm and against the current during the night. The HYCOM current model showed that the flow was south-easterly throughout the whale shark season months in the years of our study 2012–2016.
Due to the high sea surface water temperatures at Al Shaheen (26–35°C) during the whale shark season, the eggs likely develop and hatch quickly. Using the equation in Pauly and Pullin (1988) and an egg diameter of 0.88 mm (D. Robinson unpubl. data), mackerel tuna eggs are estimated to hatch within 0.55–0.89 days (13.2–21.4 h) during the whale shark season. Our assumed scenario is that (1) mackerel tuna spawn in the late hours of the night and early morning, (2) the whale sharks begin feeding on the fish eggs as they float to the surface in the early morning, (3) the sharks move with the floating eggs at the surface towards the south-east during the morning and early afternoon, and then (4) the sharks cool off at depth during the night (see Robinson et al. (2017) for vertical movement data), and return to the north-west of Al Shaheen, near P1, in anticipation of the next spawning event. As passive acoustic telemetry only records presence/absence near receiver stations, other methods, such as deployment of behavioral tags, would be useful to test this hypothesis.
Notes on management
Whale sharks are Endangered, having suffered severe population decline over the past three generations. They face a variety of potential threats in the Gulf region (Reynolds et al., 2022), likely making this one of the more at-risk populations for the species (Pierce et al., 2021). Off Oman, whale sharks are still taken by fishers (D. Robinson unpubl. data), and the whole area – particularly the Strait of Hormuz – has intense shipping traffic which could severely impact the sharks in this region (Womersley et al., 2022). Shipping has been identified as a potentially major threat to whale sharks with high cryptic mortality rates (Womersley et al., 2022, 2024). Al Shaheen was one of the global aggregation sites with the highest overlap of ship traffic, highlighting that the core aggregation area here requires urgent management to minimize threats from ship strike (Womersley et al., 2024). The specific small-scale movement data presented here provide an opportunity for careful spatial management of vessel movements in the Al Shaheen field through the whale shark season. Additionally, it is likely that mackerel tuna spawning is the main driver of this whale shark aggregation (Robinson et al., 2016). Protecting the spawning aggregation and managing this spawning stock is essential to ensure the whale shark aggregation into the future.
Data availability statement
The raw data supporting the conclusions of this article will be made available by the authors, without undue reservation.
Ethics statement
The animal study was approved by the Qatar Ministry of Environment. The study was conducted in accordance with the local legislation and institutional requirements.
Author contributions
SB: Conceptualization, Data curation, Funding acquisition, Investigation, Methodology, Project administration, Resources, Writing – review & editing. DR: Conceptualization, Funding acquisition, Investigation, Methodology, Project administration, Resources, Writing – review & editing. MJ: Funding acquisition, Investigation, Project administration, Resources, Writing – review & editing. SP: Investigation, Methodology, Writing – original draft. PT: Formal analysis, Investigation, Writing – review & editing. CR: Formal analysis, Investigation, Methodology, Writing – original draft.
Funding
The author(s) declare that financial support was received for the research and/or publication of this article. We thank everyone involved in the Qatar Whale Shark Research Project, as well as the staff at the Qatar Ministry of Municipality and Environment (QMME) and the Qatar Coast Guard for providing the platform to carry out field research in Qatar. We thank A.P Møller Mærsk (Maersk Oil) for providing the majority of financial support for the purchasing of equipment and the staff of the Maersk Oil Research and Technology Centre. SP and CR were additionally supported by Waterlust, Aqua-Firma and the Shark Foundation. We thank Sheikh Abdulah bin Nasser bin Khalifa Al Thani for supporting the Qatar Whale Shark Research and publication of the study. The funders were not involved in the study design, collection, analysis, interpretation of data, the writing of this article, or the decision to submit it for publication.
Acknowledgments
We also thank the offshore platform workers for their dedicated support with data collection.
Conflict of interest
The authors declare that the research was conducted in the absence of any commercial or financial relationships that could be construed as a potential conflict of interest.
Generative AI statement
The author(s) declare that no Generative AI was used in the creation of this manuscript.
Publisher’s note
All claims expressed in this article are solely those of the authors and do not necessarily represent those of their affiliated organizations, or those of the publisher, the editors and the reviewers. Any product that may be evaluated in this article, or claim that may be made by its manufacturer, is not guaranteed or endorsed by the publisher.
Supplementary material
The Supplementary Material for this article can be found online at: https://www.frontiersin.org/articles/10.3389/fmars.2025.1568607/full#supplementary-material
Supplementary Figure 1 | Activity at each station in the array. Black lines represent deployment periods of receivers and black dots are deployment and retrieval dates. Orange circles represent acoustic detections of a tag, with the first detection (white square) and last detection (pink square) also indicated. Deployment periods without any detections indicate lost or broken receivers, except for P8 which did not record any tags.
Supplementary Figure 2 | Yearly variation in the overall number of detections per active tag (blue bars) made in the whole acoustic array by all tags combined and summed per month, with the number of tags (red) and the percentage of tags from the active tags (black) detected in the array per month.
Supplementary Figure 3 | Whale shark activity spaces during the main whale shark season (May–Sep) and in the rest of the year (Oct–Apr), and in the individual months of the whale shark season. Calculation of the core habitat (50% KUD; red) and extent home range (95% KUD; grey) were based on centers of activity calculated at 24h intervals (black dots). Stations at platforms (P; orange) and in open water (OW; blue) are shown. Empty circles indicate stations that were lost before the first data download, and the light colors represent stations that were only used in the first season (2012/13).
Supplementary Figure 4 | Diagnostic plots for model S fitted to whale shark detection data at five stations along a north-west to south-east transect. (A) QQ-plot of residuals (black), with the red line indicating the 1–1 line and grey bands showing the expected 95% CI for the QQ plot, assuming the distribution is correct. (B) Deviance residuals vs. fitted values.
Supplementary Figure 5 | Predicted (line) vs observed (points) proportions of whale shark detections over the course of the day at each of the five stations along the north-west to south-east transect. No global trend is apparent, largely because station OW10 does not show a clear peak time for detections.
Supplementary Table 1 | Details of all whale sharks tagged during this study. The end of the tag period for Rmax was the date of last detection and for Rmin it was 19 Oct 2016 when the study ended. Max days refers to the maximum number of consecutive days a shark was detected in the array. Tags 118–125 were never detected in the array.
Supplementary Table 2 | Model comparison table from the six GAMs, with rdet = relative detections, dist = distance from P1, doy = day of year.
Supplementary Table 3 | AIC Table of the five hierarchical GAMs, with prop.det = proportion of detections per 30-min bin and time.bin = 30-min bin. All models had a gaussian family and used the REML method.
References
Acha E. M., Piola A., Iribarne O., and Mianzan H. (2015). “Biology of Fronts,” in Ecological Processes at Marine Fronts: Oases in the ocean. Eds. Acha E. M., Piola A., Iribarne O., and Mianzan H. (Springer International Publishing, Cham), 13–32.
Acuña-Marrero D., Jiménez J., Smith F., Doherty P. F., Hearn A., Green J. R., et al. (2014). Whale shark (Rhincodon typus) seasonal presence, residence time and habitat use at Darwin Island, Galápagos Marine Reserve. PloS One 9, e115946. doi: 10.1371/journal.pone.0115946
Araujo G., Agustines A., Bach S. S., Cochran J. E. M., de la Parra-Galván E., de la Parra-Venegas R., et al. (2022). Improving sightings-derived residency estimation for whale shark aggregations: A novel metric applied to a global dataset. Front. Marine Sci. 9, 775691. doi: 10.3389/fmars.2022.775691
Cagua E. F., Cochran J. E. M., Rohner C. A., Prebble C. E. M., Sinclair-Taylor T. H., Pierce S. J., et al. (2015). Acoustic telemetry reveals cryptic residency of whale sharks. Biol. Lett. 11, e20150092. doi: 10.1098/rsbl.2015.0092
Calenge C. (2006). The package adehabitat for the R software: a tool for the analysis of space and habitat use by animals. Ecol. modell. 197, 516–519. doi: 10.1016/j.ecolmodel.2006.03.017
Campbell H. A., Watts M. E., Dwyer R. G., and Franklin C. E. (2012). V-Track: software for analysing and visualising animal movement from acoustic telemetry detections. Marine Freshw. Res. 63, 815–820. doi: 10.1071/MF12194
Cochran J. E. M., Braun C. D., Cagua E. F., Campbell M. F., Hardenstine R. S., Kattan A., et al. (2019). Multi-method assessment of whale shark (Rhincodon typus) residency, distribution, and dispersal behavior at an aggregation site in the Red Sea. PloS One 14, e0222285. doi: 10.1371/journal.pone.0222285
D’Antonio B., Ferreira L. C., Fisher R., Thums M., Pattiaratchi C. B., Sequeira A. M. M., et al. (2025). Natural and artificial structures influence the movement and habitat connectivity of whale sharks (Rhincodon typus) across seascapes. Diversity Distrib. 31, e13950. doi: 10.1111/ddi.13950
D’Antonio B., Ferreira L. C., Meekan M., Thomson P. G., Lieber L., Virtue P., et al. (2024). Links between the three-dimensional movements of whale sharks (Rhincodon typus) and the bio-physical environment off a coral reef. Move. Ecol. 12, 10. doi: 10.1186/s40462-024-00452-2
de la Parra Venegas R., Hueter R., González Cano J., Tyminski J., Gregorio Remolina J., Maslanka M., et al. (2011). An unprecedented aggregation of whale sharks, Rhincodon typus, in Mexican coastal waters of the Caribbean Sea. PloS One 6, e18994. doi: 10.1371/journal.pone.0018994
Dove A. D. M., Matsumoto R., Schreiber C., Murakumo K., Coco C., Yanagisawa M., et al. (2021). 9 Chapter lessons from care of whale sharks in public aquariums. Whale Sharks: Biol. Ecol. Conserv. 181, 181–198. doi: 10.1201/b22502
Fonteneau A., Pallares P., and Pianet R. (2000).A worldwide review of purse seine fisheries on FADs. Pêche thonière et dispositifs de concentration de poissons. Available online at: archimer.ifremer.fr (Accessed April 2024).
Genin A. (2004). Bio-physical coupling in the formation of zooplankton and fish aggregations over abrupt topographies. J. Marine Syst. 50, 3–20. doi: 10.1016/j.jmarsys.2003.10.008
Hearn A. R., Green J. R., Penaherrera-Palma C., Reynolds S., Rohner C. A., Roman M., et al. (2022). “Whale shark movements and migrations,” in Whale Sharks: Biology, Ecology and Conservation. Eds. Dove A. D. M. and Pierce S. J. (CRC Press, Boca Raton, USA), 105–128.
Holland K. N., Kleiber P., and Kajiura S. M. (1999). Different residence times of yellowfin tuna, Thunnus albacares, and bigeye tuna, T. obesus, found in mixed aggregations over a seamount. Fish. Bull. 97, 392–395.
Lindo-Atichati D., Bringas F., Goni G., Muhling B., Muller-Karger F. E., and Habtes S. (2012). Varying mesoscale structures influence larval fishdistribution in the northern Gulf of Mexico. Marine Ecol. Prog. Ser. 463, 245–257. doi: 10.3354/meps09860
Magurran A. E. (1990). The adaptive significance of schooling as an anti-predator defence in fish. Annales zool. Fennici 27, 51–66.
McKinney J., Hoffmayer E., Wu W., Fulford R., and Hendon J. (2012). Feeding habitat of the whale shark Rhincodon typus in the northern Gulf of Mexico determined using species distribution modelling. Marine Ecol. Prog. Ser. 458, 199–211. doi: 10.3354/meps09777
Morato T., Hoyle S. D., Allain V., and Nicol S. J. (2010). Seamounts are hotspots of pelagic biodiversity in the open ocean. Proc. Natl. Acad. Sci. United States America 107, 9707–9711. doi: 10.1073/pnas.0910290107
Nelson J. D. and Eckert S. A. (2007). Foraging ecology of whale sharks (Rhincodon typus) within Bahía de Los Angeles, Baja California Norte, México. Fish. Res. 84, 47–64. doi: 10.1016/j.fishres.2006.11.013
Norman B. M., Holmberg J. A., Arzoumanian Z., Reynolds S. D., Wilson R. P., Rob D., et al. (2017b). Undersea constellations: The global biology of an endangered marine megavertebrate further informed through citizen science. Bioscience 67, 1029–1043. doi: 10.1093/biosci/bix127
Norman B. M., Whitty J. M., Beatty S. J., Reynolds S. D., and Morgan D. L. (2017a). Do they stay or do they go? Acoustic monitoring of whale sharks at Ningaloo Marine Park, Western Australia. J. fish Biol. 91, 1713–1720. doi: 10.1111/jfb.2017.91.issue-6
Pauly D. and Pullin R. S. V. (1988). Hatching time in spherical, pelagic, marine fish eggs in response to temperature and egg size. Environ. Biol. fishes 22, 261–271. doi: 10.1007/BF00004892
Pedersen E. J., Miller D. L., Simpson G. L., and Ross N. (2019). Hierarchical generalized additive models in ecology: an introduction with mgcv. PeerJ 7, e6876. doi: 10.7717/peerj.6876
Perry C. T., Clingham E., Webb D. H., de la Parra R., Pierce S. J., Beard A., et al. (2020). St. Helena: an important reproductive habitat for whale sharks (Rhincodon typus) in the South Central Atlantic. Front. Marine Sci. 7, 899. doi: 10.3389/fmars.2020.576343
Pierce S. J., Grace M. K., and Araujo G. (2021). “Rhincodon typus (Green status assessment),” in The IUCN Red List of Threatened Species 2021.
Pierce S. J. and Norman B. M. (2016). “Rhincodon typus,” in The IUCN Red List of Threatened Species 2016.
Prebble C. E. M., Rohner C. A., Pierce S. J., Robinson D. P., Jaidah M. Y., Bach S. S., et al. (2018). Limited latitudinal ranging of juvenile whale sharks in the Western Indian Ocean suggests the existence of regional management units. Marine Ecol. Prog. Ser. 601, 167–183. doi: 10.3354/meps12667
Rao K. V. N. (1964). An account of the ripe ovaries of some Indian Tunas. Proc. Symp. Scombroid Fishes, Part 2. Symp. Ser. Mar. Biol. Assoc. India. 1, 733–743.
R Core Team (2022). R: A language and environment for statistical computing (Vienna, Austria: R Foundation for Statistical Computing).
Reynolds R. M. (1993). Physical oceanography of the Gulf, Strait of Hormuz, and the Gulf of Oman—Results from the Mt Mitchell expedition. Marine pollut. Bull. 27, 35–59. doi: 10.1016/0025-326X(93)90007-7
Reynolds S. D., Norman B. M., Franklin C. E., Bach S. S., Comezzi F. G., Diamant S., et al. (2022). Regional variation in anthropogenic threats to Indian Ocean whale sharks. Global Ecol. Conserv. 33, e01961. doi: 10.1016/j.gecco.2021.e01961
Ritz D. A., Hobday A. J., Montgomery J. C., and Ward A. J. W. (2011). Social aggregation in the pelagic zone with special reference to fish and invertebrates. in Advances in Marine Biology. Ed. Lesser M. (Academic Press) 60, 161–227. doi: 10.1016/B978-0-12-385529-9.00004-4
Robinson D. P., Jaidah M. Y., Bach S., Lee K., Jabado R. W., Rohner C. A., et al. (2016). Population structure, abundance and movement of whale sharks in the Arabian Gulf and the Gulf of Oman. PloS One 11, e0158593. doi: 10.1371/journal.pone.0158593
Robinson D. P., Jaidah M. Y., Bach S. S., Rohner C. A., Jabado R. W., Ormond R., et al. (2017). Some like it hot: Repeat migration and residency of whale sharks within an extreme natural environment. PloS One 12, e0185360. doi: 10.1371/journal.pone.0185360
Robinson D. P., Jaidah M. Y., Jabado R. W., Lee-Brooks K., Nour El-Din N. M., Al Malki A. A., et al. (2013). Whale sharks, Rhincodon typus, aggregate around offshore platforms in Qatari waters of the Arabian Gulf to feed on fish spawn. PloS One 8, e58255. doi: 10.1371/journal.pone.0058255
Rohner C. A., Armstrong A. J., Pierce S. J., Prebble C. E. M., Cagua E. F., Cochran J. E. M., et al. (2015). Whale sharks target dense prey patches of sergestid shrimp off Tanzania. J. plank. Res. 37, 352–362. doi: 10.1093/plankt/fbv010
Rohner C. A., Cochran J. E. M., Cagua E. F., Prebble C. E. M., Venables S. K., Berumen M. L., et al. (2020). No place like home? High residency and predictable seasonal movement of whale sharks off Tanzania. Front. Marine Sci. 7,423. doi: 10.3389/fmars.2020.00423
Rohner C. A., Norman B. M., Reynolds S., Araujo G., Holmberg J., and Pierce S. J. (2022). “Population ecology of whale sharks,” in Whale Sharks: Biology, Ecology, and Conservation. Eds. Dove A. D. M. and Pierce S. J. (CRC Press, Boca Raton, Florida, USA), 129–152.
Rose G. A. and Kulka D. W. (1999). Hyperaggregation of fish and fisheries: how catch-per-unit-effort increased as the northern cod (Gadus morhua) declined. Can. J. fish. Aquat. Sci. J. canadien Des. Sci. halieutiques aquatiques 56, 118–127. doi: 10.1139/f99-207
Rowden A. A., Schlacher T. A., Williams A., Clark M. R., Stewart R., Althaus F., et al. (2010). A test of the seamount oasis hypothesis: seamounts support higher epibenthic megafaunal biomass than adjacent slopes. Marine Ecol. 31, 95–106. doi: 10.1111/j.1439-0485.2010.00369.x
Sefick S. (2016). Stream Metabolism - A package for calculating single station metabolism from diurnal oxygen curves.
Sheppard C., Al-Husiani M., Al-Jamali F., Al-Yamani F., Baldwin R., Bishop J., et al. (2010). The Gulf: a young sea in decline. Marine pollut. Bull. 60, 13–38. doi: 10.1016/j.marpolbul.2009.10.017
Simpfendorfer C. A., Heupel M. R., and Hueter R. E. (2002). Estimation of short-term centers of activity from an array of omnidirectional hydrophones and its use in studying animal movements. Canadian journal of fisheries and aquatic sciences. J. canadien Des. Sci. halieutiques aquatiques 59, 23–32. doi: 10.1139/f01-191
Sims D. W., Southall E. J., Humphries N. E., Hays G. C., Bradshaw C. J. A., Pitchford J. W., et al. (2008). Scaling laws of marine predator search behaviour. Nature 451, 1098–1102. doi: 10.1038/nature06518
Sims D. W., Southall E. J., Quayle V. A., and Fox A. M. (2000). Annual social behaviour of basking sharks associated with coastal front areas. Proc. R. Soc. B: Biol. Sci. 267, 1897–1904. doi: 10.1098/rspb.2000.1227
Snodgrass D. J. G., Orbesen E. S., Walter J. F., Hoolihan J. P., and Brown C. A. (2020). Potential impacts of oil production platforms and their function as fish aggregating devices on the biology of highly migratory fish species. Rev. fish Biol. fish. 30, 405–422. doi: 10.1007/s11160-020-09605-z
Srinivasan U. T., Watson R., and Rashid Sumaila U. (2012). Global fisheries losses at the exclusive economic zone level 1950 to present. Marine Policy 36, 544–549. doi: 10.1016/j.marpol.2011.10.001
Thomson P. G., Pillans R., Jaine F. R. A., Harcourt R. G., and Taylor M. D. (2021). Acoustic telemetry around Western Australia’s oil and gas infrastructure helps detect the presence of an elusive and endangered migratory giant. Lausanne. doi: 10.3389/fmars.2021.631449
Thoppil P. G. and Hogan P. J. (2009). On the mechanisms of episodic salinity outflow events in the strait of hormuz. J. Phys. oceanogr. 39, 1340–1360. doi: 10.1175/2008JPO3941.1
Thoppil P. G. and Hogan P. J. (2010a). A modeling study of circulation and eddies in the Persian gulf. J. Phys. oceanogr. 40, 2122–2134. doi: 10.1175/2010JPO4227.1
Thoppil P. G. and Hogan P. J. (2010b). Persian Gulf response to a wintertime shamal wind event. Deep Sea Res. Part I: Oceanogr. Res. Papers 57, 946–955. doi: 10.1016/j.dsr.2010.03.002
Tobin A., Currey L., and Simpfendorfer C. (2013). Informing the vulnerability of species to spawning aggregation fishing using commercial catch data. Fish. Res. 143, 47–56. doi: 10.1016/j.fishres.2013.01.011
Tyminski J. P., de la Parra-Venegas R., Cano J. G., and Hueter R. E. (2015). Vertical movements and patterns in diving behavior of whale sharks as revealed by pop-up satellite tags in the Eastern Gulf of Mexico. PloS One 10, 1–25. doi: 10.1371/journal.pone.0142156
Womersley F. C., Humphries N. E., Queiroz N., Vedor M., da Costa I., Furtado M., et al. (2022). Global collision-risk hotspots of marine traffic and the world’s largest fish, the whale shark. Proc. Natl. Acad. Sci. United States America 119, e2117440119. doi: 10.1073/pnas.2117440119
Womersley F. C., Rohner C. A., Abrantes K., Afonso P., Arunrugstichai S., Bach S. S., et al. (2024). Identifying priority sites for whale shark ship collision management globally. Sci. Total Environ. 934, 172776. doi: 10.1016/j.scitotenv.2024.172776
Wood S. N. (2011). Fast stable restricted maximum likelihood and marginal likelihood estimation of semiparametric generalized linear models. J. R. Stat. Soc. (B) 73, 3–36. doi: 10.1111/j.1467-9868.2010.00749.x
Keywords: acoustic telemetry, tracking, aggregations, spawning, elasmobranch, kernel utilization distribution, hierarchical GAMs
Citation: Bach SS, Robinson DP, Al Jaidah MY, Pierce SJ, Thoppil P and Rohner CA (2025) Whale shark residency and small-scale movements around oil and gas platforms in Qatar. Front. Mar. Sci. 12:1568607. doi: 10.3389/fmars.2025.1568607
Received: 30 January 2025; Accepted: 06 May 2025;
Published: 17 June 2025.
Edited by:
Todd Atwood, U.S. Geological Survey, Alaska, United StatesReviewed by:
Christopher G Lowe, California State University, United StatesMitchell J Rider, University of Miami, United States
Ben D’Antonio, Shark Research Foundation Inc., United States
Copyright © 2025 Bach, Robinson, Al Jaidah, Pierce, Thoppil and Rohner. This is an open-access article distributed under the terms of the Creative Commons Attribution License (CC BY). The use, distribution or reproduction in other forums is permitted, provided the original author(s) and the copyright owner(s) are credited and that the original publication in this journal is cited, in accordance with accepted academic practice. No use, distribution or reproduction is permitted which does not comply with these terms.
*Correspondence: Steffen S. Bach, c3RlZmZlbi5zYW52aWcuYmFjaEBnbWFpbC5jb20=; Christoph A. Rohner, Y2hyaXNAbWFyaW5lbWVnYWZhdW5hLm9yZw==
†Present address: Steffen S. Bach, Ramboll Group, Department for Impact Assessment, Copenhagen, Denmark