 Zinaida Zabudkina
 Alexander Osadchiev
 Vladimir Ivanov
 Mikhail Makhotin4
- 1Moscow Institute of Physics and Technology, Dolgoprudny, Russia
- 2Shirshov Institute of Oceanology, Russian Academy of Sciences, Moscow, Russia
- 3Institute of Geology of Ore Deposits, Petrography, Mineralogy and Geochemistry, Russian Academy of Sciences, Moscow, Russia
- 4Arctic and Antarctic Research Institute, Saint Petersburg, Russia
- 5Moscow State University, Moscow, Russia
In this work, we describe the inter-annual variability of the Barents Sea branch water (BSBW), which is one of the main branches of the Atlantic water that flows from the North Atlantic to the Western Arctic. We analyze an extensive data set of in situ data measurements performed during warm season from 1977 to 2024 in the northeastern part of the Barents Sea and in the St. Anna Trough. This region has experienced rapid climate change during recent decades, expressed by the decrease of sea ice and increasing heat inflow from the North Atlantic. Previously, BSBW effectively cooled in the Barents Sea and had a consistently negative temperature at its eastern boundary. However, significant warming was detected in the northeast part of the Barents Sea after 2000. We demonstrate that temperature of BSBW in the northeastern part of the Barents Sea and further in the St. Anna Trough largely increased during the last 20 years. In particular, BSBW with positive temperatures has been regularly observed in the St. Anna Trough since 2008. We reveal a link between the initial temperature of the Atlantic water masses at the western boundary of the Barents Sea on the one hand and BSBW temperature at the eastern boundary of the Barents Sea on the other hand. In addition, the temperature increase of BSBW is associated with (1) strengthening of local southwesterly winds, leading to decrease of ocean-atmosphere heat loss and (2) decreased intensity of cold dense water formation at the shallow banks of the Barents Sea. Finally, we confirm the results of previous model studies, which demonstrated the shift of the cooling zone from the Barents Sea to the St. Anna Trough. In particular, we show that during the recent years cooling of BSBW continues in the St. Anna Trough by mixing with cold dense water. The observed warming of BSBW accompanied by its salinity decrease, which is observed during the last 15 years, could significantly affect thermohaline structure and circulation in the Arctic Ocean.
1 Introduction
Warm and saline Atlantic water mass (AWM) reach the Arctic basin through two pathways — via the Fram Strait and the Barents Sea. The southern branch of AWM, known as the Barents Sea branch water (BSBW), undergoes cooling in the Barents Sea primarily due to heat loss to atmosphere, and subsequently spreads toward the Eurasian continental slope along the eastern flank of the St. Anna Trough (SAT) in the northern Kara Sea (Panteleev et al., 2006, 2007; Smedsrud et al., 2013) (see Figure 1). It is also influenced by sea ice formation, which is accompanied by brine rejection over shallow banks and coastal polynyas in the Barents Sea, resulting in formation of cold dense water (CDW) (Årthun et al., 2011; Martin and Cavalieri, 1989; Ivanov and Shapiro, 2005). BSBW is also modified by freshwater input due to ice melting, precipitation, and river runoff (Rudels et al., 2004).
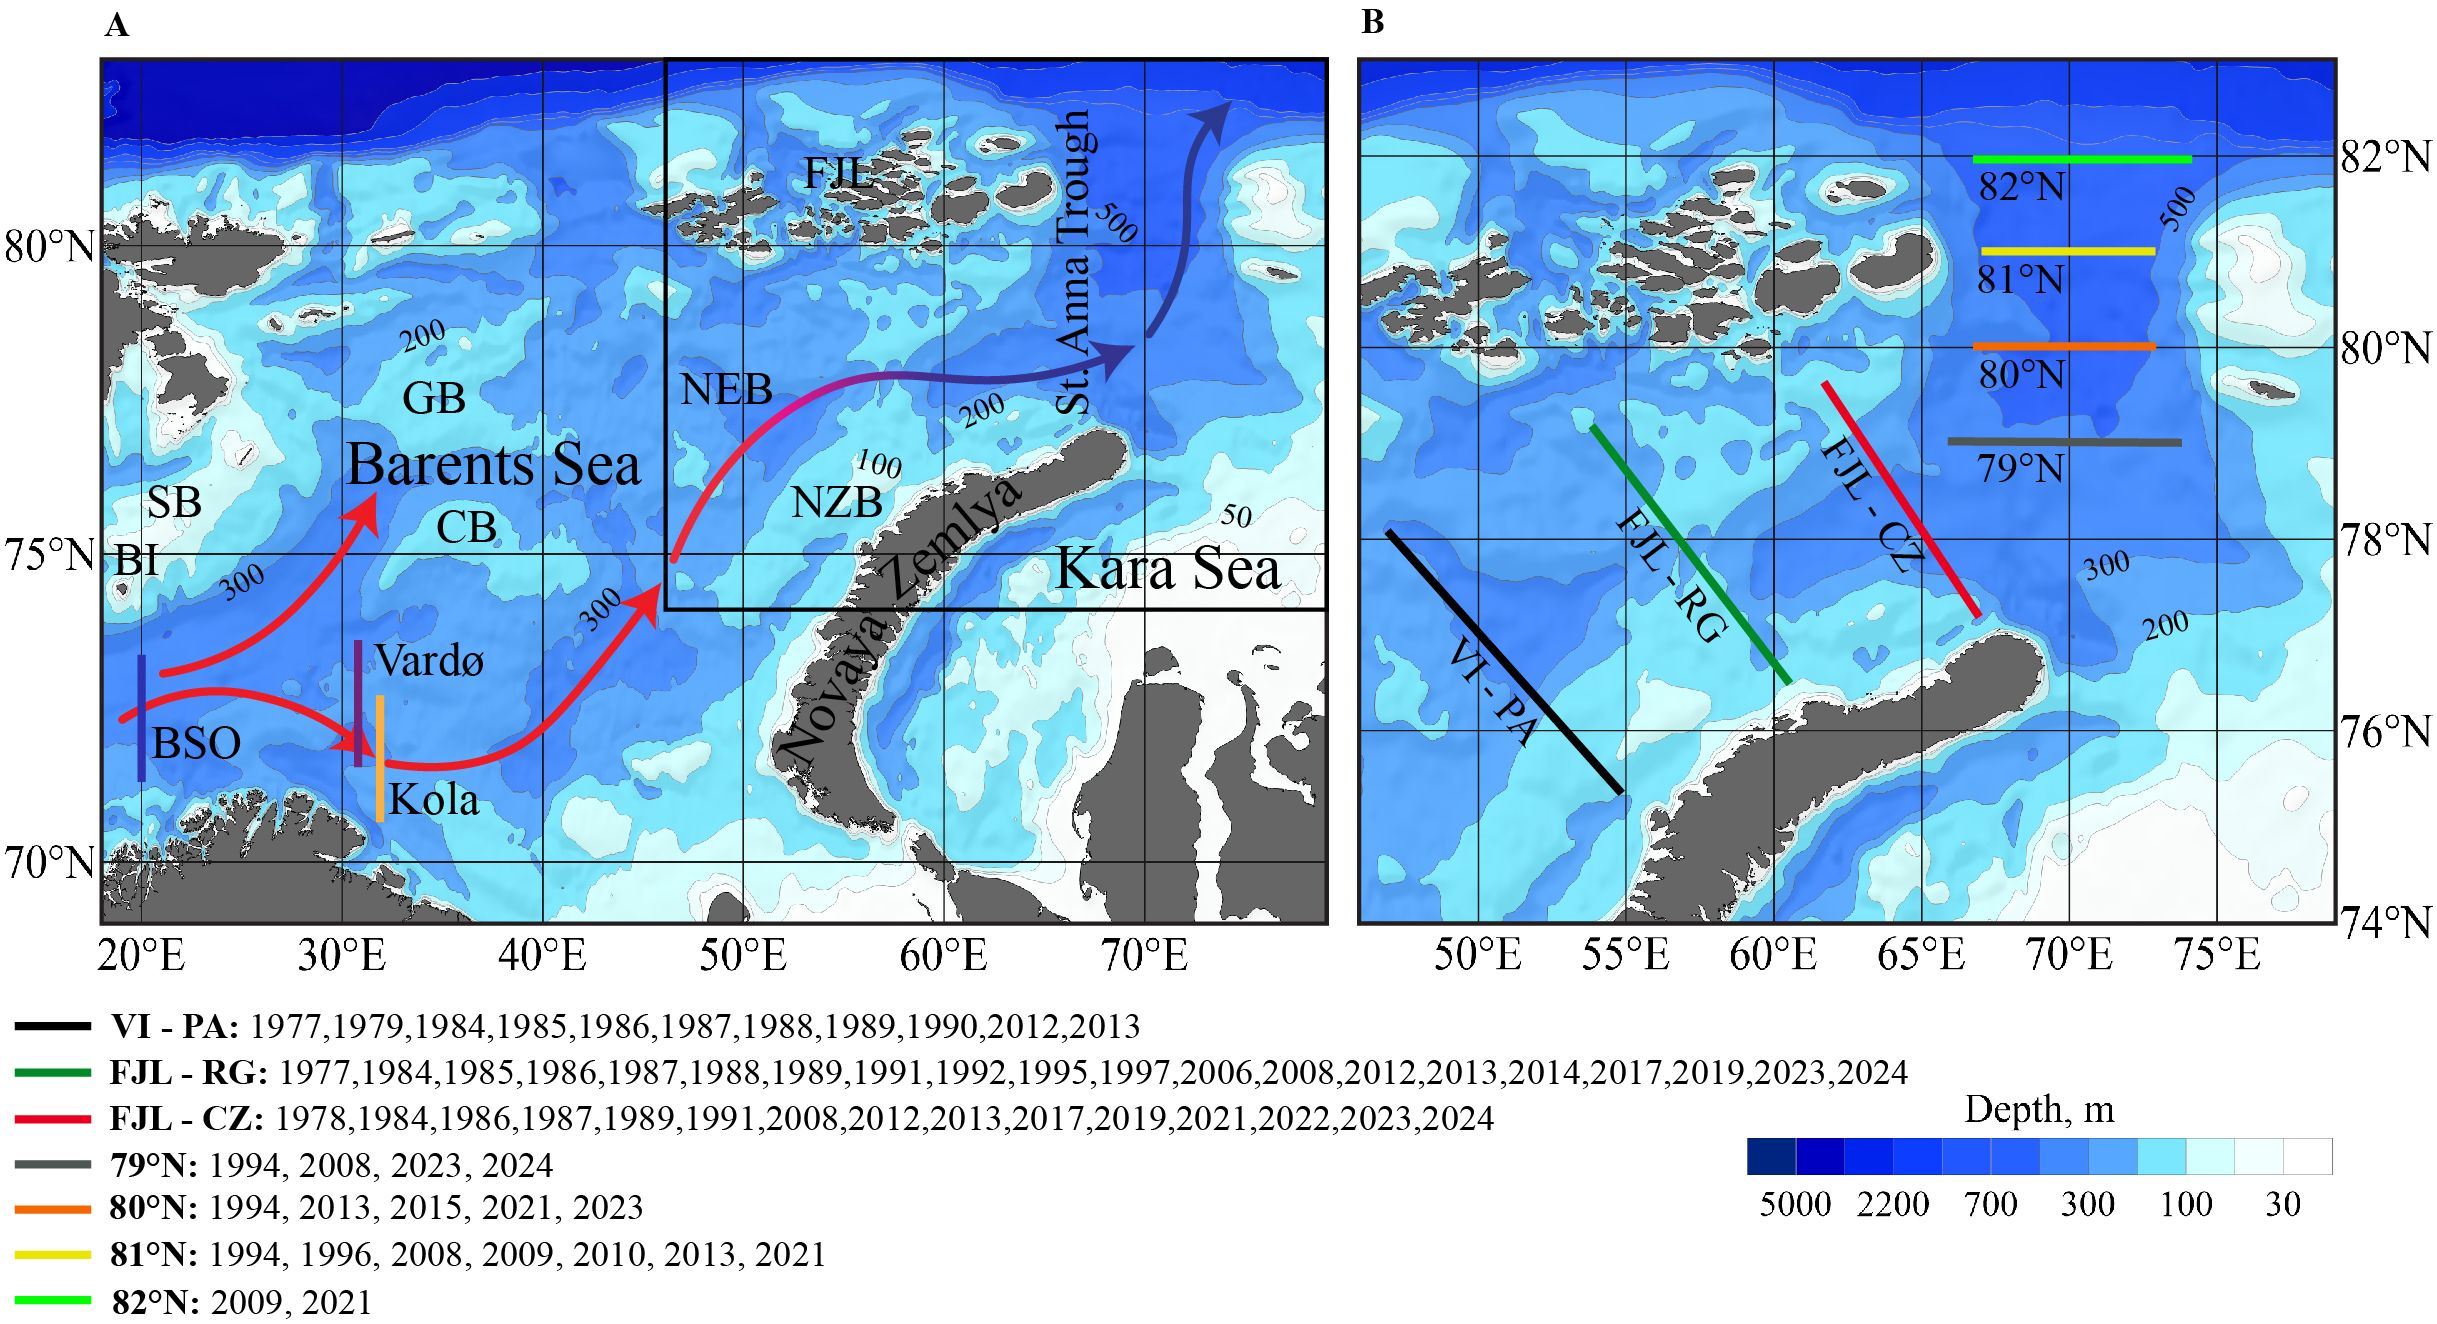
Figure 1. (A) A map of the Barents Sea and the St. Anna Trough illustrating general circulation scheme of the Atlantic Water inflow through the Barents Sea Opening (BSO) (red arrows relate to warmer inflow, blue arrows relate to cooler inflow). The blue, purple and orange lines indicate the Fugløya–Bear Island section, Vardø - North section and the Kola section, respectively. SB, Spitsbergen Bank; CB, Central Bank; GB, Great Bank; NZB, Novaya Zemlya Bank; BI, Bear Island; FJL, Franz Josef Land; NEB, North-Eastern Basin. (B) Location of the oceanographic transects in the northeastern part of the Barents Sea and in the St. Anna Trough in 1977-2024. Caption below the picture indicates years of measurements at these transects.
During the last 40 years, the Arctic Ocean has experienced significant changes due to global warming. The most pronounced alterations occurred in the Barents Sea, which is a natural boundary between two climatic regions: the cold, stratified, and seasonally ice-covered Arctic region, and the warm, well-mixed, ice-free Atlantic region (Loeng, 1991). Currently, a process generally referred to as “atlantification” (Årthun et al., 2012; Polyakov et al., 2017) is underway, which is in fact a specific oceanic response (positive feedback) to thinner and less consolidated sea ice coverage (Ivanov, 2023). In the Barents Sea atlantification is provided by an unprecedented reduction of sea ice extent (Årthun et al., 2012; Onarheim and Årthun, 2017) and increasing heat transport from the North Atlantic (Smedsrud et al., 2013; Skagseth et al., 2020; Tsubouchi et al., 2021), which lead together to weaker stratification and enhanced vertical mixing in the northern Barents Sea (Lind et al., 2018).
The decrease in sea ice extent is primarily associated with increase in Atlantic water heat transport into the Barents Sea through the western side of the Barents Sea also referred to as the Barents Sea Opening (BSO) (Årthun et al., 2012; Stroeve et al., 2014). The contribution of this increase in AWM temperature to interannual changes is more important than changes in volume transport of AWM (Årthun et al., 2012; Skagseth et al., 2008; Lien et al., 2017). In addition, it is probably linked with decrease of sea-atmosphere heat flux, which is explained by strengthening of warm southerly winds (Skagseth et al., 2020; Cai et al., 2022), as well as changes in sea-ice import from the Kara Sea and the central Arctic Ocean to the Barents Sea (Lind et al., 2018).
However, the impact of atlantification on the transformation of AWM in the Barents Sea is not yet fully understood due to the lack of measurements in the northeastern Barents Sea and in SAT. It is now believed that the Barents Sea previously played the role of a buffer zone, where a substantial portion of the advected ocean heat was lost to atmosphere during the transit of AWM from BSO to the Kara Sea. As a result, temperature of BSBW at the eastern boundary of the Barents Sea had to be maintained nearly constant and close to zero (Smedsrud et al., 2013; Skagseth et al., 2020). Other studies also revealed significant warming in the northeastern Barents Sea after 2000 (Lien and Trofimov, 2013; Barton et al., 2018). In the recent study, Skagseth et al. (2020) concluded that heat loss from the Barents Sea in 2020s has decreased compared to the 1990s. Thus, the Barents Sea is no longer an efficient buffer cooling zone, and warmer water now could reach the Arctic Basin (Skagseth et al., 2020). Other studies, however, showed that the cooling zone has shifted poleward (Barton et al., 2018; Moore et al., 2022; Lien and Trofimov, 2013). Numerical modeling suggests that large share of the heat inflowing from the Barents Sea is still lost before reaching the continental slope (Shu et al., 2021), which happens mainly during the winter season (Sumkina et al., 2023).
Transformation of BSBW in the Barents Sea is also associated with formation of CDW at the shallow banks of the Barents Sea, including Central Bank, Great Bank, Spitsbergen Bank, and Novaya Zemlya Bank (Aagaard et al., 1981; Midttun, 1985; Loeng, 1991; Quadfasel et al., 1992; Ivanov and Shapiro, 2005; Ivanov and Tuzov, 2021). Årthun et al. (2011) concluded that in recent years formation of CDW on these shallow banks has significantly decreased during warm winters (Årthun et al., 2011). Martin and Cavalieri (1989) followed by Lien and Trofimov (2013) (using data from 2008) also identified an additional source of dense water formation located southwestward from the Franz Josef Land (Martin and Cavalieri, 1989; Lien and Trofimov, 2013). Furthermore, Lien and Trofimov noted the absence of dense water sinking from the Novaya Zemlya Bank into the Northeast Basin. They concluded that the region of dense water formation off the coast of Novaya Zemlya had shifted northward in 2008 compared to 1991 due to varying atmospheric conditions. They also associated this shift with a significantly higher temperature of BSBW observed at the eastern boundary of the Barents Sea in 2008 compared to 1991. They suggested that due to the northward shift of the CDW source (where mixed and cooled BSBW was previously observed), BSBW in 2008 had a higher fraction of Atlantic water and was correspondingly warmer, which was confirmed by in situ measurements.
As a result of convective processes, mixing with CDW and fresh surface water, the range of AWM density in the Barents Sea increases significantly as it approaches the continental slope. Schauer et al. (2002a) and Rudels et al. (2013) described two water masses with different characteristics at the 81.25°N section in 1996. Cold and less saline water formed the intermediate layer (T < −1°C, S ∼ 34.75), while slightly warmer and more saline water (T ∼ -0.5°C, S between 34.8 and 34.9) occupied the deepest part of the trough (Schauer et al., 2002a; Rudels et al., 2013). The fresher and colder water had characteristics similar to those of CDW, which formed as a result of ice formation and brine rejection over shallow banks in the Barents Sea (Schauer et al., 2002b). Rudels et al. (2013) also suggested that a less dense intermediate water mass could be formed on the shelf of the Kara Sea and descend directly into the SAT (Rudels et al., 2013). The denser and warmer water mass was mainly the Atlantic Water, that was cooled and freshened by mixing with brine-rich water formed primarily at the Novaya Zemlya Bank (CDW, although having increased salinity as a result of brine rejection during ice formation at the shallow banks, could still remain fresher than BSBW and decrease its salinity after being mixed). Lien and Trofimov (2013), and then Dmitrenko et al. (2015), based on in situ measurements in 2008, described the previously unidentified “true” BSBW, which contains the Atlantic water core, which is the least transformed by mixing with CDW, river runoff and precipitation. “True” BSBW is characterized by high temperature and salinity (T > 0°C, S > 34.9) (Dmitrenko et al., 2015; Lien and Trofimov, 2013). At the same time, “true” BSBW is not observed during every year, and the densest part of the flow could be formed by CDW. According to the data obtained from a mooring-based CTD in the eastern part of SAT at 81°N, Dmitrenko et al. (2015) detected “true” BSBW in December 2009 - January 2010. However, it was not observed during the rest of the measurement period, i.e., from September to December 2009 and then from January to September 2010. In addition, according to the mooring data collected from September 2006 to September 2007 in the Nansen Basin to the north from the Severnaya Zemlya, a trace of “true” BSBW, indicated by increased temperature and salinity, was observed from March to May at depths of 800–1800 m. Dmitrenko et al. (2015) associated the appearance of “true” BSBW with an increase in temperature and salinity of AWM at the western boundary of the Barents Sea. As a result, the extent of the sea ice decreases and, accordingly, the contribution of CDW and freshening due to melt water to the transformation of AWM decreases (Årthun et al., 2011). Based on numerical modeling, Smedsrud et al. (2013) also found a correlation between heat inflow to BSO and the density of BSBW at the eastern boundary of the Barents Sea (Smedsrud et al., 2013).
Thus, the entire outflow entering SAT through the eastern boundary of the Barents Sea and further to the continental slope could be divided into a cold and relatively fresh intermediate layer formed mainly by CDW and the bottom layer formed by the saltier and warmer core of the Atlantic water. CDW could episodically appear below the Atlantic water core, as was observed at the mooring station from May to September 2010 (Dmitrenko et al., 2015). Lien and Trofimov (2013) showed that the intermediate water layer was formed by waters originating from southwest of the Franz Josef Land, while cold bottom waters were formed at the shelf westward from the Novaya Zemlya (Lien and Trofimov, 2013). In our work, we will refer to water mass with relatively small Atlantic component, formed as a result of ice formation and brine rejection, as Cold Dense water. The warmest and saltiest water layer will be considered as BSBW since it contains the core of Atlantic water (see Table 1 for definitions of water masses).
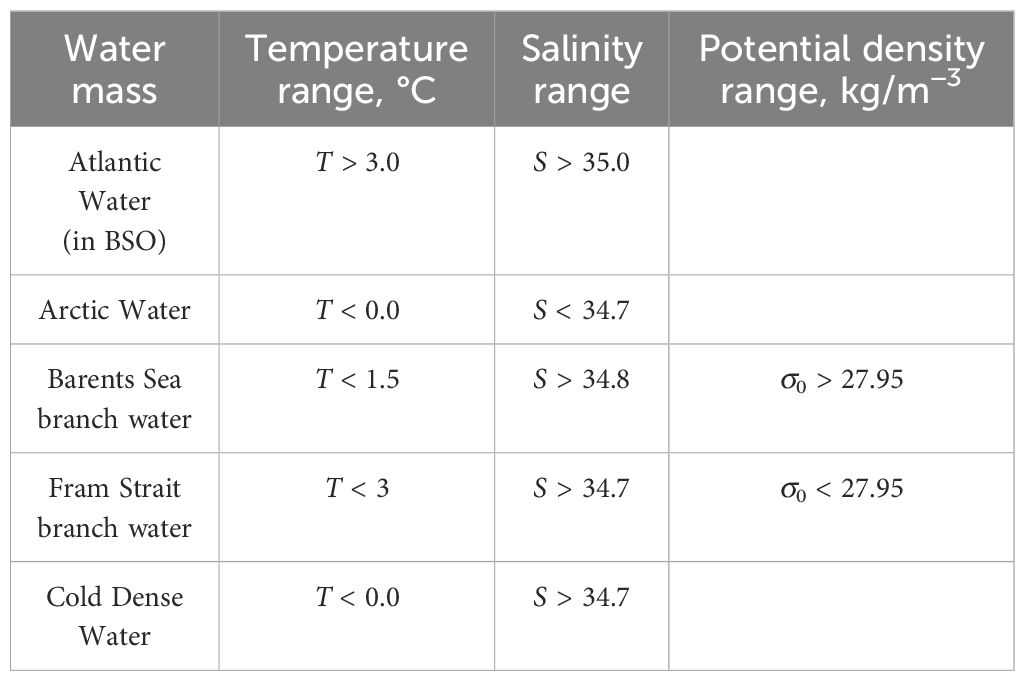
Table 1. Definitions of water masses present in the northeastern part of the Barents Sea and in SAT analyzed in this study.
Previous studies were mainly focused on the detailed description of BSBW characteristics for several individual years (Dmitrenko et al., 2015; Lien and Trofimov, 2013; Schauer et al., 2002a). Another group of papers were based on numerical modeling were focused on the decrease of sea ice coverage Årthun et al. (2012); Lien et al. (2017) or the decrease in the efficiency of heat loss to atmosphere in the Barents Sea Skagseth et al. (2020); Shu et al. (2021). Our analysis is based on a large dataset of in situ measurements, large share of them was not published before. This data set covers more than 30 years and is organized at 7 oceanographic sections from the northeastern Barents Sea to the northern part of SAT. It allows us to trace the interannual variability of BSBW characteristics and its transformation on its way to the continental slope. The obtained results are extremely relevant in the context of the climate change observed in recent decades in the Barents Sea. The majority of measurements used in this study were obtained during the warm period from June to September. Therefore, our conclusions about the interannual variability of the characteristics of the BSBW are valid specifically for the warm season.
2 Data and methods
Hydrographic in situ data used in this study were collected during 43 oceanographic surveys in SAT and in the northeastern part of the Barents Sea by research vessels “Vsevolod Beryezkin”, “Professor Vise”, “Michael Sars”, “Eldjarn”, “Johan Hjort”, “Otto Schmidt”, “Professor Logachev”, “G. O. Sars”, “Polarstern”, “Akademik Vavilov”, “Dalnye Zelentsi”, “Professor Boyko”, “Obva”, “Kapitan Dranitsyn”, “Nikolay Evgenov”, “Professor Molchanov”, “Akademik Fedorov”, “Akademik Tryoshnikov”, “Mihail Somov”, “Akademik Ioffe” in 1977–2024 (Table 2). Some of these data were described and analyzed before in a dozen of papers (Gammelsrød et al., 2009; Loeng et al., 1993; Schauer et al., 2002a, 2002b; Panteleev et al., 2004; Matishov et al., 2009; Lien and Trofimov, 2013; Dmitrenko et al., 2015; Makhotin and Ivanov, 2016; Ivanov et al., 1999, 2020; Osadchiev et al., 2022), while a certain share of data is presented for the first time in this study. The vertical thermohaline structure was measured along 7 different oceanographic transects (with slight deviations of transect locations during certain years due to local sea ice conditions and field survey routes), namely, Victoria Island - Peninsula Admiralteystva (VI - PA), Franz-Josef Land Russkaya Gavan (FJL - RG), Franz-Josef Land - Cape Zhelaniya (FJL - CZ) and four quasi-zonal transects across SAT at ∼79°N, ∼80°N, ∼81°N and ∼82°N (Figure 1B). These oceanographic transects were used to analyze thermohaline characteristics of BSBW and CDW in the northeastern part of the Barents Sea and in SAT. The sections sampled in each expedition are indicated in Table 2.
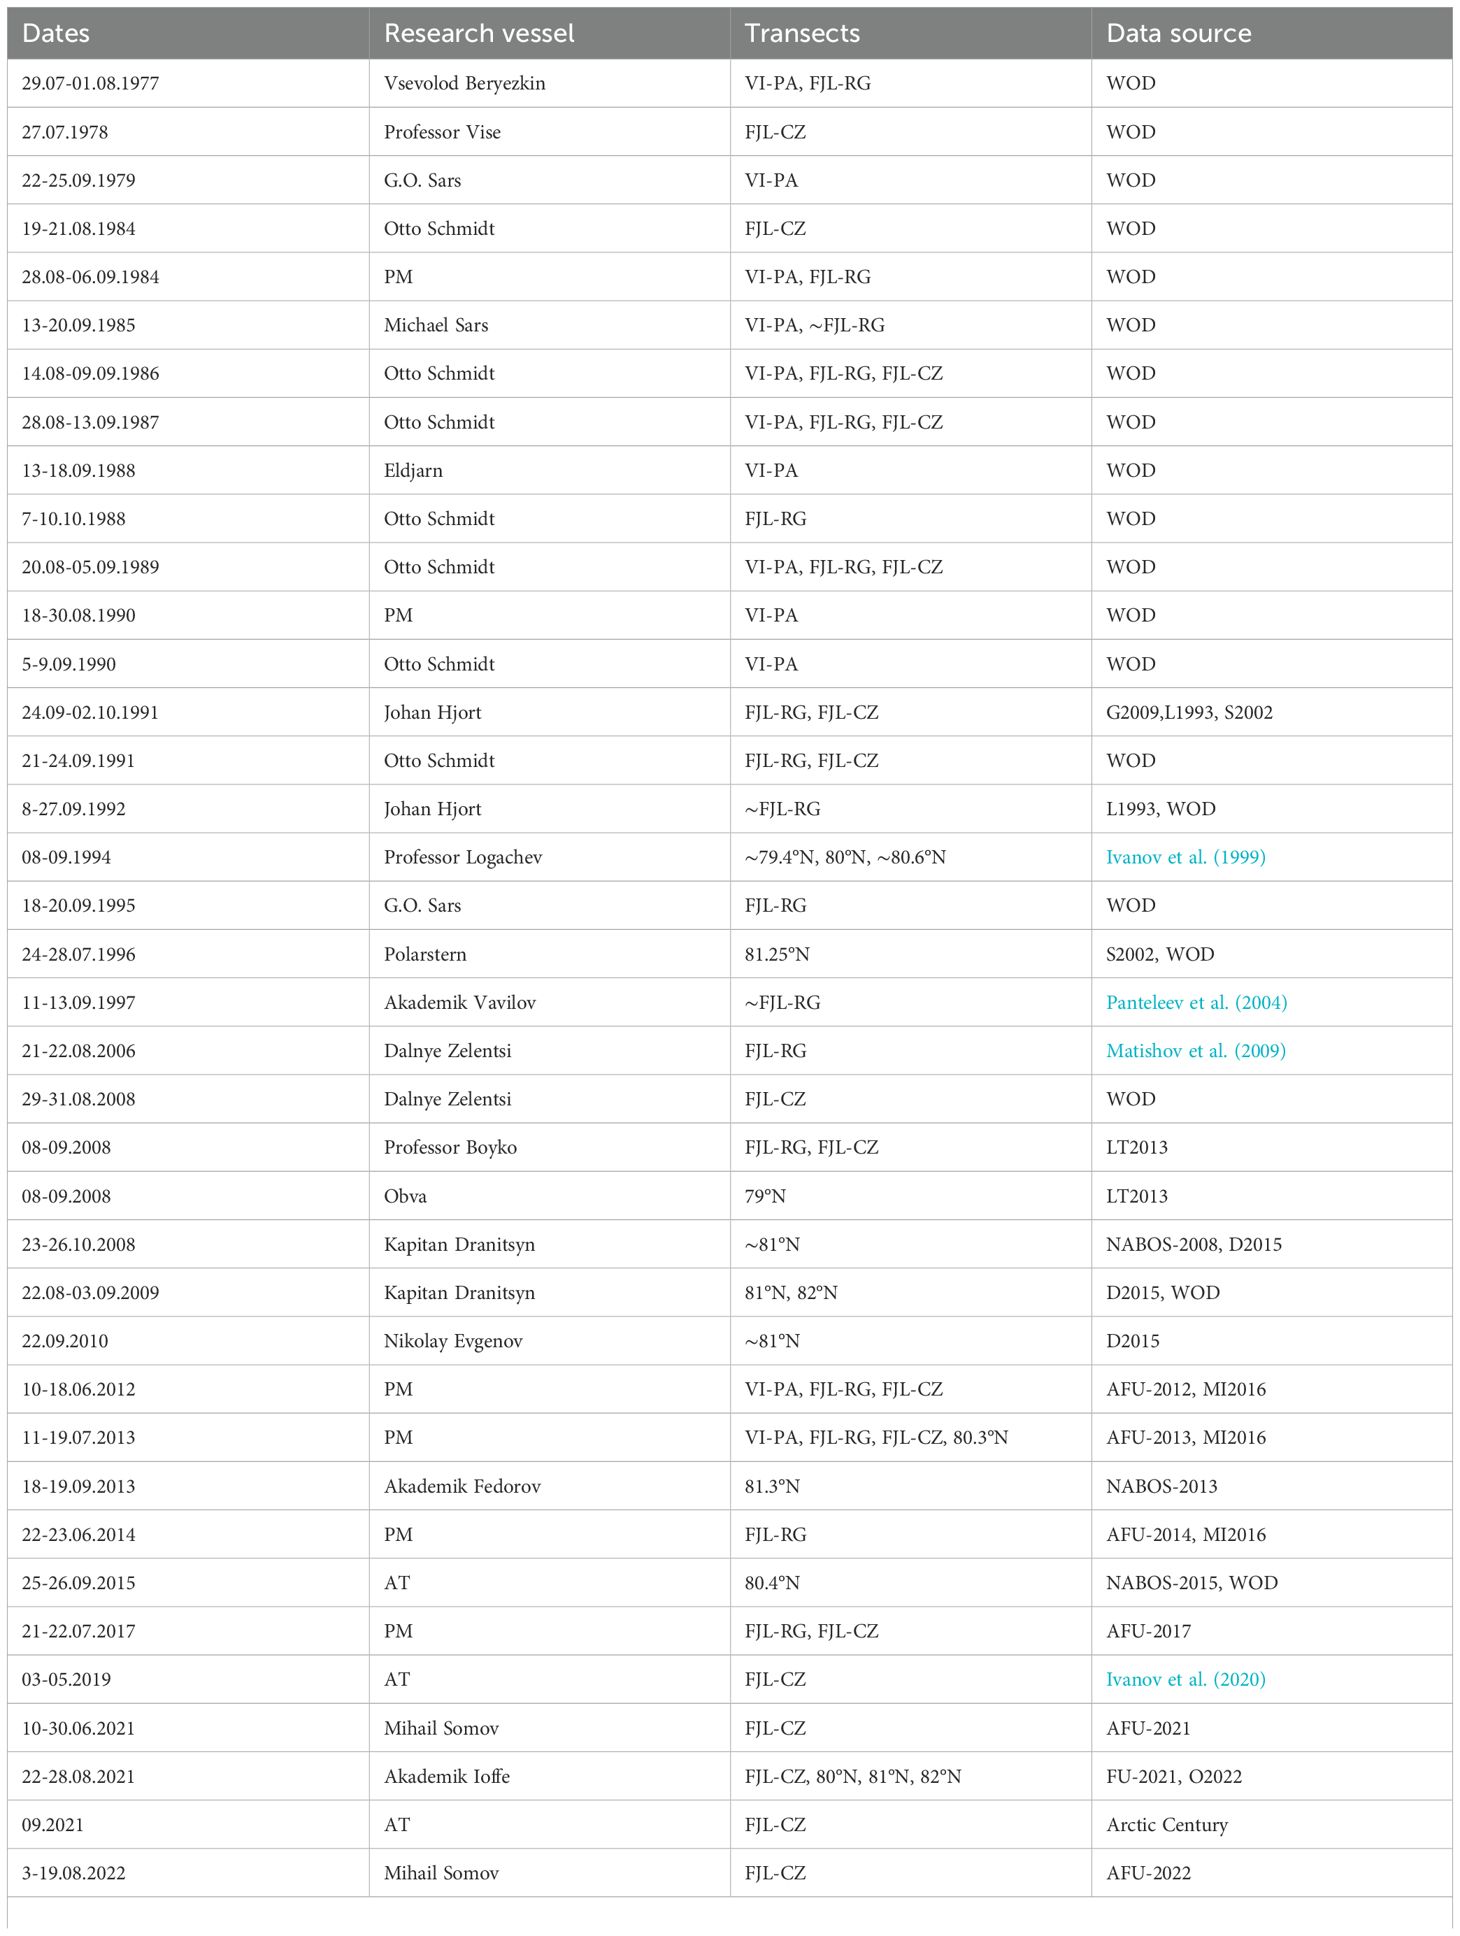
Table 2. Dates, research vessels, transects of oceanographic surveys and data source.
To analyze and compare the interannual variability of thermohaline characteristics of BSBW, characteristics of the BSBW core were identified and used at each of the sections. BSBW was identified at the TS-diagram according to its definition in Table 1 at each transect. BSBW core was considered to be the point with the maximal measured temperature of BSBW (an example is shown in Figure 2). We believe that this method of determining characteristics of the BSBW core is the most accurate, because, according to our analysis, BSBW characteristics vary significantly from year to year. In addition, they largely change along the path of BSBW from the Barents Sea to the continental slope. Therefore, it is impossible to calculate the average temperature and salinity of BSBW for each year at each section by defining this water mass by ranges of certain isotherms and isohalines. In addition, characteristics of CDW vary greatly from year to year. In particular, they are episodically observed in SAT below BSBW. Therefore, the option of averaging over a fixed spatial area cannot be applied either. In different years CDW makes different contribution to the averaged temperature over a fixed area in SAT. This process shifts temperature and salinity ranges of BSBW. For these reasons, we believe that maximal value of the BSBW temperature is the most appropriate estimation of BSBW core for our analysis.
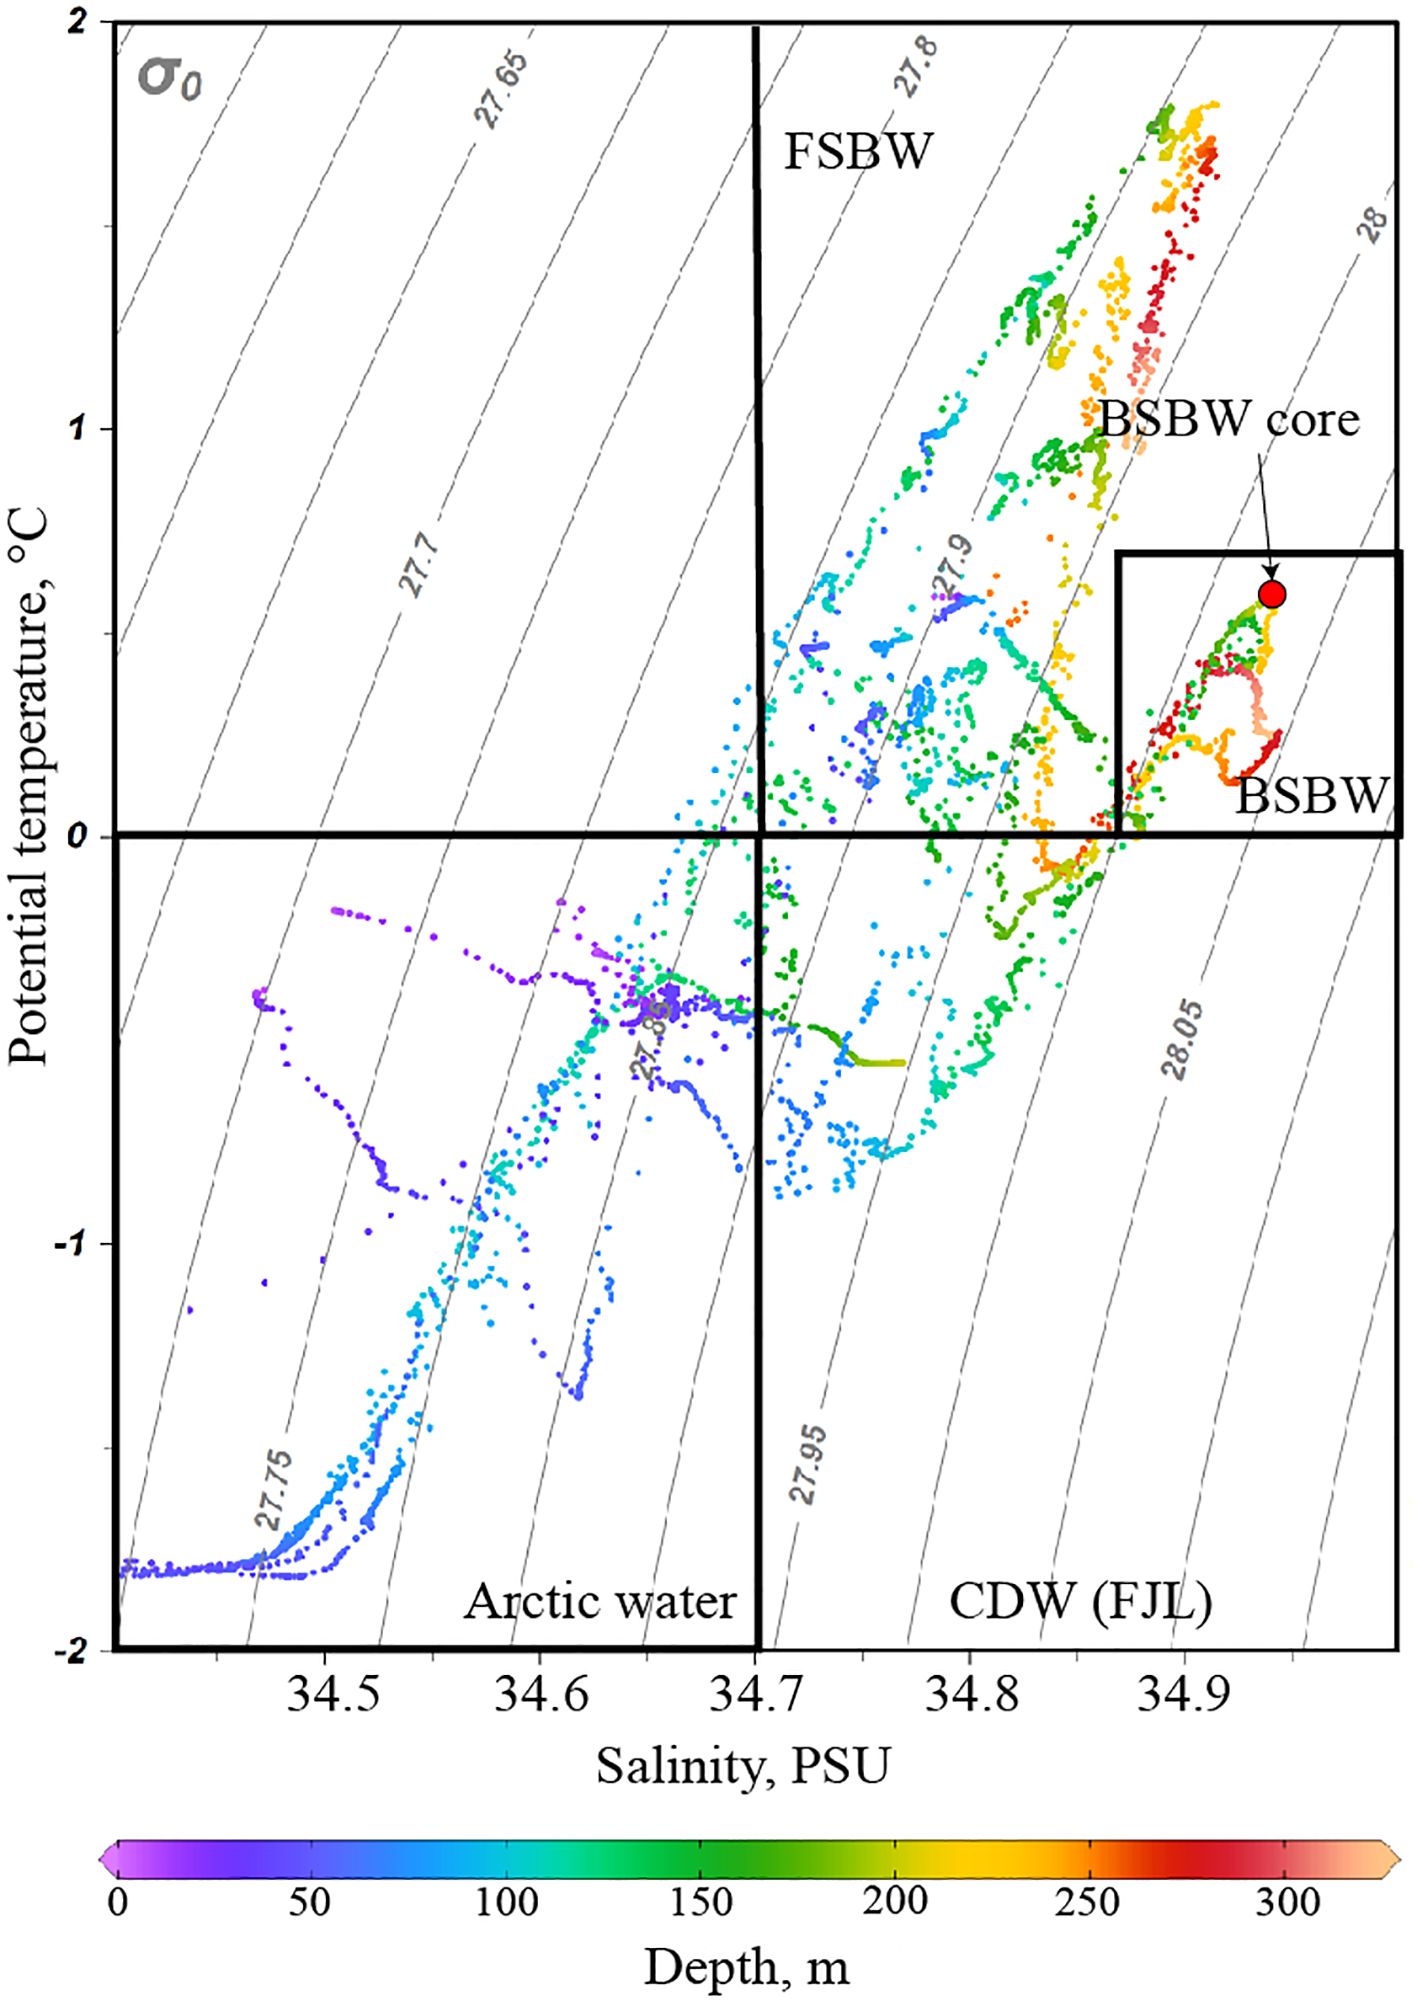
Figure 2. Definition of the BSBW core using the example of the FJL-CZ section on 10–18 June 2012.
To compare the characteristics of AWM on the western and eastern borders of the Barents Sea, we used mean annual temperature and salinity data from the Fugløya–Bear Island transect averaged between 71.5°N and 73.5°N (at the longitude of 20°E) over 50–200 m depth range and from the Vardø - North section averaged between 72.25°N and 74.25°N (at the longitude of 31.2°E) over 50–200 m depth range. Both data sets were collected by Institute of Marine Research, Norway and are available until 2024 through the International Council for the Exploration of the Sea (ICES) portal (http://ocean.ices.dk/iroc/). Additionally, we used observations from the Kola transect between 70.5° and 72.5°N (at the longitude of 33.5°E). Measurements were carried out by Knipovich Polar Research Institute of Marine Fisheries and Oceanography, Russia. We consider mean annual temperature and salinity data over 0–200 m depth range (available through the International Council for the Exploration of the Sea (ICES) portal (http://ocean.ices.dk/iroc/) until 2021). We also used monthly temperature data from this section, previously available through www.pinro.ru until 2020 (access is currently closed). To reveal a link between the characteristics of AWM at the western and eastern boundaries of the Barents Sea, the Pearson correlation coefficient was calculated. The statistical significance of the difference between two BSBW temperature means at the FJL-RG transect, before and after 2000, was calculated using two-sample t-test.
Atmospheric conditions in the study area were examined using the ERA5 atmospheric reanalysis with a 0.25° spatial using monthly mean values (Hersbach et al., 2020). We used surface zonal and meridional wind stress, sensible and latent heat fluxes, net values of solar and thermal radiation fluxes, sea surface temperature and 2 m air temperature. All fluxes were defined positive upward. The heat flux and atmospheric conditions were calculated as the average value of monthly values in the region of 20-55°E and 69-77°N, since this is an approximate area of direct contact of AWM with atmosphere. Sea ice coverage was regarded as present if sea ice concentration exceeded 15%. Data on ice concentration were also taken from the ERA5 atmospheric reanalysis.
3 Results
Analysis of in situ measurements conducted during 42 expeditions over 30 years revealed significant changes in temperature of BSBW after 2000 as compared to the previous decades. BSBW temperature at the FJL - RG section, based on data from 1977 to 1997, varied between -0.8°C and 0.5°C, while at the eastern boundary of the Barents Sea (FJL - CZ transect) and further in SAT it was -1°C - -0.2°C (Figure 3A). Therefore, Smedsrud’s assumption that BSBW has a near-zero temperature at the eastern boundary of the Barents Sea is apparently not entirely correct. The range of BSBW temperature is still quite large, however, at the eastern boundary of the Barents Sea (CZ - FJL transect) and further in SAT, the BSBW core has negative temperatures observed at all available sections.
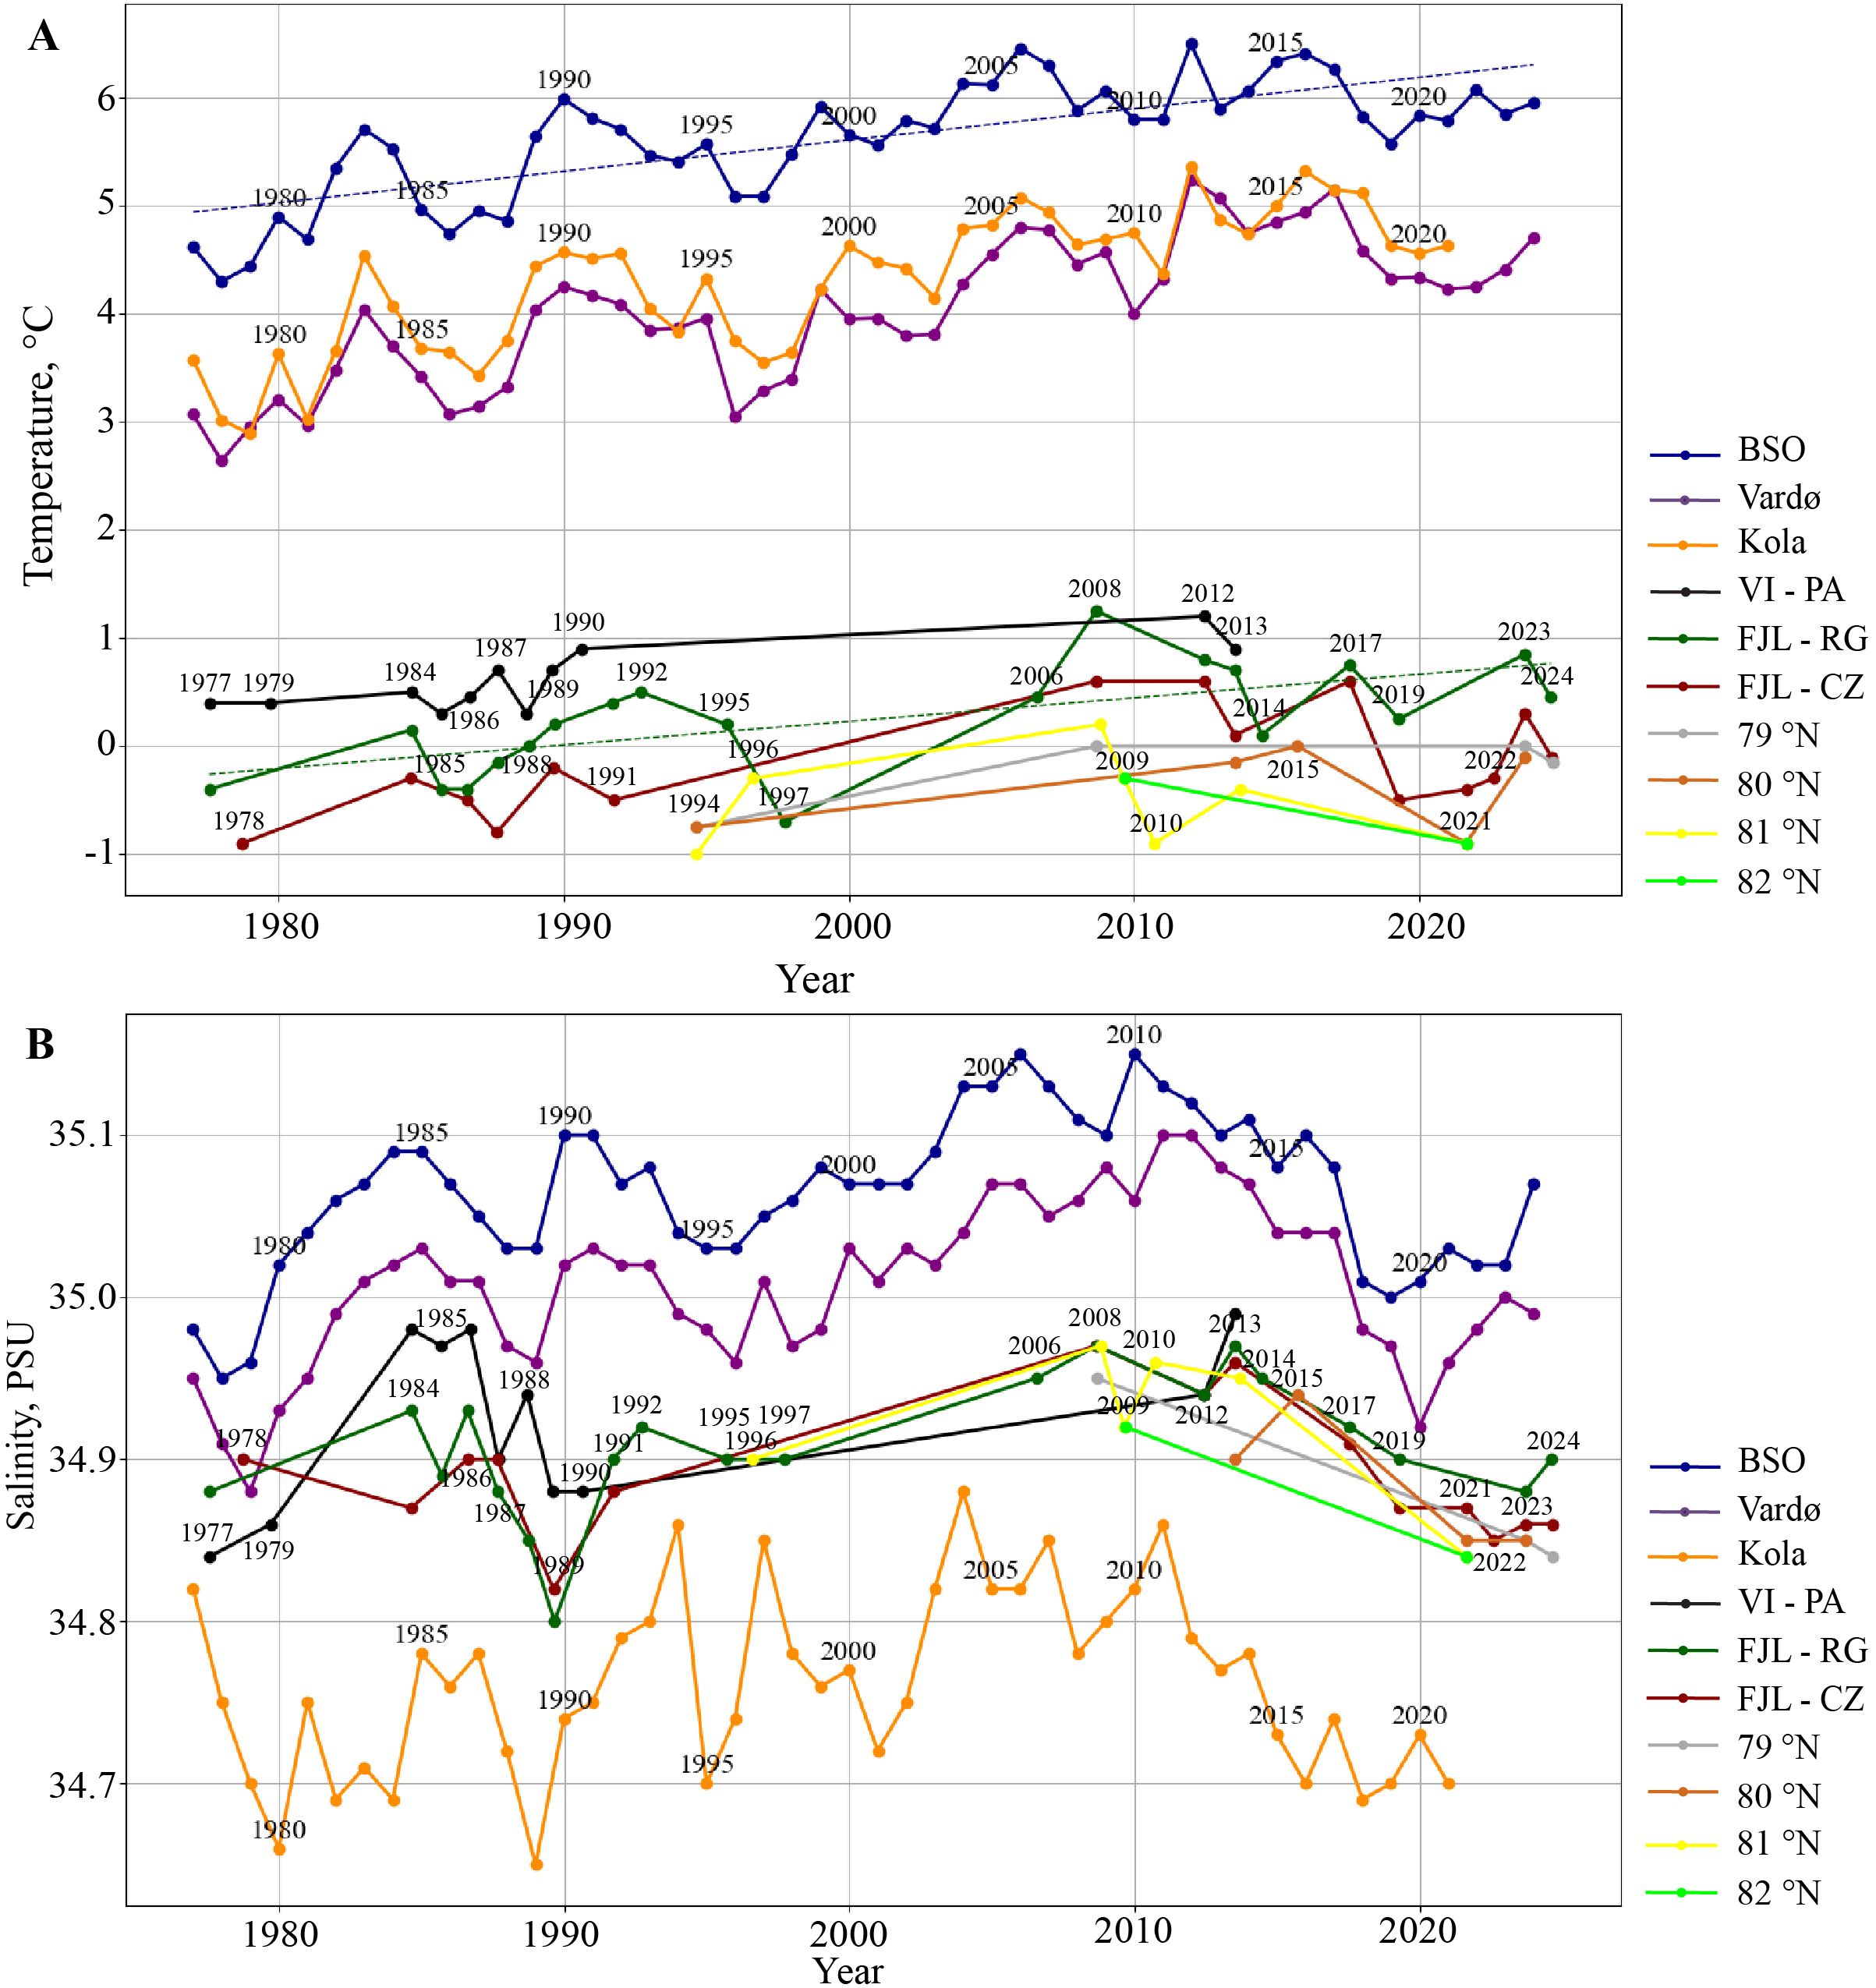
Figure 3. Average temperature (A) and salinity (B) of AWM at BSO, Vardø and Kola transects based on in situ measurements from 1977 to 2024 (blue, purple and orange lines); BSBW core temperature (A) and salinity (B) at transects in the northeastern part of the Barents Sea and in SAT based on in situ measurements from 1977 to 2024 (black, green, brown, gray and yellow lines). The dashed lines show the temperature trend of AWM at the BSO section (blue dashed line) and BSBW at the FJL-RG section (green dashed line).
In situ measurements in 2006-2024, however, show that the core BSBW temperature in the northeastern part of the Barents Sea and SAT has increased significantly as compared to the period before 2000 (Figure 3A). At the FJL - RG transect, temperature varied from 1.25°C in 2008 to 0.1°C in 2014. Two-sample t-test showed statistical significance of the difference between two BSBW temperature means, namely, before and after the year 2000. According to data from the FJL - CZ section, the highest temperatures were registered in 2008, 2012 and 2017 when the BSBW core temperature was 0.6°C, while the lowest temperatures -0.5°C and -0.4°C were recorded in 2019 and 2021. However, in 2019, the measurements were taken earlier (May) than all other measurements in our dataset. It could have influenced the fact that BSBW temperature was the lowest registered at this year. In SAT, in contrast to measurements made before 2000, near-zero and even positive temperatures were been recorded. Therefore, in 2008, at the ∼81°N section, temperature of the BSBW core was 0.2°C, while in 2015 at 80.4°N the temperature was around 0°C. In addition, in the north-eastern part of the Barents Sea, the core temperature of BSBW has a tendency to increase in temperature (0.2°C per 10 years for the FJL-RG section), which is also statistically significant. As for salinity, the distinct increasing salinity trend of AWM observed in 1990–2010 switched to gradual decreasing at all sections during the last 15 years.
We also want to analyze in more detail the years in which we have measurements from several sections in the northeastern part of the Barents Sea (PA-VI, RG-FJL, CZ-FJL). Based on these data, we could trace the influence of CDW (formed at the Novaya Zemlya Bank and off the coast of the Franz Josef Land) on the transformation of BSBW.
All available measurements in 1977–1997 in the northeastern part of the Barents Sea indicate formation of very cold and saline CDW at the Novaya Zemlya Bank. At the VI-PA section, their temperature varies from -1.55°C to -1.9°C, and salinity is 34.9-35. After being formed, CDW gradually mixes with BSBW. At the FJL-RG section, its temperature increases to -0.9°C - -1.8°C, and salinity decreases to 34.74-34.97 in different years. By the FJL-CZ section, CDW almost completely mixes with BSBW and in most years it is no longer detectable by thermohaline measurements. In 1984 and 1986, the FJL-CZ transect reaches the Franz Josef Land and CDW formed to the south of it is also observed. CDW characteristics during these years were up to -1.35°C - -1.43°C and 34.75-34.81.
According to Lien and Trofimov (2013), in 2008, CDW formed southwestward from the Franz Josef Land with temperature down to -1.6°C and salinity between 34.7 and 34.9. In contrast, dense water formed north of Novaya Zemlya was significantly warmer (-0.58°C) and more saline (34.95), which indicates its mixing with AWM. Bottom water with similar characteristics (-0.6°C, 34.94) was further observed in the northern part of SAT (Lien and Trofimov, 2013).
In situ measurements in 2012 indicate that CDW was formed over the Novaya Zemlya Bank, which is consistent with observations in 1991 and is located further south as compared to the situation observed in 2008 (Figure 4; Supplementary Figure S1). Both at the shelf and at the North-Eastern Basin, temperature of dense water was as low as -0.6°C, but salinity of these waters at the bottom of the North-Eastern Basin was higher (34.92) than at the shelf of the Novaya Zemlya (34.88), probably as a result of mixing with BSBW. BSBW in this section (PA - VI) had two cores, one of which already sunk to depth and lost contact with atmosphere. The second core was still on the surface, its temperature and the salinity were 3.6°C and 34.94, respectively. Dense water formation southwest of the Franz Josef Land was observed at the northern part of the FJL - RG transect. Similarly to 2008, this water was colder (-1°C - -0.6°C) and fresher (34.72-34.83) than CDW at the Novaya Zemlya Bank. Minimal values of temperature and salinity could not be clearly identified, as the transect extended only to 78.18°N. At FJL - CZ transect, e.g., gradual mixing of CDW with AWM was observed, causing AWM temperature to decrease to 0.6°C. Temperature of intermediate waters, predominantly formed near the coast of the Franz Josef Land, increased to -0.2 - -0.8°C. CDW from the Novaya Zemlya Bank became practically undetectable at this section and was no longer traced at the FJL - CZ transect as a separate water mass due to mixing with BSBW.
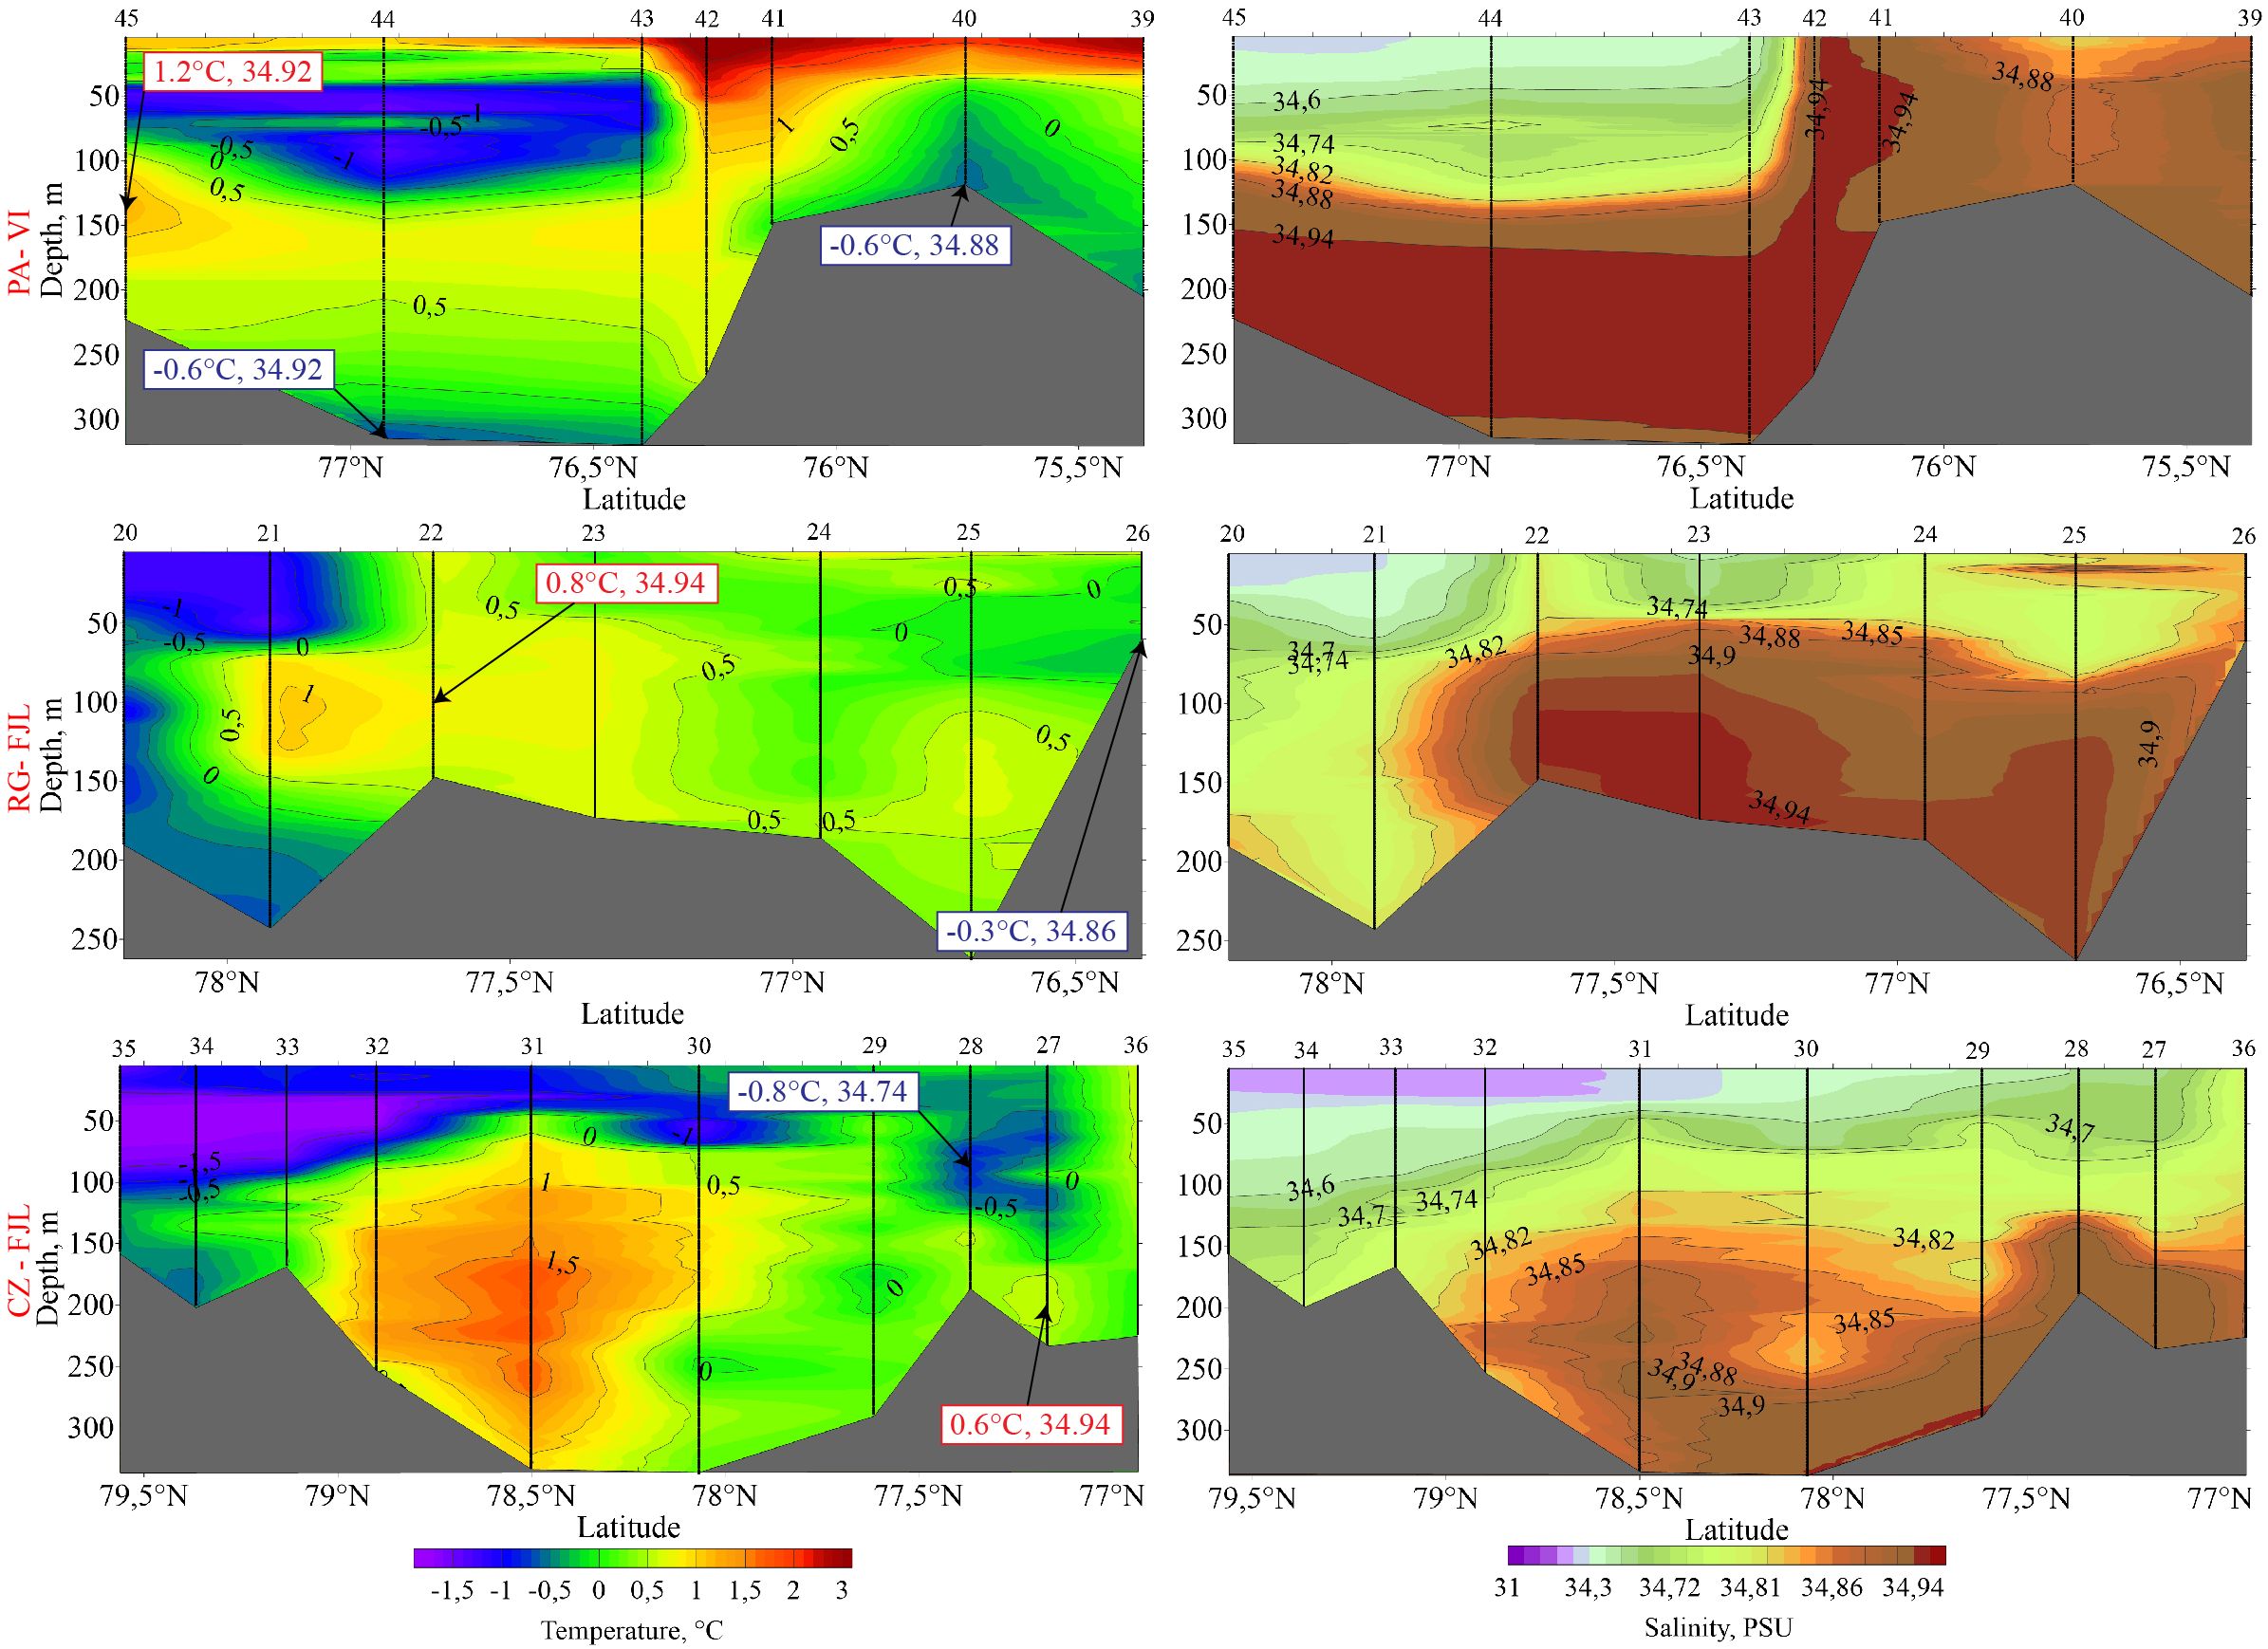
Figure 4. The vertical temperature and salinity structure along the transects VI - PA, FJL - RG and FJL CZ in the northeastern part of the Barents Sea on 10–18 June 2012. Numbers show the temperature and salinity of the BSBW core (red) and CDW (blue).
In 2013, two BSBW cores with temperature of 0.9°C and salinity of 34.99 were also observed at the PA-VI section. Very dense waters with temperatures close to the freezing point (-1.8°C) and salinity up to 35.15 were formed at the Novaya Zemlya Bank, which indicates very active formation of CDW during that year (Figure 5; Supplementary Figure S2). At the FJL - RG transect, due to mixing with the warmer and less saline BSBW, CDW had a temperature minimum of -1.1°C and a salinity maximum of 34.97. BSBW in turn cooled down to 0.7°C. At this transect, as well as at the VI - PA transect, dense water formation to the south of the Franz Josef Land with temperatures down to -1.6°C and salinity equal to 34.7-34.85 was also observed. At the FJL - CZ transect, as observed in 2012, there was a steady mixing of BSBW with CDW, resulting in cooling of BSBW to 0.1°C and a decrease in its salinity to 34.96. The intermediate waters had temperature of -1 - -0.4°C and a rather low salinity of ∼34.8, indicating that water formed at the shelf of the Franz Josef Land made up a larger fraction of intermediate waters than CDW from the Novaya Zemlya Bank. CDW from the Novaya Zemlya Bank, however, was not traced in this transect, although it appears again at 80.3°N with temperature of -0.8°C - -1.2°C and salinity of 34.92, which probably indicates a pulsating nature of the outflow of CDW. BSBW at this section cools down to -0.15°C and is freshened to 34.9.
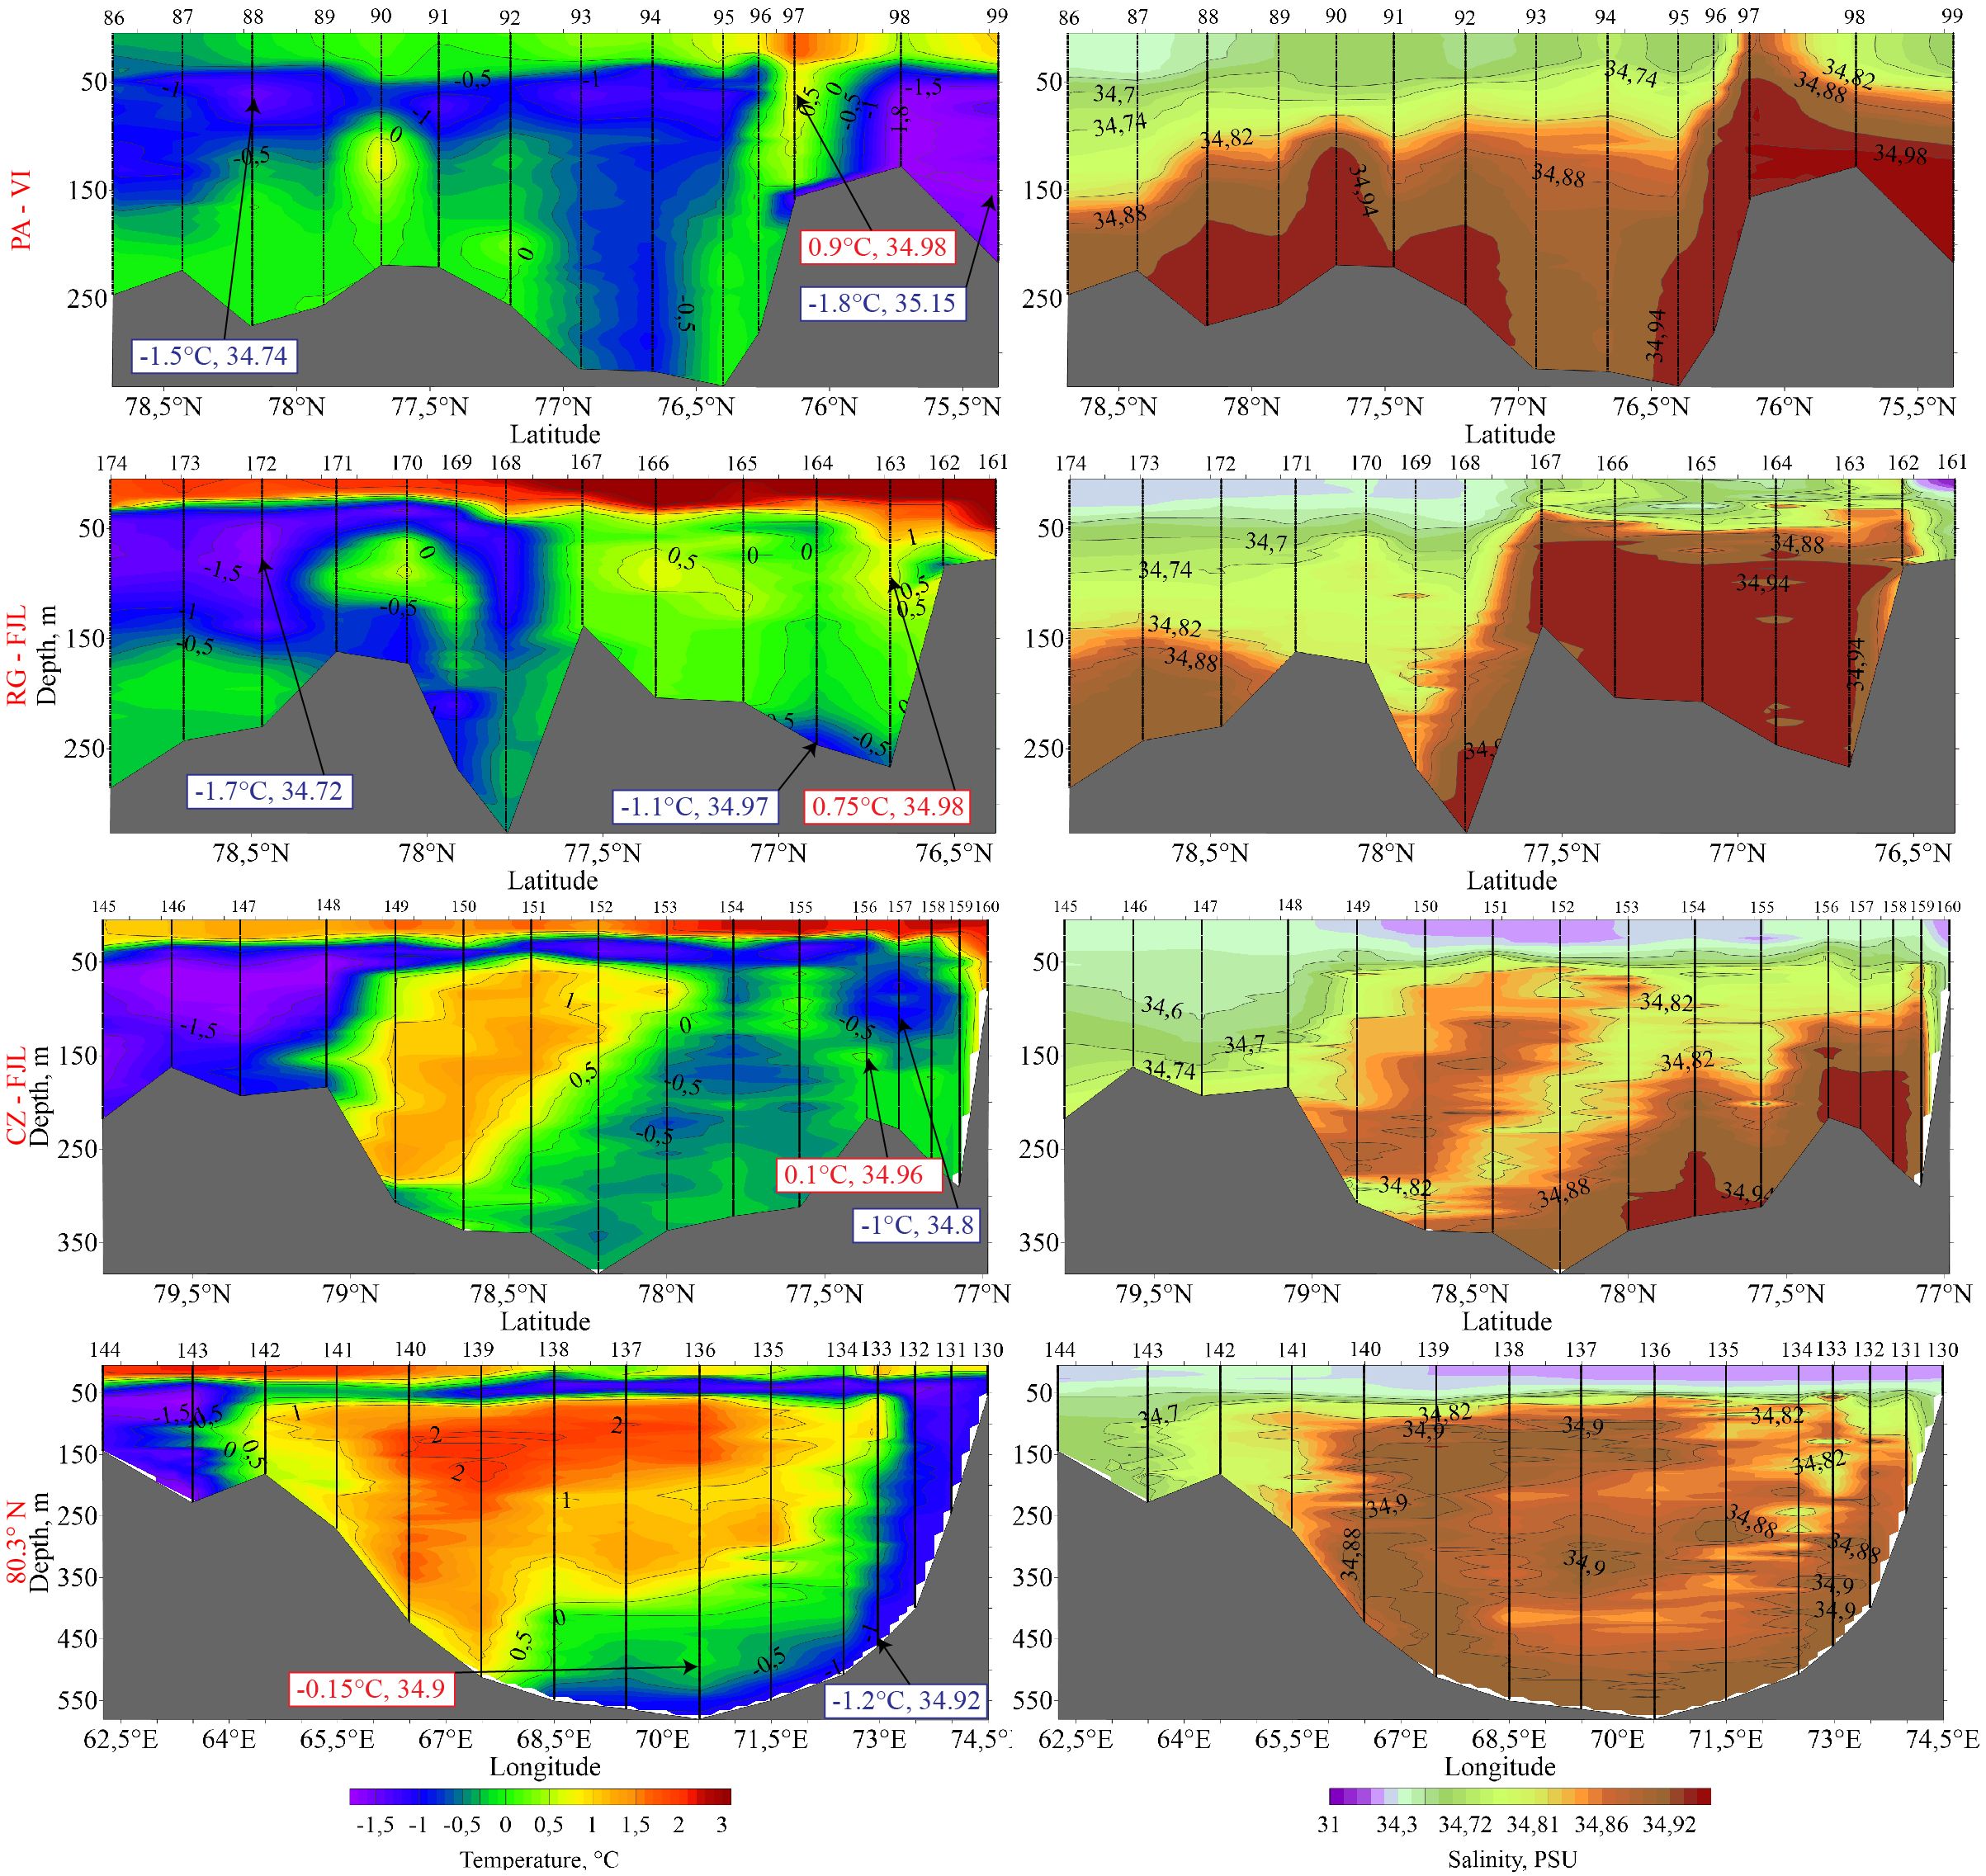
Figure 5. The vertical temperature and salinity structure along transects VI - PA, FJL - RG, FJL - CZ and 80.3°N in the northeastern part of the Barents Sea and in SAT on 11–19 July 2013. Numbers show the temperature and salinity of the BSBW core (red) and CDW (blue).
In 2017, however, there were practically no CDW observed at the FJL - RG transect (Figure 6; Supplementary Figure S3). The entire southern part of the transect was occupied by the Atlantic waters, and only a small area at the depth of 75 m in the southernmost part of the transect was occupied by CDW with temperature of -0.6°C and salinity of 34.8. Temperature of BSBW varied from 0°C to 0.7°C, and salinity reached 34.92. In the northwestern part of the transect, Arctic water with temperatures down to -1.8°C and salinity below 34.7 prevailed. The bottom layers were probably occupied by BSBW with temperature up to 0.4°C and salinity of 34.9. At the FJL - CZ transect, there was also only a small volume of water with temperatures down to -0.4°C and salinity around 34.8. In the northwestern part of the transect, Arctic waters again prevailed, with temperatures near freezing point (-1.8°C) and salinity between 34.4 and 34.7. Therefore, it could be concluded that in 2017, apparently a very small amount of CDW was formed, which almost completely mixed with BSBW, and its temperature decreased to 0.6°C.
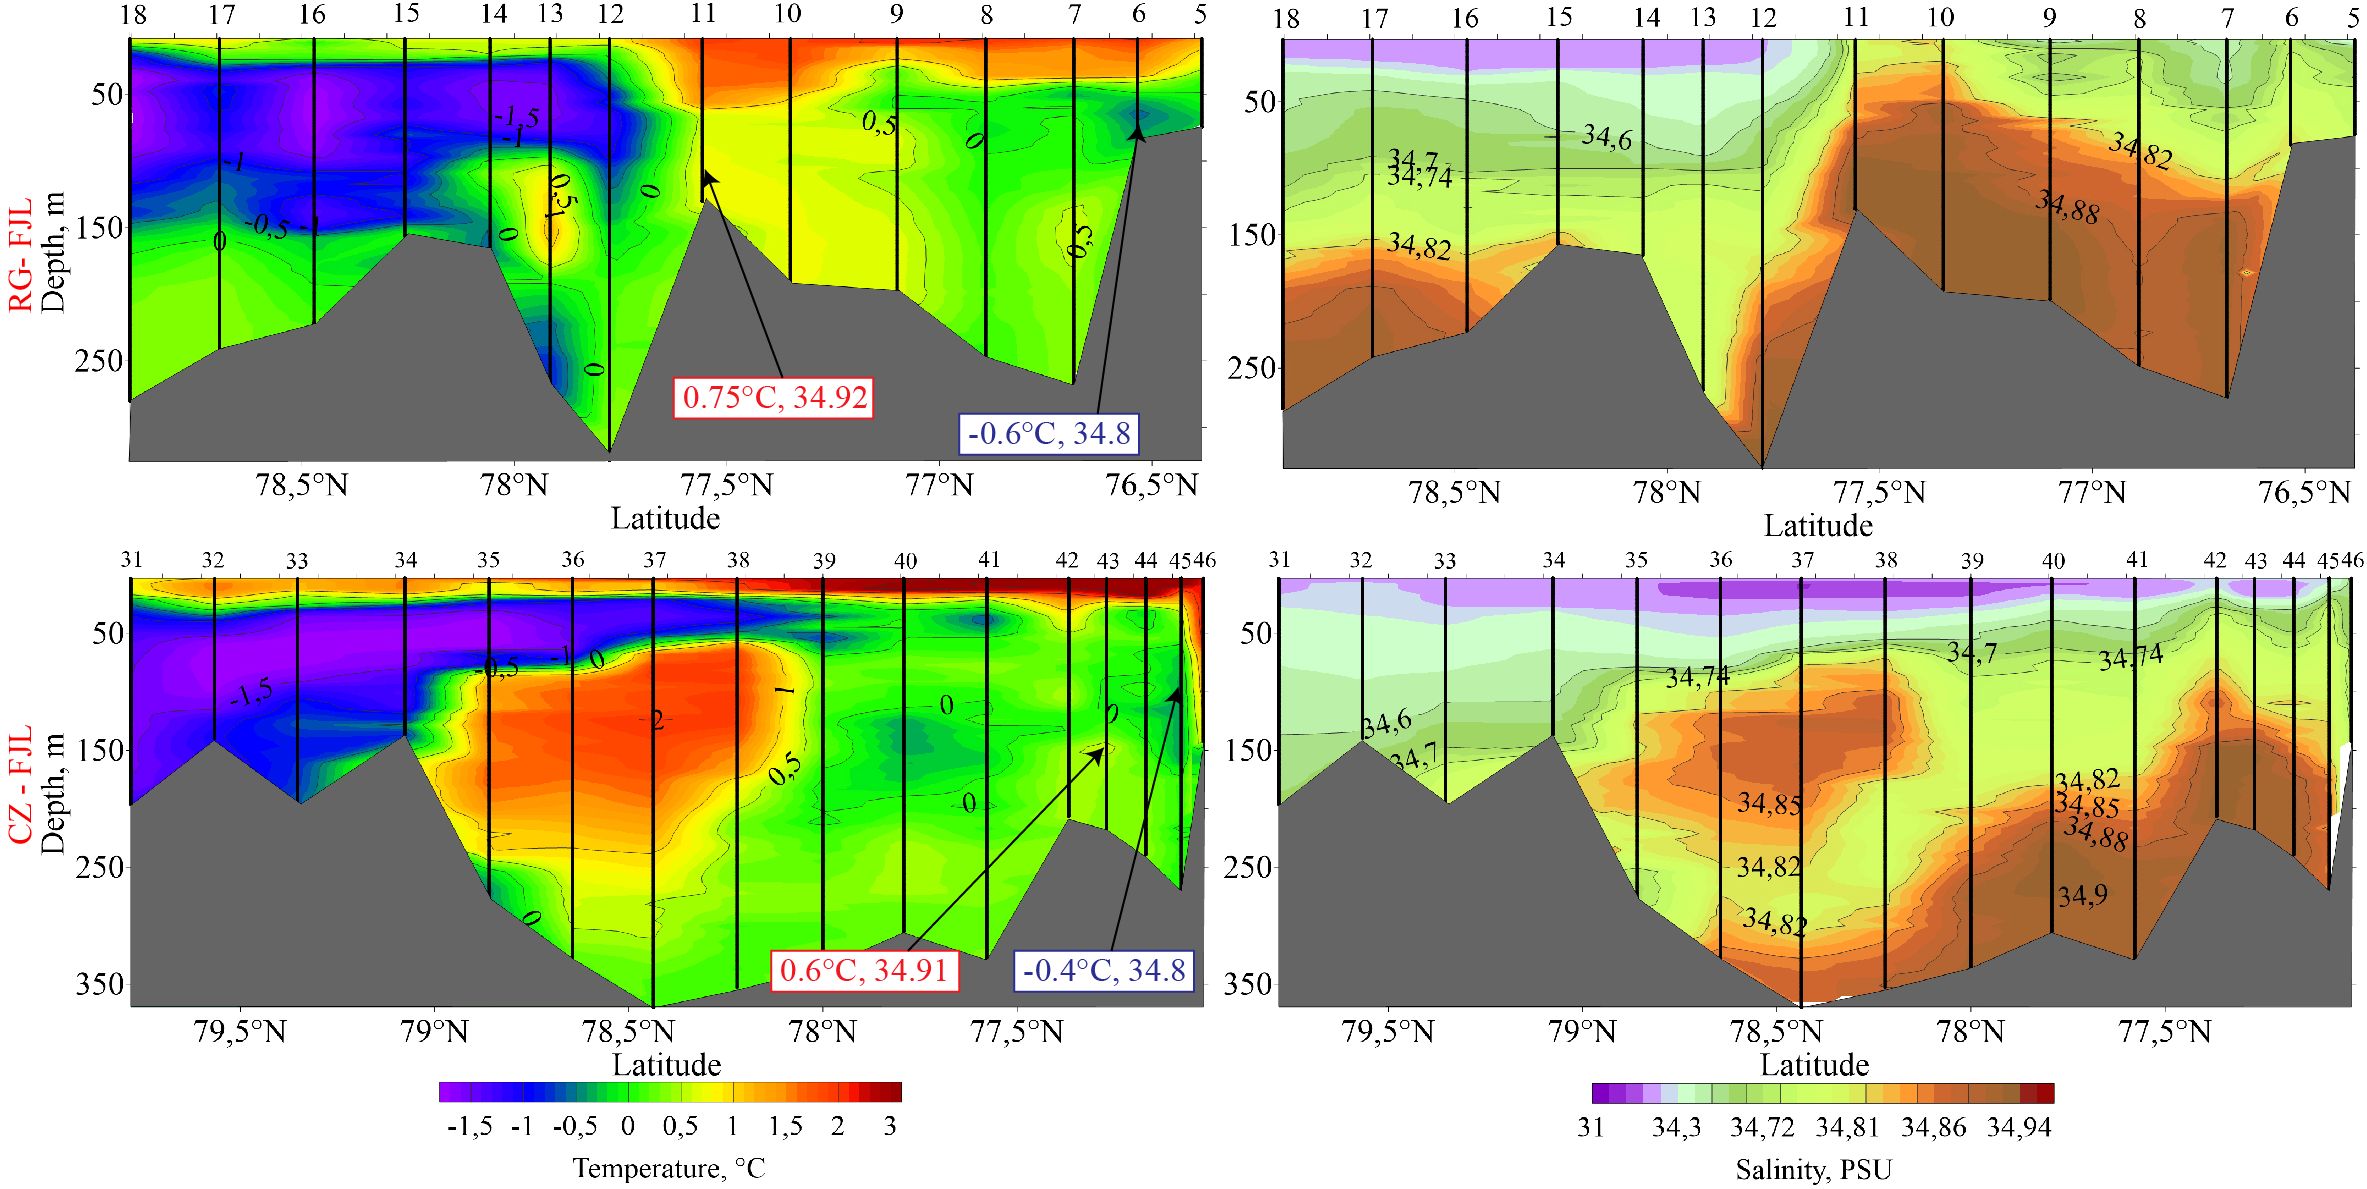
Figure 6. The vertical temperature and salinity structure along the transects FJL - RG and FJL - CZ in the northeastern part of the Barents Sea on 21–22 July 2017. Numbers show the temperature and salinity of the BSBW core (red) and CDW (blue).
The data from the 2023 oceanographic survey at the FJL - RG transect indicates a very small amount of CDW in the southern part of the transect near the sea bottom (Figure 7; Supplementary Figure S4). Their temperature reached -0.5°C, and salinity was 34.84. The southern part of the section is occupied by BSBW with temperature of up to 0.9°C and maximal salinity of 34.88. Near Cape Zhelaniya (the northeastern cape of the Novaya Zemlya), however, the volume of CDW is significantly larger, with temperature of -0.8°C and salinity of 34.82. It indicates formation of these waters to the north of the Novaya Zemlya Bank, as observed by Lien and Trofimov in 2008. CDW occupies the bottom layers under the core of BSBW, its temperature and salinity are 0.3°C and 34.87, respectively. In the northwestern part of the FJL - RG transect, there is a large amount of dense water formed off the Franz Josef Land coast with temperatures down to -1.7°C and salinities of 34.7-34.8. Near the Cape Zhelaniya and at more northern transects up to 79.7°N, these water form an intermediate layer between BSBW and the Fram Strait branch water (FSBW) which came from the north via SAT. The bottom dense waters that were formed north of the Novaya Zemlya could be traced at all subsequent transects north of the Cape Zhelaniya and occupied the deepest water layers under the core of BSBW. BSBW gradually cools and at the section at 79.7°N has temperature of 0°C.
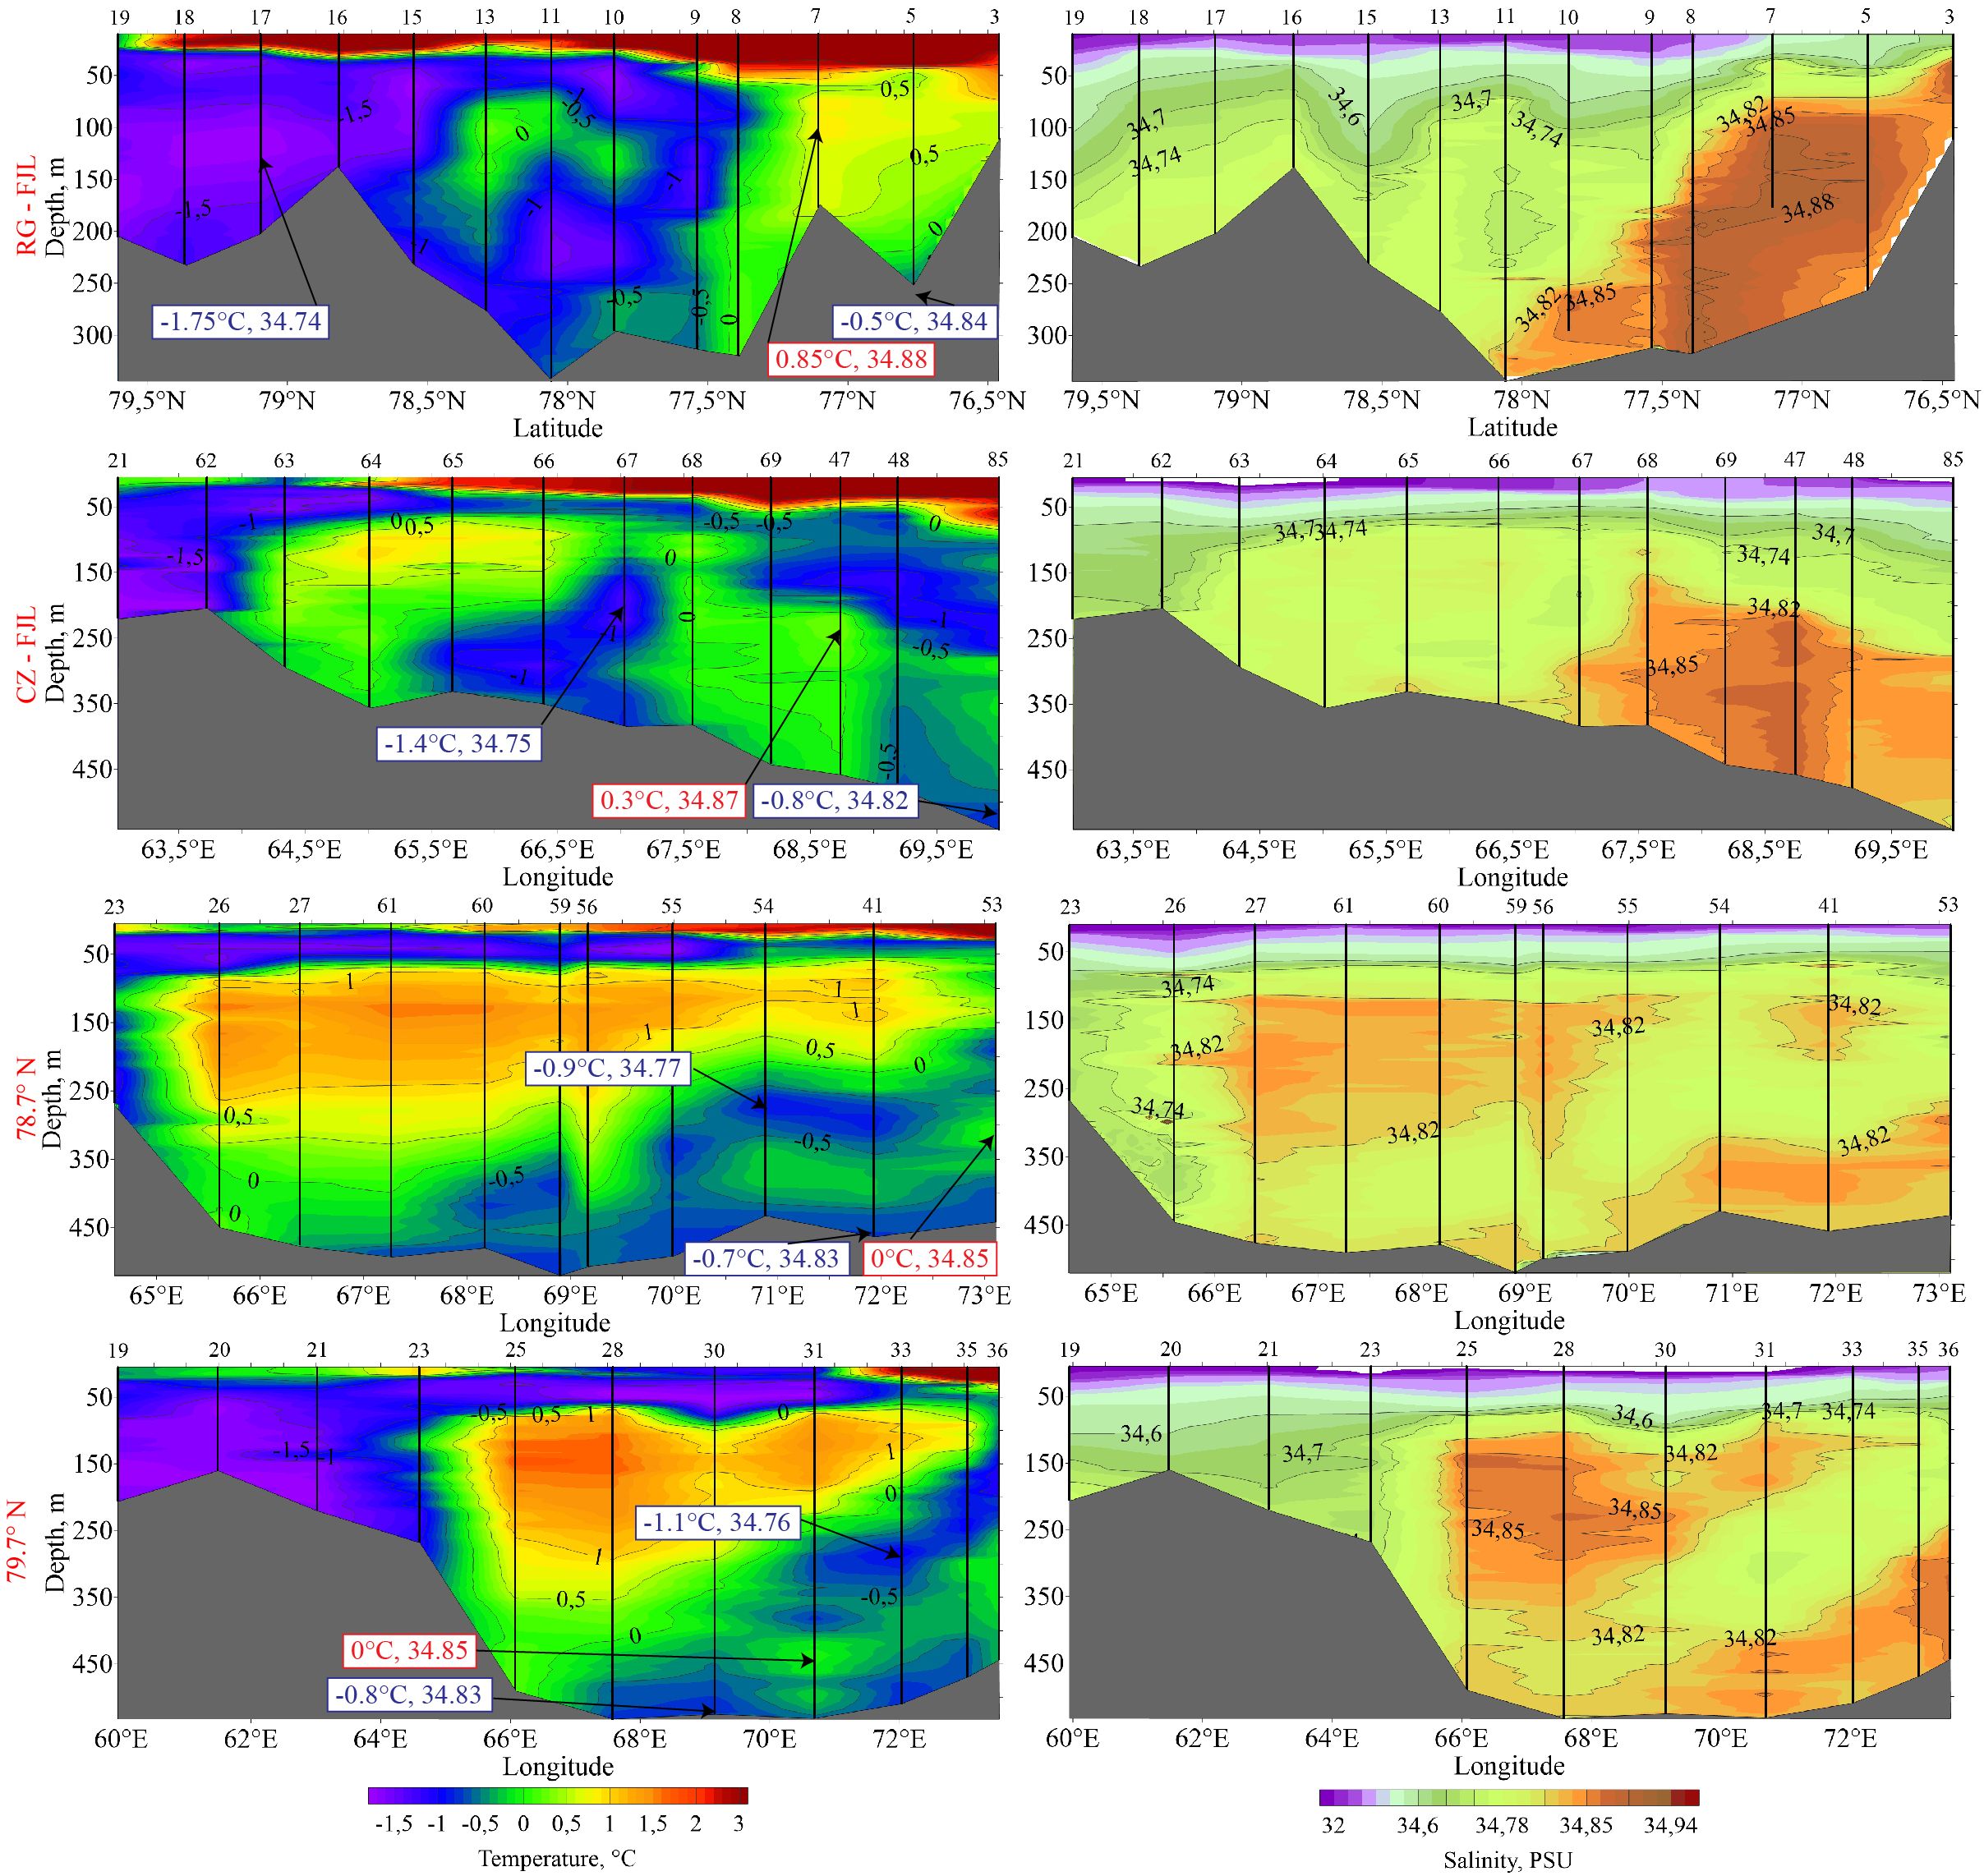
Figure 7. The vertical temperature and salinity structure along the transects FJL - RG, FJL - CZ, 78.7°N and 79.7°N in the northeastern part of the Barents Sea and in SAT on 14–24 September 2023. Numbers show the temperature and salinity of the BSBW core (red) and CDW (blue).
In 2024, at the FJL - RG section the core of BSBW is located at the depth of 120 m and has temperature of 0.45°C and salinity of 34.9 (Figure 8; Supplementary Figure S5). In the southern part of the section, a small volume of CDW, formed at the Novaya Zemlya Bank with temperature down to -0.9°C and salinity of 34.78 is observed. There is also a large amount of CDW formed off the coast of the Franz Josef Land with temperatures down to -1.6°C and salinity about 34.7-34.8. By the FJL - CZ section, CDW from the Novaya Zemlya Bank completely mixes with BSBW, cooling it to -0.1°C and freshening to 34.86 and is not traced further. CDW from the shelf near the Franz Josef Land forms an intermediate layer between BSBW, which occupies the bottom layers of water, and FSBW. Temperature of CDW increases to -1°C, and salinity is about 34.72. The same characteristics of this water are observed at the section at 79°N, while BSBW cools down to -0.15°C and its salinity decreases to 34.84.
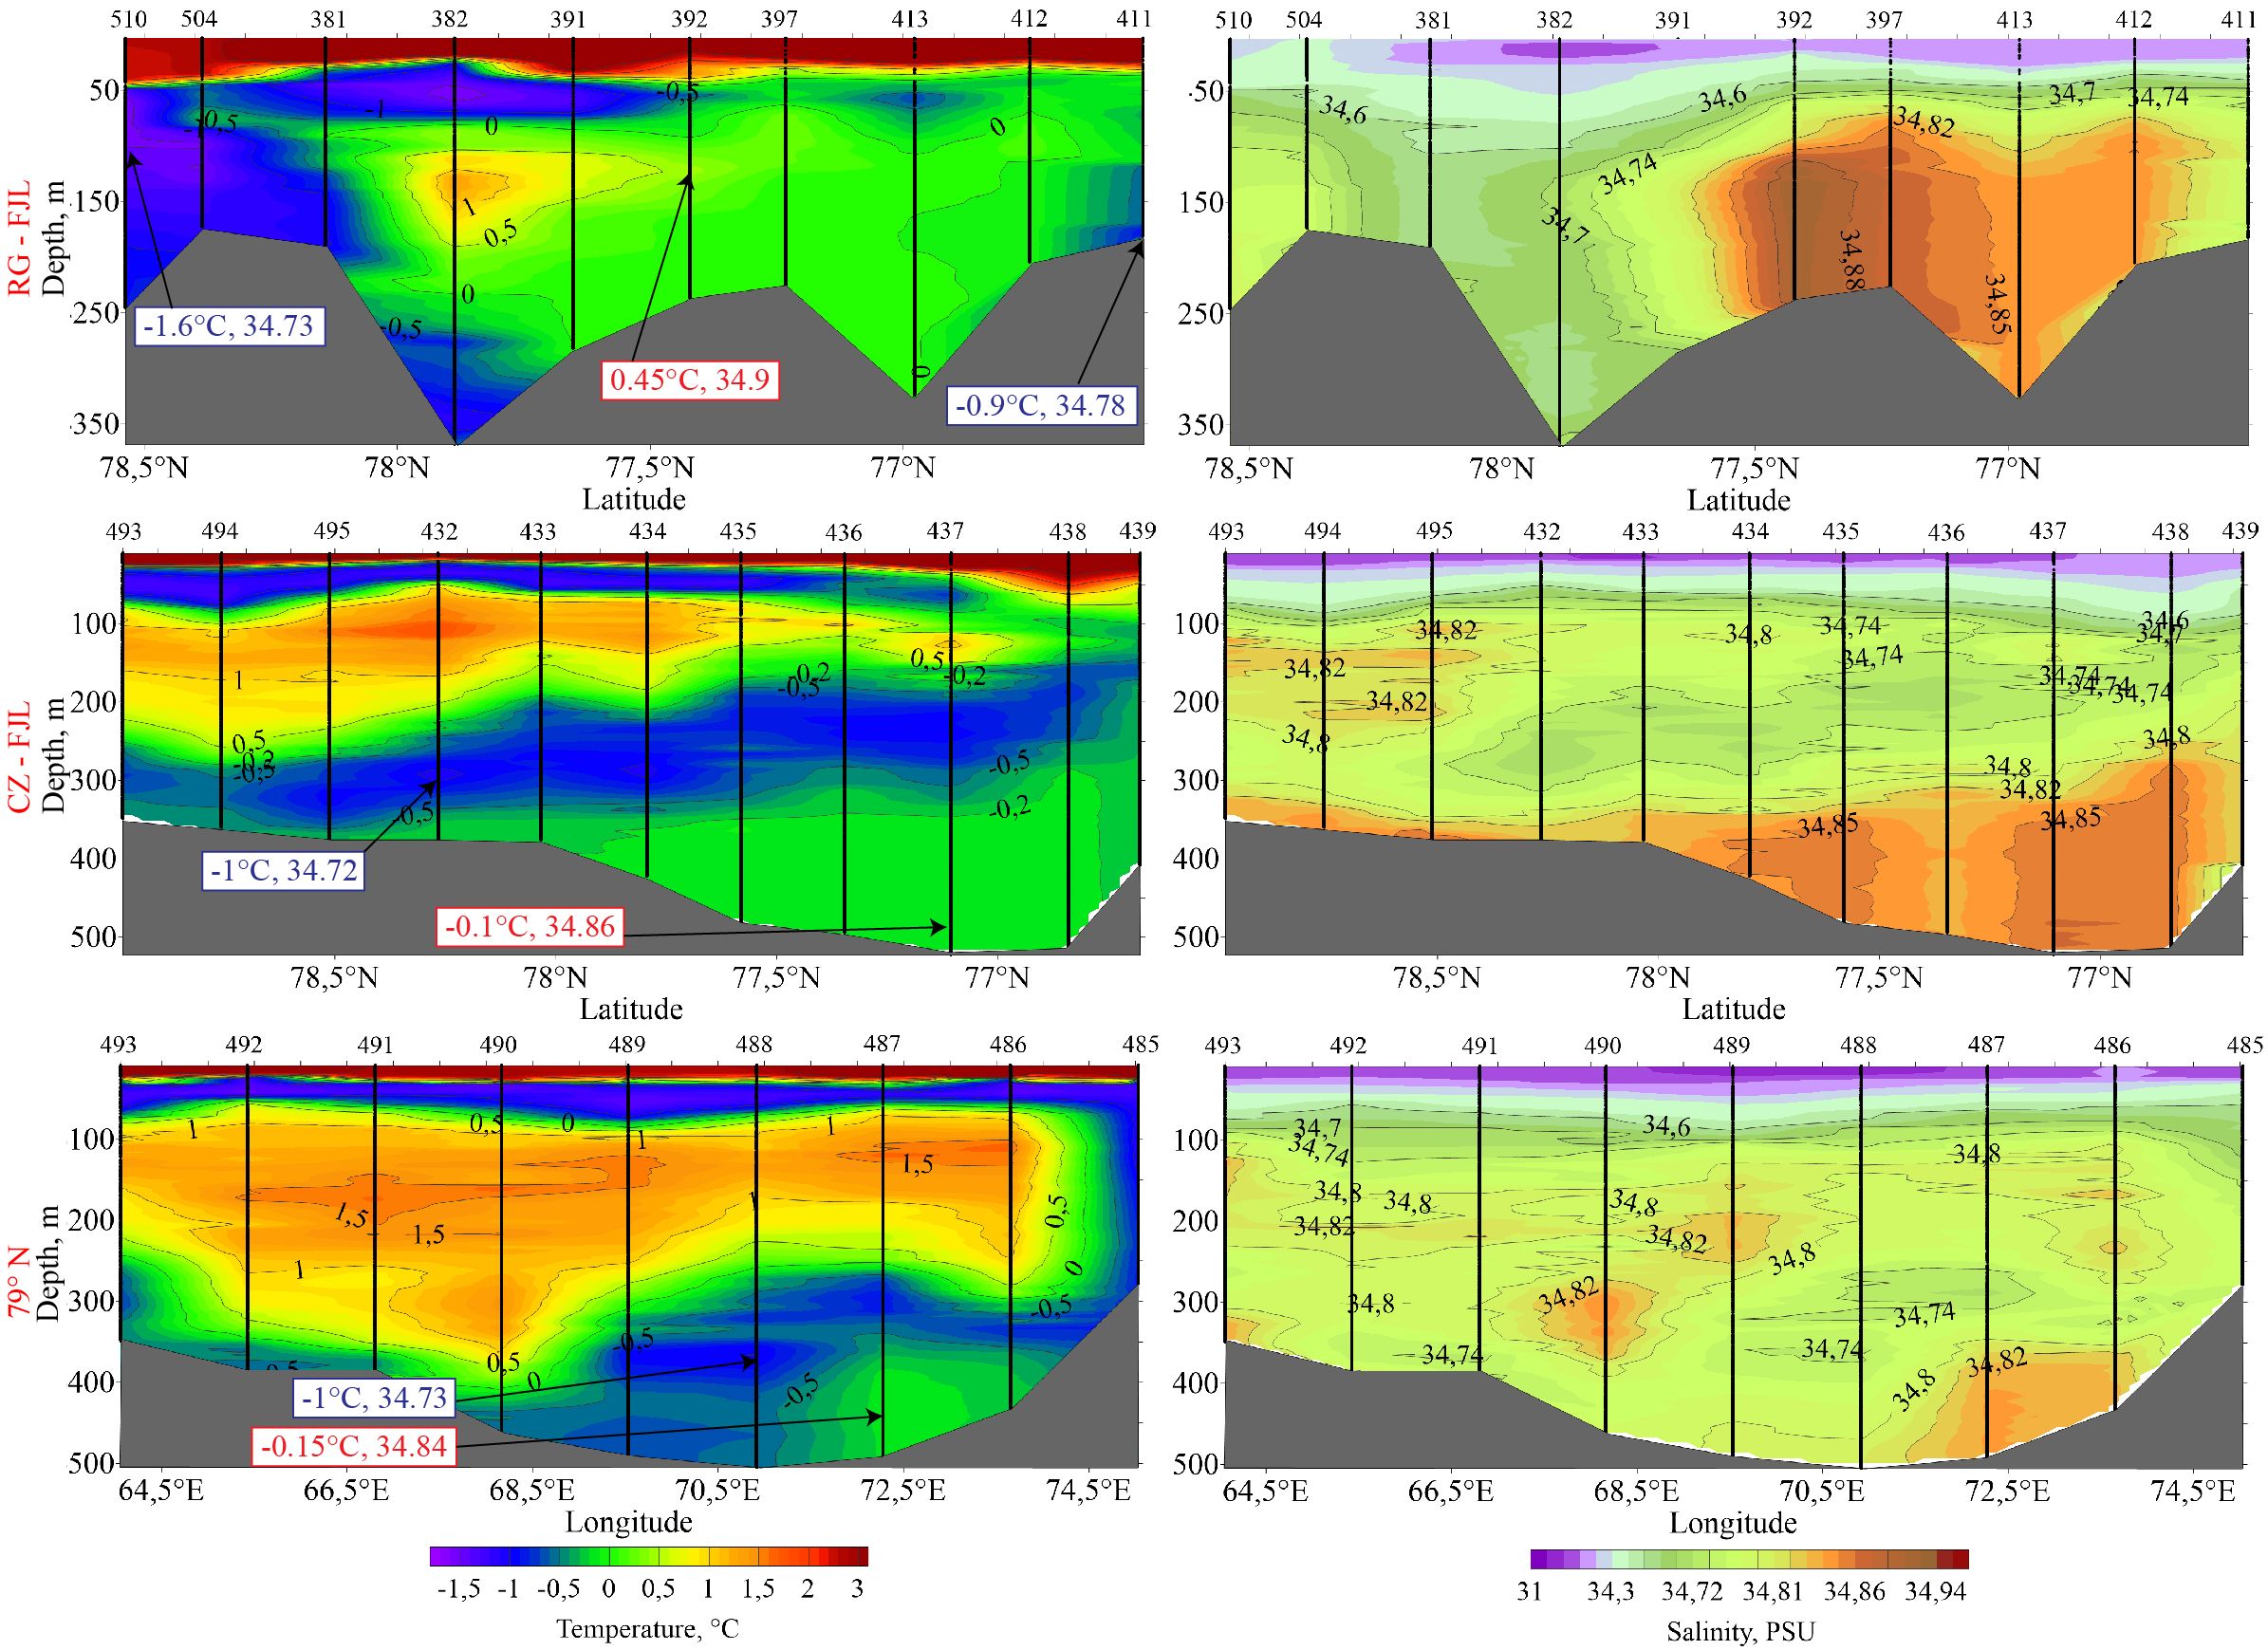
Figure 8. The vertical temperature and salinity structure along the transects FJL - RG, FJL - CZ, and 79°N in the northeastern part of the Barents Sea and in SAT on 9 August - 11 September 2024. Numbers show the temperature and salinity of the BSBW core (red) and CDW (blue).
4 Discussion
4.1 Impact of AWM thermohaline characteristics and atmospheric processes on BSBW
BSBW in the northeastern part of the Barents Sea has a positive core temperature trend of 0.2°C/decade (for the FJL-RG transect) and significant difference between the mean core temperature before and after 2000. In SAT in two recent decades, positive temperature of BSBW was recorded for the first time. To understand the reasons for these changes, we analyzed the correlation between the potential core temperature of BSBW in the sections in the eastern Barents Sea and the mean temperature of AWM in the Fugløya–Bear Island, Vardø and Kola transects with different time lags. Table 3 presents correlations of temperature and salinity between sections with time lags from 0 to 3 years. In addition, we also have monthly data for AWM temperature at the Kola transect, so we calculated correlations with a monthly shift for temperature for the same time. These correlations are presented in Supplementary Tables S1, S2. Table 3 shows that the maximal temperature correlations between transects in the western and eastern parts of the Barents Sea are observed with a zero time lag and range from 0.77 to 0.83 depending on the sections. Correlations gradually decrease and become non-statistically significant with increasing time lag. The correlation of the annual averaged AWM temperature at the Kola transect and the transects in the eastern part of the Barents Sea with a time lag equal to one month demonstrates the same dependence. The correlation between the Kola transect and the FJL-CZ transect increases from non-statistically significant values of 0.26 - 0.51 at the time lag of 2–3 years to 0.63 - 0.84 with decrease in the time lag. The correlation becomes statistically significant when monthly data is averaged starting from February of the year preceding the measurements and remains so with a further decrease in the lag. The maximum correlation of 0.84 is observed for monthly data from the Kola transect averaged from January of the year of measurements. The correlations between the Kola transect and the FJL-RG transect also gradually increase with decreasing time lag, becoming statistically significant at the time lag of about 2 years. The maximal correlation of 0.83 is observed for the Kola transect data averaged from February of the year of measurements. The correlation values are consistent with the estimates of the AWM flow velocity of 3–5 cm/s (Ingvaldsen et al., 2004) and its corresponding residence time in the Barents Sea (about 1–2 years). Note that the most of the analyzed in situ measurements in the eastern part of the Barents Sea and SAT were made in August-September. The existence of high correlations at zero time lag indicates the presence of strong autocorrelations and the sluggish nature of ocean anomalies. Based on these data, we conclude that temperature of BSBW in the eastern part of the Barents Sea is related to the initial temperature of AWM in the western part of the Barents Sea. At the same time, high salinity correlations are also observed between most of the sections. The largest correlations are observed mainly at zero time lag or one year time lag (Table 3). In addition, in Figure 3B we can clearly observe the trend toward freshening of AWM at the western boundary of the Barents Sea during the last 15 years, which is also maintained at the eastern boundary of the Barents Sea in the characteristics of BSBW.
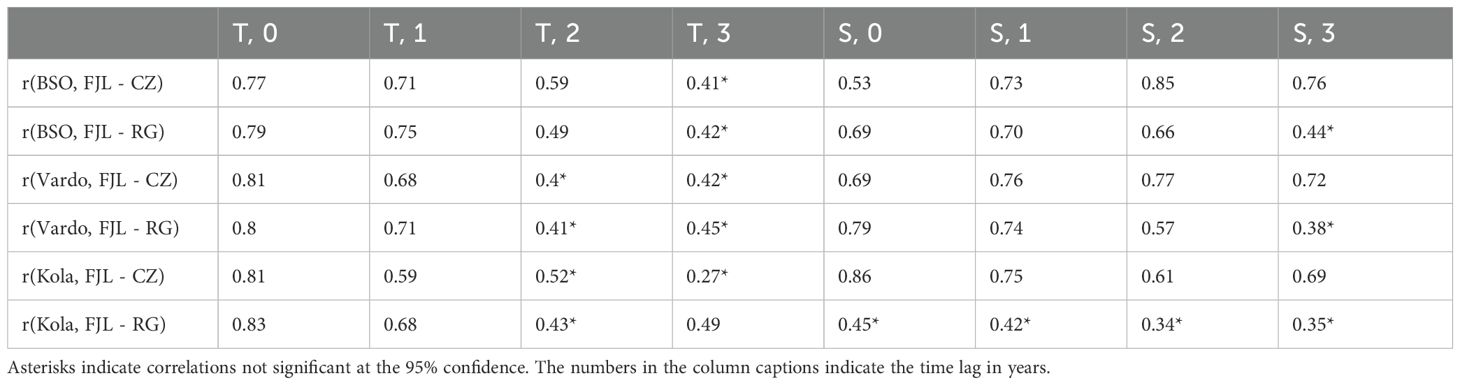
Table 3. Correlations between thermohaline characteristics of AWM at BSO, Vardo and Kola transects and BSBW at FJL - CZ and FJL - RG transects.
There is also a connection between characteristics of BSBW in the north-eastern part of the Barents Sea with local atmospheric conditions and ocean-atmosphere heat flux during the cold season from October to March preceding the measurements. The heat flux during the last 20 years was on average lower than in the 1990s, which is consistent with the results of Skagseth (Skagseth et al., 2020). There is a significant correlation between the total heat flux and BSBW core temperature at the eastern boundary of the Barents Sea (-0.68 with measurements at the FJL - CZ transect, -0.51 at the FJL - RG transect). The decreasing ocean heat loss is associated with the observed strengthening of abnormal south-westerly winds (Skagseth et al., 2020; Rinke et al., 2017; Wickström et al., 2020). These winds advects warm air to the Barents Sea, as a result the ocean-atmosphere heat flux decreased during the period of sea surface cooling. The significant correlation between the average southwesterly wind speed and the heat flux from October to March is -0.71. The average speed of the southwesterly wind was calculated as a projection of the average wind during the cold season at the southwestern direction. Thus, we believe that the observed increase in the core temperature of BSBW is also related to the decreasing heat loss from the ocean surface, which are associated with the strengthening of southwesterly winds in recent decades. Dmitrenko et al. (2009) also put forward an assumption that the residence time of BSBW may depend on local atmospheric conditions (Dmitrenko et al., 2009). Namely, southerly winds could decrease BSBW residence time in the Barents and Kara seas, while northerly winds could increase it. Decrease of BSBW residence time in the Barents Sea results in less effective BSBW cooling. We have no possibility to test this assumption as it requires specialized measurements and modeling. It should be noted, however, that in the years with the maximal measured BSBW temperature (2008, 2012, 2017) the strongest southwesterly winds were also observed, which is consistent with the assumption of Dmitrenko et al. (2009).
4.2 CDW formation and its influence on BSBW
We do not have any data on the influence of the process of formation of CDW on BSBW in the western and central parts of the Barents Sea. However, based on transects FJL - RG and FJL - CZ, as well as the additional transect VI - PA, we could describe this process near the Franz Josef Land and the Novaya Zemlya.
Analysis of in situ measurements confirms previous studies by Årthun et al. (2011) and then by Lien and Trofimov (2013). Before 2000 all measurements registered formation of very cold and saline CDW at the Novaya Zemlya Bank and near the Franz Josef Land. After 2000 the range of characteristics of these waters significantly increased. Area of their formation near the Novaya Zemlya also probably begun to vary. In 2012, 2013, 2017 and 2024, CDW were formed at the Novaya Zemlya Bank. In 2023, CDW were formed further northward at the area near the Cape Zhelaniya. Notably, in 2013, these waters were very cold and saline, while in 2012 and 2017, relatively warm and fresh waters were observed. In 2012 and 2017, CDW almost completely mixed with BSBW in the Barents Sea. To the south-west of the Franz Josef Land, dense water formation was observed during all years except 2017, subsequently forming an intermediate layer between BSBW and FSBW in SAT, which is consistent with the results of Lien and Trofimov (2013) based on measurements in 2008. The waters formed off the coast of the Novaya Zemlya were in all cases warmer and saltier than those off the Franz Josef Land, which confirms presence of the Atlantic component in them.
The reasons for these differences, however, require specific analysis. Previously, it was concluded that an important factor in the variability of CDW formation is surface salinity before the freezing season. In case of the Novaya Zemlya Bank it relates to freshwater content in the Norwegian/Murmansk and Novaya Zemlya coastal currents (Rudels, 1987; Schauer, 1995; Schauer et al., 2002a), as well as the water column stability (Harms, 1997; Backhaus et al., 1997). Harms, however, showed that the process of freezing and melting of sea ice is more important than freshwater inflow, and, according to the results of Ellingsen et al. (2009), an important role is also played by ice import through the northern boundaries of the Barents Sea (Harms, 1997; Ellingsen et al., 2009). Formation of CDW is further associated with formation of polynyas. To the west of the Novaya Zemlya, cold easterly winds often contribute to occurrence of polynyas (Martin and Cavalieri, 1989). Moreover, it was recognized that, since the climate of this region is strongly influenced by the Atlantic inflow, any changes in characteristics of this inflow would inevitably affect dense water formation processes (Harms, 1997; Backhaus et al., 1997).
To assess the external conditions of CDW formation, we analyzed sea surface temperature, ice concentration, total heat flux, 2 m air temperature and wind speed during cold seasons preceding in situ measurements at the Novaya Zemlya Bank (56.5°E, 76.25°N) using ERA5 reanalysis data (Figures 9, 10). We compared averaged atmospheric and oceanic conditions during cold seasons for the periods 1977–1999 and 2000-2024 (Figure 10). Until 2000, northeasterly and southeasterly winds prevailed at the Novaya Zemlya Bank area. This is evident both from the average values for this period (Figure 10) and for individual years (e.g., 1991 in Figure 9). These winds advected cold air, as a result the difference in air and ocean surface temperatures was very high. All these factors supported active formation of very cold and saline CDW. (Figure 10) shows a significant increase in southerly winds at the Novaya Zemlya Bank area after 2000. These winds advect warm air, causing the difference in air and ocean surface temperatures to decrease. In addition, ocean surface itself in this area also warms up and ice concentration decreases. All changes described above could be the reason for shift from CDW with temperatures around the freezing point and very high salinity before 2000 to CDW with higher temperatures and wide salinity range after 2000. Note, that although the ocean-air temperature difference was smaller after 2000, the average heat flux indeed was larger. This is probably related to the reduced sea ice coverage after 2000 that results in more efficient heat loss to atmosphere.
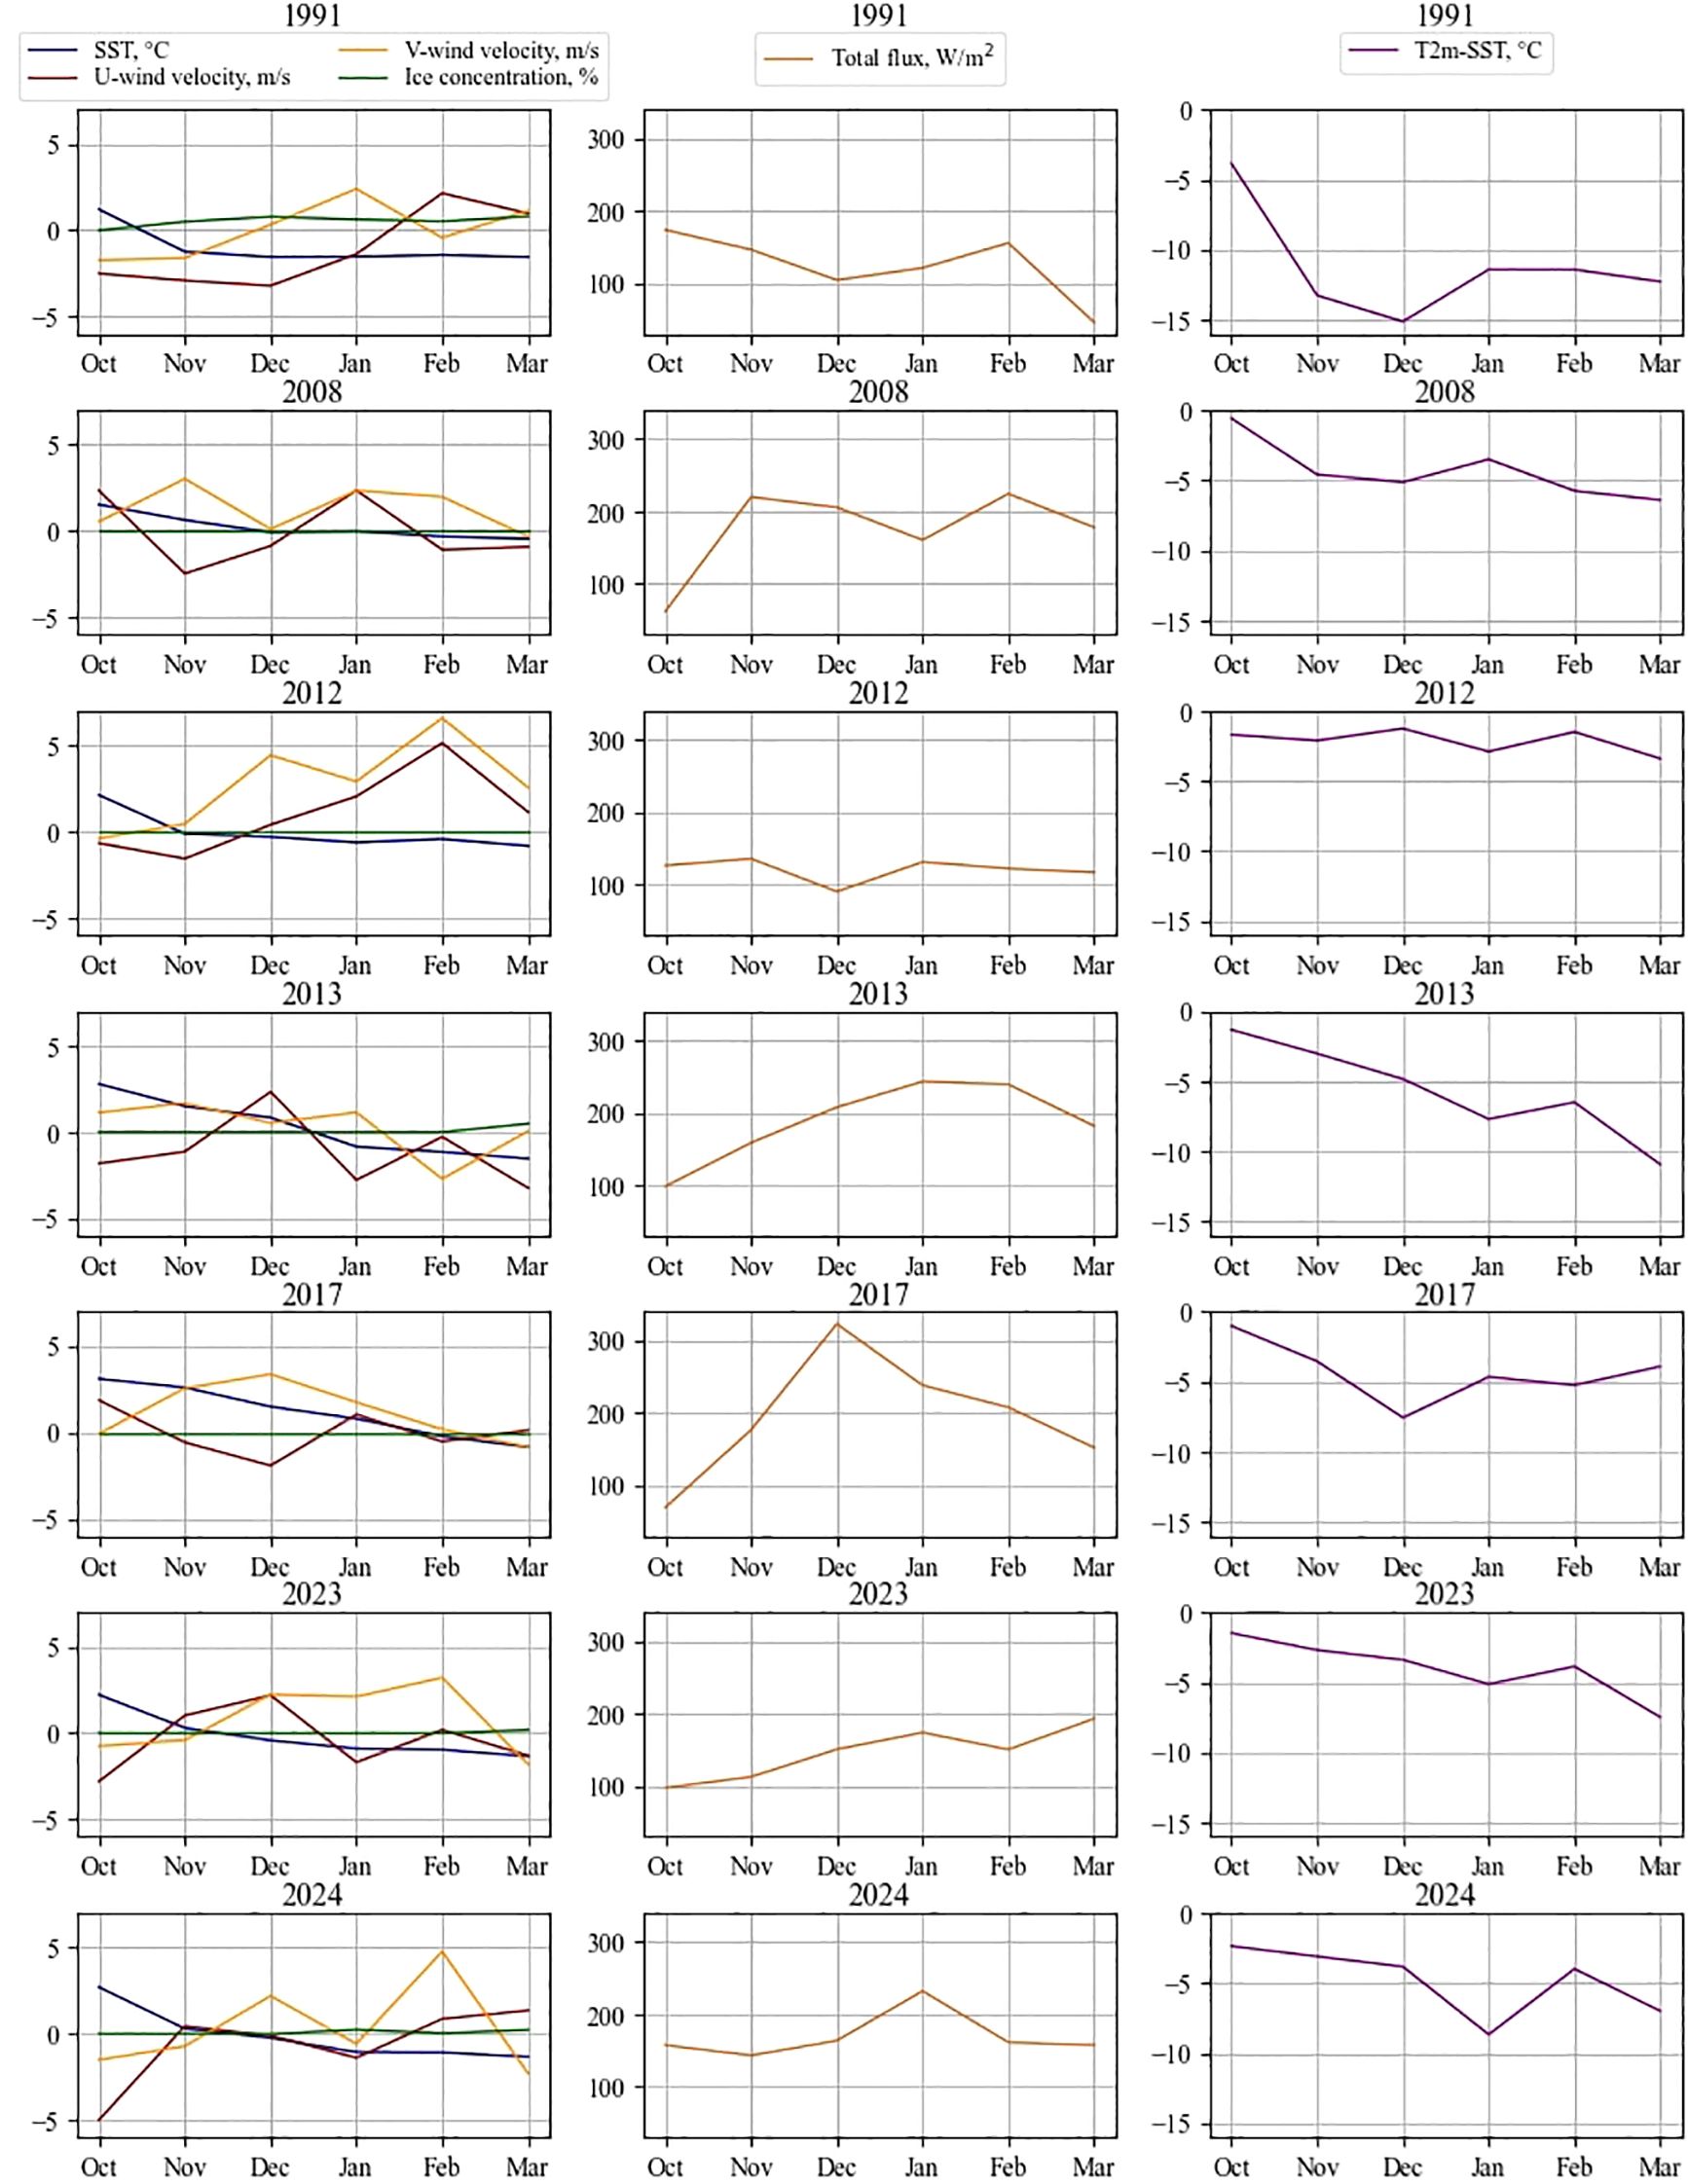
Figure 9. ERA5 reanalysis data on atmospheric and oceanographic conditions at the Novaya Zemlya Bank from October to March in 1991, 2008, 2012, 2013, 2017, 2023 and 2024.
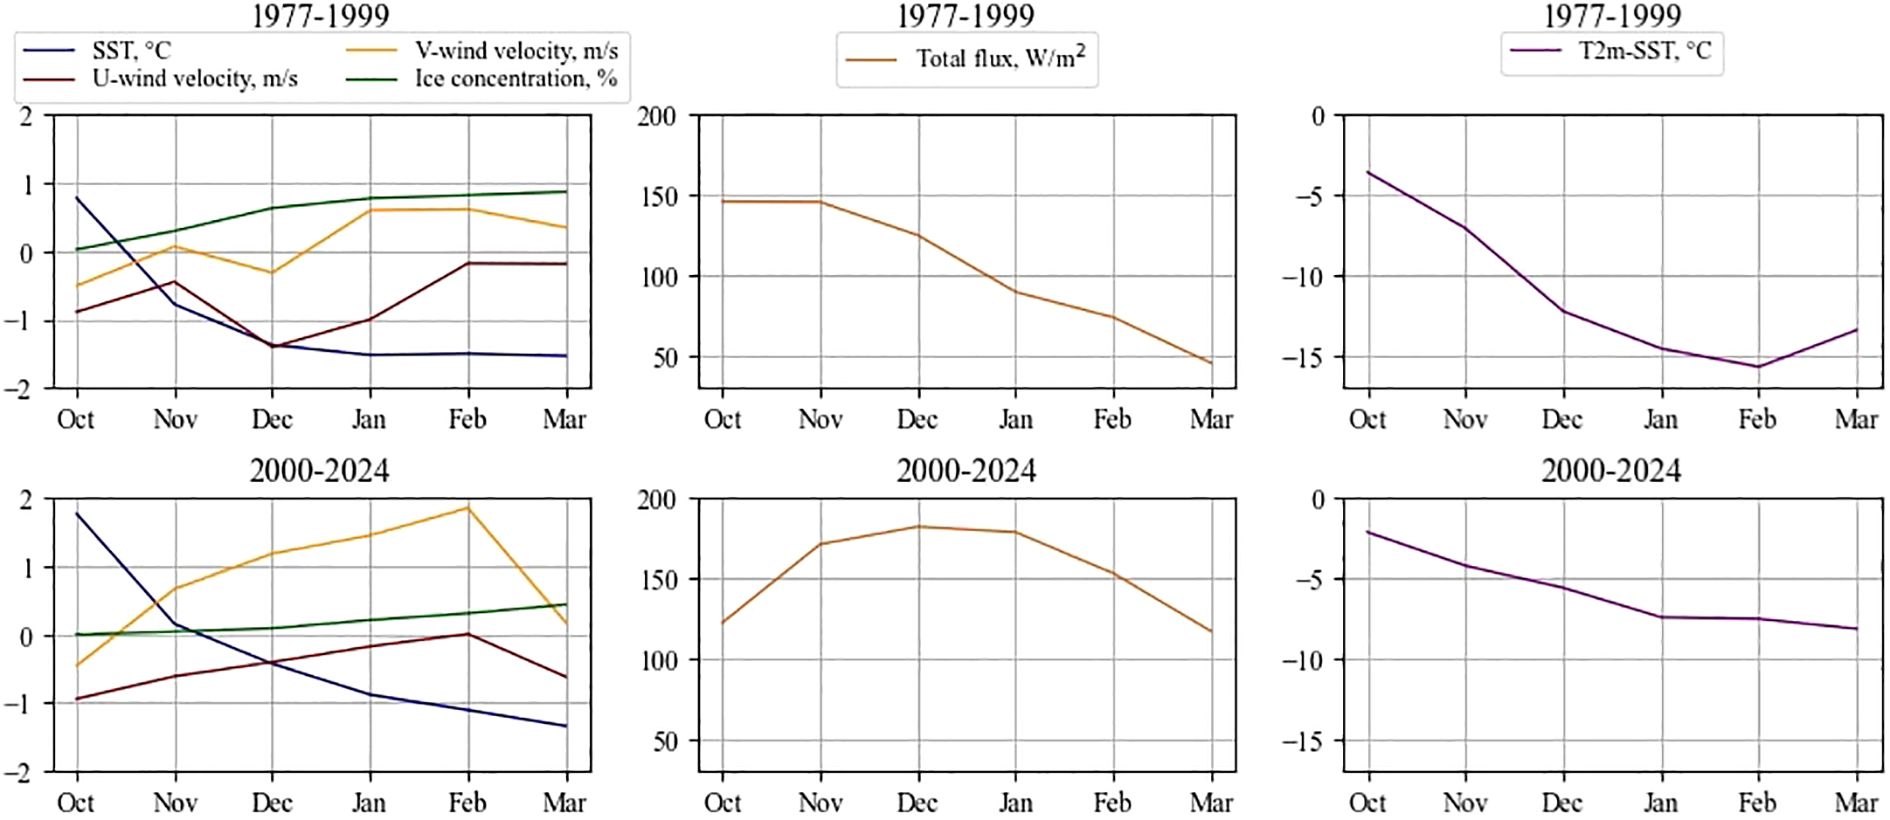
Figure 10. ERA5 reanalysis data on monthly-averaged atmospheric and oceanographic conditions at the Novaya Zemlya Bank from October to March in 1977–1999 and 2000-2024.
We also analyzed the reasons for differences in characteristics of CDW in the recent years. The graphs (Figure 9) show that in 2017 sea surface temperature at the Novaya Zemlya Bank remained positive during most of the cold season and turned steadily negative only in February, while in 2012 it decreased to only -0.8°C. In 2012, southwesterly winds were observed for most of the cold season, as a result the difference between air and sea surface temperatures was small (up to 3.4°C). In 2017, the difference between air and sea surface temperatures in February-March, when the water surface cooled to 0°C, was also relatively small (4-5°C). Similar conditions were observed in 2008. Sea surface temperature was above 0°C for a long time, and by March it decreased only to -0.45°C. Its difference with air temperature for the entire cold season did not exceed 6.4°C. In 2013, 2023 and 2024, on the contrary, temperature difference was up to 11°C, 7.5°C and 8.6°C, and the minimum average monthly sea surface temperature was -1.5°C, -1.3°C and -1.3°C, respectively. In 2013 and 2023, southeasterly and northeasterly winds were observed, contributing to more active cooling of sea surface and formation of CDW.
We see a clear connection between the characteristics of CDW and thermohaline properties of sea surface layer, as well as wind conditions over the Novaya Zemlya Bank. In the years with the warmest AWM (2008, 2012, 2017), high temperature of the Novaya Zemlya Coastal Current is also observed, which leads to later and less active ice formation. Also, in the recent years, the warmest years are accompanied by prolonged southwesterly winds that bring warm air, resulting in a decreased sea-atmosphere heat flux. CDW have a high temperature and low salinity and quickly mix with Atlantic water, so it is not traced further in SAT. Cold dense waters formed southwestward from the Franz Josef Land in these years also had an increased temperature or even did not form at all. On the contrary, atmospheric and oceanic conditions in 2013 were close to the typical conditions observed before 2000. Northeasterly and southeasterly winds prevailed throughout the cold season, sea surface had low temperature, and difference in air and sea surface temperature exceeded 10°C. Measurements in 2013 registered formation of the coldest and saltiest CDW among all available data since 2000. In 2023 and 2024, similar air and ocean surface temperatures were observed with episodical northeasterly and southeasterly winds. Temperature of CDW in these years also had intermediate values from -0.8°C to -0.9°C. In 2013 and 2023, the CDW had high salinity, so it sank below BSBW and occupied bottom layers in SAT.
However, we could not find any confirmation of the assumption of Lien and Trofimov (2013) about the causes of shifting the source of CDW formation northward to Cape Zhelaniya. In 2012, there were prolonged southwesterly winds at the Novaya Zemlya Bank from October to March. The difference in atmosphere and ocean surface temperatures was very small (Figure 9). According to Lien and Trofimov (2013), under such conditions, CDW forms northward from the Novaya Zemlya Bank, but our in situ measurements clearly indicate presence of CDW at the Novaya Zemlya Bank and in the North-Eastern Basin. We did not find any other obvious connections in the other years with available measurements. However, we assume that variability of the CDW formation region near the Novaya Zemlya may be associated with decrease in sea-ice coverage in the northeastern part of the Barents Sea. This decrease is associated with an increased range of values of thermohaline characteristics of AWM and with decreasing ice import from the north, observed at the eastern boundary of the Barents Sea. The retreat of ice edge and decrease in its thickness could lead to more active formation of polynyas and, accordingly, formation of CDW, as compared to stable ice coverage during previous decades. This issue, however, requires an individual study, including specific in situ measurements and numerical modeling.
4.3 Transformation of BSBW in SAT
We conclude that over the past 20 years, along the eastern boundary of the Barents Sea (defined by FJL - CZ transect), temperature of BSBW in the warm season exhibits a considerable range (from -0.5°C to 0.6°C). It depends on (1) the initial temperature of AWM flowing into the Barents Sea through BSO (defined by Fugløya – Bear Island transect), (2) atmospheric conditions affecting the direct cooling of AWM, (3) formation of CDW at the shallow banks of the Barents Sea, which then mixes with BSBW. However, the subsequent transformation and cooling of BSBW in SAT before it enters the deep Arctic basin remains mainly unknown.
Lien and Trofimov (2013), based on the findings from two expeditions conducted in 2008, described cooling of BSBW due to mixing with CDW in SAT (Lien and Trofimov, 2013). Temperature of BSBW, which was approximately 0.6°C at FJL - CZ section, decreased to near-zero temperatures at 79° N. Lien and Trofimov (2013) identified interleaving and double diffusive processes as the main mixing mechanisms in the northeastern part of the Barents Sea. Furthermore, they suggested that turbulent mixing may play a significant role in SAT. However, they acknowledged that the data available for their analysis was insufficient for definitive conclusions. Turbulent mixing in SAT was also discussed by Dmitrenko et al. (2014), but his analysis was mainly concerned with the interaction of FSBW with surface waters (Dmitrenko et al., 2014).
Based on our data collected between late July and early September in 2013, BSBW with core temperature of approximately 0.1°C at the eastern boundary of the Barents Sea cooled to -0.2°C at the latitude of 81.3°N. In late August 2021, the temperature of BSBW core was -0.4°C on FJL - CZ transect and subsequently decreased to -0.9°C across the 80°N, 81°N, and 82°N transects. Salinity of BSBW decreased from 34.87 to 34.84, confirming the cooling effect due to mixing with intermediate waters of lower salinity. Data obtained during the oceanographic survey at the end of September 2023 also confirmed the gradual cooling of BSBW in SAT resulting from interactions with colder intermediate waters formed by CDW. At FJL - CZ transect the temperature maximum was equal to 0.3°C, while it decreased to 0°C at 79°N and further to -0.2°C at the latitude of 79.7°N. Concurrently, salinity decreased slightly from 34.86 to 34.85. A slight cooling (from -0.1°C to -0.15°C) and freshening (from 34.86 to 34.84) of BSBW was also observed according to measurements in 2024 at the FJL-CZ and 79°N sections. The T-S diagrams also illustrate the progressive mixing of BSBW with intermediate cold waters (see Supplementary Figures S2, S4, S5).
Our analysis of in situ measurements aligns with the modeling studies conducted by Shu (Shu et al., 2021), that reported a poleward shift of the cooling zone in the Barents Sea. According to the CMIP6 projection under the SSP585 scenario, Shu et al. (2021) indicated that there will be further warming and freshening of BSBW in the northeastern Barents Sea and SAT. Our analysis demonstrates that some of the heat carried by BSBW, which was previously released in the Barents Sea by interaction with atmosphere, under current conditions is lost due to mixing with cold intermediate waters in SAT. However, despite the continued cooling of BSBW in SAT due to mixing with CDW, measurements indicate that its temperature at latitudes to the north of 80°N could now be equal to and even exceed 0°C. Consequently, under current conditions warmer Atlantic water could reach the continental slope.
5 Conclusions
In our study, we analyze the interannual variability of BSBW thermohaline characteristics during the warm season. We base on in situ measurements obtained during 42 oceanographic expeditions from 1977 to 2024 in the northeastern Barents Sea and in SAT, as well as on in situ measurements of AWM characteristics at the western boundary of the Barents Sea and ERA5 reanalysis data.
Prior to the 2000s, the temperature of AWM entering the western part of the Barents Sea was relatively low and AWM effectively cooled primarily through heat exchange with atmosphere, leading to consistently negative temperatures as AWM entered SAT. However, our analysis of measurements taken over the past 20 years shows that the average temperature of BSBW at the eastern boundary of the Barents Sea and further in SAT in the warm season has significantly increased. We demonstrate that this change is linked to the rising temperature of AWM entering the Barents Sea from the west. The increasing heat transport carried by AWM could no longer be effectively absorbed by the atmosphere, consequently causing correlation of temperature of BSBW entering SAT with the initial temperature of AWM at BSO. In addition, the effectiveness of ocean surface cooling is further reduced by the strengthening of southwesterly winds bringing warm air, which has been observed in recent years. The years with the highest BSBW temperature coincide with anomalously strong southwesterly winds observed during the cold season.
Our study also describes the characteristics of CDW that mixes with BSBW and also affects its thermohaline properties. Our analysis of in situ measurements at the Novaya Zemlya Bank showed that until 2000 there was a stable formation of very cold and saline CDW. However, as a result of the increase of water surface temperature in the Novaya Zemlya Bank area and strengthening of southwesterly winds that bring warm air, a significantly greater range of temperatures and warming of CDW have been observed in the recent years. In years with prolonged southwesterly winds and high sea surface temperatures, only a small volume of CDW with relatively high temperatures and low salinities is formed. In this case CDW completely mixes with BSBW in the Barents Sea. Conversely, during years with strong northeasterly and southeasterly winds, very cold and dense water is formed, which then occupies the bottom layer and could be traced further in SAT. We also confirmed the conclusions of Lien and Trofimov (2013) that CDW formed near the Franz Josef Land subsequently form an intermediate layer between FSBW and BSBW in SAT. Moreover, we show that the cooling zone of BSBW is now shifting northward to SAT. The mechanism of BSBW cooling by ocean-atmosphere heat exchange is now partially replaced by cooling due to mixing of BSBW with CDW in SAT. However, in years with strong southwesterly winds, the efficiency of this mechanism is also reduced, because small volume of relatively warm dense water is formed.
In situ measurements over the past 20 years have recorded zero and even positive temperatures of BSBW in SAT. This suggests that under current conditions BSBW with higher temperatures could reach the continental slope northward from SAT. Model studies report that wind speeds in the Arctic region will continue to increase in the future decades (Vavrus and Alkama, 2022). Combined with the decreasing of sea ice extent, wind anomalies could have even greater impact on BSBW characteristics than they currently do. Moreover, in situ measurements show a gradual freshening of AWM, which is also being transferred to the characteristics of BSBW. The increase in temperature, coupled with gradual freshening of BSBW, significantly affects its density, potentially leading to a reduced depth of BSBW descend at the continental slope. In addition, flow velocity of BSBW could also change due to its geostrophic nature. These changes could have significant impacts on the large-scale circulation in the Arctic Ocean, as well as the local interactions between BSBW and other water masses in SAT.
While our study provides significant progress in understanding the ongoing changes in the characteristics of BSBW, several questions remain insufficiently explored. First of all, the question of whether the conclusions we have drawn for the warm season of the year are also applicable to the winter season is still relevant. There is still very limited number of in situ measurements from October to May, so it is not yet possible to carry out similar analysis for the cold season. This task requires regular measurements from mooring stations as well as modeling studies. It can be assumed, however, that in the winter period there is also a distinct warming of the BSBW. In particular, Dmitrenko et al. (2015) observed the BSBW with temperatures greater than 0°C from December 2009 to January 2010 based on measurements from the mooring station. In addition, model studies are essential to quantify the influence of three considered factors on BSBW characteristics and to develop more accurate forecasts of their future changes. Finally, the causes of changes in the region of CDW formation off the coast of Novaya Zemlya are not fully understood. Formation of CDW north of the Novaya Zemlya Bank leads to later mixing of these waters with BSBW, and, consequently, to cooling of BSBW further northward than in the case of water formation at the Novaya Zemlya Bank. However, specific in situ measurements and numerical modeling studies are required to understand this issue.
Data availability statement
In situ measurements from 1977-1979, 1984-1992, 1995, 1996, 2008, 2009 and 2015 are available through the World Ocean Database (https://www.ncei.noaa.gov/products/world-ocean-database). Data for 2008, 2013 and 2015 are available at https://uaf-iarc.org/nabos/data/. The original contributions presented in the study are available through https://data.mendeley.com/ (2012: https://doi.pangaea.de/10.1594/PANGAEA.895269; 2013: https://doi.pangaea.de/10.1594/PANGAEA.895270; 2014: https://doi.pangaea.de/10.1594/PANGAEA.895271; 2017: https://data.mendeley.com/datasets/nxsxbdxyw7/1; 2021: https://data.mendeley.com/datasets/hhcgj8y5vn/1; 2023: https://data.mendeley.com/datasets/y68pdnmhgm/1; 2024: https://data.mendeley.com/datasets/9jv495dcxr/1). Further inquiries can be directed to the corresponding author.
Author contributions
ZZ: Conceptualization, Formal analysis, Investigation, Methodology, Resources, Visualization, Writing – original draft, Writing – review & editing. AO: Conceptualization, Formal analysis, Funding acquisition, Methodology, Project administration, Resources, Supervision, Writing – original draft, Writing – review & editing, Investigation. VI: Data curation, Formal analysis, Resources, Writing – review & editing. MM: Data curation, Formal analysis, Resources, Writing – review & editing. VM: Data curation, Formal analysis, Resources, Writing – review & editing.
Funding
The author(s) declare that financial support was received for the research and/or publication of this article. This research was funded by the Moscow Institute of Physics and Technology under the Agreement No. 075-03-2024–117 dated January 17, 2024 (analysis of dense water formation); the state assignment of Shirshov Institute of Oceanology No. FMWE-2024-0015 (analysis of sea ice data); the Russian Science Foundation, research project 23-17-00087 (study of water masses in the Barents Sea), research project 23-17-00001 (study of water masses in the St. Anna Trough), research project 24-17-00041 (processing and analysis of in situ data) and research project 22-77-10004 (processing and analysis of meteorological data).
Conflict of interest
The authors declare that the research was conducted in the absence of any commercial or financial relationships that could be construed as a potential conflict of interest.
Generative AI statement
The author(s) declare that no Generative AI was used in the creation of this manuscript.
Publisher’s note
All claims expressed in this article are solely those of the authors and do not necessarily represent those of their affiliated organizations, or those of the publisher, the editors and the reviewers. Any product that may be evaluated in this article, or claim that may be made by its manufacturer, is not guaranteed or endorsed by the publisher.
Supplementary material
The Supplementary Material for this article can be found online at: https://www.frontiersin.org/articles/10.3389/fmars.2025.1569186/full#supplementary-material
References
Aagaard K., Coachman L., and Carmack E. (1981). On the halocline of the Arctic Ocean. Deep Sea Res. Part A Oceanographic Res. Papers 28, 529–545. doi: 10.1016/0198-0149(81)90115-1
Årthun M., Eldevik T., Smedsrud L., Skagseth Ø., and Ingvaldsen R. (2012). Quantifying the influence of Atlantic heat on Barents Sea ice variability and retreat. J. Climate 25, 4736–4743. doi: 10.1175/JCLI-D-11-00466.1
Årthun M., Ingvaldsen R., Smedsrud L. H., and Schrum C. (2011). Dense water formation and circulation in the Barents Sea. Deep Sea Res. Part I: Oceanographic Res. Papers 58, 801–817. doi: 10.1016/j.dsr.2011.06.001
Backhaus J. O., Fohrmann H., Kämpf J., and Rubino A. (1997). Formation and export of water masses produced in Arctic shelf polynyas—process studies of oceanic convection. ICES J. Mar. Sci. 54, 366–382. doi: 10.1006/jmsc.1997.0230
Barton B. I., Lenn Y.-D., and Lique C. (2018). Observed atlantification of the Barents Sea causes the polar front to limit the expansion of winter sea ice. J. Phys. Oceanography 48, 1849–1866. doi: 10.1175/JPO-D-18-0003.1
Cai Z., You Q., Chen H. W., Zhang R., Chen D., Chen J., et al. (2022). Amplified wintertime Barents Sea warming linked to intensified Barents Oscillation. Environ. Res. Lett. 17, 044068. doi: 10.1088/1748-9326/ac5bb3
Dmitrenko I. A., Bauch D., Kirillov S. A., Koldunov N., Minnett P. J., Ivanov V. V., et al. (2009). Barents Sea upstream events impact the properties of Atlantic water inflow into the Arctic Ocean: Evidence from 2005 to 2006 downstream observations. Deep Sea Res. Part I: Oceanographic Res. Papers 56, 513–527. doi: 10.1016/j.dsr.2008.11.005
Dmitrenko I. A., Kirillov S. A., Serra N., Koldunov N., Ivanov V. V., Schauer U., et al. (2014). Heat loss from the Atlantic water layer in the northern Kara Sea: Causes and consequences. Ocean Sci. 10, 719–730. doi: 10.5194/os-10-719-2014
Dmitrenko I. A., Rudels B., Kirillov S. A., Aksenov Y., Lien V. S., Ivanov V. V., et al. (2015). Atlantic water flow into the Arctic Ocean through the St. Anna Trough in the northern Kara Sea. J. Geophysical Res. 120, 5158–5178. doi: 10.1002/2015JC010804
Ellingsen I., Slagstad D., and Sundfjord A. (2009). Modification of water masses in the Barents Sea and its coupling to ice dynamics: a model study. Ocean Dynamics 59, 1095–1108. doi: 10.1007/s10236-009-0230-5
Gammelsrød T., Leikvin Ø., Lien V., Budgell W. P., Loeng H., and Maslowski W. (2009). Mass and heat transports in the NE Barents Sea: Observations and models. J. Mar. Syst. 75, 56–69. doi: 10.1016/j.jmarsys.2008.07.010
Harms I. H. (1997). Water mass transformation in the Barents Sea—application of the hamburg shelf ocean model (HAMSOM). ICES J. Mar. Sci. 54, 351–365. doi: 10.1006/jmsc.1997.0226
Hersbach H., Bell B., Berrisford P., Hirahara S., Horanyi A., Munoz-Sabater J., et al. (2020). The ERA5 global reanalysis. Q. J. R. Meteorol. Soc. 146, 1999–2049. doi: 10.1002/qj.3803
Ingvaldsen R. B., Asplin L., and Loeng H. (2004). Velocity field of the western entrance to the Barents Sea. J. Geophysical Res.: Oceans 109. doi: 10.1029/2003JC001811
Ivanov V. (2023). Arctic sea ice loss enhances the oceanic contribution to climate change. Atmosphere 14, 409. doi: 10.3390/atmos14020409
Ivanov V. V., Frolov I. E., and Filchuk K. V. (2020). Transformation of Atlantic water in the north-eastern Barents Sea in winter. Arctic AntArctic Res. 66, 246–266. doi: 10.30758/0555-2648-2020-66-3-246-266
Ivanov G., Nescheretov A., and Ivanov V. (1999). Oceanographic investigations in the St. Anna Trough, Kara Sea. Berichte Zur Polar-und Meeresforschung 342, 27–45.
Ivanov V. V. and Shapiro G. I. (2005). Formation of a dense water cascade in the marginal ice zone in the Barents Sea. Deep Sea Res. Part I: Oceanographic Res. Papers 52, 1699–1717. doi: 10.1016/j.dsr.2005.04.004
Ivanov V. V. and Tuzov F. K. (2021). Formation of dense water dome over the Central Bank under conditions of reduced ice cover in the Barents Sea. Deep Sea Res. Part I: Oceanographic Res. Papers 175, 103590. doi: 10.1016/j.dsr.2021.103590
Lien V. S., Schlichtholz P., Skagseth Ø., and Vikebø F. B. (2017). Wind-driven Atlantic water flow as a direct mode for reduced Barents Sea ice cover. J. Climate 30, 803–812. doi: 10.1175/JCLI-D-16-0025.1
Lien V. S. and Trofimov A. G. (2013). Formation of Barents Sea branch water in the north-eastern Barents Sea. Polar Res. 32, 18905. doi: 10.3402/polar.v32i0.18905
Lind S., Ingvaldsen R. B., and Furevik T. (2018). Arctic warming hotspot in the northern Barents Sea linked to declining sea-ice import. Nat. Climate Change 8, 634–639. doi: 10.1038/s41558-018-0205-y
Loeng H. (1991). Features of the physical oceanographic conditions of the Barents Sea. Polar Res. 10, 5–18. doi: 10.3402/polar.v10i1.6723
Loeng H., Ozhigin V. K., Ådlandsvik B., and Sagen H. (1993). Current measurements in the northeastern Barents Sea (ICES).
Makhotin M. S. and Ivanov V. V. (2016). Circulation of the Atlantic water in the Barents Sea based on hydrological survey data and numerical simulation. Proc. Hydrometcentre Russia 361, 169–191.
Martin S. and Cavalieri D. J. (1989). Contributions of the siberian shelf polynyas to the Arctic Ocean intermediate and deep water. J. Geophysical Res.: Oceans 94, 12725–12738. doi: 10.1029/JC094iC09p12725
Matishov G. G., Matishov D. G., and Moiseev D. V. (2009). Inflow of Atlantic-origin waters to the Barents Sea along glacial troughs. Oceanologia 51, 321–340. doi: 10.5697/oc.51-3.321
Midttun L. (1985). Formation of dense bottom water in the Barents Sea. Deep Sea Res. Part A Oceanographic Res. Papers 32, 1233–1241. doi: 10.1016/0198-0149(85)90006-8
Moore G., Våge K., Renfrew I., and Pickart R. (2022). Sea-ice retreat suggests re-organization of water mass transformation in the Nordic and Barents Seas. Nat. Commun. 13, 67. doi: 10.1038/s41467-021-27641-6, PMID: 35013213
Onarheim I. H. and Årthun M. (2017). Toward an ice-free Barents Sea. Geophysical Res. Lett. 44, 8387–8395. doi: 10.1002/2017GL074304
Osadchiev A., Viting K., Frey D., Demeshko D., Dzhamalova A., Nurlibaeva A., et al. (2022). Structure and circulation of Atlantic water masses in the St. Anna Trough in the Kara Sea. Front. Mar. Sci. 9. doi: 10.3389/fmars.2022.915674
Panteleev G., Ikeda M., Grotov A., Nechaev D., and Yaremchuk M. (2004). Mass, heat and salt balances in the eastern Barents Sea obtained by inversion of hydrographic section data. J. Oceanography 60, 613–623. doi: 10.1023/B:JOCE.0000038353.37993.e1
Panteleev G., Nechaev D., and Ikeda M. (2006). Reconstruction of summer Barents Sea circulation from climatological data. Atmosphere-Ocean 44, 111–132. doi: 10.3137/ao.440201
Panteleev G., Proshutinsky A., Kulakov M., Nechaev D., and Maslowski W. (2007). Investigation of the summer Kara Sea circulation employing a variational data assimilation technique. J. Geophysical Res.: Oceans 112. doi: 10.1029/2006JC003728
Polyakov I. V., Pnyushkov A. V., Alkire M. B., Ashik I. M., Baumann T. M., Carmack E. C., et al. (2017). Greater role for Atlantic inflows on sea-ice loss in the Eurasian Basin of the Arctic Ocean. Science 356, 285–291. doi: 10.1126/science.aai8204, PMID: 28386025
Quadfasel D., Rudels B., and Selchow S. (1992). The Central Bank vortex in the Barents Sea: water mass transformation and circulation. In. ICES Mar. Sci. Symposia 40–51. doi: 10.17895/ices.pub.19270622
Rinke A., Maturilli M., Graham R. M., Matthes H., Handorf D., Cohen L., et al. (2017). Extreme cyclone events in the Arctic: Wintertime variability and trends. Environ. Res. Lett. 12, 094006. doi: 10.1088/1748-9326/aa7def
Rudels B. (1987). On the mass balance of the Polar Ocean, with special emphasis on the Fram Strait Vol. 188 (Norway: Norsk Polarinstitutt Skrifter).
Rudels B., Jones E. P., Schauer U., and Eriksson P. (2004). Atlantic sources of the Arctic Ocean surface and halocline waters. Polar Res. 23, 181–208. doi: 10.1111/j.1751-8369.2004.tb00007.x
Rudels B., Schauer U., Björk G., Korhonen M., Pisarev S., Rabe B., et al. (2013). Observations of water masses and circulation with focus on the Eurasian Basin of the Arctic Ocean from the 1990s to the late 2000s. Ocean Sci. 9, 147–169. doi: 10.5194/os-9-147-2013
Schauer U. (1995). The release of brine-enriched shelf water from Storfjord into the Norwegian Sea. J. Geophysical Res.: Oceans 100, 16015–16028. doi: 10.1029/95JC01184
Schauer U., Loeng H., Rudels B., Ozhigin V. K., and Dieck W. (2002a). Atlantic water flow through the Barents and Kara Seas. Deep Sea Res. Part I: Oceanographic Res. Papers 49, 2281–2298. doi: 10.1016/S0967-0637(02)00125-5
Schauer U., Rudels B., Jones E., Anderson L., Muench R., Björk G., et al. (2002b). Confluence and redistribution of Atlantic water in the Nansen, Amundsen and Makarov basins. Annales Geophysicae 20, 257–273. doi: 10.5194/angeo-20-257-2002
Shu Q., Wang Q., Song Z., and Qiao F. (2021). The poleward enhanced Arctic Ocean cooling machine in a warming climate. Nat. Commun. 12, 2966. doi: 10.1038/s41467-021-23321-7, PMID: 34016987
Skagseth Ø., Eldevik T., Årthun M., Asbjørnsen H., Lien V. S., and Smedsrud L. H. (2020). Reduced efficiency of the Barents Sea cooling machine. Nat. Climate Change 10, 661–666. doi: 10.1038/s41558-020-0772-6
Skagseth Ø., Furevik T., Ingvaldsen R., Loeng H., Mork K. A., Orvik K. A., et al. (2008). “Volume and heat transports to the Arctic Ocean via the Norwegian and Barents Seas,” in Arctic–subArctic Ocean fluxes: Defining the role of the northern seas in climate, 45–64. doi: 10.1007/978-1-4020-6774-73
Smedsrud L. H., Esau I., Ingvaldsen R. B., Eldevik T., Haugan P. M., Li C., et al. (2013). The role of the Barents Sea in the Arctic climate system. Rev. Geophysics 51, 415–449. doi: 10.1002/rog.20017
Stroeve J. C., Markus T., Boisvert L., Miller J., and Barrett A. (2014). Changes in Arctic melt season and implications for sea ice loss. Geophysical Res. Lett. 41, 1216–1225. doi: 10.1002/2013GL058951
Sumkina A., Kivva K., and Ivanov V. (2023). Seasonality of heat exchange on the Barents Sea surface. Oceanology 63, S65–S71. doi: 10.1134/S0001437023070196
Tsubouchi T., Våge K., Hansen B., Larsen K. M. H., Østerhus S., Johnson C., et al. (2021). Increased ocean heat transport into the Nordic seas and Arctic Ocean over the period 1993–2016. Nat. Climate Change 11, 21–26. doi: 10.1038/s41558-020-00941-3
Vavrus S. J. and Alkama R. (2022). Future trends of Arctic surface wind speeds and their relationship with sea ice in CMIP5 climate model simulations. Climate Dynamics 59, 1833–1848. doi: 10.1007/s00382-021-06071-6
Keywords: Atlantic water masses, atlantification, Barents Sea branch water, St. Anna Trough, Barents Sea, Arctic Ocean
Citation: Zabudkina Z, Osadchiev A, Ivanov V, Makhotin M and Merkulov V (2025) Interannual variability of the Barents Sea branch water in the northeastern part of the Barents Sea and the St. Anna Trough. Front. Mar. Sci. 12:1569186. doi: 10.3389/fmars.2025.1569186
Received: 31 January 2025; Accepted: 18 June 2025;
Published: 10 July 2025.
Edited by:
Igor Dmitrenko, University of Manitoba, CanadaReviewed by:
Dorothea Bauch, University of Kiel, GermanyVidar Lien, Norwegian Institute of Marine Research (IMR), Norway
Gleb Panteleev, Naval Research Laboratory, United States
Copyright © 2025 Zabudkina, Osadchiev, Ivanov, Makhotin and Merkulov. This is an open-access article distributed under the terms of the Creative Commons Attribution License (CC BY). The use, distribution or reproduction in other forums is permitted, provided the original author(s) and the copyright owner(s) are credited and that the original publication in this journal is cited, in accordance with accepted academic practice. No use, distribution or reproduction is permitted which does not comply with these terms.
*Correspondence: Zinaida Zabudkina, emluYWlkYXphYnVka2luYUB5YW5kZXgucnU=