 Megan N. Wilson1,2*
 Richard D. Brodeur3
 Toby D. Auth4G. Curtis Roegner5
 Cheryl A. Morgan6
 Samantha M. Zeman6
 Su Sponaugle1
- 1Department of Integrative Biology, Hatfield Marine Science Center, Oregon State University, Newport, OR, United States
- 2Puget Sound Partnership, Olympia, WA, United States
- 3Northwest Fisheries Science Center, National Oceanic and Atmospheric Administration, Hatfield Marine Science Center, Newport, OR, United States
- 4Pacific State Marine Fisheries Commission, Portland, OR, United States
- 5Northwest Fisheries Science Center, National Oceanic and Atmospheric Administration, Point Adams Research Station, Hammond, OR, United States
- 6Cooperative Institute for Marine Ecosystem and Resources Studies, Hatfield Marine Science Center, Oregon State University, Newport, OR, United States
Effects of climate change on ocean ecosystem dynamics are widespread. Oceanographic conditions vital to biological communities have already shown changes, resulting in negative impacts on several of the world’s largest fisheries. The Northern California Current (NCC) is a highly productive system that supports many important fisheries. In addition to large-scale oceanographic forcing and seasonal up- and downwelling cycles, in the last decade, the NCC also experienced two distinct marine heatwaves (MHWs) that resulted in pervasive ecosystem alterations. The 2014–16 and 2019 MHWs had contrasting oceanic and atmospheric origins and different effects on ocean temperature, providing the opportunity to identify the mechanisms important to juvenile fish recruitment processes and how they may be differentially impacted by future warming scenarios. We utilized a five-year time series (2014, 2015, 2016, 2018, and 2019) of larval fish concentration, growth, and diet as a natural experiment to investigate the impact of MHWs as well as two neutral years on cabezon (Scorpaenicthys marmoratus). Findings include the first published measurement of larval cabezon daily growth rates. Mean growth rates were higher during MHWs, suggesting that elevated temperatures did not pose a major growth or survival challenge. Cabezon’s fast growth response to MHW conditions demonstrates that larval cabezon were able to sustain fast growth in warmer temperatures, and were not likely prey limited. Further, larval cabezon gut fullness did not differ significantly among years. Instead, differences in diet composition and prey quality varied with larval growth. Relative to slower-growing larvae, larval cabezon with high growth rates consumed larger prey items, including larval euphausiids and amphipods. Consistent with these patterns of larval growth, nearshore recruitment of juvenile cabezon was also high during MHW years. Our findings highlight the importance of phenological coupling, or matches in timing, between cabezon and euphausiid population dynamics in that larval cabezon exhibited fast growth when the timing of flexion was coupled with the euphausiid population transition to a larger, omnivorous larval stage. Results of this study suggest that larval cabezon’s variable growth and broad diet coupled with selection for large, nutrient dense prey may be a source of resilience for its population dynamics.
1 Introduction
Global climate change is driving ecosystem-wide responses in coastal and open oceans around the world. A dramatic increase in greenhouse gasses in the atmosphere has led to unprecedented physical and chemical changes in ocean environments, including increases in ocean temperatures and acidification, decreases in dissolved oxygen, and changes to freshwater input and nutrient cycling (Deutsch et al., 2015; Doney et al., 2012; Abraham et al., 2013; Altieri and Gedan, 2015; Chan et al., 2019; IPCC, 2019). These stressors interact to alter ecosystem structure and functioning in direct and indirect ways, including changes in ocean productivity, phenology, and species distributions (Hsieh and Boer, 1992; Koeller et al., 2009; Bakun et al., 2015). Documenting and predicting changes to vulnerable ocean habitats, such as regions with high exposure to stressors (e.g., surface waters), those already near ecological tipping points (e.g., coral reefs, kelp forests), and nursery grounds for important fisheries species (e.g., mangroves, seagrass beds) is critical (e.g., Rogers-Bennett and Catton, 2019).
Among the stressors impacting marine ecosystems, increases in ocean temperatures are already resulting in poleward shifts in species’ ranges (Hastings et al., 2020; Pinsky et al., 2020), altered life history timelines (Auth et al., 2018; Asch et al., 2019), and physiological challenges (Bennett et al., 2019). In addition to long-term, nonstationary ocean warming, climate change is expected to increase the number of marine heatwaves (MHWs; Hobday et al., 2016, 2018, Frölicher et al., 2018). MHWs are defined as discrete periods of prolonged anomalously warm water at a particular location (Hobday et al., 2016, 2018) and are often caused by compounding influences of atmospheric forcing (e.g., air-sea heat flux, teleconnections) and/or oceanic processes (e.g., heat transport; Oliver et al., 2021). While MHWs are not a new phenomenon, they have been increasing in frequency and duration over the past century (Oliver et al., 2018) and have caused substantial disruptions to marine ecosystems (Mills et al., 2013; Wernberg et al., 2013; Hughes et al., 2017; Eakin et al., 2019; Jacox et al., 2019; Smale et al., 2019; Gomes et al., 2024). Early life stages are a survival bottleneck for many marine species and can be particularly vulnerable to MHW impacts. For example, MHW have been linked to failed spawning of invertebrates (e.g., Shanks et al., 2020), shifting species assemblages of larval fishes (e.g., Thompson et al., 2022), and disruptions to larval physiology (e.g., Gall et al., 2021; Bruning et al., 2024) and larval phenology (e.g., Miller et al., 2024) during critical life stage transitions (e.g., metamorphosis, molting). In recent years, significant advances in our ability to model the physical drivers of MHWs have enabled forecasting of future events (Oliver et al., 2019; Holbrook et al., 2020; Jacox et al., 2022), yet we lack a mechanistic understanding of the biological and ecological effects on marine processes, especially those that have been historically challenging to study, such as such as the survival and recruitment of taxa with planktonic stages of development. Studies that examine larval feeding, growth, and survival in response to multiple distinct MHW events are needed.
The Northern California Current (NCC) is a dynamic eastern boundary current system characterized by high productivity that fuels several large commercial fisheries. This productivity is largely attributed to intense seasonal upwelling and the retention of nutrients from river runoff along the continental shelf (Huyer, 1983; Hickey and Banas, 2008; Checkley and Barth, 2009). The NCC undergoes substantial variability in temperature related to local and remote forcing and fluctuates between warm and cold periods on a regular basis (Fiedler and Mantua, 2017). From 2014-19, the NCC experienced several record-setting MHW events with longer durations and higher intensities and frequencies than have been recorded in recent decades, well exceeding normal variability (Bond et al., 2014, Di Lorenzo and Mantua, 2016; Amaya et al., 2020; Weber et al., 2021). For example, peak sea surface temperature anomalies reached 2–3 standard deviations above normal in 2013–2015 and 3.5 standard deviations above normal in 2019 (Amaya et al., 2020). In response to anomalous environmental conditions, profound ecosystem effects occurred throughout the California Current including shifts in species distributions and spawning patterns at all trophic levels (Cavole et al., 2016; Di Lorenzo and Mantua, 2016; McClatchie et al., 2016; Daly et al., 2017; Peterson et al., 2017; Auth et al., 2018; Jacox et al., 2018; Brodeur et al., 2019; Rogers-Bennett and Catton, 2019, Starko et al., 2025) and changes in the growth of young fish (Fennie et al., 2023).
To understand the impact of MHWs on marine ecosystems, particularly the response of economically and culturally important fish populations to climate change stressors, it is necessary to understand how MHWs impact recruitment processes. Marine larvae typically suffer exceptionally high mortality rates (>99%; Peterman and Bradford, 1987; Hedgecock and Pudovkin, 2011), thus it is likely that the effects of MHWs will disproportionately impact this vulnerable life stage. There is a long history of studies of environmental factors that affect larval fish and invertebrate growth and survival (e.g., Cushing, 1990; Hare, 2014; Pan et al., 2016). For larval fishes that inhabit upwelling zones, past studies have found that intermediate levels of wind stress strike a balance between enhancing prey availability and minimizing advective loss (Rothschild and Osborn, 1988; Cury and Roy, 1989; Roy et al., 1992). During MHW events where upwelling is suppressed, lower productivity may result in poor feeding conditions for larvae (Cushing, 1990). Alternatively, calm physical conditions may allow prey to form concentrated layers that larval fish may exploit (Lasker, 1975). For zooplankton that depend upon temperature as a phenological signal (e.g., for reproduction, somatic growth, dormancy; Mackas et al., 2012), MHW events may spatially or temporally decouple larval fishes and their prey, resulting in recruitment failure.
Cabezon is the largest cottid in the California Current and is economically and culturally important. Archeological records indicate harvest of cabezon at exposed rocky coastal sites in California as early as 6200 B.C. (Gobalet and Jones, 1995). Cabezon is targeted by modern recreational and commercial fisheries throughout its range (Cope and Key, 2009; Rodomsky et al., 2018). Because of their proximity to shore and ability to survive capture, cabezon are specifically targeted by the live-fish fishery, a ‘boutique’ fishery that provides restaurants with live, dinner-plate sized fish (McKee-Lewis, 1996). Over the past two decades, cabezon harvest in California, Oregon, and Washington has ranged from approximately 85–230 mts, at a value of 1.5-3.5 dollars per pound, depending on whether the harvest was sold fresh (dead) or live (Cope et al., 2019). Total landings in Oregon and California peaked at nearly 550 mts in the 1990s (Cope and Key, 2009) and cabezon were the fifth most important species in California’s commercial live-fish fishery (Lucas, 2006). Cabezon spawn during both winter (downwelling) and summer (upwelling) months (Doyle, 1992; Shenker, 1988; Ottmann et al., 2018), thus their larval stages experience distinct upwelling regimes that impact temperature and prey availability. Larval cabezon primarily inhabit the neuston for the duration of their larval stage (Shenker, 1988; Doyle, 1992), utilizing this zone as a nursery and likely taking advantage of elevated prey availability. The neuston is a known nursery ground for multiple species (Brodeur, 1989; Whitney et al., 2021) and, being at the air-sea interface, it is especially exposed to climate change stressors (Gove et al., 2019; Helm, 2021). Despite this importance and unique vulnerability, our understanding of ecological processes in this habitat is limited. We utilized a 5-yr time series of neuston sampling from along the Oregon and Washington coasts that encompassed two different MHW events as well as oceanographically neutral years as a natural experiment to shed light on the trophodynamics and growth of larval cabezon. Increased understanding of the larval ecology of this species provides a window of insight into how recruitment processes may be impacted by climate change in the future.
2 Methods
2.1 Field sampling
Biological net samples were collected during 10 research surveys in the NCC in five different years: 2014, 2015, 2016, 2018, and 2019, representing a portion of the long-term environmental monitoring data that are collected by the National Oceanic and Atmospheric Administration (NOAA), Northwest Fisheries Science Center (NWFSC) in this region (Supplementary Figure S1). It should be noted that because biological sampling occurred via three separate research surveys, larval cabezon and prey collections did not spatially or temporally overlap exactly. While coupled in-situ sampling of zooplankton and larval fish would be preferable to ensure spatial overlap of predators and prey (sensu Sponaugle et al., 2009; Swieca et al., 2023), such studies are rare and targeted (i.e., often do not span several years). We cannot assume direct spatial overlap between larval cabezon and prey using the samples available for this study. However, these surveys represent the best-available long-term larval cabezon and prey data in this region as close to co-located as possible and thus provide valuable insights about trophodynamics in the region. All larval cabezon were collected during NWFSC Pre-recruit Surveys. Prey densities and biomasses were collected during NWFSC Newport Hydrographic Line (NHL) surveys and NWFSC Juvenile Salmon and Ocean Ecosystem Surveys (JSOES). Pre-recruit cruises sampled shelf, shelf-break, and offshore stations along ten cross-shelf transects in Oregon and Washington waters (42-46.5˚N; Brookings, Oregon to Willapa Bay, Washington; Brodeur et al., 2019); samples utilized in this study came from nine of these transects. The JSOES survey sampled five to six stations along cross-shelf transects in Oregon and Washington waters (44.5-48˚N; Newport, Oregon to La Push, Washington; Morgan et al., 2019); samples utilized in this study came from one shelf (60-m depth) and one shelf break (296-m) station along a single transect (Newport, Oregon). Similarly, samples from the NHL surveys were from one shelf (60-m depth) and one shelf-break (296-m depth) station on the historically sampled NHL (44.6°N; Peterson et al., 2017). All samples utilized in this study had a similar annual temporal scale (May-June of each year).
2.1.1 Biological sample collection
Larval fishes, including cabezon, were collected using a 1.0 x 0.5-m, 333-μm mesh neuston net towed horizontally along the sea surface for 5 min at 3.7 km h−1 (~ 1.0 m s −1) on Pre-recruit surveys. This net targets the surface layer where cabezon live. The volume of water filtered was estimated using a General Oceanics flowmeter. All larval fishes were sorted, identified, measured (to standard length, SL), and preserved according to standard procedures (Auth and Brodeur, 2006; Auth, 2008; Auth et al., 2018). Larval cabezon were separated for further laboratory analysis.
Amphipod and early-stage euphausiid biomasses were estimated from zooplankton samples collected by a 0.6-m diameter, 333-μm mesh plankton net towed obliquely from approximately 20-m to the sea surface (Morgan et al., 2005; Brodeur and Morgan, 2016; Morgan et al., 2019) on JSOES surveys. This net was used for these taxa with higher mobility which would allow them to evade plankton nets with smaller mesh (below). Amphipods and euphausiid eggs and larvae (nauplii, calyptopis, and furcilia) were enumerated, measured, and converted to biomass using length-to-mass regressions (e.g., Morgan et al., 2019).
The environmental concentrations of appendicularians, cladocerans, copepod nauplii, and adult copepods were estimated from zooplankton samples collected from a 0.5-m diameter, 202-μm plankton net towed vertically from a maximum of 100-m to the sea surface (sensu Keister et al., 2011; Fisher et al., 2015; Peterson et al., 2017) on NHL surveys. This smaller mesh net allows for the collection of smaller less mobile plankton. The volume of water filtered was estimated using a Tsurumi-Seiki (TSK) flowmeter. Concentrations estimated for individual species were summed over broad taxonomic groups (e.g., Podon sp. and Evadne sp. summed to form Cladocera group) and averaged over sampling station and averaged over sampling events (May and June) each year. Copepods were enumerated, identified following standard methods, measured, and converted to biomass using length-to-mass regressions from the literature (e.g., sensu Hooff and Peterson, 2006). Only the copepod groups observed in larval cabezon guts —Pseudocalanus spp., Centropages sp., Acartia spp., Paracalanus spp., Ctenocalanus sp., Clausocalanus spp., Calocalanus spp., Mesocalanus sp., and Corycaeus spp.— were included in the estimation of copepod environmental biomass. Copepod biomasses were summed for calanoid and cyclopoid groups separately and then averaged over sampling station and averaged over sampling events (May and June).
2.2 Environmental data
High resolution (1/4˚) daily sea surface temperature (SST) data were obtained from the NOAA OISST V2 data product (https://www.esrl.noaa.gov/psd/). A time series of daily SST for the study region was obtained by averaging over 42.125 to 46.625˚N and 124.25 to 125.25˚W. These data were analyzed using the R software (v. 4.0.4) package heatwaveR (Schlegel and Smit, 2018) to identify the presence of marine heatwave (MHW) events, which are defined as five or more consecutive days of anomalously warm temperatures, or temperatures elevated above a threshold value, in this case the 90th percentile defined over a 30-y climatology (1982-2012; following Hobday et al., 2016, 2018). MHW events are categorized as “moderate” if the maximum intensity does not double the distance between the climatology and the threshold value, “strong” if the maximum intensity doubles the distance between the climatology and the threshold value, “severe” if this distance is tripled, and “extreme” if the distance is quadrupled (following Hobday et al., 2016). Mean recent temperature (MRT), or the average of daily SST during the last three complete days of life for individual larval cabezon, was calculated to align environmental conditions with the experiences of larvae at the time of collection.
Upwelling intensity was calculated using the Coastal Upwelling Transport Index (CUTI; Jacox et al., 2018; https://mjacox.com/upwelling-indices/), which provides estimates of vertical transport near the coast. CUTI values in the central geographic area of the study region (44°N) were summed over the 14-d period prior to larval collection to estimate the cumulative upwelling input into the ecosystem. This 14-d period was chosen to account for the lag between physical forcing and zooplankton abundance, as zooplankton blooms are thought to lag wind stress by ~13–16 d (Spitz et al., 2005).
2.3 Diet analysis
We examined the gut contents of larval cabezon collected in 2014 (n=13), 2015 (n=14), 2018 (n=8) and 2019 (n=18). In 2016, a total of n=106 larval cabezon were collected, thus we utilized a random subsample for gut content analysis (n=24). Larval guts were dissected in glycerol on a glass microscope slide under a Leica MZ16 dissecting scope. We removed the entire gastrointestinal tract and then gently teased out prey items using minutien pins, starting with the anterior end (Llopiz and Cowen, 2009). Prey were identified to the lowest taxonomic level possible, enumerated, and measured along the longest axis (prosome length, carapace length, trunk length, or total length) under the same microscope fitted with a Leica DMLB camera and Imago Pro Premier 9.1 software. Prey lengths were converted to biomass using published length to mass regressions, using temperate system conversions wherever possible (Uye, 1982; Hosie and Ritz, 1983; Middlebrook and Roff, 1986; Hay et al., 1991; Mumm, 1991; Abubakr and Jones, 1992; Webber and Roff, 1995; Berggreen et al., 1988; Lindley, 1998, 1999; Satapoomin, 1999; Cornet-Barthaux et al., 2007; Llopiz and Cowen, 2009; Nakamura et al., 2017). We identified most copepods prey items to orders Calanoida or Cyclopoida. All cyclopoid copepods were positively identified as Corycaeus spp. For some calanoid copepods, lower taxonomic resolution was possible, including the positive identification the following genera: Pseudocalanus spp., Centropages sp., Acartia spp., Paracalanus spp., and a group unidentifiable to genera but likely a member of the following group: Paracalanus spp., Ctenocalanus sp., Clausocalanus spp., Calocalanus spp., or Mesocalanus sp. However, because some calanoids could not be identified beyond order, we present copepod prey in two groups: calanoids and Corycaeus spp. For unknown crustaceans (e.g., unidentifiable copepods) the means of all conversions within the lowest possible taxonomic group were used.
We calculated feeding incidence as the percentage of cabezon larvae with prey in their guts. Larvae with empty guts were excluded from further prey analysis (n=3). Three metrics were used to describe larval diet composition: 1) frequency of occurrence (%FO, the percent of larvae with a particular prey type in gut), 2) numerical percentage (%N, the percent number of each prey type out of all prey numbers available), and 3) biomass proportion (%B, the percent biomass of each prey type out of total consumed prey biomass). These diet metrics were calculated for each year group. There was a broad size range of cabezon larvae in all years; thus, to factor in any ontogenetic shifts in feeding, larvae were split into large (>8.4 mm) and small (<8.4 mm) size classes to investigate the differences in diet composition. A size of 8.4 mm SL was selected because this is the size that most larvae in the study undergo flexion.
Consumed prey biomass was calculated for each individual larva by summing the biomass of all consumed prey. We divided this value by larval volume (SL3) to account for increased gut capacity with increasing larval size. We used larval volume instead of SL (Sponaugle et al., 2009; Gleiber et al., 2020; Swieca et al., 2023) because post-flexion growth in larval cabezon is associated with substantial increases in body depth. Thus, larval volume more accurately captures increased gut capacity than larval length. We calculated gut fullness by regressing consumed prey biomass on larval volume to account for the increase in gut capacity with growth and examining the residuals of this relationship (Dower et al., 1998; Sponaugle et al., 2009). Analysis of variance (ANOVA) was used to compare consumed prey biomass and gut fullness between year groups and prey types.
We calculated a prey selectivity index (wi, Equation 1) using prey proportions consumed as a function of prey availability (following Manly et al., 2002; Llopiz and Cowen, 2009):
where oi is the proportion of prey type i consumed and πi is the proportion in the environment. Values of wi>1 indicate selection for a prey type and values<1 indicate selection against a prey type. Selection ratios near 1 indicate consumed proportions reflect those in the environment. Bonferroni-adjusted confidence intervals [S(wi), Equation 2] were calculated as:
where ui is the total number of prey items consumed. Significant selection for or against a prey item is shown by a CI not overlapping with 1 (non-random selection). This selection ratio was chosen for its simplicity and statistical testability, but CIs are questionable for rare prey (Manly et al., 2002). The selection ratio becomes Chesson’s α when expressed as a proportion of the sum of selection ratios, which is known to be similarly vulnerable when prey types are rare in the environment (Lechowicz, 1982). Thus, the selectivity index is not calculated for prey types where the number of consumed prey ≤ 3. Selectivity values were calculated by pooling individuals within a given year (e.g., oi: biomass of prey type i consumed in a given year/total biomass of prey consumed in a given year; πi: biomass of prey type i in environment in a given year/total biomass of larval cabezon prey items in environment in given year). We used the selection index and other diet metrics to identify the most important prey items (i.e., highly selected for and comprising a large proportion of larval cabezon diet). We then grouped years by the occurrence of these important prey items for growth analysis.
2.4 Growth analysis
We used otolith microstructure analysis to analyze the age and daily growth rates of larval cabezon. We have previously validated the assumptions underlying the use of otolith microstructure, including daily deposition of material (Wilson et al., 2023). While this is the first study to use otolith microstructure analysis to make biological and ecological inferences about the early life history and survival of this species, otolith microstructure has been used successfully in other cottids elsewhere (Khrustaleva and Pavlov, 2000; Onikura et al., 2004). Extreme temperature and/or feeding conditions, often encountered in laboratory studies, may influence otolith deposition (e.g., Ofelio et al., 2023), however we assumed consistent otolith deposition across the range of temperatures encountered in this study. Further laboratory testing would be useful to test this assumption.
A limited sample size of cabezon larvae necessitated that we pool samples from all sampling locations and by year group. All larvae (n=196) were staged (pre-flexion, flexion, or transformation) and measured for SL and gape width (mouth height and width; Yasuda, 1960) to the nearest 0.01 mm using a Leica MZ16 dissecting microscope with a Leica DLMB camera and Image Pro Premier 9.1 software. In 2014, 2015, 2016, and 2018, larvae were heavily damaged due to preservation methods and the otoliths of many individuals were degraded or completely dissolved. As a result, although all larvae were examined for otoliths, usable otolith sample sizes varied each year: 2014 (n=13), 2015 (n=9), 2016 (n=7), 2018 (n=10), and 2019 (n=20). Due to low sample size, and similar environmental conditions, we combined individual years into year groups. Individual larvae used in the diet analysis were also used in otolith analysis.
Otoliths were relatively easy to locate in the cranium, lying laterally along either side of the brain (Supplementary Figure S2A). In younger cabezon, incomplete cranium ossification and pigmentation meant otoliths could be seen through the cranium prior to dissection. This was not possible in older cabezon (post-flexion and transformation stage), where ossification and pigmentation necessitated careful removal of the top of the cranium. Sagittal otoliths were distinguished by their medial location and ellipsoid shape relative to more laterally located, rounder lapilli. The hatch mark was often challenging to locate due to the cloudy nature of the core region but was distinguished as the first increment to encompass >75% of the core circumference [see Wilson et al. (2023) for confirmation via a laboratory-based rearing study].
Sagittal otoliths were dissected and stored in immersion oil on a glass microscope slide for 1–3 days to clear prior to reading. Otoliths were read along the longest axis at 100x magnification using a Leica DMLB compound microscope with a Lumenera Infinity 3 camera and Image Pro Premier 9.1 software. Each otolith was read twice by the same reader without access to prior reads or sampling data. If the two readings differed by ≤5%, one read was randomly chosen for analysis. If reads differed by >5%, otoliths were read a third time. Otoliths where the three readings differed by >5% would be removed from analysis (n=0; Sponaugle et al., 2009).
Daily otolith increments were enumerated to provide an estimate of age. The distance between two consecutive increments (increment width) was used to analyze growth patterns using two metrics: 1) mean daily growth (MDG), the average increment width for each day of life, and 2) mean recent growth (MRG), or the average increment width for the last three complete days of life. MRG was used to relate biological responses to the environmental conditions at the time of sampling.
Otolith increment width typically increases with the age of the fish (Baumann et al., 2003). Thus, we accounted for the effect of age on MRG by calculating a detrended growth index (Equation 3):
where is the detrended growth of individual i at age j, is the otolith-based growth (increment width) of individual i at age j, is the mean otolith-based growth of all individuals at age j, and SD is the standard deviation of G. Analyzing detrended MRG allowed us to compare the biological response to environmental conditions across different aged larvae (Robert et al., 2009; Sponaugle et al., 2010).
We compared MRG across year groups using ANOVA, followed by a Tukey HSD post-hoc test. We also used analysis of covariance (ANCOVA) with age and location as covariates to check that differences in MRG across year groups were not confounded by age or location. Differences in MRG remained significant after accounting for age (p<0.05). Differences in MRG were marginally significant after accounting for location (p=0.07). Considering the small sample size and large survey area, we proceeded under the assumption that location was not confounding observed differences in MRG.
2.5 Statistical modeling
We used generalized additive models (GAMs) to assess the effect of upwelling, temperature, and prey availability on the recent growth of larval cabezon. The response variable in the model was individual MRG of cabezon (n=55). The candidate predictor variables were upwelling intensity (cumulative; 14 d prior to collection), mean recent sea surface temperature (MRT; averaged over last three complete days prior to collection), appendicularian concentration (ind. m-3), cladoceran concentration (ind. m-3), copepod nauplii concentration (ind. m-3), calanoid copepod biomass (mg C m-3), Corycaeus spp. biomass (mg C m-3), biomasses of four euphausiid life stages (i.e., egg, nauplii, calyptopis, and furcilia; mg C m-3), and amphipod biomass (mg C m-3). We included a measure of early growth (mean increment width over first 6 d of life, which is on average the first third of larval life) because an individual’s recent growth is likely dependent on growth experiences early in life (i.e., fish that grow faster when young are more likely grow faster at older ages). Finally, we included latitude as a random intercept to account for spatial differences in collection location, as spatial comparisons were outside the scope of the present study. We also examined a second suite of models with the same structure, but instead of environmental prey concentrations and biomasses, we used ingested prey biomasses.
We used Kendall’s correlation test, a nonparametric alternative to a Pearson test, to evaluate collinearity between candidate predictor variables. While there appeared to be a relationship between temperature and the environmental biomass of calyptopis (τ = 0.74), more distinct observations are needed to clarify this relationship. Smoothing functions were applied to each predictor variable and the number of knots was restricted to three to avoid model overfitting given the small sample size. We then used a forward stepwise selection procedure to include significant predictor variables (p<0.05) while maximizing model fit and parsimony by minimizing Akaike’s information criterion (AIC) and the generalized cross validation (GCV) score and maximizing the deviance explained. Model residuals were inspected for deviations from normality and homogeneity of variance. All model analyses and visualizations were conducted using the R packages ‘mgcv’ (Wood, 2017) and ‘mgcViz’ (Fasiolo et al., 2020).
3 Results
3.1 Environmental setting
Interannual variation in satellite-derived sea surface temperature led to annual cohorts of larval cabezon experiencing a different mean (ranging from 12.00-13.80˚C) and range of temperature variation (0.01-2.41˚C difference; Figure 1). The temperature cabezon larvae experienced during their final three days of life, corresponding to the mean recent growth and feeding environment, ranged from 12.32 ˚C-14.41˚C, occurring in 2015 and 2016, respectively. There was also interannual variation in cumulative upwelling in the study region (Figure 2). On average, 2018 had the lowest mean cumulative upwelling (2.31 m3s-1), while 2019 was >3x greater (7.74 m3s-1). However, 2014 had the highest maximum upwelling value and experienced the greatest range in upwelling strength over 14 d (4.34-10.35 m3s-1).
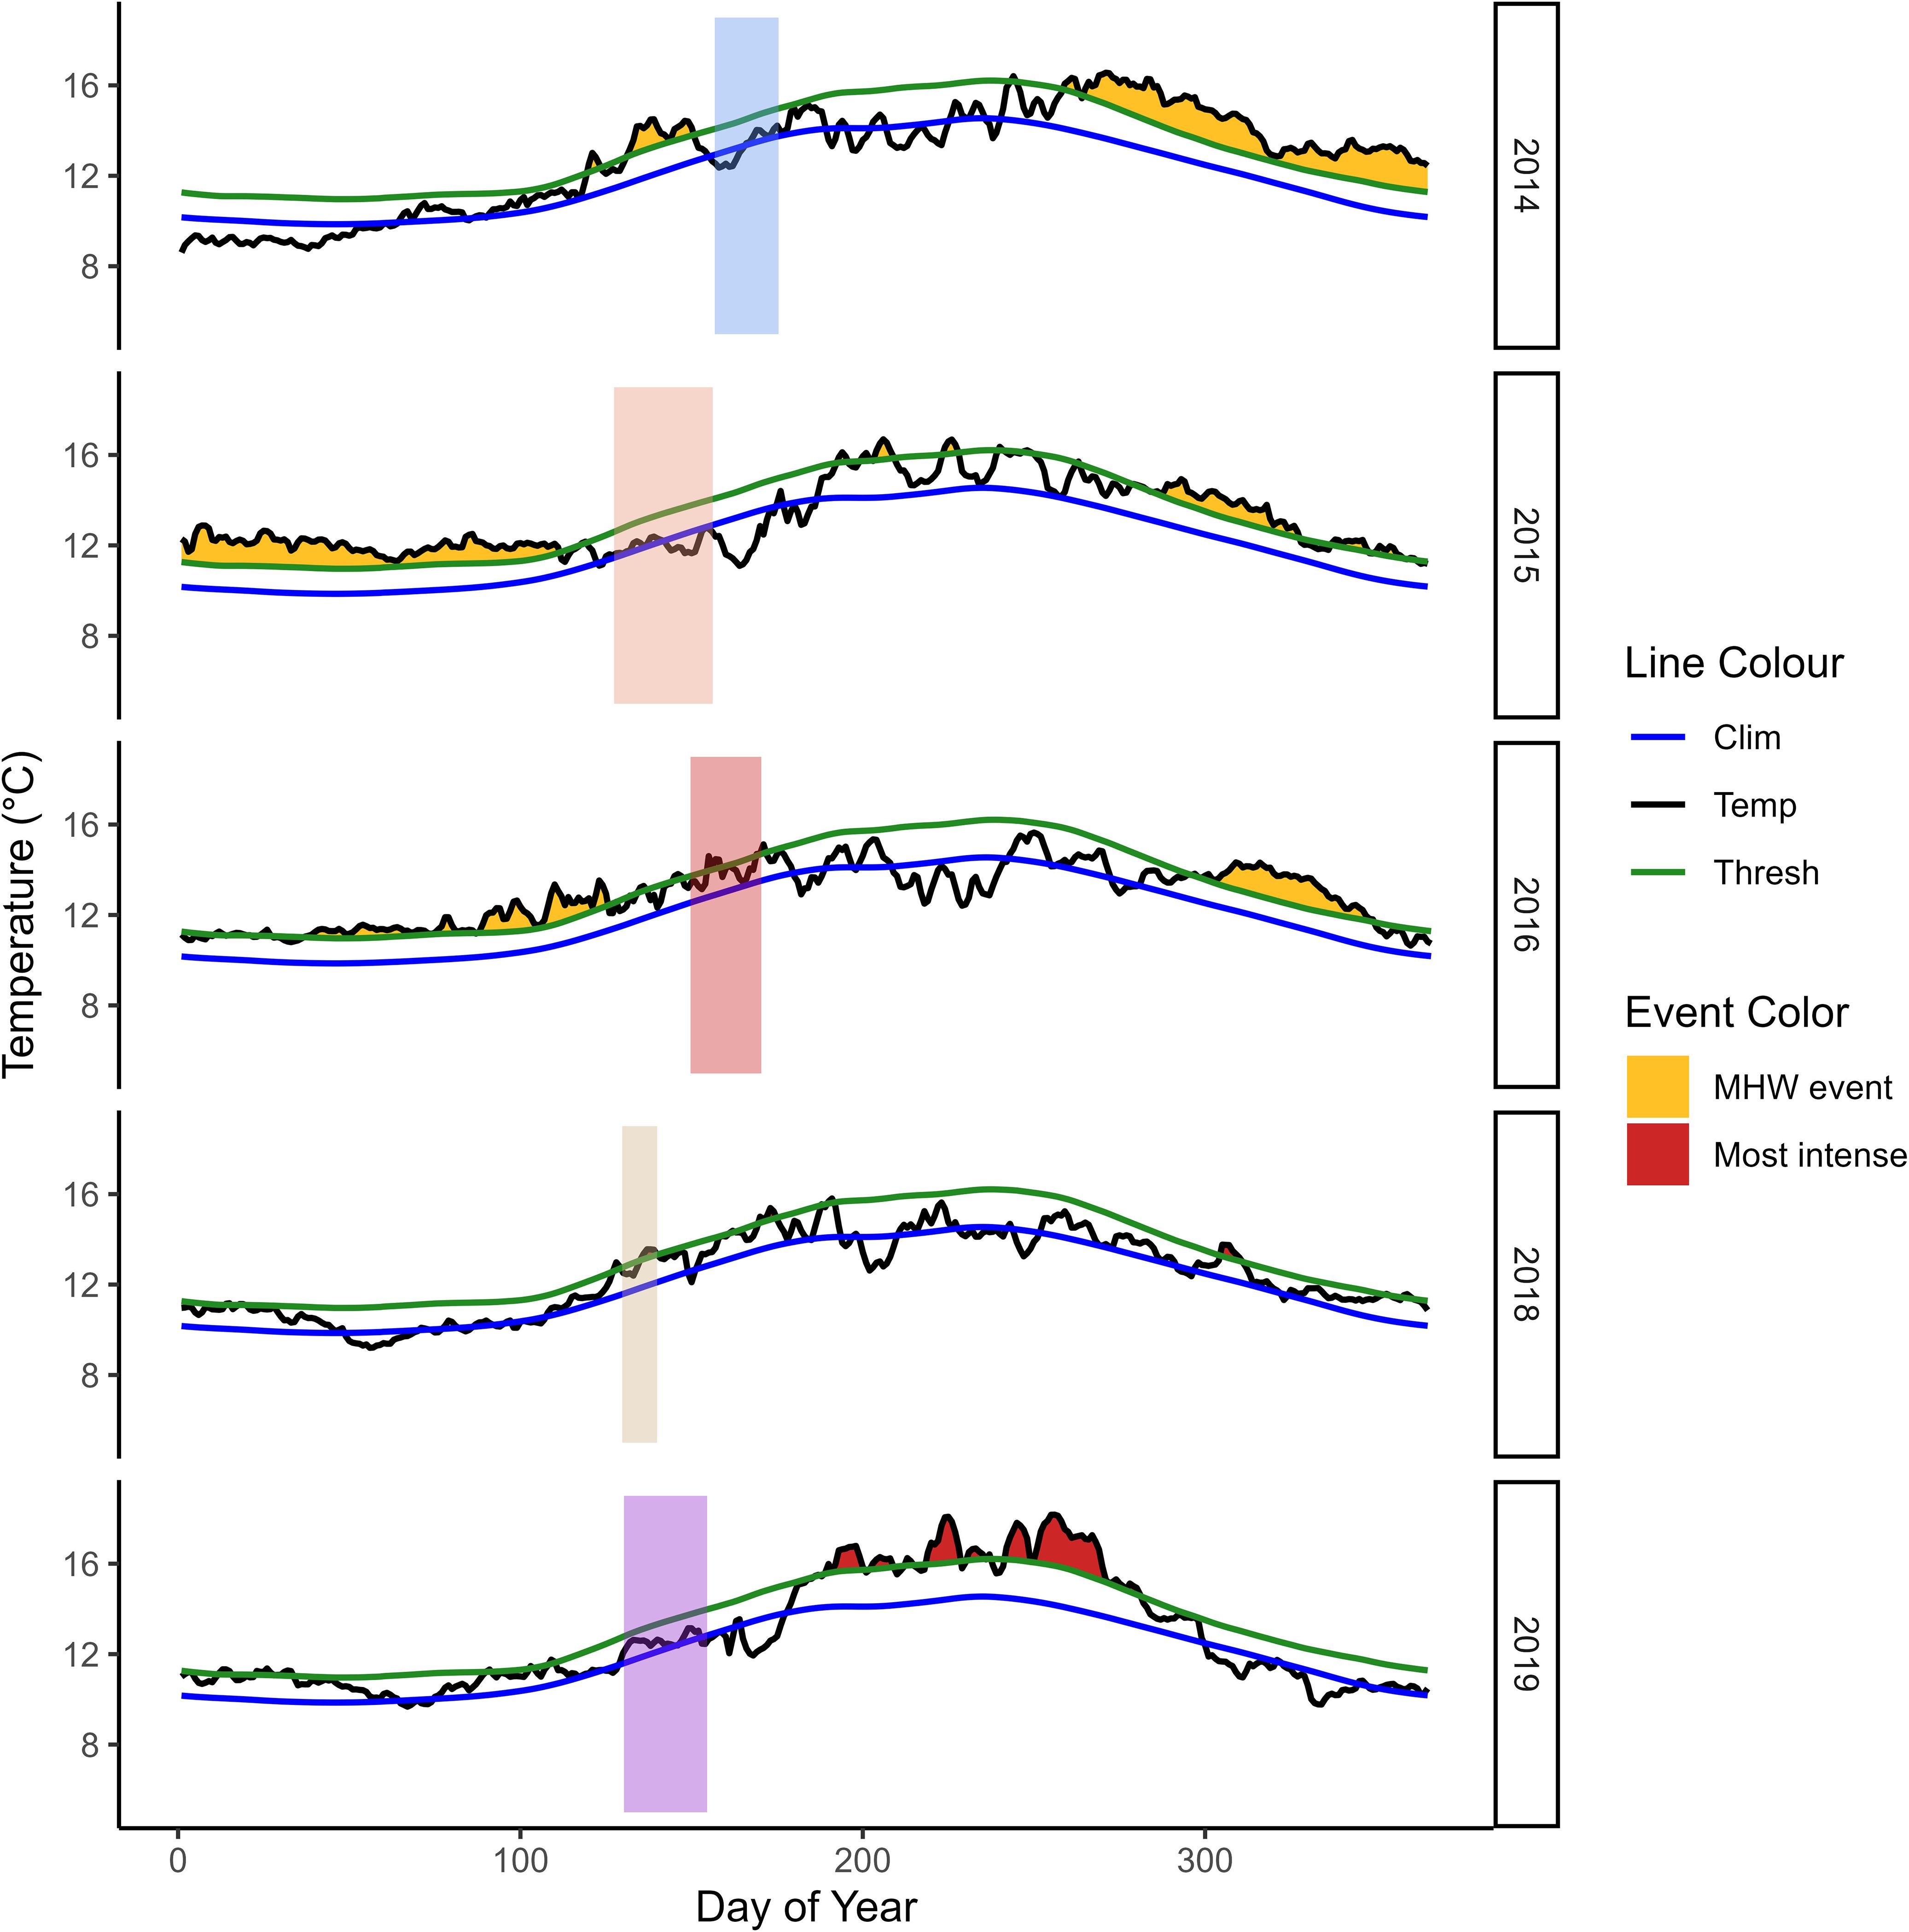
Figure 1. Sea surface temperature (SST) throughout the study period and region, utilizing high resolution SST data from NOAA OISST v2 data product. Shaded boxes indicate the days that cabezon (Scorpaenichthys marmoratus) larvae inhabited the neuston. Different colors indicate different annual cohorts. Marine heatwave events are indicated in yellow and red (most intense) shading and are defined as discrete warm water anomalies that persist for at least five consecutive days and exceed the threshold (green line; 90th percentile) of the long-term (1982-2012) climatology (blue line).
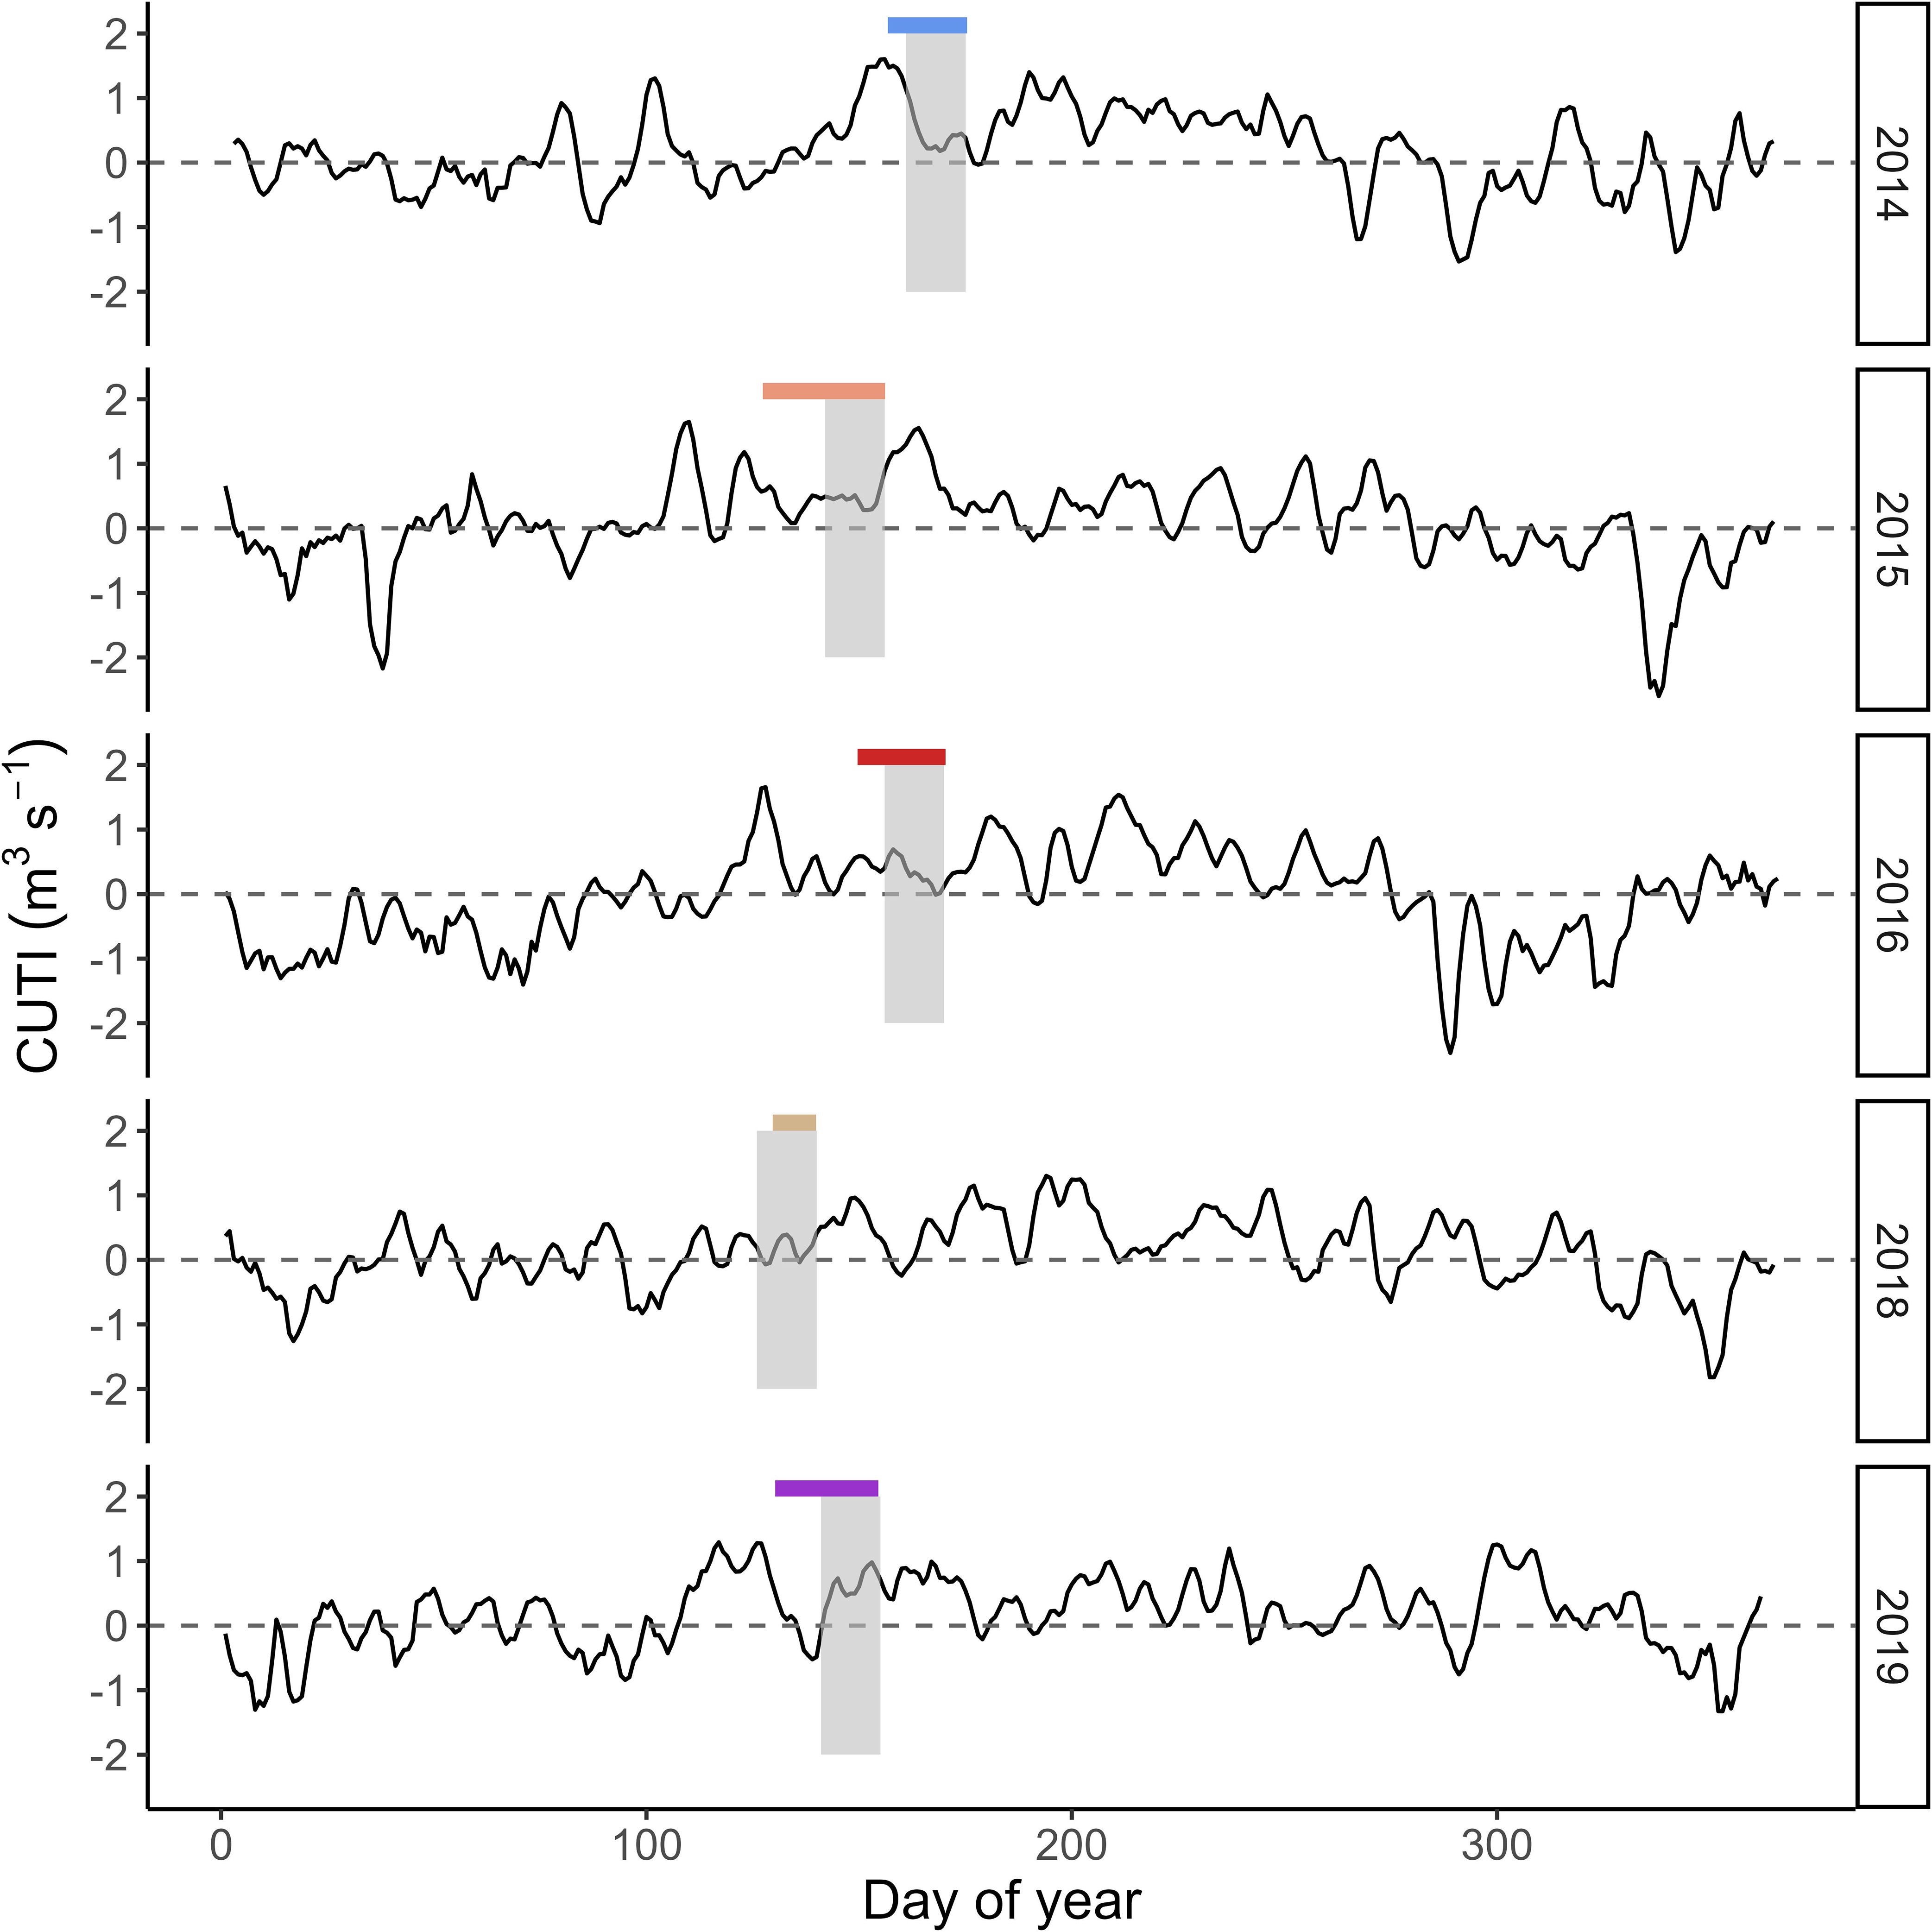
Figure 2. Coastal upwelling transport index (CUTI) in the central geographic area of the study region (44˚N) for the duration of the study period (thin black line). Values above (below) the dashed line indicate upwelling (downwelling). Colored boxes indicate the days that cabezon (Scorpaenichthys marmoratus) larvae inhabited the neuston and grey shaded boxes are the 14-d period prior to larval collection over which CUTI was averaged.
Out of the 10 strongest MHW events in the past 39 y (1982-2021), five occurred in late 2014, 2016, and 2019. The MHW event in 2014 had the longest uninterrupted duration over our study period (218 d) and the MHW event in 2019 had the highest intensity (+4.00˚C) over our study period (Figures 1, 2), which was the second highest intensity over the long-term climatology (highest: +4.17˚C in 1997). Though the in-situ SSTs experienced by cabezon larvae each year fell within the 90th percentile of the long term (1982-2012) climatology (Figure 1), the ecosystem was altered by the environmental forcing that resulted from MHW events. In 2015 and 2016, an extended ~8-mo period of elevated temperatures in our study region preceded sampling, creating persistent, anomalous conditions that shaped the larval cabezon feeding and growth environment. In 2019, a high intensity 3-mo MHW was evident in our study region approximately one month after sampling. However, MHW conditions including elevated temperature, reduced surface winds, and decreased evaporative cooling, were present in the Northeast Pacific Ocean as early as May 2019 (Amaya et al., 2020, Chen et al., 2021) and by early summer the mixed layer had already begun to shoal (Amaya et al., 2020), suggesting that larval cabezon experienced environmental preconditioning, or the early onset of altered conditions (e.g., Shroeder et al., 2013) due to the 2019 MHW. Year groups were defined as: 1) Neutral (2014, 2018), 2) MHW I (2015, 2016), and 3) MHW II (2019). The MHW I event was characterized by exceptional duration, resulting in longer-term disturbances to the ecosystem, and larval cabezon experienced the aftermath of these conditions. The MHW II event was characterized by exceptional intensity, a high magnitude but shorter-term disturbance to the ecosystem, and larval cabezon experienced the spin-up of the event.
3.2 Cabezon distribution and size
Cabezon was the third most abundant larval fish collected in the Pre-recruit surveys of the neuston in 2014, 2015, 2016, and 2018. Only rockfishes (Sebastes spp.) and Pacific Saury (Cololabis saira) were more abundant. Across all sampling years, cabezon had an average concentration of 2.70 ± 0.51 ind. 1000 m-3 (total n=199 cabezon individuals). Cabezon mean concentration varied by year, ranging from 1.10 ± 0.36 ind. 1000 m-3 in 2018 to 6.81 ± 1.81 ind. 1000 m-3 in 2016 (Table 1). Cabezon were broadly distributed throughout the study area in 2016 and were concentrated toward the north in 2014 and 2019 and toward the south in 2015 and 2018 (Supplementary Figure S1). Cabezon were caught at similar rates during day and night hours except for 2016, when 86.8% of the catch occurred at night. Larval fish are highly visual and may be able to evade net capture during the day, but further behavioral study would be needed to understand why larvae were mostly caught at night only in 2016. The average SL of cabezon larvae was 8.23, 9.09, and 9.31 mm in neutral, MHW I, and MHW II years, respectively.
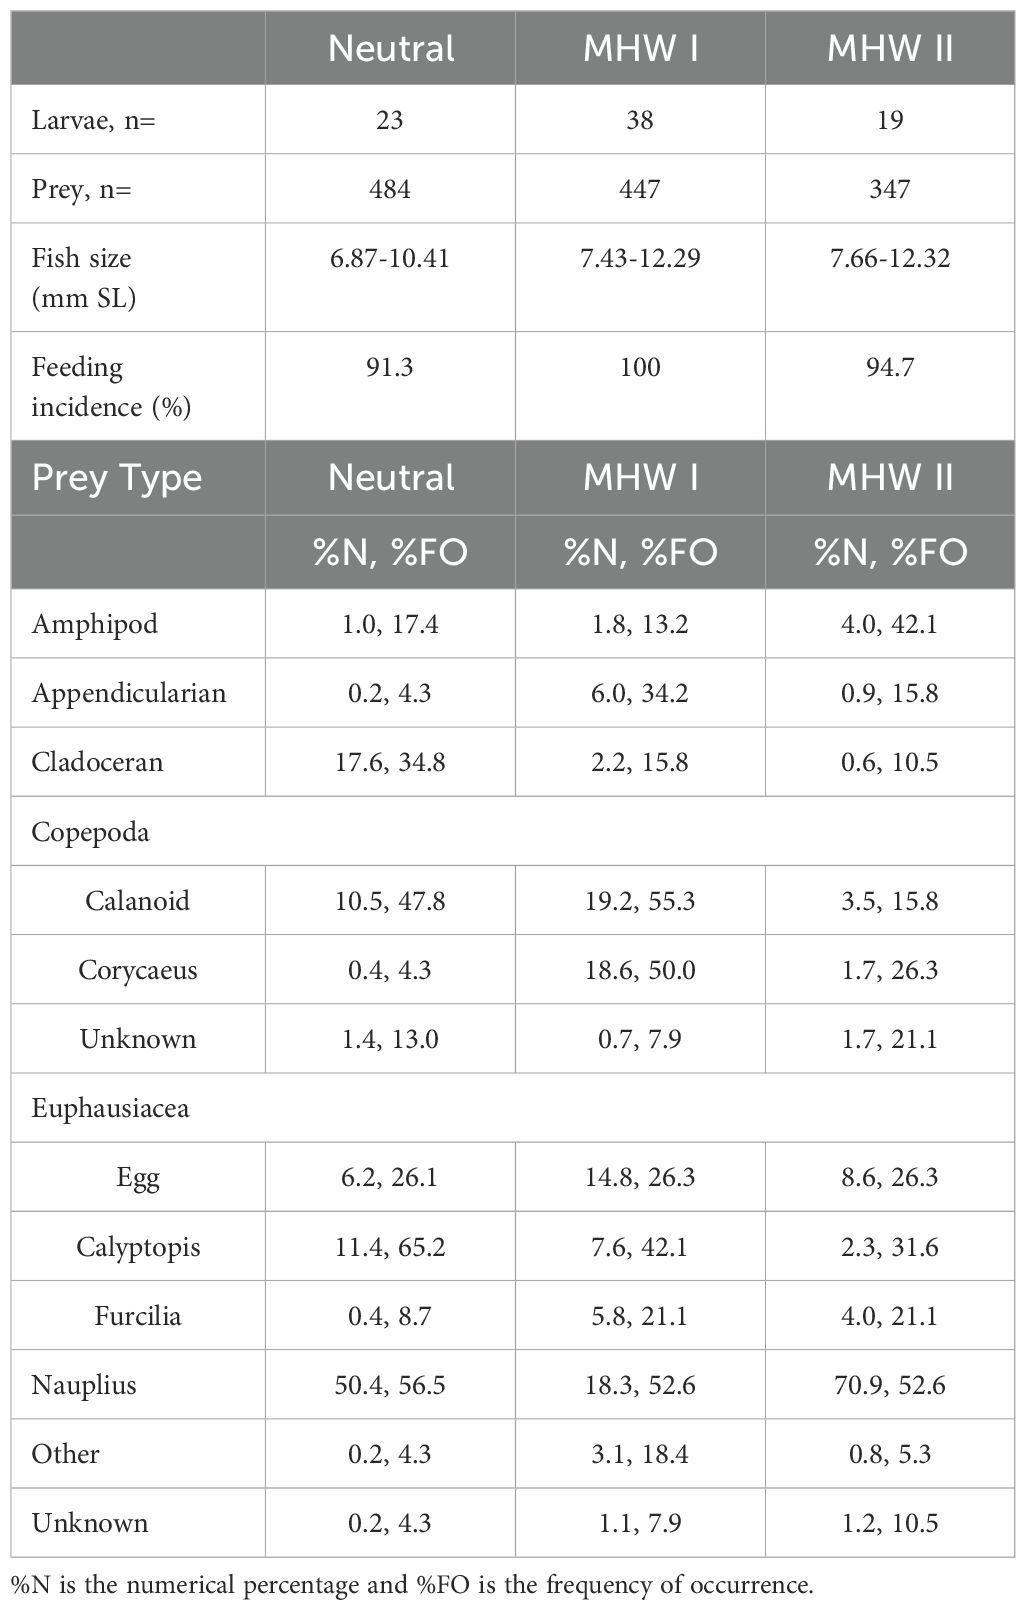
Table 1. Summary of diet data for larval cabezon (Scorpaenichthys marmoratus) collected in the northern California Current in neutral (2014, 2018), marine heatwave I (MHW I; 2015, 2016) and marine heatwave II (MHW II; 2019) years along cross-shelf transects from Willapa Bay, Washington, to Gold Beach, Oregon.
3.3 Cabezon diet and selectivity
Cabezon larvae had a very high feeding incidence in all years of this study (Table 1): very few individuals (n=3) had empty guts. As expected, larval gape size (mouth width and mouth height) increased linearly with fish size (p<0.05; Supplementary Figure S3) and ingested prey biomass was directly proportional to fish volume (p<0.05, Supplementary Figure S4A). However, there were no significant differences in standardized prey biomass or gut fullness between neutral, MHW I, and MHW II years (Supplementary Figure S4B, C; p>0.05).
Larval cabezon diet composition was variable among years (Figure 3). Calyptopis comprised the greatest proportion (53.0%) of biomass consumed during neutral years, with the largest proportion (4.5%) of cladocerans also consumed in neutral years. Calyptopis (18.7%) and furcilia (26.0%) together comprised a large proportion of consumed biomass during MHW I years. There was a larger proportion (13.3%) of rare prey types categorized as “other”, which included crab megalopae, ostracods, pteropods, bivalve larvae, and protists during MHW I. The greatest proportion of amphipods in the cabezon diet occurred in MHW II, with amphipods (25.2%), furcilia (17.7%), and calyptopis (14.5%) comprising most of the biomass. Calanoid copepods accounted for roughly similar amounts of biomass in all years, ranging from 9.9% (MHW II) to 12.8% (MHW I). Corycaeus spp. copepods and appendicularians accounted for a greater proportion of biomass (6.7% and 8.2%, respectively) in MHW I years than in MHW II years (2.2% and 5.2%, respectively), and were nearly absent in neutral years (0.23% and 0.31%, respectively).
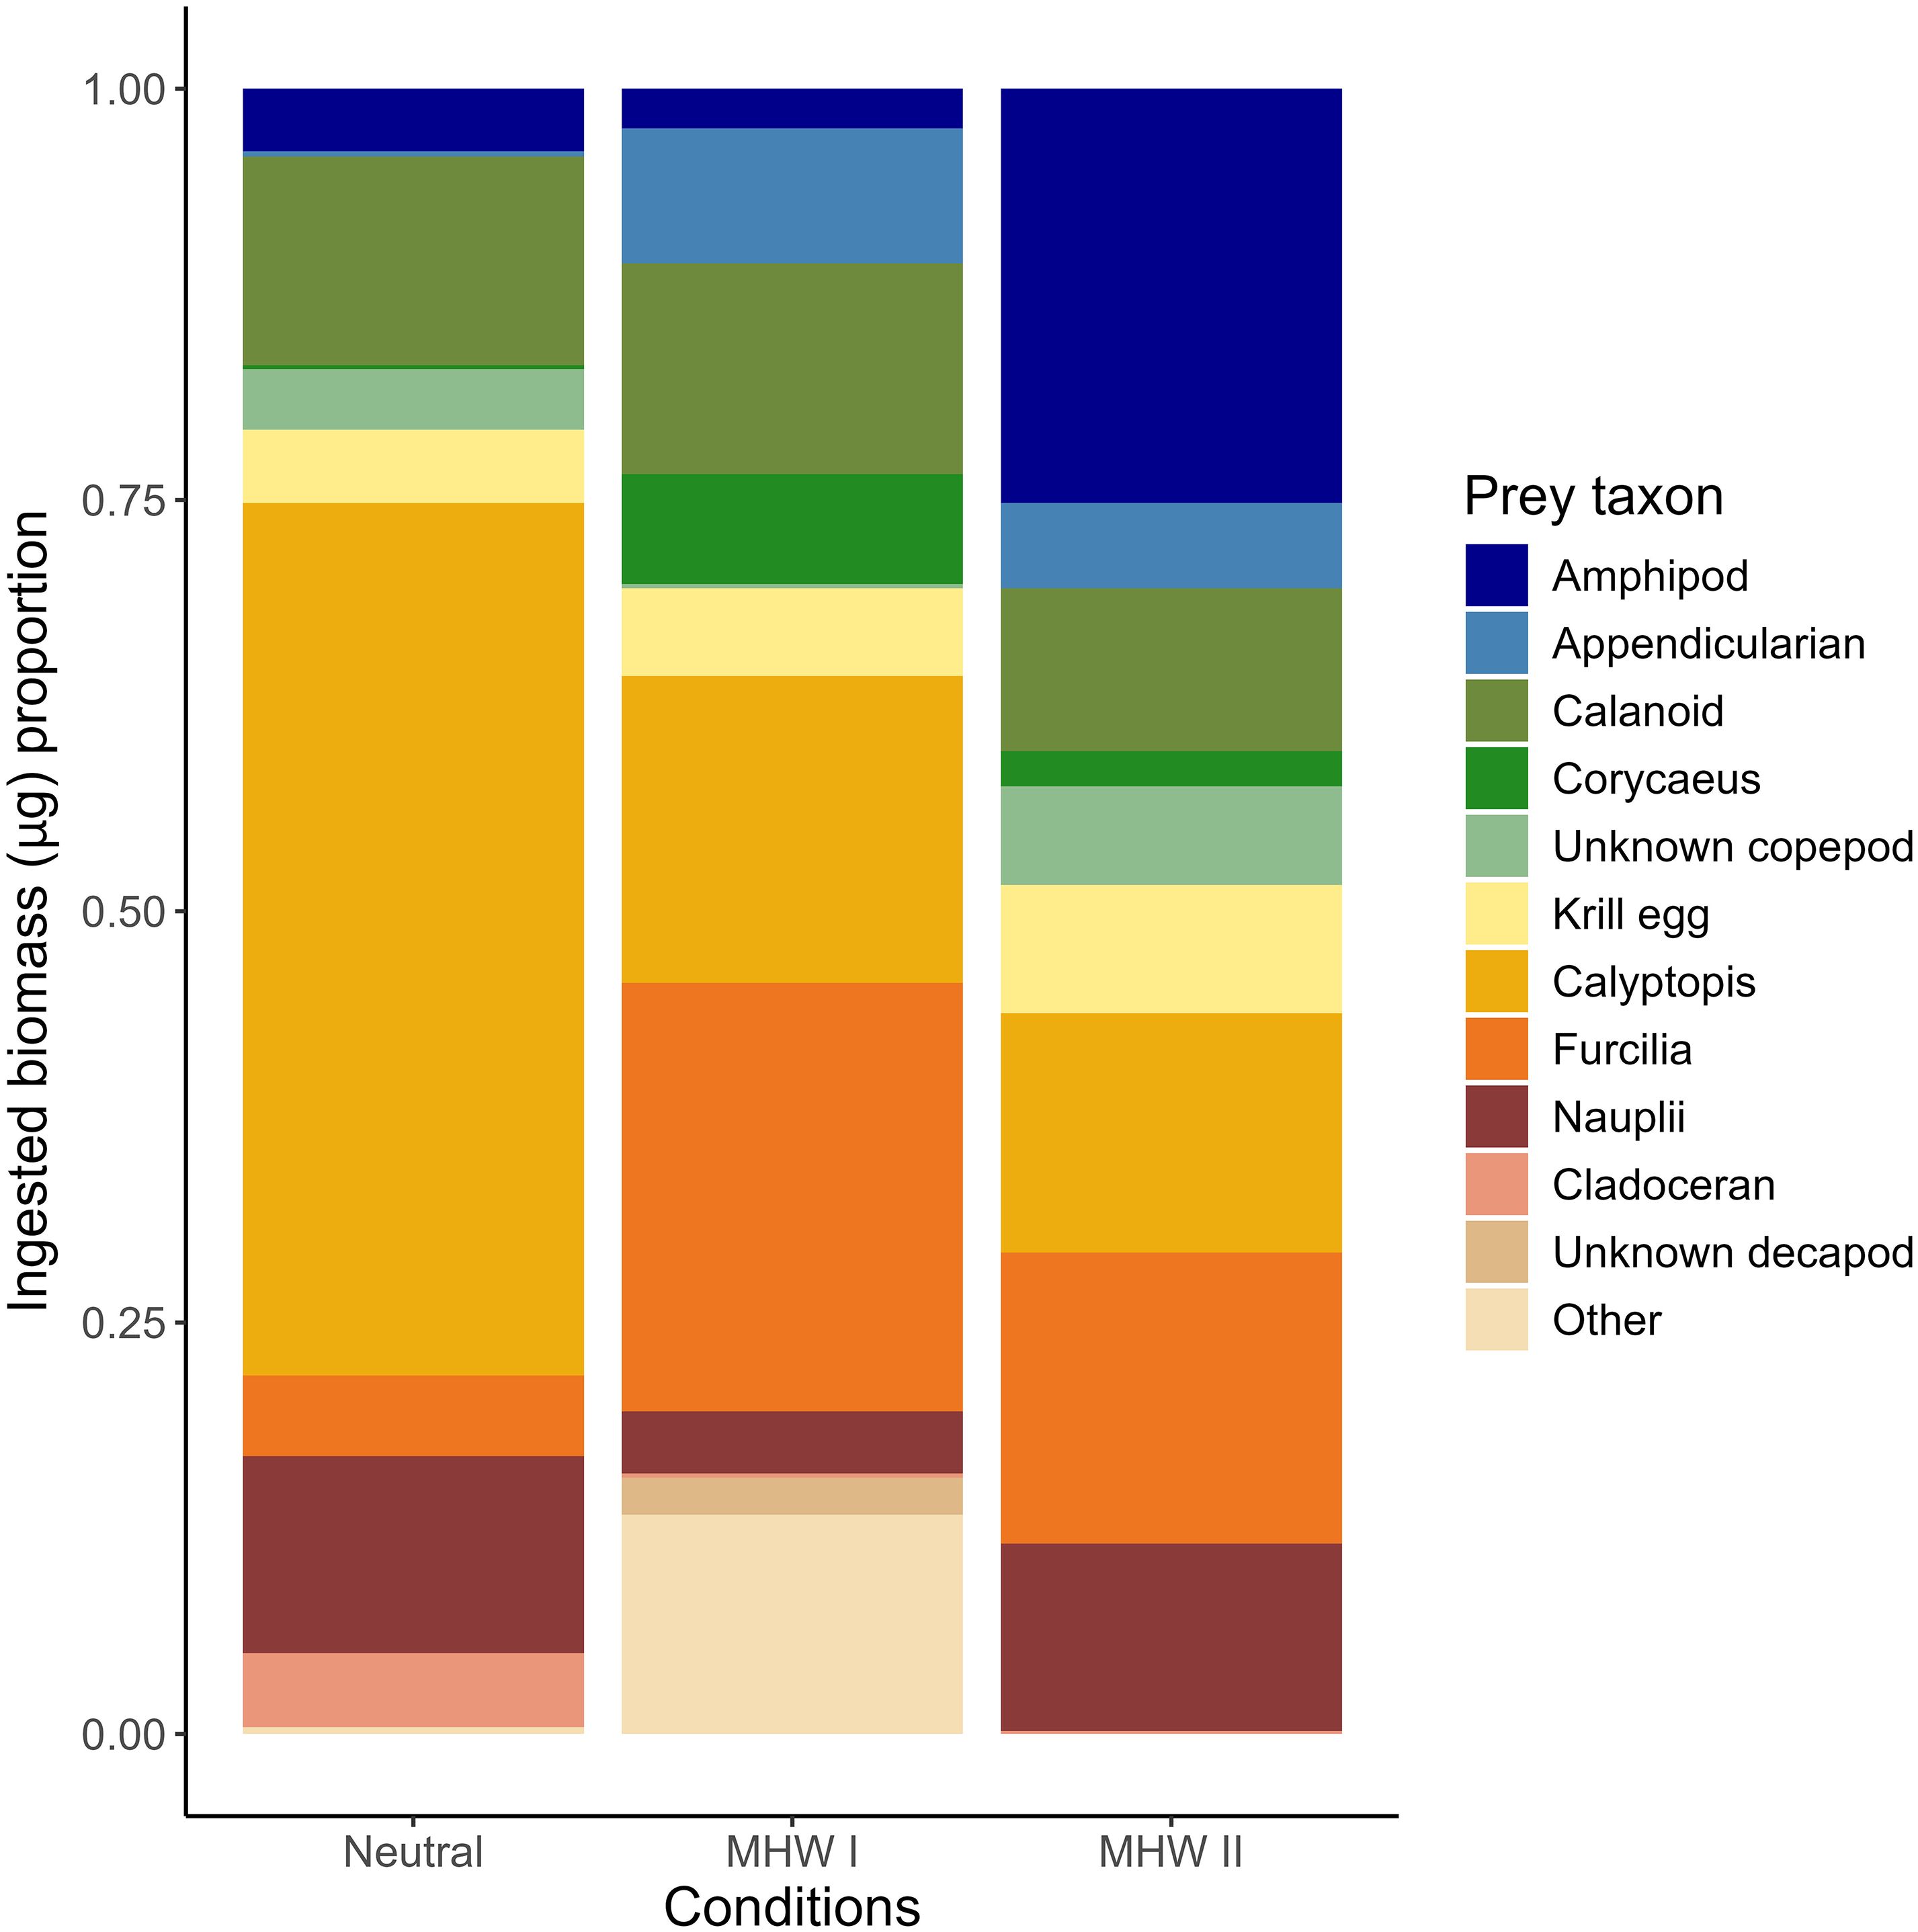
Figure 3. Larval cabezon (Scorpaenichthys marmoratus) ingested prey biomass, presented as a proportion of the total biomass of all consumed prey in guts of larvae collected across the study region. Fish collected over five years were grouped into neutral years, and years with marine heatwaves I or II (MHW I, MHW II).
After accounting for cabezon size (i.e., standardized biomass; Figure 4), the prey item with the greatest consumed biomass in neutral years was furcilia (ANOVA, p<0.0001). In MHW I years, calyptopis and furcilia had significantly higher standardized biomasses than Corycaeus spp. copepods and copepod nauplii (ANOVA, p<0.0001). Calyptopis also had significantly higher biomass than calanoid copepods and krill eggs (ANOVA, p<0.0001). In MHW II, calyptopis and furcilia were significantly more abundant than copepod nauplii and krill eggs (ANOVA, p<0.0001). Additionally, calyptopis had significantly higher biomass than Corycaeus spp. copepods and cladocerans (ANOVA, p<0.0001).
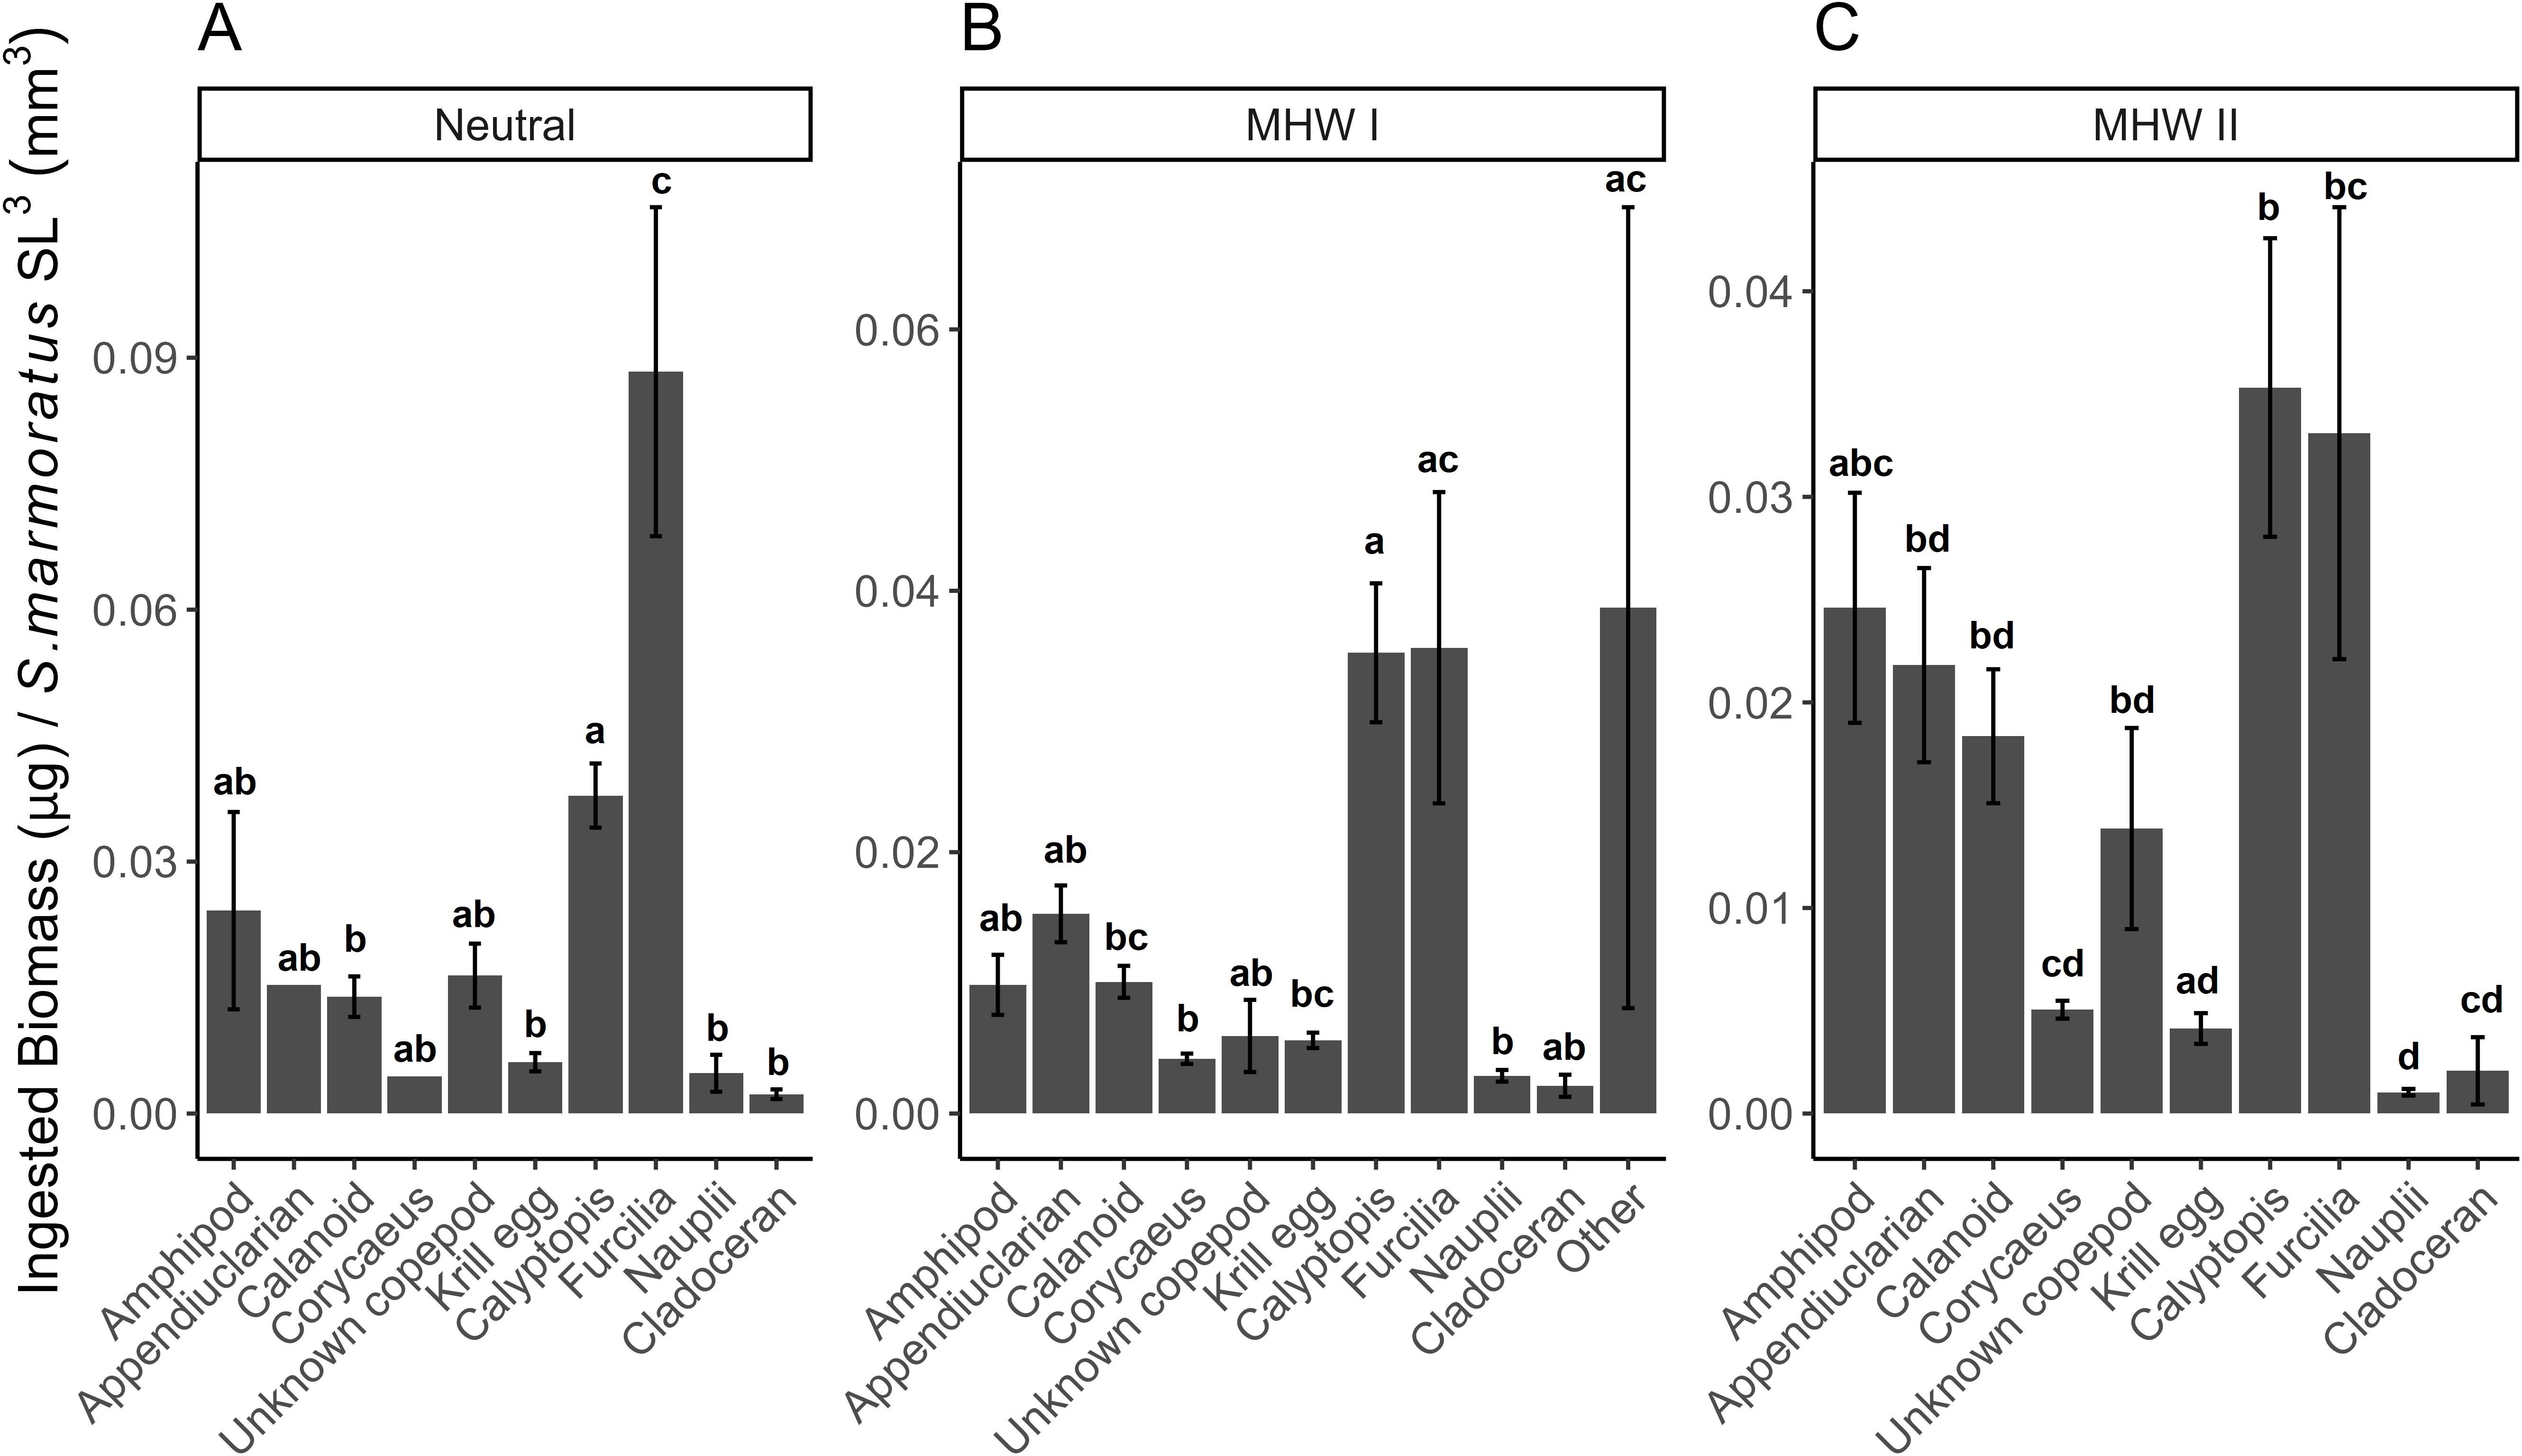
Figure 4. Mean standardized prey biomass consumed by larval cabezon [µg dry weight/Scorpaenichthys marmoratus SL3] separated by prey taxon and year group (A: neutral, B: MHW I, C: MHW II). Error bars represent the standard error of the mean. Different letters indicate significant differences (ANOVA; p<0.05).
Dividing cabezon larvae into different size groups revealed size-based differences in the prey types ingested (Figure 5). Small cabezon larvae (<8.4 mm SL, pre-flexion) in neutral years consumed mostly calyptopis (53.0%) and calanoid copepods (17.9%), and a very small amount of furcilia (2.6%). Small larvae in MHW I years consumed appendicularians (9.8%), calanoid copepods (20.3%), some Corycaeus spp. copepods (5.2%), and a large proportion of calyptopis (28.1%) and euphausiid eggs (21.1%). Small larvae in the MHW II year consumed the largest proportion of calanoid copepods (38.3%) and furcilia (17.3%), and some calyptopis (25.4%) as well. Nauplii comprised 8.7% and 12.5% of the diets of small larvae in MHW I and MHW II years, respectively, and accounted for more biomass (16.5%) in neutral years (Figure 5A).
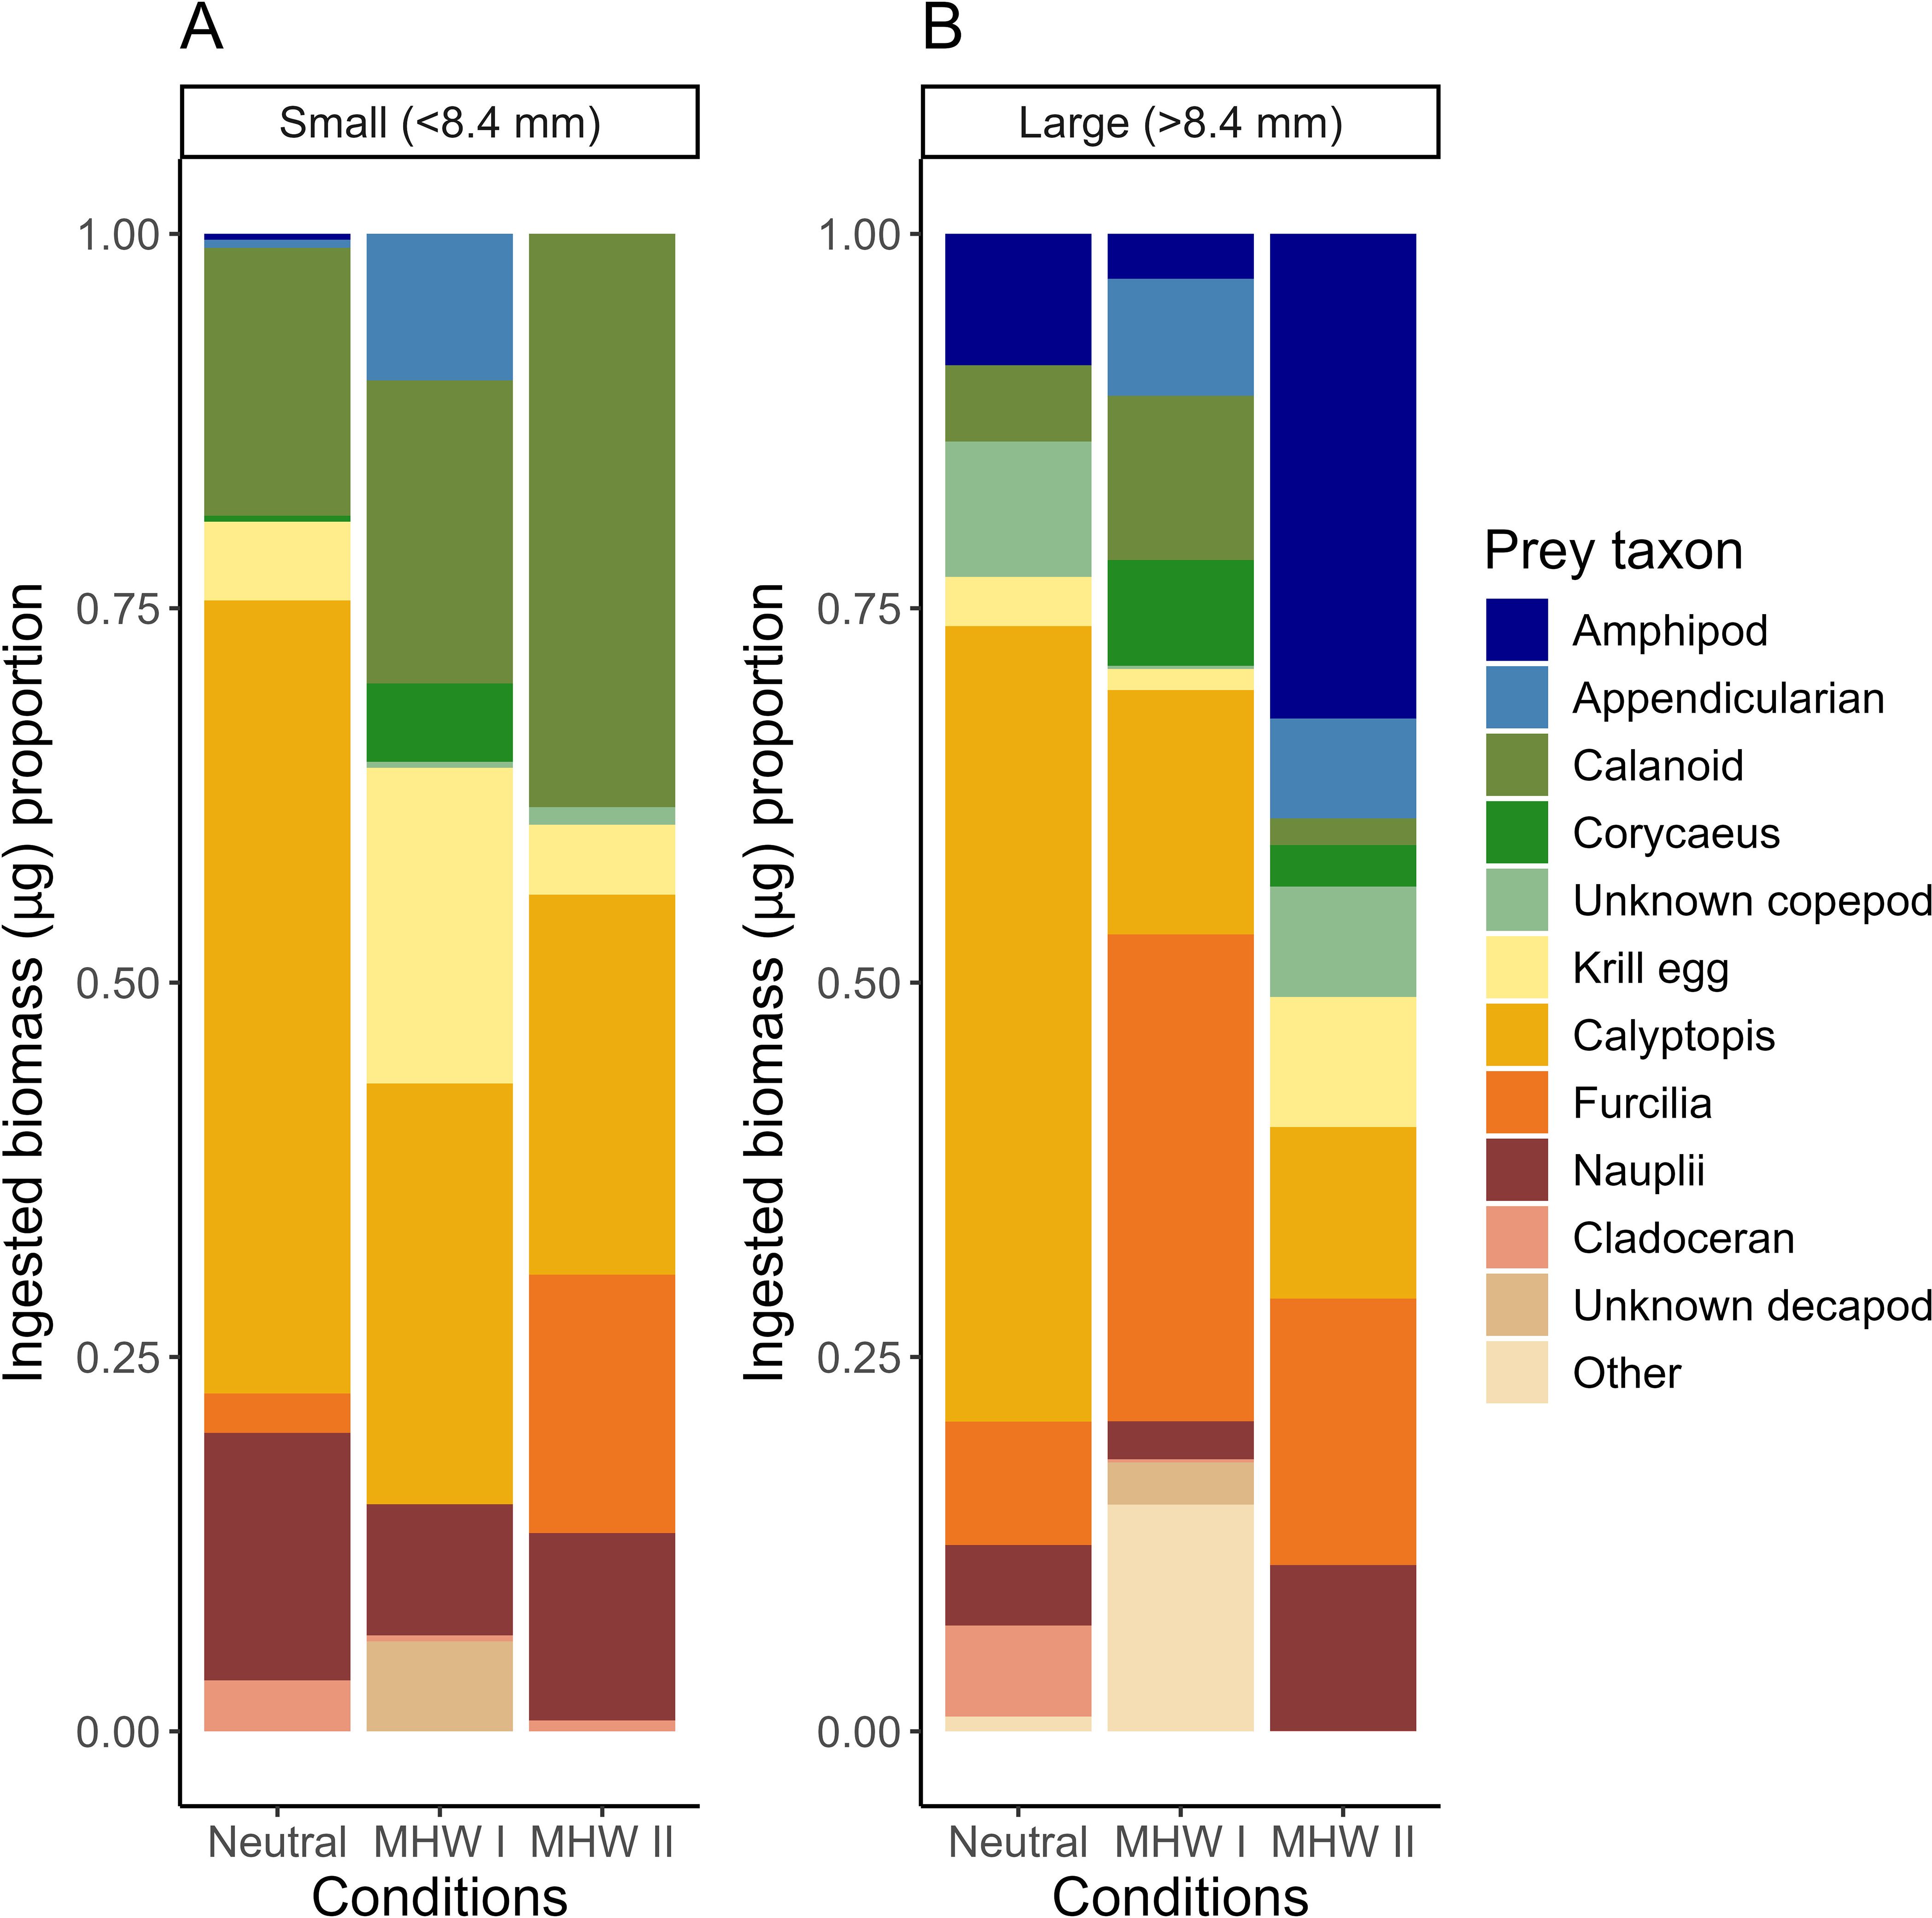
Figure 5. Larval cabezon (Scorpaenichthys marmoratus) ingested prey biomass as a proportion of the total biomass of all consumed prey from larvae collected across the study region. Fishes were separated into (A) small (<8.4 mm SL) and (B) large (>8.4 mm SL) categories to account for ontogenetic shifts in diet composition. Fish collected over five years were grouped into neutral years, and years with marine heatwaves I or II (MHW I, MHW II).
Large cabezon larvae (>8.4 mm SL, post-flexion) in neutral years continued to consume a large proportion of calyptopis (53.1%), more furcilia than small larvae (8.2%), and began consuming amphipods (8.8%). Large larvae in MHW I consumed large numbers of furcilia (32.5%) and some amphipods (3.0%), while maintaining some consumption of calyptopis (16.3%) and appendicularians (7.8%). Large larvae in the MHW II year consumed the greatest proportion of larger prey such as amphipods (32.4%), while continuing to consume euphausiid furcilia (17.8%) and calyptopis (11.5%), and smaller prey such as euphausiid eggs (8.7%) and appendicularians (6.7%). The proportion of nauplii consumed by large cabezon larvae was much less than small larvae in all years except MHW II, where the proportion of nauplii consumed was similar between years (11.1%; Figure 5B).
Overall, the highest prey selectivity indices (proportion of prey biomass consumed vs. in the environment) were observed in the MHW II year (Figure 6). Amphipods, furcilia, calyptopis, nauplii, and Corycaeus spp. copepods were selected for during MHW II. In neutral years, though to a lesser degree than in MHW II, cabezon larvae selected nauplii, euphausiid eggs, calyptopis, cladocerans, and amphipods. Selectivity indices were generally lowest in MHW I years, but there was slight selection for furcilia, calyptopis, and Corycaeus spp. copepods. In all years, cabezon larvae tended not to select for calanoid copepods (Figure 6). Calanoid copepods are diel vertical migrators and may not spatially overlap with cabezon larvae as much as other neustonic copepod prey (e.g., Corycaeus spp). Additionally, observed prey preferences may be related to prey energy or lipid content. For example, calanoid copepods have a lower trophic level than some of the other prey items that were selected for, and their lipid content varies by species.
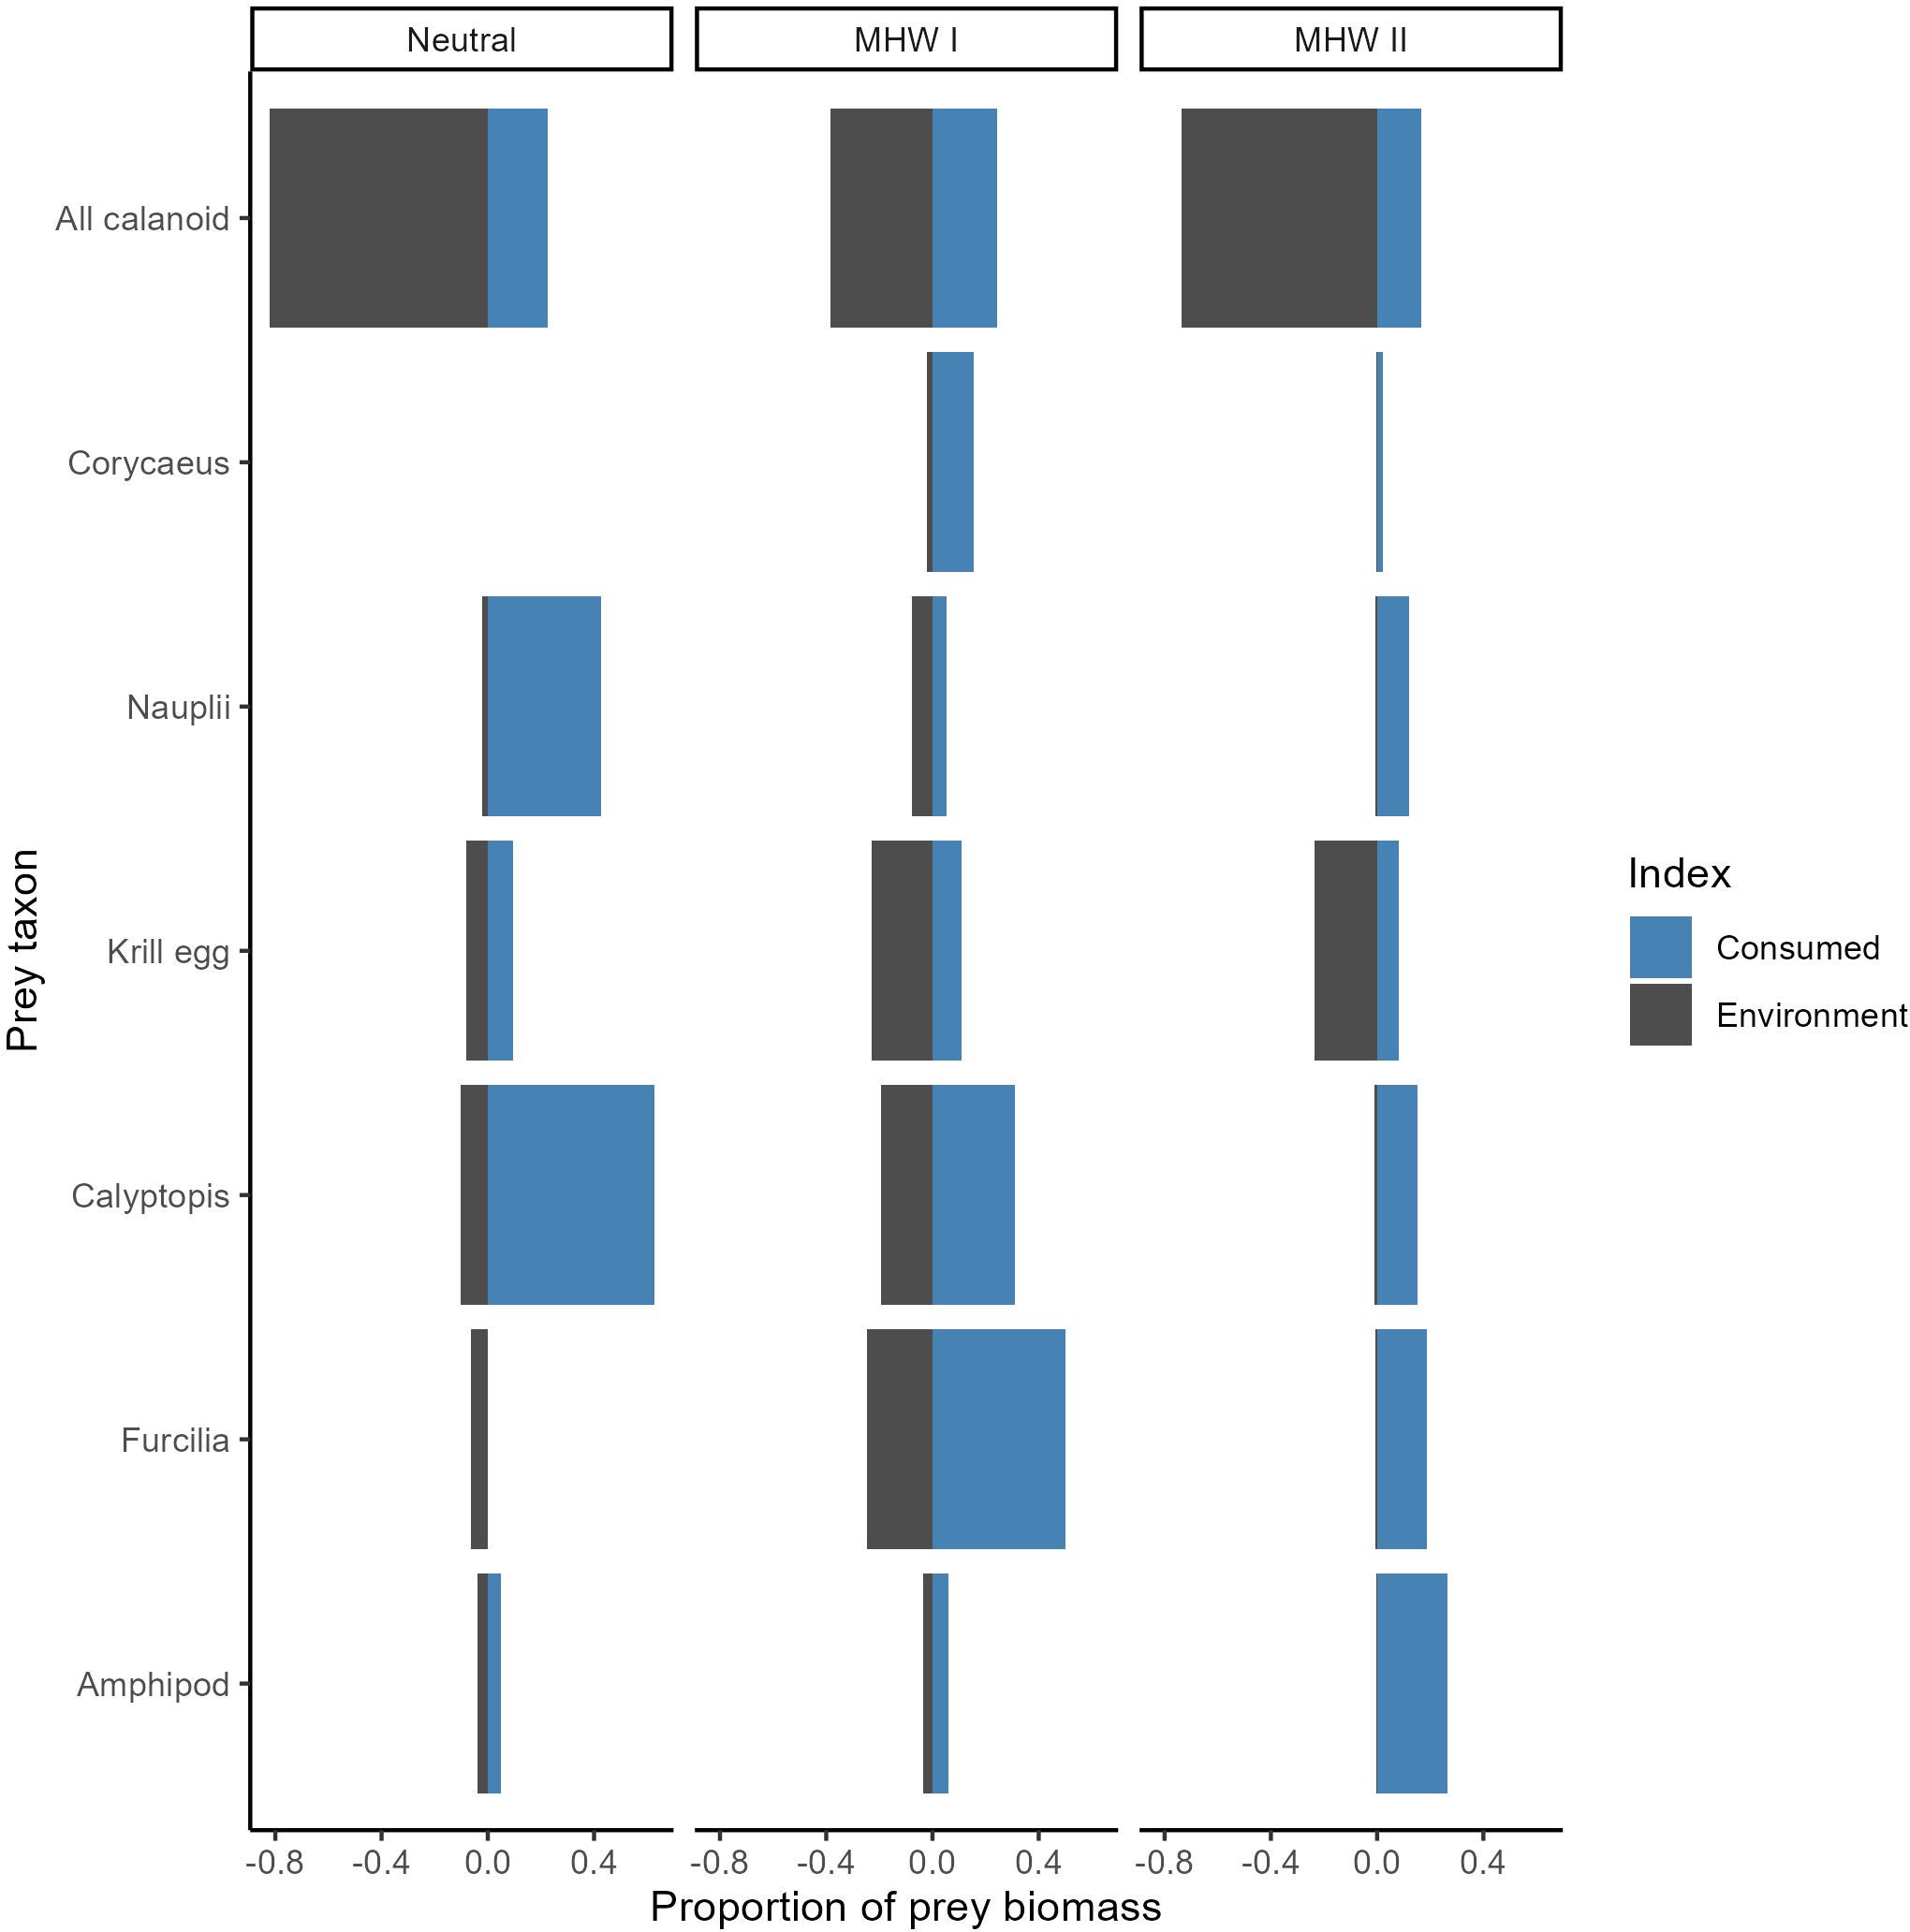
Figure 6. Cabezon selectivity of each prey type in each year, indicated by the ratio of the proportion of consumed prey biomass (blue bars) to prey biomass in the environment (grey bars). Fish collected over five years were grouped into neutral years, and years with marine heatwaves I or II (MHW I, MHW II).
3.4 Prey availability
Environmental prey abundances estimated from zooplankton sampling varied among years. The lowest biomass of calanoid copepods occurred during MHW I (2015: 1.87 ± 0.42 mg C m-3; 2016: 2.9 ± 1 mg C m-3; Table 2). Calanoid copepods were ~5x more abundant in 2014 than during MHW I, 3x more abundant in 2018, and 10x more abundant during MHW II in 2019. Cyclopoid Corycaeus spp. copepods were absent in neutral years but occurred in low biomasses during MHW I and II. Copepod nauplii were present in all years but had an exceptionally high concentration in the neutral year 2018.
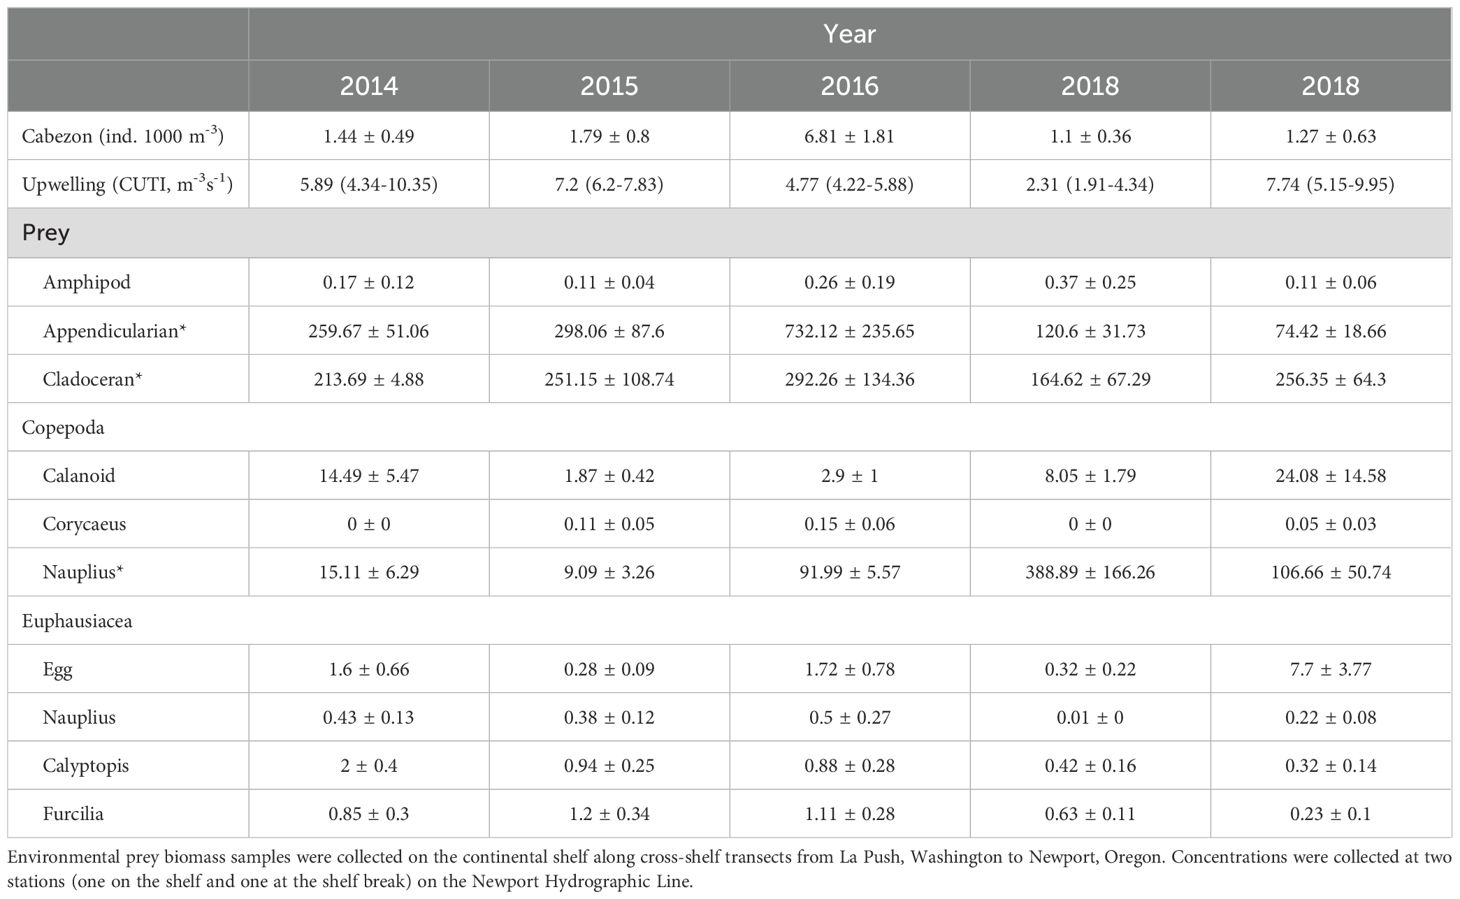
Table 2. Cabezon (Scorpaenichthys marmoratus) concentration, upwelling conditions over the 14-d period prior to sampling, and environmental prey abundances, defined by biomasses (mg C m-³; or concentrations* where biomass was not available).
The biomass of euphausiids varied interannually and by life stage (Supplementary Figure S5). Calyptopis was the most abundant life stage in neutral years and was significantly more abundant than nauplii (p=0.02; Supplementary Figure S5A). There were no significant differences in biomass between euphausiid life stages during MHW I years (p>0.05, Supplementary Figure S5B). During MHW II, eggs had the highest biomass of all life stages, being 11x greater than other euphausiid life stages combined (p=0.01; Supplementary Figure S5C). Nauplii had consistently low biomass across all years and were nearly absent in neutral 2018, and furcilia had the highest biomass in MHW I year.
Amphipods were an important component of larval cabezon diets, especially during MHW II, but had a consistently low biomass throughout the study period (Table 2). Appendicularians were highly abundant throughout the study periods and densities were 2-9x higher in 2016 than in other years. Cladocerans also maintained high concentrations throughout the study years.
3.5 Cabezon age and growth
Cabezon larvae used in otolith-based growth analysis ranged from 4.95 to 12.36 mm SL and were 2 to 40 d post-hatch (dph; Figure 7A). Three individuals older than 40 dph were identified as outliers (>1.5x the inter-quartile range of the sample) and removed from otolith analysis. The mean age of cabezon larvae from neutral years (13.4 d) was significantly younger than those from MHW I (20.5 d), and MHW II years (24.3 d; p<0.0001). Otherwise, larval size and age had similar means and ranges across year groups. The overall mean somatic growth rate for this population was 0.43 mm d-1.
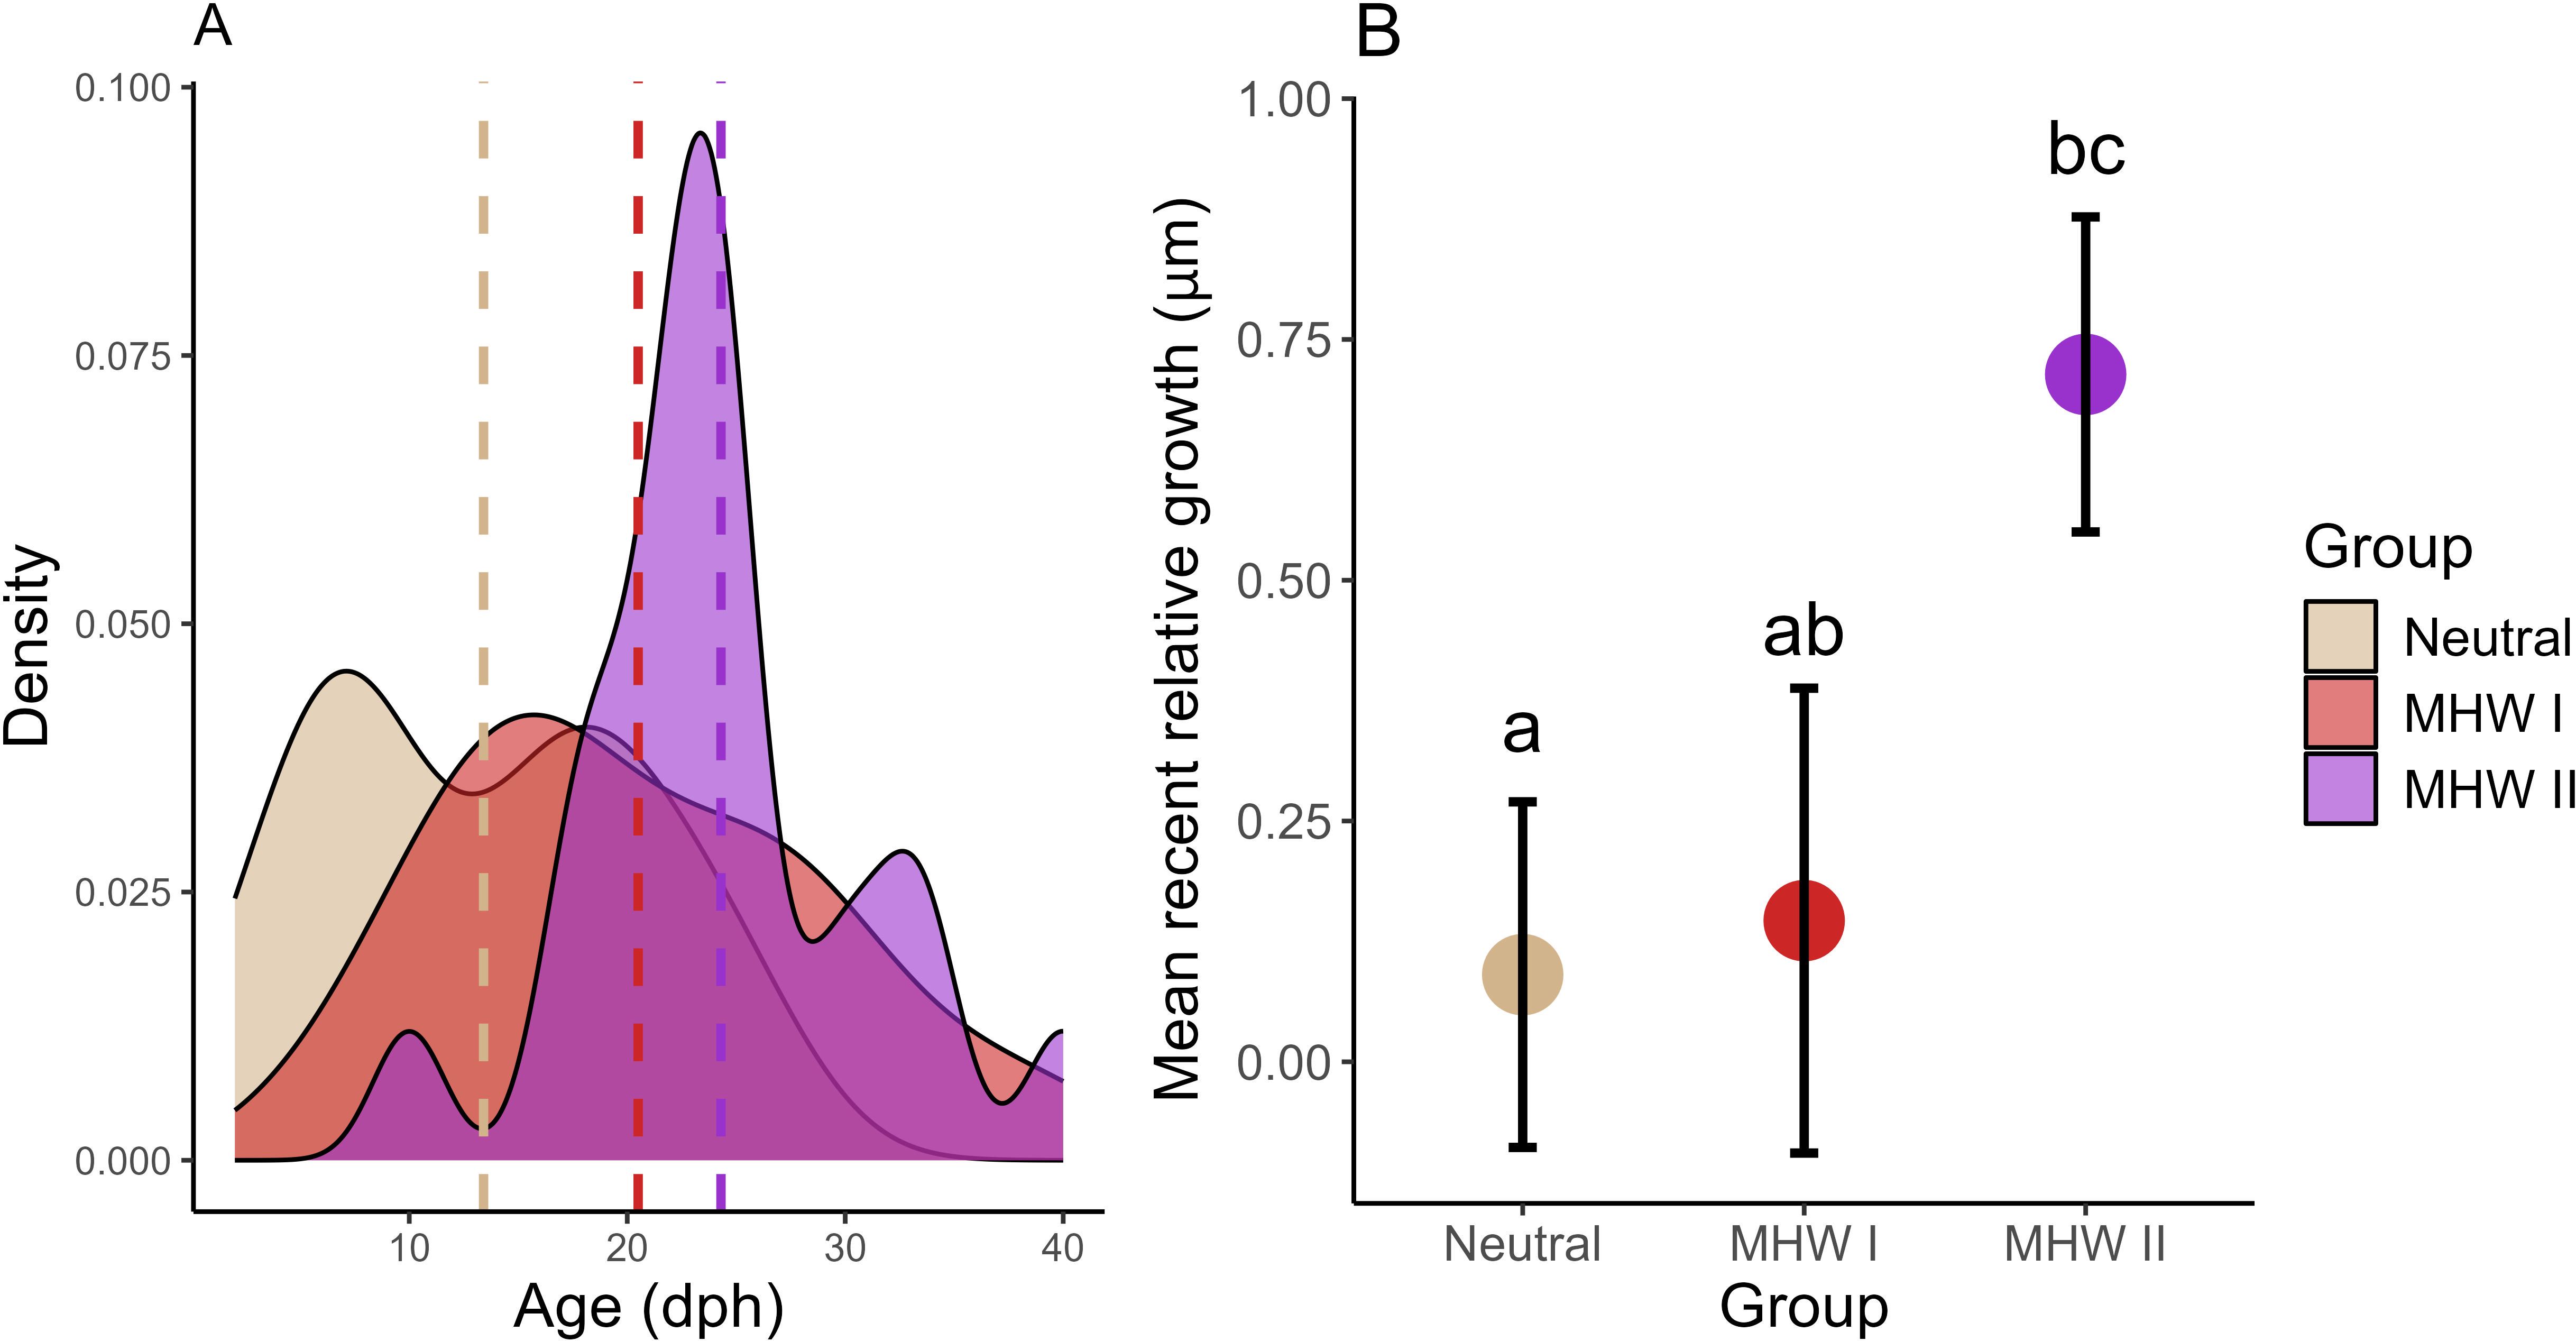
Figure 7. (A) Age frequency distribution (age in days post-hatch, dph) and (B) mean recent growth of larval cabezon (Scorpaenichthys marmoratus) over five years grouped into neutral years and years with marine heatwaves I or II (MHW I, MHW II). Dashed lines in (A) represent the mean of each distribution. Error bars in (B) represent the standard error of the mean, and different letters indicate significant differences (ANOVA, p<0.05). Larvae in neutral years were significantly younger than larvae in MHW I and II years.
Otolith microstructure analysis revealed otolith regions with distinct growth patterns after the hatch mark: 1) fast growth and wide, clear increments for 3–5 dph, 2) slow growth and small, cloudy increments for 5–10 dph, 3) increasingly fast growth and distinct, wide increments continuing to the otolith edge (Supplementary Figure S2B). There was a significant, positive relationship between fish size and age, otolith size and age, and fish size-at-age residuals and otolith size-at-age residuals (Wilson et al. unpubl. data).
Mean recent growth (MRG; size-detrended growth rate over the last three complete days of life) was significantly faster in MHW II than in neutral years (p=0.04; Figure 7B). MRG in MHW II (0.714 ± 0.164) was also higher than in MHW I (0.147 ± 0.241), though this difference was not significant (p = 0.13), likely due to a small sample size in MHW I.
Mean daily growth (MDG; average growth in each day of life) and mean size-at-age followed a similar pattern. Daily growth and size-at-age in cabezon from MHW II began to diverge from MHW I and neutral year fish at approximately 10 dph, and this difference became significant by 15–20 dph (Figure 8). This difference in MDG was most pronounced between neutral and MHW II years (Figure 8A), where growth after 20 dph fell in neutral years. Consistently elevated MDG in MHW II years translated into significantly larger sizes-at-age (Figure 8B; p<0.05).
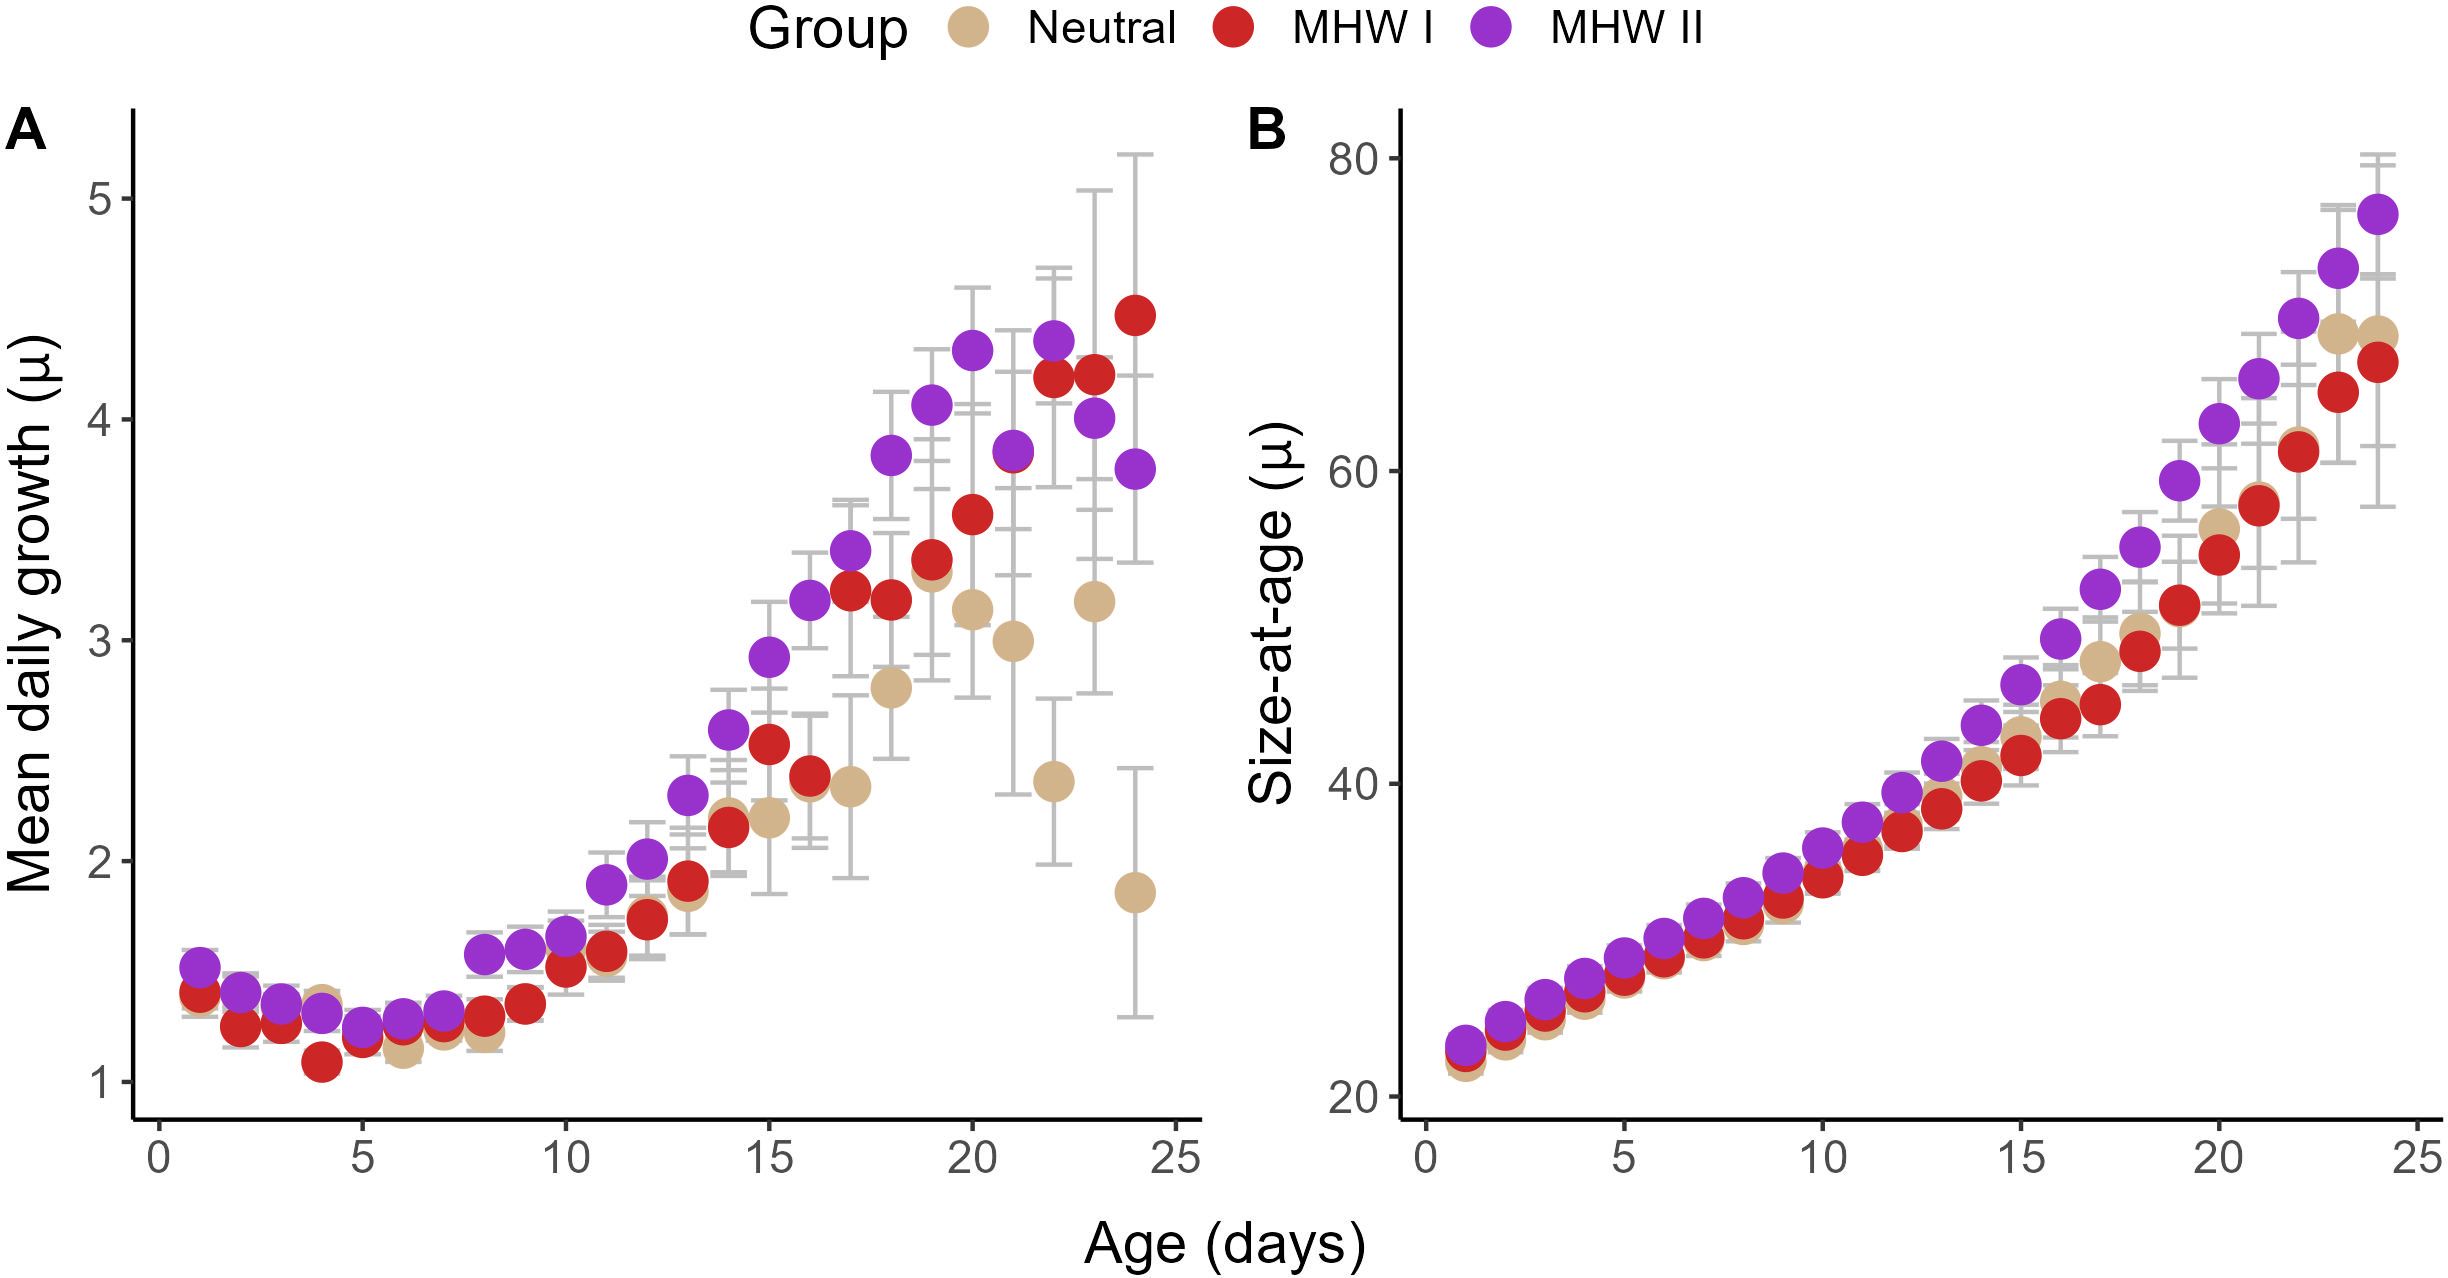
Figure 8. Mean (± SE) (A) daily growth and (B) size-at-age across three-year groups of larval cabezon (Scorpaenichthys marmoratus). Fish collected over five years were grouped into neutral years, and years with marine heatwaves I or II (MHW I, MHW II). After ~15–20 dph, MHW II larvae grew significantly faster than other years (A), translating into a significantly larger size-at-age (B).
3.6 Recent growth modeling
In the best model, larval cabezon MRG (size-detrended growth rate over the last three complete days of life) was influenced by early larval growth, environmental conditions, and the environmental biomass of calyptopis (Figure 9; deviance explained=51.4%, AIC=116.21, GCV=0.48). As expected, MRG was higher in larvae with high mean early growth (p<0.001; Figure 9A). MRG had a positive linear relationship with upwelling intensity (p=0.02; Figure 9B): growth was faster when higher levels of upwelling had occurred during the previous 14 d. MRG had a logarithmic relationship with mean recent temperature, such that growth was faster in warmer temperatures, but gains in MRG slowed and plateaued after a threshold. While this relationship was not significant (p=0.17; Figure 9C), including temperature in the model improved overall model fit. Finally, MRG was lower when the biomass of calyptopis was high (p=0.04; Figure 9D). Models re-run with consumed prey biomass rather than environmental prey biomass generated similar model fit and variance. The same covariates led to the best fitting model and covariates had similar functional relationships with MRG.
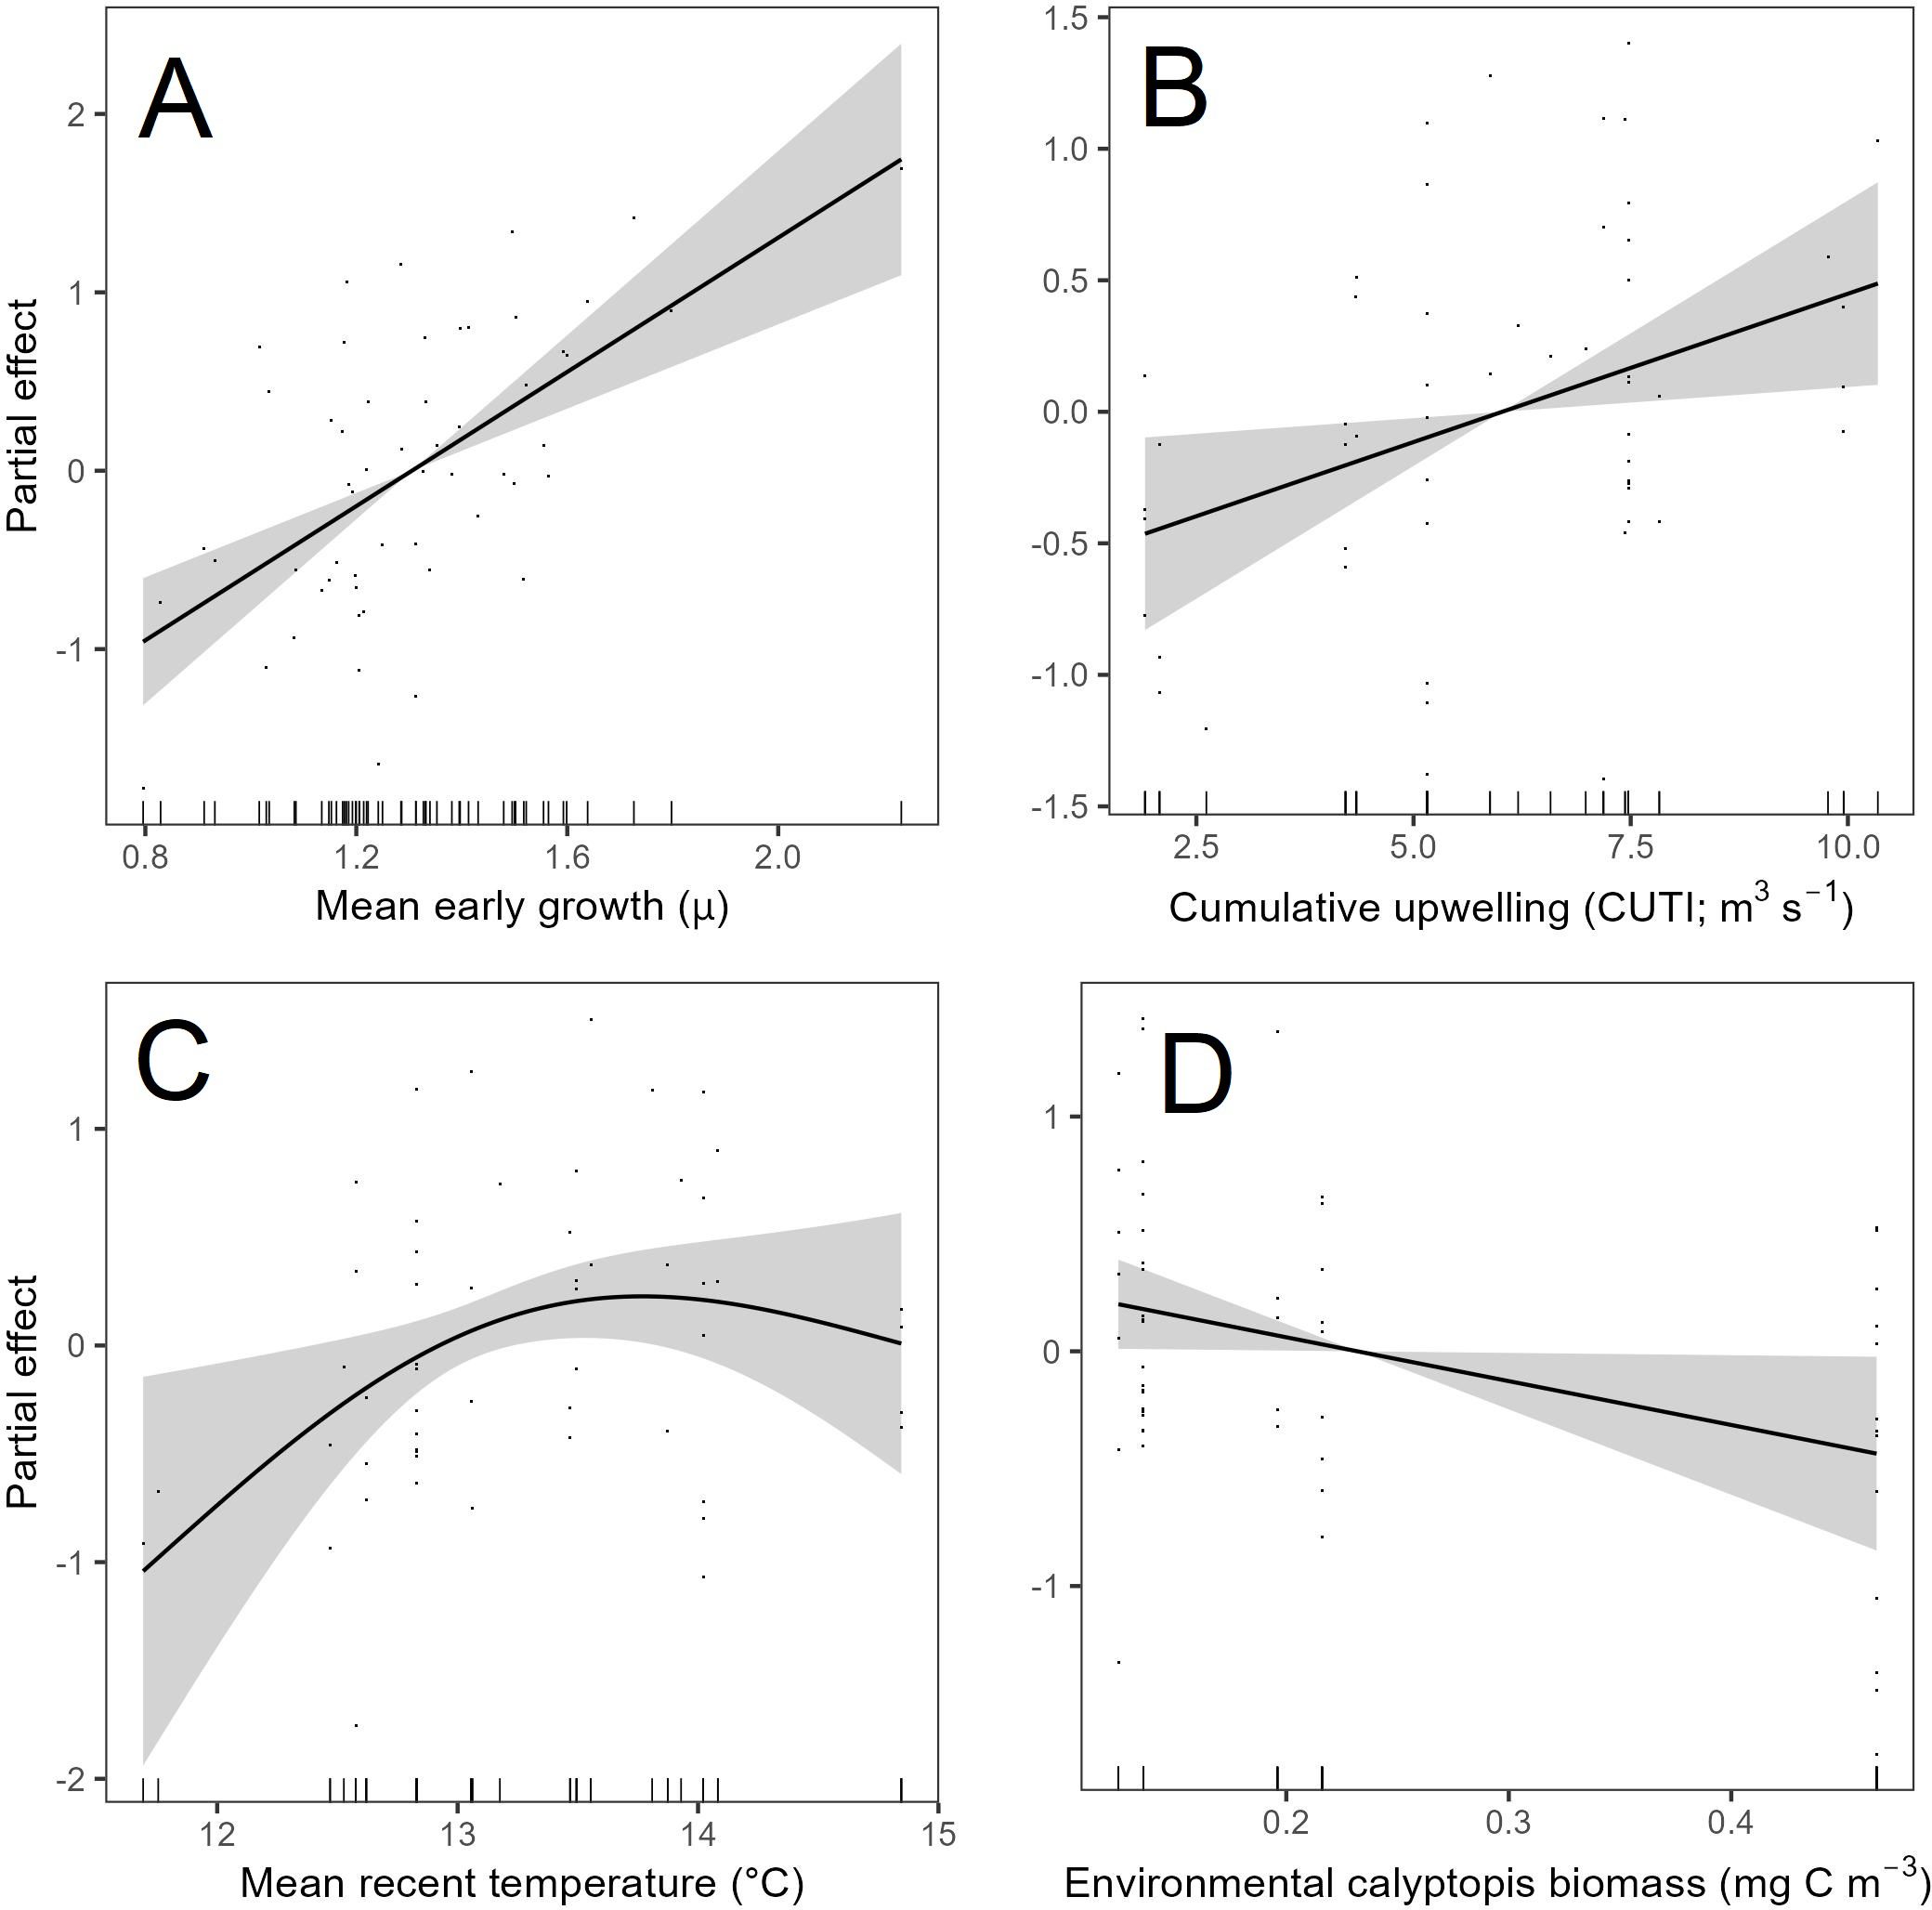
Figure 9. GAM smooth functions showing the partial effects of each covariate (A: mean early growth, B: cumulative upwelling, C: mean recent temperature, D: environmental calyptopis biomass) after accounting for the other covariate effects on the mean recent growth (MRG) of individual larval cabezon (Scorpaenichthys marmoratus; n=55). 95% confidence intervals (shaded in grey) and partial residuals (points) are shown for each covariate pot. Model AIC=116.21, GCV=0.48, and deviance explained=51.4%.
4 Discussion
Despite the economic and cultural importance of cabezon (Lucas, 2006; Cope and Key, 2009; Rodomsky et al., 2018), relatively little is known about events occurring during its early life history stages that are the most vulnerable. Examining growth and diet of cabezon larvae in the northern California Current across five years encompassing oceanographically neutral years as well as those affected by anomalous marine heatwaves provided a natural experiment to shed light on processes influencing growth and survival of this neustonic species. Larval cabezon growth and diet varied significantly between neutral years and those affected by marine heatwaves (MHW I, and MHW II): growth was fastest during MHW II (2019), when upwelling was most intense and larvae consumed primarily amphipods, in addition to a substantial biomass of euphausiid calyptopis and furcilia. Growth was intermediate in MHW I years (2015, 2016), when upwelling was moderate and larval diets were diverse, containing euphausiids (all life stages), calanoid copepods, Corycaeus spp. copepods, appendicularians, and a collection of “other” prey types (including crab megalopae, pteropods, bivalve larvae, ostracods, and protists). Finally, larval growth was slowest in neutral years when upwelling was lowest and larval cabezon consumed predominantly calyptopis and calanoid copepods. These growth and diet patterns resulted in cabezon larvae that were largest-at-age during MHW II, which may have provided refuge from gape-limited predators. Altogether, these conditions during 2019 translated into the highest juvenile cabezon recruitment rate observed in our 8-yr recruitment monitoring time series (Wilson et al., unpubl. data; Figure 10).
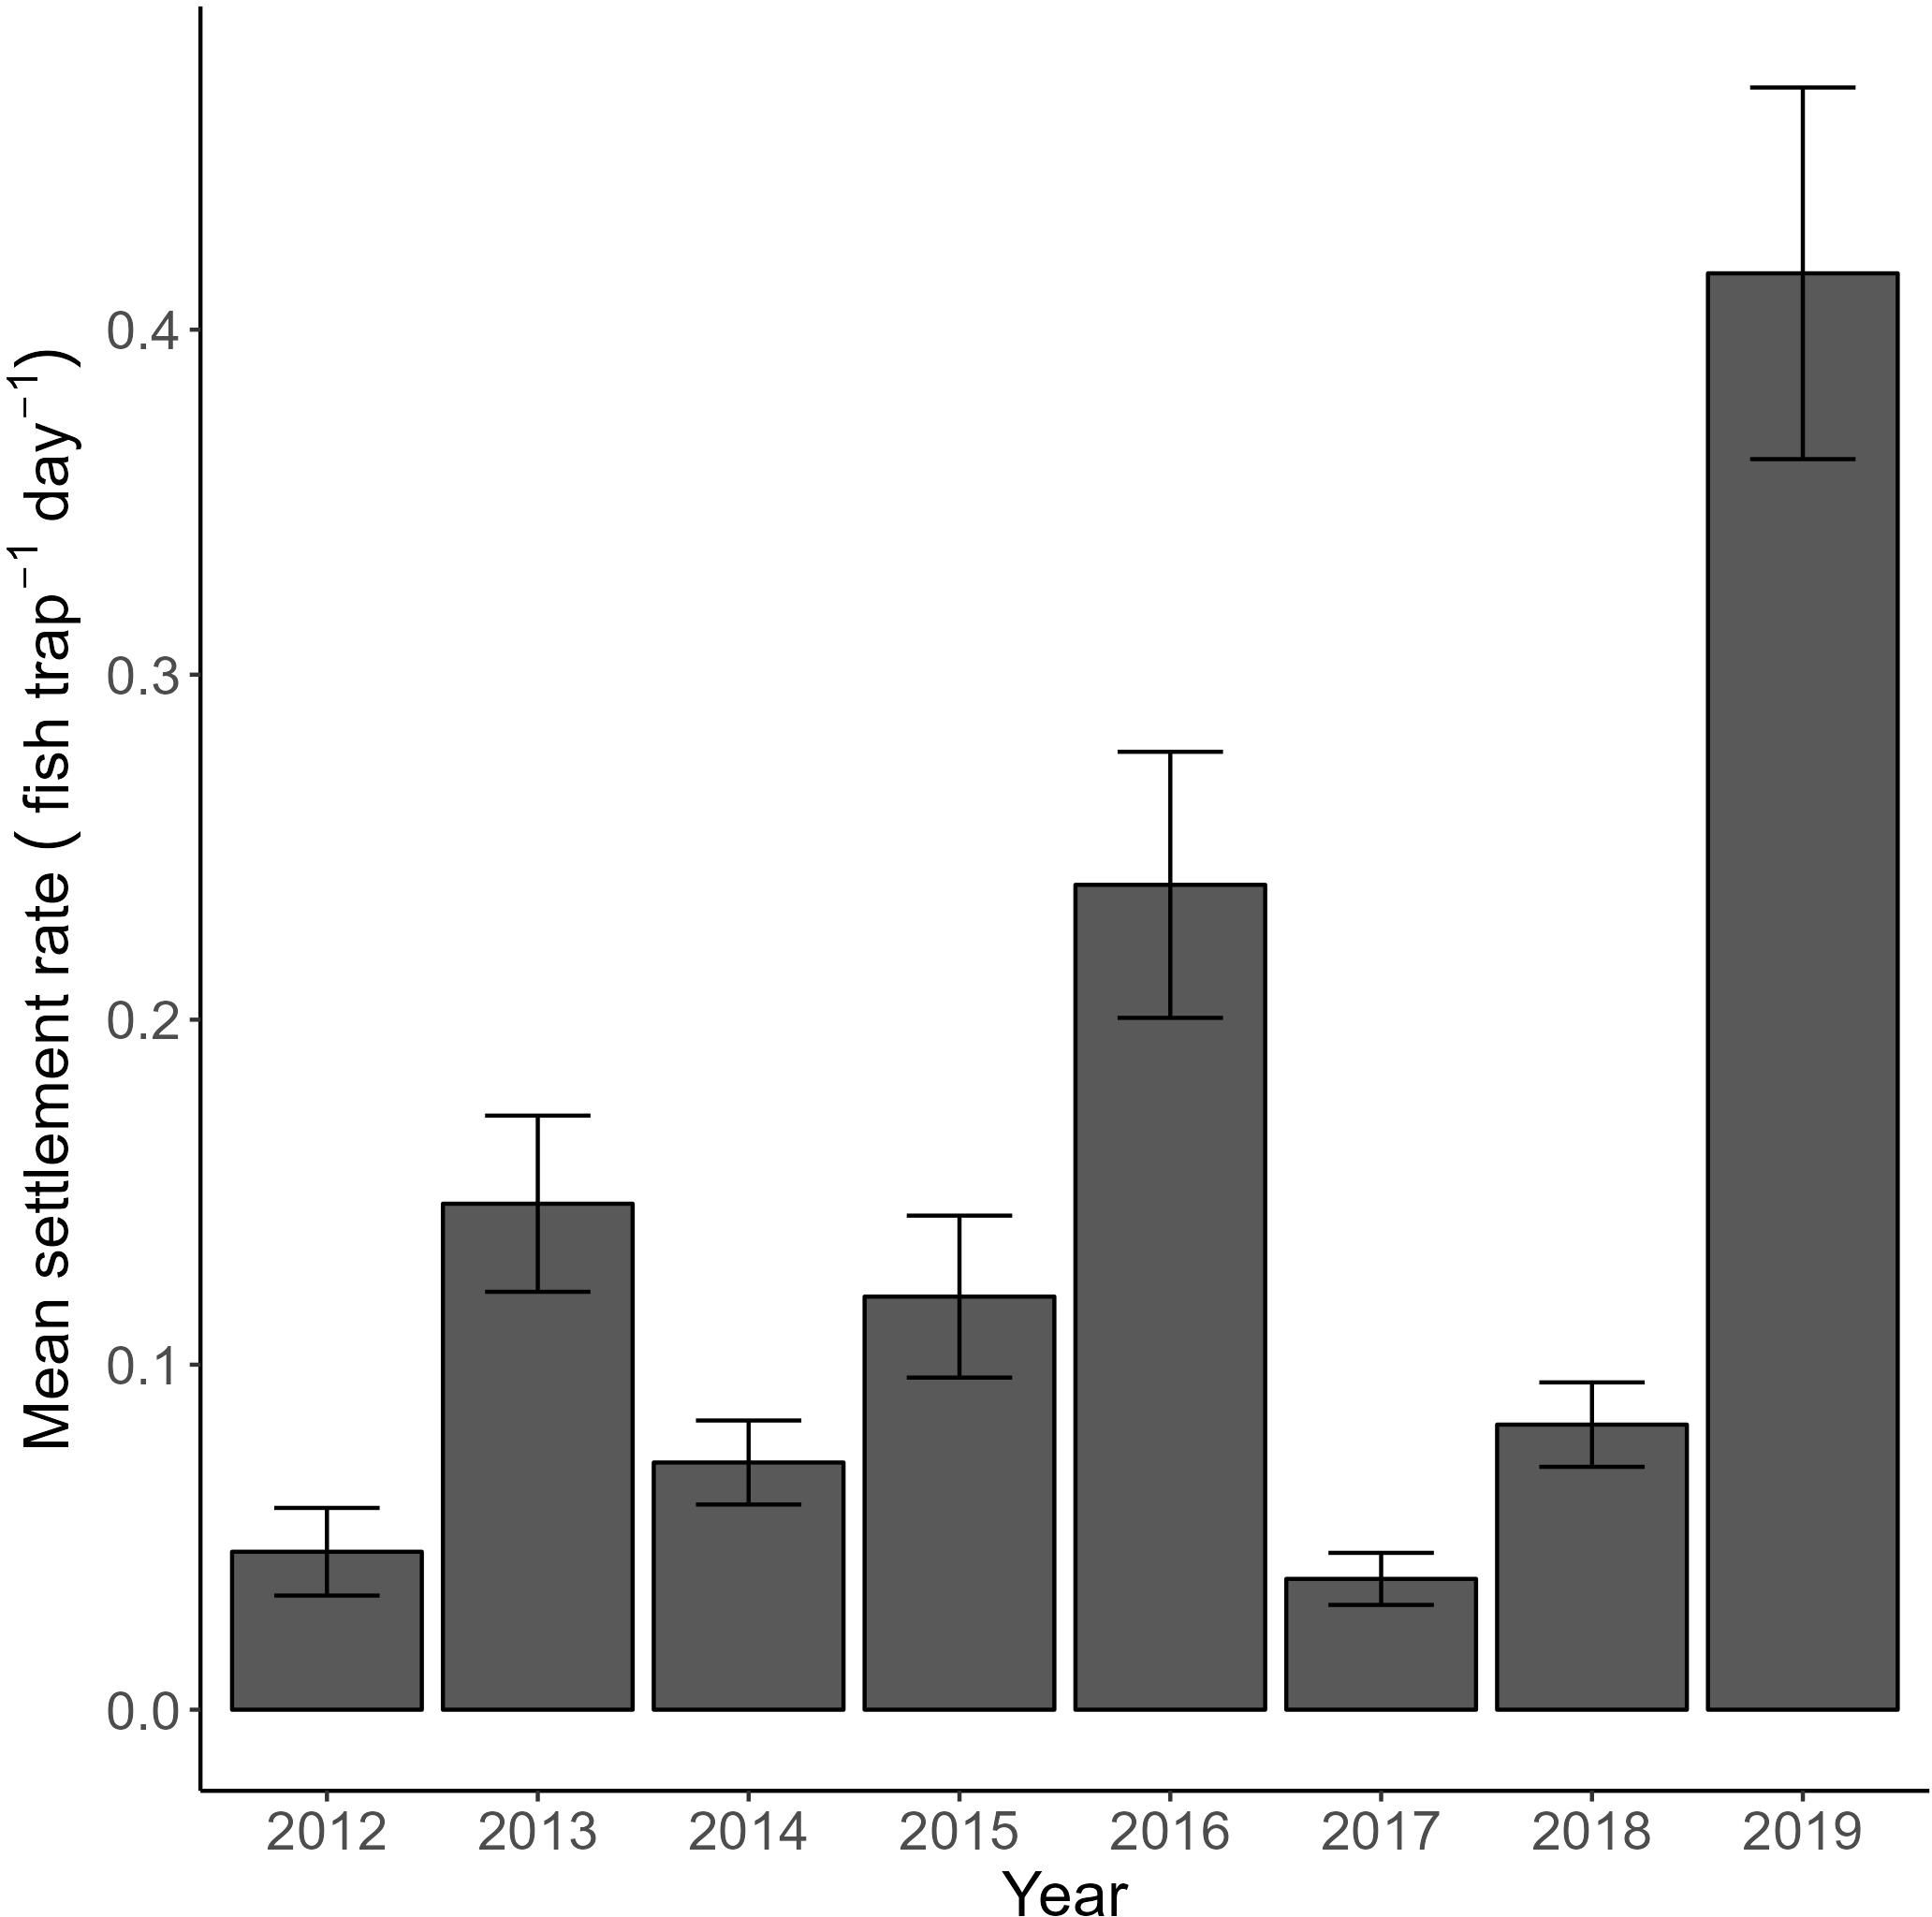
Figure 10. Mean settlement rate of cabezon (Scorpaenichthys marmoratus) (± SE) from an 8-yr time series of nearshore groundfish recruitment monitoring along the coast of Oregon (adapted from Wilson et al. unpubl data).
4.1 Larval cabezon otolith microstructure
This study provides the first published measurement of larval cabezon daily growth rates. Larval cabezon grew at an average rate of 0.43 mm d-1, which is markedly faster than many other larval fishes in the NCC, such as myctophids (0.11-0.13 mm d-1; Methot, 1981; Bystydzieńska et al., 2010; Swieca et al., 2023) and rockfishes (Sebastes spp.; 0.15-0.47 mm d-1 from 3.5-52.3 mm SL, Laidig et al., 2008), but comparable to other species that also inhabit the neuston as larvae, such as sablefish (Anoplopoma fimbria; 0.4–1 mm d-1 from 10–40 mm SL; Sogard, 2011) and species that are known to have elevated larval growth rates associated with an early onset of piscivory (e.g., yellowfin tuna [Thunnus albacares]; 0.47 mm d-1, Lang et al., 1994; blackfin tuna [T. atlanticus], 0.45 mm d-1, Gleiber et al., 2020; and Atlantic bluefin tuna [T. thynnus], 0.37-0.39 mm d-1 (Malca et al., 2022). Larval cabezon’s fast growth relative to other NCC larval fishes is likely related to their utilization of the neuston habitat and their ability to select higher trophic level prey items.
Three regions of distinct otolith growth patterns were evident after the hatch mark: 1) fast growth and wide, clear increments for 3–5 dph, 2) slow growth and cloudy, small increments for 5–10 dph, and 3) increasingly fast growth and distinct, wide increments to the otolith edge. Based on findings from rearing cabezon eggs, the 3–5 initial wide increments likely correspond to yolk-sac absorption (Wilson et al., 2023). Coherence in patterns of otolith microstructure among several other larval fishes in the NCC are consistent with the idea that the 5–10 small, cloudy increments correspond to a period of first feeding (H.W. Fennie and K. Swieca, NOAA, pers. comm.). Increasingly successful feeding associated with flexion and increasing gape width likely leads to increasingly wide increments extending to the otolith edge.
4.2 Interannual variability in cabezon diet and growth
Larval cabezon gut fullness did not differ among year groups, suggesting instead that differences in diet composition and prey quality are more important in generating variable larval growth. The diet of larval cabezon is fairly broad, consisting of amphipods, euphausiid eggs, nauplii, calyptopis, and furcilia, calanoid and cyclopoid copepods and nauplii, appendicularians, and cladocerans. This array is generally consistent with the single past study of larval cabezon diet that occurred in the Saanich Inlet, British Columbia, Canada (Barraclough and Fulton, 1968), except for the presence of Balanus cyprids in similar size cabezon larvae in this earlier study. This minor difference is likely due to the 1968 study samples being collected closer to the coastline within a fjord.
Like many fishes, larval cabezon diets change with ontogeny, with the fastest growing cabezon larvae expanding their range of prey sizes from smaller to increasingly larger prey items over time (Makrakis et al., 2005; Bochdansky et al., 2008; Daly et al., 2009). Unsurprisingly, the composition of “small” and “large” prey items consumed differed with environmental conditions. In neutral years, small, mostly pre-flexion larvae (<8.4 mm SL) consumed large proportions of relatively small prey items (i.e., calyptopis, calanoid copepods, nauplii, and cladocerans), while large, post-flexion larvae (>8.4 mm SL) continued to consume large proportions of calyptopis, while adding a small proportion of larger prey items (i.e., furcilia and amphipods). In MHW I years, small cabezon larvae again consumed small prey items, though of different composition (i.e., euphausiid calyptopis and eggs, calanoid and Corycaeus sp. copepods), while larger larvae consumed a larger proportion of furcilia (a relatively large prey item). In MHW II compared to MHW I, small cabezon larvae consumed a much larger proportion of calanoid copepods and had begun to feed on furcilia in addition to calyptopes. In addition, during the MHW II year, the diets of large cabezon larvae had the smallest proportion of calyptopis, which were replaced by a large biomass of amphipods and furcilia.
Our observation that the fastest growing larvae consumed the greatest proportion of amphipods suggests that amphipods are a highly nutritious prey item. Studies of amphipod diet and lipid content in other systems (e.g., Arctic and Straits of Georgia) have shown that some amphipod species (e.g., Parathemisto abyssorum, Parathemisto pacifica, and Cyphocaris challengeri) prey upon copepods, other amphipods, cladocerans, and ostracods, thus incorporating lipids up the food chain (Falk-Petersen et al., 1987; Haro-Garay, 2003; Kraft et al., 2015). Similarly, larval cabezon in the NCC consuming amphipods likely reap the benefit of feeding at a higher trophic level. Years with high amphipod abundance may indicate strong recruitment for cabezon, but cabezon’s broad diet is likely to support strong recruitment in various prey environments.
Larval cabezon diets reflect some prey selectivity, where amphipods and euphausiid furcilia were overrepresented relative to their natural occurrence in the environment. Interestingly, the furcilia stage is when larval euphausiids, especially Thysanoessa spinifera, start to transition from a primarily phytoplankton diet to omnivory, elevating their trophic level, increasing their lipid content, and thus increasing their value as a prey item (Feinberg et al., 2010; Fisher et al., 2020). Corycaeus spp. also appeared to be selected for by larval cabezon especially during MHW II. Calanoid copepods were never selected for, despite being a preferred prey item for many species in the California Current (Tomaro et al., 2012; Swalethorp et al., 2014).
Prey selectivity varied among years: While furcilia and calyptopis were preferentially consumed during MHW II, calyptopis and cladocerans were selected for in neutral years. In contrast, during MHW I years, the biomasses of consumed euphausiid life stages roughly reflected patterns of environmental biomasses, with only a slight preference for furcilia. Appendicularians were consistently present in larval cabezon diets but did not appear to be selected for or against. Pleuronectiform and some scombrid larvae are known to specialize on consuming appendicularians (Gadomski and Boehlert, 1984; Llopiz et al., 2010), and other larval fishes are thought consume appendicularians during the onset of piscivory, as they are similarly shaped and easier to capture than fish larvae (Purcell et al., 2005). In the NCC, appendicularians are present in the water column prior to the onset of summer upwelling (Gadomski and Boehlert, 1984; Purcell et al., 2005), and are an important trophic link to the microbial food web (Llopiz et al., 2010; Corrales-Ugalde et al., 2021); thus they may be important for fish larvae, including earlier cohorts of cabezon, that are feeding in the plankton during this time (Wilson et al., unpubl. data). The generalist diet of larval cabezon likely provides resilience to seasonal environmental variation as well as anomalous environmental conditions.
We note that apparent prey selectivity by larval cabezon may have been influenced by study design. Larval fishes and environmental prey were sampled at different times each year using techniques that could bias our views. For example, zooplankton sampling was conducted with plankton nets towed vertically and obliquely, which may under-sample neustonic organisms such as Corycaeus spp. Additionally, it is possible that the number of larval cabezon predators in the environment varied between years. However, because none of our sampling methods enumerated predators in the environment, examining the impact of predation on diet and growth is outside the scope of this study. Coupled, in-situ studies of zooplankton, larval fish, and larval fish predators would be preferable to ensure spatial overlap when investigating trophodynamics (sensu Sponaugle et al., 2009; Swieca et al., 2023). However, these studies are rare and targeted (e.g., do not span several years). The surveys included in the present study represent the best-available, long-term larval cabezon and prey data in the region and thus still provide valuable insights. Finally, interpreting patterns of prey selectivity can be challenging when prey species have well-developed predator avoidance behaviors. For instance, calanoid copepods may spend less time in the neuston as they vertically migrate, especially during daylit hours when visual predators like larval fishes feed.
Larval cabezon have a well-developed feeding apparatus and large eyes compared to other similar age larval fishes in the California Current (O’Connell, 1953). Because larval fishes are visual predators, it is not surprising that larval cabezon can selectively feed on high-quality prey items. Additionally, it is possible that cabezon have very little resource competition. While most larval fishes and other zooplanktivorous organisms vertically migrate to feed in the photic zone during the night to seek refuge from visual predators (Brewer and Kleppel, 1986; Ohman, 1990; Hobbs and Botsford, 1992; Hays, 2003), larval cabezon continuously inhabit the neuston (Doyle, 1992). Larval cabezon feeding occurrence was not affected by time of day, indicating that they successfully feed regardless of time of day and have access to prey while would-be competitors migrate to depth. Other planktivores that inhabit the neuston at all times of day include larval sablefish (Anoplopoma fimbria) who appear to preferentially consume calanoid copepods at similar larval sizes (Grover and Olla, 1990; Sogard, 2011), larval Pacific saury (Cololabis saira) whose diet is unknown though adults are known to feed on large copepods and adult euphausiids (Miyamoto et al., 2020), juvenile salmon, who preferentially feed on larger, heavily pigmented prey like hyperiid amphipods and insects (Brodeur, 1989), and Velella velella, who largely consume cladocerans, calanoid copepods, and fish eggs (Zeman et al., 2018). Interestingly, both V. velella and Chrysaora fuscescens, common, co-occurring gelatinous zooplankton in the NCC, preferentially feed on cladocerans (Zeman et al., 2016). Although cladocerans are not a main prey item for cabezon, they comprise part of the cabezon diet, so this apparent selection poses an opportunity for competition between larval fish and gelatinous zooplankton, which are predicted to increase in abundance with climate change (Brodeur et al., 2002, 2018). Overall, the preferred and rather generalist diet of cabezon reflects their neustonic niche, including some differentiation from other neustonic inhabitants.
4.3 Differential impact of marine heatwaves
While the most likely impact of climate-change driven, non-stationary increases in ocean temperatures is changes in larval fish physiology (e.g., metabolism), discrete MHW events add complexity by altering the ecological setting that a larval fish must navigate to survive (e.g., trophodynamics). Discrete environmental events that can restructure ecosystems, such as MHWs, are emerging as critical factors driving rapid ecosystem shifts (Smale et al., 2019; Oliver et al., 2021). Therefore, categorizing MHWs not only in terms of physical factors (e.g., intensity of temperature anomaly, duration, and source of forcing), but also in terms of biological and ecological ramifications is necessary. The present study encompassed two types of MHW events, each with different sources of physical forcing, durations, and intensities, which provides an opportunity to measure their ecological impacts on larval cabezon, either by anomalous preconditioning, in-situ, or carry-over environmental changes, and each with markedly different outcomes for the recruitment of this species.
MHW I first appeared in the NCC in mid-September 2014, when surface waters warmed by 7˚C in 1 h (Gentemann et al., 2017). Although MHW I was punctuated by brief periods of cooling, SST was elevated until late 2016 (Peterson et al., 2017). Above-average upwelling winds were evident in the spring of both 2015 and 2016, but there was an anomalously deep mixed layer underlying the warm water mass. Despite the upwelling of some cool water nearshore and off southern Oregon, these waters warmed to above average temperatures by mid-summer each year (Gentemann et al., 2017). MHW II brought anomalous environmental conditions beginning in May 2019 with extreme temperatures evident in following summer months. In contrast to MHW I, MHW II was shorter in duration, higher in intensity (+7.9˚C maximum anomaly) and coincided with a very shallow mixed-layer depth (Amaya et al., 2020). The differences in mixed-layer depth may be an important factor in the differential ecosystem impact of the two MHW events. A deep mixed-layer in MHW I allowed the surface water heat flux to be mixed over a larger volume (lower intensity), but also resulted in surface anomalies becoming trapped below the mixed layer as it shoaled in the summer, only to remerge when the mixed layer deepened the following winter (Amaya et al., 2020). This reemergence resulted in an extended period of temperature anomalies and sustained alteration of the marine ecosystem. A shallow mixed layer in MHW II resulted in less dilution of warm surface waters (high intensity) and no reemergence (shorter duration).
MHW I resulted in well-documented range shifts and reproduction failure for many species (Thompson et al., 2019; Laurel and Rogers, 2020; Piatt et al., 2020; Shanks et al., 2020; Walker et al., 2020; Nielsen et al., 2021). The NCC typically undergoes a spring transition to upwelling conditions that bring lipid-rich northern copepods southward into the study region. During wintertime downwelling conditions, these northern copepods are displaced by lipid-poor southern copepods that are advected into the region by poleward transport. During the MHW I years, this transition in copepod communities never occurred (https://www.fisheries.noaa.gov/west-coast/science-data/ocean-ecosystem-indicators-pacific-salmon-marine-survival-northern). If larval cabezon diets reflected broader copepod community dynamics, we might expect southern species such as Paracalanus spp. and Corycaeus spp. to be consumed during MHW years, and northern species to be consumed in neutral years. The increased number of Corycaeus spp. copepods in larval cabezon diets during MHW relative to neutral years may provide some support for this hypothesis; however, we were not able to reliability identify calanoid copepod species to genera and are thus unable to categorize them as part of the northern or southern communities. A targeted, co-located study of neustonic larval fish and their prey would enable us to make more robust predictions about the impact of environmental forcing on this unique habitat and whether our assumptions about the impact of upwelling-driven copepod community dynamics on the food web hold.
MHW I also had a profound effect on euphausiid population dynamics. In northern and central California, the common NCC euphausiid species, Thysanoessa spinifera and Euphausia pacifica, decreased in abundance (McClatchie et al., 2016; Peterson et al., 2017) and body size (Robertson and Bjorkstedt, 2020; Killeen et al., 2022). However, larval euphausiid stages had the opposite response: warm temperatures and elevated chlorophyll levels led to increases in body length and abundance (Robertson and Bjorkstedt, 2020). Lipid analysis of E. pacifica and T. spinifera life stages indicate that while E. pacifica can complete its life cycle feeding on phytoplankton alone, development is delayed in T. spinifera when there are insufficient zooplankton to sustain their omnivorous diet (Fisher et al., 2020). Multiple lines of evidence suggest that MHW I resulted in a high abundance of euphausiid larvae, providing ample prey for larval cabezon to consume. However, the ability of these krill larvae to complete their life cycle may have been reduced due to insufficient smaller zooplankton prey. In this case, adult biomasses would have plummeted as was observed off Oregon (Peterson et al., 2017), leading to very few larval euphausiids for cabezon to feed upon in 2017-18, which may have contributed to the low cabezon recruitment that was observed off Oregon in 2017-2018 (Figure 10). In contrast to MHW I, warm water conditions during MHW II did not result in below average euphausiid abundances in the NCC (Thompson et al., 2019).
4.4 Factors affecting recruitment processes and early-life history success
Variable ocean conditions throughout the study period provided the opportunity to investigate the factors affecting recruitment processes for cabezon in the NCC. Elevated temperatures can increase larval fish metabolism and growth (Houde, 1987; Sponaugle et al., 2006; Grorud-Colvert and Sponaugle, 2011), so faster larval cabezon growth during MHW I and MHW II years is not unexpected. However, elevated temperatures can result in poor larval survival if there are insufficient prey available to sustain this fast growth (Shelley and Johnson, 2022; Fennie et al., 2023). Mean recent larval growth was significantly faster and recruitment greater in MHW years than in neutral years, thus it seems that elevated temperatures did not pose a growth or survival challenge. However, the difference in the magnitude of elevated temperatures experienced by the larvae is likely not great enough to account for the particularly elevated larval growth and record-setting recruitment in 2019 (Figure 10). Instead, differences in prey abundance and quality likely played a key role.
The linear relationship between larval cabezon MRG and upwelling intensity suggests that increased upwelling is beneficial for growth, as increased productivity increases prey availability. Especially because the neuston is uniquely exposed to strong winds as an air-sea interface, we might expect a decrease in MRG after some intermediate upwelling value due to increased turbulence and decreased larval fish-prey encounter rates (Rothschild and Osborn, 1988; Cury and Roy, 1989; Roy et al., 1992). However, the neuston has often been considered a “foraging hotspot,” where much like thin layers, encounter rates with prey and predators are elevated (Greer et al., 2013; Benoit-Bird et al., 2013; Benoit-Bird and McManus, 2014; Whitney et al., 2021). This may be why there was no sharp decrease in MRG at high values of cumulative upwelling. Additionally, onshore and offshore movement with upwelling cycles may maintain overall coherence and normal encounter rates within the surface layer throughout the cross-shelf journey (Shanks and Eckert, 2005).
These findings are consistent with the existence of a critical period where sufficient high quality prey items must be present when larval cabezon undergo flexion and become capable of capturing larger prey items. Larval cabezon appear to be preferentially consuming larger prey items (e.g., furcilia vs. calyptopis or eggs), and among larger prey items, they are selecting for amphipods. Higher resolution information about larval cabezon diet composition (e.g., identification to species via preservation in formalin rather than ethanol or lipid content analysis) would provide more clarity about the benefits of different prey items (Robert et al., 2014).
Larval cabezon growth appears to be dependent on euphausiid population dynamics: larval growth is elevated when the onset of flexion is spatially and temporally aligned with transition from calyptopis to furcilia larval stage in the euphausiid population. Though larval euphausiids comprise a large proportion of larval cabezon diets each year, the ability to also utilize other large prey items such as amphipods may provide some resilience to environmental “mismatches” (Cushing, 1990; Fortier et al., 1995; Endo et al., 2022). Fluctuations in euphausiid populations are driven by temperature, upwelling, and chlorophyll levels (Robertson and Bjorkstedt, 2020; Phillips et al., 2022) and closely reflect regional and local patterns in oceanography. Larval cabezon utilization of euphausiid larvae, and the growth impact of different euphausiid larval stages, suggests that monitoring euphausiid population dynamics may help predict cabezon recruitment.
While considerable knowledge has been gained from applying oceanographic or zooplankton community indices to predict fish recruitment and population dynamics, results of the present study indicate that the mechanistic connections between temperature, diet, and growth in fish early stages can be indirect and complex. Achieving a nuanced understanding of these relationships under variable environmental conditions, including discrete ecosystem perturbations (e.g., MHW events), enhances our understanding of recruitment processes and improves our ability to predict responses to future climate change.
Data availability statement
The raw data supporting the conclusions of this article will be made available by the authors, without undue reservation.
Ethics statement
The animal study was approved by the Institutional Animal Care and Use Committee. The study was conducted in accordance with the local legislation and institutional requirements.
Author contributions
MW: Investigation, Formal analysis, Methodology, Writing – review & editing, Funding acquisition, Writing – original draft, Data curation, Visualization, Conceptualization. RB: Data curation, Methodology, Writing – original draft, Writing – review & editing. TA: Data curation, Methodology, Writing – original draft, Writing – review & editing. GR: Data curation, Methodology, Writing – original draft, Writing – review & editing. CM: Data curation, Writing – review & editing, Methodology, Writing – original draft. SZ: Data curation, Methodology, Writing – original draft, Writing – review & editing. SS: Conceptualization, Funding acquisition, Investigation, Methodology, Supervision, Writing – original draft, Writing – review & editing.
Funding
The author(s) declare that financial support was received for the research and/or publication of this article. MW was supported throughout this study by the Oregon Sea Grant Robert E. Malouf Scholarship, the Hatfield Marine Science Center Mamie Markham Award, Integrative Biology research funds, and a Hatfield Student Organization Research Award. Support of MW and SS during the preparation of this manuscript included National Science Foundation grant OCE 2125407.
Acknowledgments
We are immensely grateful to our collaborators at the NOAA NWFSC for their collaboration. Specifically, we thank those involved with the NWFSC Pre-recruit cruise, including NOAA staff, volunteers, and the captain and crew of the R/V Bell M. Shimada and R/V Ocean Starr. We also thank those involved with the historic and ongoing sampling of the NHL, including past and present staff and students, and the captain and crew of the R/V Elakha. Finally, we thank those involved with the JSOES surveys, including NOAA staff, and the captain and crew of the F/V Frosti. Without their dedication to maintaining these long-term surveys, commitment to collaboration and mentorship, and expert advice, this study would not have been possible. We especially thank Kelsey Swieca, Miram Gleiber, and Jami Ivory for their help with zooplankton gut-content identification, and H. Will Fennie, Kelsey Swieca, and Kelia Axler for assistance with otolith interpretation. Earlier versions of this manuscript benefitted from the input of Robert K. Cowen, Lorenzo Ciannelli, Mary Hunsicker, and Kirsten Grorud-Colvert.
Conflict of interest
The authors declare that the research was conducted in the absence of any commercial or financial relationships that could be construed as a potential conflict of interest.
Generative AI statement
The author(s) declare that no Generative AI was used in the creation of this manuscript.
Publisher’s note
All claims expressed in this article are solely those of the authors and do not necessarily represent those of their affiliated organizations, or those of the publisher, the editors and the reviewers. Any product that may be evaluated in this article, or claim that may be made by its manufacturer, is not guaranteed or endorsed by the publisher.
Supplementary material
The Supplementary Material for this article can be found online at: https://www.frontiersin.org/articles/10.3389/fmars.2025.1569581/full#supplementary-material
References
Abraham J. P., Baringer M., Bindoff N. L., Boyer T., Cheng L. J., Church J. A., et al. (2013). A review of global ocean temperature observations: Implications for ocean heat content estimates and climate change. Rev. Geophysics 51, 450–483. doi: 10.1002/rog.20022
Abubakr M. A. and Jones D. A. (1992). Functional morphology and ultrastructure of the anterior mid-gut diverticulae of larvae of Penaeus monodon Fabricius 1798 (Decapoda, Natantia). Crustaceana 62, 142–158. doi: 10.1163/156854092X00712
Altieri A. H. and Gedan K. B. (2015). Climate change and dead zones. Global Change Biol. 21, 1395–1406. doi: 10.1111/gcb.12754
Amaya D. J., Miller A. J., Xie S.-P., and Kosaka Y. (2020). Physical drivers of the summer 2019 North Pacific marine heatwave. Nat. Commun. 11, 1903. doi: 10.1038/s41467-020-15820-w
Asch R. G., Stock C. A., and Sarmiento J. L. (2019). Climate change impacts on mismatches between phytoplankton blooms and fish spawning phenology. Global Change Biol. 25, 2544–2559. doi: 10.1111/gcb.14650
Auth T. D. (2008). Distribution and community structure of ichthyoplankton from the northern and central California Current in May 2004–06. Fisheries Oceanogr. 17, 316–331. doi: 10.1111/j.1365-2419.2008.00481.x
Auth T. D. and Brodeur R. D. (2006). Distribution and community structure of ichthyoplankton off the coast of Oregon, USA, in 2000 and 2002. Mar. Ecol. Prog. Ser. 319, 199–213. doi: 10.3354/meps319199
Auth T. D., Daly E. A., Brodeur R. D., and Fisher J. L. (2018). Phenological and distributional shifts in ichthyoplankton associated with recent warming in the northeast Pacific Ocean. Global Change Biol. 24, 259–272. doi: 10.1111/gcb.13872
Bakun A., Black B. A., Bograd S. J., Garcia-Reyes M., Miller A. J., Rykaczewski R. R., et al. (2015). Anticipated effects of climate change on coastal upwelling ecosystems. Curr. Climate Change Rep. 1, 85–93. doi: 10.1007/s40641-015-0008-4
Barraclough W. E. and Fulton J. D. (1968). Data record of larval and juvenile fish caught with a surface trawl in Saanich Inlet during June and July Vol. 100 (Fisheries Research Board of Canada Report), 83.
Baumann H., Pepin P., Davidson F. J. M., Mowbray F., Schnack D., and Dower J. F. (2003). Reconstruction of environmental histories to investigate patterns of larval radiated shanny (Ulvaria subbifurcata) growth and selective survival in a large bay of Newfoundland. ICES J. Mar. Sci. 60, 243–258. doi: 10.1016/S1054-3139(03)00019-5
Bennett S., Duarte C. M., Marbà N., and Wernberg T. (2019). Integrating within-species variation in thermal physiology into climate change ecology. Philos. Trans. R. Soc. B 374, 20180550. doi: 10.1098/rstb.2018.0550
Benoit-Bird K. J. and McManus M. A. (2014). A critical time window for organismal interactions in a pelagic ecosystem. PloS One 9, e97763. doi: 10.1371/journal.pone.0097763
Benoit-Bird K. J., Shroyer E. L., and McManus M. A. (2013). A critical scale in plankton aggregations across coastal ecosystems. Geophysical Res. Lett. 40, 3968–3974. doi: 10.1002/grl.50747
Berggreen U., Hansen B., and Kiorboe T. (1988). Food size spectra, ingestion and growth of the copepod Acartia tonsa during development: implications for determination of copepod production. Mar. Biol. 99, 341–352. doi: 10.1007/BF02112126
Bochdansky A. B., Grønkjær P., Pepin P., and Leggett W. C. (2008). Food limitation in larval fish: ontogenetic variation in feeding scope and its potential effect on survival. Mar. Ecol. Prog. Ser. 367, 239–248. doi: 10.3354/meps07590
Bond N., Cronin M. F., Freeland H., and Mantua N. (2015). Causes and impacts of the 2014 warm anomaly in the NE Pacific. Geophysical Res. Lett. 42, 3414–3420. doi: 10.1002/2015GL063306
Brewer G. D. and Kleppel G. S. (1986). Diel vertical distribution of fish larvae and their prey in nearshore waters of southern California. Mar. Ecol. Prog. Ser. 27, 217–226. doi: 10.3354/meps027217
Brodeur R. D. (1989). Neustonic feeding by juvenile salmonids in coastal waters of the Northeast Pacific. Can. J. Zool. 67, 1995–2007. doi: 10.1139/z89-284
Brodeur R. D., Auth T. D., and Phillips A. J. (2019). Major shifts in pelagic micronekton and macrozooplankton community structure in an upwelling ecosystem related to an unprecedented marine heatwave. Front. Mar. Sci. 6, 212. doi: 10.3389/fmars.2019.00212
Brodeur R. D. and Morgan C. A. (2016). Influence of a coastal riverine plume on the cross-shelf variability in hydrography, zooplankton, and juvenile salmon diets. Estuaries Coasts 39, 1183–1198. doi: 10.1007/s12237-015-0050-4
Brodeur R. D., Perry R. I., Boldt J. L., Flostrand L., Galbraith M., King J., et al. (2018). An unusual gelatinous plankton event in the NE Pacific: the great pyrosome bloom of 2017. PICES Press 26, 22–27.
Brodeur R. D., Sugisaki H., and Hunt G. L. Jr. (2002). Increases in jellyfish biomass in the Bering Sea: implications for the ecosystem. Mar. Ecol. Prog. Ser. 233, 89–103. doi: 10.3354/meps233089
Bruning M. J., Veliz D., Rojas-Hernandez N., Garces-Vargas J., Garrido I., Cid M. J., et al. (2024). The timing of marine heatwaves during the moulting cycle affects performance of decapod larvae. Sci. Rep. 14, 29800. doi: 10.1038/s41598-024-81258-5
Bystydzieńska Z. E., Phillips A. J., and Linkowski T. B. (2010). Larval stage duration, age and growth of blue lanternfish Tarletonbeania crenularis (Jordan and Gilber) derived from otolith microstructure. Environ. Biol. Fishes 89, 493–503. doi: 10.1007/s10641-010-9681-2
Cavole L. M., Demko A. M., Diner R. E., Giddings A., Koester I., Pagniello C. M., et al. (2016). Biological impacts of the 2013–2015 warm-water anomaly in the Northeast Pacific: winners, losers, and the future. Oceanography 29, 273–285. doi: 10.5670/oceanog.2016.32
Chan F., Barth J. A., Kroeker K. J., Lubchenco J., and Menge B. A. (2019). The dynamics and impact of ocean acidification and hypoxia. Oceanography 32, 62–71. doi: 10.5670/oceanog.2019.312
Checkley D. M. and Barth J. A. (2009). Patterns and processes in the California current system. Prog. Oceanogr. 83, 49–64. doi: 10.1016/j.pocean.2009.07.028
Chen Z., Shi J., Liu Q., Chen H., and Li C. (2021). A persistent and intense marine heatwave in the Northeast Pacific during 2019–2020. Geophysical Res. Lett. 48, e2021GL093239. doi: 10.1029/2021GL093239
Cope J. M. and Key M. (2009). Status of Cabezon (Scorpaenichthys marmoratus) in California and Oregon Waters as Assessed in 2009 (Pacific Fisheries Management Council), 421.
Cope J. M., Berger A. M., Whitman A. D., Budrick J. E., Bosley K. M., Tsou T., et al. (2019). Assessing Cabezon (Scorpaenichthys marmoratus) stocks in waters off of California and Oregon, with catch limit estimation for Washington State. Pacific Fishery Manage. Council. Available at: http://www.pcouncil.org/groundfish/stockassessments/.
Corrales-Ugalde M., Sponaugle S., Cowen R. K., and Sutherland K. R. (2021). Seasonal hydromedusan feeding patterns in an Eastern Boundary Current show consistent predation on primary consumers. J. Plankton Res. 43, 712–724. doi: 10.1093/plankt/fbab059
Cornet-Barthaux V., Armand L., and Quéguiner B. (2007). Biovolume and biomass estimates of key diatoms in the Southern Ocean. Aquat. Microbial. Ecol. 48, 295–308. doi: 10.3354/ame048295
Cury P. and Roy C. (1989). Optimal environmental window and pelagic fish recruitment success in upwelling areas. Can. J. Fisheries Aquat. Sci. 46, 670–680. doi: 10.1139/f89-086
Cushing D. H. (1990). Plankton production and year-class strength in fish populations: an update of the match/mismatch hypothesis. Adv. Mar. Biol. 26, 249–293. doi: 10.1016/S0065-2881(08)60202-3
Daly E. A., Brodeur R. D., and Auth T. D. (2017). Anomalous ocean conditions in 2015: impacts on spring Chinook salmon and their prey field. Mar. Ecol. Prog. Ser. 566, 169–182. doi: 10.3354/meps12021
Daly E. A., Brodeur R. D., and Weitkamp L. A. (2009). Ontogenetic shifts in diets of juvenile and subadult coho and chinook salmon in coastal marine waters: important for marine survival? Trans. Am. Fisheries Soc. 138, 1420–1438. doi: 10.1577/T08-226.1
Deutsch C., Ferrel A., Seibel B., Pörtner H.-O., and Huey R. B. (2015). Climate change tightens a metabolic constraint on marine habitats. Science 348, 1132–1135. doi: 10.1126/science.aaa1605
Di Lorenzo E. and Mantua N. (2016). Multi-year persistence of the 2014/15 North Pacific marine heatwave. Nat. Climate Change 6, 1042–1047. doi: 10.1038/nclimate3082
Doney S. C., Ruckelshaus M., Emmett Duffy J., Barry J. P., Chan F., English C. A., et al. (2012). Climate change impacts on marine ecosystems. Annu. Rev. Mar. Sci. 4, 11–37. doi: 10.1146/annurev-marine-041911-111611
Dower J. F., Pepin P., and Leggett W. C. (1998). Enhanced gut fullness and an apparent shift in size selectivity by radiated shanny (Ulvaria subbifurcata) larvae in response to increased turbulence. Can. J. Fisheries Aquat. Sci. 55, 128–142. doi: 10.1139/f97-225
Doyle M. J. (1992). Neustonic ichthyoplankton in the northern region of the California Current ecosystem Vol. 33 (California Cooperative Oceanic Fisheries Investigations Report), 141–161.
Eakin C. M., Sweatman H. P. A., and Brainard R. E. (2019). The 2014–2017 global-scale coral bleaching event: insights and impacts. Coral Reefs 38, 539–545. doi: 10.1007/s00338-019-01844-2
Endo C. A. K., Stige L. C., Skogen M. D., Ciannelli L., and Vikebø F. V. (2022). Two decades of match-mismatch in Northeast Arctic cod–feeding conditions and survival. Front. Mar. Sci. 9. doi: 10.3389/fmars.2022.767290
Falk-Petersen S., Sargent J. R., and Tande K. S. (1987). Lipid composition of zooplankton in relation to the sub-arctic food web. Polar Biol. 8, 115–120. doi: 10.1007/BF00297065
Fasiolo M., Nedellec R., Goude Y., and Wood S. N. (2020). Scalable visualization methods for modern Generalized Additive Models. J. Comput. Graph. Stat.. 29 (1), 78-86.
Feinberg L. R., Peterson W. T., and Shaw C. T. (2010). The timing and location of spawning for the Euphausiid Thysanoessa spinifera off the Oregon coast, USA. Deep Sea Res. 57, 572–583. doi: 10.1016/j.dsr2.2009.10.007
Fennie H. W., Grorud-Colvert K., and Sponaugle S. (2023). Larval rockfish growth through a marine heatwave: window into the future. Sci. Rep. 13, 4089. doi: 10.1038/s41598-023-30726-5
Fiedler P. C. and Mantua N. J. (2017). How are warm and cool years in the California Current related to ENSO? J. Geophysical Research: Oceans 122, 5936–5951. doi: 10.1002/2017JC013094
Fisher J. L., Menkel J., Copeman L., Shaw C. T., Feinberg L. R., and Peterson W. T. (2020). Comparison of condition metrics and lipid content between Euphausia pacifica and Thysanoessa spinifera in the northern California Current, USA. Prog. Oceanogr. 188, 102417. doi: 10.1016/j.pocean.2020.102417
Fisher J. L., Peterson W. T., and Rykaczewski R. R. (2015). The impact of El Niño events on the pelagic food chain in the northern California Current. Global Change Biol. 21, 4401–4414. doi: 10.1111/gcb.13054
Fortier L., Ponton D., and Gilbert M. (1995). The match/mismatch hypothesis and the feeding success of fish larvae in ice-covered southeastern Hudson Bay. Mar. Ecol. Prog. Ser. 120, 11–27. doi: 10.3354/meps120011
Frölicher T. L., Fischer E. M., and Gruber N. (2018). Marine heatwaves under global warming. Nature 560, 360–364. doi: 10.1038/s41586-018-0383-9
Gadomski D. M. and Boehlert G. W. (1984). Feeding ecology of pelagic larvae of English sole Parophrys vetulus and butter sole Isopsetta isolepis off the Oregon coast. Mar. Ecol. Prog. Ser. 20, 1–12. doi: 10.3354/meps020001
Gall M. L., Holmes S. P., Campbell H., and Byrne M. (2021). Effects of marine heatwave conditions across the metamorphic transition to the juvenile sea urchin (Heliocidaris erythrogramma). Mar. pollut. Bull. 163, 111914. doi: 10.1016/j.marpolbul.2020.111914
Gentemann C. L., Fewings M. R., and García-Reyes M. (2017). Satellite sea surface temperatures along the West Coast of the United States during the 2014–2016 northeast Pacific marine heat wave. Geophysical Res. Lett. 44, 312–319. doi: 10.1002/2016GL071039
Gleiber M. R., Sponaugle S., and Cowen R. K. (2020). Some like it hot, hungry tunas do not! Implications of temperature and plankton food web dynamics on growth and diet of tropical tuna larvae. ICES J. Mar. Sci. 77, 3058–3073. doi: 10.1093/icesjms/fsaa201
Gobalet K. W. and Jones T. L. (1995). Prehistoric native American fisheries of the central California coast. Trans. Am. Fisheries Soc. 124, 813–823. doi: 10.1577/1548-8659(1995)124<0813:PNAFOT>2.3.CO;2
Gomes D. G. E., Ruzicka J. J., Crozier L. G., Huff D. D., Brodeur R. D., and Stewart J. D. (2024). Marine heatwaves disrupt ecosystem structure and function via altered food webs and energy flux. Nat. Commun. 15, 1988. doi: 10.1038/s41467-024-46263-2
Gove J. M., Whitney J. L., McManus M. A., Lecky J., Carvalho F. C., Lynch J. M., et al. (2019). Prey-size plastics are invading larval fish nurseries. Proc. Natl. Acad. Sci. 116, 24143–24149. doi: 10.1073/pnas.1907496116
Greer A. T., Cowen R. K., Guigand C. M., McManus M. A., Sevadjian J. C., and Timmerman A. H. (2013). Relationships between phytoplankton thin layers and the fine-scale vertical distributions of two trophic levels of zooplankton. J. Plankton Res. 35, 939–956. doi: 10.1093/plankt/fbt056
Grorud-Colvert K. and Sponaugle S. (2011). Variability in water temperature affects trait-mediated survival of a newly settled coral reef fish. Oecologia 165, 675–686. doi: 10.1007/s00442-010-1748-4
Grover J. J. and Olla B. L. (1990). Food habits of larval sablefish Anoplopoma fimbria from the Bering Sea. Fishery Bull. 88, 811–814.
Hare J. A. (2014). The future of fisheries oceanography lies in the pursuit of multiple hypotheses. ICES J. Mar. Sci.: J. du Conseil 71, 2343–2356. doi: 10.1093/icesjms/fsu018
Haro-Garay M. (2003). Diet and functional morphology of the mandible of two planktonic amphipods from the Strait of Georgia, British Columbia, Parathemisto pacifica (Stebbing 1888) and Cyphocaris challengeri (Stebbing 1888). Crustaceana 76, 1291–1312. doi: 10.1163/156854003323009821
Hastings R. A., Rutterford L. A., Freer J. J., Collins R. A., Simpson S. D., and Genner M. J. (2020). Climate change drives poleward increase and equatorward declines in marine species. Curr. Biol. 30, 1572–1577. doi: 10.1016/j.cub.2020.02.043
Hay S. J., Kiørboe T., and Matthews A. (1991). Zooplankton biomass and production in the North Sea during the autumn circulation experiment, October 1987–March 1988. Continental Shelf Res. 11, 1453–1476. doi: 10.1016/0278-4343(91)90021-W
Hays G. C. (2003). A review of the adaptive significance and ecosystem consequences of zooplankton diel vertical migrations. Hydrobiologica 503, 163–170. doi: 10.1023/B:HYDR.0000008476.23617.b0
Hedgecock D. and Pudovkin A. I. (2011). Sweepstakes reproductive success in highly fecund marine fish and shellfish: A review and commentary. Bull. Mar. Sci. 87, 971–1002. doi: 10.5343/bms.2010.1051
Helm R. R. (2021). The mysterious ecosystem at the ocean’s surface. PloS Biol. 19, e3001046. doi: 10.1371/journal.pbio.3001046
Hickey B. M. and Banas N. S. (2008). Why is the northern end of the California Current System so productive? Oceanography 21, 90–107. doi: 10.5670/oceanog.2008.07
Hobbs R. C. and Botsford L. W. (1992). Diel vertical migration and timing of metamorphosis of larvae of the Dungeness crab Cancer magister. Mar. Biol. 112, 417–428. doi: 10.1007/BF00356287
Hobday A. J., Alexander L. V., Perkins S. E., Smale D. A., Straub S. C., Oliver E. C., et al. (2016). A hierarchical approach to defining marine heatwaves. Prog. Oceanogr. 141, 227–238. doi: 10.1016/j.pocean.2015.12.014
Hobday A. J., Oliver E. C., Gupta A. S., Benthuysen J. A., Burrows M. T., Donat M. G., et al. (2018). Categorizing and naming marine heatwaves. Oceanography 31, 162–173. doi: 10.5670/oceanog.2018.205
Holbrook N. J., Sen Gupta A., Oliver E. C., Hobday A. J., Benthuysen J. A., Scannell H. A., et al. (2020). Keeping pace with marine heatwaves. Nat. Rev. Earth Environ. 1, 482–493. doi: 10.1038/s43017-020-0068-4
Hooff R. C. and Peterson W. T. (2006). Copepod biodiversity as an indicator of changes in ocean and climate conditions of the northern California Current ecosystem. Limnol. Oceanogr. 51, 2607–2620. doi: 10.4319/lo.2006.51.6.2607
Hosie G. W. and Ritz D. A. (1983). Contribution of moulting and eggs to secondary production in Nyctiphanes australis (Crustacea: Euphausiacea). Mar. Biol. 77, 215–220. doi: 10.1007/BF00395809
Houde E. D. (1987). Fish early life dynamics and recruitment variability. Am. Fish Soc. Symposium 2, 17–29.
Hsieh W. W. and Boer G. J. (1992). Global climate change and ocean upwelling. Fisheries Oceanogr. 1, 333–338. doi: 10.1111/j.1365-2419.1992.tb00005.x
Hughes T. P., Kerry J. T., Álvarez-Noriega M., Álvarez-Romero J. G., Anderson K. D., Baird A. H., et al. (2017). Global warming and recurrent mass bleaching of corals. Nature 543, 373–377. doi: 10.1038/nature21707
Huyer A. (1983). Coastal upwelling in the California Current system. Prog. Oceanogr. 12, 259–284. doi: 10.1016/0079-6611(83)90010-1
IPCC (2019). IPCC Special Report on the Ocean and Cryosphere in a Changing Climate. Eds. Pörtner H.-O., Roberts D. C., Masson-Delmotte V., Zhai P., Tignor M., Poloczanska E., Mintenbeck K., Alegría A., Nicolai M., Okem A., Petzold J., Rama B., and Weyer N. M. (Cambridge, UK and New York, NY, USA: Cambridge University Press), 755. doi: 10.1017/9781009157964
Jacox M. G., Alexander M. A., Amaya D., Becker E., Bograd S. J., Brodie S., et al. (2022). Global seasonal forecasts of marine heatwaves. Nature 604, 486–490. doi: 10.1038/s41586-022-04573-9
Jacox M. G., Edwards C. A., Hazen E. L., and Bograd S. J. (2018). Coastal upwelling revisited: Ekman, Bakun, and improved upwelling indices for the US West Coast. J. Geophysical Research: Oceans 123, 7332–7350. doi: 10.1029/2018JC014187
Jacox M. G., Tommasi D., Alexander M. A., Hervieux G., and Stock C. A. (2019). Predicting the evolution of the 2014–2016 California Current System marine heatwave from an ensemble of coupled global climate forecasts. Front. Mar. Sci. 6, 497. doi: 10.3389/fmars.2019.00497
Keister J. E., Di Lorenzo E., Morgan C. A., Combes V., and Peterson W. T. (2011). Zooplankton species composition is linked to ocean transport in the Northern California Current. Global Change Biol. 17, 2498–2511. doi: 10.1111/j.1365-2486.2010.02383.x
Khrustaleva A. M. and Pavlov D. A. (2000). Features of otolith morphology in the young of several fish species from the White Sea. J. Ichthyol. 40, 625–636.
Killeen H., Dorman J., Sydeman W., Dibble C., and Morgan S. (2022). Effects of a marine heatwave on adult body length of three numerically dominant krill species in the California Current Ecosystem. ICES J. Mar. Sci. 79, 761–774. doi: 10.1093/icesjms/fsab215
Koeller P., Fuentes-Yaco C., Platt T., Sathyendranath S., Richards A., Ouellet P., et al. (2009). Basin-scale coherence in phenology of shrimps and phytoplankton in the North Atlantic Ocean. Science 324, 791–793. doi: 10.1126/science.1170987
Kraft A., Graeve M., Janssen D., Greenacre M., and Falk-Petersen S. (2015). Arctic pelagic amphipods: lipid dynamics and life strategy. J. Plankton Res. 37, 790–807. doi: 10.1093/plankt/fbv052
Laidig T. E., Sakuma K. M., Hyde J. R., Watson W., and Lawley C. T. (2008). Identification, description, and daily growth of pelagic larval and juvenile squarespot rockfish, Sebastes hopkinsi (family Sebastidae). California Cooperative Oceanic Fisheries Investigations Data Rep. 49, 212–221.
Lang K. L., Grimes C. B., and Shaw R. F. (1994). Variations in the age and growth of yellowfin tuna larvae, Thunnus albacares, collected about the Mississippi River plume. Environ. Biol. Fishes 39, 259–270. doi: 10.1007/BF00005128
Lasker R. (1975). Field criteria for survival of anchovy larvae: the relation between inshore chlorophyll maximum layers and successful first feeding. Fishery Bull. 73, 453.
Laurel B. J. and Rogers L. A. (2020). Loss of spawning habitat and prerecruits of Pacific cod during a Gulf of Alaska heatwave. Can. J. Fisheries Aquat. Sci. 77, 644–650. doi: 10.1139/cjfas-2019-0238
Lechowicz M. J. (1982). The sampling characteristics of electivity indices. Oecologia 52, 22–30. doi: 10.1007/BF00349007
Lindley J. A. (1998). Diversity, biomass and production of decapod crustacean larvae in a changing environment. Invertebrate Reprod. Dev. 33, 209–219. doi: 10.1080/07924259.1998.9652633
Lindley J. A., Robins D. B., and Williams R. (1999). Dry weight carbon and nitrogen content of some euphausiids from the north Atlantic Ocean and the Celtic Sea. J. Plankton Res. 21, 2053–2066. doi: 10.1093/plankt/21.11.2053
Llopiz J. K. and Cowen R. K. (2009). Variability in the trophic role of coral reef fish larvae in the oceanic plankton. Mar. Ecol. Prog. Ser. 381, 259–272. doi: 10.3354/meps07957
Llopiz J. K., Richardson D. E., Shiroza A., Smith S. L., and Cowen R. K. (2010). Distinctions in the diets and distributions of larval tunas and the important role of appendicularians. Limnology Oceanography 55, 983–996. doi: 10.4319/lo.2010.55.3.0983
Lucas S. (2006). History and status of commercial live fish fisheries in California and the United States West Coast. Live Reef Fish Inf. Bull. 16, 19–25.
Mackas D. L., Greve W., Edwards M., Chiba S., Tadakoro K., Eloire D., et al. (2012). Changing zooplankton seasonality in a changing ocean: Comparing time series of zooplankton phenology. Prog. Oceanogr. 97, 31–62. doi: 10.1016/j.pocean.2011.11.005
Makrakis M. C., Nakatani K., Bialetzki A., Sanches P. V., Baumgartner G., and Gomes L. C. (2005). Ontogenetic shifts in digestive tract morphology and diet of fish larvae of the Itaipu Reservoir, Brazil. Environ. Biol. Fishes 72, 99–107. doi: 10.1007/s10641-004-6596-9
Malca E., Shropshire T., Landry M. R., Quintanilla J. M., Laiz-CarriÓn R., Shiroza A., et al. (2022). Influence of food quality on larval growth of Atlantic bluefin tuna (Thunnus thynnus) in the Gulf of Mexico. J. Plankton Res. 44, 747–762. doi: 10.1093/plankt/fbac024
Manly B. F. J., McDonald L. L., Thomas D. L., MacDonald T. L., and Erickson W. P. (2002). Resource Selection by Animals, Statistical Design and Analysis for Field Studies. 2nd ed (Dordrecht, Netherlands: Kluwer Academic Publishers), 236.
McClatchie S., Goericke R., Leising A., Auth T. D., Bjorkstedt E., Robertson R. R., et al. (2016). State of the California current 2015–16: comparisons with the 1997–98 El Niño. California Cooperative Oceanic Fisheries Investigations Data Rep. 57, 1–57.
McKee-Lewis K. K. (1996). Rapid changes and growth of California’s live finfish fishery (Seattle, Washington: Proceedings of the Marketing and Shipping Live Aquatic Products).
Methot R. D. (1981). Spatial covariation of daily growth rates of larval northern anchovy, Engraulis mordax, and larval northern lampfish, Stenobrachius leucopsarus. Rapp Proces-verbaux Des. Réunions Cons Int. pour l’Éxploration la Mer. 178, 424–431.
Middlebrook K. and Roff J. C. (1986). Comparison of methods for estimating annual productivity of the copepods Acartia hudsonica and Eurytemora herdmani in Passamaquoddy Bay, New Brunswick. Can. J. Fisheries Aquat. Sci. 43, 656–664. doi: 10.1139/f86-079
Miller J. A., Almeida L. Z., Rogers L. A., Thalmann H. L., Forney R. M., and Laurel B. J. (2024). Age, not growth, explains larger body size of Pacific cod larvae during recent marine heatwaves. Sci. Rep. 14, 19313. doi: 10.1038/s41598-024-69915-1
Mills K. E., Pershing A. J., Brown C. J., Chen Y., Chiang F.-S., Holland D. S., et al. (2013). Fisheries management in a changing climate: lessons from the 2012 ocean heat wave in the Northwest Atlantic. Oceanography 26, 191–195. doi: 10.5670/oceanog.2013.27
Miyamoto H., Vijai D., Kidokoro H., Tadokoro K., Watanabe T., Fuji T., et al. (2020). Geographic variation in feeding of Pacific saury Cololabis saira in June and July in the North Pacific Ocean. Fisheries Oceanogr. 29, 558–571. doi: 10.1111/fog.12495
Morgan C. A., Beckman B. R., Weitkamp L. A., and Fresh K. L. (2019). Recent ecosystem disturbance in the Northern California current. Fisheries 44, 465–474. doi: 10.1002/fsh.10273
Morgan C. A., De Robertis A., and Zabel R. W. (2005). Columbia River plume fronts. I. Hydrography, zooplankton distribution, and community composition. Mar. Ecol. Prog. Ser. 299, 19–31. doi: 10.3354/meps299019
Mumm N. (1991). Zur sommerlichen Verteilung des Mesozooplanktons im Nansen-Becken, Nordpolarmeer (On the summerly distribution of mesozooplankton in the Nansen Basin, Arctic Ocean) Vol. 92 (Berichte zur Polarforschung (Reports on Polar Research), 146.
Nakamura A., Matsuno K., Abe Y., Shimada H., and Yamaguchi A. (2017). Length-weight relationships and chemical composition of the dominant mesozooplankton taxa/species in the subarctic Pacific, with special reference to the effect of lipid accumulation in Copepoda. Zoological Stud. 56, e13. doi: 10.6620/ZS.2017.56-13
Nielsen J. M., Rogers L. A., Brodeur R. D., Thompson A. R., Auth T. D., Deary A. L., et al. (2021). Responses of ichthyoplankton assemblages to the recent marine heatwave and previous climate fluctuations in several Northeast Pacific marine ecosystems. Global Change Biol. 27, 506–520. doi: 10.1111/gcb.15415
O’Connell C. P. (1953). The life history of the cabezon, Scorpaenichthys marmoratus (Ayres) Vol. 93 (State of California Department of Fish and Game Marine Fisheries Branch Fish Bulletin), 76.
Ofelio C., Moyano M., Sswat M., Rioual F., Moullec F., Aguirre-Velarde A., et al. (2023). Temperature and prey density drive growth and otolith formation of the world’s most valuable fish stock. Sci. Rep. 13, 16001. doi: 10.1038/s41598-023-43168-w
Ohman M. D. (1990). The demographic benefits of diel vertical migration by zooplankton. Ecol. Monogr. 60, 257–281. doi: 10.2307/1943058
Oliver E. C., Benthuysen J. A., Darmaraki S., Donat M. G., Hobday A. J., Holbrook N. J., et al. (2021). Marine heatwaves. Annu. Rev. Mar. Sci. 13, 313–342. doi: 10.1146/annurev-marine-032720-095144
Oliver E. C., Burrows M. T., Donat M. G., Sen Gupta A., Alexander L. V., Prekins-Kirkpatrick S. E., et al. (2019). Projected marine heatwaves in the 21st century and the potential for ecological impact. Fronteris Mar. Sci. 6, 734. doi: 10.3389/fmars.2019.00734
Oliver E. C., Donat M. G., Burrows M. T., Moore P. J., Smale D. A., Alexander L. V., et al. (2018). Longer and more frequent marine heatwaves over the past century. Nat. Commun. 9, 1–12. doi: 10.1038/s41467-018-03732-9
Onikura N., Takeshita N., Matsui S., and Kimura S. (2004). Age, growth and hatching dates based on otolith increments of larvae and juveniles of the roughskin sculpin Trachidermus fasciatus (Scorpaeniformes: Cottidae) in Ariake Bay, Kyushu Island, Japan. Aquaculture Sci. 52, 375–379.
Ottmann D., Grorud-Colvert K., Huntington B., and Sponaugle S. (2018). Interannual and regional variability in settlement of groundfishes to protected and fished nearshore waters of Oregon, USA. Mar. Ecol. Prog. Ser. 598, 131–145. doi: 10.3354/meps12616
Pan T.-C. F., Applebaum S. L., Lentz B. A., and Manahan D. T. (2016). Predicting phenotypic variation in growth and metabolism of marine invertebrate larvae. J. Exp. Mar. Biol. Ecol. 483, 64–73. doi: 10.1016/j.jembe.2016.06.006
Peterman R. M. and Bradford M. J. (1987). Wind speed and mortality rate of a marine fish, the northern anchovy (Engraulis mordax). Science 235, 354–356. doi: 10.1126/science.235.4786.354
Peterson W. T., Fisher J. L., Strub P. T., Du X., Risien C., Peterson J., et al. (2017). The pelagic ecosystem in the Northern California Current off Oregon during the 2014–2016 warm anomalies within the context of the past 20 years. J. Geophysical Research: Oceans 122, 7267–7290. doi: 10.1002/2017JC012952
Phillips E. M., Chu D., Gauthier S., Parker-Stetter S. L., Shelton A. O., and Thomas R. E. (2022). Spatiotemporal variability of euphausiids in the California Current Ecosystem: insights from a recently developed time series. ICES J. Mar. Sci. 79, 1312–1326. doi: 10.1093/icesjms/fsac055
Piatt J. F., Parrish J. K., Renner H. M., Schoen S. K., Jones T. T., Arimitsu M. L., et al. (2020). Extreme mortality and reproductive failure of common murres resulting from the northeast Pacific marine heatwave of 2014-2016. PloS One 15, e0226087. doi: 10.1371/journal.pone.0226087
Pinsky M. L., Selden R. L., and Kitchel Z. J. (2020). Climate-driven shifts in marine species ranges: Scaling from organisms to communities. Annu. Rev. Mar. Sci. 12, 153–179. doi: 10.1146/annurev-marine-010419-010916
Purcell J. E., Sturdevant M. V., and Galt C. P. (2005). “A review of appendicularians as prey of invertebrate and fish predators,” in Response of Marine Ecosystems to Global Changes: Ecological Impact of Appendicularians (Contemporary Publishing International), 359–435.
Robert D., Castonguay M., and Fortier L. (2009). Effects of preferred prey density and temperature on feeding success and recent growth in larval mackerel of the southern Gulf of St. Lawrence. Mar. Ecol. Prog. Ser. 377, 227–237. doi: 10.3354/meps07833
Robert D., Murphy H. M., Jenkins G. P., and Fortier L. (2014). Poor taxonomical knowledge of larval fish prey preference is impeding our ability to assess the existence of a “critical period” driving year-class strength. ICES J. Mar. Sci. 71, 2042–2052. doi: 10.1093/icesjms/fst198
Robertson R. R. and Bjorkstedt E. P. (2020). Climate-driven variability in Euphausia pacifica size distributions off northern California. Prog. Oceanogr. 188, 102412. doi: 10.1016/j.pocean.2020.102412
Rodomsky B. T., Calavan T. R., and Lomeli K. C. (2018). The Oregon commercial nearshore fishery update (Oregon Department of Fish and Wildlife Management Marine Resources Program), 51.
Rogers-Bennett L. and Catton C. A. (2019). Marine heat wave and multiple stressors tip bull kelp forest to sea urchin barrens. Sci. Rep. 9, 15050. doi: 10.1038/s41598-019-51114-y
Rothschild B. J. and Osborn T. R. (1988). Small-scale turbulence and plankton contact rates. J. Plankton Res. 10, 465–474. doi: 10.1093/plankt/10.3.465
Roy C., Cury P., and Kifani S. (1992). Pelagic fish recruitment success and reproductive strategy in upwelling areas: environmental compromises. South Afr. J. Mar. Sci. 12, 135–146. doi: 10.2989/02577619209504697
Satapoomin S. (1999). Zooplankton community in Kapur mangrove canal, Ranong province. Phuket Mar. Biol. Center Res. Bull. 62, 33–56.
Schlegel R. W. and Smit A. J. (2018). heatwaveR: A central algorithm for the detection of heatwaves and cold-spells. J. Open Source Software 3, 821. doi: 10.21105/joss.00821
Shanks A. L. and Eckert G. L. (2005). Population persistence of California Current fishes and benthic crustaceans: a marine drift paradox. Ecol. Monogr. 75, 505–524. doi: 10.1890/05-0309
Shanks A. L., Rasmuson L. K., Valley J. R., Jarvis M. A., Salant C., Sutherland D. A., et al. (2020). Marine heat waves, climate change, and failed spawning by coastal invertebrates. Limnol. Oceanogr. 65, 627–636. doi: 10.1002/lno.11331
Shelley C. E. and Johnson D. W. (2022). Larval fish in a warming ocean: a bioenergetic study of temperature-dependent growth and assimilation efficiency. Mar. Ecol. Prog. Ser. 691, 97–114. doi: 10.3354/meps14057
Shenker J. M. (1988). Oceanographic associations of neustonic larval and juvenile fishes and Dungeness crab megalopae off Oregon. Fisheries Bull. US 86, 299–317.
Shroeder I. D., Black B. A., Sydeman W. J., Bograd S. J., Hazed E. L., Santora J. A., et al. (2013). The North Pacific High and wintertime pre-conditioning of California current productivity. Geophysical Res. Lett. 40, 541–546. doi: 10.1002/grl.50100
Smale D. A., Wernberg T., Oliver E. C., Thomsen M., Harvey B. P., Straub S. C., et al. (2019). Marine heatwaves threaten global biodiversity and the provision of ecosystem services. Nat. Climate Change 9, 306–312. doi: 10.1038/s41558-019-0412-1
Sogard S. M. (2011). Interannual variability in growth rates of early juvenile sablefish and the role of environmental factors. Bull. Mar. Sci. 87, 857–872. doi: 10.5343/bms.2010.1045
Spitz Y. H., Allen J. S., and Gan J. (2005). Modeling of ecosystem processes on the Oregon shelf during the 2001 summer upwelling. J. Geophysical Res. 110, C10S17. doi: 10.1029/2005JC002870
Sponaugle S., Grorud-Colvert K., and Pinkard D. (2006). Temperature-mediated variation in early life history traits and recruitment success of the coral reef fish Thalassoma bifasciatum in the Florida Keys. Mar. Ecol. Prog. Ser. 308, 1–15. doi: 10.3354/meps308001
Sponaugle S., Llopiz J. K., Havel L. N., and Rankin T. L. (2009). Spatial variation in larval growth and gut fullness in a coral reef fish. Mar. Ecol. Prog. Ser. 383, 239–249. doi: 10.3354/meps07988
Sponaugle S., Walter K. D., Denit K. L., Llopiz J. K., and Cowen R. K. (2010). Variation in pelagic larval growth of Atlantic billfishes: the role of prey composition and selective mortality. Mar. Biol. 157, 839–849. doi: 10.1007/s00227-009-1366-z
Starko S., Epstein G., Chalifour L., Bruce K., Buzzoni D., Csordas M., et al. (2025). Ecological responses to extreme climatic events: a systematic review of the 2014–2016 Northeast Pacific marine heatwave. Oceanogr. Mar. Biol. Annu. Rev. 63.
Swalethorp R., Kjellerup S., Malanski E., Munk P., and Nielsen T. G. (2014). Feeding opportunities of larval and juvenile cod (Gadus morhua) in a Greenlandic fjord: temporal and spatial linkages between cod and their preferred prey. Mar. Biol. 161, 2831–2846. doi: 10.1007/s00227-014-2549-9
Swieca K., Sponaugle S., Schmid M. S., Ivory J., Corrales-Ugalde M., Sutherland K., et al. (2023). Growth and diet of a larval myctophid across distinct upwelling regimes in the California Current. ICES J. Mar. Sci. 80, 1431–1446. doi: 10.1093/icesjms/fsad070
Thompson A. R., Ben-Aderet N. J., Bowlin N. J., Kacev D., Swalethorp R., and Watson W. (2022). Putting the Pacific marine heatwave into perspective: The response of larval fish off southern California to unprecedented warming in 2014–2016 relative to the previous 65 years. Global Change Biol. 28, 1766–1785. doi: 10.1111/gcb.16010
Thompson A. R., Schroeder I. D., Bograd S. J., Hazen E. L., Jacox M. G., Leising A., et al. (2019). State of the California current 2018-19: a novel anchovy regime and a new marine heat wave? California Cooperative Oceanic Fisheries Investigations Data Rep. 60, 1–65.
Tomaro L. M., Teel D. J., Peterson W. T., and Miller J. A. (2012). When is bigger better? Early marine residence of middle and upper Columbia River spring Chinook salmon. Mar. Ecol. Prog. Ser. 452, 237–252. doi: 10.3354/meps09620
Uye S. (1982). Length-weight relationships of important zooplankton from the inland Sea of Japan. J. Oceanographic Soc. Japan 38, 149–158. doi: 10.1007/BF02110286
Walker H. J. Jr., Hastings P. A., Hyde J. R., Lea R. N., Snodgrass O. E., and Bellquist L. F. (2020). Unusual occurrences of fishes in the Southern California Current System during the warm water period of 2014–2018. Estuarine Coast. Shelf Sci. 236, 106634. doi: 10.1016/j.ecss.2020.106634
Webber M. K. and Roff J. C. (1995). Annual biomass and production of the oceanic copepod community off Discovery Bay, Jamaica. Mar. Biol. 123, 481–495. doi: 10.1007/BF00349227
Weber E. D., Auth T. D., Baumann-Pickering S., Baumgartner T. R., Bjorkstedt E. P., Bograd S. J., et al. (2021). State of the California Current 2019–2020: Back to the future with marine heatwaves? Front. Mar. Sci. 8, 709454. doi: 10.3389/fmars.2021.709454
Wernberg T., Smale D. A., Tuya F., Thomsen M. S., Langlois T. J., De Bettignies T., et al. (2013). An extreme climatic event alters marine ecosystem structure in a global biodiversity hotspot. Nat. Climate Change 3, 78–82. doi: 10.1038/nclimate1627
Whitney J. L., Gove J. M., McManus M. A., Smith K. A., Lecky J., Neubauer P., et al. (2021). Surface slicks are pelagic nurseries for diverse ocean fauna. Sci. Rep. 11, 1–18. doi: 10.1038/s41598-021-81407-0
Wilson M. N., Sponaugle S., and Grorud-Colvert K. (2023). Testing assumptions underlying cabezon (Scorpaenichthys marmoratus) otolith microstructure analysis using wild-caught juveniles and opportunistic rearing of eggs and larvae. J. Fish Biol. 102, 1088–1095. doi: 10.1111/jfb.15364
Wood S. N. (2017). Generalized Additive Models: An Introduction with R (1st ed.). (Chapman and Hall/CRC), 496.
Yasuda F. (1960). The feeding mechanisms in some carnivorous fish. Records Oceanographic Works Japan 5, 153–160.
Zeman S. M., Brodeur R. D., Daly E. A., and Sutherland K. R. (2016). Prey selection patterns of Chrysaora fuscescens in the northern California Current. J. Plankton Res. 38, 1433–1443. doi: 10.1093/plankt/fbw065
Zeman S. M., Corrales-Ugalde M., Brodeur R. D., and Sutherland K. R. (2018). Trophic ecology of the neustonic cnidarian Velella velella in the northern California Current during an extensive bloom year: insights from gut contents and stable isotope analysis. Mar. Biol. 165, 150. doi: 10.1007/s00227-018-3404
Keywords: otoliths, Northern California Current, marine heatwave, Cottidae, Pacific groundfish, larval fish growth, plankton
Citation: Wilson MN, Brodeur RD, Auth TD, Roegner GC, Morgan CA, Zeman SM and Sponaugle S (2025) A tale of two heatwaves: variable daily growth and a broad diet enable neustonic larval cabezon to thrive during warm oceanic conditions. Front. Mar. Sci. 12:1569581. doi: 10.3389/fmars.2025.1569581
Received: 01 February 2025; Accepted: 11 June 2025;
Published: 29 July 2025.
Edited by:
Dilip Kumar Jha, National Institute of Ocean Technology, IndiaReviewed by:
David W. Ginsburg, University of Southern California, United StatesRaj Kiran Lakra, Atal Center for Ocean Science and Technology for Islands-National Institute of Ocean Technology, India
Copyright © 2025 Wilson, Brodeur, Auth, Roegner, Morgan, Zeman and Sponaugle. This is an open-access article distributed under the terms of the Creative Commons Attribution License (CC BY). The use, distribution or reproduction in other forums is permitted, provided the original author(s) and the copyright owner(s) are credited and that the original publication in this journal is cited, in accordance with accepted academic practice. No use, distribution or reproduction is permitted which does not comply with these terms.
*Correspondence: Megan N. Wilson, bWVnYW4ud2lsc29uQHBzcC53YS5nb3Y=