Abstract
Mangrove nurseries are crucial for fishery production, supplying energy and nutrients via leaf organic matter in food webs. Recent stable isotope studies emphasize the nutritional value of mangrove detritus, especially for leaf-eating crabs, while algae remain important for other consumers in the ecosystem. In the Galapagos Islands, protected shorelines with mature mangrove forests may significantly contribute to secondary production. In this study, we measured carbon (δ¹³C) and nitrogen (δ¹5N) stable isotope ratios from primary producers (e.g., mangroves, epiphytes, benthic algae), coastal sediments, and consumers (including fish larvae, epibenthic, and zooplanktonic crustaceans). We used Bayesian mixing models to assess the relative importance of food sources across six protected shorelines on Santa Cruz and Isabela Islands, representing different biogeographic origins. We also examined environmental drivers and habitat conditions influencing spatial variation in resource partitioning among consumers. Our results reveal distinct dietary patterns: ‘δ¹³C-depleted’ consumers (e.g., crab larvae, post-flexion fish larvae) relied heavily on mangroves and epiphytes, with terrestrial inputs exceeding 25%; whereas ‘δ¹³C-enriched’ consumers (e.g., polychaetes, caridean shrimps) primarily fed on microphytobenthos, macroalgae, and ¹³C-rich organic matter, with terrestrial inputs < 25%. Opportunistic feeding is suggested for fishery-related taxa, such as spiny lobster larvae. Turbidity and nitrate concentration emerged as key drivers of resource partitioning, with spatial patterns more distinct within islands than between them. These results highlight the dominant role of local hydrophysical conditions and water quality in shaping mangrove nursery functions, surpassing the influence of broader regional factors. Our study also underscores the importance of internal nutrient recycling—particularly mediated by larval crabs—in sustaining early life stages of fish and other mid-trophic species. These findings call for a deeper understanding of how habitat conditions and environmental variability influence food availability at both local and regional scales.
1 Introduction
Mangrove ecosystems are prevalent across tropical and subtropical regions, providing habitat, shelter and food to numerous organisms, including many species of fishery relevance (Nagelkerken et al., 2008; Hogarth, 2015). These ecosystems offer multiple services that benefit fishery activities, such as food and raw materials, wave attenuation, and enhancement of the well-being of coastal communities reliant on nearshore resources (Barbier et al., 2011; Lee et al., 2014; Benzeev et al., 2017). However, the primary scientific focus has been on the role of mangroves as nursery habitats for fish (Beck et al., 2001; Nagelkerken et al., 2010; Igulu et al., 2014; Whitfield, 2017). Several hypotheses have been proposed to explain the attractiveness of mangroves for juvenile fauna (Nagelkerken and Faunce, 2008). Nursery function may be derived from the higher abundance of food relative to other less structured habitats (e.g., sublittoral soft bottoms), mangrove litter and detritus constituting an important part of the diet of post-settlement fish larvae (i.e., ‘food availability’ hypothesis; Laegdsgaard and Johnson, 1995; Jennerjahn and Ittekkot, 2002; Verweij et al., 2006). Alternatively, the advantages that mangroves confer may also reside in a reduced predation risk and the provision of shelter from physical disturbance (Verweij et al., 2006; Rooker et al., 2018). These perspectives are not necessarily mutually exclusive. More recent explanations, such as the ‘seascape nursery’ concept proposed by Nagelkerken et al. (2015), provide a more comprehensive evaluation of the role of habitats throughout early life stages and incorporate the significance of movement corridors linking hotspots of nekton abundance and productivity (Litvin et al., 2018).
Early stable isotope studies suggested that mangrove-derived carbon played a minor role in aquatic food webs, with other primary producers—such as phytoplankton, benthic algae, seagrass leaves, and mangrove epiphytes—considered the primary energy sources for fishery production (Hsieh et al., 2002; Kieckbusch et al., 2004). However, recent research, particularly on leaf-eating crabs (e.g., Sesarmidae and Ucididae families), has challenged this view, showing that these consumers assimilate significant amounts of mangrove detritus, underscoring the importance of mangrove carbon as both a dietary energy source and a contributor to higher trophic levels (TLs; Werry and Lee, 2005; Bui and Lee, 2014; Kristensen et al., 2017; Medina-Contreras et al., 2024).
Disagreement regarding mangroves as nursery grounds is partly due to the use of traditional trophic enrichment factors (TEFs) in mixing models (e.g., Post, 2002; McCutchan et al., 2003), which tend to underestimate mangrove carbon’s contribution—particularly for leaf-eating crabs, which show higher fractionation values than expected (Bui and Lee, 2014). The complexity of mangrove ecosystems, shaped by biotic, abiotic, and spatial factors (Ewel et al., 1998; Blaber, 2007), further complicates the issue. Feeding preferences and strategies vary across and within species. Ontogenic dietary changes are particularly notable in many species that rely on the mangrove-seagrass-reef continuum (Cocheret de la Morinière et al., 2003; Kimirei et al., 2013). For example, penaeid shrimp rely on mangrove carbon during early life stages but shift to other sources in other habitats as adults (Mohan et al., 1997). Additionally, spatial variation driven by mangrove forest typology, coastal geomorphology, and habitat configuration affects the availability and role of carbon sources in food webs (Faunce and Layman, 2009).
The Galapagos Islands represent the westernmost archipelago with native mangrove forests in the Americas and the Tropical Eastern Pacific (TEP). Mangroves in the Galapagos predominantly grow as vertically underdeveloped fringe vegetation along the coast (Wium-Andersen and Hamann, 1986), characterized by a terrigenous sedimentary setting, meaning they are dominated by minerogenic sedimentation from terrestrial sources (Worthington et al., 2020). Well-developed mangrove forests are limited to a few scattered bays and other protected shorelines, primarily in the central and western islands (Moity and Delgado, 2018; Moity et al., 2019). Due to strict protective measures implemented since 1959, including bans on logging and shrimp farming, Galapagos mangroves remain close to a pristine state (Moity et al., 2019). The establishment of the Galapagos Marine Reserve (GMR) in 1998 further enhanced protection by banning industrial fishing and allowing only licensed artisanal fishers to operate in 99% of the GMR’s designated waters, following a customary zoning scheme (Heylings et al., 2002; Moity, 2018). In some mangrove areas, fishing activities target specific species, such as mullets, and are also used to capture bait species and provide resting areas for shade (Pontón-Cevallos et al., 2022). Given the absence or reduction of alternative potential nursery habitats, such as seagrass beds, coral reefs, and salt marshes, mangroves are crucial in ensuring nursery functions. They support species that are important for both fisheries (Fierro-Arcos et al., 2021; Plumlee et al., 2022; Aguaiza et al., 2024) and tourism (Chiriboga-Paredes et al., 2022).
However, the extent to which mangrove-derived organic matter sustains the early life stages of these species remains unknown. Neither its nutritional role for the prey of these species, nor for other planktonic (e.g., brachyuran crab larvae) and epibenthic consumers (e.g., amphipods), has been clarified. Given the significant regional (i.e., among marine bioregions/islands; Edgar et al., 2004; Fierro-Arcos et al., 2021; Aguaiza et al., 2024) and local variability (i.e., within islands; Moity et al., 2019; Llerena-Martillo et al., 2018) in both biotic and abiotic components of the ecosystem, it is likely that isotopic baselines, as well as consumer resource preferences and dependencies, also vary across these scales. Stable isotope analysis (SIA) can be a suitable approach to enhance our understanding of the mechanisms and variability of the mangrove nursery role in the Galapagos. Carbon and nitrogen stable isotope measurements have been widely used to trace the fate of organic matter in coastal food webs worldwide, including in mangrove ecosystems (e.g., Rodelli et al., 1984; Bouillon et al., 2007; Abrantes et al., 2015; Then et al., 2021). These tracers offer significant advantages over traditional gut content analysis, particularly since the diets of small organisms and larvae are difficult to visually quantify (Lee, 1999).
This study aimed to: (1) evaluate the contribution of mangrove-derived organic matter to local food webs in protected coastal environments using stable isotopes of carbon and nitrogen, and (2) identify environmental drivers shaping spatial variation in resource partitioning across six habitats with distinct biogeographic origins. While the role of mangrove detritus in larval stages is largely underexplored, recent studies recognizing its importance for taxa like leaf-eating crabs suggest it plays a key role in local food webs (see above). The second objective also aims to clarify whether regional (between-island) or local (within-island) factors influence spatial variability in nursery function. We hypothesize that sheltered shorelines enhance nursery potential by promoting the retention and internal cycling of mangrove-derived organic matter, emphasizing the influence of local factors.
Though mangroves in the TEP region are known as critical nursery grounds for fish (Aburto-Oropeza et al., 2008; Castellanos-Galindo et al., 2013), most studies focus on estuarine or deltaic forests, which differ from oceanic fringe mangroves in community composition and trophodynamics. Given the unique conditions of the Galapagos Archipelago, our study offers new insights into the role of mangroves as nursery grounds in this region. By addressing these dynamics, our results provide perspectives that could refine or expand the ‘food availability’ hypothesis for mangrove nursery functions at larger scales, including the TEP region and globally.
2 Materials and methods
2.1 Study area
The Galapagos Archipelago is located in the TEP, approximately 1000 km off the coast of Ecuador (Snell et al., 1996). The climate oscillates between a cool-dry (June to November) and a warm-wet season (December to May), influenced by the confluence of three dominant oceanic currents: the Panama, Humboldt, and Cromwell currents. This unique oceanographic setting supports the coexistence of tropical, temperate, and Southern Ocean species in the waters surrounding the islands (Wellington, 1975). The archipelago is also subject to El Niño Southern Oscillation (ENSO) events, which can disrupt the productivity and dynamics of marine and coastal ecosystems (Sweet et al., 2007; Dueñas et al., 2021). Mangrove forests cover approximately 35% of the coastline and consist of four species: red mangrove (Rhizophora mangle), white mangrove (Laguncularia racemosa), black mangrove (Avicennia germinans), and button mangrove (Conocarpus erectus; Wium-Andersen and Hamann, 1986; Moity et al., 2019). About 85% of these mangrove patches are less than 0.5 hectares in size and are naturally stunted due to wave exposure, dry climate, and the absence of permanent estuaries and rivers (Moity et al., 2019). However, in some protected coastal configurations, particularly in the geologically younger western islands of Isabela and Fernandina, mangrove trees can grow up to 25 meters high, forming lush vegetation (Wium-Andersen and Hamann, 1986; Moity et al., 2019). Notably, 90% of the mangrove forests are concentrated in the Western and Central-Southeastern (CSE) bioregions (sensuMoity, 2019).
In our study area, we explored a diverse array of biota—including fish larvae, small mobile invertebrates, autotrophic producers, and organic matter—across six mangrove sites located along sheltered shorelines, such as small bays, coastal lagoons, and tidal creeks.
These sites were distributed between two islands, each representing distinct bioregions: Isabela (Western; N = 2) and Santa Cruz (CSE; N = 4; Figure 1). While increasing the number of sites on the western coast of Isabela and Fernandina would have enhanced regional contrasts, our study focused primarily on evaluating local habitat differences rather than broader variability across the archipelago. Thus, our study design considered both regional variation and the greater presumed importance of local variation. Despite similar climatic conditions across all sites (mean annual temperature ≈ 22°C, precipitation ≈ 1150 mm; UEA Climatic Research Unit (UEACRU) et al., 2021), our sampling locations were chosen to encompass diverse geomorphological settings. These include open and half-open bays with varying length-to-width ratios, as well as specific habitat configurations such as the vertical structure of mangrove patches/forests, identity and composition of mangrove species, and bottom type (Supplementary Table 1; Supplementary Figure 1). These factors contribute significantly to variations in tidal hydrodynamics and overall physical-chemical conditions in water.
Figure 1
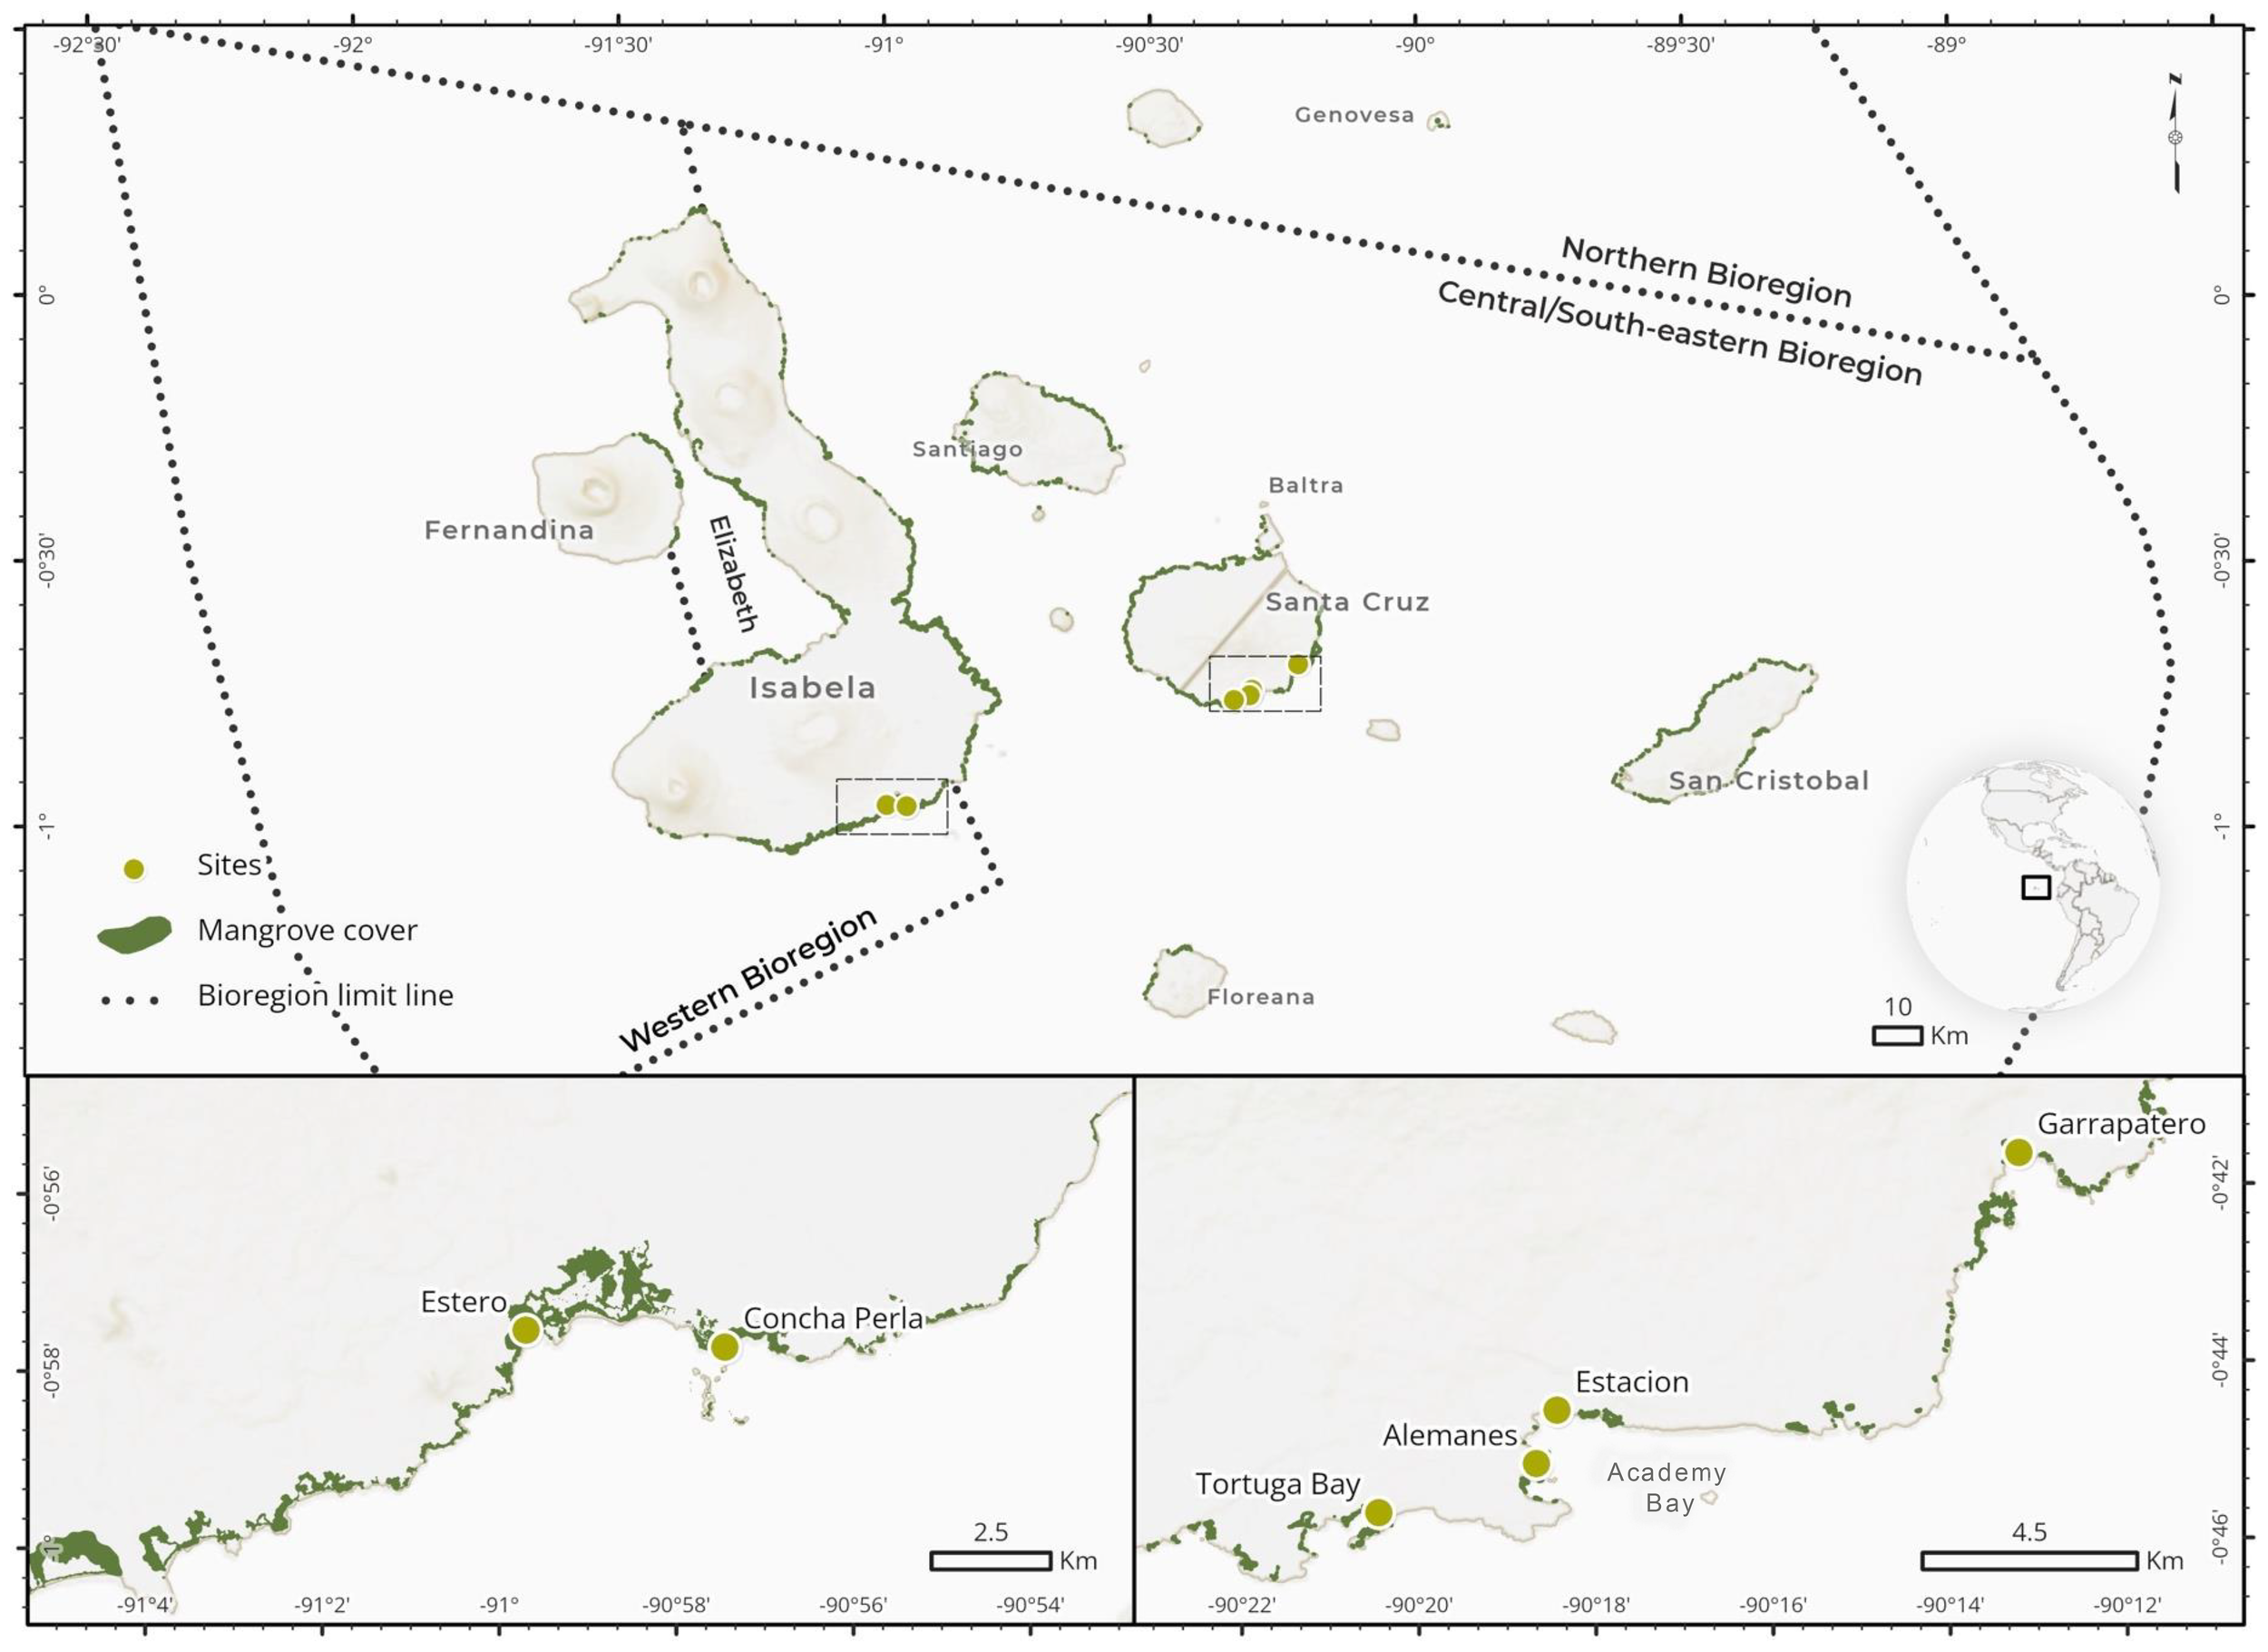
Upper panel. Geographic position of the Galapagos Islands, marine bioregions (sensuMoity, 2019) and mangrove cover (as mapped in Moity et al., 2019). Lower panels. Sampling locations (‘sites’) were in the intertidal waters of mangrove-fringed, protected shorelines, including bays, coastal lagoons, and tidal creeks. These sites were situated in Isabela (N = 2; Western bioregion; left) and Santa Cruz (N = 4; Central South-Eastern bioregion; right), with two sites located within Academy Bay in the latter island.
In Santa Cruz, sites like Estacion and Alemanes are situated within the broader open bay of Academy Bay, which encompasses smaller bays and lagoons (Figure 1; Supplementary Figure 1). With the exception of Estero, the predominant substrate across these sites consists of rocky littoral and sublittoral areas interspersed with patches of sand and mangrove vegetation. Estero, along with bays like Garrapatero and Tortuga Bay, features muddy substrates near the root systems (Supplementary Table 1; Supplementary Figure 1), characterized by fine sediment particles (< 250 μm). In contrast, other habitats have coarser sediment (250 μm - 1 mm) with minimal organic matter content.
The most prevalent mangrove species across all sites was R. mangle, while L. racemosa was exclusive to Santa Cruz sites. Within this island, A. germinans was found only in Garrapatero and Tortuga Bay, whereas C. erectus exclusively occurred in the latter site (Supplementary Table 1), as a result of a mangrove restoration effort by the Galapagos National Park Directorate (Moity, N., pers. comm.). Benthic, floating, and epiphytic macroalgae (growing on mangrove roots and trunks) were abundant across all habitats. However, in locations such as Tortuga Bay, Alemanes, and Concha Perla, a greater diversity of algal morphotypes and taxa was observed, likely due to the increased structural complexity of the rocky littoral and sublittoral zones in these areas. In contrast, Estacion was characterized by a limited number of macroalgal species, though these were highly abundant, predominantly consisting of filamentous algae. Conversely, microphytobenthos (MPB) mats were more visibly abundant along the shallow sandy shores of Garrapatero and Estero. While coastal plants other than mangroves, such as Opuntia cacti, were present at some sites, they were less prevalent than mangrove trees and were not considered significant sources for this study. The shrub Hibiscus tiliaceus was notably abundant along the shoreline in Estero, with numerous decaying leaves observed on the water surface.
Despite being largely unmodified due to their protected status, the two sites in Academy Bay (Santa Cruz), as well as Concha Perla (Isabela), show signs of habitat degradation, pollution and disturbance, owing to their proximity to urban centers in both islands (Fernández, 2008; Liu and d’Ozouville, 2013; Martin et al., 2015). Conversely, Tortuga Bay (Santa Cruz) and Estero (Isabela), located within park boundaries and under strict administration, experience minimal impacts from tourism, while Garrapatero (Santa Cruz) also faces occasional disturbances from subsistence fisheries (pers. obs.; Supplementary Table 1).
2.2 Stable isotopes analysis
2.2.1 Sample collection
Primary producers, organic matter, and consumers were sampled twice for SIA at each of the six sites, except at Estacion, which was sampled only once. Sampling was carried out during the cool season, between October 22th and November 28th, 2019. At each site, the two sampling events were scheduled to coincide with contrasting tidal phases—neap tides (around the third-quarter moon) and spring tides (around the new moon)—within the overall sampling period, which allowed us to capture the trophodynamics of mangrove communities effectively.
Samples from the four mangrove species were collected, including fresh young (green), senescent (yellow), and decaying (brown) leaves. Fresh leaves of the coastal shrub H. tiliaceus were also collected in one site (Estero). Algal sources were categorized into various functional/taxonomic groups: benthic fleshy macroalgae (e.g., Ulva sp., Dictyota sp.), red algae (e.g., Ahnfeltia svensonii), floating fleshy seaweed (e.g., Sargassum spp.), filamentous algae/algal turfs (e.g., green and brown macro- and microalgae, cyanobacteria), epiphytic algae from mangrove roots/trunks, and MPB (Table 1). Additionally, suspended particulate organic matter (POM), including phytoplankton, was sampled at 0.5 m depth. Sedimentary organic matter (SOM) samples at the intertidal zone were collected using a PVC tube corer (30 mm int. diam.; 10 cm length). Notably, at Estero and Garrapatero, only one sample of POM and SOM could be collected due to specific conditions, whereas neither of the two was obtained at Concha Perla (see Supplementary Material Section 1.1.1.1 for detailed collection procedures).
Table 1
| Source (producer) | Species/taxon/description | N | δ13C (‰) | δ15N (‰) | C:N |
|---|---|---|---|---|---|
| Mangrove (leaves) | Young, senescent and decaying | 50 | -27.8 (1.3) | 9.2 (2.6) | 79.1 (36.9) |
| Red | Rhizophora mangle | 27 | -27.8 (1.2) | 8.9 (2.6) | 75.8 (36) |
| White | Laguncularia racemosa | 15 | -27.4 (1.5) | 9.4 (1.6) | 89.6 (43.4) |
| Black | Avicennia germinans | 5 | -29 (0.8) | 12.3 (1.7) | 66.2 (25.8) |
| Button | Conocarpus erectus | 3 | -27.6 (1.0) | 5.2 (0.1) | 77.3 (25.7) |
| Algae | Both macro and micro | 49 | -20 (4.2) | 8.4 (1.9) | 11.1 (4.8) |
| Floating seaweed | Brown (Sargassum spp.) | 8 | -19.5 (2.9) | 7.1 (1.2) | 18.4 (1.6) |
| Benthic fleshy macroalgae | Green (e.g., Ulva sp., Caulerpa racemosa) Brown (e.g., Dictyota sp., Colpomenia sinuosa) | 13 | -16.0 (2.2) | 8.9 (1.7) | 12.4 (4.9) |
| Benthic filamentous (algal turfs) | Green, brown, cyanobacteria | 15 | -19.4 (1.3) | 9.4 (1.5) | 8.3 (1.7) |
| Red algae (filamentous, fleshy) | Filamentous specimen poss. Hypnea musciformis (invasive) | 4 | -25.4 (4.7) | 8 (1.3) | 7.3 (1.1) |
| Epiphytes (roots/trunk) | Green, brown (e.g. Bostrychia sp.), cyanobacteria | 8 | -25.6 (3.1) | 8 (1.5) | 8.3 (1.9) |
| MPB | Unidentified | 1 | -20.9/-20.1* (2.5*) | 2.4* (1.2*) | NA |
| Coastal shrub (leaves) | Hibiscus tiliaceus | 2 | -29.6 (0.01) | 5.3 (0.1) | 36.7 (29.1) |
| POM | Includes phytoplankton | 9 | -16.1 (4.6) | 8.8 (0.5) | 12.1 (3.4) |
| SOM | 250 μm and 1 mm fractions | 17 | -18.1 (2.0) | 8.4 (1.1) | 4.5 (2.2) |
Mean (and standard deviation) of δ13C and δ15N values (‰) and C:N ratios of primary producers and suspended particulate (POM) and sedimentary organic matter (SOM) sampled in mangrove ecosystems of the Galapagos Islands.
MPB, microphytobenthos; N, number of samples; NA, value not available.
*Values taken from Medina-Contreras et al. (2023) and used in mixing models rather than the single observed value.
Post-settlement fish larvae and invertebrates (including zooplankton and epibenthos) were collected using WaterMark® quatrefoil light traps (Floyd et al., 1984; Secor et al., 1992; Supplementary Figure 2). This passive sampling method exploits the phototactic behavior of mobile fauna towards an artificial light source (Mueller and Neuhauss, 2010; McLeod and Costello, 2017). Each sampling night, three light traps were haphazardly deployed near the shore and adjacent to mangrove fringe sections, with a minimum distance of 50 m between traps. These traps were secured to the bottom and left deployed overnight for ca. 12 h (typically from 6 pm to 6 am). All fish and the most abundant invertebrate taxa across the three light traps were collected and categorized into 14 consumer categories for SIA (Table 2). Groups were defined by taxon and/or life stage and included various crustaceans (e.g., brachyuran larvae, amphipods, isopods, caridean shrimps), polychaetes, platyhelminths, and fish larvae. Smaller fish post-flexion larvae (N = 6) were grouped together due to their similar ecology and isotopic signatures (see Section 3.1.2), and to ensure adequate sample size for statistical modeling. They were analyzed separately from early juvenile Mugilids (presumably Mugil galapagensis; N = 2) and Gobiids (Bathygobius lineatus; N = 2; Table 2).
Table 2
| Consumer | Species/Taxon | N | δ13C (‰) | δ15N (‰) | C:N |
|---|---|---|---|---|---|
| Crustacea | 65 | -18.6 (3.0) | 8.6 (2.5) | 5.2 (1.5) | |
| Achelata (puerulus) | Palinurus sp. | 3 | -20.8 (0.7) | 7.6 (1.6) | 4 (0.5) |
| Amphipoda | e.g. Parhyalella sp., Stenopleura sp., Ampelisca sp. | 7 | -17.4 (1.7) | 9.2 (0.8) | 4.1 (0.2) |
| Brachyura (megalopa) | Grapsus grapsus | 6 | -22.4 (0.6) | 6.1 (2.3) | 5.2 (0.4) |
| Brachyura (zoea) | e.g., Grapsus grapsus, Callinectes sp., Portunus sp., Carcinus sp. | 4 | -22.3 (0.7) | 5.4 (1.2) | 5.3 (0.8) |
| Caridea | Palaemon sp. | 9 | -15.7 (2.2) | 11.5 (1.4) | 3.7 (0.3) |
| Copepoda | e.g., Caligus sp., Acartia sp., Paracalanus sp. | 1 | -21.1 | 9.4 | 4.3 |
| Cumacea | Bodotria sp., Psudocuma sp., Campylaspis sp. | 8 | -19.4 (1.4) | 9.1 (1.5) | 5.7 (0.9) |
| Isopoda | e.g., Aega sp., Armadillidium sp., Eurydice sp. | 25 | -18.1 (3.0) | 8.4 (2.7) | 6 (1.7) |
| Ostracoda | Conchoecia sp. | 2 | -16.4 (2.3) | 9.6 (1.1) | 6.9 |
| Fish | 10 | -19.9 (2.5) | 7.2 (2.8) | 3.9 (0.4) | |
| Fish (post-flexion larvae) | e.g., Sparidae, Gerreidae, Gobiidae | 6 | -21.3 (0.4) | 6.4 (0.9) | 4.1 (0.4) |
| Gobiidae (juvenile) | Bathygobius lineatus | 2 | -15.3 (0.1) | 12.2 (0.3) | 3.6 (0.1) |
| Mugilidae (juvenile) | Mugil sp.* | 2 | -20.5 (0.6) | 4.8 (0.8) | 3.7 (0.1) |
| Platyhelminthes | Turbellaria | 1 | -17.9 | 7.5 | 3.9 |
| Polychaeta | Errantia | 9 | -13.4 (2.0) | 11.5 (1.1) | 4.5 (0.5) |
Mean (and standard deviation) of δ13C and δ15N values (‰) and C:N ratios of fish larval stages, zooplankton and other benthic consumers sampled in mangrove ecosystems of the Galapagos Islands.
*Presumably Mugil galapagensis.
N, number of samples.
At each sampling event, small invertebrates were grouped from 5–15 individuals depending on size, to obtain sufficient biomass for SIA. For caridean (Palaemon sp.) shrimps, 2–3 similarly sized individuals were combined per sample. Fish larvae and platyhelminths were processed individually to preserve isotopic resolution. Samples were stored in a cooler box and transported within two hours to the laboratory at the Charles Darwin Research Station in the Galapagos Islands (see Supplementary Material Section 1.1.1.2 for detailed collection procedures).
2.2.2 Laboratory procedures
Upon arrival at the laboratory, all samples of mangrove and H. tiliaceus leaves, macroalgae and consumers underwent a thorough cleaning process with saline water to remove any adhering debris. For MPB samples, primarily composed of diatoms, cells were isolated from mud using positive phototaxis. This method involved placing a piece of cloth and a glass slide on the surface of the mud samples, allowing the algae to migrate upwards towards the light (Eaton and Moss, 1966). Water samples containing suspended POM were processed through glass fiber filters (Whatman GF/F). Sediment samples were sieved sequentially through a 1 mm mesh followed by a finer 250 μm mesh to obtain two fractions of SOM in select sites. For caridean shrimps and fish larvae, gut contents were carefully removed to eliminate the potential confounding effect of recently ingested food during SIA. Caridean shrimps were also stripped from their exoskeletons, retaining only the soft tissue for analysis. All processed samples were stored frozen at -20°C and subsequently transported to the laboratories at Ghent University, Belgium. There, samples were dried at 50°C for 48h, homogenized (or powdered in the case of plant material) and stored under moisture-free conditions prior to detailed analysis. For further insights into laboratory procedures for producers, refer to the Supplementary Material Section 1.1.2.
2.2.3 Isotope analyses
All samples were subsampled for separate analyses of δ13C and δ15N. For δ13C analysis, the first step involved removing all inorganic carbonates from mangrove, macroalgae, MPB, SOM, and consumer samples (excluding fish, platyhelminths, polychaetes, and caridean shrimps). This was achieved by acidifying the material with drops of 5% HCl applied every hour, until no reaction was observed (Jaschinski et al., 2008). Acidified subsamples were dried (at 50°C for 48h) again and then carefully weighed (300-700 μg for most samples; 20–60 mg for SOM) into pre-muffled silver cups (Elemental Ltd; 5 x 3.5 mm size for most samples; 8.4 x 4 mm for SOM samples) at 500°C for 4h. For POM, samples were cut in half: one half was placed in a desiccator with 10% HCl fumes for 24 h to remove inorganic carbonates, the other half was not acidified and used for δ15N analysis. Subsamples of equivalent weights were placed into tin cups (Elemental Ltd, 5 x 3.5 mm) for δ15N analysis. Unlike δ13C analysis, no acidification was performed for δ15N samples to prevent potential 15N enrichment, as acidification can alter nitrogen isotopic ratios (Pinnegar and Polunin, 1999; Vafeiadou et al., 2013).
All samples underwent analysis using an isotope ratio mass spectrometer (IRMS; Thermo-Finnigan Delta V Advantage, Bremen, Germany) coupled to an elemental analyzer (Carlo Erba). Stable isotope ratios were expressed in standard delta (δ) notation (Fry, 2006):
where R = 13C/12C for carbon, and 15N/14N for nitrogen. The standard deviations for both δ13C and δ15N of the working standards were max 0.08‰.
2.3 Environmental variables
In this study, three types of environmental variables were assessed: spatial, water quality, and hydrological. Spatial variables, which relate to geographic positioning and mangrove forest/patch configuration, were determined for each of the six sites using sampling coordinates obtained from a Garmin eTrex 32x handheld GPS device. Specifically, total mangrove area (within a 500 m radius), mangrove fringe perimeter (within a 100 m radius), and the number of mangrove patches (within a 500 m radius) were calculated. These spatial metrics were derived using the base map developed by Moity et al. (2019) within ArcGIS Pro v.2.6.0 (Esri Inc, 2020).
Water quality variables were comprehensively measured either in situ or in the laboratory. A HI 9829 multiparameter probe (Hanna Instruments, USA) was utilized to record sea surface temperature (°C), conductivity (mS/cm), salinity, total dissolved solids (g/L), acidity (pH), dissolved oxygen (DO) concentration (mg/L) and saturation (%), and turbidity (NTU) during evening deployment and retrieval of light traps (N = 22). Additionally, seawater samples collected during light-trap deployments (N = 11) were carefully processed, preserved and stored in the Galapagos until analysis at the Center for Water and Sustainable Development (CADS)-ESPOL, in Guayaquil, Ecuador. Analytical procedures followed standard methods and included assessments of nutrients (ammonium, nitrite, nitrate, phosphate, total nitrogen (TN), total phosphorous), total suspended solids (TSS), and chlorophyll a concentrations (mg/L). However, only nitrite, nitrate, TN, and TSS yielded reliable values and were therefore retained for statistical analyses (see Section 2.4.3).
Hydrological variables, linked to tidal flow, were determined using a Sontek-IQ Plus flowmeter from Xylem Inc., USA, to measure horizontal flow velocity (m/s; ‘flow velocity’ hereafter) and depth (m) over 1.5 h during light-trap deployment (N = 11). The flowmeter, which also recorded sea bottom temperature (°C), was positioned perpendicular to the mangrove fringe and adjusted based on local salinity values to calculate flow velocity accurately. Although both flow velocity and depth can be influenced by tidal stages (i.e., high, low, ebb, flood) and regional oceanographic conditions, a previous study with up to seven replicates per site (unpub. data) demonstrated that spatial differences remained consistent despite temporal variations. Therefore, these measurements effectively represent the average sea-level velocity and depth near the shore or the middle of the tidal creek (in the case of Estero) during the study period (see detailed procedures in Supplementary Material Section 1.2).
2.4 Statistical analysis
2.4.1 Isotopic composition differences
All statistical analyses were performed using R (v.4.2.1; R Core Team, 2021). Differences in (dual) isotopic composition among sample groups were tested using permutational multivariate analysis of variance (PERMANOVA) with Euclidean distances (9,999 permutations; Anderson et al., 2008), implemented via the ‘adonis2’ function in the vegan package (v.2.6-2; Oksanen et al., 2022). When significant effects (p< 0.05) were found, we used the ‘betadisper’ function to perform a test for homogeneity of multivariate dispersions (PERMDISP; 9,999 permutations; Anderson, 2004) to assess whether observed differences were attributable to group location (centroids) or to differences in within-group dispersion. For significant interactions involving more than two levels, post-hoc pairwise tests were conducted using the ‘pairwise.adonis2’ function from the pairwiseAdonis package (Martínez-Arbizú, 2020) for PERMANOVA, or the ‘permutest’ (vegan) function for PERMDISP. Individual PERMANOVA tests were conducted and visualized in a two-dimensional Principal Coordinate Analysis (PCO) space to examine (dual) isotopic differences between: (1) mangrove samples (considering mangrove species and leaf life stages as fixed factors; Supplementary Table 3; Supplementary Figure 3); (2) sources (mangroves, macroalgal groups, POM, and SOM; Supplementary Table 4; Supplementary Figure 4); (3) consumers (Supplementary Table 5; Supplementary Figure 5); (4) source groups derived from different a posteriori aggregation options (see 2.4.2); and (5) islands and sites (within islands) for each source group independently. The PERMANOVA models incorporated various combinations of fixed, nested, and random effects (i.e., blocks within which permutations were constrained; see Supplementary Material Section 1.3.1).
2.4.2 Bayesian mixing models
The contribution of food sources to consumer diets was estimated with Bayesian mixing models, using the simmr package (v.0.4.5; Parnell, 2021). Simmr outputs, like other stable isotope mixing models, generate posterior probability distributions that indicate the likelihood of specific sources being part of a consumer’s diet, along with their credible intervals (Parnell et al., 2013). We incorporated TEFs of 1.76 ± 0.22‰ for δ13C and 2.22 ± 0.1‰ for δ15N from Schwamborn and Giarrizzo (2015) (see Table ESM1) into the model1. All potential sources were included in a first run of the model, except for the shrub H. tiliaceus and red macroalgae, which were under-sampled due to low representation across habitats (N< 5; Table 1; Figure 2). Mangrove samples were pooled as one source due to minimal δ13C variation (see 3.1.1). POM and SOM were also considered as sources, relevant to suspension/deposit feeders and detritivores in mangrove ecosystems. For MPB, due to limited data availability (only one reliable δ¹³C measurement and no δ¹5N data), we adopted theoretical values from Medina-Contreras et al. (2023). This study reported a global mean δ¹³C value that closely matched our single sample2. We only included consumer taxa/life stages with sufficient sample sizes (N > 3).
Figure 2
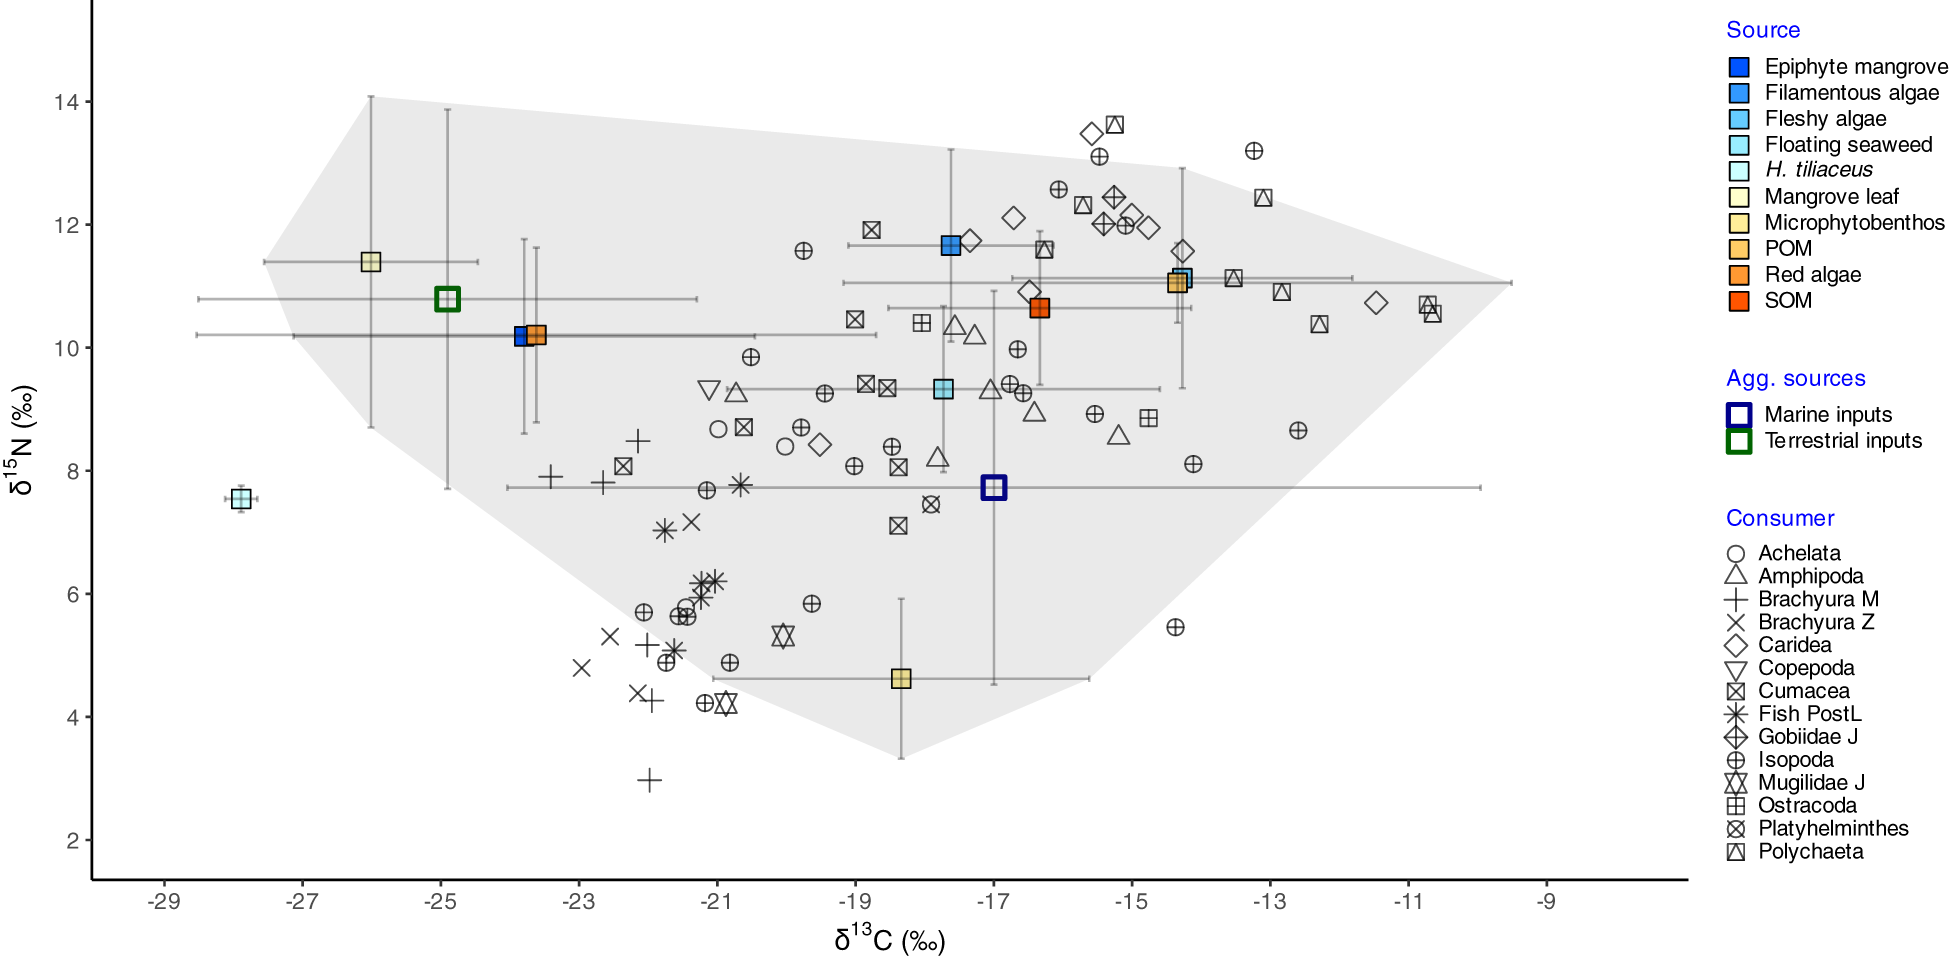
Stable isotope biplot of δ13C and δ15N values of food sources (mean ± SD; filled boxes) and consumers (individual points) sampled in mangrove ecosystems of the Galapagos Islands. Aggregated (‘agg.’) sources (mean ± SD; empty boxes) are also shown, in which ‘terrestrial inputs’ comprise mangrove leaves and mangrove epiphytes, while ‘marine inputs’ include filamentous, fleshy, and floating algae, microphytobenthos, and organic matter (POM — particulate, and SOM — sedimentary). Trophic enrichment factors of 1.76 ± 0.22‰ (δ13C) and 2.22 ± 0.10‰ (δ15N) were added to food sources to adjust the Simmr model. Convex hulls around all putative sources in the ecosystem (excluding red algae and H. tiliaceus) are overlaid in the plot. Other abbreviations: J, juvenile; PostL, post-flexion larval stages; Z, zoeae stages; M, megalopae stages.
We then conducted a second model run, employing a posteriori aggregation of sources following Ward et al. (2011). This approach streamlined the model, improving our ability to identify consumer groupings based on the relative contribution of mangroves to their diets compared to other carbon sources in the ecosystem. Several alternative source groupings were tested, with categories formed based on similar isotopic compositions (e.g., no significant differences detected through multivariate analyses; see Sections 2.4.1 and 3.1.1) and ecological relevance. The simplest grouping consisted of two categories: terrestrial versus marine endmembers. Terrestrial inputs included mangroves and their associated epiphytic algae, while marine inputs comprised benthic fleshy, floating, and filamentous algae, along with MPB, POM, and SOM (Figure 2). Two additional options considered three groups, each splitting marine inputs differently. The first separated MPB from other marine endmembers due to its presumably lower δ¹5N signatures (Table 1; Figure 2). The second distinguished between autochthonous and allochthonous marine sources, with the former including filamentous and fleshy algae, MPB, and SOM, while the latter comprised floating seaweed and POM. The 2-group model, which produced the least uncertainty (e.g., narrower posterior probability distributions), was employed for further spatial variation analyses (see Section 3.2). Source contributions to consumer diets from the alternative grouping options are detailed in the Supplementary Material (Supplementary Figures 7-9).
To explore spatial differences in dietary contributions across consumer groups, we used MixSIAR v.3.1.12 (Stock et al., 2018). MixSIAR provides a versatile framework for partitioning dietary contributions based on one or two continuous/categorical variables, offering greater flexibility than the Simmr model. In this study, we employed MixSIAR to estimate dietary contributions across consumer groups and sites, treating both factors as fixed categorical covariates. Consumer groups (‘13C-depleted’ vs. ‘13C-enriched’; see Section 3.2) rather than singular taxa/life stages were contrasted, as we were interested in comparing how dietary contributions vary in space across distinct food-web segments within mangrove ecosystems, and because some consumer categories did not portray large enough sample sizes to fulfill the requirements of the model (N ≥ 3). Source groups (terrestrial and marine inputs) were also partitioned by site, with values reported as mean ± SD. Only carbon isotope data were used for calculations due to insufficient measurements for MPB, which is presumed to be a key factor in distinguishing consumers based on δ15N (see Section 3.1.1). Variation in consumer tracer values in response to sampling error and individual differences (e.g., digestibility, assimilation, metabolic rates) was accounted for by using a multiplicative error structure (Stock and Semmens, 2016).
2.4.3 Environmental drivers of spatial variation
To assess the influence of selected environmental parameters on the spatial variation of source contributions to consumer diets, we performed Redundancy Analysis (RDA) using the vegan package. RDA allowed for the visual identification of spatial patterns through ordination plots. Latitude and longitude were included as environmental variables to account for spatial autocorrelation, recognizing that nearby locations, such as Estacion and Alemanes in Santa Cruz (within Academy Bay; Figure 1), may exhibit similar isotopic signatures, and therefore, dietary contributions due to shared environmental conditions or ecological processes.
Prior to analysis, environmental variables were standardized to a mean of zero and a unit standard deviation. To minimize multicollinearity, we examined a correlation matrix plot (Supplementary Figure 6) that visualizes scatterplots, Pearson correlation coefficients, and histograms for all variables using the GGally package (Schloerke et al., 2024). We applied a threshold of |r| > 0.80 for pairwise Pearson correlations, resulting in the reduction of parameters from 20 to 13 (Supplementary Table 6). Compositional data (median percentage contributions per source group) were transformed into centered log-ratios (CLR) using the easyCODA package (Greenacre, 2020) to meet the normality assumptions of RDA.
To identify the most relevant environmental predictors, we employed forward model selection using a double-stopping criterion—maximization of adjusted R² (adj-R²) and a p-value threshold of 0.01—implemented through the ‘ordiR2step’ function in vegan (Blanchet et al., 2008). At each step of the model-building process, we accounted for the effect of ‘consumer group’ using partial RDA, ensuring that predictor selection focused solely on spatial variation. Finally, we assessed both global and marginal effects of each constraining variable using permutation tests for constrained analysis (‘anova.cca’ function in vegan; N = 9,999 permutations).
The best-fit model identified turbidity (F1,9 = 18.53, p = 0.003) and nitrate (F1,9 = 12.5, p = 0.008) as significant predictors, albeit with a modest adj-R² of 16%. Nonetheless, the RDA axis explained 86.3% of the ‘unconditional’ constrained variation.
3 Results
3.1 Carbon and nitrogen isotopic ratios
3.1.1 Primary producers and organic matter
A total of 127 samples of primary producers (mangrove and H. tiliaceus leaves, macroalgae, MPB), suspended POM, and SOM were analyzed for carbon and nitrogen stable isotopes. δ13C of individual samples ranged from -31‰ (L. racemosa decaying leaf) to -10.6‰ (brown fleshy alga Colpomenia sinuosa), while δ15N ranged from 5.1‰ (C. erectus senescent leaf; or 2.4‰ when considering MPB)3 to 14.3‰ (R. mangle senescent leaf). Mangrove samples, therefore, showed the greatest variation in δ15N (SD: 2.6‰) among sources (Table 1). Mangrove samples also exhibited the second lowest δ13C values (-27.8 ± 1.3‰), surpassed only by the coastal shrub H. tiliaceus (-29.6 ± 0.01‰), and the second highest δ15N ratios (9.2 ± 2.6‰), following filamentous algae (9.4 ± 1.5‰).
Significant differences in isotopic composition were observed among leaf life stages (PERMANOVA: F2,44 = 2.33, p = 0.039; PERMDISP: F2,47 = 0.02, p = 0.982), with a notable 13C-depletion occurring during senescence, except in A. germinans and C. erectus, where senescent leaves exhibited lower δ13C values than decaying leaves (Supplementary Table 2). Significant differences were also found among mangrove species (PERMANOVA: F3,44 = 5.82, p< 0.009), although these results may have been partly influenced by the heterogeneous dispersions among species (PERMDISP: F3,46 = 3.1, p = 0.036). Significant differences were detected across all species pairs (all life stages pooled), except between R. mangle and L. racemosa; the greater variance in R. mangle samples may account for the significant differences observed with C. erectus (Supplementary Table 3; Supplementary Figure 3). Additionally, differences among leaf life stages across mangrove species were only observed between L. racemosa and both A. germinans and C. erectus (Supplementary Table 3; Supplementary Figure 3).
Algal sources exhibited a broader δ13C variation (-30.7‰ to -10.6‰) compared to mangrove leaves (Figure 2). Overall, significant differences in carbon and nitrogen isotopic compositions were found among food sources (PERMANOVA: F7,116 = 47.76, p< 0.001). Although most source pairs exhibited significant differences (Supplementary Table 4; Supplementary Figure 4), we identified two distinct macroalgal groups based on their divergent δ¹³C signatures. Epiphytes (-25.6 ± 3.1‰) and red algae (-25.4 ± 4.7‰) were the most 13C-depleted algal sources, with values overlapping those of mangrove leaves. In contrast, benthic fleshy algae (-16 ± 2.2‰), filamentous algae (-19.4 ± 1.3‰), and floating seaweeds (-19.5 ± 2.9‰) were more 13C-enriched, with POM (-16.1 ± 4.6‰) and SOM (-18.1 ± 2‰) sharing similar values (Table 1; Figure 2). Given the overall significant dispersion across sources (PERMDISP: F7,116 = 3.27, p = 0.004), significant pairwise differences between filamentous algae and other sources (e.g., POM, mangroves, epiphytes, red algae) could also be explained by their larger distances to centroids (Supplementary Table 4; Supplementary Figure 4).
Nevertheless, significant differences between terrestrial (mangroves + epiphytes) and marine (benthic fleshy algae + filamentous algae + floating seaweed + POM + SOM) endmembers were evident (PERMANOVA: F1,118 = 278.21, p< 0.001; PERMDISP: F1,118 = 0.04, p = 0.846), primarily driven by variations in δ¹³C (Figure 2). The intermediate δ¹³C value (-20.9‰) of our single MPB sample indicates that this algal source aligns more closely with marine endmembers (Figure 2; Table 1). However, the notably lower literature-based δ¹5N value (2.4 ± 1.2‰; Medina-Contreras et al., 2023) suggests isotopic divergence from other marine inputs (see Section 2.4.2; Supplementary Figure 7).
Although significant differences were observed among terrestrial, autochthonous and allochthonous marine inputs (PERMANOVA: F2,117 = 139.66, p< 0.001), these findings may have been partly affected by heterogeneous variances among the groups (PERMDISP: F2,117 = 4.8, p = 0.01). While pairwise comparisons revealed significant differences between terrestrial sources and both autochthonous and allochthonous marine sources (p< 0.01 for both), the latter two exhibited significant overlap in their values (F1,60 = 0.99, p = 0.339), with autochthonous sources displaying significantly greater dispersion around their centroid compared to allochthonous sources (p = 0.1; see 2.4.2; Supplementary Figure 7).
3.1.2 Consumers
Carbon and nitrogen stable isotopes of 85 consumer samples were analyzed in this study. δ13C ranged from -23.4‰ (Grapsus grapsus megalopae) to -10.6‰ (polychaetes), while δ15N from 3‰ (G. grapsus megalopae) to 13.6‰ (polychaetes; Figure 2). There were overall significant differences among consumers (PERMANOVA: F8,68 = 11.63, p< 0.001), but some of these may have been caused by dispersion disparities across groups (PERMDISP: F8,68 = 5.62, p< 0.001).
Brachyuran zoeae exhibited the lowest δ13C values among consumers (-22.3 ± 0.7‰) and the lowest δ15N values among crustaceans (5.4 ± 1.2‰; Table 2), differing significantly from many other taxa (Supplementary Table 5; Supplementary Figure 5). In contrast, caridean shrimps showed both the highest δ13C (-15.7 ± 2.2‰) and δ15N (11.5 ± 1.4‰) values, also differing significantly from other taxa, including cumaceans, amphipods, isopods, lobster pueruli, and brachyuran larval stages (Supplementary Table 5; Supplementary Figure 5). Isopods had the largest variation in both δ13C (SD: 3‰) and δ15N (SD: 2.7‰; Table 2; Supplementary Figure 5).
Other invertebrates like platyhelminths (δ13C: -17.9‰, δ15N: 7.5‰) and polychaetes (δ13C: -13.4 ± 2‰, δ15N: 11.5 ± 1.1‰), also had heavier isotopic values, polychaetes showing significant differences with brachyuran zoeae and lobster pueruli (Supplementary Table 5; Supplementary Figure 5). Amongst fishes, post-flexion larval stages (δ13C: -21.3 ± 0.4‰, δ15N: 6.4 ± 0.9‰) and mugilid juveniles (δ13C: -20.5 ± 0.6‰, δ15N: 4.8 ± 0.8‰) exhibited relatively low isotopic values for both C and N, the former consumer depicting similar significant pairwise differences against other consumers as for brachyuran zoeae. Meanwhile, stable-isotope ratios of gobiid juveniles (δ13C: -15.3 ± 0.1‰, δ15N: 12.2 ± 0.3‰) overlapped with those of caridean shrimps (Figure 2; Table 2; Supplementary Figure 5).
3.2 Resource contributions to consumer diets
Marine inputs—such as macroalgae, MPB, and organic matter—dominated the diets of consumer species, with mean contributions ranging from 52.3% (SD: 17.2%) in brachyuran megalopae to 88.8% (SD: 7.4%) in polychaetes. In contrast, terrestrial inputs, including mangroves and epiphytic algae, made a smaller contribution, with mean values ranging from 11.2% (SD: 7.4%) in polychaetes to 47.7% (SD: 17.2%) in brachyuran megalopae (Figure 3; Supplementary Table 7). Terrestrial inputs contributed more than 25% to the median diet of several ‘13C-depleted’ consumers, including brachyuran larval stages (megalopae and zoeae), fish post-flexion larvae, cumaceans, and lobster pueruli, underscoring their stronger dependence on these carbon sources. In contrast, ‘13C-enriched’ consumers—including polychaetes, caridean shrimps, amphipods and isopods, — displayed a strong dependence on marine inputs, which accounted for over 75% of their median dietary contributions (Figure 3; Supplementary Table 7).
Figure 3
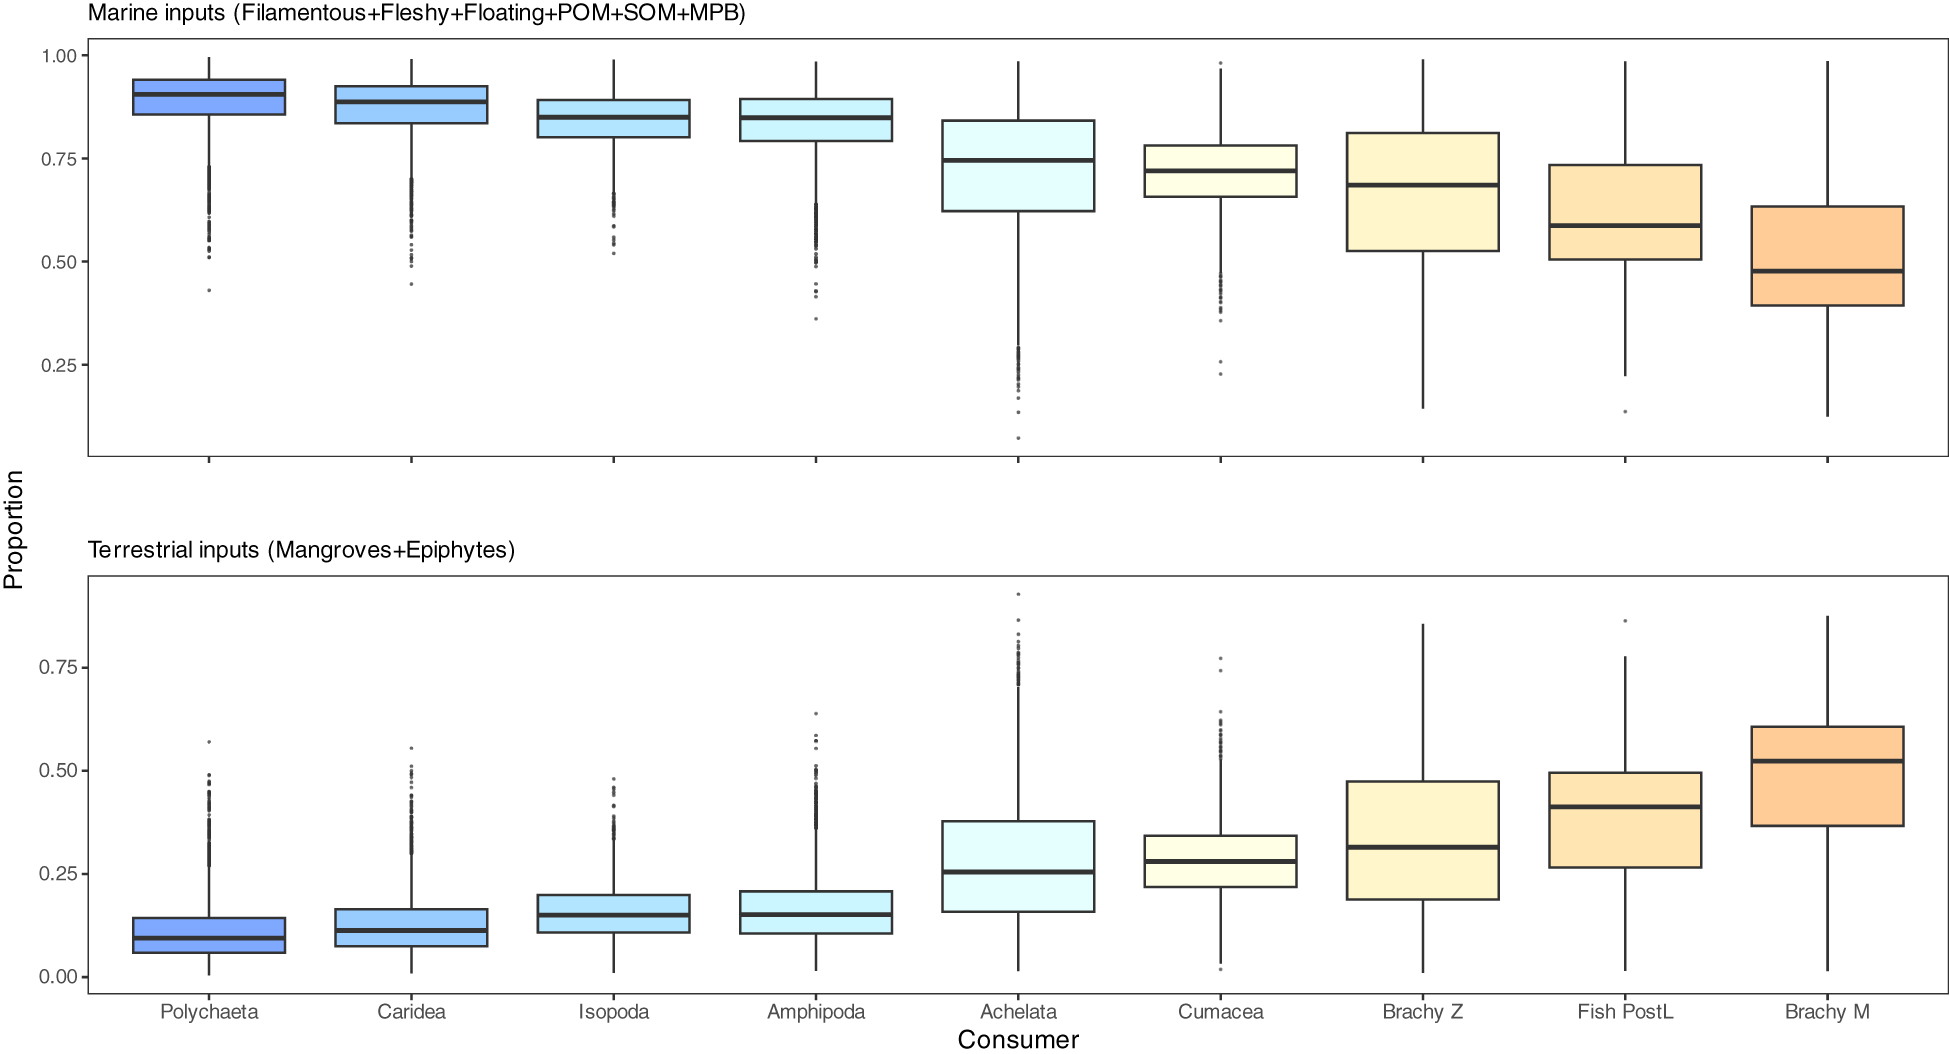
Boxplots illustrating Bayesian posterior probability distributions of source contributions to consumer diets in the mangrove ecosystems of the Galapagos Islands, as estimated using a Simmr model. The sources were aggregated a posteriori following an initial model run that included all potential sources: (top) marine inputs (filamentous, fleshy, and floating algae; organic matter — particulate (POM) and sedimentary (SOM); and microphytobenthos (MPB)) and (bottom) terrestrial inputs (mangrove leaves and mangrove epiphytes). Other abbreviations: Brachy, Brachyura (crab); PostL, post-flexion larval stages; Z, zoeae stages; M, megalopae stages.
Isopods (29.7 ± 0.1%) exhibited a significantly greater reliance on MPB compared to most other consumers, for which macroalgae and/or organic matter played a substantially more prominent role among marine inputs (Supplementary Figure 8). Additionally, autochthonous marine sources—comprising fleshy and filamentous benthic macroalgae, MPB, and SOM—consistently contributed more to consumer diets than allochthonous sources, such as floating seaweed and POM, across all marine consumers. However, the precise contributions of these marine inputs among certain 13C-enriched consumers, such as polychaetes, remains unclear due to high variability in their posterior probability distributions (Supplementary Figure 9).
3.3 Spatial variation
3.3.1 Source isotopic compositions
No significant differences were found in the isotopic composition of resources between islands (PERMANOVA: terrestrial: F1,52 = 15.02, p = 1; marine: F1,56 = 11.41, p = 1) or between sites (terrestrial: F4,52 = 1.4, p = 1; marine: F4,56 = 1.85, p = 1) for either terrestrial or marine inputs. Isotopic values were generally lower at Isabela compared to Santa Cruz, particularly for δ¹5N, by approximately 2‰ (Figure 4). Specifically, Alemanes in Santa Cruz showed the highest mean values for both C and N isotopes in the two groups of sources (terrestrial: δ¹³C: -26.4 ± 0.8‰, δ¹5N: 10.2 ± 0.3‰; marine: δ¹³C: -16.7 ± 0.04‰, δ¹5N: 9.5 ± 0.2‰), while Estero in Isabela exhibited the lowest values amongst sites (terrestrial: δ¹³C: -28.9 ± 0.2‰, δ¹5N: 6.4 ± 0.4‰; marine: δ¹³C: -20.4 ± 0.2‰, δ¹5N: 7.2 ± 0.5‰; Figure 4).
Figure 4
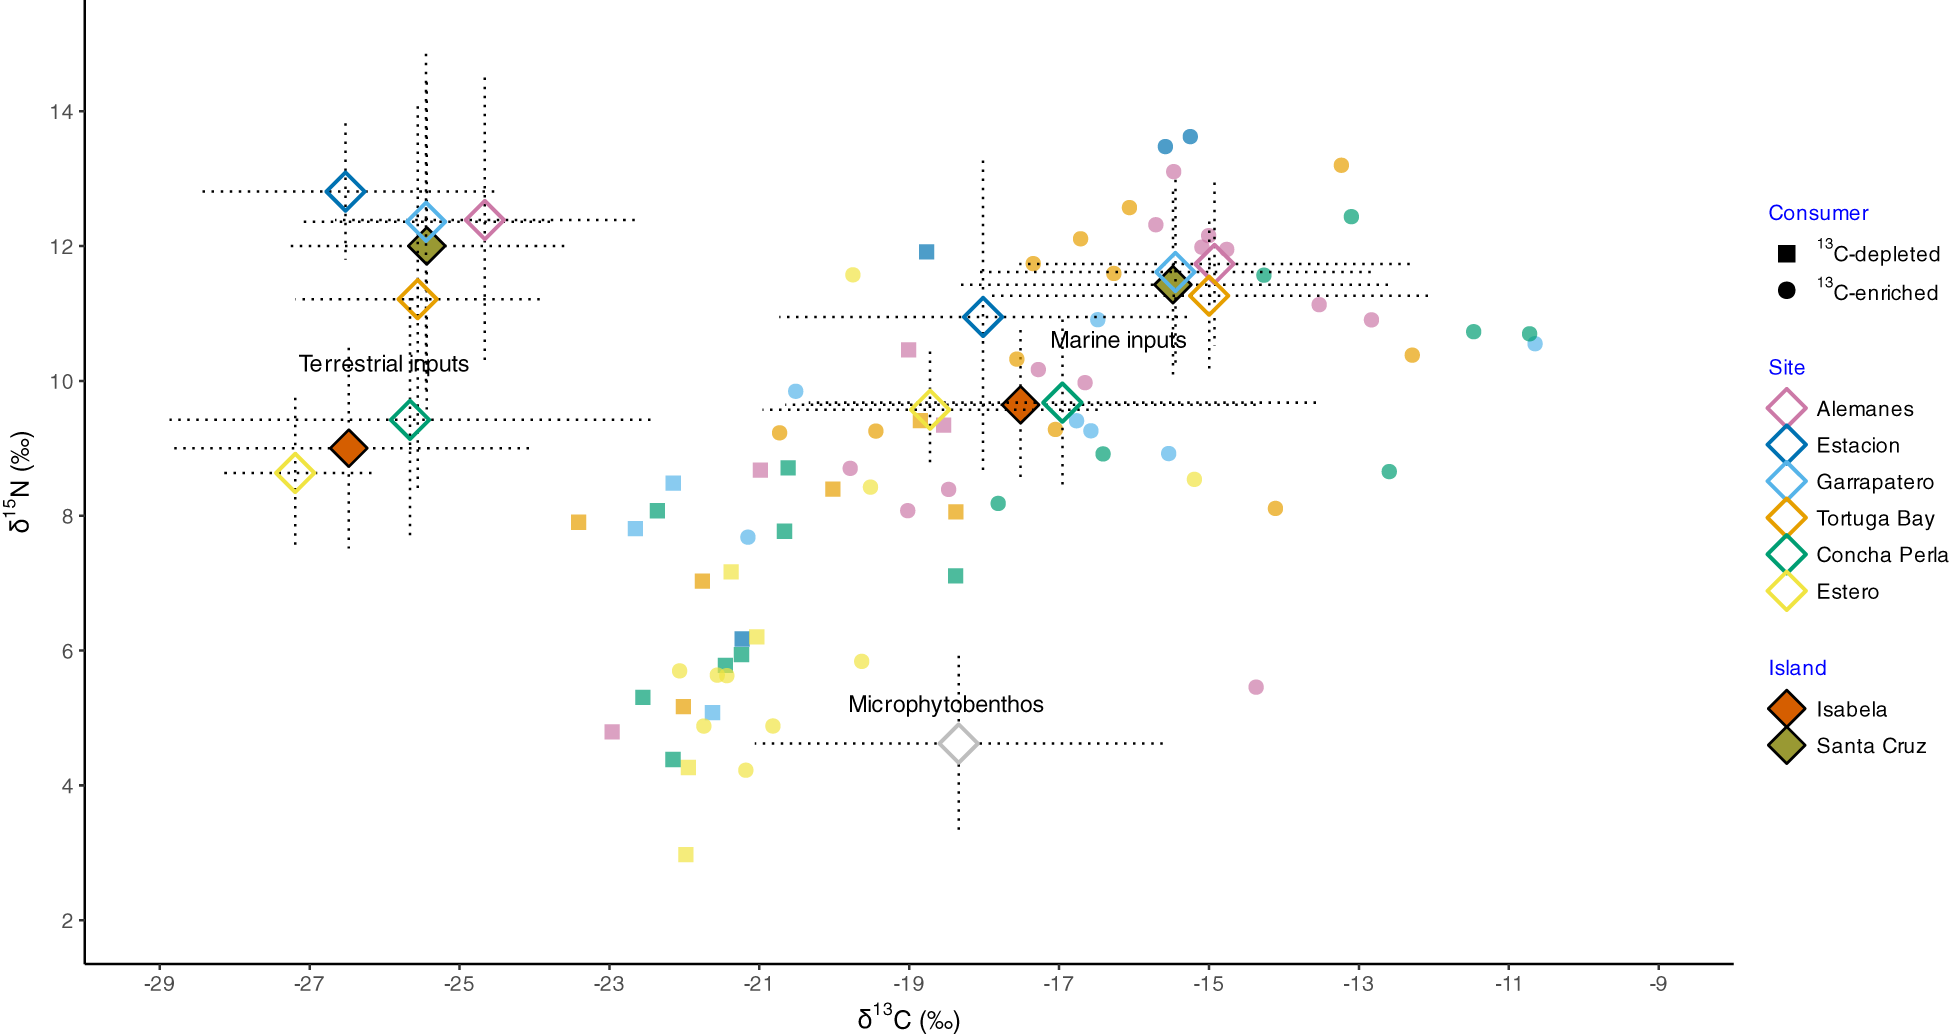
Stable isotope biplot showing mean (± SD) δ¹³C and δ¹5N values (rhombuses) for aggregated terrestrial sources (mangrove leaves and epiphytes) and marine sources (filamentous, fleshy, and floating algae, organic matter — particulate (POM) and sedimentary (SOM)) across two islands (filled symbols) and six mangrove sites (empty symbols) in the Galapagos: Santa Cruz (SC; n = 4 sites) and Isabela (Is; n = 2 sites). Individual consumer isotopic values are overlaid, categorized as ‘¹³C-depleted’ (squares: brachyuran megalopae and zoeae, fish post-flexion larvae, cumaceans, and lobster pueruli) or ‘¹³C-enriched’ (circles: polychaetes, caridean shrimps, isopods, and amphipods). Trophic enrichment factors of 1.76±0.22‰ for δ¹³C and 2.22±0.10‰ for δ¹5N were applied to food sources to estimate their contributions to consumers. For reference, a global mean (± SD) value for microphytobenthos, based on Medina-Contreras et al. (2023), was also included.
3.3.2 Source contributions to consumer diets
Turbidity and nitrate concentrations emerged as the strongest predictors of spatial variation in consumer dietary composition. Terrestrial inputs were strongly associated with turbidity (species score = –0.662), whereas marine inputs were more closely linked to nitrate levels (species score = 0.256; Figure 5). Sites with elevated turbidity (>5 NTU)—particularly Tortuga Bay, Garrapatero, and Alemanes—exhibited a greater contribution of terrestrial resources to consumer diets, with ¹³C-depleted consumers deriving >50% of their mean dietary input from terrestrial sources, and Garrapatero exceeding 60%. In contrast, sites with low turbidity (<5 NTU), such as Concha Perla, Estacion, and Estero, showed a predominance of marine inputs, contributing >90% of the mean dietary input for ¹³C-enriched consumers (Figure 6; Supplementary Tables 6 and 8).
Figure 5
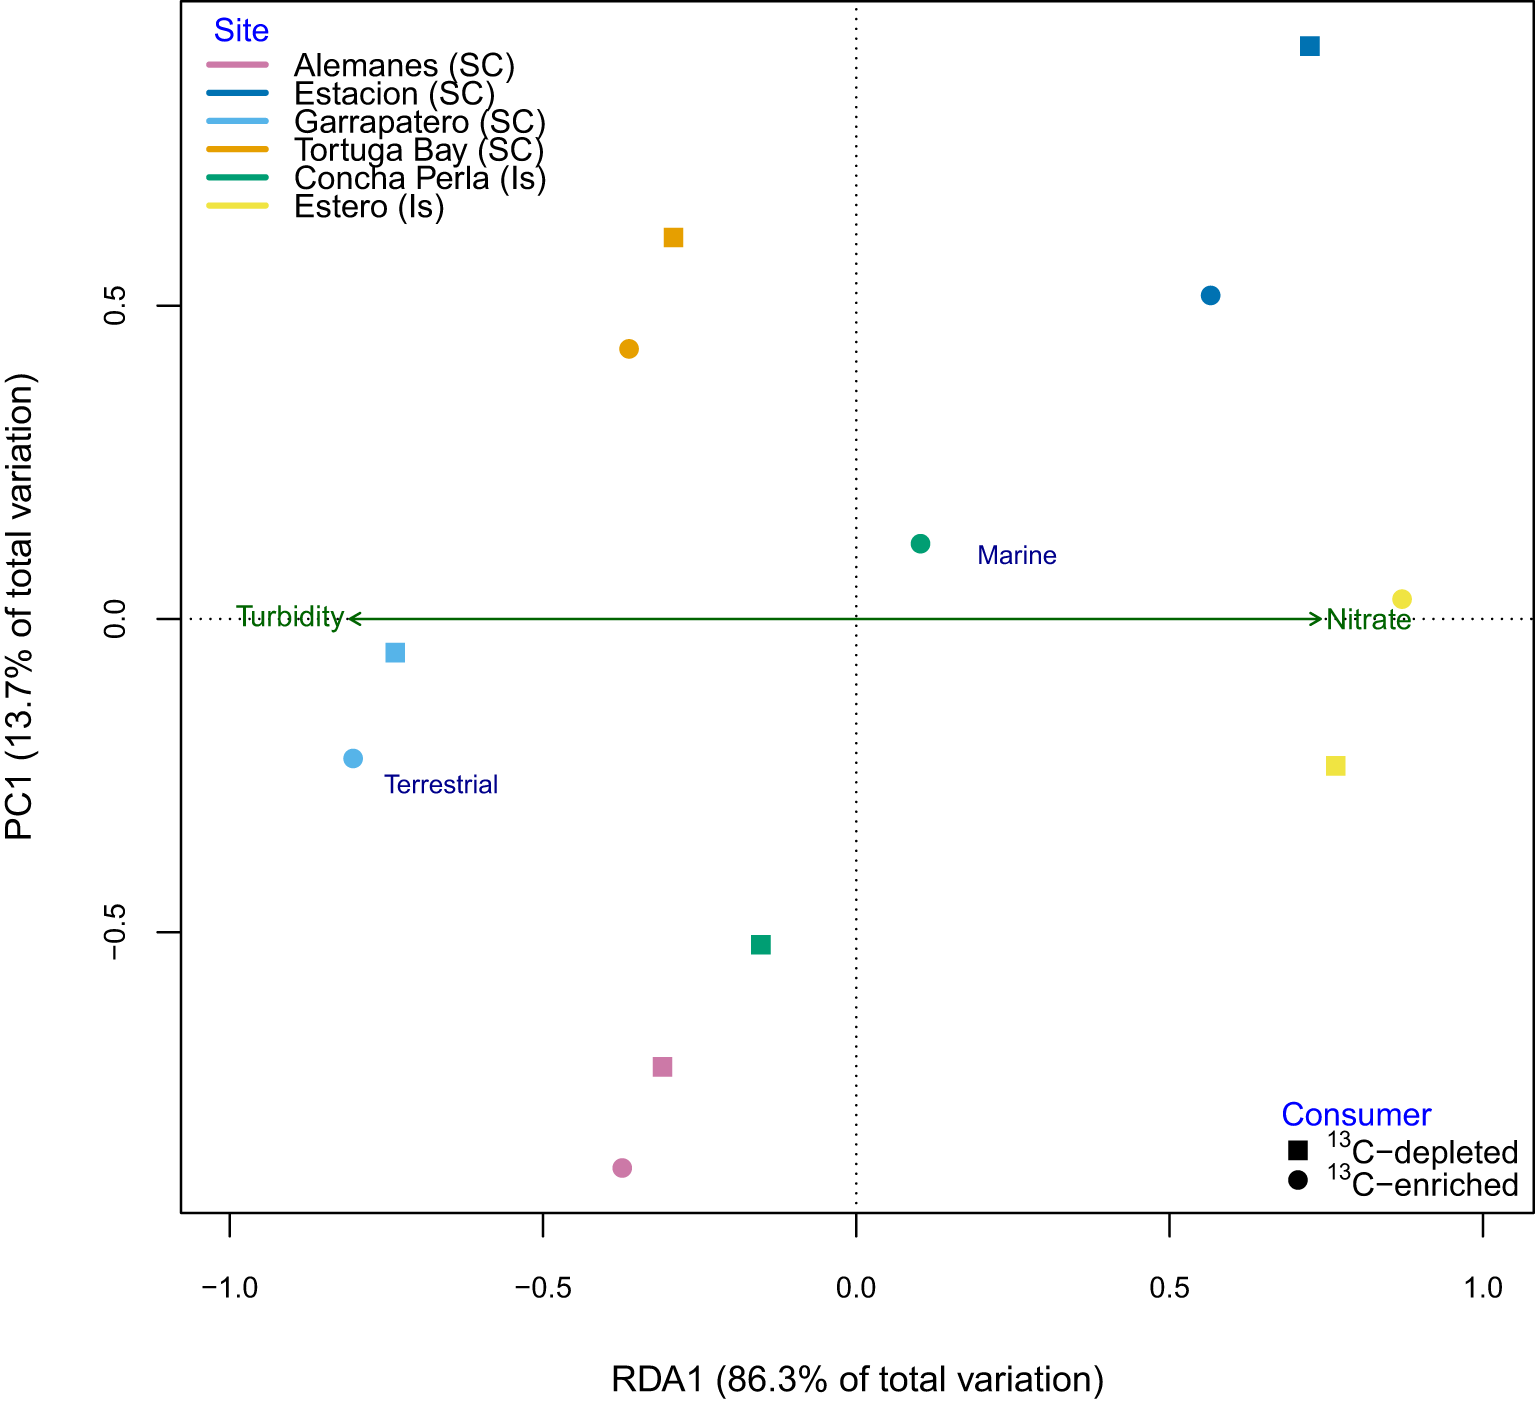
Partial Redundancy Analysis (RDA) tri-plot representing the spatial variability of source group (terrestrial vs marine inputs) contributions to consumer diets in mangrove ecosystems across six sites between Santa Cruz (SC) and Isabela (Is) islands in the Galapagos, calculated by using a MixSIAR model only with δ¹³C. The plot accounts for variation among different consumer groups—’13C-depleted’ (squares) and ‘13C-enriched’ (circles)— while selecting the best-fit set of environmental variables during ordination. Points are color-coded according to sampling site.
Figure 6
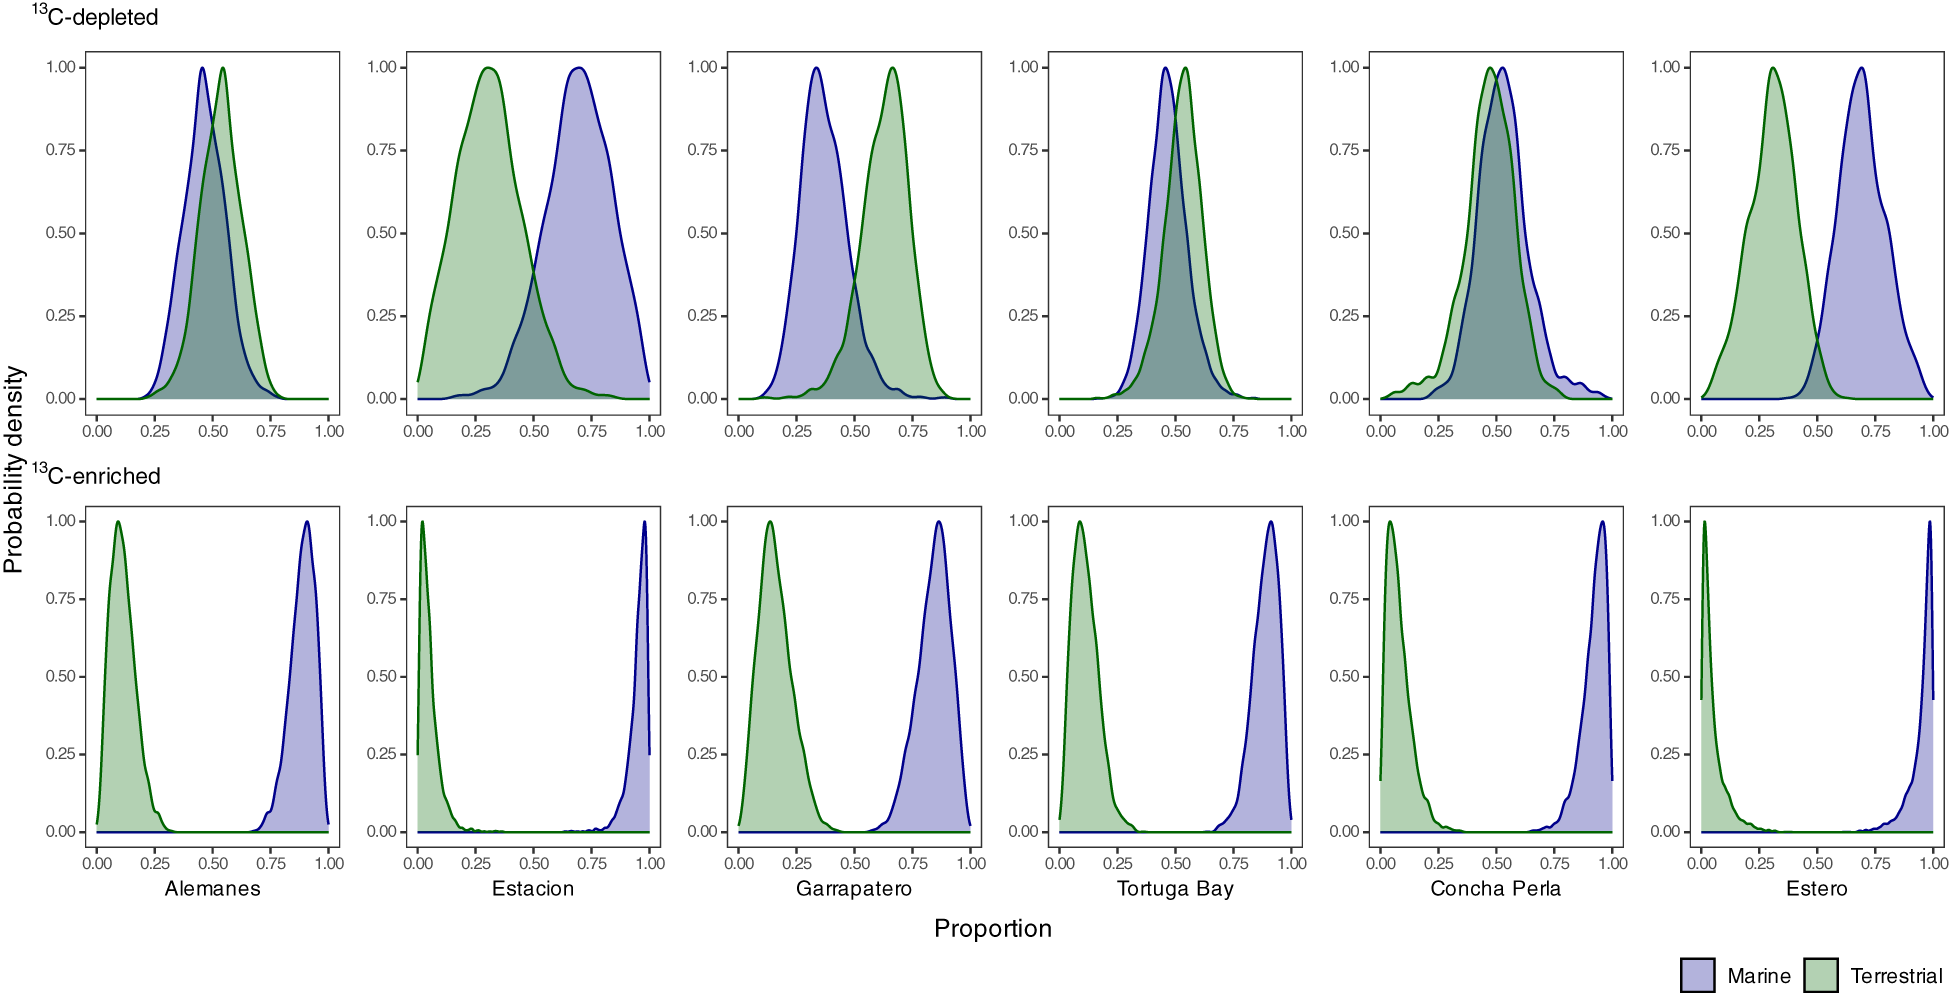
Bayesian posterior probability distributions of the contributions of aggregated terrestrial and marine inputs to the diet of ‘13C-depleted’ (top), and ‘13C-enriched’ consumers (bottom) found across six mangrove habitats located between two islands of the Galapagos (i.e., Santa Cruz: Alemanes, Estacion, Garrapatero, Tortuga Bay; Isabela: Concha Perla, Estero), by using a MixSIAR model only with δ¹³C.
These patterns highlight the interplay of environmental drivers across both regional and local scales (Supplementary Figure 6). At the regional level, Santa Cruz sites with reduced mangrove cover exhibited significantly higher turbidity (r = –0.581, p< 0.05), salinity (r = –0.899, p< 0.001), and pH (r = –0.759, p< 0.01), distinguishing them from sites in Isabela. At the local scale, turbidity—particularly elevated at Alemanes and Tortuga Bay—was negatively associated with water depth (r = –0.548), helping to explain within-island differences such as those at Estacion, which had the greatest water depth in Santa Cruz (2.2 ± 0.18 m). Nitrate concentration, strongly correlated with TN (r = 0.752, p< 0.01), also showed a moderate negative association with salinity (r = –0.363, p< 0.05). This pattern is consistent with the highest nitrate (0.35 ± 0.04 mg/L) and lowest salinity levels (16.66 ± 5.5) observed at the brackish site of Estero (Supplementary Tables 6; Supplementary Figure 6).
4 Discussion
4.1 Carbon and nitrogen isotopic signatures in sources
4.1.1 Mangroves
The leaves of Galapagos mangroves exhibit a depletion in 13C similar to that observed in other C3 terrestrial vascular plants (O’Leary, 1981). Their isotopic ratios (-27.8‰; SD = 1.3‰) closely match the global median estimate (-28.1‰; inter-quantile range: -29.4 to -27‰; Bouillon et al., 2008) and are comparable to values reported in other regions, such as the Western Atlantic (e.g., Puerto Rico, Florida, Brazil, Caribbean Colombia; Medina and Francisco, 1997; France, 1998; Mancera-Pineda et al., 2009; Giarrizzo et al., 2011; Rodríguez-Rodríguez et al., 2018) and the Indo-Pacific (e.g., India, Sri Lanka, Kenya, Australia; Bouillon et al., 2002 and 2004; Abrantes and Sheaves, 2009). However, mangrove δ13C values in this study, along with those from the Guayas River Estuary in mainland Ecuador (~27‰; Cifuentes et al., 1996), are 1-2‰ higher compared to other locations across the TEP (e.g., Viana et al., 2015; Medina-Contreras et al., 2018, 2020 and 2023). This enrichment may be attributed to the effects of salinity stress and/or nutrient limitations on the CO2 assimilation rate. In oceanic environments, mangroves are typically underdeveloped, lacking the tall and dense forest structures observed elsewhere (Lin and Sternberg, 1992; McKee et al., 2002; Bouillon et al., 2008; Mancera-Pineda et al., 2009).
Mangrove δ15N ratios were also enriched by ca. 5‰ compared to other locations across the TEP region and worldwide (e.g., Viana et al., 2015; Medina-Contreras et al., 2018, 2020 and 2023). Several processes at the ocean-basin and regional levels could explain this spatial enrichment. The geographic position of the archipelago at the edge of the Pacific Equatorial Divergence province (see Longhurst, 1998) creates a latitudinal gradient of δ15N in the Pacific (Lorrain et al., 2015; Altabet, 2001). The sub-oxic conditions in the TEP lead to denitrification in the water column, resulting in further 15N enrichment of residual nitrate in seawater (Gruber and Sarmiento, 1997; Lorrain et al., 2015; Sánchez et al., 2018; Medina-Contreras et al., 2023). Furthermore, the abundance of 15N-rich seabird guano along the Galapagos shorelines might contribute to the atypically high δ15N signatures in the area (Gagnon et al., 2013). We note that these isotopic values are representative of the dry season during a non-ENSO year, as significant temporal variation is expected due to the highly dynamic oceanic-atmospheric conditions around the archipelago (Banks, 2002; Palacios, 2004).
Ontogenic (intraspecific) differences in mangrove leaves were significant but small, consistent with previous studies (Fourqurean and Schrlau, 2003; Bouillon et al., 2008). Similarly, the dominant red (R. mangle) and white (L. racemosa) mangroves showed minimal δ¹³C separation, aligning with Medina-Contreras et al. (2018). Moreover, mangrove leaves are more variable in δ15N than δ13C across equivalent spatial scales (Fry et al., 2000), suggesting that intra- and interspecific differences in mangrove isotopic signatures may have been accentuated by the larger spatial variation of the former isotope (see Section 4.3).
4.1.2 Algae, organic matter and isotopic discrimination among sources
The algal sources in this ecosystem had a mean δ¹³C of -20.4‰, only slightly lower than the global median estimate of -18.9‰ (Bouillon et al., 2008). A large variability in algal δ13C was observed due to their plasticity in photosynthetic pathways (Keeley, 1999). We report the highest δ13C values for POM across the TEP (16.1 ± 4.6‰), indicating that mangrove ecosystems in the Galapagos, at least at the sampled sites, are rather open systems where oceanic, rather than coastal phytoplankton dominates. SOM δ13C values were also the most enriched across the TEP (Medina-Contreras et al., 2018, 2020 and 2023), indicating a marine origin. Therefore, the contribution of mangrove detritus to the SOM pool appears negligible, possibly because it is quickly recycled in the ecosystem or exported offshore.
δ15N signatures in algal sources and organic matter were enriched by at least 5‰ (similar to mangroves) compared to other locations in the TEP, confirming an overall enrichment of the N isotopic baseline in the Galapagos. Food web studies require distinct isotopic separation among sources to accurately estimate dietary contributions in consumers. To mitigate potential overlaps, some studies have aggregated functionally similar taxa a posteriori (Ward et al., 2011). Since the goal of our study was to determine relative contributions of major endmember sources, and since we observed significant isotopic differences between terrestrial and marine endmembers, particularly in δ¹³C values, we chose to adopt a two-source model to characterize the trophic structure of the system. While this model may seem overly simplistic, it effectively reduced the risk of drawing conclusions with high uncertainty. Conversely, a more complex three-source model that differentiated marine sources by their origin (autochthonous vs. allochthonous), failed to clearly separate their δ¹³C signatures. A three-source model that separated MPB from other marine inputs relied on literature-based rather than empirical data, introducing additional uncertainty. Novel in situ sample collections is needed to obtain reliable estimates of actual MPB isotopic signatures. In addition, a higher-resolution source model that can discriminate contributions of different terrestrial resources requires inclusion of additional isotopic tracers like 32S, 34S, 2H (as suggested by Bouillon et al., 2008; Viana et al., 2015; Then et al., 2021), or amino-acid compound-specific nitrogen isotope analysis (e.g., Popp et al., 2007).
4.2 Carbon and nitrogen isotopic signatures in consumers and dietary contributions
The broad isotopic ranges of δ¹³C (-23.4 to -10.6‰) and δ¹5N (3 to 13.6‰) in consumers suggest niche segregation of food sources within the ecosystem (Bouillon et al., 2002; Sepúlveda-Lozada et al., 2015). Higher δ¹³C values in some consumers, coupled with elevated δ¹5N, may reflect ¹³C enrichment with increasing TL. Consumer δ¹³C values in the Galapagos were generally higher than those reported for the TEP, while the δ¹5N range was similar to that observed in other studies (Medina-Contreras et al., 2018; Viana et al., 2015). Despite sharing very few species, comparisons between the archipelago and mainland locations should not be constrained, as sister taxa generally exhibit analogous diets dictated by phylogenetic history (Cattin et al., 2004). Thus, the results imply differences in resource utilization patterns across the TEP region.
4.2.1 Crustaceans
The δ13C and δ15N ranges of crustaceans in this study were almost as wide as the total consumer variation, reflecting the diversity of feeding habits within this taxon, including ontogenic diet changes (Jeffs and O’Rorke, 2020). It is important to note that the light-trap sampling method used in this study favored the capture of small mobile crustaceans and fish larvae (Floyd et al., 1984; Secor et al., 1992). We identified three distinct trophic pathways among crustaceans in the Galapagos mangroves. First, several ‘¹³C-depleted’ crustaceans rely heavily on mangrove leaf material and/or algal epiphytes, although marine-derived organic matter can still contribute over 50% to their diets. Another group of ‘¹³C-depleted’ crustaceans use a mix of terrestrial and marine inputs in varying proportions, depending on local environmental conditions. At the opposite end, an algal-based food web comprises ‘¹³C-enriched’ crustaceans, which primarily depend on non-epiphytic macroalgae, MPB, and/or marine-derived organic carbon. The three distinct crustacean trophic pathways identified in this study closely align with those described for mangroves in northern Brazil (Giarrizzo et al., 2011) and are strongly supported by our Bayesian mixing model.
Brachyuran larvae (zoeae and megalopae) were predominantly reliant on a mangrove-based food web, with terrestrial inputs accounting for more than 33% of their diet on average. In contrast to northern Brazil, where purely herbivorous sesarmid (e.g., Aratus, Armases) or ucidid crabs (e.g., Ucides cordatus) dominate, these are absent in the Galapagos. Instead, early life stages of other crab species with diverse feeding habits (e.g., Grapsus grapsus, Callinectes spp., Portunus spp., Carcinus spp.) exhibit substantial dependence on mangrove-derived carbon, consistent with prior findings (Giarrizzo et al., 2011). Other crustaceans, such as benthic omnivores like lobster larvae and detritivores like cumaceans, participate in a mixed-source food web, with diets composed of ~27-28% terrestrial and 71-72% marine inputs. Meanwhile, the algal-based food web features locally abundant benthic omnivore/detritivores such as isopods and amphipods, and carnivorous caridean shrimps, which derive over 80% of their diet from marine sources. Notably, isopods exhibit the greatest isotopic variation in both δ¹³C and δ¹5N (Table 2; Supplementary Figure 5), suggesting potential niche segregation based on feeding guild, as observed in previous studies (Giarrizzo et al., 2011; Viana et al., 2015). Other consumers, such as calanoid copepods and ostracods, exhibited isotopic values similar to those of lobster larvae and caridean shrimps, respectively, suggesting comparable food source utilization. However, their low sample size (N< 3) precluded the application of mixing models, limiting the conclusions that could be drawn about their resource use.
4.2.2 Fish larvae, other invertebrates and food web interactions
Fish collected in this study showed a clear segregation in carbon isotopic patterns, despite the small sample size (N = 10) and lower taxonomic and functional representation compared to crustaceans. Post-flexion larval stages of Sparidae, Gerreidae, and Gobiidae exhibited a stronger reliance on terrestrial inputs (‘¹³C-depleted’ consumers), whereas early juveniles of Bathygobius lineatus (Gobiidae) appeared to depend more on algal-based food webs (‘¹³C-enriched’ consumers), based on their isotopic values, had they been included in mixing models. Similarly, mugilid (Mugil sp.) early juveniles, with isotopic values close to those of lobster larvae, seemed to rely on a mixed-source food web. Larger sample sizes in future studies will be necessary to clarify the resource use and food web positioning of these fish taxa and diverse life stages.
Among invertebrates, errant polychaetes also showed a preference for algal-based food webs, while the single platyhelminth sample exhibited isotopic values similar to amphipods and isopods, suggesting a similar algal-based resource use. Although these results are preliminary and underscore the need for broader sampling, especially for underrepresented groups, the resource utilization patterns observed here are consistent with findings from northern Brazil (Giarrizzo et al., 2011) and the Pacific coast of Colombia (Medina-Contreras et al., 2020).
Dietary source contributions in food web models can vary considerably depending on TEFs and other model parameters, such as elemental concentrations (Parnell, 2021). Recent experimental studies have reported higher TEF values for sesarmid crabs like Aratus pisonii (e.g., δ¹³C: 5.4 ± 0.9‰; δ¹5N: 3.9 ± 0.5‰; Sandoval et al., 2022), suggesting an even greater contribution from mangrove detritus. Nevertheless, we applied a uniform TEF value across all consumers in our models, as the elevated carbon values reported in recent studies (Bui and Lee, 2014; Kristensen et al., 2017; Sandoval et al., 2022) were based on adult stages of exclusively leaf-eating crab families. These findings underscore the need for more precise TEF estimates for mangrove consumers across Galapagos habitats to enhance the reliability of Bayesian mixing models.
Spiny lobsters are among the most commercially captured species in the Galapagos (Molina et al., 2004; Castrejón, 2011). This study suggests that their larval stages exhibit opportunistic behavior regarding carbon sources, potentially showing a preference for mangrove detrital material depending on availability and other reasons. This behavior supports the ‘food availability’ hypothesis that mangroves serve as nurseries due to their abundant food resources (Laegdsgaard and Johnson, 1995), while indicating common ontogenic dietary shifts among consumers. However, beyond a preference for mangrove-derived sources, the depleted δ¹³C values observed in these early life stages may also result from a negative isotopic shift during embryogenesis (Schwamborn et al., 2002), a factor that should be considered in future studies. Nonetheless, species heavily reliant on mangrove detritus play a crucial role in converting plant biomass into forage for other consumers, including the later life stages of these commercially important species.
Furthermore, leaf litter processed by crabs and, to a lesser extent, other invertebrates like amphipods, produces tannin-free fecal pellets colonized by microbes. These microbes form the foundation of coprophagous food chains crucial for detritivores (e.g., isopods, cumaceans) and planktonic consumers (e.g., calanoid copepods; Giarrizzo et al., 2011). Despite these insights, most isotopic studies have focused on adult stages of fish and invertebrates, providing limited evidence on carbon partitioning at this ecological scale (e.g., except for Giarrizzo et al., 2011; Schwamborn et al., 2002).
Despite the acknowledged importance of MPB as a carbon source along the Pacific Colombian coast (Medina-Contreras et al., 2020) and in Panama (Viana et al., 2015), this study suggests that mangrove detritus may be equally important compared to algal sources for secondary production. Variations within the TEP region could arise due to differences in shelf configuration and tidal hydrology (Faunce and Layman, 2009). In highly productive oceanic systems with steep-slope configurations like the Galapagos, macroalgal beds dominate and exhibit greater diversity over MPB mats. This contrasts with low-relief estuarine systems found in other TEP mainland locations, where higher tidal fluctuations create larger exposed intertidal areas. These conditions favor the colonization of benthic diatoms and other MPB taxa, thereby supplying abundant carbon sources within local food webs.
4.3 Spatial variation in isotopic compositions and consumer diets
Source isotopic compositions showed no significant differences among islands or specific locations within islands, though some spatial patterns were evident. This aligns with previous studies along the Colombian Pacific coast (Medina-Contreras et al., 2018, 2020), Kenya (Bouillon et al., 2004), and Sri Lanka (Bouillon et al., 2004). However, dietary contributions varied most at the within-island (local) scale, primarily driven by differences in terrestrial inputs among sites. Trophic variation best correlated with turbidity and nitrate concentration, though these environmental variables only accounted for a small portion of this variation. These findings suggest that resource partitioning across habitats is shaped by multiple interacting environmental factors.
In this study, turbidity was negatively correlated with tidal depth, which represents the average sea-level depth at the shore or in the middle of the tidal creek (e.g., Estero). Habitats with lower turbidity and deeper waters (e.g., Concha Perla, Estacion, Estero) likely retain less organic material, creating conditions that favor algal growth and increase its dietary contribution. In contrast, sites with higher turbidity (e.g., Alemanes, Tortuga Bay, Garrapatero) may promote the retention of mangrove detritus due to their shallower depths and more enclosed coastal configurations. These findings highlight the role of local hydrophysical processes and water quality in driving within-island variation. Additionally, factors such as bay dimensions (e.g., length-to-width ratios) and sediment characteristics (e.g., mineralization rates) may further contribute to elevated terrestrial inputs in these habitats. Turbidity showed a moderate positive correlation with salinity and pH, while nitrate concentrations were negatively correlated with both parameters. These patterns likely contribute to within-island variation in isotopic signatures. Salinity stress, known to reduce CO2 assimilation in mangroves (McKee et al., 2002), may lead to more enriched δ¹³C values at higher-salinity sites, while lower pH levels could indicate anthropogenic pollution (Fry et al., 2000). Notably, the elevated mangrove δ¹5N values and lower pH observed at Estación—located near the Galapagos main urban center—likely reflect increased anthropogenic inputs, such as wastewater discharge (Fernández, 2008; Liu and d’Ozouville, 2013; Martin et al., 2015). These findings suggest that spatial patterns in isotopic composition are shaped not only by variations in resource use but also by shifts in isotopic baselines influenced by local environmental and anthropogenic conditions.
Marine isoscapes play a crucial role in assessing spatial variation in resource partitioning across a range of scales, from local islands and bioregions within the Galapagos to broader TEP insular and mainland ecosystems. The steep-slope shelf of the Galapagos, coupled with the absence of seagrass habitats, likely enhances fish dependence on mangrove nurseries compared to other regions. Given the Galapagos Islands’ vulnerability to ocean-climate variability, expanding this approach to examine temporal shifts in isotopic baselines—particularly in response to ENSO cycles—could provide valuable insights into the effects of climate change on mangrove food webs and fisheries.
5 Conclusions
Mangrove-derived organic carbon is crucial for sustaining local food webs and fisheries in the Galapagos Islands. This study utilizes stable isotopes of carbon and nitrogen to trace the dietary contributions of primary producers and carbon sources within Galapagos mangrove ecosystems. δ¹³C variation was key in distinguishing terrestrial inputs, such as mangrove leaves and epiphytic algae, from marine contributions, while δ¹5N effectively separated marine autochthonous/benthic sources, including benthic algae, from allochthonous/pelagic sources like floating seaweed. We demonstrate that many consumers, such as brachyuran megalopae, rely heavily on mangrove detritus and epiphytes, with mangrove carbon contributing up to 50% of their diet. Although preliminary, these results emphasize the pivotal role of mangroves in supporting biodiversity and local fisheries, reinforcing the growing body of literature around the ‘food availability’ hypothesis.
In the shallower, more turbid bays of Garrapatero, Tortuga Bay, and (Playa) Alemanes, while most consumers still predominantly rely on algal-based food webs, key species such as herbivorous brachyuran larvae, detritivorous cumaceans, and benthic omnivorous lobster larvae play a crucial role in recycling mangrove-derived carbon and transferring it across the complex food web. This underscores the need for a more comprehensive understanding of how habitat conditions and environmental variability shape food availability, both within the archipelago and across broader scales.
As mangrove ecosystems are intricately linked to rocky shore and adjacent subtidal habitats, their environmental complexity likely reduces predation risk and provides essential shelter—factors that may be just as critical as their nutritional contribution. This underscores the importance of viewing mangroves not as isolated habitats, but as integral components of interconnected coastal seascapes, closely tied to offshore reefs and shallow seamounts. Future studies employing both natural and artificial markers (e.g., chemical tracers, telemetry) could further illuminate population connectivity and the role of mangroves in supporting economically valuable species.
Future mangrove research must integrate SIA with environmental data (e.g., hydrophysical, geomorphological, and ecological factors) across multiple spatial and temporal scales to assess the nursery function and variability of these ecosystems. However, ensuring the resilience of mangrove nursery habitats in a rapidly changing world requires us to equally recognize their socioeconomic and cultural importance—particularly for communities dependent on mangroves for recreation, fisheries livelihoods, and heritage. A comprehensive understanding of both the ecological and social dimensions of mangrove-fishery linkages, along with the human pressures that threaten them, is essential for developing effective conservation and ecosystem-based fisheries management. This holistic approach is vital not only for the GMR but also for safeguarding mangrove ecosystems across the TEP and globally.
Statements
Data availability statement
The raw data supporting the conclusions of this article will be made available by the authors, without undue reservation.
Author contributions
JP: Conceptualization, Data curation, Formal analysis, Investigation, Methodology, Writing – original draft, Writing – review & editing, Visualization. AV: Data curation, Formal analysis, Methodology, Writing – review & editing, Writing – original draft. NM: Data curation, Formal analysis, Writing – review & editing. JR: Supervision, Writing – review & editing. MR: Methodology, Writing – review & editing. MB: Supervision, Writing – review & editing. TM: Conceptualization, Methodology, Resources, Writing – review & editing, Supervision. JB: Project administration, Supervision, Writing – review & editing. PG: Project administration, Supervision, Writing – review & editing.
Funding
The author(s) declare that financial support was received for the research and/or publication of this article. This study was conducted for the purpose of a PhD program, in which JP-C obtained support from the Special Research Fund (BOF) from Ghent University (UGent; 01W09317), and Escuela Superior Politecnica del Litoral (ESPOL) to conduct his studies. In addition, sampling campaigns and SIA lab procedures were financed through a Global Minds Fund operational grant (number 27919-1; UGent via VLIR-UOS) and infrastructure was funded by the EMBRC Belgium-FWO research infrastructure (project number I001621). Publication fees were made possible through the Global Minds Structural International Partnerships (SIP) collaboration with ESPOL.
Acknowledgments
We extend our sincere gratitude to the Galapagos National Park Directorate for their consent to conduct this research under permits No. PC-13-18, PC-02-19, and PC-37-19. We are particularly thankful to the park rangers and administrative staff for their support during the planning and sampling campaigns. Additionally, we appreciate the Galapagos Biosecurity Agency for granting sample mobilization rights, including inter-island transport, and the Charles Darwin Foundation for their ongoing support. Special thanks to María Isabel Timpe for her invaluable assistance in organizing the field campaigns, and to Diana Castillo and Javier Farraye for their dedicated help with sampling. We also extend our gratitude to Andrea Rosado, Rebeca Parra, Dr. Luis Domínguez (from CADS-ESPOL), Bruno Vlaeminck, and Annick Van Kenhove (Marine Biology Research Group’s Lab-UGent) for their expert handling of lab procedures. Also, to the members of the lab of Prof. Dr. Steven Bouillon at the Department of Earth and Environmental Sciences of the Catholic University of Leuven (KULeuven) for conducting all SIA. We are grateful to Juan Carlos Cedeño for his help with map elaboration. Moreover, we would like to thank Andrew Parnell and Andrew Jackson for their expertise and guidance in Stable Isotope Mixing Models, provided during a course organized by PR Statistics, which JP and AV attended. This manuscript builds upon research previously presented in a chapter of JP’s doctoral dissertation (Pontón-Cevallos, 2023), with notable differences in the results and discussion sections. This publication is contribution number 2480 of the Charles Darwin Foundation for the Galapagos Islands.
Conflict of interest
The authors declare that the research was conducted in the absence of any commercial or financial relationships that could be construed as a potential conflict of interest.
Generative AI statement
The author(s) declare that Generative AI was used in the creation of this manuscript. ChatGPT (version GPT-4-turbo; OpenAI) was used in the editing of certain text fragments in this manuscript. No original content was retrieved from the platform.
Publisher’s note
All claims expressed in this article are solely those of the authors and do not necessarily represent those of their affiliated organizations, or those of the publisher, the editors and the reviewers. Any product that may be evaluated in this article, or claim that may be made by its manufacturer, is not guaranteed or endorsed by the publisher.
Supplementary material
The Supplementary Material for this article can be found online at: https://www.frontiersin.org/articles/10.3389/fmars.2025.1571071/full#supplementary-material
Footnotes
1.^Although most studies have traditionally applied TEF values with lower δ¹³C and higher δ¹N (e.g., Post, 2002; McCutchan et al., 2003), these estimates were derived from organisms inhabiting different ecosystems—such as pelagic environments—where consumer communities often span a wider range of TLs. In contrast, the TEFs used in our study were derived from a similar composition of consumer taxa in mangrove ecosystems in northern Brazil, and they aligned more closely with our data. These TEFs better matched our model assumptions, as indicated by most consumer points falling within the source convex hull (Figure 2).
2.^The isotopic values for MPB used in Medina-Contreras et al. (2023) were derived from aggregated results of 17 studies spanning the global mangrove distribution, including Medina-Contreras et al. (2020) from the Pacific coast of Colombia. Although the δ¹³C value reported by the latter study (−20.6±1.7‰) closely matched our single observation, we chose to adopt the global mean and standard deviation as theoretical values for our analysis. This decision reflects the recognition that geographic proximity does not necessarily equate to isotopic similarity (Kurle and McWhorter, 2017).
3.^Theoretical δN value for MPB (see Section 2.4.2 and Table 1).
References
1
AbrantesK. G.JohnstonR.ConnollyR. M.SheavesM. (2015). Importance of mangrove carbon for aquatic food webs in wet–dry tropical estuaries. Estuar. Coast.38, 383–399. doi: 10.1007/s12237-014-9817-2
2
AbrantesK.SheavesM. (2009). Food web structure in a near-pristine mangrove area of the Australian Wet Tropics. Estuar. Coast. Shelf S.82, 597–607. doi: 10.1016/j.ecss.2009.02.021
3
Aburto-OropezaO.EzcurraE.DanemannG.ValdezV.MurrayJ.SalaE. (2008). Mangroves in the Gulf of California increase fishery yields. Proc. Natl. Acad. Sci. U.S.A.105, 10456–10459. doi: 10.1073/pnas.0804601105
4
AguaizaC.MumbyP. J.Rastoin-LaplaneE.Aburto-OropezaO.Salinas-De-LeónP. (2024). Mangroves as nursery habitats for Galapagos reef fishes. Mar. Ecol. Prog. Ser.747, 99–115. doi: 10.3354/meps14702
5
AltabetM. A. (2001). Nitrogen isotopic evidence for micronutrient control of fractional NO3– utilization in the Equatorial Pacific. Limnol. Oceanogr.46, 368–380. doi: 10.4319/lo.2001.46.2.0368
6
AndersonM. J. (2004). PERMDISP: a FORTRAN Computer Program for Permutational Analysis of Multivariate Dispersions (for any Two-factor ANOVA design) using Permutation Tests (Auckland: Department of Statistics, University of Auckland).
7
AndersonM. J.GorleyR. N.ClarkeK. R. (2008). PERMANOVA+ for PRIMER: Guide to Software and Statistical Methods (Plymouth, UK: PRIMER-E Ltd).
8
BanksS. A. (2002). “Ambiente físico,” in Reserva Marina de Galápagos: Línea Base de la Biodiversidad. Eds. DanulatE.EdgarG. J. (Fundación Charles Darwin and Servicio Parque Nacional de Galápagos, Puerto Ayora, Galápagos), 146–165.
9
BarbierE. B.HackerS. D.KennedyC.KochE. W.StierA. C.SillimanB. R. (2011). The value of estuarine and coastal ecosystem services. Ecol. Monogr.81, 169–193. doi: 10.1890/10-1510.1
10
BeckM. W.HeckK. L.AbleK. W.ChildersD. L.EgglestonD. B.GillandersB. M.et al. (2001). The identification, conservation, and management of estuarine and marine nurseries for fish and invertebrates: A better understanding of the habitats that serve as nurseries for marine species and the factors that create site-specific variability in nursery quality will improve conservation and management of these areas. Bioscience51, 633–641. doi: 10.1641/0006-3568(2001)051[0633:TICAMO]2.0.CO;2
11
BenzeevR.HutchinsonN.FriessD. A. (2017). Quantifying fisheries ecosystem services of mangroves and tropical artificial urban shorelines. Hydrobiologia803, 225–237. doi: 10.1007/s10750-017-3299-8
12
BlaberS. J. M. (2007). Mangroves and fishes: issues of diversity, dependence, and dogma. B. Mar. Sci.80, 457–472.
13
BlanchetF. G.LegendreP.BorcardD. (2008). Forward selection of explanatory variables. Ecology89, 2623–2632. doi: 10.1890/07-0986.1
14
BouillonS.ConnollyR. M.LeeS. Y. (2008). Organic matter exchange and cycling in mangrove ecosystems: recent insights from stable isotope studies. J. Sea. Res.59, 44–58. doi: 10.1016/j.seares.2007.05.001
15
BouillonS.DehairsF.VelimirovB.AbrilG.BorgesA. V. (2007). Dynamics of organic and inorganic carbon across contiguous mangrove and seagrass systems (Gazi bay, Kenya). J. Geophys. Res.-Biogeo112, G02018. doi: 10.1029/2006JG000325
16
BouillonS.KoedamN.RamanA.DehairsF. (2002). Primary producers sustaining macro-invertebrate communities in intertidal mangrove forests. Oecologia130, 441–448. doi: 10.1007/s004420100814
17
BouillonS.MoensT.OvermeerI.KoedamN.DehairsF. (2004). Resource utilization patterns of epifauna from mangrove forests with contrasting inputs of local versus imported organic matter. Mar. Ecol. Prog. Ser.278, 77–88. doi: 10.3354/meps278077
18
BuiT. H. H.LeeS. Y. (2014). Does “you are what you eat” apply to mangrove grapsid crabs? PloS One9, e89074. doi: 10.1371/journal.pone.0089074
19
Castellanos-GalindoG.A.KrummeU.RubioE.A.Saint-PaulU. (2013). Spatial variability of mangrove fish assemblage composition in the Tropical Eastern Pacific Ocean. Rev. Fish. Biol. Fisher. 23, 69–86. doi: 10.1007/s11160-012-9276-4
20
CastrejónM. (2011). Co-Manejo Pesquero en la Reserva Marina de Galápagos - Tendencias, Retos y Perspectivas de Cambio (México, D.F: Fundación Charles Darwin, Kanankil, Plaza y Valdés).
21
CattinM. F.BersierL. F.Banašek-RichterC.BaltenspergerR.GabrielJ. P. (2004). Phylogenetic constraints and adaptation explain food-web structure. Nature427, 835–839. doi: 10.1038/nature02327
22
Chiriboga-ParedesY.PalominoÁ.GoodmanL.CórdovaF.PáezV.YépezM.et al. (2022). Discovery of a Putative Scalloped Hammerhead Shark Sphyrna lewini (Carcharhiniformes: Sphyrnidae) Nursery Site at the Galapagos Islands, Eastern Tropical Pacific. Environ. Biol. Fish.105, 181–192. doi: 10.1007/s10641-021-01207-3
23
CifuentesL. A.CoffinR. B.SolorzanoL.CardenasW.EspinozaJ.TwilleyR. R. (1996). Isotopic and elemental variations of carbon and nitrogen in a mangrove estuary. Estuar. Coast. ShelfS. 43, 781–800. doi: 10.1006/ecss.1996.0103
24
Cocheret de la MorinièreE.PolluxB. J. A.NagelkerkenI.HemmingaM. A.HuiskesA. H. L.van der VeldeG. (2003). Ontogenetic dietary changes of coral reef fishes in the mangrove-seagrass-reef continuum: stable isotopes and gut-content analysis. Mar. Ecol. Prog. Ser.246, 279–289. doi: 10.3354/meps246279
25
DueñasA.Jiménez-UzcáteguiG.BoskerT. (2021). The effects of climate change on wildlife biodiversity of the Galapagos Islands. Climate Change Ecol.2, 100026. doi: 10.1016/j.ecochg.2021.100026
26
EatonJ. W.MossB. (1966). The estimation of numbers and pigment content in epipelic algal populations. Limnol. Oceanogr.11, 584–595. doi: 10.4319/lo.1966.11.4.0584
27
EdgarG. J.BanksS.FariñaJ. M.CalvopiñaM.MartínezC. (2004). Regional biogeography of shallow reef fish and macro-invertebrate communities in the Galapagos Archipelago. J. Biogeogr.31, 1107–1124. doi: 10.1111/j.1365-2699.2004.01055.x
28
Esri Inc (2020). ArcGIS Pro (Version 2.5) (Redlands, CA: Esri Inc). Available at: https://www.esri.com/en-us/arcgis/products/arcgis-pro/overview (Accessed September 26, 2022).
29
EwelK.TwilleyR.OngJ. I. N. (1998). Different kinds of mangrove forests provide different goods and services. Global Ecol. Biogeogr.7, 83–94. doi: 10.1111/j.1466-8238.1998.00275.x
30
FaunceC. H.LaymanC. A. (2009). “Sources of variation that affect perceived nursery function of mangroves,” in Ecological Connectivity among Tropical Coastal Ecosystems. Ed. NagelkerkenI. (Springer Netherlands, Dordrecht), 401–421. doi: 10.1007/978-90-481-2406-011
31
FernándezA. R. (2008). Coastal Nutrient and Water Budget Assessments for Puerto Ayora, Academy Bay, Santa Cruz Island (Santa Cruz Island, Galapagos: The Significant Opportunities in Atmospheric Research and Science (SOARS) Report).
32
Fierro-ArcosD.Marín-JarrínJ. R.Aburto-OropezaO.HarveyE. S.Rastoin-LaplaneE.Salinas-de-LeónP. (2021). Mangrove fish assemblages reflect the environmental diversity of the Galapagos Islands. Mar. Ecol. Prog. Ser.664, 183–205. doi: 10.3354/meps13628
33
FloydK. B.CourtenayW. H.HoytR. D. (1984). A new larval fish light trap: the quatrefoil trap. Prog. Fish Cult.46, 216–219. doi: 10.1577/1548-8640(1984)46<216:ANLFLT>2.0.CO;2
34
FourqureanJ. W.SchrlauJ. E. (2003). Changes in Nutrient Content and Stable Isotope Ratios of C and N during Decomposition of Seagrasses and Mangrove Leaves along a Nutrient Availability Gradient in Florida Bay, USA. Chem. Ecol.19, 373–390. doi: 10.1080/02757540310001609370
35
FranceR. L. (1998). Estimating the assimilation of mangrove detritus by fiddler crabs in Laguna Joyuda, Puerto Rico, using dual stable isotopes. J. Trop. Ecol.14, 413–425. doi: 10.1017/S0266467498000315
36
FryB. (2006). Stable Isotope Ecology (New York, NY: Springer).
37
FryB.BernA. L.RossM. S.MeederJ. F. (2000). δ15N studies of nitrogen use by the red mangrove, Rhizophora mangle L. in South Florida. Estuar. Coast. Shelf S.50, 291–296. doi: 10.1006/ecss.1999.0558
38
GagnonK.RothäuslerE.SyrjänenA.Yli-RenkoM.JormalainenV. (2013). Seabird guano fertilizes Baltic Sea littoral food webs. PloS One8, e61284. doi: 10.1371/journal.pone.0061284
39
GiarrizzoT.SchwambornR.Saint-PaulU. (2011). Utilization of carbon sources in a Northern Brazilian mangrove ecosystem. Estuar. Coast. Shelf S.95, 447–457. doi: 10.1016/j.ecss.2011.10.018
40
GreenacreM. (2020). “easyCODA: compositional data analysis in practice,” in R Package v.0.34.3. Available at: https://cran.r-project.org/web/packages/easyCODA/index.html (Accessed May 28, 2025).
41
GruberN.SarmientoJ. L. (1997). Global patterns of marine nitrogen fixation and denitrification. Global Biogeochem. Cy.11, 235–266. doi: 10.1029/97GB00077
42
HeylingsP.Bensted-SmithR.AltamiranoM. (2002). “Zonificación e Historia de la Reserva Marina de Galápagos,” in Reserva Marina de Galápagos: Línea Base de la Biodiversidad. Eds. DanulatE.EdgarG. J. (Fundación Charles Darwin and Servicio Parque Nacional de Galápagos, Puerto Ayora, Galápagos), 10–22.
43
HogarthP. J. (2015). The Biology of Mangroves and Seagrasses. 3rd ed (Oxford, UK and New York, NY: Oxford University Press).
44
HsiehH. L.ChenC. P.ChenY. G.YangH. H. (2002). Diversity of benthic organic matter flows through polychaetes and crabs in a mangrove estuary: δ13C and δ34S signals. Mar. Ecol. Prog. Ser.227, 145–155. doi: 10.3354/meps227145
45
IguluM. M.NagelkerkenI.DorenboschM.GrolM. G. G.HarborneA. R.KimireiI. A.et al. (2014). Mangrove habitat use by juvenile reef fish: meta-analysis reveals that tidal regime matters more than biogeographic region. PloS One9, e114715. doi: 10.1371/journal.pone.0114715
46
JaschinskiS.HansenT.SommerU. (2008). Effects of acidification in multiple stable isotope analyses. Limnol. Oceanogr.-Meth.6, 12–15. doi: 10.4319/lom.2008.6.12
47
JeffsA.O’RorkeR. (2020). “Feeding and nutrition of crustacean larvae,” in The Natural History of the Crustacea: Developmental Biology and Larval Ecology (Oxford University Press, New York, NY), 309–331.
48
JennerjahnT. C.IttekkotV. (2002). Relevance of mangroves for the production and deposition of organic matter along tropical continental margins. Naturwissenschaften89, 23–30. doi: 10.1007/s00114-001-0283-x
49
KeeleyJ. E. (1999). Photosynthetic pathway diversity in a seasonal pool community. Funct. Ecol.13, 106–118. doi: 10.1046/j.1365-2435.1999.00294.x
50
KieckbuschD. K.KochM. S.SerafyJ. E.AndersonW. T. (2004). Trophic linkages among primary producers and consumers in fringing mangroves of subtropical lagoons. B. Mar. Sci.74, 271–285.
51
KimireiI. A.NagelkerkenI.MgayaY. D.HuijbersC. M. (2013). The Mangrove Nursery Paradigm Revisited: Otolith Stable Isotopes Support Nursery-to-Reef Movements by Indo-Pacific Fishes. PloS One8, 66320. doi: 10.1371/journal.pone.0066320
52
KristensenE.LeeS. Y.MangionP.QuintanaC. O.ValdemarsenT. (2017). Trophic discrimination of stable isotopes and potential food source partitioning by leaf-eating crabs in mangrove environments. Limnol. Oceanogr.62, 2097–2112. doi: 10.1002/lno.10553
53
KurleC. M.McWhorterJ. K. (2017). Spatial and temporal variability within marine isoscapes: implications for interpreting stable isotope data from marine systems. Mar. Ecol. Prog. Ser.568, 31–45. doi: 10.3354/meps12045
54
LaegdsgaardP.JohnsonC. R. (1995). Mangrove habitats as nurseries: unique assemblages of juvenile fish in subtropical mangroves in eastern Australia. Mar. Ecol. Prog. Ser.126, 67–81. doi: 10.3354/meps126067
55
LeeS. Y. (1999). Tropical mangrove ecology: physical and biotic factors influencing ecosystem structure and function. Aust. J. Ecol.24, 355–366. doi: 10.1046/j.1442-9993.1999.00984.x
56
LeeS. Y.PrimaveraJ. H.Dahdouh-GuebasF.McKeeK.BosireJ. O.CannicciS.et al. (2014). Ecological role and services of tropical mangrove ecosystems: a reassessment. Global Ecol. Biogeogr.23, 726–743. doi: 10.1111/geb.12155
57
LinG. H.SternbergL. D. S. (1992). Effect of growth form, salinity, nutrient and sulfide on photosynthesis, carbon isotope discrimination and growth of red mangrove (Rhizophora mangle L.). Funct. Plant Biol.19, 509–517. doi: 10.1071/PP9920509
58
LitvinS. Y.WeinsteinM. P.SheavesM.NagelkerkenI. (2018). What makes nearshore habitats nurseries for nekton? An emerging view of the nursery role hypothesis. Estuar. Coast.41, 1539–1550. doi: 10.1007/s12237-018-0383-x
59
LiuJ.d’OzouvilleN. (2013). “Water contamination in Puerto Ayora: applied interdisciplinary research using Escherichia coli as an indicator bacteria,” in Galapagos Report 2011-2012 (Galapagos National Park Directorate, CGREG, Charles Darwin Foundation and Galapagos Conservancy, Puerto Ayora, Galapagos), 76–83.
60
Llerena-MartilloY.Peñaherrera-PalmaC.EspinozaE. R.Llerena-MartilloY.Peñaherrera-PalmaC.EspinozaE. R. (2018). Fish assemblages in three fringed mangrove bays of Santa Cruz Island, Galapagos Marine Reserve. Rev. Biol. Trop.66, 674–687. doi: 10.15517/rbt.v66i2.33400
61
LonghurstA. (1998). Ecological Geography of the Sea (San Diego, CA: Academic Press).
62
LorrainA.GrahamB. S.PoppB. N.AllainV.OlsonR. J.HuntB. P.et al. (2015). Nitrogen isotopic baselines and implications for estimating foraging habitat and trophic position of yellowfin tuna in the Indian and pacific oceans. Deep-Sea. Res. Pt. II113, 188–198. doi: 10.1016/j.dsr2.2014.02.003
63
Mancera-PinedaJ. E.TwilleyR. R.Rivera-MonroyV. H. (2009). Carbon (δ13C) and nitrogen (δ15N) isotopic discrimination in mangroves in Florida coastal Everglades as a function of environmental stress. Contrib. Mar. Sci.38, 109–129.
64
MartinM.HaerdterU.PoehlmannH.ValdésA. (2015). “Monitoring environmental indicators on Isabela Island to prevent and reduce pollution,” in Galapagos Report 2013-2014 (Galapagos National Park Directorate, CGREG, Charles Darwin Foundation and Galapagos Conservancy, Puerto Ayora, Galapagos), 40–45.
65
Martínez-ArbizúP. (2020). “pairwiseAdonis: Pairwise Multilevel Comparison using Adonis,” in R Package v.0.4. Available at: https://github.com/pmartinezarbizu/pairwiseAdonis (Accessed May 28, 2025).
66
McCutchanJ. H.Jr.LewisW. M.Jr.KendallC.McGrathC. C. (2003). Variation in trophic shift for stable isotope ratios of carbon, nitrogen, and sulfur. Oikos102, 378–390. doi: 10.1034/j.1600-0706.2003.12098.x
67
McKeeK. L.FellerI. C.PoppM.WanekW. (2002). Mangrove Isotopic (δ15N and δ13C) Fractionation across a Nitrogen vs. Phosphorus Limitation Gradient. Ecology83, 1065–1075. doi: 10.1890/0012-9658(2002)083[1065:MINACF]2.0.CO;2
68
McLeodL. E.CostelloM. J. (2017). Light traps for sampling marine biodiversity. Helgoland Mar. Res.71, 2. doi: 10.1186/s10152-017-0483-1
69
MedinaE.FranciscoM. (1997). Osmolality and δ13C of leaf tissues of mangrove species from environments of contrasting rainfall and salinity. Estuar. Coast. Shelf S.45, 337–344. doi: 10.1006/ecss.1996.0188
70
Medina-ContrerasD.ArenasF.SánchezA. (2024). “Mangrove food web structure and isotopic niche,” in Treatise on Estuarine and Coastal Science, 2nd edition. Eds. BairdD.ElliottM. (Elsevier, London), 305–324. doi: 10.1016/B978-0-323-90798-9.00003-2
71
Medina-ContrerasD.Arenas-GonzálezF.Cantera-KintzJ.Sánchez-GonzálezA.GiraldoA. (2020). Food web structure and isotopic niche in a fringe macro-tidal mangrove system, Tropical Eastern Pacific. Hydrobiologia847, 3185–3199. doi: 10.1007/s10750-020-04295-x
72
Medina-ContrerasD.Cantera-KintzJ.Sánchez-GonzálezA.ManceraE. (2018). Food web structure and trophic relations in a riverine mangrove system of the Tropical Eastern Pacific, central coast of Colombia. Estuar. Coast.41, 1511–1521. doi: 10.1007/s12237-017-0350-y
73
Medina-ContrerasD.Sánchez-GonzálezA.Arenas-GonzálezF. (2023). Macroinvertebrates food web and trophic relations of a peri-urban mangrove system in a semi-arid region, Gulf of California, México. J. Mar. Syst.240, 103864. doi: 10.1016/j.jmarsys.2023.103864
74
MohanP. C.RaoR. G.DehairsF. (1997). Role of godavari mangroves (India) in the production and survival of prawn larvae. Hydrobiologia358, 317–320. doi: 10.1023/A:1003105508328
75
MoityN. (2018). Evaluation of No-Take Zones in the Galapagos Marine Reserve, Zoning Plan 2000. Front. Mar. Sci.5. doi: 10.3389/fmars.2018.00244
76
MoityN. (2019). Marine Bioregions for Coastal Subtidal Shallow Rocky Reef of the Galapagos Archipelago, GIS Layer for Edgar et al. 2004. Pangea. doi: 10.1594/PANGAEA.907105
77
MoityN.DelgadoB. (2018). “Manglares,” in Atlas de Galápagos, Ecuador: Especies Nativas e Invasoras (Fundación Charles Darwin and WWF-Ecuador, Quito), 61–63.
78
MoityN.DelgadoB.Salinas-de-LeónP. (2019). Mangroves in the Galapagos Islands: distribution and dynamics. PloS One14, e0209313. doi: 10.1371/journal.pone.0209313
79
MolinaL.DanulatE.OviedoM.GonzálezJ. A. (2004). Guı́a de Especies de Interés Pesquero en La Reserva Marina de Galápagos (Puerto Ayora, Galápagos: Fundación Charles Darwin, Agencia Española de Cooperación Internacional and Dirección Parque Nacional Galápagos).
80
MuellerK. P.NeuhaussS. C. (2010). Behavioral neurobiology: how larval fish orient towards the light. Curr. Biol.20, R159–R161. doi: 10.1016/j.cub.2009.12.028
81
NagelkerkenI.BlaberS. J. M.BouillonS.GreenP.HaywoodM.KirtonL. G.et al. (2008). The habitat function of mangroves for terrestrial and marine fauna: a review. Aquat. Bot.89, 155–185. doi: 10.1016/j.aquabot.2007.12.007
82
NagelkerkenI.de SchryverA. M.VerweijM. C.Dahdouh-GuebasF.van der VeldeG.KoedamN. (2010). Differences in root architecture influence attraction of fishes to mangroves: a field experiment mimicking roots of different length, orientation, and complexity. J. Exp. Mar. Biol. Ecol.396, 27–34. doi: 10.1016/j.jembe.2010.10.002
83
NagelkerkenI.FaunceC. H. (2008). What makes mangroves attractive to fish? Use of artificial units to test the influence of water depth, cross-shelf location, and presence of root structure. Estuar. Coast. ShelfS. 79, 559–565. doi: 10.1016/j.ecss.2008.04.011
84
NagelkerkenI.SheavesM.BakerR.ConnollyR. M. (2015). The seascape nursery: a novel spatial approach to identify and manage nurseries for coastal marine fauna. Fish Fish.16, 362–371. doi: 10.1111/faf.12057
85
O’LearyM. H. (1981). Carbon isotope fractionation in plants. Phytochemistry20, 553–567. doi: 10.1016/0031-9422(81)85134-5
86
OksanenJ.SimpsonG.BlanchetF.KindtR.LegendreP.MinchinP.et al. (2022). “vegan: community ecology package,” in R package v.2.6-2. Available at: https://CRAN.R-project.org/package=vegan (Accessed May 28, 2025).
87
PalaciosD. M. (2004). Seasonal patterns of sea-surface temperature and ocean color around the Galapagos: regional and local influences. Deep-Sea. Res. Pt. II51, 43–57. doi: 10.1016/j.dsr2.2003.08.001
88
ParnellA. C. (2021). “SIMMR: a stable isotope mixing model,” in in R Package v.0.4.5. Available at: https://cran.r-project.org/web/packages/simmr/index.html (Accessed May, 28 2025).
89
ParnellA. C.PhillipsD. L.BearhopS.SemmensB. X.WardE. J.MooreJ. W.et al. (2013). Bayesian stable isotope mixing models. Environmetrics24, 387–399. doi: 10.1002/env.2221
90
PinnegarJ. K.PoluninN. V. C. (1999). Differential fractionation of δ13C and δ15N among fish tissues: implications for the study of trophic interactions. Funct. Ecol.13, 225–231. doi: 10.1046/j.1365-2435.1999.00301.x
91
PlumleeJ. D.KenworthyM. D.GittmanR. K.KellerD. A.GarnettE. E.Vaca-PitaL.et al. (2022). Remarkable euryhalinity of a marine fish Lutjanus novemfasciatus in mangrove nurseries. Ecology103, e03582. doi: 10.1002/ecy.3582
92
Pontón-CevallosJ. F. (2023). Linkages between mangroves and fisheries in the Galapagos: ecological, social and management perspectives. Ghent University, Ghent.
93
Pontón-CevallosJ. F.Ramírez-ValarezoN.Pozo-CajasM.Rodríguez-JácomeG.Navarrete-ForeroG.MoityN.et al. (2022). Fishers’ Local Ecological Knowledge to support mangrove research in the Galapagos. Front. Mar. Sci.9. doi: 10.3389/fmars.2022.911109
94
PoppB. N.GrahamB. S.OlsonR. J.HannidesC. C.LottM. J.López-IbarraG. A.et al. (2007). Insight into the Trophic Ecology of Yellowfin Tuna, Thunnus albacares, from Compound-Specific Nitrogen Isotope Analysis of Proteinaceous Amino Acids. Terrestrial Ecol.1, 173–190. doi: 10.1016/S1936-7961(07)01012-3
95
PostD. M. (2002). Using stable isotopes to estimate trophic position: models, methods, and assumptions. Ecology83, 703–718. doi: 10.1890/0012-9658(2002)083[0703:USITET]2.0.CO;2
96
R Core Team (2021). R: A Language and Environment for Statistical Computing (Vienna: R Foundation for Statistical Computing). Available at: https://www.R-project.org/ (Accessed May, 28 2025).
97
RodelliM. R.GearingJ. N.GearingP. J.MarshallN.SasekumarA. (1984). Stable isotope ratio as a tracer of mangrove carbon in Malaysian ecosystems. Oecologia61, 326–333. doi: 10.1007/BF00379629
98
Rodríguez-RodríguezJ. A.PinedaJ. E. M.MelgarejoL. M.CalderónJ. H. M. (2018). Functional traits of leaves and forest structure of neotropical mangroves under different salinity and nitrogen regimes. Flora239, 52–61. doi: 10.1016/j.flora.2017.11.004
99
RookerJ. R.DanceM. A.WellsR. J. D.QuiggA.HillR. L.AppeldoornR. S.et al. (2018). Seascape connectivity and the influence of predation risk on the movement of fishes inhabiting a back-reef ecosystem. Ecosphere9, e02200. doi: 10.1002/ecs2.2200
100
SánchezA.Rodríguez-FigueroaG.ShumilinE.Ortiz-HernándezM. C. (2018). Evidence of intense suboxia and anoxia in a tropical bay of the Gulf of California. Cont. Shelf Res.168, 21–27. doi: 10.1016/j.csr.2018.09.006
101
SandovalL. A.Mancera-PinedaJ. E.Leal-FlórezJ.Blanco-LibrerosJ. F.Delgado-HuertasA. (2022). Mangrove carbon sustains artisanal fish and other estuarine consumers in a major mangrove area of the southern Caribbean Sea. Mar. Ecol. Prog. Ser.681, 21–35. doi: 10.3354/meps13910
102
SchloerkeB.CookD.LarmarangeJ.BriatteF.MarbachM.ThoenE.et al. (2024). “GGally: extension to ‘ggplot2’,” in R package version 2.1.2. Available at: https://CRAN.R-project.org/package=GGally (Accessed May, 28 2025).
103
SchwambornR.EkauW.VossM.Saint-PaulU. (2002). How important are mangroves as a carbon source for decapod crustacean larvae in a tropical estuary? Mar. Ecol. Prog. Ser.229, 195–205. doi: 10.3354/meps229195
104
SchwambornR.GiarrizzoT. (2015). Stable isotope discrimination by consumers in a tropical mangrove food web: how important are variations in C/N ratio? Estuar. Coast.38, 813–825. doi: 10.1007/s12237-014-9871-9
105
SecorD. H.DeanJ. M.HansbargerJ. (1992). Technical NOTES modification of the quatrefoil light trap for use in hatchery ponds. Prog. Fish Cult.54, 202–205. doi: 10.1577/1548-8640(1992)054<0202:TNMOTQ>2.3.CO;2
106
Sepúlveda-LozadaA.Mendoza-CarranzaM.WolffM.Saint-PaulU.Ponce-MendozaA. (2015). Differences in food web structure of mangroves and freshwater marshes: evidence from stable isotope studies in the Southern Gulf of Mexico. Wetl. Ecol. Manage.23, 293–314. doi: 10.1007/s11273-014-9382-2
107
SnellH. M.StoneP. A.SnellH. L. (1996). A summary of geographical characteristics of the Galapagos Islands. J. Biogeogr.23, 619–624. doi: 10.1111/j.1365-2699.1996.tb00022.x
108
StockB. C.JacksonA. L.WardE. J.ParnellA. C.PhillipsD. L.SemmensB. X. (2018). Analyzing mixing systems using a new generation of Bayesian tracer mixing models. PeerJ6, e5096. doi: 10.7717/peerj.5096
109
StockB.SemmensB. (2016). Unifying error structures in commonly used biotracer mixing models. Ecology97, 2562–2569. doi: 10.1002/ecy.1517
110
SweetW. V.MorrisonJ. M.KamykowskiD.SchaefferB. A.BanksS.McCullochA. (2007). Water mass seasonal variability in the Galapagos Archipelago. Deep-Sea. Res. Pt. I54, 2023–2035. doi: 10.1016/j.dsr.2007.09.009
111
ThenA. Y. H.AdameM. F.FryB.ChongV. C.RiekenbergP. M.Mohammad ZakariaR.et al. (2021). Stable isotopes clearly track mangrove inputs and food web changes along a reforestation gradient. Ecosystems24, 939–954. doi: 10.1007/s10021-020-00561-0
112
UEA Climatic Research Unit (UEACRU)HarrisI.JonesP. D.OsbornT. J.ListerD. H. (2021). CRU time series (TS) high-resolution gridded datasets of month-by-month variation in climate (Jan. 1901 - dec. 2020), version 4.05 (Centre for Environmental Data Analysis). Available at: https://catalogue.ceda.ac.uk/uuid/c5b7f737a2704312b7d8e6a72a7a51dd. (Accessed March 20, 2023).
113
VafeiadouA. M.MateratskiP.AdaoH.De TrochM.MoensT. (2013). Food sources of macrobenthos in an estuarine seagrass habitat (Zostera noltii) as revealed by dual stable isotope signatures. Mar. Biol.160, 2517–2523. doi: 10.1007/s00227-013-2238-0
114
VerweijM. C.NagelkerkenI.GraaffD.PeetersM.BakkerE. J.van der VeldeG. (2006). Structure, food and shade attract juvenile coral reef fish to mangrove and seagrass habitats: a field experiment. Mar. Ecol. Prog. Ser.306, 257–268. doi: 10.3354/meps306257
115
VianaI. G.ValielaI.MartinettoP.PierceR. M.FoxS. E. (2015). Isotopic studies in pacific Panama mangrove estuaries reveal lack of effect of watershed deforestation on food webs. Mar. Environ. Res.103, 95–102. doi: 10.1016/j.marenvres.2014.10.003
116
WardE. J.SemmensB. X.PhillipsD. L.MooreJ. W.BouwesN. (2011). A quantitative approach to combine sources in stable isotope mixing models. Ecosphere2, 1–11. doi: 10.1890/ES10-00190.1
117
WellingtonG. M. (1975). “The Galapagos coastal marine environments,” in Resource Report to the Department of National Parks and Wildlife (Quito: Ministry of Agriculture).
118
WerryJ.LeeS. Y. (2005). Grapsid crabs mediate link between mangrove litter production and estuarine planktonic food chains. Mar. Ecol. Prog. Ser.293, 165–176. doi: 10.3354/meps293165
119
WhitfieldA. K. (2017). The role of seagrass meadows, mangrove forests, salt marshes and reed beds as nursery areas and food sources for fishes in estuaries. Rev. Fish Biol. Fisher.27, 75–110. doi: 10.1007/s11160-016-9454-x
120
Wium-AndersenS.HamannO. (1986). Manglares de las Islas Galápagos. Instituto Geográfico Militar Rev. Geográfica23, 101–122.
121
WorthingtonT. A.Zu ErmgassenP. S.FriessD. A.KraussK. W.LovelockC. E.ThorleyJ.et al. (2020). A global biophysical typology of mangroves and its relevance for ecosystem structure and deforestation. Sci. Rep.-UK10, 1–11. doi: 10.1038/s41598-020-71194-5
Summary
Keywords
mangroves, Galapagos, nursery, stable isotopes, food webs, fishery production, larval stages
Citation
Pontón-Cevallos J, Vafeiadou A-M, Moity N, Ramírez-González J, Rendón MJ, Borbor-Cordova MJ, Moens T, Bermudez-Monsalve JR and Goethals P (2025) The role of mangroves in early-life trophic interactions supporting fishery production in the Galapagos. Front. Mar. Sci. 12:1571071. doi: 10.3389/fmars.2025.1571071
Received
04 February 2025
Accepted
29 May 2025
Published
27 June 2025
Volume
12 - 2025
Edited by
Ibon Galparsoro, Technological Center Expert in Marine and Food Innovation (AZTI), Spain
Reviewed by
Mario Barletta, Federal University of Pernambuco, Brazil
Diana Medina-Contreras, Centro Interdisciplinario de Ciencias Marinas (IPN), Mexico
Updates
Copyright
© 2025 Pontón-Cevallos, Vafeiadou, Moity, Ramírez-González, Rendón, Borbor-Cordova, Moens, Bermudez-Monsalve and Goethals.
This is an open-access article distributed under the terms of the Creative Commons Attribution License (CC BY). The use, distribution or reproduction in other forums is permitted, provided the original author(s) and the copyright owner(s) are credited and that the original publication in this journal is cited, in accordance with accepted academic practice. No use, distribution or reproduction is permitted which does not comply with these terms.
*Correspondence: José Pontón-Cevallos, josefernando876@gmail.com; jfponton@espol.edu.ec
‡These authors have contributed equally to this work and share first authorship
†Present address: José Pontón-Cevallos, Instituto de Ecología Aplicada, Colegio de Ciencias Biológicas y Ambientales, Universidad San Francisco de Quito, Quito, Ecuador; Nicolas Moity, Department of Biological Sciences, University of New Hampshire, Durham, NH, United States; Jorge R. Bermudez-Monsalve, Department of Plankton and Microbial Ecology, Leibniz-Institute of Freshwater Ecology and Inland Fisheries, Stechlin, Germany
Disclaimer
All claims expressed in this article are solely those of the authors and do not necessarily represent those of their affiliated organizations, or those of the publisher, the editors and the reviewers. Any product that may be evaluated in this article or claim that may be made by its manufacturer is not guaranteed or endorsed by the publisher.