Abstract
This study compared the characteristics of energy flow and food web structure in the Laizhou Bay ecosystem using the Ecopath model and linear inverse models enhanced by Monte Carlo methods coupled with a Markov Chain (LIM-MCMC), respectively, based on survey data collected in May, August, and November 2022. The ecosystem was divided into 22 functional groups with trophic levels ranging from 1.00 to 3.48 and a large proportion of predator groups. The Ecopath model estimated an overall energy transfer efficiency of 5.34%, with the detrital food chain exhibiting significantly higher energy transfer efficiency (6.73%) than the grazing food chain (5.31%). Energy flow paths in the LIM-MCMC model were classified into four primary routes, predominantly driven by respiration and the inflow of detritus at lower trophic levels, which accounted for 79.9% of the total energy flow in group a. The Ecopath model provided a connectance index of 0.30, a system omnivory index of 0.33, Finn’s mean path length of 2.46, and Finn’s cycle index of 8.18%, whereas the LIM-MCMC model produced an average path length of 2.78. Both models indicated a shorter food chain and low complexity of the food web. Total system throughput (TST) was estimated at 10,086.1 (Ecopath) and 10,968.0 t·km-2a-1(LIM-MCMC), with total respiration and total flows into detritus accounting for 41.2% and 51.1% of TST, respectively. The total primary production to total respiration ratios were 1.40 (Ecopath) and 0.86 (LIM-MCMC). Despite consistent ecosystem parameters across both models—total consumption (4,407.7 t·km-2a-1), total primary production (3,606.4 t·km-2a-1), and total biomas (151.0 t·km-2a-1)—the Ecopath model suggested a relatively mature ecosystem, whereas the LIM-MCMC model indicated that this ecosystem was in an unstable developmental stage with low energy utilisation efficiency of primary productivity
1 Introduction
As integral components of marine ecosystems, nearshore bay areas serve as crucial interfaces between terrestrial surface runoff and oceanic environments, rendering them highly vulnerable to natural environmental fluctuations and anthropogenic disturbances. Consequently, ecosystem modelling has become an essential tool for predicting and analysing changes in the structure and function of food webs, particularly in the monitoring and management of marine ecosystems (Kytinou et al., 2020). The most commonly used approaches are the Ecopath with Ecosim (Ecopath) model and linear inverse models enhanced by Monte Carlo methods coupled with a Markov Chain (LIM-MCMC), both of which are grounded in trophic dynamics. These models have been used to assess ecosystem stability and complexity. Ecopath model simulate the energy flow and food web structure by inputting ecological parameters for each functional group and quantifying key ecosystem characteristics and trophic relationships to evaluate ecosystem maturity and stability (Christensen and Walters, 2004). The LIM-MCMC, which integrates Monte Carlo methods with a linear inverse model (Van den Meersche et al., 2009), replaces conventional least squares (MN) algorithms with probabilistic sampling. This methodological innovation addresses uncertainties in both data and models by defining the minimum and maximum boundaries for each flow and the average estimates with standard deviations to be computed based on a given number of flow solutions (Chaalali et al., 2015). In particular, the model provides a better representation of low-trophic-level energy transfer processes and is particularly valuable for exploring energy flow paths within ecological networks. However, the Ecopath model has remained a cornerstone tool for studying marine food web structures, whereas the LIM-MCMC, which is predominantly used for uncertainty analyses, has gained increasing prominence in the early 21st century.
Since its introduction in the study of offshore ecosystems in China, the Ecopath model has become a pivotal tool for the overall assessment of the structure and function of diverse ecosystems. For example, He et al. (2021) compared the structure of the Xihu Harbor ecosystem between 2010 and 2020, and Gao et al. (2022) conducted a comparative study of the marine ecosystems of Haizhou Bay and the Lvsi fishing grounds. Simultaneously, the LIM-MCMC was employed to examine the complexity of food web structures and energy flows across different ecosystems. For example, Meddeb et al. (2019) combined an Ecological Network Analysis model with the LIM-MCMC to study planktonic food webs in the southwestern Mediterranean region, underscoring its value for multifunctional ecosystem analysis. However, comparative studies using both the Ecopath and LIM-MCMC within the same ecosystem are scarce. Chaalali et al. (2015) conducted a comparative analysis of the Biscay Bay ecosystem using the Ecopath model and LIM-MCMC, which further demonstrated the advantage of the LIM-MCMC in handling uncertainty that is easily overlooked in analyses based on the Ecopath model. Hossain et al. (2017) demonstrated that linear inverse modelling can be used as a complement to Ecopath applications and that there is considerable uncertainty associated with the predicted energy flows within the ecosystem of Hamilton Harbour. Therefore, the integration of both models offers a more holistic framework for assessing the structure and function of certain ecosystems. However, current research has largely employed these approaches independently, thus revealing a critical gap in exploring their combined potential (Chaalali et al., 2015). Addressing this gap through integrative studies may substantially enhance our understanding and thus help manage complex ecosystems.
Laizhou Bay, a semi-enclosed estuary in the Bohai Sea, receives nutrient inputs from the Yellow River and many other land-based runoff sources that support vital ecological functions, such as spawning, feeding, and migration (Jin et al., 2013). However, aquaculture intensity and pollution caused by human activities have surpassed the bearing capacity of Laizhou Bay, eventually leading to eutrophication and depletion of fishery resources. In particular, there has been a shift towards smaller and lower-quality fishery species (Han et al., 2021). Many studies have assessed the structure and function of the Laizhou Bay ecosystem using the Ecopath model; however, most of these studies have focused on certain areas or species for ecological assessment, such as artificial reef areas (Zhang et al., 2022a; Wang et al., 2024), and ecological capacity assessments of stock enhancement species (Feng et al., 2018; Giralt Paradell et al., 2021); thus, the ecological functions of non-fishery species in energy flow and transfer have been overlooked, which limits the comprehensive understanding of the structure and health of the Laizhou Bay ecosystem (Ju et al., 2020). This comparative study of the Ecopath model and LIM-MCMC was conducted to evaluate the characteristics of energy flow and food web structure in the Laizhou Bay ecosystem. The findings of this study provide valuable insights into the complexity, stability, and health level of Laizhou Bay, which constitutes a scientific basis for ecological management efforts.
2 Materials and methods
2.1 Sample collection and analysis
This study was conducted in the Laizhou Bay area (37°10′ N–37°55′ N, 119°00′ E–120°10′ E) where 20 sampling stations were established, which were the same in each survey (Figure 1). Marine organisms and environmental factors were sampled during spring (May), summer (August), and autumn (November) in 2022. Sampling was performed using a single-vessel bottom trawl survey; the power of the trawler was 260 kW, and the main parameters of the trawl net were a width of 8.0 m, height of 5.3 m, and mesh size of 1400 meshes. At each station, the trawl was dragged for 1 h at an average speed of 3.0 knots. Benthic samples were collected using a Van Veen grab (1000 cm2). Zooplankton were quantitatively sampled using a Type I plankton net, supplemented qualitatively with a Type II plankton net. Phytoplankton samples were collected using a Type III shallow-water plankton net. The plankton net was trawled vertically from the bottom to the surface, and the amount of filtered water was recorded using a HYDRO-BIOS Multi-Limnos filtration system. Both benthic and planktonic samples were preserved in a 5% formalin solution in 500 mL polyethylene bottles and later returned to the laboratory for species identification and biomass analysis. Samples of marine organisms were collected from three to five individuals of the same size per species for carbon and nitrogen isotope analyses. The sampled specimens were dissected, and approximately 3-5 g of muscle tissue was collected. Notably, the dorsal muscle of fish, abdominal muscle of shrimp, muscle from the first chelicerae of crustaceans, mantle muscle of cephalopods, and adductor muscle of bivalves were collected, whereas from echinoderms, the gonad tissue was collected. Sediment samples were collected using a grab, as described above. Seawater samples were filtered through Whatman GF/F membranes (47 mm diameter, 0.7 µm pore size). Sediment and seawater samples were analysed for dissolved organic carbon (DOC) and particulate organic carbon (POC).
Figure 1
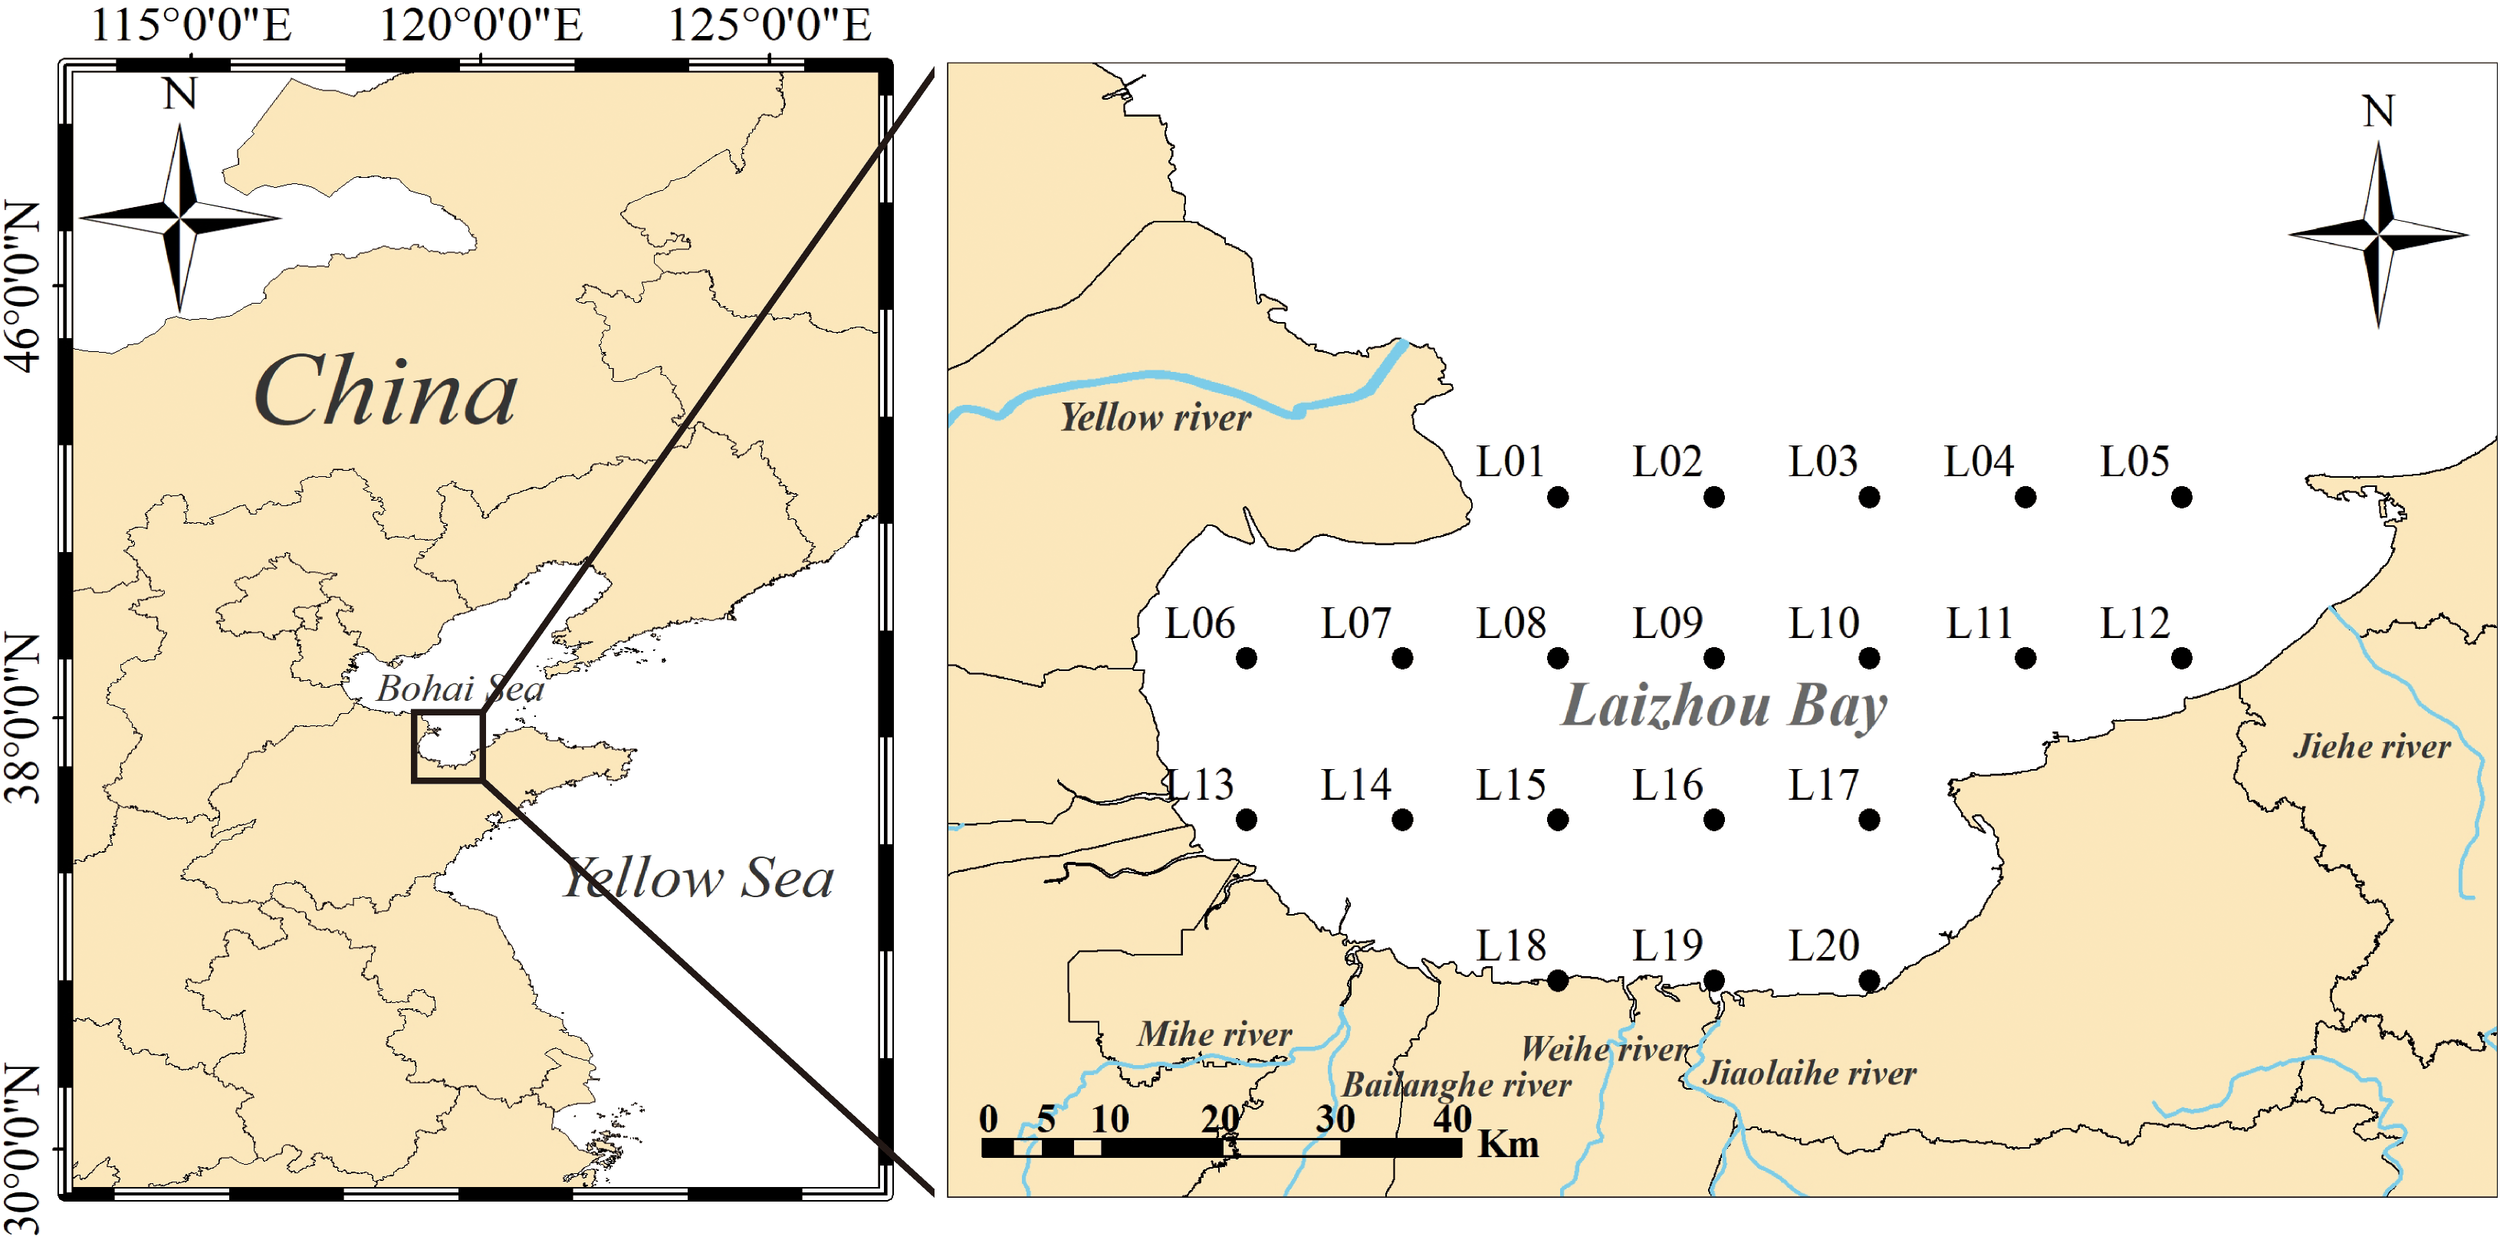
Study area and sampling sites in the Laizhou Bay of northern China.
2.2 Model building
2.2.1 Model principles
2.2.1.1 Ecopath model
According to the principle of trophic dynamics (Lindeman, 1991), the Laizhou Bay ecosystem was divided into 22 functional groups using the Ecopath model, where the energy output and input of each functional group maintained balance in this ecosystem. The basic equations are as follows:
In this equation, i represents the functional group, B represents the biomass of the functional group i (t·km-2a-1), P represents the production of the functional group, Q represents the consumption of the functional group, EE is the ecotrophic efficiency, DCij represents the diet matrix of the functional group ij, and E represents the amount of migration. The Ecopath model requires parameters DCij, B, P/B, and Q/B to be entered. The model was constructed using Ecopath with Ecosim (v6.6.8) software. The model assumed an intrinsic steady-state system in which biomass did not change, and net migration (the difference between emigration and immigration) was equal to zero or negligible on an annual scale.
2.2.1.2 LIM-MCMC
The LIM-MCMC uses the MCMC algorithm to provide a more accurate estimation of energy flow, where the energy output and input of each functional group maintain a balance in the ecosystem (Van den Meersche et al., 2009; Tecchio et al., 2016). The energy balance equation was as follows: Production (P) = Consumption (Q)–Excretion (U)–Respiration (R). Production was the total production; Consumption was defined as all flows entering the functional groups; Excretion was the flow from living functional groups to detritus and included natural mortality; Respiration was calculated as exported outside the model.
The energy input and output parameters were constrained by the equality and inequality equations of mass balance in this model. These equations can be expressed as matrix calculations (Chaalali et al., 2015). The equalities equation is E (m × n) x = F, and the inequalities equation is G (c × n) x ≥ h. In these equations, E (m × n) and G (c × n) represent the matrices of the energy flow path coefficients, where m is the mass balance of the energy flow of each functional group, c is the number of inequality equations, and n indicates the number of energy flow paths (x1, x2,…, xn). Additionally, F is the equation value matrix (m × 1), and h is the inequality value matrix (c × 1). The energy flow paths are divided into four groups with their values ranging from the smallest to the largest, including group a of 0.00 to 1.00, group b of 1.00 to 10.00, group c of 10.00 to 100.00, and group d of >100.00 (t·km-2a-1). The LIM-MCMC was fitted using the “Lim” and “LimSolve” packages in R software (v4.4.1).
2.2.2 Functional group classification
Functional groups in the Laizhou Bay ecosystem were divided into 22 groups based on the feeding habits, habitat types, economic value, and growth characteristics of the marine organisms, whereas detritus was classified into a separate group (Supplementary Table S1). Notably, these 22 groups, as well as B, P, Q, U, and R, were used for the Ecopath model and LIM-MCMC and were identical between these two models.
2.2.3 Data preprocessing
In the Ecopath model, the biomass (B) of phytoplankton is the ratio of chlorophyll a content to the phytoplankton wet weight (1:400) (Jones, 1979). The detritus biomass was calculated from the POC and DOC values (Yang, 2018). The ratios of production to biomass (P/B) and consumption to biomass (Q/B) of fish were calculated according to the methods of Palomares and Pauly (1998) or obtained from the Fishbase website (www.Fishbase.org). The P and Q values of other species are cited from other studies in the ecosystems of areas adjacent to Laizhou Bay. The ecotrophic efficiency (EE) value was output using the Ecopath model and ranged from 0 to 1. The diet composition (DC) represents predator-prey relationships among functional groups, which were calculated through stomach content analysis and δ13C isotope values measurement (Lamb et al., 2019).
For the LIM-MCMC, values of the parameters B, P/B, Q/B, and DC were identical to those in the Ecopath model. The ratios of excretion to biomass (U/B) and respiration to biomass (R/B) were obtained from other studies conducted in Laizhou Bay (Li et al., 2024). Additionally, the values of B, P/B, Q/B, U/B, and R/B in these two models were expressed in wet weight (t·km-2·a-1).
2.2.4 δ13C and δ15N measurements and trophic level analysis
Trophic levels were typically assessed using stable nitrogen isotopes, as predators are generally 3.4‰ more enriched in stable nitrogen isotopes than their prey, which was used as the nitrogen isotope enrichment. Phytoplankton, zooplankton, and benthos served as baseline organisms, which presented throughout the year and exhibited a simple diet with stable δ15N enrichment. Therefore, the stable nitrogen isotope of Scapharca broughtonii was used as the baseline organism. The trophic level of each species was determined by comparing its nitrogen isotope value with that of the baseline organism. Sampled tissues were rinsed with distilled water and freeze-dried (FD-1C-50+, BIOCOOL, China). After freeze-drying, the samples were ground into fine powder, which was then sieved through an 80-mesh filter. The resulting powder samples were decarbonated by treatment with 1 mol·L-1 HCl, followed by re-drying and storage in a desiccator. Finally, the carbon and nitrogen stable isotopes were determined using an elemental analyser (Flash EA1112 HT, Thermo Fisher Scientific, USA) coupled with an isotope ratio mass spectrometer (DELTA V Advantage, Thermo Fisher Scientific, USA) (Minagawa and Wada, 1984; Post, 2002):
In this equation, δ15Nconsumer refers to the nitrogen isotope ratio of the consumer, δ15Nbaseline is the nitrogen isotope ratio of the baseline organism, Δδ15N is the nitrogen isotope enrichment of 3.4‰, and is the trophic level of the baseline organism. The trophic levels of marine organisms selected in this study are shown in Table 1 (Ju et al., 2020).
Table 1
| Characteristic parameters | Values | |
|---|---|---|
| Ecopath | LIM-MCMC | |
| Total consumption (t·km-2·a-1) | 4407.67 | 4407.67 |
| Total exports (t·km-2·a-1) | 1527.03 | 956.94 |
| Total respiration (t·km-2·a-1) | 2568.60 | 4173.83 |
| Total flows into detritus (t·km-2·a-1) | 1582.82 | 1429.56 |
| Total system throughput (t·km-2·a-1) | 10086.11 | 10968.00 |
| Total primary production (t·km-2·a-1) | 3606.40 | 3606.40 |
| Total primary production/Total respiration | 1.40 | 0.86 |
| Total primary production/Total biomass | 23.88 | 23.88 |
| Total biomass (excluding detritus, t·km-2·a-1) | 151.04 | 151.04 |
Characteristic parameters of the Laizhou bay ecosystem after the analysis of Ecopath and LIM-MCMC models, respectively.
2.2.5 Model debugging and quality analysis
For the Ecopath model, the basic condition for debugging balance was 0<EE ≤ 1. The parameters of the unbalanced functional groups were repeatedly adjusted within the range of 5%. Notably, the food transfer efficiency of GE (represented by the P/Q value) ranged from 0.05 to 0.3. Model quality was analysed using the pedigree index, using the following equation (Christensen et al., 2005):
In this equation,where P is the pedigree index, n is the number of functional groups, i is the ith functional group, j is the value of parameters B, P/B, Q/B, and DC, and Iij is the pedigree index of the functional group i.
For the LIM-MCMC, the equations and inequalities of each functional group mentioned in section 2.2.1, were debugged by adjusting all the values of parameters P/B, Q/B, U/B, and R/B in the range of 5%. Then, the MCMC algorithm sampled all possible results and calculated their average value, until the LIM-MCMC generated at least one set of solutions which satisfied the balance of this model (Gerber et al., 2023).
2.2.6 Characteristic parameter output
The characteristic parameter output by the Ecopath model and LIM-MCMC can be used to assess the structural and functional characteristics of the Laizhou Bay ecosystem. The total system throughput (TST) represents the overall ecosystem scale, which is composed of four components: total consumption (TC), total exports (TE), total respiration (TR), and total flows into detritus. The ratio of total primary production (TPP) to TR (TPP/TR) is an indicator of the maturity and stability of the ecosystem, which is always >1 when the ecosystem is in the early developmental stages, but <1 when the ecosystem becomes mature and is affected by human activities (Banerjee et al., 2017). Additionally, Finn’s cycle index represents the proportion of the recirculation of the energy flows in the ecosystem, and Finn’s mean path length (FML) represents the number of trophic levels participating in each cycle of the energy flow. The connectance index (CI), system omnivory index (SOI), and average path length (APL) reflect the complexity of the ecosystem structure. When the CI and SOI values are close to one, these parameters always indicate the ecosystem structure is complex and stable (Christensen and Walters, 2004).
3 Results
3.1 Trophic levels of functional groups in the Laizhou Bay ecosystem
The distribution of trophic levels among functional groups in the Laizhou Bay ecosystem was established using the nitrogen isotope ratio (2) of S. broughtonii as the basal organism, which was consistent with other studies (Liénart et al., 2021). One-way analysis of variance revealed no significant differences in the carbon isotope ratios among species, while nitrogen isotope ratios exhibited significant variation (p ≤ 0.05). This result indicated that the functional groups shared similar carbon sources but differed significantly in their nitrogen utilisation (Supplementary Table S2). Variations in the carbon and nitrogen isotope values were observed, with fish exhibiting relatively high δ13C and δ15N levels, suggesting their higher trophic positions within the food web (Figure 2). The characteristics of the trophic levels in the Laizhou Bay ecosystem, derived from stable carbon and nitrogen isotope analyses, ranged primarily from 1.00 to 3.48 (Supplementary Table S3) and were divided into trophic levels I, II, and III. Trophic Level I is composed of detritus and phytoplankton, which serve as primary producers and provide fundamental energy sources for this ecosystem. Trophic levels II and III (45.5% each) comprised predatory functional groups. The average trophic level of the functional groups composed of fishery species was 3.30, with notable variation among species within the group. The trophic levels of the functional groups composed of fish ranged from 3.09 to 3.48, with demersal fish exhibiting the highest trophic levels (III). Crustaceans ranged from 2.89 to 3.35, and cephalopods ranged from 2.75 to 3.17. The trophic levels within these functional groups showed considerable variability, indicating a broad distribution across trophic levels. Furthermore, the primary fishery species (P. trituberculatus, C. japonica, O. oratoria, Loliolus sp., and F. chinensis) in Laizhou Bay were primarily found at trophic levels II and III.
Figure 2
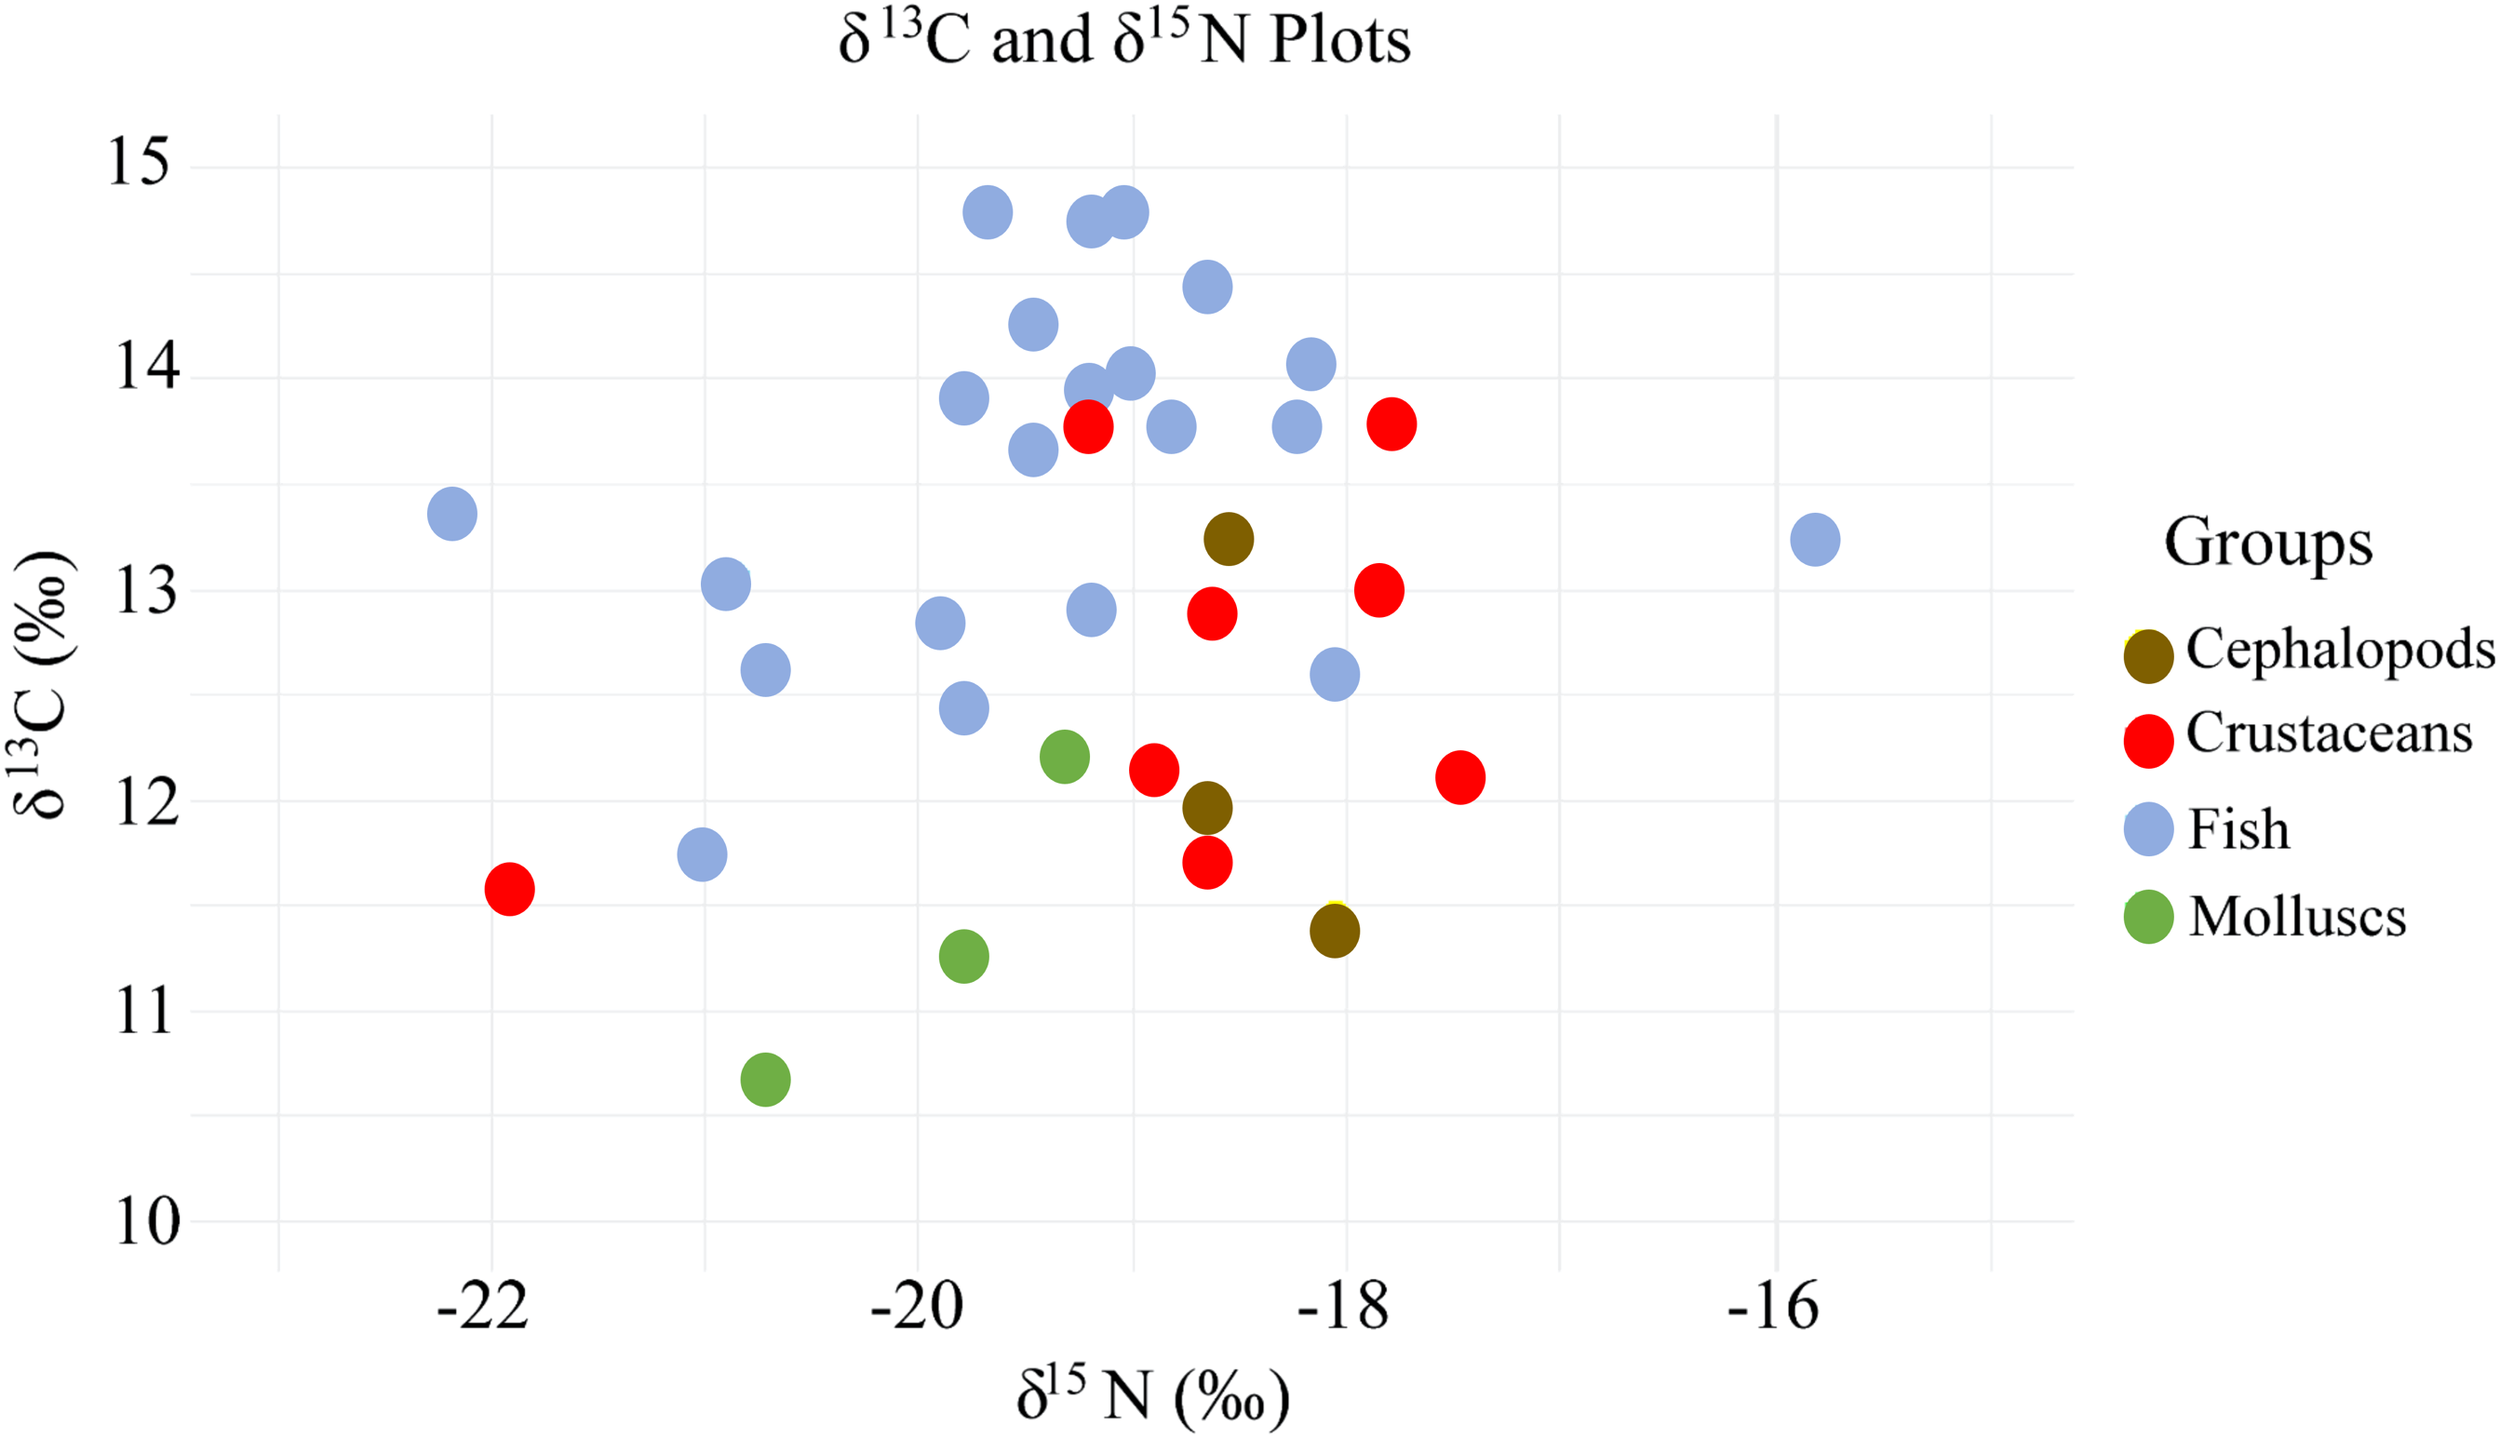
Stable isotope biplots of δ13C and δ15N values in the Laizhou Bay ecosystem.
3.2 Comparative analysis of energy flow in the Laizhou Bay ecosystem
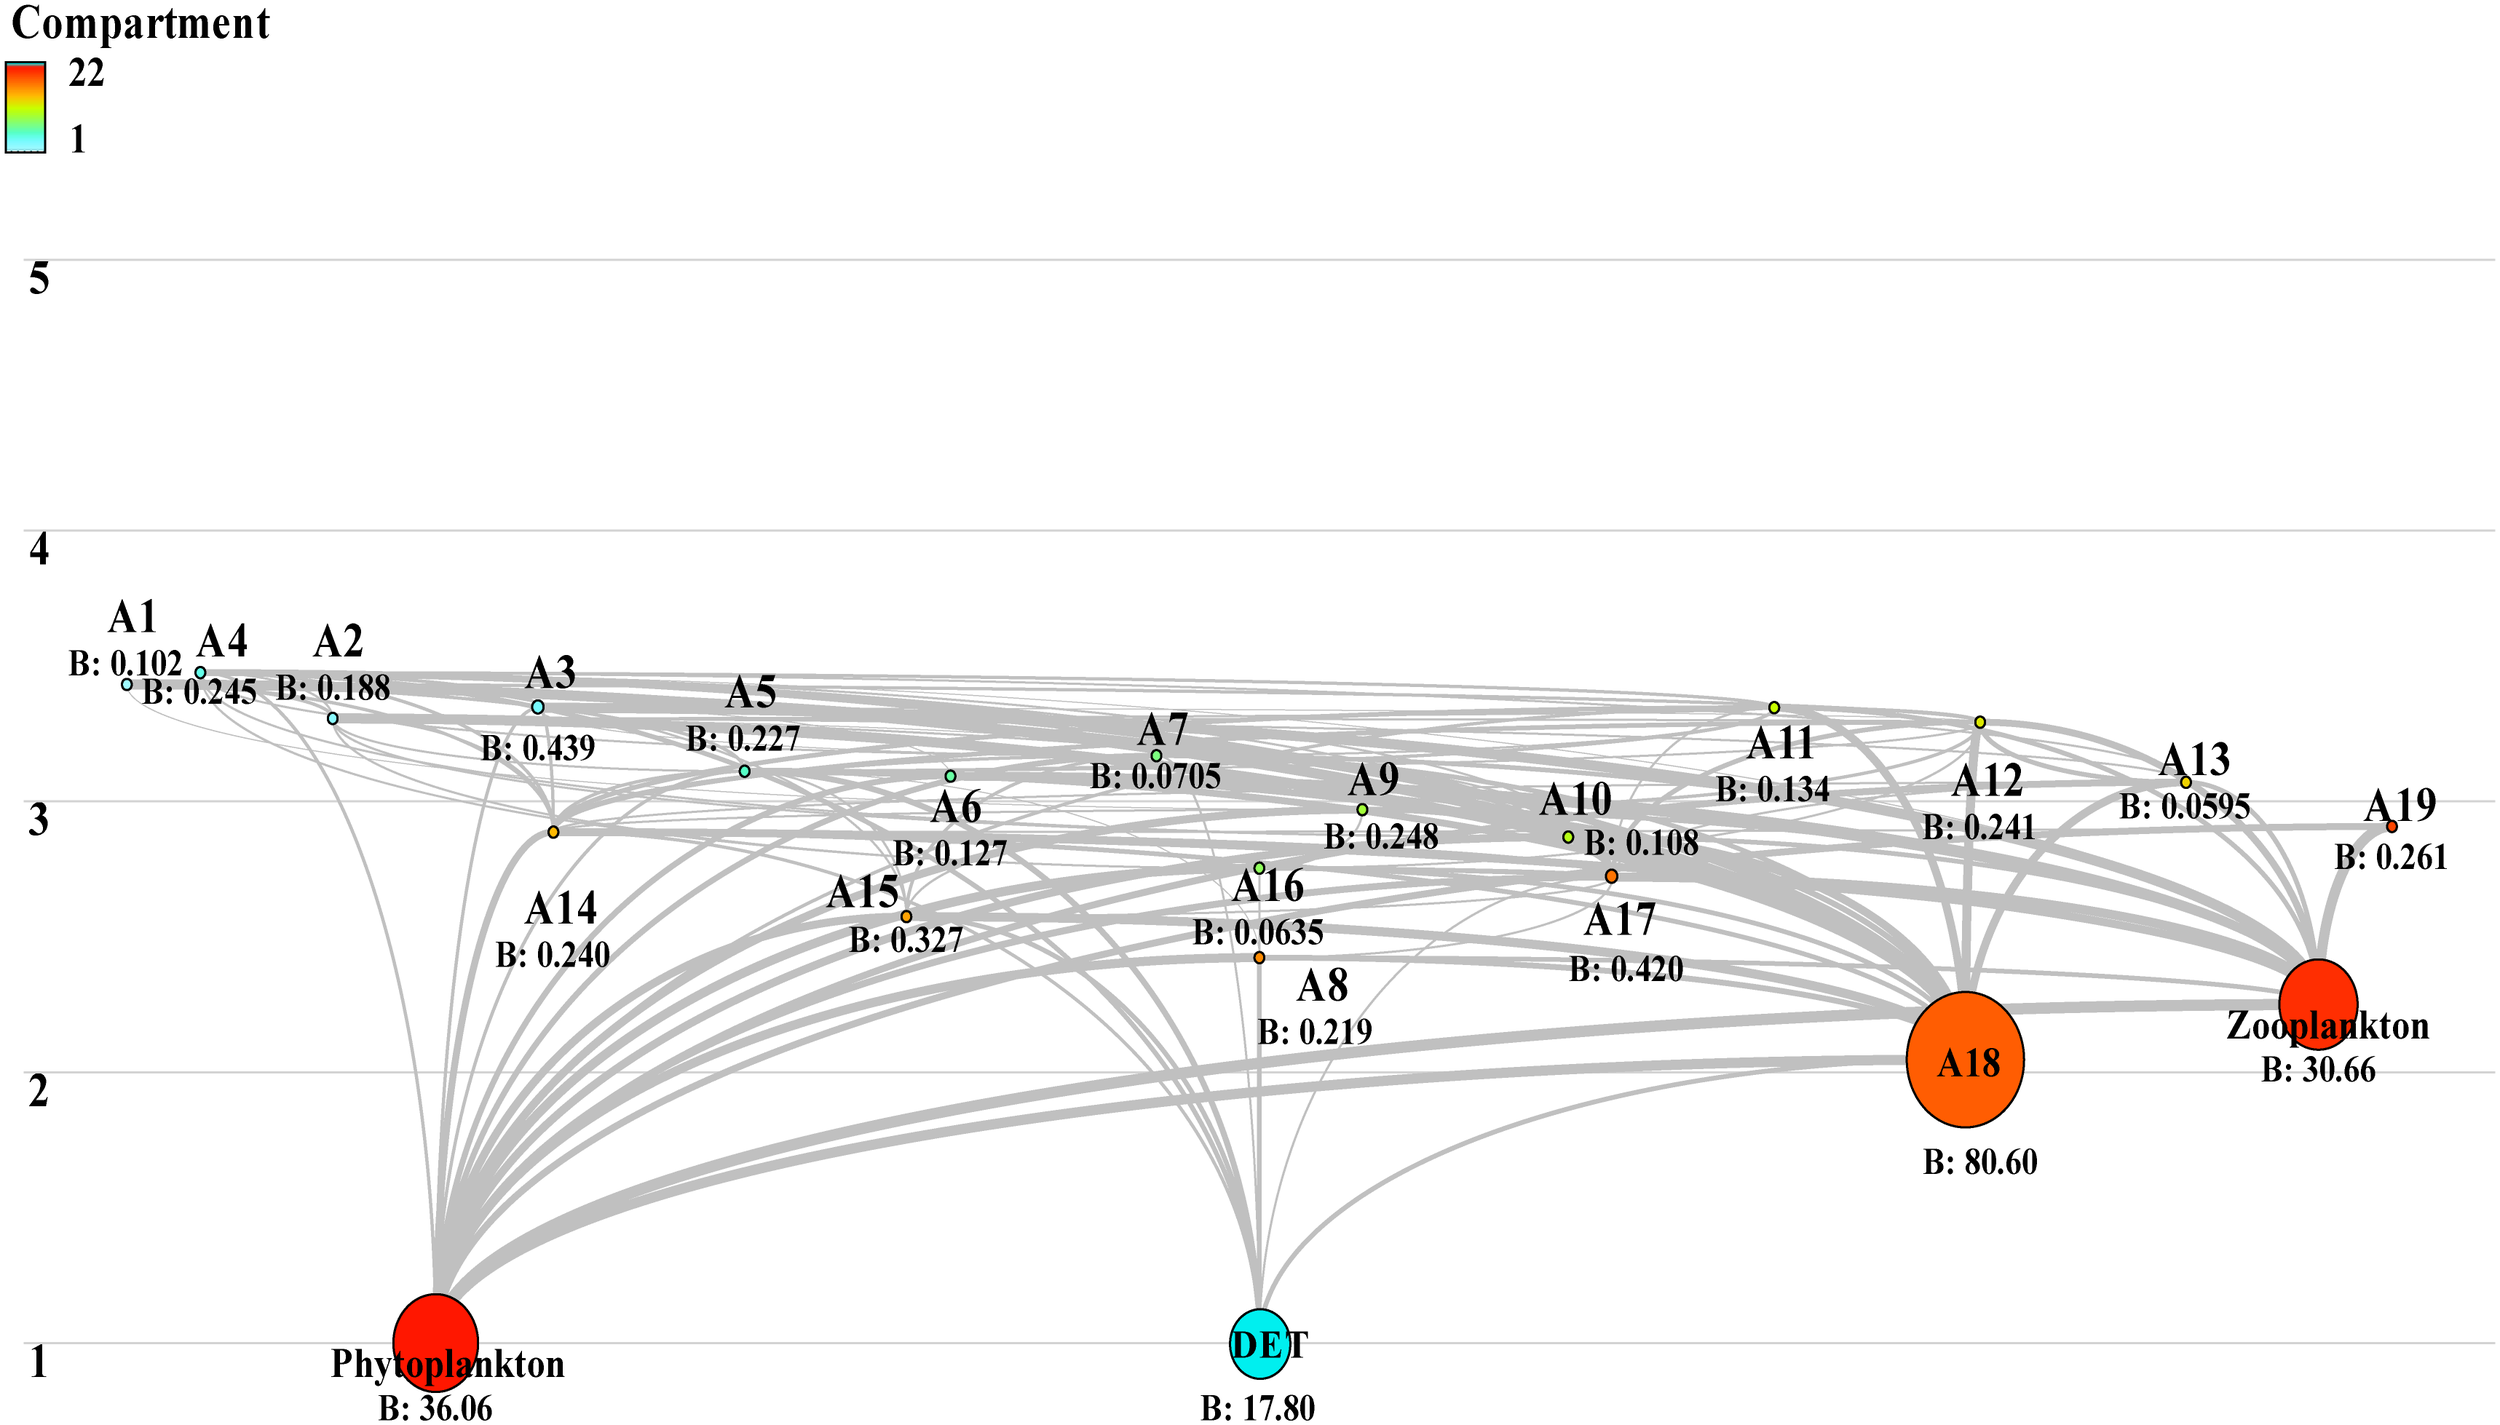
Energy flow efficiency in the Laizhou Bay ecosystem displayed a distinct hierarchical structure in the Ecopath model (Figure 3), where energy was primarily circulated from trophic levels I to III. Detritus and phytoplankton were assigned to trophic level I and contributed biomass of 17.8 and 36.1 t·km-2a-1 respectively, which accounted for 35.7% of the total biomass, respectively. Phytoplankton contributed 3,606.4 t·km-2a-1 to the total energy flow (35.8%), of which 96.2% (3,469.0 t·km-2a-1) was consumed and the remaining energy of 137.6 t·km-2a-1 flowed into the detritus for recycling. The total energy flowing into the detritus from all trophic levels was 1149.0 t·km-2a-1, representing 11.4% of the total energy flow, with 55.8 t·km-2a-1 recycled from trophic level II. The remaining energy is mineralised into inorganic matter, which is either deposited or reused within the ecosystem. Furthermore, energy circulation predominantly occurred within trophic levels I to III, which together contributed 99.6% of the TST, with minimal energy transfer to higher trophic levels (e.g. trophic level IV: 0.05%) (Table 2). The biomass at trophic level IV was decreased to 0.41 t·km-2a-1, indicating the energy loss during the transferring process. The total energy transfer efficiency was 5.34%, with a proportion of the total energy flow originating from the detritus of 0.23. The energy transfer efficiency from detritus (2.61%) was higher than that from primary producers (0.83%) at trophic level II, whereas the opposite was true at trophic level III and higher levels.
Figure 3
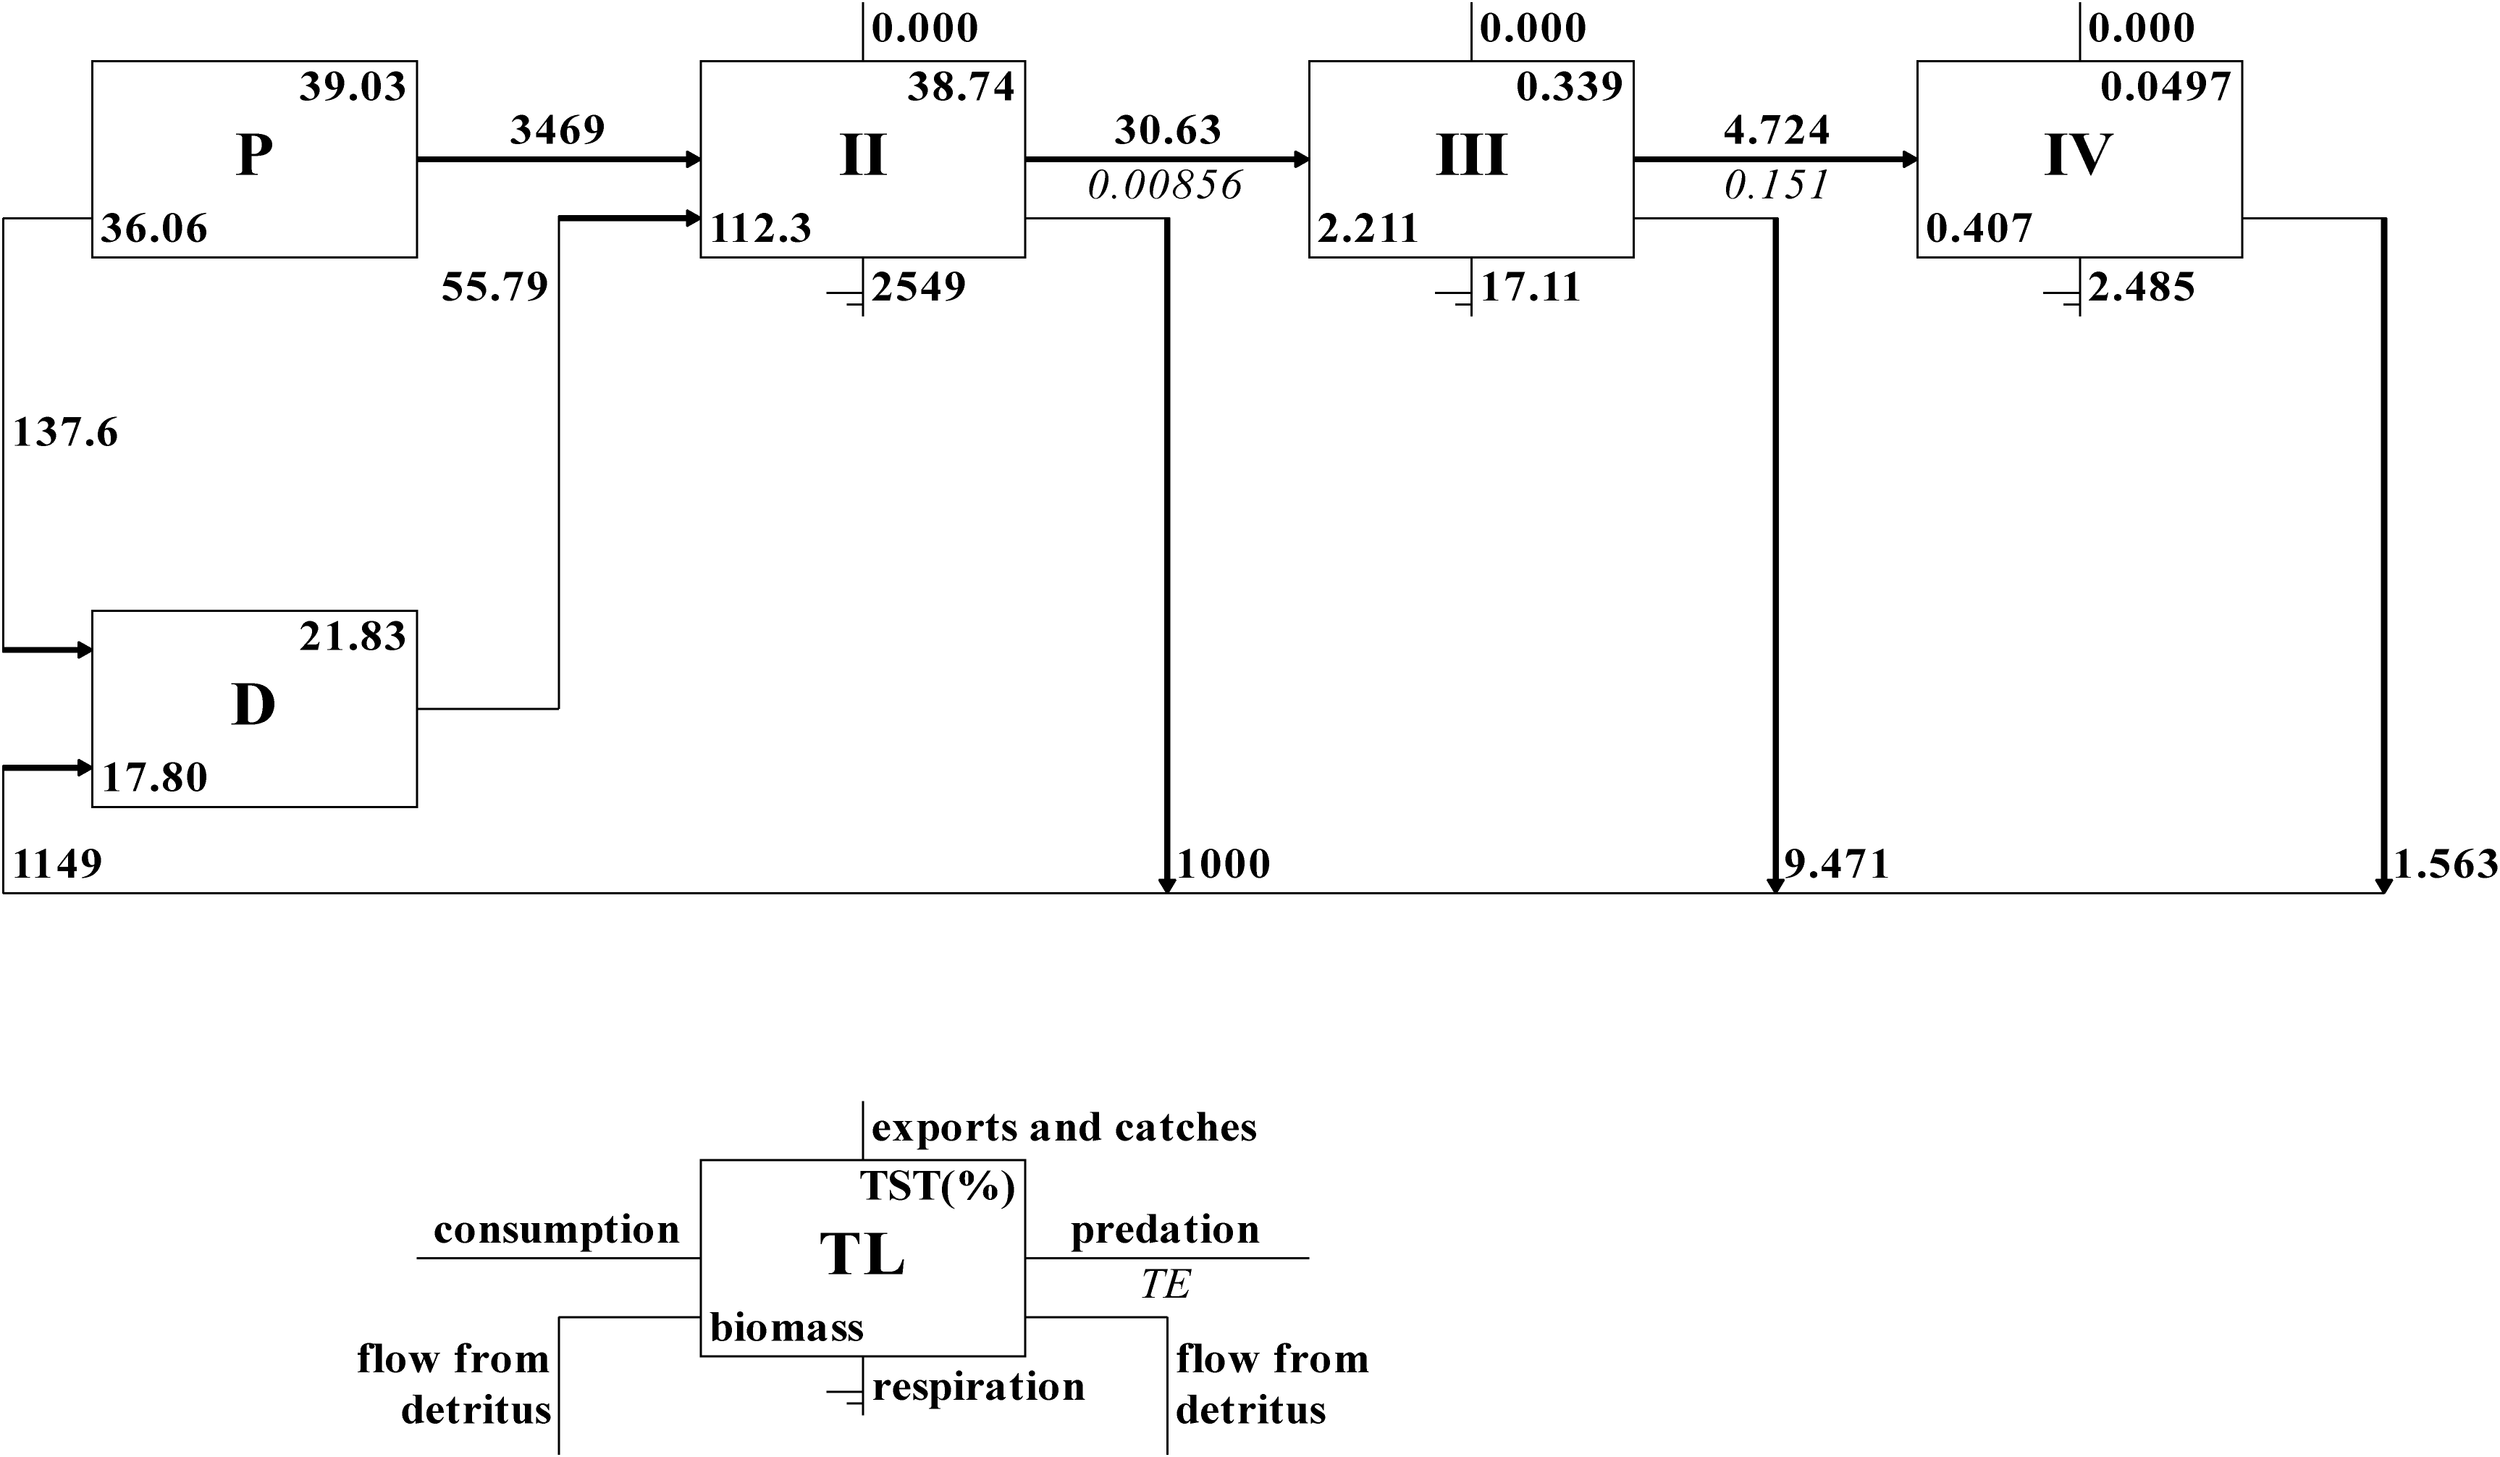
Energy flow through trophic levels in the Laizhou Bay ecosystem based on the Ecopath model.
Table 2
| Sources | Trophic levels | |||
|---|---|---|---|---|
| II | III | IV | V | |
| Producer | 0.83 | 15.17 | 11.97 | 9.40 |
| Detritus | 2.61 | 13.56 | 8.618 | 8.47 |
| All flows | 0.86 | 15.09 | 11.82 | 9.37 |
| Proportion of total flow originating from detritus: 0.23 | ||||
| Transfer efficiencies (calculated as geometric mean for TL II-IV) | ||||
| From primary producers: 5.31% | ||||
| From detritus: 6.73% | ||||
| Total: 5.34% | ||||
Transfer efficiency of different trophic levels in the Laizhou Bay ecosystem (%).
The energy flow in the Laizhou Bay ecosystem contained 164 paths in the LIM-MCMC model that were divided into four groups: a, b, c, and d (Supplementary Table S4; Figure 4). Group a comprised 131 paths, including paths from respiratory consumption and flow into the detritus to functional groups at low trophic levels. Group b comprised six paths, including paths from functional groups at trophic level I to high trophic levels. Group c contained 10 paths, especially the paths from meiobenthos to R. venosa (100.0 t·km-2a-1) and zooplankton to echinoderms (100.0 t·km-2a-1). Group d included 17 paths, particularly the paths from CO2 to phytoplankton (4,173.8 t·km-2a-1) and from phytoplankton to zooplankton (1,848.9 t·km-2a-1). Respiratory consumption and flow into detritus accounted for 35.5% of group d, whereas the remaining energy flowed from phytoplankton, zooplankton, and detritus to meiobenthos, R. venosa, and Loliolus sp., accounting for 25.0% of the total energy flow. The total respiratory consumption of all functional groups was 3,606.4 t·km-2a-1, with the highest respiratory consumption observed in R. venosa (1,702.9 t·km-2a-1), followed by Loliolus sp. (1,202.2 t·km-2a-1), zooplankton (826.1 t·km-2a-1), and phytoplankton (320.1 t·km-2a-1), but functional groups at high trophic levels exhibited minimal respiratory consumption, such as benthivore fish of 0.30 t·km-2a-1. The paths of energy flows into detritus, with Loliolus sp. contributing the highest value of 512.4 t·km-2a-1.
Figure 4
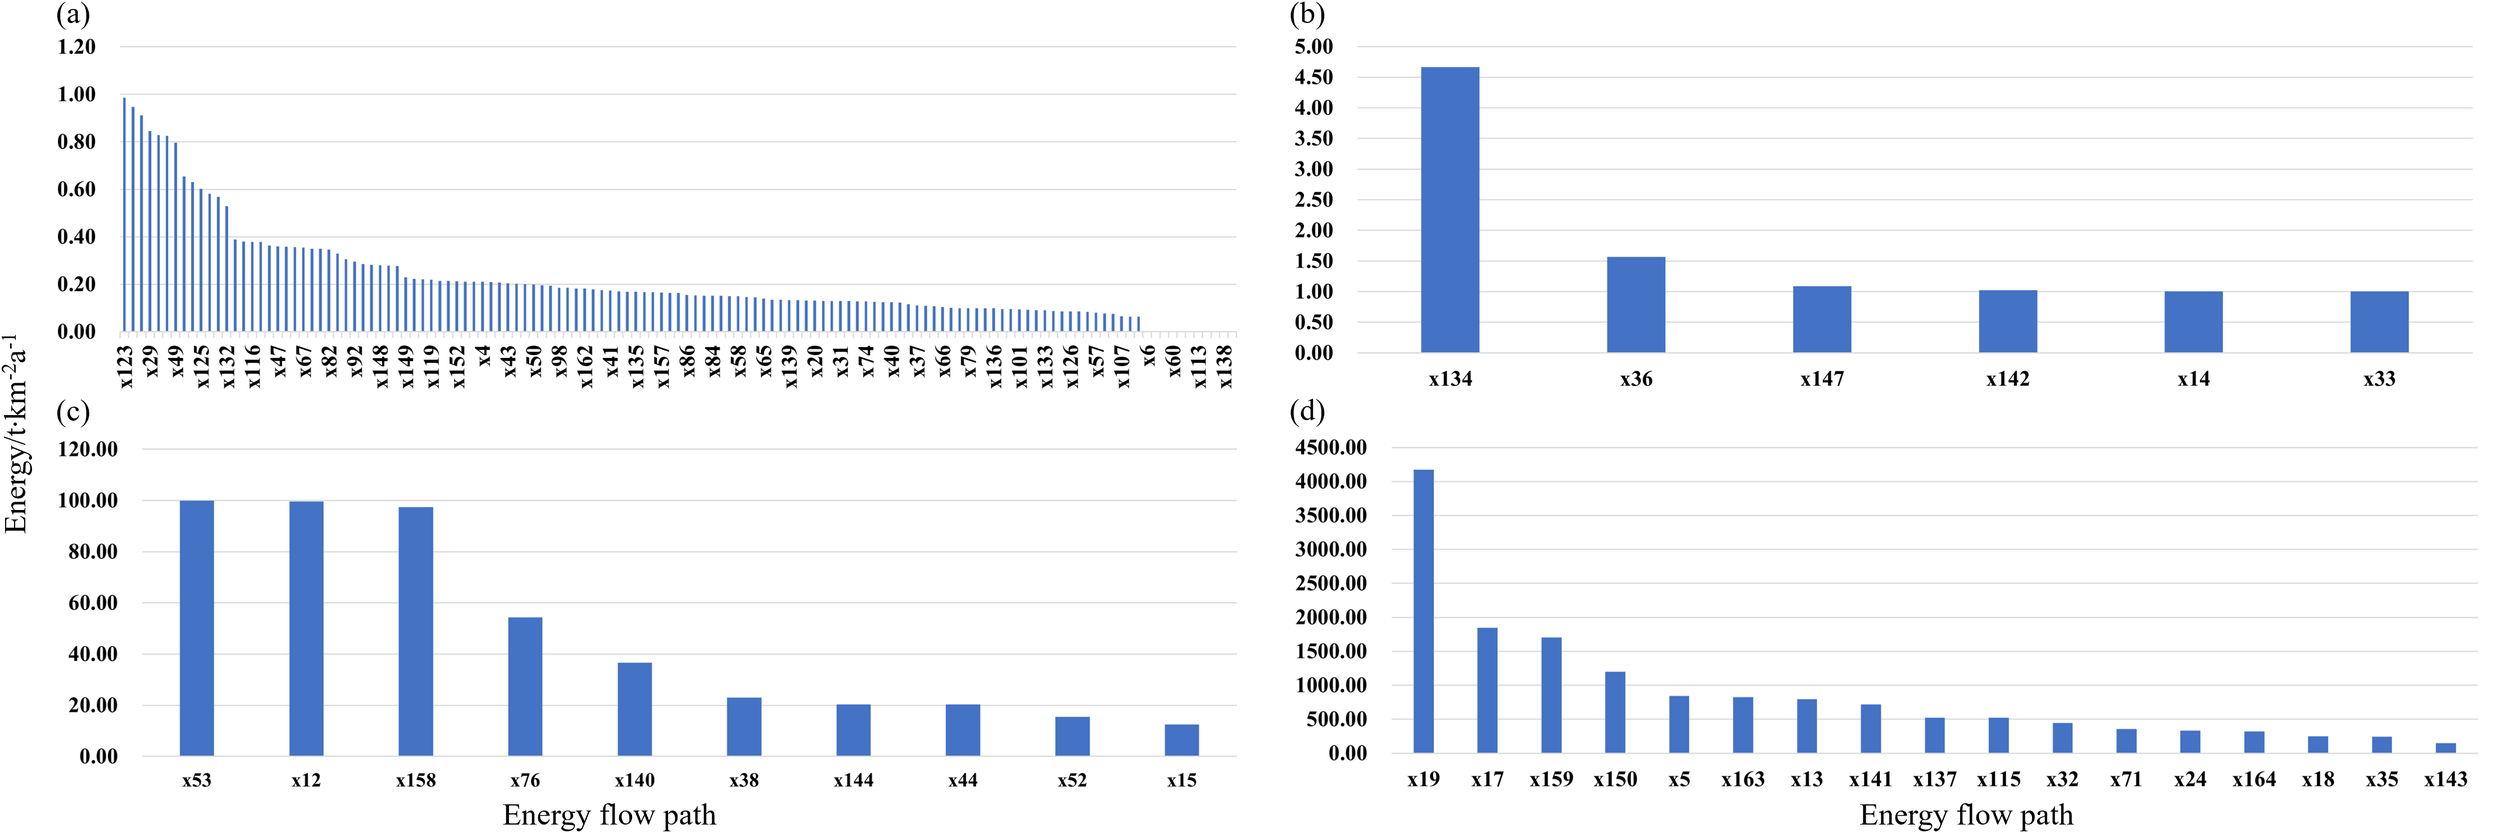
Energy flows in the Laizhou Bay ecosystem based on the LIM-MCMC model. Energy flow paths corresponding to the flow numbers are shown in the appendix: (a) 0.00-1.00 t·km-2a-1; (b) 1.00-10.00 t·km-2a-1; (c) 10.00-100.00 t·km-2a-1; (d) >100.00 t·km-2a-1.
3.3 Comparative analysis of food web structure in the Laizhou Bay ecosystem
In the Ecopath model, the energy flow in the food web of the Laizhou Bay ecosystem was primarily driven by primary producers and detritus. Thus, the food web included two food chains (Figure 5). One food chain was the grazing food chain, where energy flowed from phytoplankton to other 17 functional groups with increasing trophic levels and was eventually transferred to functional groups at trophic level III, including Gobiidae and O. oratorias (Supplementary Table S2). The detrital food chain was initiated from detritus, and the energy of detritus was directly transferred to the functional groups of demersal fish, benthivorous fish, Octopodidae, Loliolus sp., echinoderms, molluscs, and meiobenthos, and eventually transferred to Gobiidae, pelagic fish, omnivorous fish, cnidarians, P. trituberculatus, C. japonica, O. oratoria, and F. chinensis. At the end of these two food chains was the Sciaenidae functional group. The parameters CI (0.30), SOI (0.33), FML (2.46), and FCL (8.18%) indicated reduced food chain and web complexity.
Figure 5
Food web structure in the Laizhou Bay ecosystem based on the Ecopath model.
Similar to the Ecopath model, the food web in the LIM-MCMC model included two food chains initiated by phytoplankton and detritus (Figure 6). Along the grazing food chain, energy is directly transferred to zooplankton and then transferred to meiobenthos through multiple paths, which are preyed upon by benthic invertebrates; ultimately, energy is transferred from benthivorous fish to demersal fish. Detrital food chains are further divided into two paths. The shortest period was from detritus to phytoplankton, invertebrates (molluscs and crustaceans), and pelagic fish. Another path began from benthic producers (phytoplankton and detritus) to meiobenthos, benthic invertebrates (molluscs and crustaceans), benthivores, and demersal fish. Additionally, functional groups at higher trophic levels had fewer energy flow paths than other functional groups. The APL parameter (2.78) showed that these food chains were relatively short, and the food web structure was simplified.
Figure 6
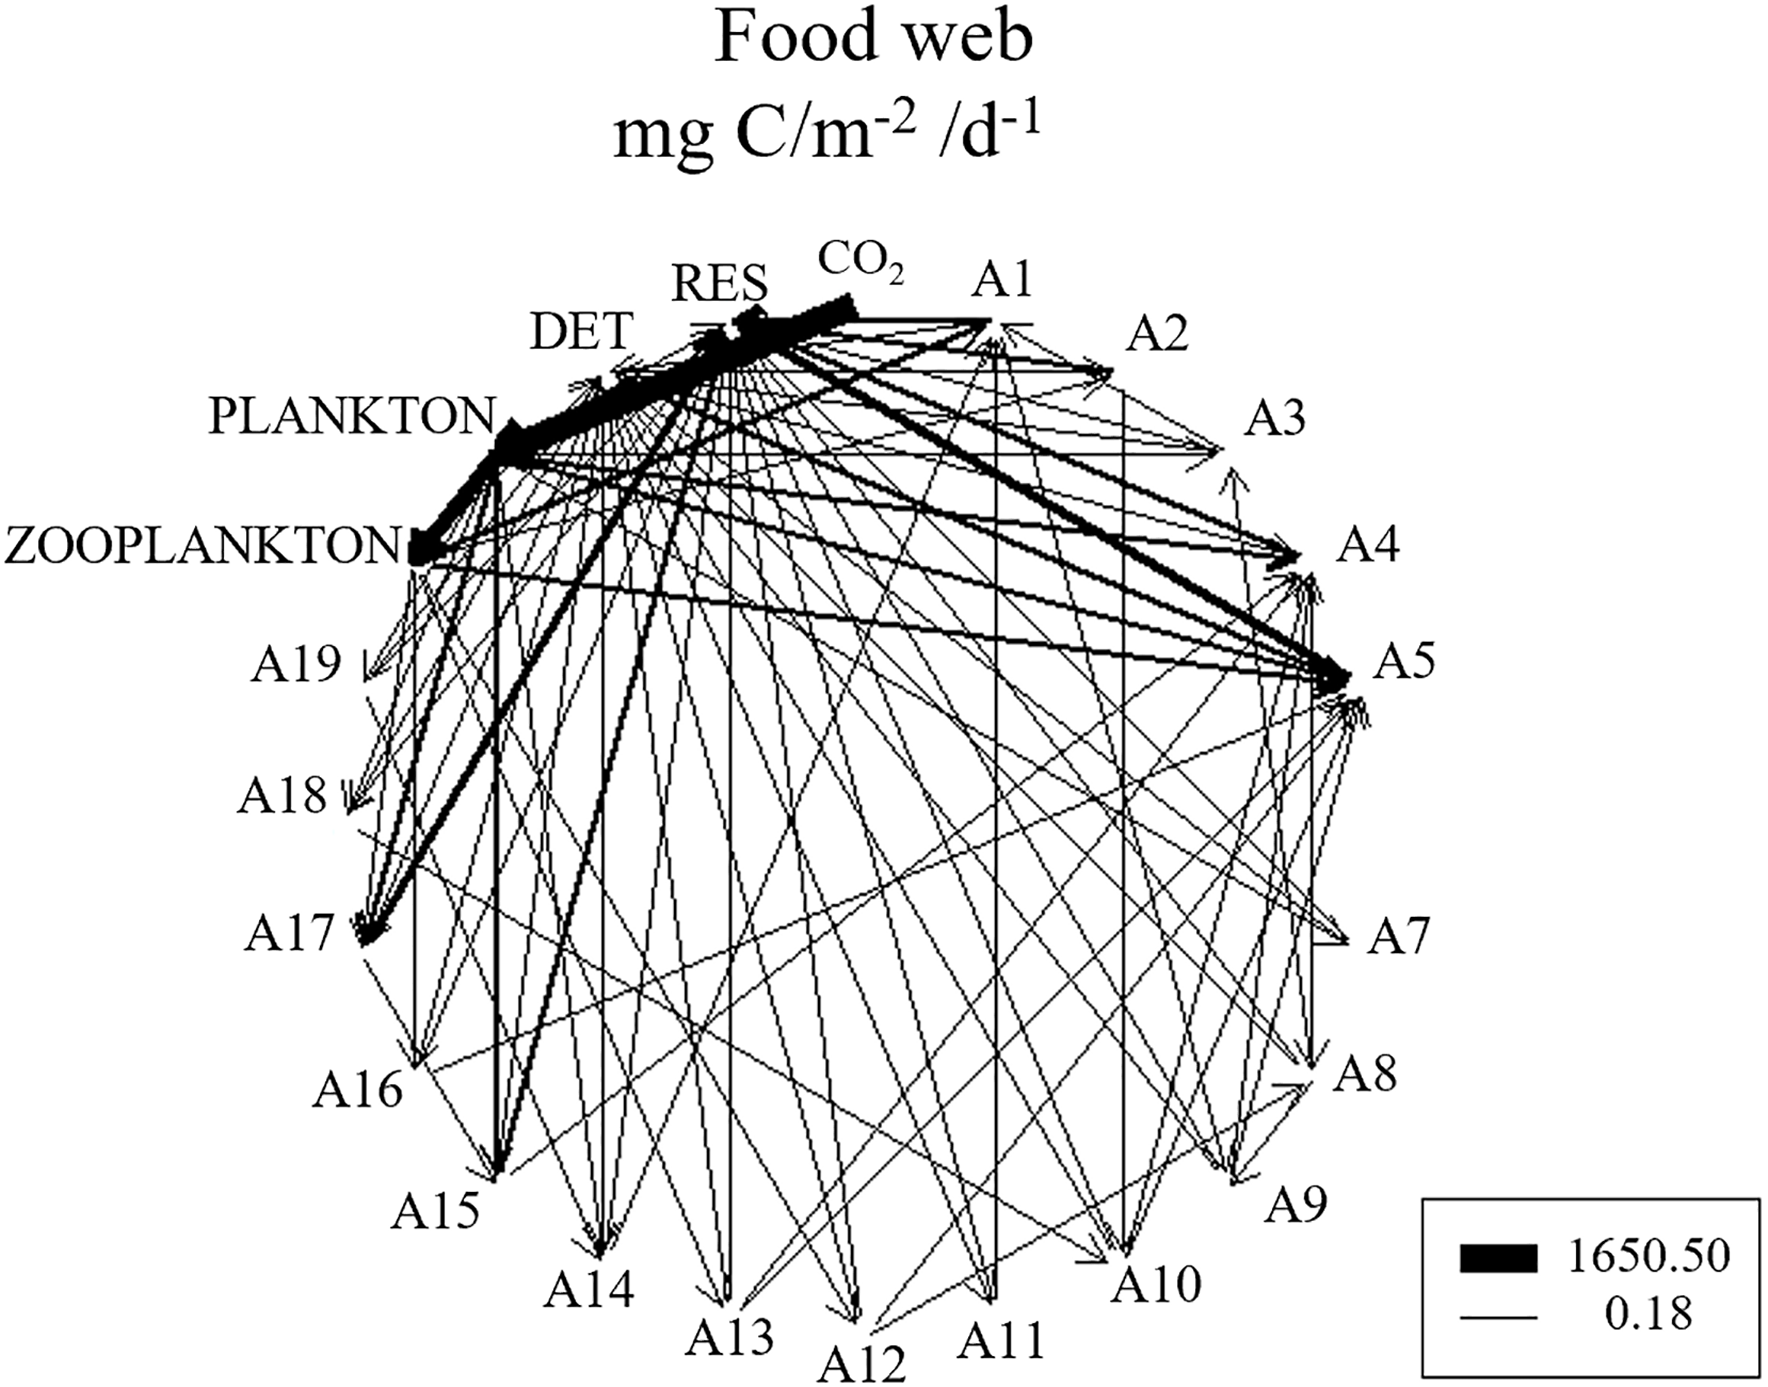
Food web structure in the Laizhou Bay ecosystem based on the LIM-MCMC model (mg C/m-2/d-1).
3.4 Overall assessment of the Laizhou Bay ecosystem
The characteristic parameter outputs from the balanced Ecopath model and LIM-MCMC are listed in Table 1. In the balanced Ecopath model, the EE values of all functional groups were <1, and the pedigree index was 0.524, which is reasonable compared with the outcomes of other studies (Morissette, 2007). In the Ecopath model and LIM-MCMC, TC, TPP, total biomass (TB), and TPP/TB were 4407.7 t·km-2a-1, 3606.4 t·km-2a-1, 151.0 t·km-2a-1, and 23.9, respectively. The parameters of TST, TR, and flow into detritus were 10086.1 and 10968.0 t·km-2a-1, 2568.6 and 4173.8 t·km-2a-1, and 1582.8 and 1429.6 t·km-2a-1, in the Ecopath model and LIM-MCMC, respectively. The ratio of TPP/TR in the Ecopath model (1.40) suggested a relatively mature ecosystem in Laizhou Bay, whereas that of the LIM-MCMC (0.86) indicated that it was in an unstable developmental stage. Additionally, the average TR value in the LIM-MCMC was 38.33% of that in the Ecopath model.
4 Discussion
4.1 Composition and structure of the functional groups in the Laizhou Bay ecosystem
The analysis of δ13C and δ15N is an essential tool for examining trophic levels and food web structures (Post, 2002; Merquiol et al., 2023). δ15N reveals the trophic positions of marine organisms and predator-prey relationships, and δ13C provides insights into the utilisation of carbon sources and habitat-specific feeding preferences (Fry, 2006). The integration of isotope analysis and ecosystem models offers deeper insights into energy flow paths and food web structure. In the present study, similar δ13C values among marine organisms suggested a homogeneity in carbon source utilisation, thus discrepant δ13C values indicated different carbon sources. For example, Sebastes schlegelii exhibited higher δ13C values, reflecting its reliance on carbon sources of a diet dominated by teleosts, crabs, and echinoderms (Kang et al., 2023), whereas Engraulis japonicus showed lower δ13C values, attributable to its reliance on carbon sources of a diet composed of crustaceans and small fishes (Yu et al., 2020). Significant differences in δ15N values in the current study pointed to diverse trophic paths that supported the growth requirements of different species (Kobari et al., 2023). For example, Saurida elongata displayed elevated δ15N values, and it was mainly feeding on Loliolus sp., Metapenaeopsis dalei, and Gobiidae, which also had high δ15N values (Du et al., 2011). However, R. venosa exhibited low δ15N values because of its benthic feeding habits (Hu et al., 2016). Additionally, marine fishes displayed higher δ13C and δ15N values than other species in the present study and played important roles in trophic pathways as consumers at high trophic levels (Qu et al., 2021; Shin et al., 2022).
The integration of the trophic level values of different functional groups into several trophic positions (I-V) may represent the link between certain functional groups in the energy flow within an ecosystem (Lindeman, 1991). Trophic levels of 1.00 to 3.48 revealed a moderately complex food web structure that mainly included primary producers and consumers at intermediate and high trophic levels. These results were consistent with the findings in Laizhou Bay (Ju et al., 2020). Notably, economic fishery species at the intermediate or high trophic levels represented a high proportion of the trophic position, reflecting their ecological significance; thus, effective management of their resources is crucial for preserving the integrity of the food web structure. Although the observed trophic levels were concentrated in levels I, II, and III, the energy estimated by the Ecopath model could be transferred to trophic level V. This discrepancy was due to the ability of the Ecopath model to simulate the complexity and multilevel interactions of the ecosystem model, especially the interactions of predation, prey consumption, and detritus recycling, ultimately producing a multilayered trophic transfer structure (Christensen and Pauly, 1992).
4.2 Characteristics of the energy flow in the Laizhou Bay ecosystem
Energy flow plays an important role in maintaining the stability of an ecosystem’s structure and function by determining the interactions between species (Cebrian, 2015). In the present study, phytoplankton and detritus were recognised as the initiators of the grazing and detrital food chains, respectively, which was in agreement with other studies in Laizhou Bay (Ju et al., 2020) and revealed their importance in accelerating energy transfer. However, the Ecopath model revealed that phytoplankton had a higher energy transfer efficiency than detritus. This phenomenon may be due to the adequate nutrient supply and suitable temperature in Laizhou Bay, which promoted the rapid growth of phytoplankton (Seifert et al., 2023). However, the interactions between functional groups at different trophic levels, rather than the amount of energy in phytoplankton, are determined by the energy transfer efficiency in the food chain. Detritus originates from incompletely decomposed organic matter or other organic matter from the recycling of carbon and nitrogen through decomposition or transformation in the ecosystem (Parsons and Strickland, 1962). In addition, the energy transfer efficiency of detritus was lower than that reported in other studies (He et al., 2021). By contrast, the energy flow from detritus is affected by environmental factors such as temperature and salinity (Kowalewska et al., 2003). Thus, the loss of energy in the energy transfer process from detritus reveals an obvious environmental disturbance to the energy flow in Laizhou Bay. However, owing to the influence of diluted water from various rivers, the stratification effect weakened the oxygen exchange of the bottom water and slowed the decomposition of detritus by microorganisms (Zhang et al., 2023a). Thus, the energy transfer efficiency of detritus was repressed.
The LIM-MCMC showed that functional groups at trophic levels I and II were important in the detrital formation process (Smith et al., 2011). The functional groups of meiobenthos and R. venosa live in areas with high levels of detritus, where detritus formation can be accelerated through the bioturbation activities of these functional groups, such as digging caves, and the mineralisation and decomposition of organic matter (Davis, 1993; Adámek and Maršálek, 2013). Although the life stages of these functional groups are short, their excretions during daily metabolic processes and deceased individuals are rapidly decomposed and form detritus, which improves the recycling and transfer efficiency of energy initiated from the detritus (Moore et al., 2004). Additionally, there were significant differences in respiration consumption between Loliolus sp. and Octopodidae, because their physiological structure and metabolic function are different, especially Loliolus sp. exhibits active predation behaviour and a higher metabolic rate (Pang et al., 2018). Because of their habitat habit of living in rock crevices and coral reefs of Octopodidae, they need to adjust their predating strategies, eventually reducing their respiration consumption (Pang et al., 2022). In comparison, the Ecopath model focuses on the roles of phytoplankton and detritus in the energy flow of the ecosystem, whereas the LIM-MCMC focuses on the mediating role of detritus and the respiration consumption of functional groups at trophic levels I and II. Compared with other studies, the overall energy transfer efficiency in the Laizhou Bay ecosystem (5.4%) was within a reasonable range in the current study, reflecting the stability of this ecosystem (Xu et al., 2019).
4.3 Characteristics of the food web structure in the Laizhou Bay ecosystem
Analysis of the food web structure highlights the complex correlation and predator-prey relationships between producers, consumers, and detritus in the ecosystem (McDonald Madden et al., 2016). In the present study, the dominant zooplankton species were copepods, which mainly fed on nearshore diatoms (Miralto et al., 1999). Although zooplankton and phytoplankton are functional groups at low trophic levels, they play a vital role in maintaining the stability and complexity of the food web structure by accelerating the energy flow (Zhang et al., 2022b). In the food web structure of the Ecopath model, the total values of the energy flows were dominated by functional groups at high trophic levels (e.g., pelagic fish), which had few paths of energy flow. For example, there were six energy flow paths for the functional group of Sciaenidae, indicating less dependence on other functional groups in the food web structure. Although the energy flow values of the functional groups at low trophic levels (e.g., zooplankton, meiobenthos, and molluscs) were low, the number of their related energy flow paths was high. Thus, these results revealed a decrease in total energy transfer efficiency, which further increased the vulnerability of the food web structure and even the stability of the ecosystem. These patterns were also observed in the Bizerte Bay ecosystem (Meddeb et al., 2019). Additionally, competitive relationships between different functional groups for ecological niches were observed. For example, in the Haizhou Bay ecosystem, a high level of ecological niche overlap between zooplankton and meiobenthos indicated competition for the same space and food resources, which partly affects the energy transfer efficiency (Bergman and Greenberg, 1994; Gao et al., 2022).
In the current study, the energy flow characteristics of the detrital food chain determined by the LIM-MCMC were more detailed than those determined by the Ecopath model based on specific divisions of the energy flow paths in the LIM-MCMC, which also reflected the utilisation efficiencies of detritus by different functional groups. Meiobenthos, molluscs, and crustaceans were the dominant functional groups in the detrital food chain in the LIM-MCMC, most of which were r-selection species in aquatic ecosystems (Akoglu, 2023). Owing to their life stages and habitat characteristics, functional groups of r-selection species have commonly been used as indicators of unstable developmental stages of an ecosystem (MacArthur and Wilson, 1967). These r-selection species have rapid reproductive ability and a short life span; thus, they show less competition in the ecological niche to adjust to unstable ecosystems (Bohn et al., 2014). However, ecosystems become dominated by functional groups composed of k-selection species as the ecosystem matures (MacArthur and Wilson, 1967). These findings were also supported by the APL and TPP/TR values in the LIM-MCMC, indicating that the Laizhou Bay ecosystem was in an unstable developmental stage, which has also been observed in the Biscay Bay ecosystem (Chaalali et al., 2015). Additionally, the number of energy flow paths of Sciaenidae was lower than that of other functional groups. This phenomenon may be related to overfishing, marine pollution, and other human activities, which have caused the population decline and even extinction of many organisms. Thus, food chains in fragile ecosystems are simple. Therefore, the food web of the Laizhou Bay ecosystem was characterised by relatively short food chains in the Ecopath model and LIM-MCMC. The simplicity and inherent fragility of the food web render the ecosystem highly vulnerable to external disturbances. Even small fluctuations in species abundance or the loss of certain species can disturb the stability of the structure and function of the ecosystem (Narwani et al., 2019).
4.4 Overall assessment of the structure and function of the Laizhou Bay ecosystem
The characteristic parameters discussed above are recognised as important indicators for assessing the structure and function of the Laizhou Bay ecosystem (Banerjee et al., 2017), especially the energy flow paths and efficiency. The values of the TC (4407.67 t·km-2·a-1) were identical in the two models in the present study, but they were higher than those recorded in the Laizhou Bay ecosystem in 2014–2015 (Ju et al., 2020), which also caused higher levels of the TST parameter. Moreover, the values of total flows into detritus were similar in these two models because the weight of U data was divided in detail in the conduction of these two models, which was included in the energy flow of other mortalities in the Ecopath model, but was divided into the energy flow of each functional group in the LIM-MCMC. The parameters in these two models were generally higher than those reported by Xu et al. (2019) and Ju et al. (2020), which revealed that the Laizhou Bay ecosystem was in a period of rapid development in recent years, compared with its state 10 years ago and with the Bohai Sea in 2018 (Zhang et al., 2023b) and the Yellow Sea in 2022 (Zhang et al., 2022a). The predominant reasons causing this phenomenon are closely related to climate change and frequent human activities, such as the development of marine ranching, enhancement, and release (Tang et al., 2025).
The TST value calculated by the LIM-MCMC was higher than that calculated by the Ecopath model because of the high TR in the LIM-MCMC. Respiration in the Ecopath model was used to balance the energy flow between the different functional groups. In this model, the assimilated food is consumed either through production or respiration. Specifically, respiration is the difference between the part assimilated by consumption and the difference between the total and primary production (Christensen et al., 2005). The Ecopath model ignores the contribution for respiration consumption of the functional groups of meiobenthos and zooplankton, resulting in low TR values. By contrast, LIM-MCMC was conducted and assessed based on a natural ecosystem, and the output results were more comprehensive and realistic. Meanwhile, the TPP values in these two models were identical; thus, the ratio of TPP/TR in the LIM-MCMC was lower than that in the Ecopath model, which may indicate inefficient energy transfer efficiency of primary productivity (Banerjee et al., 2017). Moreover, the TPP/TR parameter has been commonly used for the assessment of ecosystem ability (Zeng et al., 2024), which revealed that the Laizhou Bay ecosystem was in an unstable developmental stage during the current study and vulnerable to disturbance by human activities. However, the TPP/TR ratio in the present Ecopath model indicated that the Laizhou Bay ecosystem was mature, which is consistent with the results of Xihu Habor (He et al., 2021) and Changshan Archipelago (Zhang et al., 2023b). However, Xu et al. (2019) found the opposite results in Laizhou Bay. These contrasting results are attributed to the drawback that the Ecopath model overlooks the authenticity of the respiration input data, which directly affects the assessment of the parameters of TR and TPP/TR (Christensen and Walters, 2004). Compared with the uncertainty of assessment of the Ecopath model, the advantage of the LIM-MCMC is reduced adverse effects of uncertain data; however, the LIM-MCMC also has the disadvantage of not considering predation between the same species, particularly predators at high trophic levels, eventually reducing the values of TST by influencing diet composition and causing deviations in energy flow efficiency (Tecchio et al., 2016). Therefore, the assessment accuracy of the ecosystem structure and function can be improved by combining these two models. Furthermore, comparative studies using these two models will help corroborate ecological conclusions, which could be further employed for sensitivity analysis by modifying the constraints on specific biological compartments according to future climatic projections, thereby supporting the optimisation of fishery management strategies.
5 Conclusion
The Ecopath model and LIM-MCMC were used to analyse the characteristics of the energy flow and food web structure, respectively, in the Laizhou Bay ecosystem, which was divided into 22 functional groups. The trophic levels of these functional groups ranged from 1.00 to 3.48, and groups with medium and high trophic levels were dominant. Notably, the Ecopath model indicated an energy transfer efficiency of 5.34%, with primary producers playing a dominant role. In contrast, the LIM-MCMC showed that the energy flow was primarily controlled by respiration and detritus input within functional groups at lower trophic levels. These two models revealed that the food chain in the Laizhou Bay ecosystem was reduced and the food web structure was of low complexity. Additionally, the Ecopath model suggested that this ecosystem was relatively mature, whereas the LIM-MCMC suggested that this ecosystem was in an unstable developmental stage with low primary productivity and energy utilisation efficiency. These results provide a scientific basis for the restoration and sustainable management of the Laizhou Bay ecosystem.
Statements
Data availability statement
The original contributions presented in the study are included in the article/Supplementary Material. Further inquiries can be directed to the corresponding authors.
Author contributions
CW: Data curation, Formal Analysis, Methodology, Software, Writing – original draft, Conceptualization. XB: Conceptualization, Data curation, Formal Analysis, Writing – original draft. DX: Conceptualization, Data curation, Formal Analysis, Methodology, Writing – original draft. YJ: Conceptualization, Methodology, Writing – original draft. LM: Data curation, Formal Analysis, Methodology, Software, Writing – original draft. ZD: Data curation, Investigation, Writing – original draft. LS: Data curation, Investigation, Writing – original draft. LZ: Conceptualization, Methodology, Resources, Supervision, Writing – original draft. LF: Conceptualization, Data curation, Formal Analysis, Methodology, Writing – review & editing. RZ: Conceptualization, Data curation, Formal Analysis, Methodology, Writing – review & editing.
Funding
The author(s) declare that financial support was received for the research and/or publication of this article. This study was funded by the National Natural Science Foundation of China (No. 42306149) and the Natural Science Foundation of Shandong Province, China (No. ZR2021QC082).
Conflict of interest
The authors declare that the research was conducted in the absence of any commercial or financial relationships that could be construed as a potential conflict of interest.
Generative AI statement
The author(s) declare that no Generative AI was used in the creation of this manuscript.
Publisher’s note
All claims expressed in this article are solely those of the authors and do not necessarily represent those of their affiliated organizations, or those of the publisher, the editors and the reviewers. Any product that may be evaluated in this article, or claim that may be made by its manufacturer, is not guaranteed or endorsed by the publisher.
Supplementary material
The Supplementary Material for this article can be found online at: https://www.frontiersin.org/articles/10.3389/fmars.2025.1572355/full#supplementary-material
References
1
Adámek Z. Maršálek B. (2013). Bioturbation of sediments by benthic macroinvertebrates and fish and its implication for pond ecosystems: a review. Aquaculture Int.21, 1–17. doi: 10.1007/s10499-012-9527-3
2
Akoglu E. (2023). Ecological indicators reveal historical regime shifts in the Black Sea ecosystem. PeerJ.11, e15649. doi: 10.7717/peerj.15649
3
Banerjee A. Chakrabarty M. Rakshit N. Mukherjee J. Ray S. (2017). Indicators and assessment of ecosystem health of Bakreswar reservoir, India: An approach through network analysis. Ecol. Indicators.80, 163–173. doi: 10.1016/j.ecolind.2017.05.021
4
Bergman E. Greenberg L. A. (1994). Competition between a planktivore, a benthivore, and a species with ontogenetic diet Shifts. Ecology.75, 1233–1245. doi: 10.2307/1937449
5
Bohn K. Pavlick R. Reu B. Kleidon A. (2014). The strengths of r- and K-selection shape diversity-disturbance relationships. PloS One9, e95659. doi: 10.1371/journal.pone.0095659
6
Cebrian J. (2015). Energy flows in ecosystems. Science.349, 1053–1054. doi: 10.1126/science.aad0684
7
Chaalali A. Saint-Béat B. Lassalle G. Le Loc’h F. Tecchio S. Safi G. et al . (2015). A new modeling approach to define marine ecosystems food-web status with uncertainty assessment. Prog. Oceanography.135, 37–47. doi: 10.1016/j.pocean.2015.03.012
8
Christensen V. Pauly D. (1992). ECOPATH II-a software for balancing steady-state ecosystem models and calculating network characteristics. Ecol. Modelling.61, 169–185. doi: 10.1016/0304-3800(92)90016-8
9
Christensen V. Walters C. J. (2004). Ecopath with Ecosim: methods, capabilities and limitations. Ecol. Modelling.172, 109–139. doi: 10.1016/j.ecolmodel.2003.09.003
10
Christensen V. Walters C. Pauly D. (2005). Ecopath with Ecosim: A User’s Guide (Canada: Fisheries Centre. University of British Columbia, Vancouver).
11
Davis W. R. (1993). The role of bioturbation in sediment resuspension and its interaction with physical shearing. J. Exp. Mar. Biol. Ecology.171, 187–200. doi: 10.1016/0022-0981(93)90003-7
12
Du J. G. Lu Z. B. Yang S. Y. Chen M. R. (2011). Studies on ecological characteristics variation and population dynamics of four lizardfishes in the southern Taiwan Straits. Acta Oceanologica. Sinica.30, 72–81. doi: 10.1007/s13131-011-0163-y
13
Feng J. Tian X. L. Dong S. L. He R. P. Zhang K. Zhang D. X. et al . (2018). Comparative analysis of the energy fluxes and trophic structure of polyculture ecosystems of Portunus trituberculatus based on Ecopath model. Aquaculture.496, 185–196. doi: 10.1016/j.aquaculture.2018.07.020
14
Fry B. (2006). Stable Isotope Ecology (New York, USA: Springer Science and Business Media).
15
Gao S. K. Chen Z. Lu Y. N. Li Z. Zhang S. Yu W. W. (2022). Comparison of marine ecosystems of Haizhou Bay and Lvsi Fishing Ground in China based on the Ecopath model. Water.14, 1397. doi: 10.3390/w14091397
16
Gerber G. Brooker B. Scharler U. M. (2023). Automated workflow for incorporation and evaluation of data uncertainty in ecological networks with autoLIMR. Ecol. Informatics.75, 102375. doi: 10.1016/j.ecoinf.2023.102375
17
Giralt Paradell O. Methion S. Rogan E. Díaz López B. (2021). Modelling ecosystem dynamics to assess the effect of coastal fisheries on cetacean species. J. Environ. Management.285, 112175. doi: 10.1016/j.jenvman.2021.112175
18
Han Q. F. Song C. Sun X. Zhao S. Wang S. G. (2021). Spatiotemporal distribution, source apportionment and combined pollution of antibiotics in natural waters adjacent to mariculture areas in the Laizhou Bay, Bohai Sea. Chemosphere.279, 130381. doi: 10.1016/j.chemosphere.2021.130381
19
He C. Y. Mao S. Q. Yan X. J. Meng K. H. Hu D. F. (2021). Comparison of the 2010 and 2020 ecosystem structures in Xihu Harbor based on the Ecopath model. Ocean Coast. Management.208, 105873. doi: 10.1016/j.ocecoaman.2021.105873
20
Hossain M. Stewart T. J. Arhonditsis G. B. van Oevelen D. Minns C. K. Koops M. A. (2017). Uncertainty assessment of trophic flows in Hamilton Harbour: A linear inverse modelling analysis. Aquat. Ecosystem Health Management.20, 265–277. doi: 10.1080/14634988.2017.1342517
21
Hu N. Wang F. Zhang T. Song H. Yu Z. L. Liu D. P. (2016). Prey selection and foraging behavior of the whelk Rapana venosa. Mar. Bioligy163, 233. doi: 10.1007/s00227-016-3006-8
22
Jin X. S. Shan X. J. Li X. S. Wang J. Cui Y. Zuo T. (2013). Long-term changes in the fishery ecosystem structure of Laizhou Bay, China. Sci. China Earth Sci.56, 366–374. doi: 10.1007/s11430-012-4528-7
23
Jones J. G. (1979). A guide to methods for estimating microbial numbers and biomass in fresh water (Ambleside, UK: Freshwater Biological Association).
24
Ju P. L. Cheung W. W. L. Chen M. R. Xian W. W. Yang S. Y. Xiao J. M. (2020). Comparing marine ecosystems of Laizhou and Haizhou Bays, China, using ecological indicators estimated from food web models. J. Mar. Systems.202, 103238. doi: 10.1016/j.jmarsys.2019.103238
25
Kang M. G. Lee S. H. Kim M. J. Kwak S. N. Han I. S. Park J. M. (2023). Resource use among six commercial fish species from the South-Eastern Gill Net Fisheries, Korea. Water.15, 1146. doi: 10.3390/w15061146
26
Kobari T. Shinyashiki M. Saito K. Kume G. Ichinomiya M. Komorita T. et al . (2023). Trophic sources and pathways of mesozooplankton and fish larvae in the Kuroshio and its neighboring waters based on stable isotope ratios of carbon and nitrogen. Prog. Oceanography.210, 102952. doi: 10.1016/j.pocean.2022.102952
27
Kowalewska G. Konat-Stepowicz J. Wawrzyniak-Wydrowska B. Szymczak-Zyła M. (2003). Transfer of organic contaminants to the Baltic in the Odra Estuary. Mar. pollut. Bulletin.46, 703–718. doi: 10.1016/S0025-326X(03)00062-6
28
Kytinou E. Sini M. Issaris Y. Katsanevakis S. (2020). Global systematic review of methodological approaches to analyze coastal shelf food webs. Front. Mar. Science.7. doi: 10.3389/fmars.2020.00636
29
Lamb P. D. Hunter E. Pinnegar J. K. Doyle T. K. Creer S. Taylor M. I. (2019). Inclusion of jellyfish in 30+ years of Ecopath with Ecosim models. ICES J. Mar. Science.76, 1941–1950. doi: 10.1093/icesjms/fsz165
30
Li P. C. Zhang H. L. Zhang C. Xu B. D. Ji Y. P. Ren Y. P. et al . (2024). Temporal variations of food web in a marine bay ecosystem based on LIM-MCMC model. Acta Oceanologica Sinica.43, 79–88. doi: 10.1007/s13131-023-2273-8
31
Liénart C. Karlson A. M. L. Garbaras A. Qvarfordt S. Walve J. (2021). Spatio-temporal variation in stable isotope and elemental composition of key-species reflect environmental changes in the Baltic Sea. Biogeochemistry.156, 45–64. doi: 10.1007/s10533-021-00865-w
32
Lindeman R. L. (1991). The trophic-dynamic aspect of ecology. Bull. Math. Biol.53, 167–191. doi: 10.1016/S0092-8240(05)80045-X
33
MacArthur R. H. Wilson E. O. (1967). The theory of island biogeography (Princeton, USA: Princeton University Press).
34
McDonald Madden E. Sabbadin R. Game E. Baxter P. W. J. Chadès I. Possingham H. P. (2016). Using food-web theory to conserve ecosystems. Nat. Commun.7, 10245. doi: 10.1038/ncomms10245
35
Meddeb M. Niquil N. Grami B. Mejri K. Haraldsson M. Chaalali A. et al . (2019). A new type of plankton food web functioning in coastal waters revealed by coupling Monte Carlo Markov chain linear inverse method and ecological network analysis. Ecol. Indicators.104, 67–85. doi: 10.1016/j.ecolind.2019.04.077
36
Merquiol L. Mazzocchi M. G. D’Ambra I. (2023). The planktonic food web in the Gulf of Naples based on the analysis of carbon and nitrogen stable isotope ratios. Mar. Ecology.e12762. doi: 10.1111/maec.12762
37
Minagawa M. Wada E. (1984). Stepwise enrichment of 15N along food chains: Further evidence and the relation between δ15N and animal age. Geochimica Cosmochimica Acta48, 1135–1140. doi: 10.1016/0016-7037(84)90204-7
38
Miralto A. Barone G. Romano G. Poulet S. A. Ianora A. Russo G. L. et al . (1999). The insidious effect of diatoms on copepod reproduction. Nature.402, 173–176. doi: 10.1038/46023
39
Moore J. C. Berlow E. L. Coleman D. C. De Suiter P. C. Dong Q. Hastings A. et al . (2004). Detritus, trophic dynamics and biodiversity. Ecol. Letters.7, 584–600. doi: 10.1111/j.1461-0248.2004.00606.x
40
Morissette L. (2007). Complexity, cost and quality of ecosystem models and their impact on resilience: a comparative analysis, with emphasis on marine mammals and the Gulf of St. Lawrence. University of British Columbia, Vancouver BC, Canada.
41
Narwani A. Reyes M. Pereira A. L. Penson H. Dennis S. R. Derrer S. et al . (2019). Interactive effects of foundation species on ecosystem functioning and stability in response to disturbance. Proc. R. Soc. B: Biol. Sci.286, 1913. doi: 10.1098/rspb.2019.1857
42
Palomares M. L. D. Pauly D. (1998). Predicting food consumption of fish populations as functions of mortality, food type, morphometrics, temperature and salinity. Mar. Freshw. Res.49, 447–453. doi: 10.1071/mf98015
43
Pang Y. M. Tian Y. J. Fu C. H. Wang B. Li J. C. Ren Y. P. et al . (2018). Variability of coastal cephalopods in overexploited China Seas under climate change with implications on fisheries management. Fisheries Res.208, 22–33. doi: 10.1016/j.fishres.2018.07.004
44
Pang Y. M. Tian Y. J. Ju P. L. Sun P. Ye Z. J. Liu Y. et al . (2022). Change in cephalopod species composition in the overexploited coastal China seas with a closer look on Haizhou Bay, Yellow Sea. Regional Stud. Mar. Sci.53, 102419. doi: 10.1016/j.rsma.2022.102419
45
Parsons T. R. Strickland J. D. H. (1962). Oceanic detritus. Science.136, 313–314. doi: 10.1126/science.136.3513.313
46
Post D. M. (2002). Using stable isotopes to estimate trophic position: Models, methods, and assumptions. Ecology.83, 703–718. doi: 10.1890/0012-9658(2002)083[0703:USITET]2.0.CO;2
47
Qu P. Pang M. Qu F. Y. Li Z. Xiao M. Zhang Z. H. (2021). Natural distinction of carbon and nitrogen isotopic niches in common fish species across marine biotopes in the Yellow River estuary. Ecol. Evolution.11, 11077–11089. doi: 10.1002/ece3.7895
48
Seifert M. Nissen C. Rost B. Vogt M. Völker C. Hauck J. (2023). Interaction matters: Bottom-up driver interdependencies alter the projected response of phytoplankton communities to climate change. Global Change Biol.29, 4234–4258. doi: 10.1111/gcb.16799
49
Shin D. Park T. H. Lee C. I. Hwang K. Kim D. N. Lee S. J. et al . (2022). Characterization of trophic structure of fish assemblages in the East and South Seas of Korea based on C and N stable isotope ratios. Water.14, 58. doi: 10.3390/w14010058
50
Smith A. D. M. Brown C. J. Bulman C. M. Fulton E. A. Johnson P. Kaplan I. C. et al . (2011). Impacts of fishing low-trophic level species on marine ecosystems. Science.333, 1147–1150. doi: 10.1126/science.1209395
51
Tang S. M. Xu P. Zhang S. Y. Yin Y. Q. Liang J. Jiang Y. Z. et al . (2025). An idea for marine ranching planning based on ocean currents and its practice in Zhongjieshan Archipelago National Marine Ranching, China. Aquaculture.596, 741780. doi: 10.1016/j.aquaculture.2024.741780
52
Tecchio S. Chaalali A. Raoux A. Tous Rius A. Lequesne J. Girardin V. et al . (2016). Evaluating ecosystem-level anthropogenic impacts in a stressed transitional environment: The case of the Seine estuary. Ecol. Indicators.61, 833–845. doi: 10.1016/j.ecolind.2015.10.036
53
Van den Meersche K. Soetaert K. Van Oevelen D. (2009). Xsample (): an R function for sampling linear inverse problems. J. Stat. Software30, 1–15. doi: 10.18637/jss.v030.c01
54
Wang X. Lin C. G. Wang W. Z. Zhang L. B. (2024). The non-negligible contribution of foundation species to artificial reef construction revealed by Ecopath models. J. Environ. Management.366, 121887. doi: 10.1016/j.jenvman.2024.121887
55
Xu M. Qi L. Zhang L. B. Zhang T. Yang H. S. Zhang Y. L. (2019). Ecosystem attributes of trophic models before and after construction of artificial oyster reefs using Ecopath. Aquaculture Environ. Interact.11, 111–127. doi: 10.3354/aei00284
56
Yang H. S. (2018). Marine ranch monitoring and biological carrying capacity assessment (Beijing, China: Science Press).
57
Yu H. Q. Yu H. M. Ito S. Tian Y. J. Wang H. Liu Y. et al . (2020). Potential environmental drivers of Japanese anchovy (Engraulis japonicus) recruitment in the Yellow Sea. J. Mar. Systems.212, 103431. doi: 10.1016/j.jmarsys.2020.103431
58
Zeng Y. Liu G. G. Li J. X. Zhao Y. W. Yang W. (2024). Ecological threshold of phosphorus load in Baiyangdian Lake based on a PCLake model and ecological network analysis. Sci. Total Environment.915, 170091. doi: 10.1016/j.scitotenv.2024.170091
59
Zhang F. F. Fu H. R. Lou H. W. Sun X. J. Zhang D. Sun P. Y. et al . (2023a). Assessment of eutrophication from Xiaoqing River estuary to Laizhou Bay: Further warning of ecosystem degradation in a typically polluted estuary. Mar. pollut. Bulletin.193, 115209. doi: 10.1016/j.marpolbul.2023.115209
60
Zhang Z. Li H. J. Shen W. L. Feng K. Li S. Z. Gu S. S. et al . (2022b). The stability of phyto-zooplanktonic networks varied with zooplanktonic sizes in chinese coastal ecosystem. mSystems.7, e0082122. doi: 10.1128/msystems.00821-22
61
Zhang X. P. Song H. J. Zhuang H. F. Yi S. J. Hong X. G. Chu J. S. et al . (2023b). Calculating the carrying capacity of bivalve mariculture in the Changshan Archipelago (Bohai Strait, China): Ecopath modeling perspective. J. Sea Res.192, 102367. doi: 10.1016/j.seares.2023.102367
62
Zhang R. L. Zhang Q. Q. Zhao J. M. Wu Z. X. Liu H. Shou L. et al . (2022a). Using ecopath models to explore differences in ecosystem characteristics between an artificial reef and a nearby natural reef on the coast of the north yellow sea, China. Front. Mar. Science.9. doi: 10.3389/fmars.2022.911714
Summary
Keywords
Ecopath, LIM-MCMC, Laizhou bay, energy flow, food web structure
Citation
Wenhui C, Bingqing X, Xiuqiang D, Jisong Y, Min L, Depu Z, Shengfu L, Zhenbo L, Fan L and Zhonghua R (2025) Comparative study of the characteristics of the energy flow and food web structure in the Laizhou Bay ecosystem based on the Ecopath and LIM-MCMC models. Front. Mar. Sci. 12:1572355. doi: 10.3389/fmars.2025.1572355
Received
07 February 2025
Accepted
26 March 2025
Published
17 April 2025
Volume
12 - 2025
Edited by
Jie Feng, Chinese Academy of Sciences (CAS), China
Reviewed by
Xiaoshang Ru, Chinese Academy of Sciences (CAS), China
Haolin Yu, University of Liège, Belgium
Updates
Copyright
© 2025 Wenhui, Bingqing, Xiuqiang, Jisong, Min, Depu, Shengfu, Zhenbo, Fan and Zhonghua.
This is an open-access article distributed under the terms of the Creative Commons Attribution License (CC BY). The use, distribution or reproduction in other forums is permitted, provided the original author(s) and the copyright owner(s) are credited and that the original publication in this journal is cited, in accordance with accepted academic practice. No use, distribution or reproduction is permitted which does not comply with these terms.
*Correspondence: Ren Zhonghua, renzhonghua16@mails.ucas.ac.cn; Li Fan, lifan811230@126.com
Disclaimer
All claims expressed in this article are solely those of the authors and do not necessarily represent those of their affiliated organizations, or those of the publisher, the editors and the reviewers. Any product that may be evaluated in this article or claim that may be made by its manufacturer is not guaranteed or endorsed by the publisher.