Abstract
Estuarine regions heavily rely on the supply of freshwater from rivers, which could suffer saltwater intrusion. In the late summer and autumn of 2022, the Changjiang basin experienced prolonged severe drought, resulting in the river discharge decreasing to its lowest level according to historical records. Furthermore, the Changjiang Estuary was affected successively by three typhoons in September. Saltwater intrusion extremes have occurred since early September, resulting in the Qingcaosha Reservoir, the largest estuarine reservoir in the world, being unsuitable for water intake for 98 days. This has seriously threatened the safety of the water supply in Shanghai. No such extremely severe event has occurred since salinity has been recorded in the estuary, even in the dry season. Our findings show that saltwater intrusion extremes were caused by the combined effect of extremely low river discharge and typhoons, which drove substantial landward water transport to form a horizontal estuarine circulation flowing into the North Channel and out of the South Channel. This landward net water transport overcame seaward runoff and brought highly saline water into the estuary. The extremely low river discharge is the fundamental cause for the severe saltwater intrusion, and the typhoons greatly amplified it. The surface and bottom salinities at the water intake of the Qingcaosha Reservoir were amplified 9.6 and 23.4 times by Typhoon Hinnamonr and 10.1 and 15.1 times by Typhoon Nanmadol, respectively. We reveal the dynamic cause of saltwater intrusion extremes, which is conducive for developing effective response measures for estuarine freshwater resources safety.
1 Introduction
Worldwide, deltaic regions are among the most populated areas, with approximately 1.2 billion people living within 100 kilometers of coastlines (Small and Nicholls, 2003). These regions heavily rely on the supply of freshwater from river systems, which could suffer saltwater intrusion (high-salinity water from the outer sea was transported upstream with the flood tide, mixing and increasing salinity in the upstream river channel) due to their proximity to the sea (Costall et al., 2018). The unavailability of freshwater is a global issue (Mekonnen and Hoekstra, 2016), and it is most profound in these coastal regions (Jumain et al., 2022; Wada et al., 2011). Saltwater intrusion reduces the acquisition of freshwater resources and has adverse effects on production, daily life, and the environment, which is a key issue that needs to be resolved in estuary areas (Li et al., 2024; Aziz and Tarya, 2024; Jumain et al., 2022; Kolb et al., 2022; Pokavanich and Guo, 2024). Saltwater intrusion is mainly controlled by river discharge and tides (Prandle, 1985; Simpson et al., 1990; Zhu et al., 2021), as well as wind and other factors (Aristizábal and Chant, 2015; Geyer, 1997; Li et al., 2022; Scully et al., 2005; Zhu et al., 2020; Guo et al., 2022; Yang and Zhang, 2023).
The Changjiang River basin, nestled in the subtropical region and influenced by monsoons, boasts a vast network of tributaries, and is home to numerous cities and a significant population. The Changjiang Estuary is one of the largest estuaries in the world and is characterized by multiple bifurcations (Figure 1). The water resources in Shanghai were strategically transferred from the Huangpu River to the Changjiang Estuary in 2010, when the largest estuarine reservoir in the world, the Qingcaosha Reservoir, was built. This reservoir has an effective capacity of 4.35×10⁸ m3 and provides a daily water supply of 7.19×10⁶ m3 for the 13 million people in the major districts of Shanghai, accounting for 75% of the total freshwater in the city. The Changjiang Estuary suffered extremely severe saltwater intrusion in late summer and autumn of 2022, resulting in the Qingcaosha Reservoir’s unsuitable water intake time reached 98 days, far exceeding its designed capacity of 68 days (Zhu et al., 2013). This prolonged period of unsuitable water from the estuary posed an extremely serious threat to freshwater resources in Shanghai. No similar catastrophic saltwater intrusion event has occurred since salinity data have been recorded, even during the dry season. What was the cause for the occurrence of catastrophic saltwater intrusion in the Changjiang Estuary in 2022? In this paper, the dynamic process and mechanism of the event were revealed using observation data and a numerical model.
Figure 1
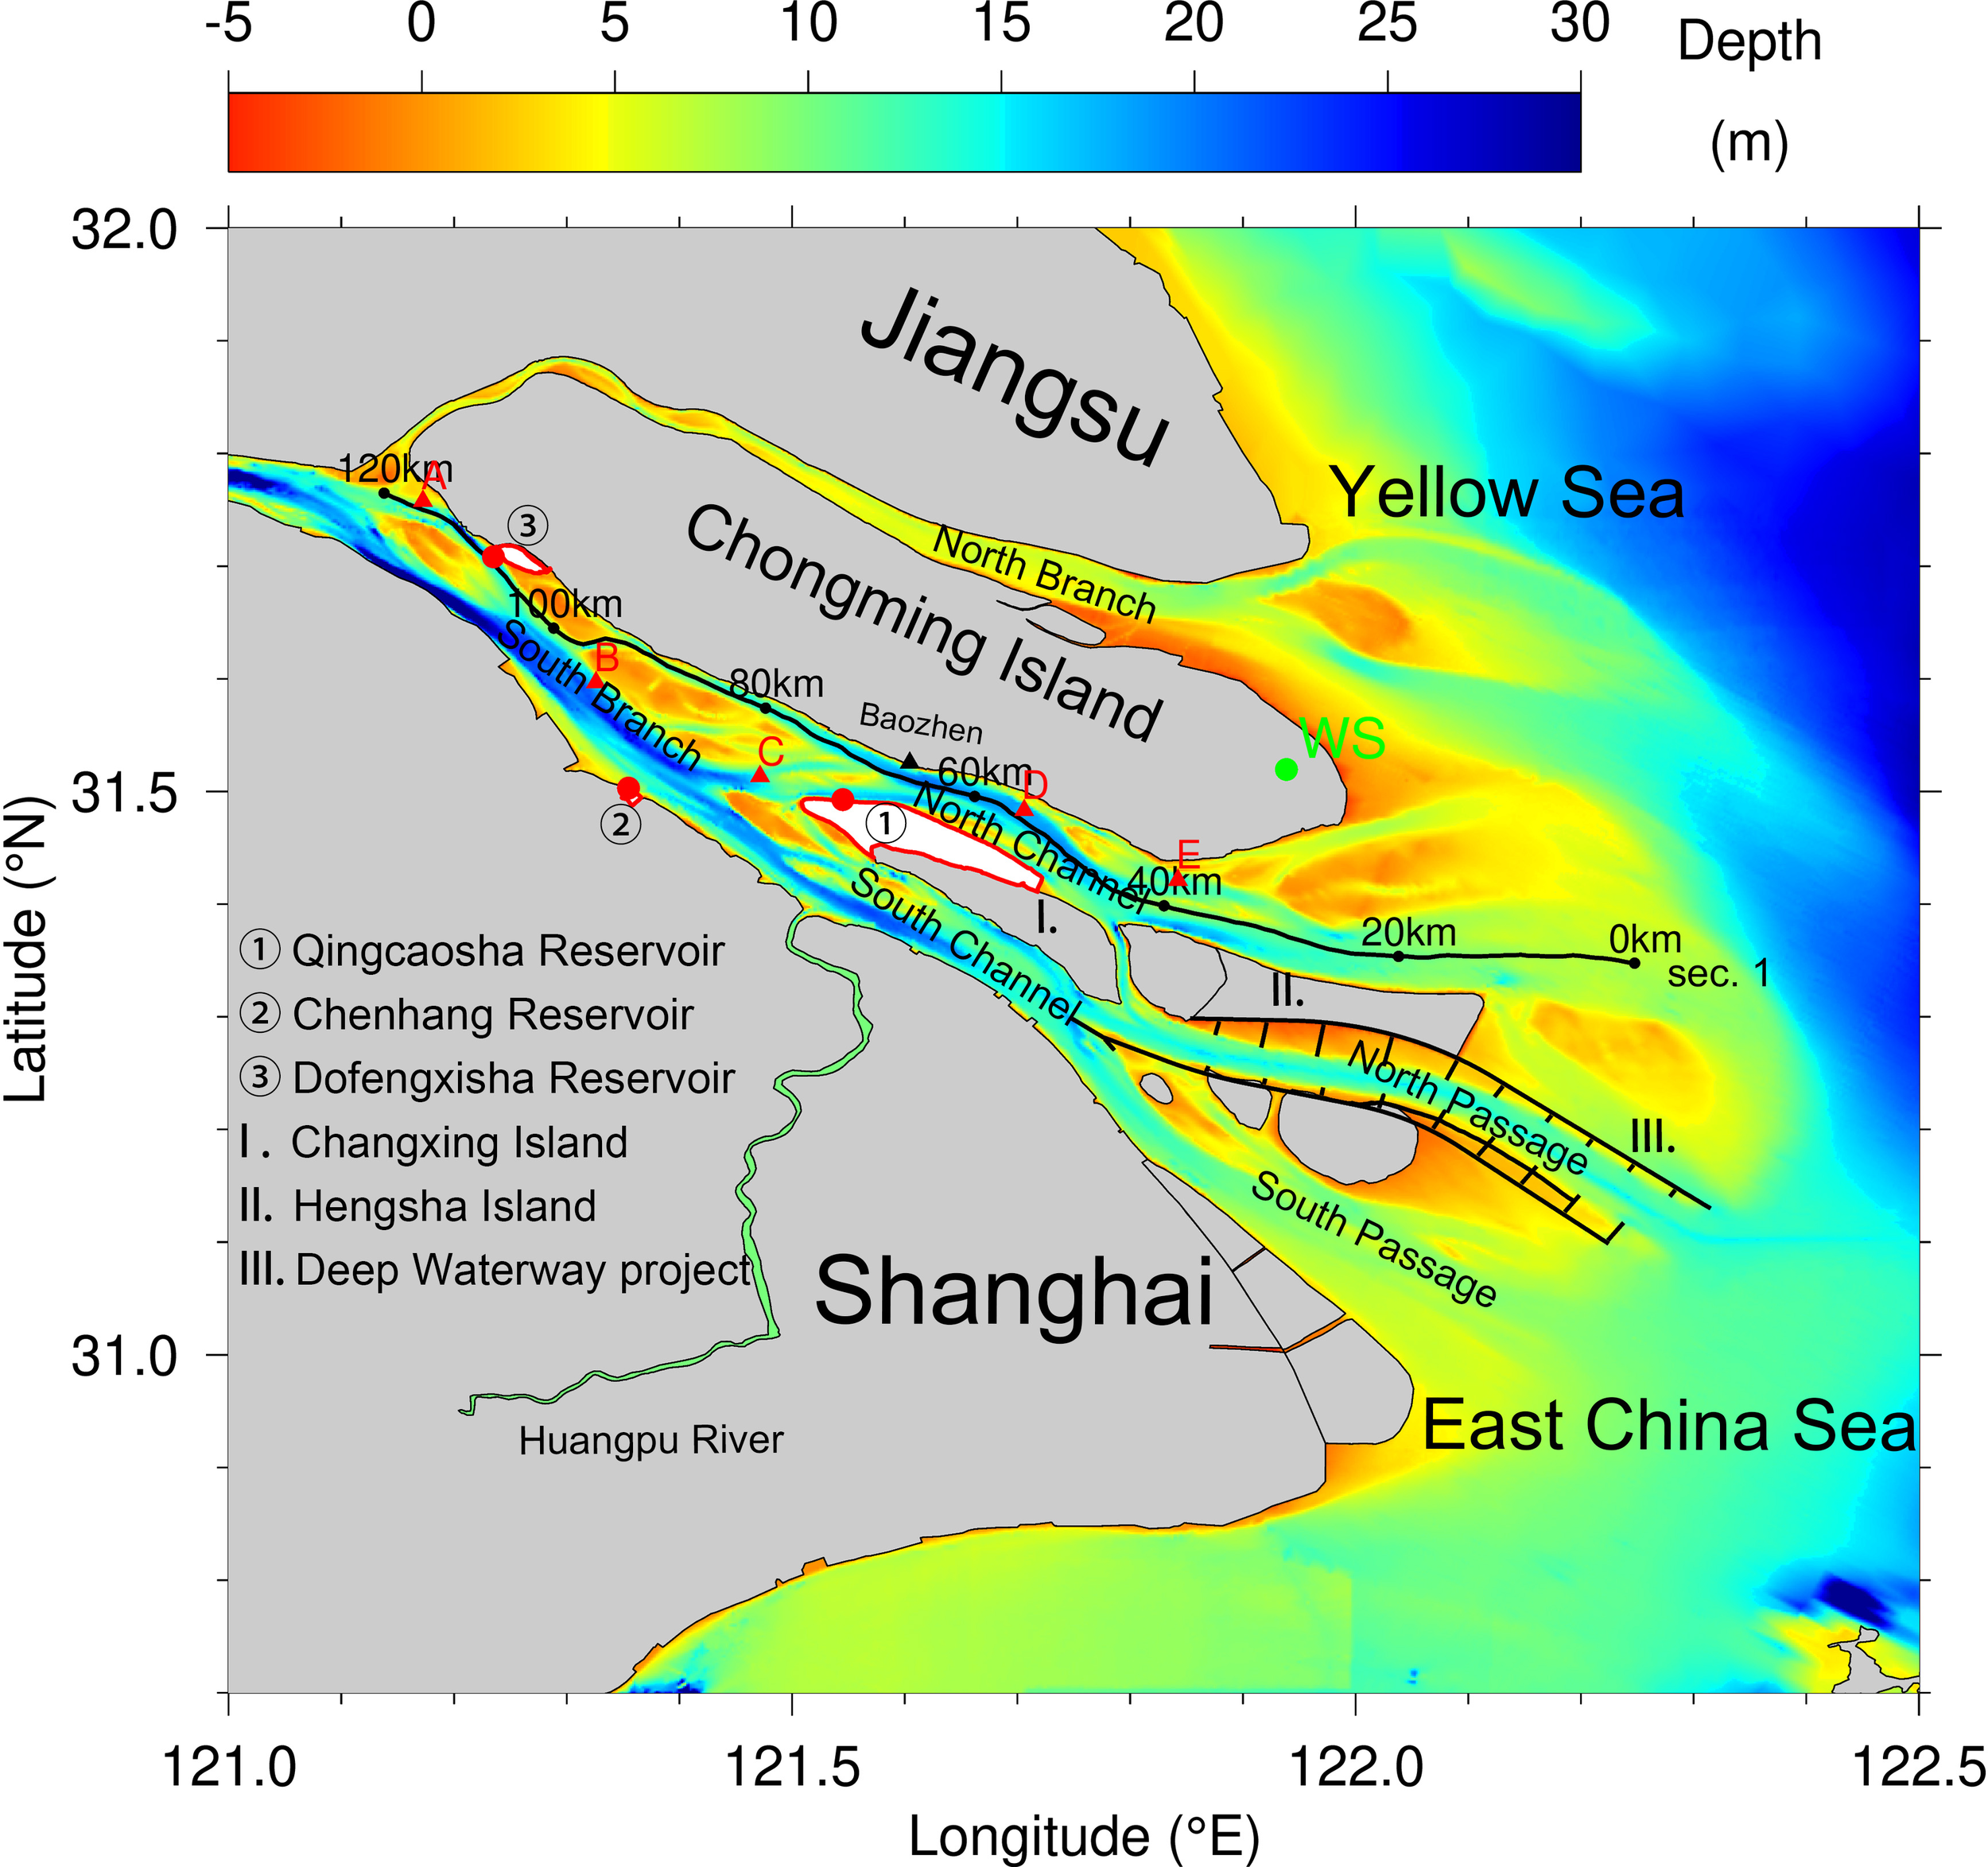
Topography of the Changjiang Estuary. The red dots indicate the locations of the reservoir water intakes. The red triangles with letters indicate the locations of the anchored boat measurement sites. Black triangle: Baozhen hydrologic station; WS is the location of the weather station on the Chongming eastern shoal. sec.1 is the longitudinal section along the North Channel and South Branch with the black dots and numbers corresponding to the distance from the start point.
2 Methods
2.1 Numerical model
A two-way nested unstructured quadrilateral grid, finite-differencing, three-dimensional estuarine and coastal ocean model (UFDECOM) was developed by Ding et al. (2021). Based on this, Ma et al. (2024) proposed an implicit, grid-nesting elevation solution based on flux balance and a matching nesting boundary flux conservation interpolation to upgrade the model to UFDECOM-i. In this paper UFDECOM-i was used to simulate the saltwater intrusion extremes. The model adopts sigma coordinates in the vertical direction and a curvilinear nonorthogonal mesh in the horizontal direction (Chen et al., 2004). The model domain covered the Bohai Sea, Yellow Sea, Changjiang Estuary and most of the East China Sea, and the western boundary was set at Datong station as the river boundary specified with daily averaged river discharge (Figure 2A). The area around the Changjiang Estuary was partially encrypted at a ratio of 1:3 with a resolution of 100 to 400 m (Figure 2B). The resolution was approximately 20 km far away from the estuary. The sea boundary of the model was driven by ocean currents composed of tidal currents and residual currents, as shown below:
Figure 2
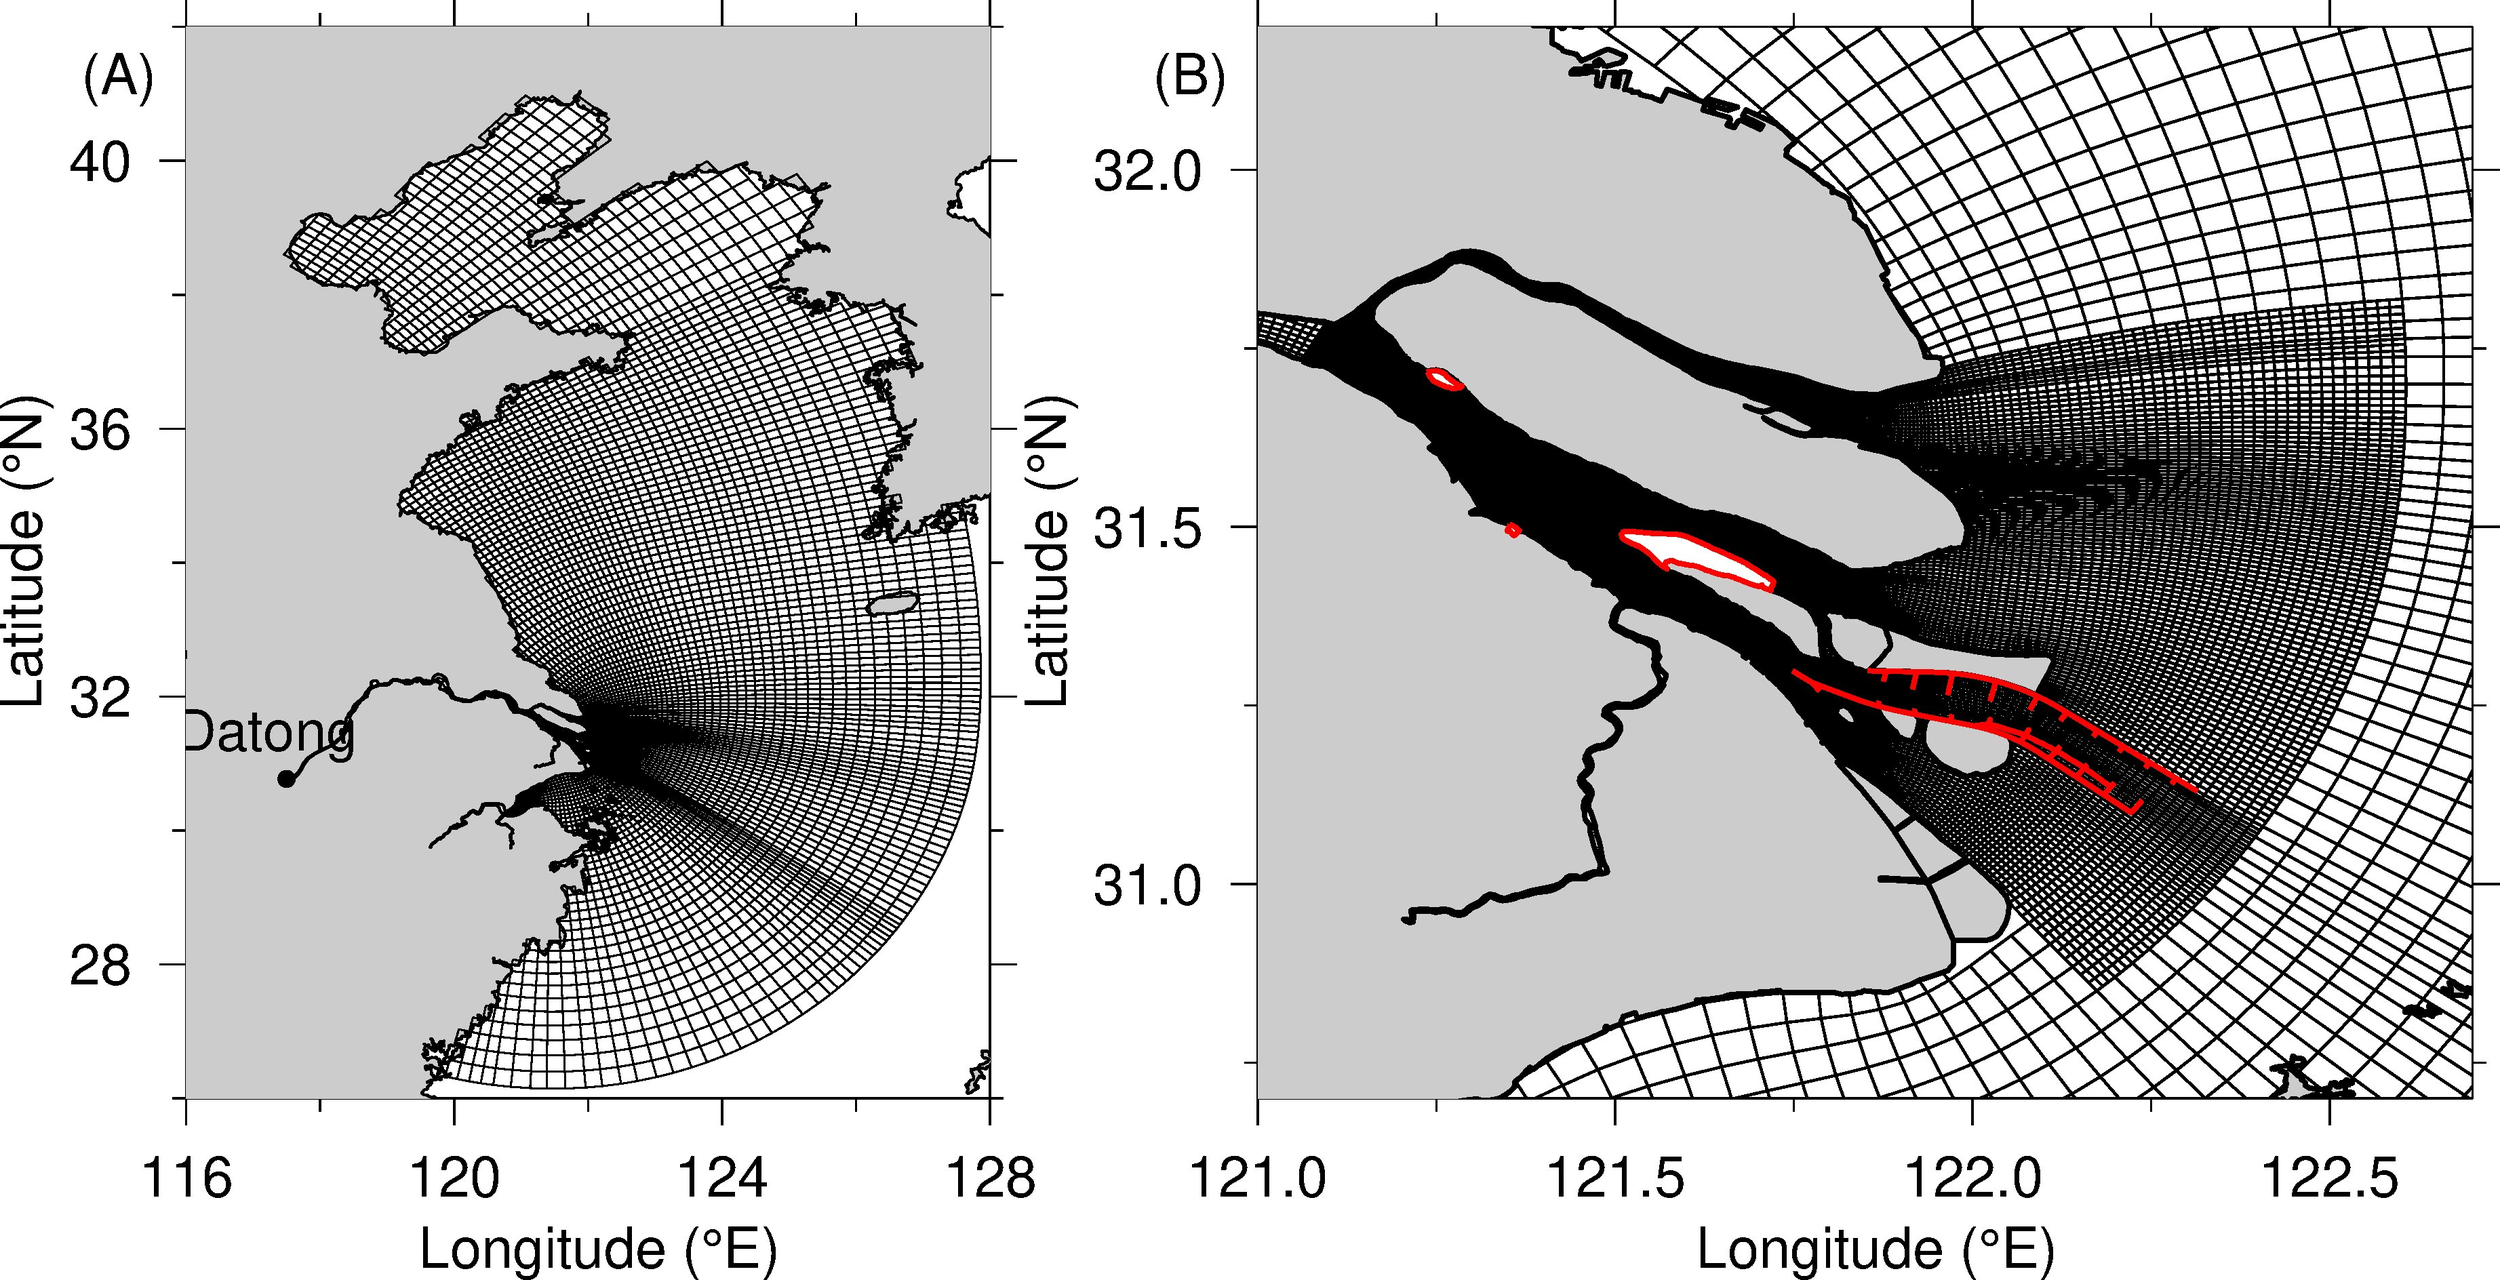
(A) Numerical model domain and curvilinear grids before local refinement. (B) Enlarged views of the nested unstructured quadrilateral grids after local refinement in the Changjiang Estuary.
where v is the total ocean current and is the residual current reflecting the continental shelf current. The tidal current consisted of 15 tidal components, including M2, S2, N2, K2, K1, O1, P1, Q1, MF, MM, MN4, M4, MS4, S1 and 2N2. ωi is the tidal frequency, and ai and gi are harmonic constants representing the amplitude and phase of each tidal component, respectively, taken from TPOX9 (https://www.tpxo.net/global/tpxo9-atlas) (Egbert and Erofeeva, 2002). The bathymetric data were derived from the digitization of nautical charts. The residual current was adopted from the monthly mean data of HYCOM (https://data.hycom.org/datasets). Our model was driven by ocean circulation, tides, river discharge and meteorological factors to simulate elevation, current and salinity. The initial salinity field was taken from the Ocean Atlas in the Huanghai Sea and East China Sea (Hydrology) (Editorial Board For Marine Atlas, 1992). The wind was simulated by the Weather Research and Forecasting (WRF) model. The initial and boundary conditions of WRF were derived from the global reanalysis meteorological data provided by the National Centers for Environmental Prediction (NCEP) database, with a spatial resolution of 1°×1° and a temporal resolution of 6 hours (http://dss.ucar.edu/datasets/ds083.2/).
2.2 Model validation and evaluation
The numerical model has been validated for the water level, current and salinity (Ding et al., 2021; Ma et al., 2024). To further demonstrate the model capacity, the measured data conducted during September 7-8, 2022 in the Changjiang Estuary were used to validate the model. The correlation coefficient (CC), root-mean-square error (RMSE) and skill score (SS) were used to assess the results. When the SS is equal to 1, the model validation was considered perfect, and when the SS is greater than 0.5, the model validation is considered very good (Murphy, 1988). Comparisons of the modeled current speed, direction and salinity at the surface and bottom layers with those at measured sites A, B, C, D and E are showed Figure 3, indicating that the modeled current and salinity were consistent with the observed values. The results of the current speed and salinity assessments are summarized in Tables 1 and 2. For the surface and bottom current speeds, the SSs were greater than 0.82 and 0.81 at each site and greater than 0.92 and 0.91 at sites C and A, respectively. For the surface and bottom salinities, the SSs were greater than 0.61 and 0.71 at each site and greater than 0.78 and 0.88 at sites D and C, respectively. The model validation showed that the model could correctly simulate the hydrodynamics and saltwater intrusion processes.
Figure 3
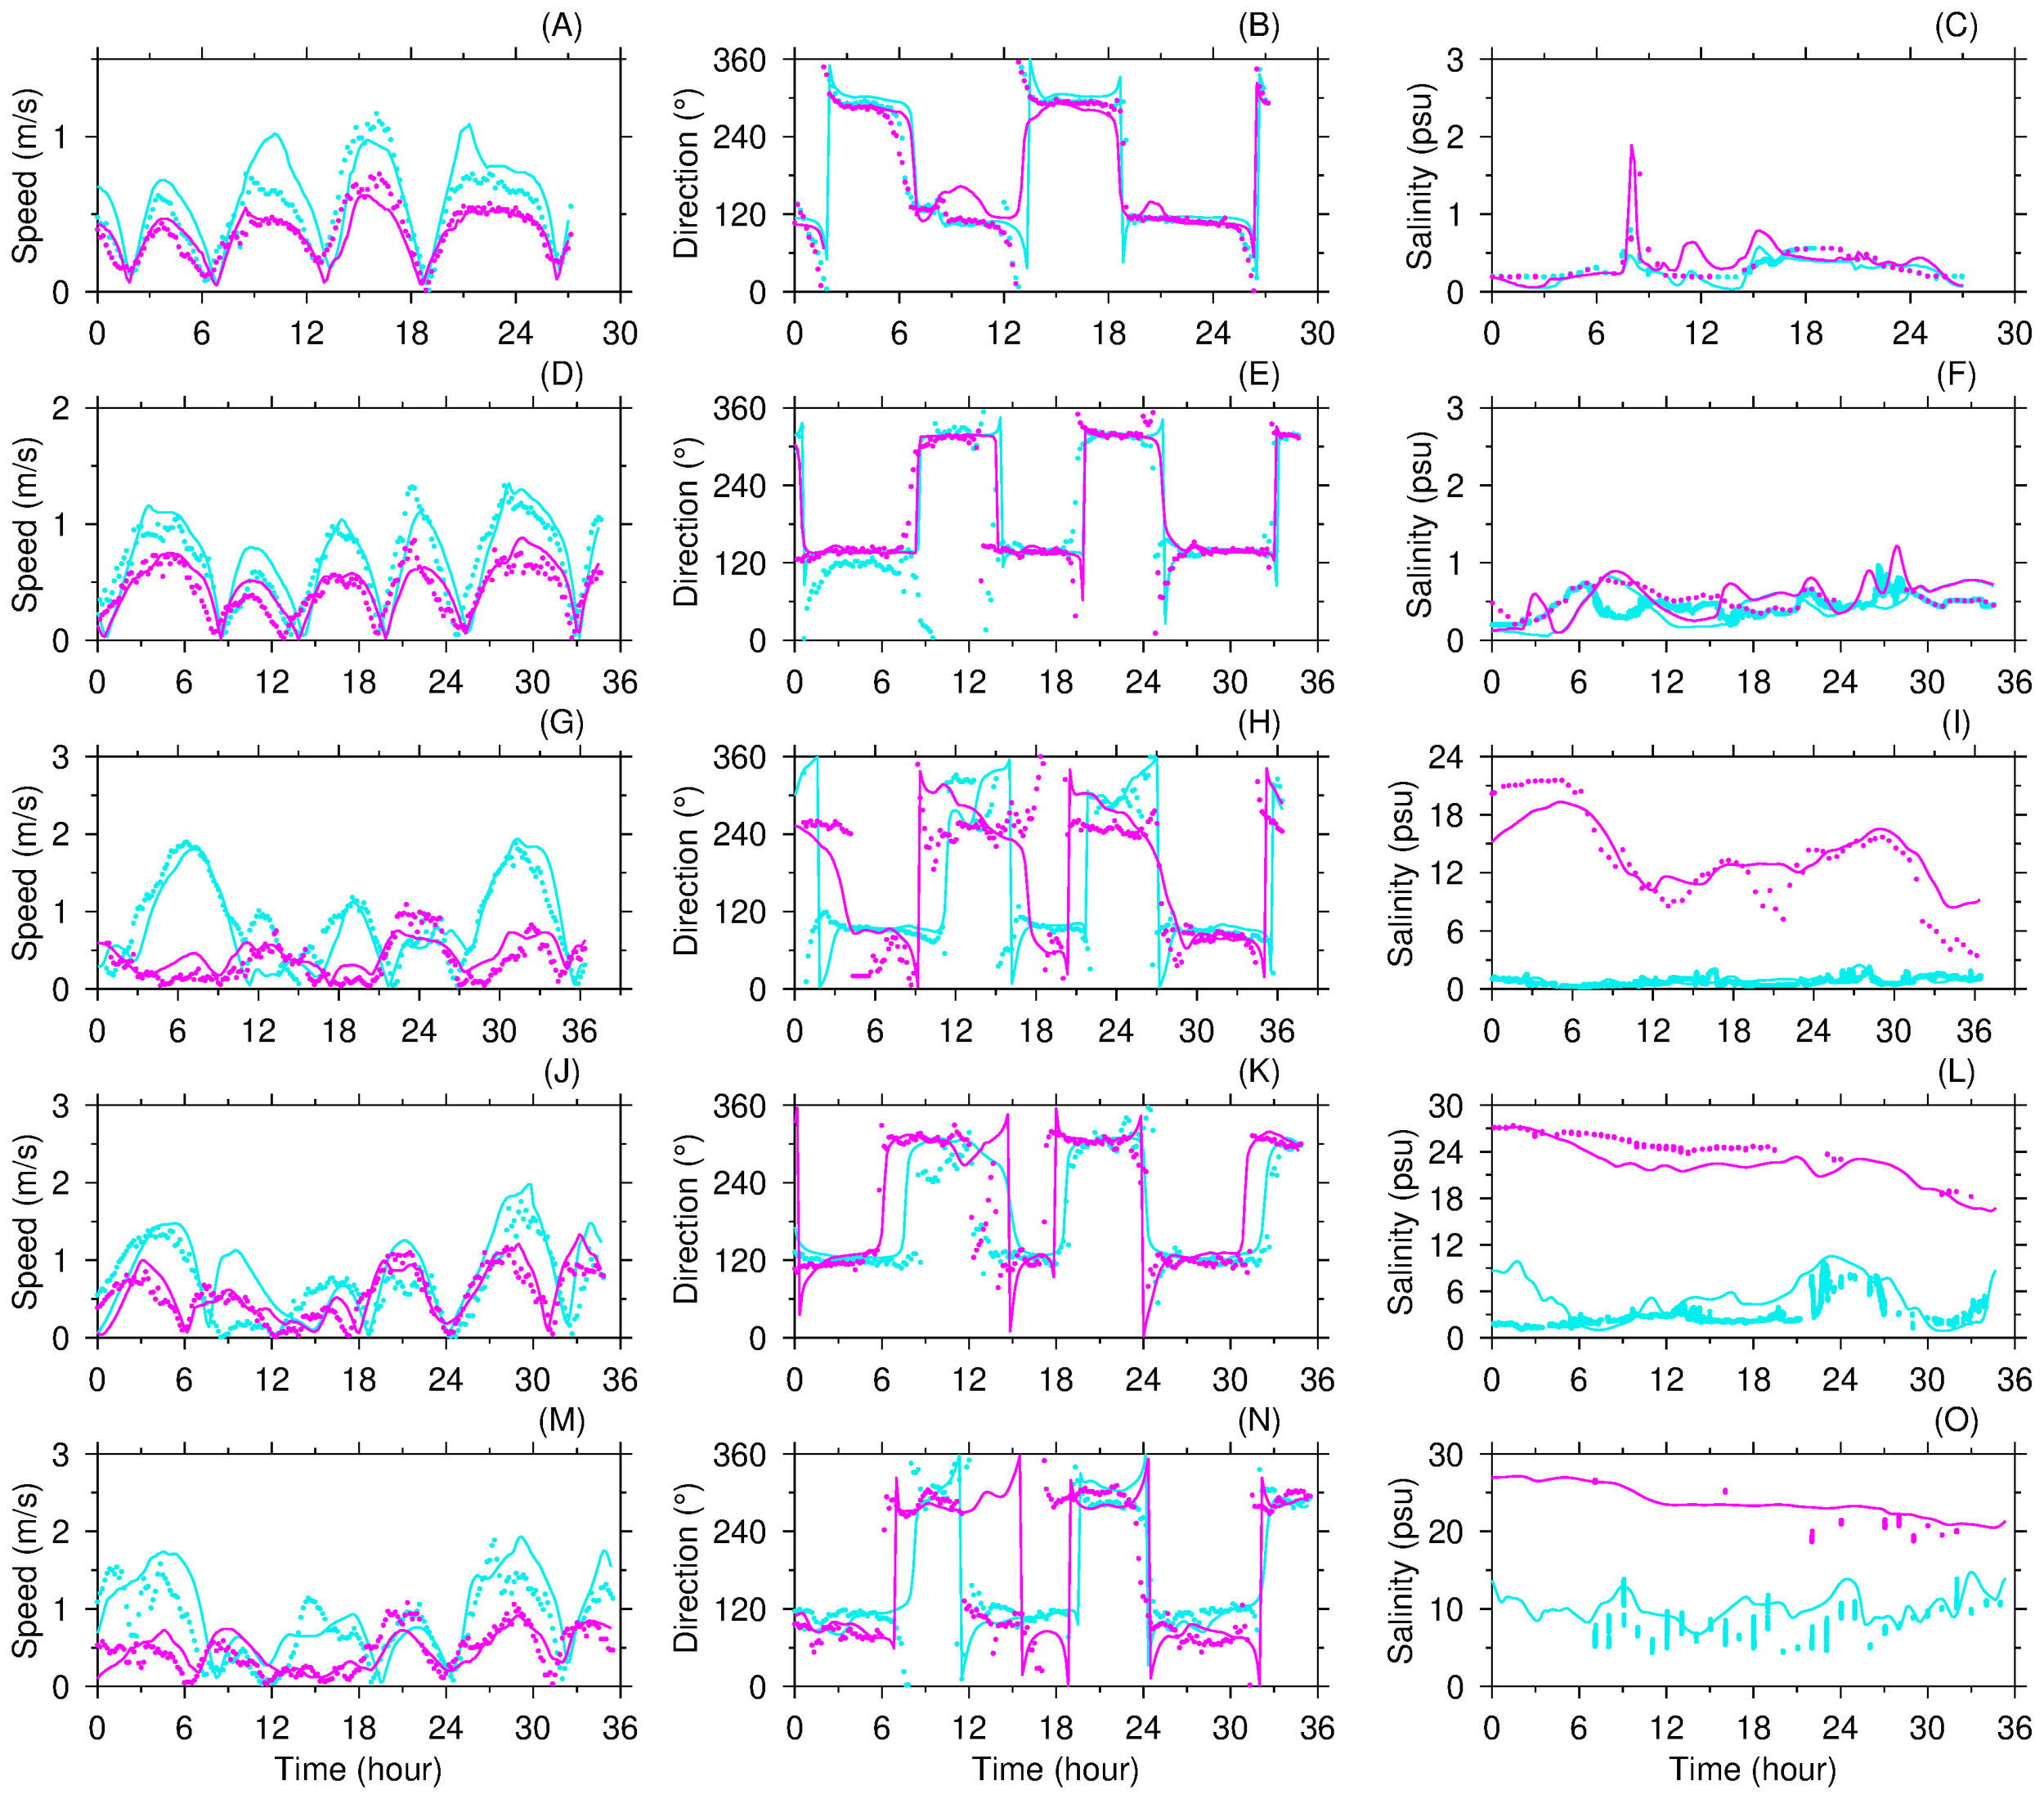
Comparison between the modeled (solid lines) and observed (dashed lines) current speed (left panel), direction (middle panel) and salinity (right panel) in the surface layer (green) and bottom layer (purple) at measurement sites A (A–C), B(D–F), C (G–I), D (J–L) and E(M–O) from September 7 to 8, 2022.
Table 1
| A | B | C | D | E | |
|---|---|---|---|---|---|
| CC | 0.82/0.83 | 0.82/0.78 | 0.87/0.78 | 0.71/0.82 | 0.80/0.70 |
| RMSE (m/s) | 0.18/0.09 | 0.21/0.14 | 0.29/0.19 | 0.40/0.20 | 0.35/0.19 |
| SS | 0.87/0.91 | 0.90/0.87 | 0.92/0.81 | 0.82/0.90 | 0.86/0.83 |
CCs, RMSEs and SSs of the current speed at the measured sites (values in the surface layer/values in the bottom layer).
Table 2
| A | B | C | D | E | |
|---|---|---|---|---|---|
| CC | 0.63/0.69 | 0.68/0.73 | 0.66/0.90 | 0.68/0.89 | 0.61/0.83 |
| RMSE | 0.11/0.26 | 0.23/0.21 | 0.44/2.73 | 3.32/1.92 | 3.17/1.40 |
| SS | 0.66/0.71 | 0.65/0.82 | 0.74/0.88 | 0.78/0.84 | 0.61/0.79 |
CCs, RMSEs and SSs of salinity at measured sites (values in the surface layer/values in the bottom layer).
3 Results
3.1 Observations
In the spring and summer of 2022, affected by climate anomalies caused by the La Niña phenomenon, the Northern Hemisphere experienced unprecedented high temperatures and droughts, with severe drought events accompanying persistent high temperatures in Europe and Asia (Fu et al., 2024; WMO, 2023). The Changjiang basin experienced severe drought events, which was the most serious meteorological and hydrological drought since 1961 when complete records were available (Duan et al., 2024; Feng et al., 2024; Lyu et al., 2023). The water levels of the main stream and major tributaries of the Changjiang River continued to decline, resulting in extremely low river discharge persisting from August to December (Figure 4a). The Datong Hydrometric Station is located in the lower reaches of the Changjiang River, 620 km from the Changjiang Estuary. Its measured data can reflect the changes in the river discharge of the Changjiang River into the sea. The river discharge began to decline in July, but it was still higher than the monthly mean from 1950 to 2022. After that, it continued to decline, and in August, it began to break the lowest value since historical records. In December, it increased slightly, but still lower than the monthly mean from 1950 to 2022.
Figure 4
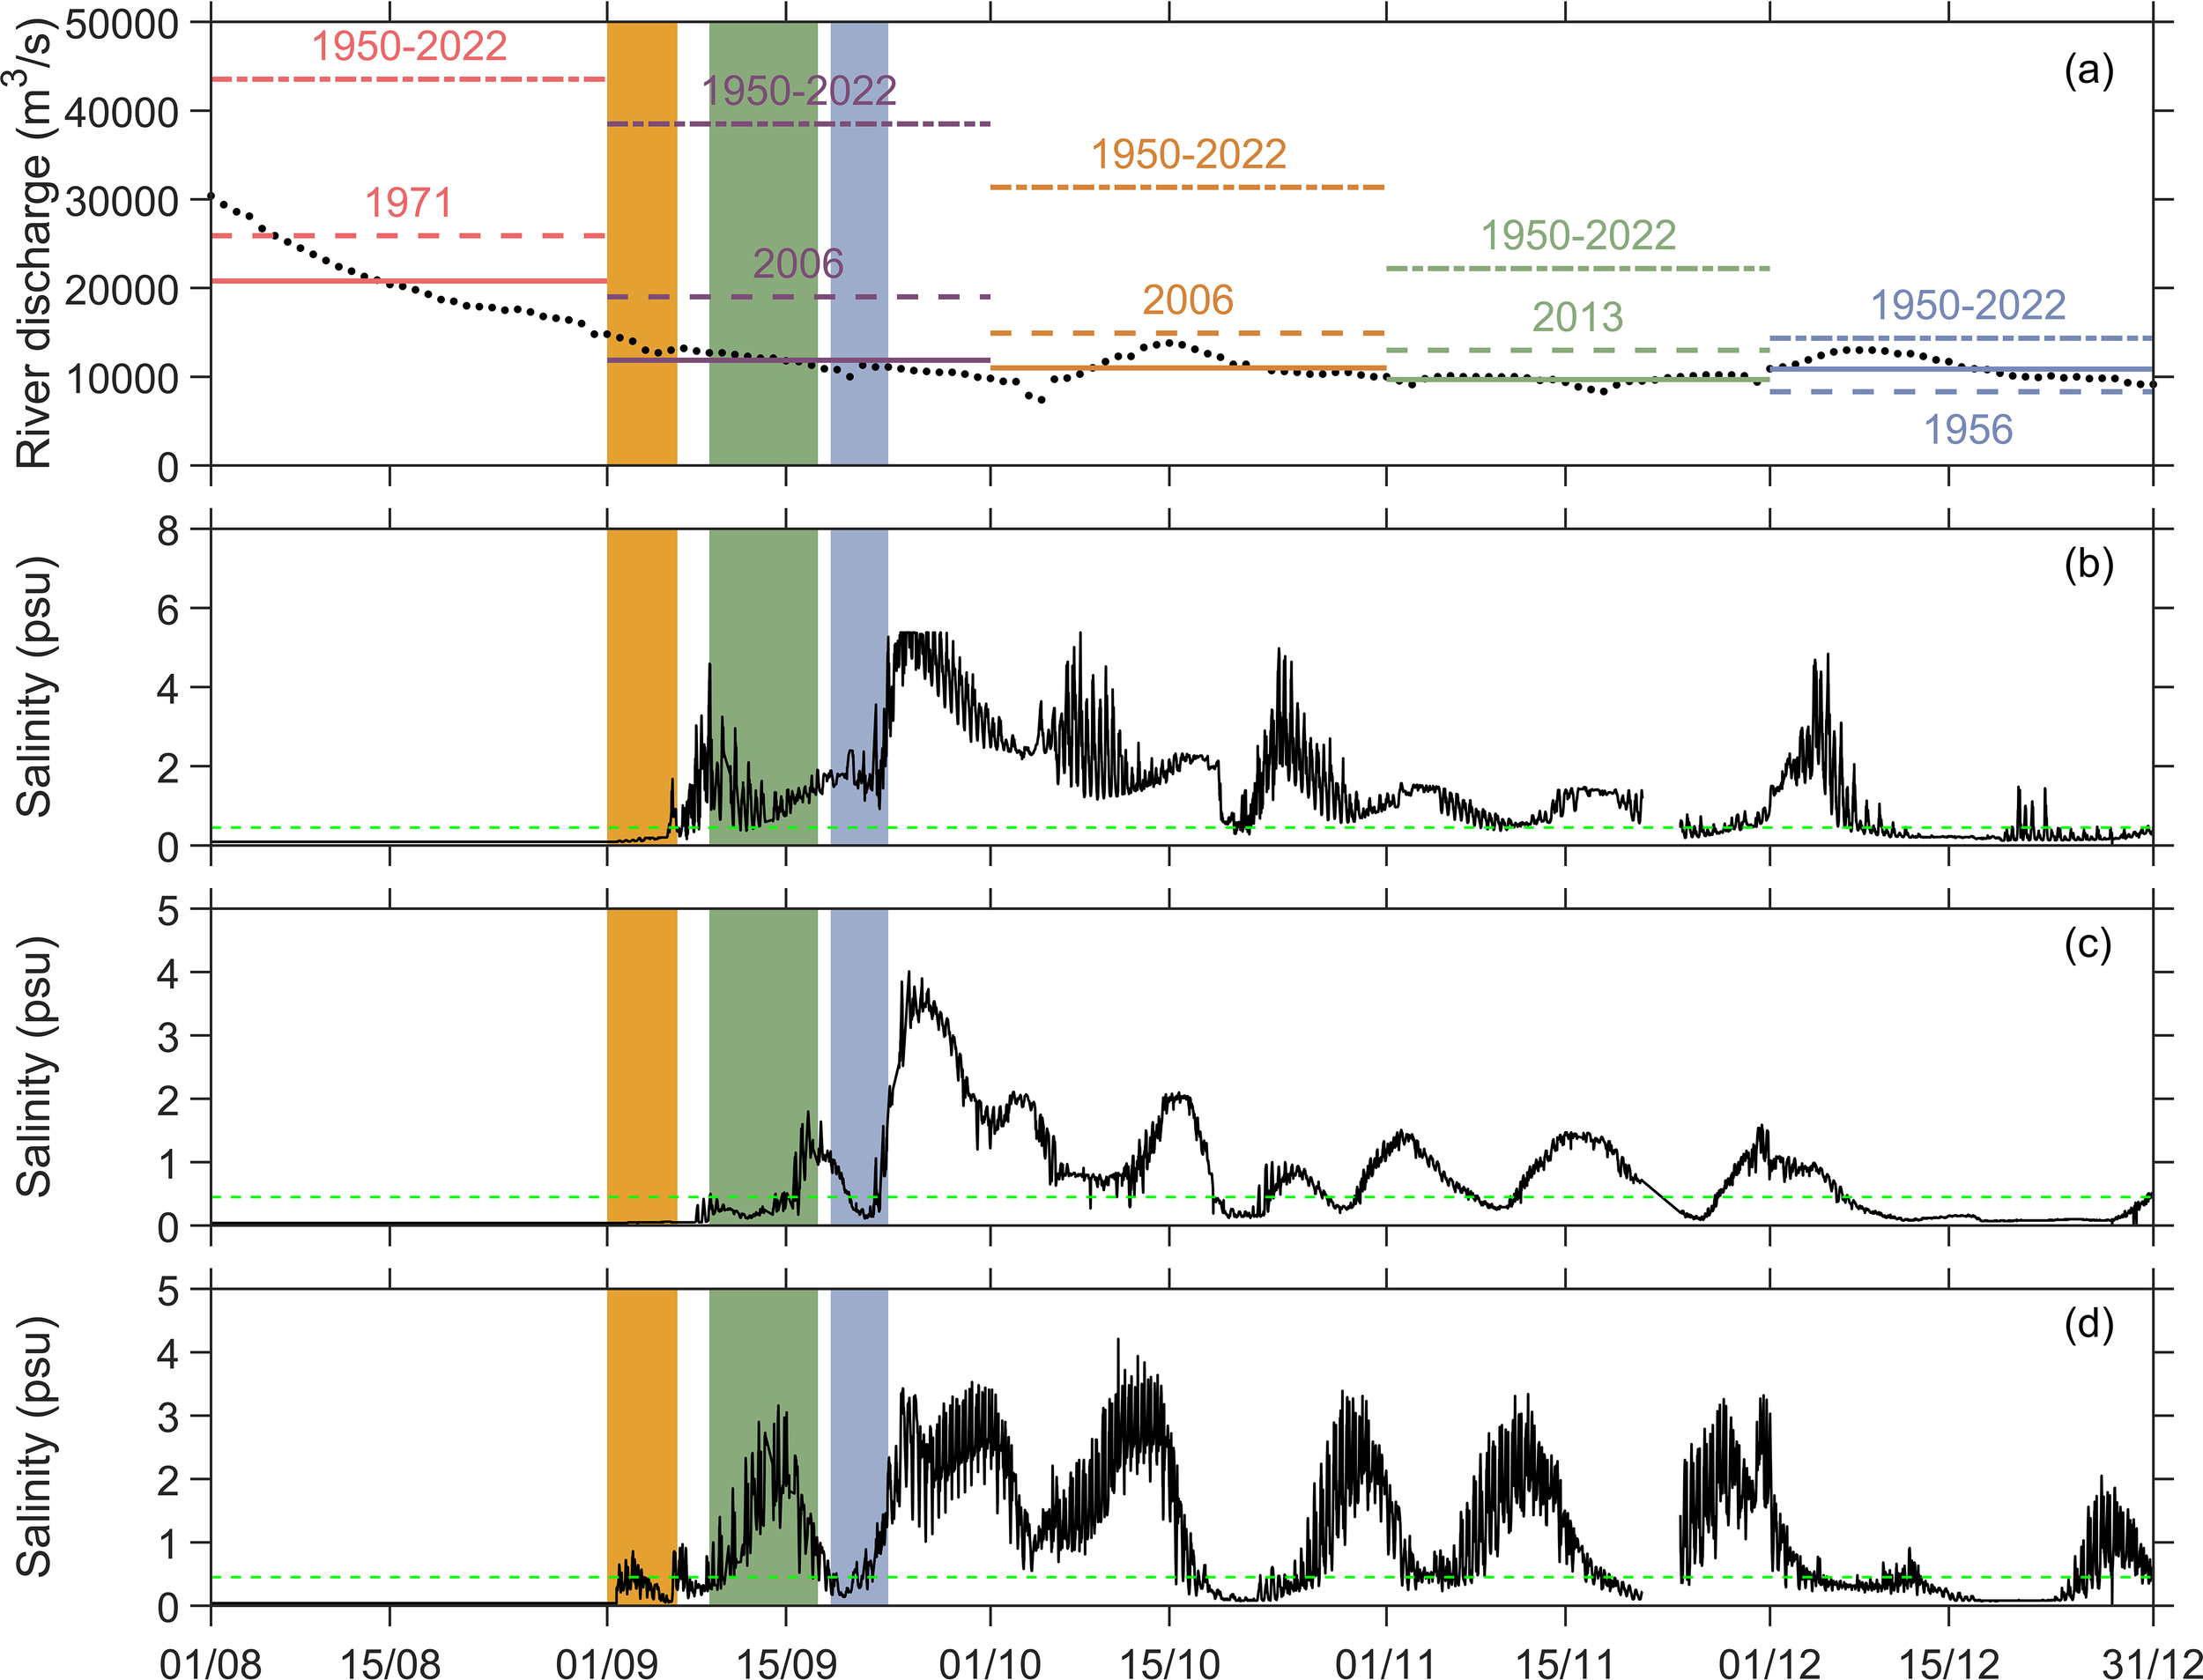
(a) Temporal variation in the measured river discharge at the Datong hydrological station from August to December. Black dots: daily average river discharge from August 1 to December 31, 2022; solid lines: monthly mean river discharge in 2022; chain lines: monthly mean river discharge from 1950 to 2022; dashed lines: the historical lowest monthly mean river discharge in the year. (b-d) Temporal variations in surface salinity at the water intakes of the Qingcaosha Reservoir (b), Chenhang Reservoir (c) and Dongfengxisha Reservoir (d) from August 1 to December 31, 2022. The dashed green line represents a salinity of 0.45, which is the standard for drinking water. Bronze belts: impact period of typhoon Hinnamonr; green belts: impact period of typhoon Muifa; blue belts: impact period of typhoon Nanmadol.
On September 1-6, 8-16, and 17–21 in 2022, the Changjiang Estuary was affected by typhoons Hinnamonr, Muifa, and Nanmadol, respectively (Figures 5A-C). Typhoon Muifa made landfall in Hangzhou Bay and crossed the estuary. Typhoon Hinnamonr northward move in the middle of the East China Sea, and Typhoon Nanmadol made landfall in Kyushu, Japan that was far away from the estuary. The maximum wind speeds measured at the weather station on the Chongming eastern shoal (labeled in Figure 1) during the three typhoons were 19.5, 26.7 and 14.6 m/s, respectively (Figure 5D). During typhoons Hinnamonr and Nanmadol, the Changjiang Estuary was influenced by strong northerly winds. While there was a strong northeast wind before the center of Typhoon Muifa crossed the estuary, and a strong southerly wind after it crossed the estuary (Figure 5E).
Figure 5
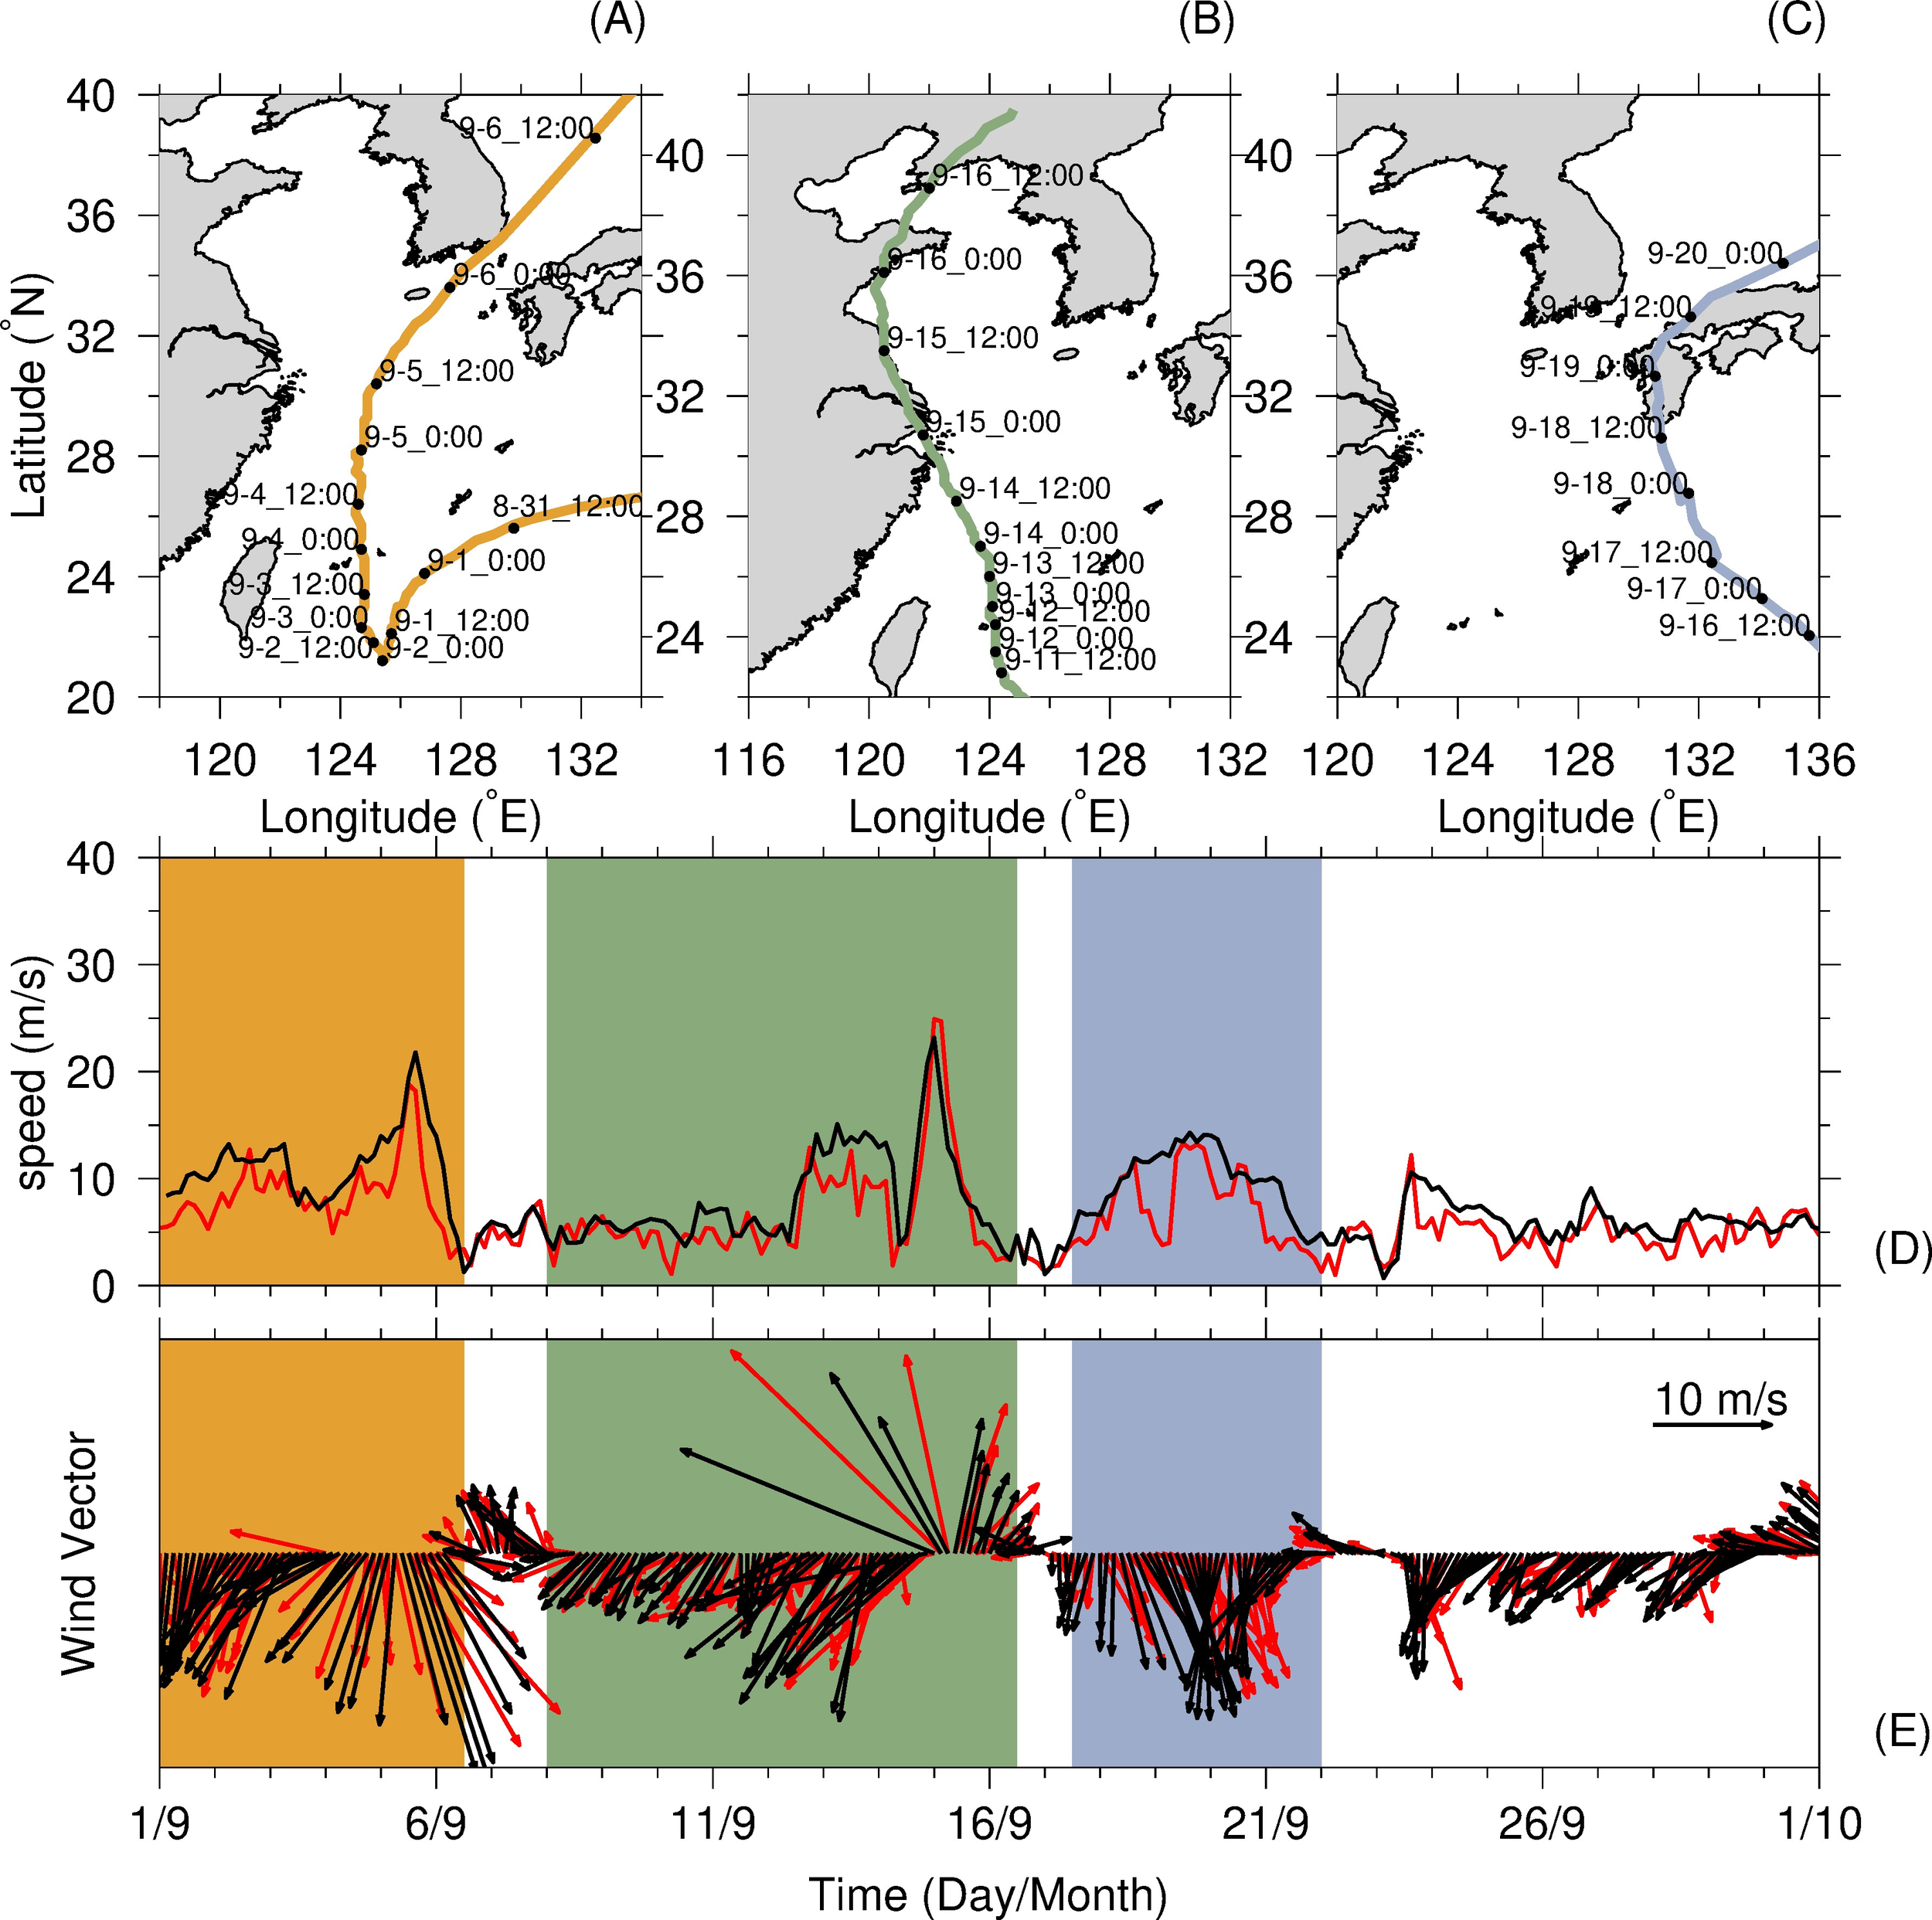
Tracks of Typhoons Hinnamonr (A), Muifa (B) and Nanmadol (C). Temporal variations in observed (red) and Weather Research and Forecasting (WRF)-modeled (black) wind speeds (D) and wind vectors (E) at the weather station on the eastern Chongming shoal. Dots represent the typhoon centers at the time labeled. The bronze, green and blue belts are the influence periods of typhoons Hinnamonr, Muifa and Nanmadol on the Changjiang Estuary, respectively.
The measured surface salinity variation in the three reservoir intakes from September 1 to December 31, 2022 is shown in Figures 4b-d. At the water intake of the Qingcaosha Reservoir, the salinity began to increase at 20:00 on September 5. Until 19:00 on December 12, the salinity was greater than the drinking water salinity standard of 0.45 (Standards for drinking water quality, GB5749-2006) in most of the time. The total duration of the unsuitable water intake time reached 98 days. The unsuitable water intake time in the Chenhang and Dongfengxisha Reservoirs reached 68.1 and 85.7 days, respectively. Despite the intermittent time of water availability, the limited effective capacities of the Chenhang Reservoir and Dongfengxisha Reservoir, at only 8.6×10⁶ and 8.9×10⁶ m3, fall short of fulfilling the water supply demands. The saltwater intrusion extremes posed a serious threat to Shanghai’s water supply safety, resulting in the water source was forced to transfer from the Changjiang Estuary to the reserved backup water source in the Huangpu River.
On September 7-8, 2022, we conducted quasi-synchronous field observations at five anchored boat measurement sites A-E in the South Branch and North Channel (Figure 1). Each ship was equipped with acoustic Doppler current profiler (ADCP) and compass to collect current velocity and direction every 2 minute on the water depths. The winch was equipped with conductivity-temperature-depth (CTD) to collect salinity every half hour. At site A, the maximum salinity of 1.56 occurred during the ebb tide in the bottom layer (Figure 6B), indicating that the saltwater originated upstream, which is also called saltwater spillover from the North Branch due to its funnel shape and low river discharge (Wu et al., 2006; Yang et al., 2023). Form site B to site E, the maximum salinity reached 3.87, 21.54, 27.39 and 26.61, respectively, which was significantly much higher than that of approximately 0 in normal flood seasons (Figure 6). They all occurred at the flood slacks in the bottom layer, meaning that source of saltwater intrusion was from downstream, i.e., the North Channel. Additionally, there was great asymmetry in the duration of the flood and ebb currents between the surface and bottom layers, with the duration of the flood current at the bottom being much longer than that at the surface, indicating the importance of the landward baroclinic pressure gradient force for the extremely severe saltwater intrusion.
Figure 6
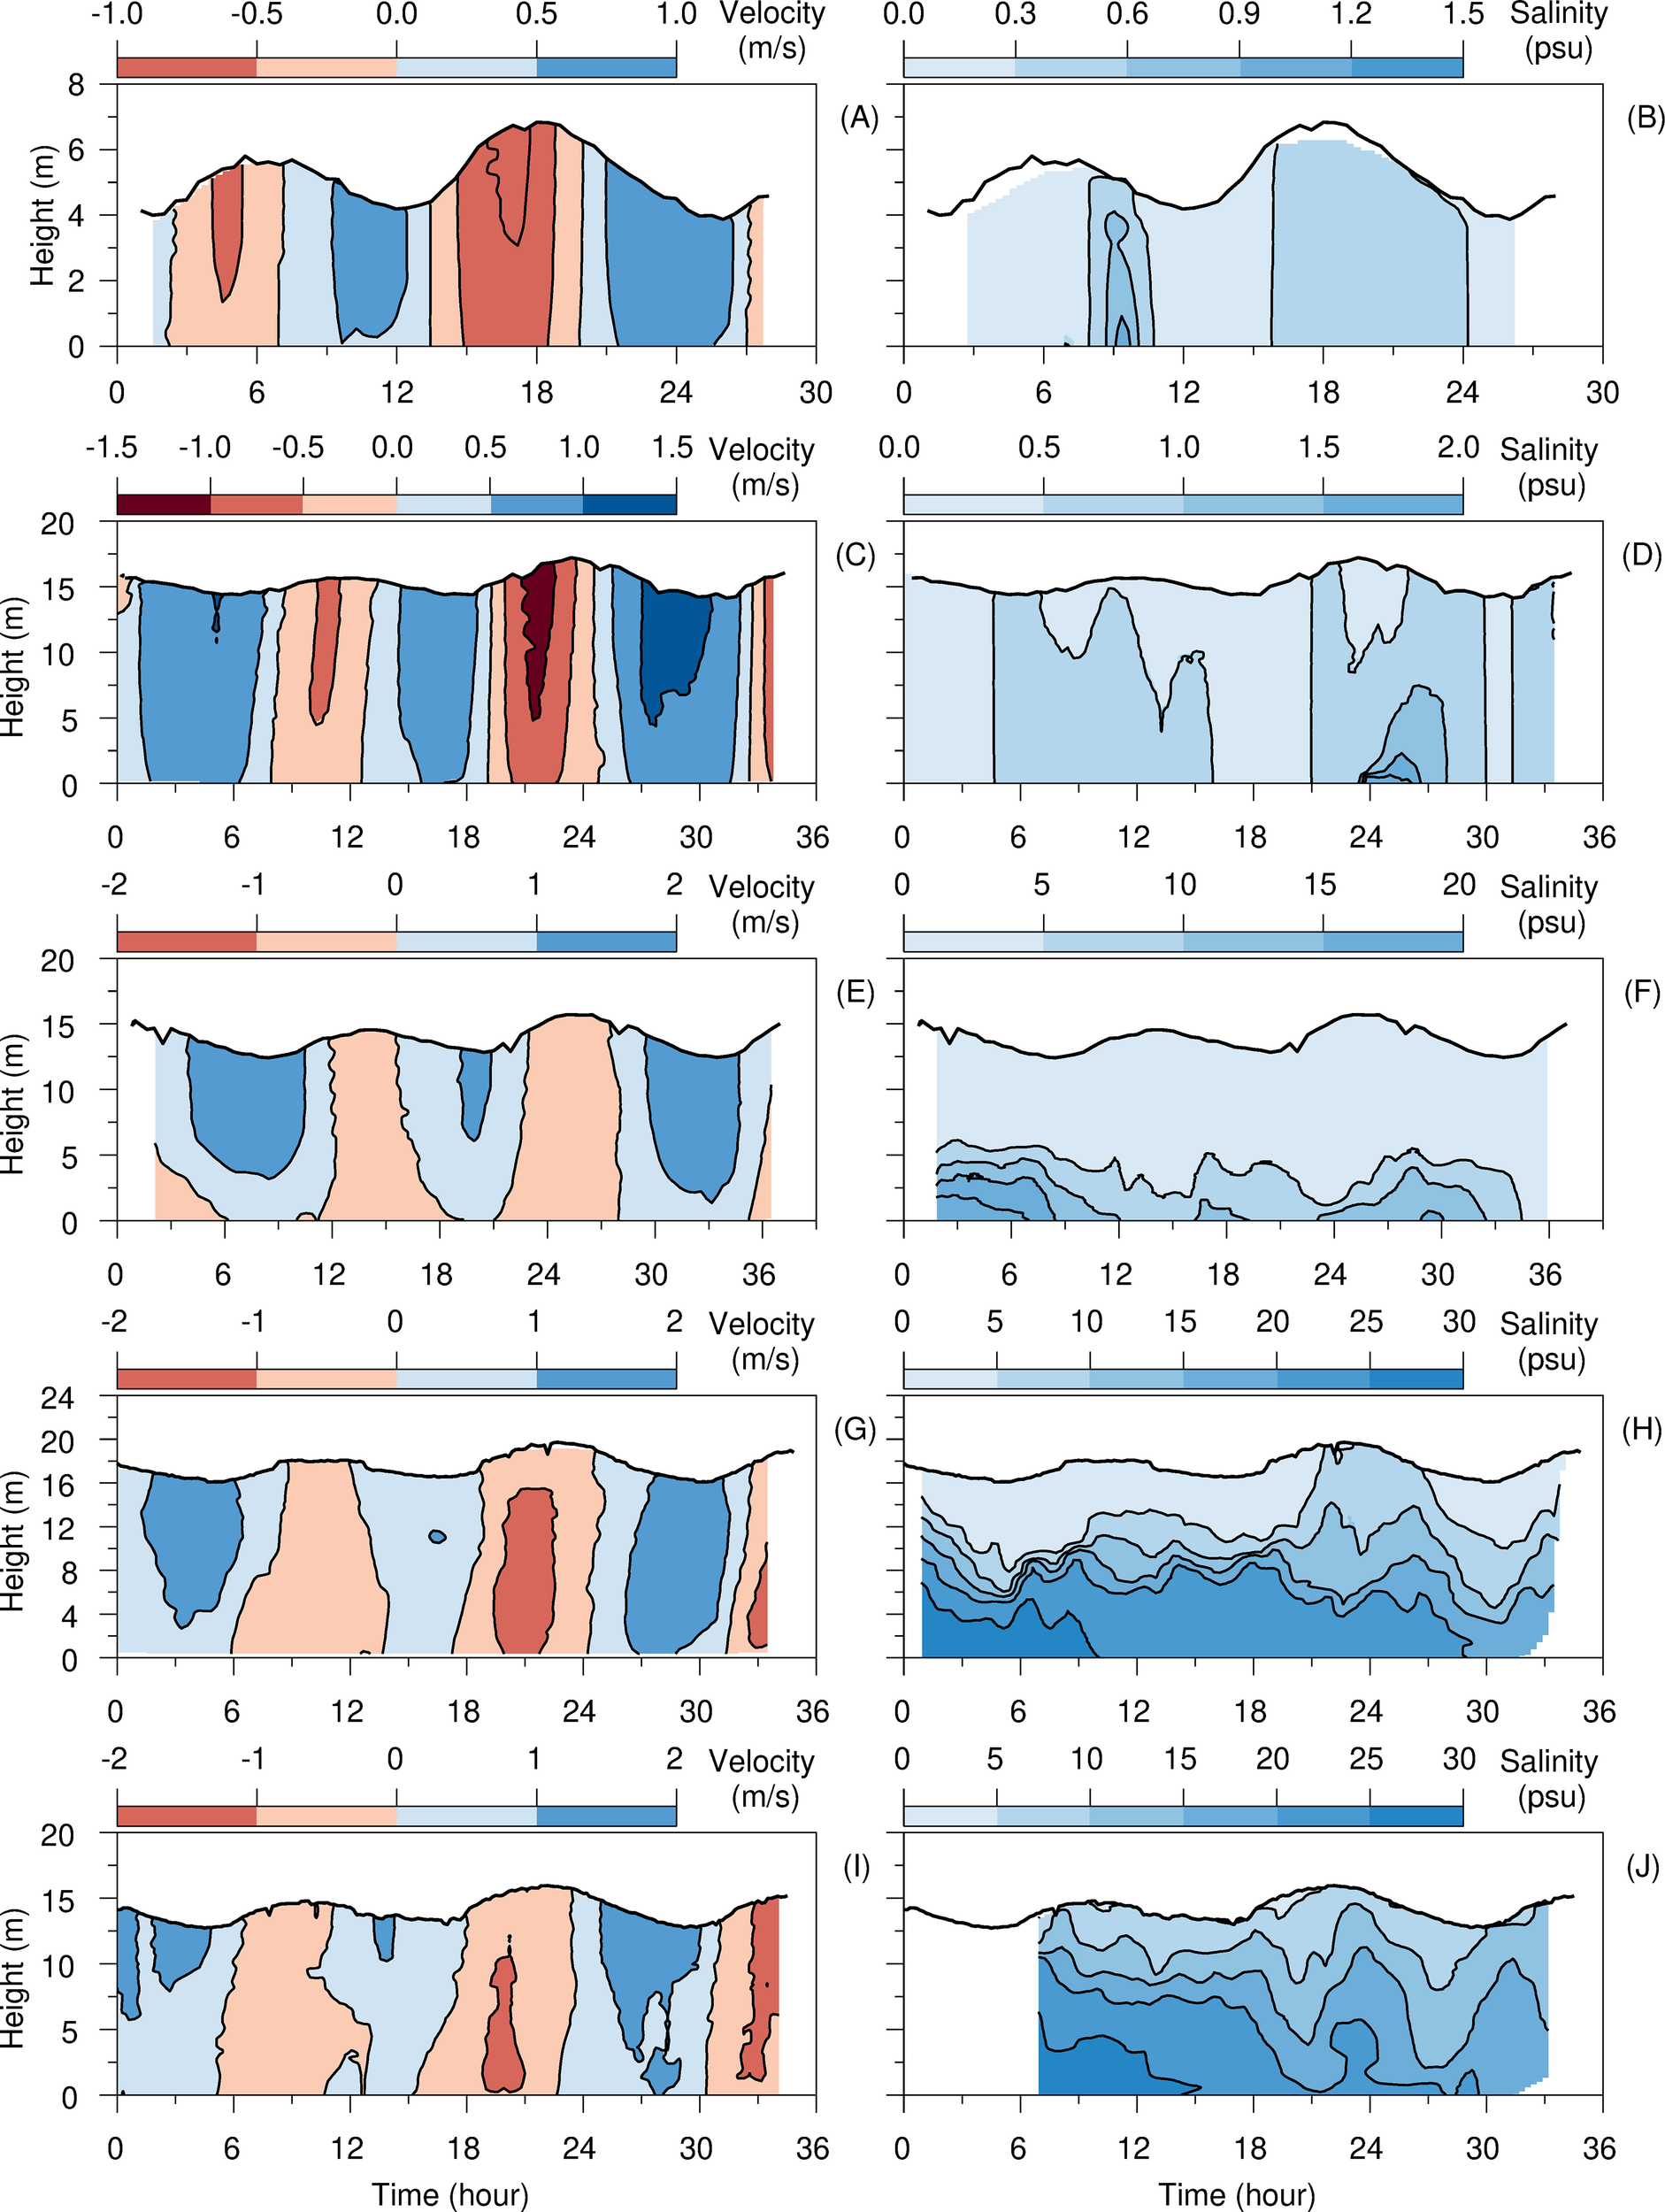
Temporal variations in the observed current (left panel) and salinity (right panel) profiles at measurement sites A (A, B), B (C, D), C (E, F), D (G, H) and E (I, J) from September 7 to 8, 2022. The flow velocity during ebb tide is positive, while during flood tide it is negative.
Researchers have found that estuarine saltwater intrusion is mainly determined by river discharge and tides (Geyer, 1993; Prandle, 1985; Simpson et al., 1990; Zhu et al., 2021), as well as by winds, which are conducive to transporting water landward through Ekman transport (Aristizábal and Chant, 2015; Geyer, 1997; Li et al., 2022, Li et al., 2012; Scully et al., 2005; Zhu et al., 2020). The abovementioned observational data indicated that the river discharge of the Changjiang River in late summer and autumn of 2022 was extremely low during the five months, and the Changjiang Estuary was affected by three typhoons in September. The saltwater intrusion extremes in the Changjiang Estuary was related to long-term low river discharge and the impact of typhoons, but its dynamic process and cause is still unclear and needs to be revealed.
3.2 Numerical simulation results
In late summer and autumn of 2022, the duration of saltwater intrusion extremes was long, in which September was the beginning and most severe month. Therefore, we focus on the process and mechanism of saltwater intrusion extremes in September. Figure 7 presents the temporal variation in the simulated surface and bottom salinity distributions along longitudinal sec. 1 (labeled in Figure 1) in September 2022. Influenced by the saltwater spilling over from the North Branch, the upper reaches of the South Branch was affected by saltwater intrusion throughout September. During the impact of Typhoon Hinnamonr and Nanmadol (between September 5 to 7 and 18 to 21), the saltwater distinctly moved upstream and reached the middle reaches of the South Branch, where it met the saltwater spilling over from the North Branch, resulting in no freshwater along the longitudinal section. Furthermore, during the neap tide, the reduced tidal forces conspired to create pronounced salinity stratification, resulting in a significant salinity difference of over 20 between the surface and bottom layers. Differently, despite Typhoon Muifa’s direct landfall in Hangzhou Bay and pass over the Changjiang Estuary, the manifestation of saltwater intrusion varied significantly. Between September 13 and 16, affected by Typhoon Muifa and the astronomical spring tide, the saltwater spilling over from the Northern Branch intensified, and the salinity on the upper reaches of the South Branch increased. The saltwater in the North Channel showed an upstream trend, but the landward intrusion distance was relatively short, and it quickly moved downstream after Typhoon Muifa.
Figure 7
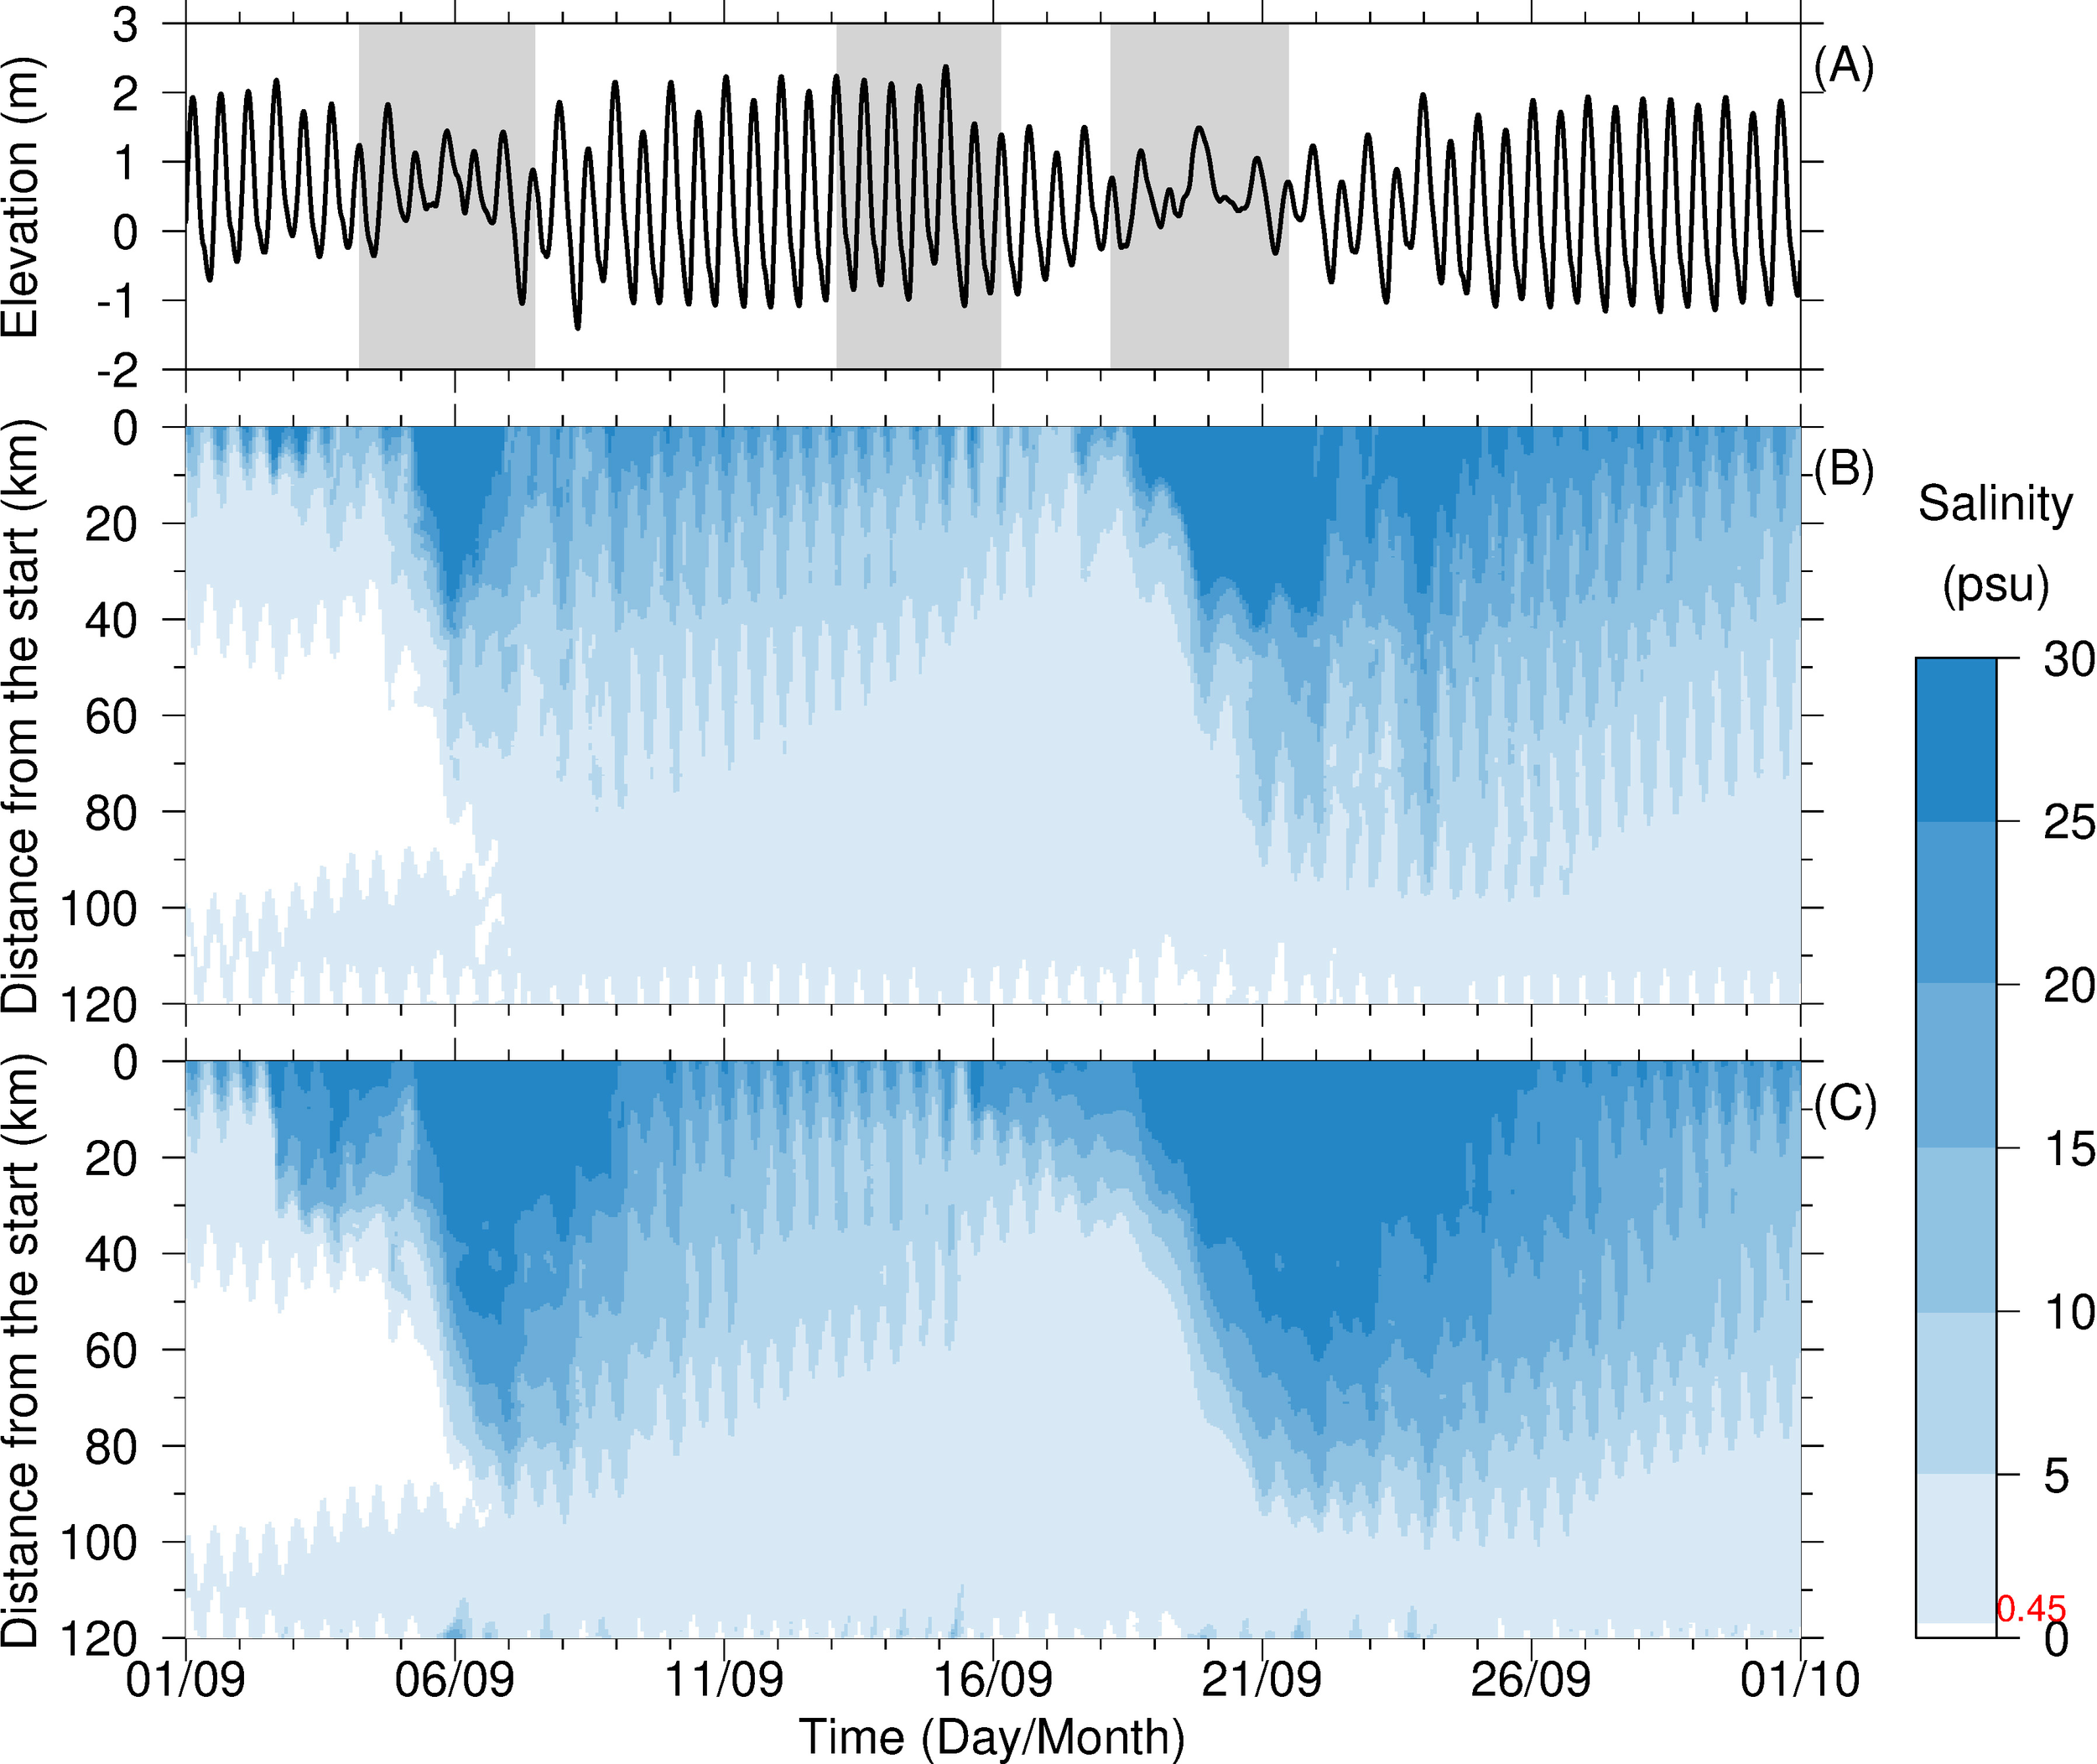
Temporal variations in simulated elevation at the Baozhen hydrological station (A), surface (B) and bottom (C) salinity distributions along longitudinal sec. 1 in September 2022. The gray belts in subfigure a are the tidally averaged periods for the net unit width water and salt flux during the influences of the typhoons.
The distribution of salinity reveals that during the impact of Typhoon Hinnamonr and Nanmadol, the North Channel was dominated by high-salinity water, which extended upstream into the lower reaches of the South Branch (Figure 8A, I; Figure 9A, I). The saltwater intrusion on the north side was stronger than that on the south side of the South Branch, which was mainly from the North Channel; and it was distinctly stronger in the North Channel than in the South Channel. At 4:00 on September 15 during Typhoon Muifa, the saltwater intrusion weakened, the saltwater moved seaward. Given that Typhoon Muifa influenced the estuary during the spring tide, the diluted water expanded northward on the east side of Chongming Island due to tide-induced Stokes drift (Qiu and Zhu, 2015; Wu et al., 2014). The North Branch consistently experienced the most severe saltwater intrusion, attributed to its low net water diversion ratio. During September, with a net water diversion ratio of -1.74%, there was a pronounced instance of water flux reversing its natural transport direction towards the North Branch. The saltwater intrusion length, defined as the distance from the farthest position of the isohaline 2 to the starting point of the section, along longitudinal sec. 1 was 94.54, 71.65 and 111.48 km in the surface layer (Figures 8A, E, I), was 97.93, 71.81 and 111.82 km at the bottom layer during the influences of Typhoon Hinnamonr, Muifa, and Nanmadol (Figures 10A, E, I), and was greater than that in the surface layer by 3.39, 0.16 and 0.34 km. The time of no fresh water (salinity greater than 0.45) in Qingcaosha, Chenhang and Dongfengxisha Reservoir in September was 24.76, 15.76, 22.64 days in surface layer (Figures 9A, C, E) and 25.35, 16.42, 24.78 days in bottom layer (Figures 9B, D, F), respectively.
Figure 8
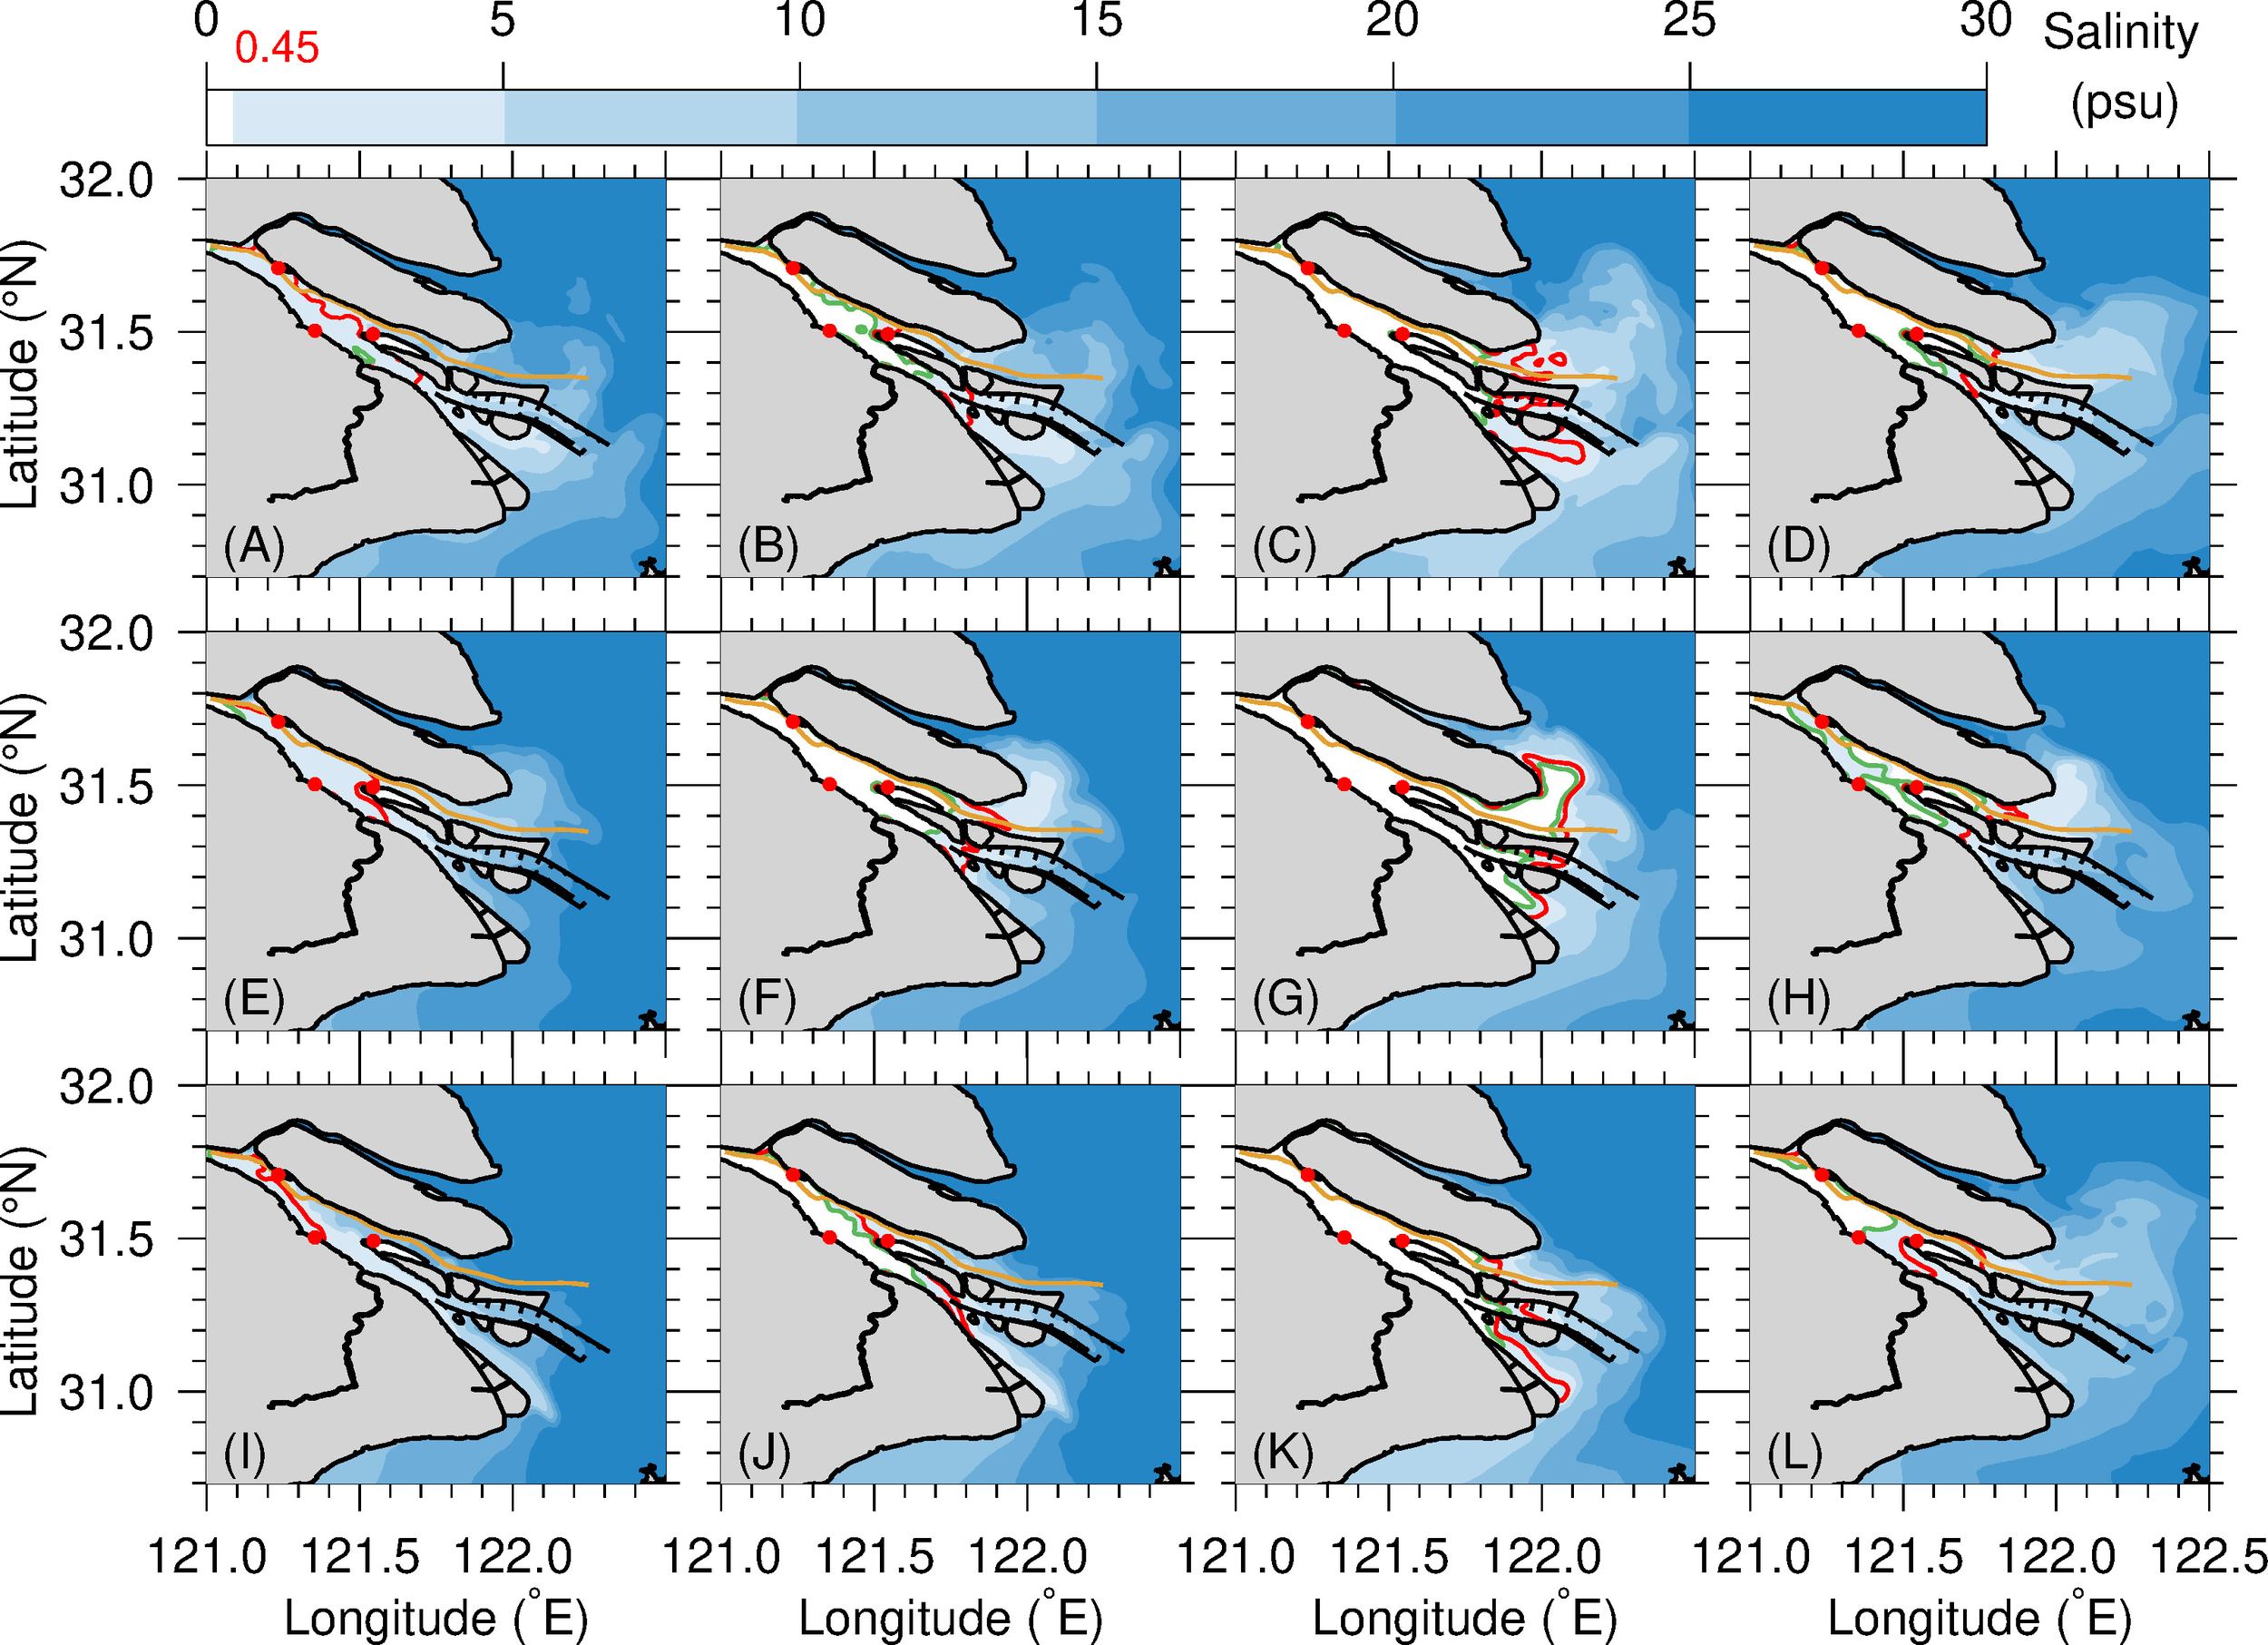
Salinity distribution in the surface layers at 1:00 on September 8 during Typhoon Hinnamonr (A-D), at 4:00 on September 15 during Typhoon Muifa (E-H), and at 2:00 on September 24, 2022 during Typhoon Nanmadol (I-L) under real circumstances (A, E, I), half of the monthly mean river discharge (B, F, J), monthly mean river discharge (C, G, K) and climate wind conditions without typhoons (D, H, L). Bronze lines: sec. 1; green lines: 0.45 isohaline; red line: 2 isohaline.
Figure 9
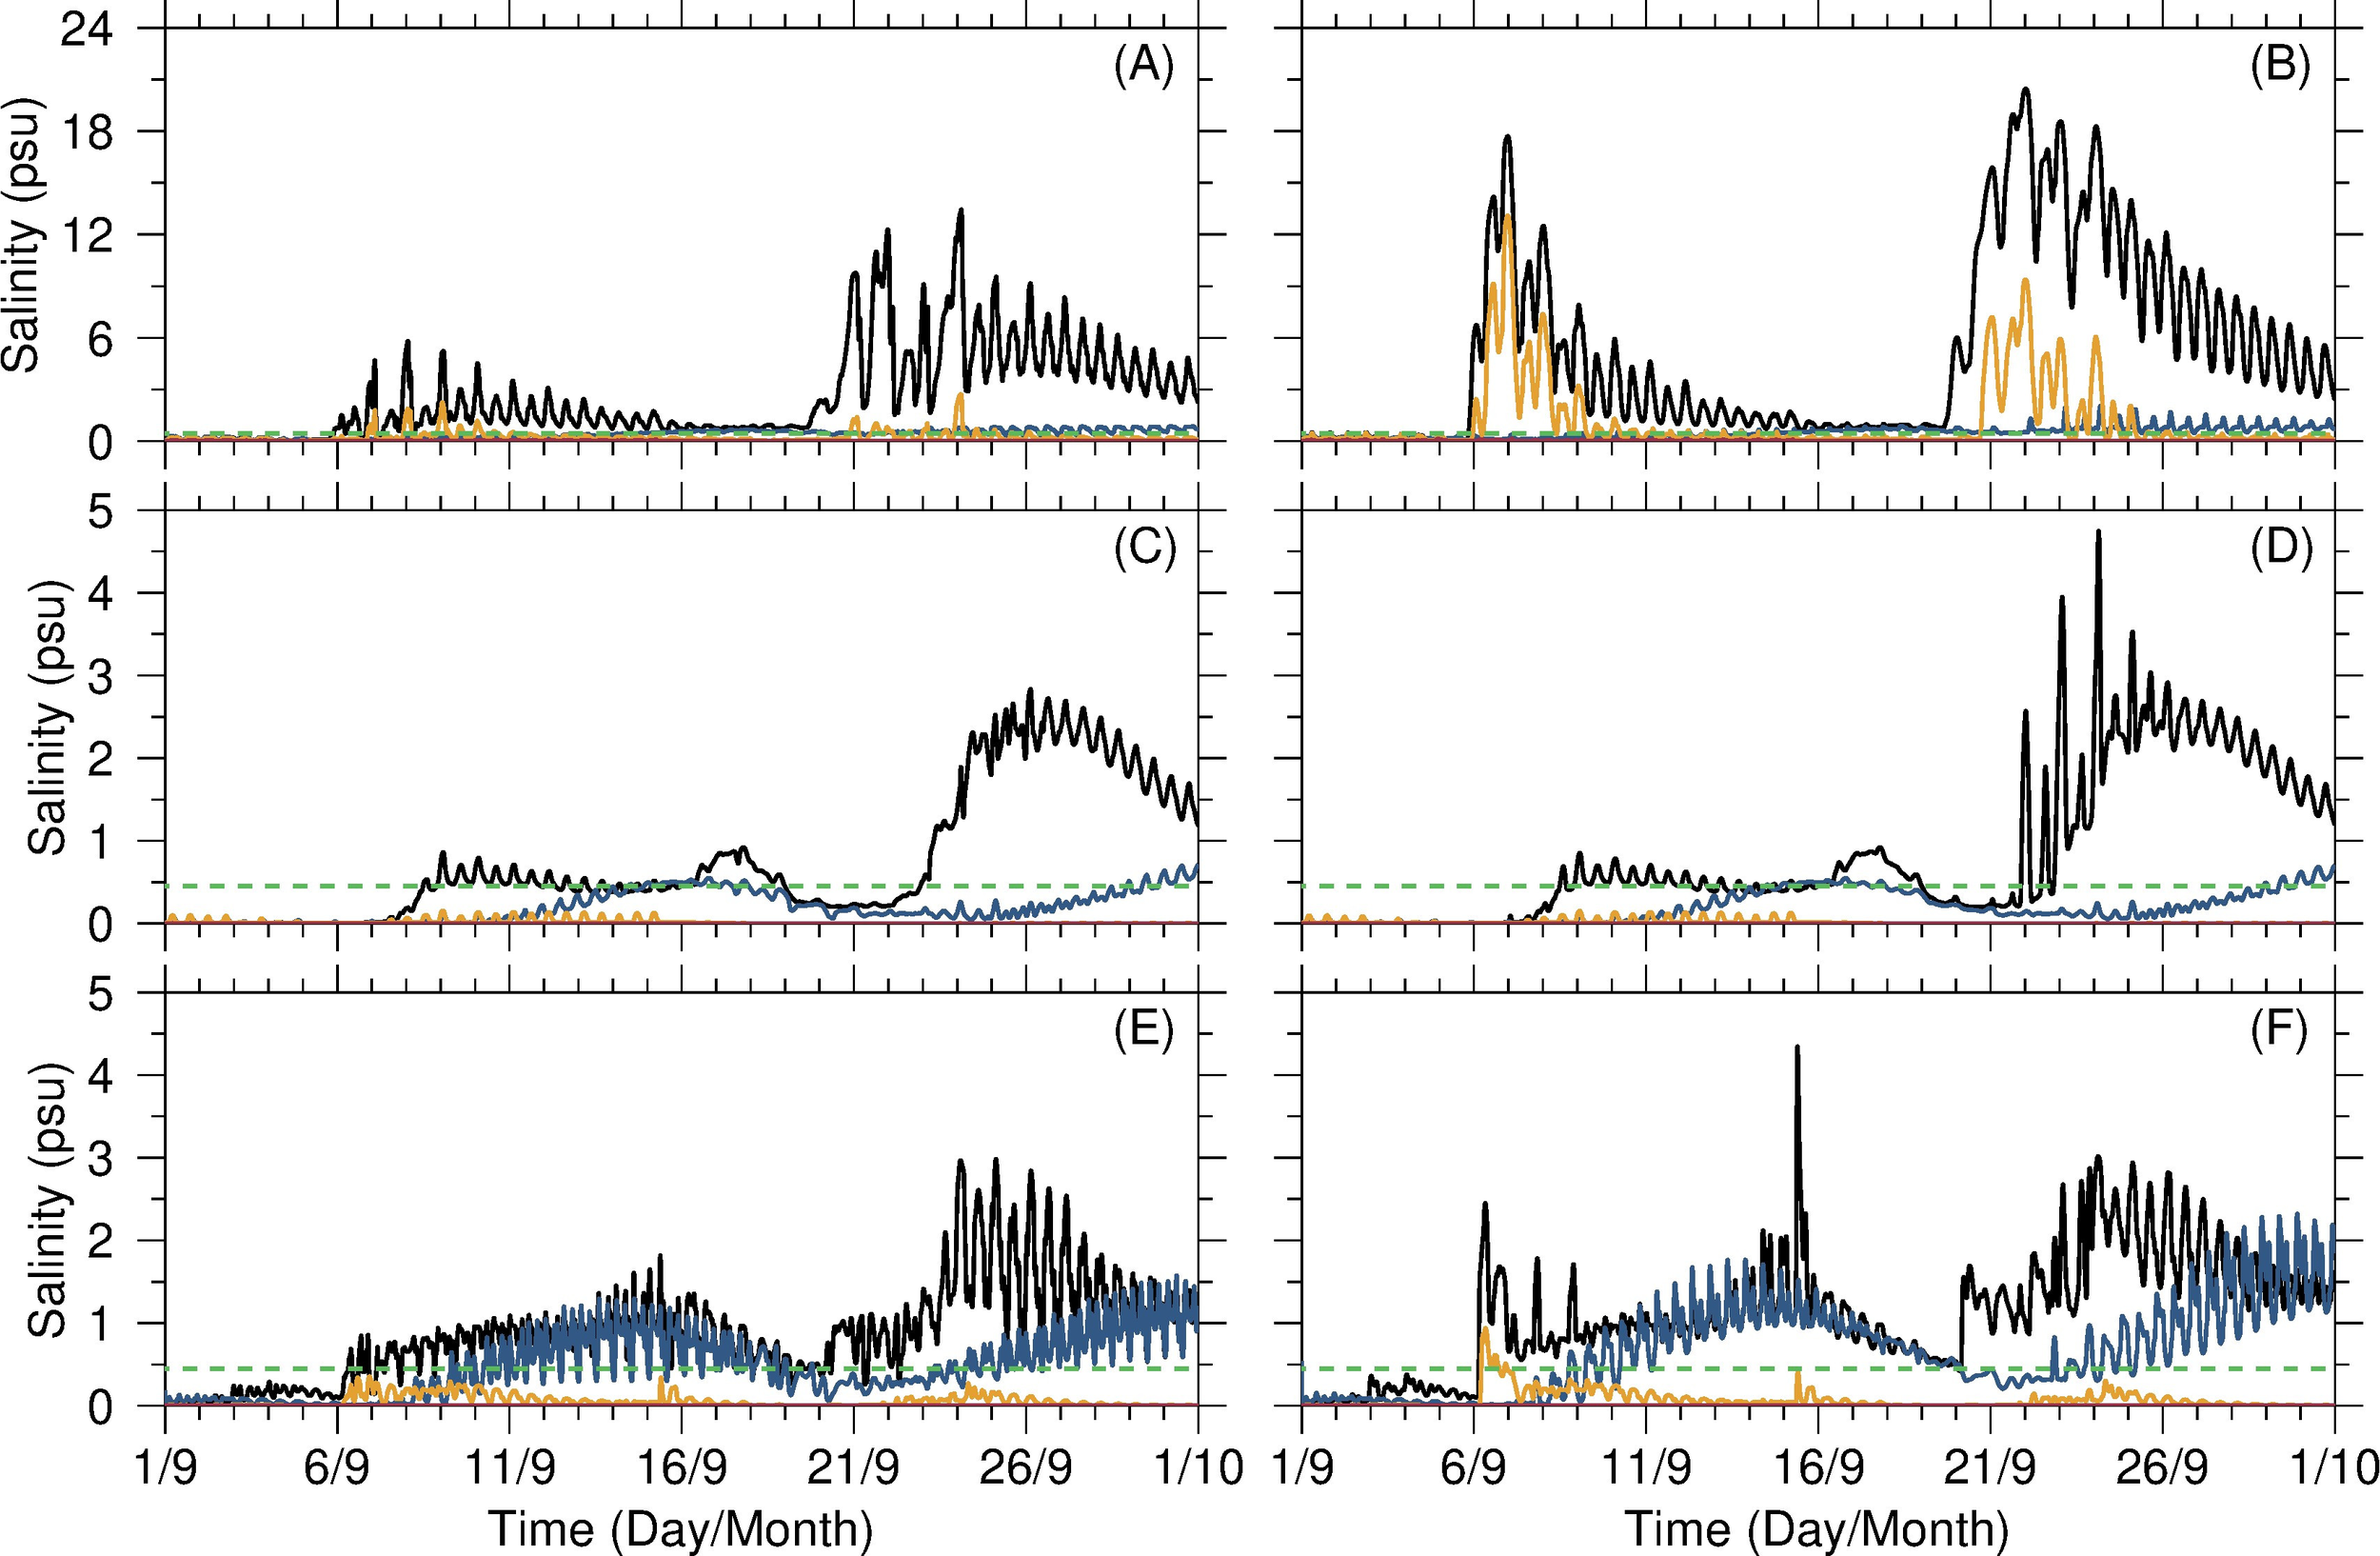
Temporal salinity variations in the surface (left) and bottom (right) layer at the water intakes of the Qingcaosha Reservoir (A, B), Chenhang Reservoir (C, D) and Dongfengxisha Reservoir (E, F). Black lines: real river discharge and typhoons; bronze lines: half of the monthly mean river discharge and typhoons; blue lines: real river discharge and no typhoons; green dash lines: salinity of 0.45.
Figure 10
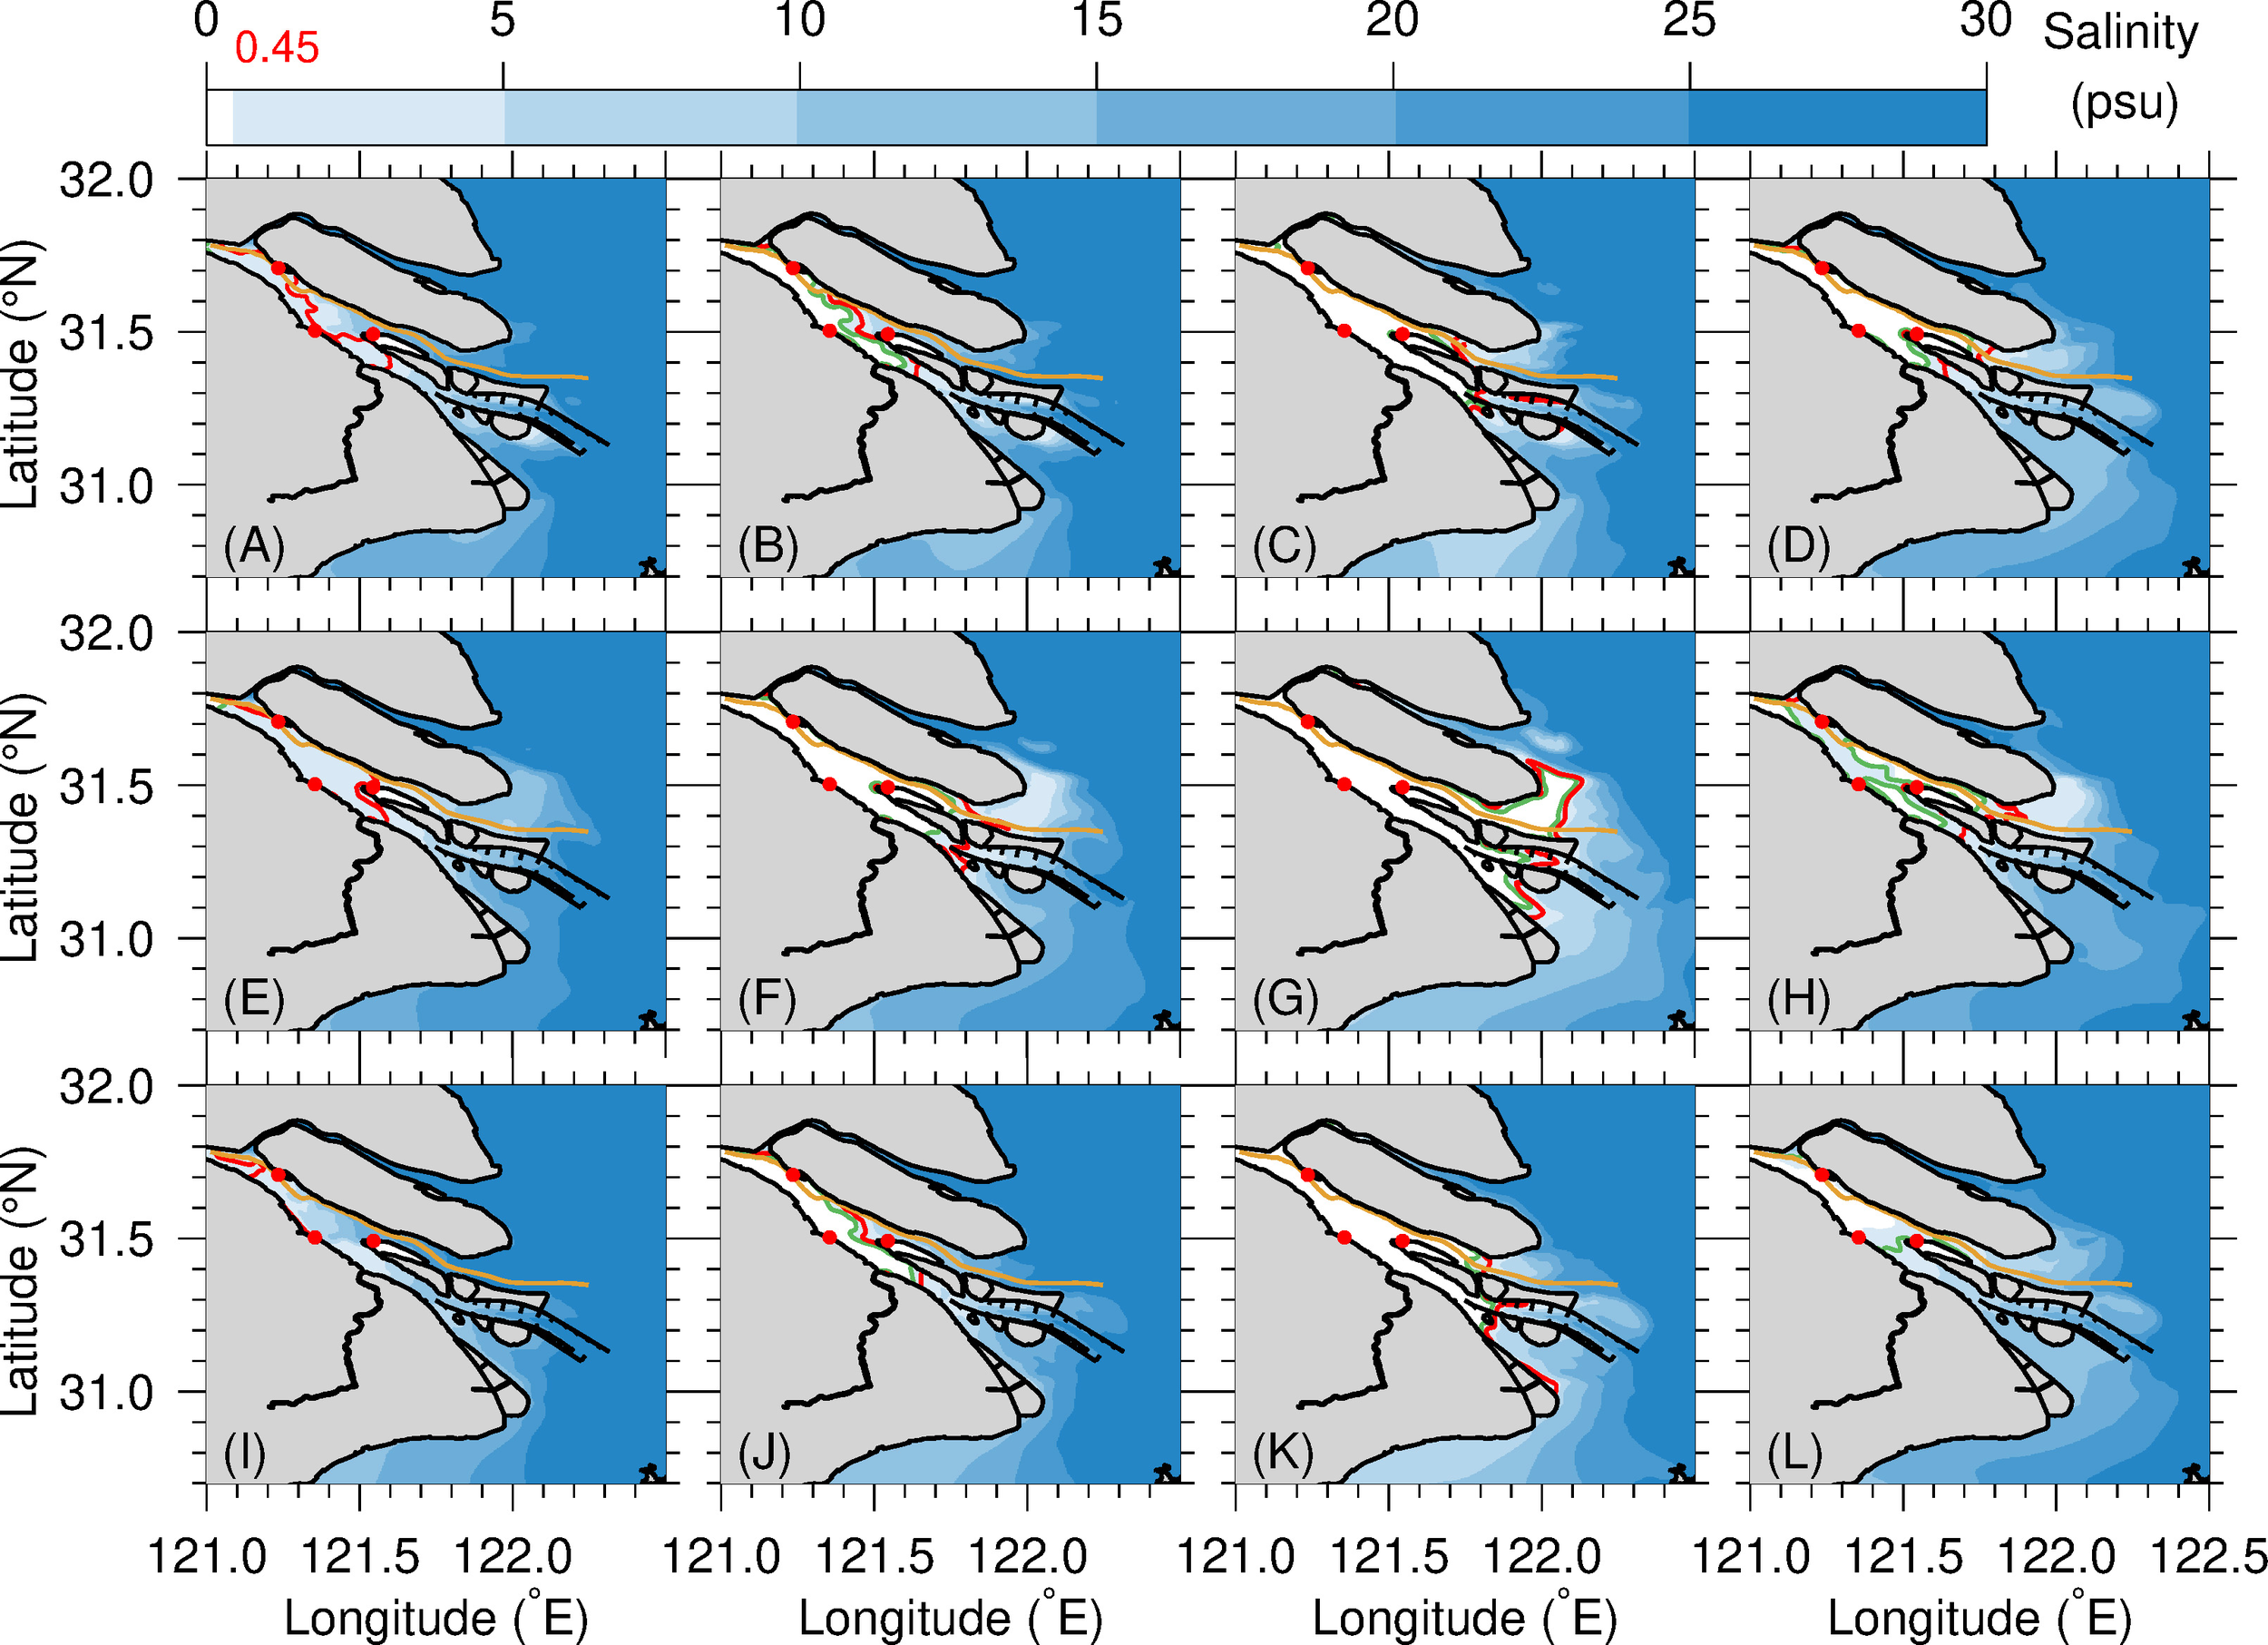
Salinity distribution in the bottom layers at 1:00 on September 8 during Typhoon Hinnamonr (A-D), at 4:00 on September 15 during Typhoon Muifa (E-H), and at 2:00 on September 24, 2022 during Typhoon Nanmadol (I-L) under real circumstances (A, E, I), half of the monthly mean river discharge (B, F, J), monthly mean river discharge (C, G, K) and climate wind conditions without typhoons (D, H, L). Bronze lines: sec. 1; green lines: 0.45 isohaline; red line: 2 isohaline.
For estuaries with shallow water and large tidal ranges, the net unit width water and salt flux can correctly reflect water and salt transport (Zhu et al., 2020). During the influence of Typhoon Hinnamonr and Nanmadol, the residual water level increased, and the net unit width water and salt flux southward flowed off the river mouth driven by the typhoon’s strong northerly wind (Figure 11). The net water and salt flux were transported landward in the North Branch, resulting in a high salinity of more than 25 in the branch. Driven by the strong landward Ekman transport and baroclinic pressure gradient force, the net unit width water and salt flux flowed landward into the North Channel and then flowed seaward out of the South Channel, forming a horizontal water and salt transport route and producing an extremely severe saltwater intrusion in the estuary. Only northerly winds with speeds greater than 10 m/s could cause net landward water transport in the North Channel (Zhu et al., 2020). In contrast, the net unit width water and salt flux northward flowed during Typhoon Muifa, and the residual water level decreased off the river mouth because of the northeasterly wind before the typhoon and southerly wind after the typhoon (shown in Figure 3A), which could not produce landward Ekman transport (Li et al., 2012, Li et al., 2022). The numerical results indicated that strong northerly wind-driven landward water and salt transport caused saltwater intrusion extremes in the case of low river discharge.
Figure 11
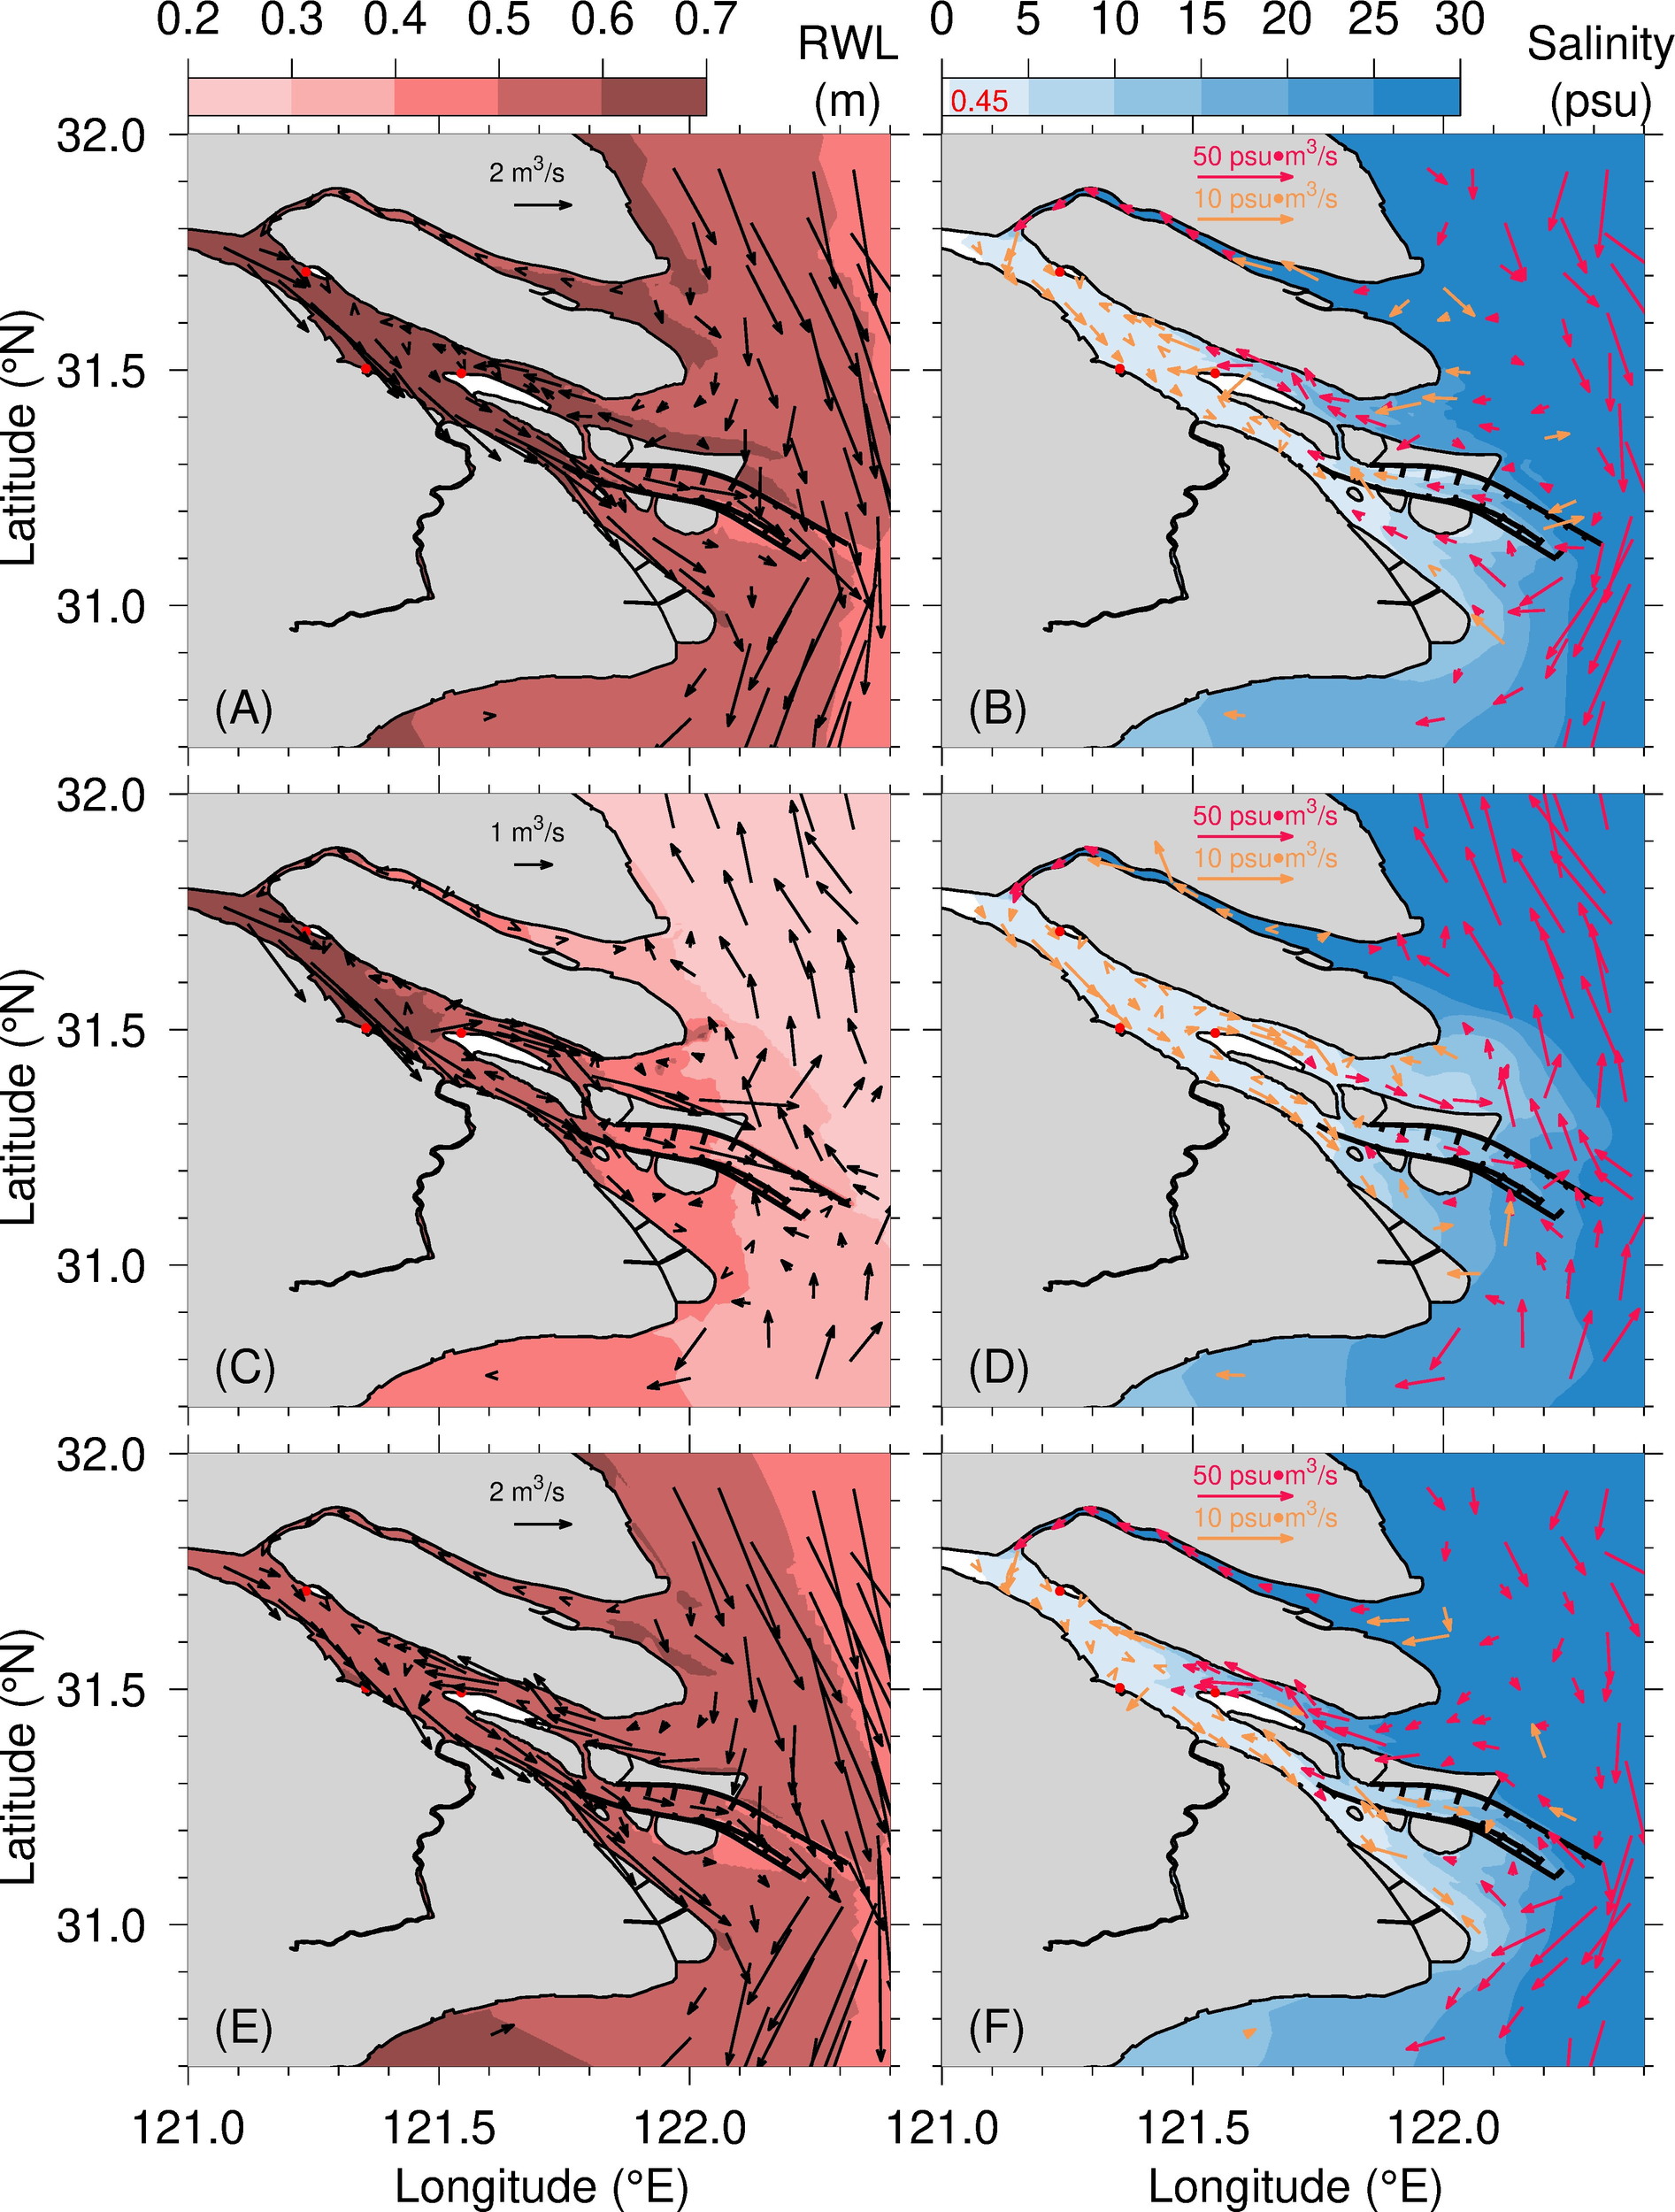
Distribution of residual water level (RWL), net unit width water flux (left) and net unit width salt flux and salinity (right) during Typhoon Hinnamonr (A, B), Muifa (C, D) and Nanmadol (E, F).
4 Discussions
The numerical model reproduced the saltwater intrusion extremes occurred under the combined impact of extremely low river discharge and typhoons. Extremely low river discharge and typhoons do not always occur simultaneously, so the individual impacts of them on the saltwater intrusion extremes were numerically investigated to discuss their dynamic mechanisms.
If the river discharge is assumed to increase to half of the monthly mean of 21800 and 19300 m3/s in August and September, respectively, during the periods of Typhoons Hinnamonr and Nanmadol, the saltwater is driven by the landward Ekman transport, causing it to flow from the North Channel into the South Branch and affect the Qingcaosha Reservoir (Figures 8B, J; Figures 9B, J). During the typhoon Muifa, the saltwater spilling over from the North Branch into the South Branch disappeared (Figure 8F; Figure 10F). The saltwater intrusion length in the surface layer along longitudinal sec. 1 was 64.07, 29.37, and 81.40 km during the influences of Typhoon Hinnamonr, Muifa, and Nanmadol (Figures 8B, F, J), respectively. It was 90.80, 31.12 and 86.31 km at the bottom layer, and was greater than that in the surface layer by 26.73, 0.78 and 4.91 km (Figures 10B, F, J). The time of no fresh water (salinity greater than 0.45) in Qingcaosha, Chenhang and Dongfengxisha Reservoir in September was 3.56, 0.00 and 0.00 days in surface layer (Figures 9A, C, E) and 8.95, 0.00, 0.60 days in bottom layer (Figures 9B, D, F), respectively, indicating that the time of excessive salinity at the water intake is significantly reduced for Qingcaosha and Dongfengxisha Reservoir, and there is no saltwater intrusion influence on Chenhang Reservoir.
If the river discharge is assumed to increase to the monthly mean of 43500 and 38500 m3/s in August and September, respectively, saltwater moves seaward to the middle of North Channel, each reservoir is no longer affected by saltwater intrusion (Figures 8C, G, K; Figures 10C, G, K). The saltwater intrusion length in the surface layer along longitudinal sec. 1 was 20.48, 16.50, and 37.27 km during the influences of Typhoon Hinnamonr, Muifa, and Nanmadol (Figures 8C, G, K), respectively; was 53.38, 19.06 and 41.06 km at the bottom layer, and was greater than that in the surface layer by 32.9, 2.56 and 3.79 km (Figures 10C, G, K). The salinity was always zeros at the intake of both Qingcaosha, Chenhang and Dongfengxisha Reservoir (Figure 9), indicating that the extremely low river discharge is the fundamental cause for the severe saltwater intrusion.
Assuming that there are no three typhoons in September 2022, the distribution of salinity clearly demonstrates that a substantial weakening of the saltwater intrusion in the estuary (Figures 8D, H, L; Figures 10D, H, L). Specifically, during the early September when the river discharge was relatively high, the reservoirs remain largely unaffected by saltwater intrusion (Figure 8D; Figure 10D). As the river discharge decreases continuously, the subsequent occurrence of saltwater spillover from the North Branch poses a significant threat to the downstream reservoirs (Figure 8H; Figure 10H). It stagnates near the Qingcaosha Reservoir upon intersecting with the saltwater invading from the North Channel (Figure 8L; Figure 10L). The saltwater intrusion length in the surface layer along longitudinal sec. 1 was 42.71, 39.75 and 46.66 km during the influences of Typhoon Hinnamonr, Muifa and Nanmadol (Figures 8D, H, L), shortened 51.83, 31.90 and 64.82 km compared to situations with typhoons, respectively; was 47.11, 39.80 and 63.41 km at the bottom layer, shortened 50.82, 32.01 and 48.41 km compared to situations with typhoons, respectively (Figures 10D, H, L). The time of no fresh water in September was 14.27, 4.40 and 13.86 days at surface layer in Qingcaosha, Chenhang and Dongfengxisha Reservoir (Figures 9A, C, E), reducing 24.24, 11.36 and 8.78 days compared to situations with typhoons, respectively; was 17.10, 4.54 and 17.88 days at bottom layer (Figures 9B, D, F), reducing 8.25, 11.88 and 6.90 days compared to situations with typhoons, respectively. Those indicated that the saltwater intrusion was significantly weakened with increase of river discharge and without typhoons, and was much stronger in bottom layer than in surface layer (Tao et al., 2024; Wang and Hong, 2021; Wang et al., 2021; Wu et al., 2023; Yang and Zhang, 2023; Zhang et al., 2023).
Statistics of the time-averaged salinity at the water intakes of the reservoirs indicates that Typhoon Hinnamonr amplified the surface salinity (Figures 9A, C, E) and bottom salinity (Figures 9B, D, F) by 9.6 and 23.4 times in the Qingcaosha Reservoir, by 6.2 and 6.3 times in the Chenhang Reservoir, and by 2.1 and 2.0 times in the Dofengxisha Reservoir, respectively; Typhoon Nanmadol amplified the surface and bottom salinities by 10.1 and 15.1 times in the Qingcaosha Reservoir, by 6.2 and 6.3 times in the Chenhang Reservoir, and by 2.9 and 2.8 times in the Dofengxisha Reservoir, respectively. The amplification effect of Typhoon Muifa on saltwater intrusion was not as great as that of Typhoon Hinnamonr, given that there was no favorable landward Ekman transport wind during the typhoon (Li et al., 2022; Tao et al., 2024; Zhu et al., 2020). At the water intake of Dongfengxisha Reservoir, the three typhoon amplification effects on saltwater intrusion were not as obvious as those at the water intake of Qingcaosha Reservoir because the saltwater intrusion there mainly came from the North Branch upstream, not from the North Channel downstream (Lyu and Zhu, 2018; Yang et al., 2023). Therefore, it can be concluded that typhoons Hinnamonr and Nanmadol greatly amplified saltwater intrusion in the case of low river discharge.
5 Conclusions
The saltwater intrusion extremes in the Changjiang Estuary occurred in late summer and autumn of 2022, and the unsuitable water intake time in the Qingcaosha, Chenhang and Dongfengxisha Reservoirs reached 98.0, 68.1 and 85.7 days, respectively. Our findings showed that the saltwater intrusion extremes was caused by the combined effect of extremely low river discharge and typhoons that bring strong northerly and northwesterly winds, which produced strong southward net water transport and high water levels along the coast off the river mouth and drove substantial landward water and transport into the North Channel to form horizontal estuarine circulation flowing out of the South Channel into the sea. This landward net water transport overcame seaward runoff and brought highly saline water into the estuary, which seriously threatened the water intake of the estuarine reservoirs. The extremely low river discharge is the fundamental cause for the severe saltwater intrusion, and typhoons Hinnamonr and Nanmadol greatly amplified it. If there is no typhoons, the saltwater intrusion length along longitudinal sec. 1 in the surface layer is shortened by 51.83, 31.90 and 64.82 km, and the time of no fresh water in Qingcaosha Reservoir was reduced by 24.24, 11.36 and 8.78 days in September during the influences of Typhoon Hinnamonr, Muifa and Nanmadol, respectively.
Global climate change has been exacerbated, leading to more frequent and extreme weather. Extremely low river discharge caused by severe basin drought and strong northerly winds caused by typhoons will intensify saltwater intrusion and worsen freshwater resource utilization in estuaries. Greater attention should be given to saltwater intrusion extremes and freshwater safety in estuaries, which are among the most populated areas with high freshwater demand. Revealing the dynamic mechanism of saltwater intrusion extremes in this paper is conducive to understanding how it happened and developing effective response measures for estuarine freshwater resources safety.
Statements
Data availability statement
The data underlying the findings of this article can be accessed at https://doi.org/10.6084/m9.figshare.28608143.v1. Further inquiries can be directed to the corresponding author.
Author contributions
RM: Conceptualization, Data curation, Formal Analysis, Investigation, Methodology, Software, Validation, Visualization, Writing – original draft. CQ: Conceptualization, Data curation, Investigation, Resources, Software, Writing – review & editing. JZ: Conceptualization, Data curation, Formal Analysis, Funding acquisition, Methodology, Project administration, Software, Supervision, Visualization, Writing – review & editing. ZZ: Investigation, Project administration, Resources, Supervision, Writing – review & editing. YZ: Funding acquisition, Investigation, Project administration, Resources, Supervision, Writing – original draft, Writing – review & editing. LK: Investigation, Resources, Writing – review & editing. LD: Conceptualization, Formal Analysis, Writing – review & editing. WQ: Software, Validation, Writing – review & editing. HW: Conceptualization, Methodology, Supervision, Writing – review & editing.
Funding
The author(s) declare that financial support was received for the research and/or publication of this article. This work was supported by the National Key R&D Program of China (grant 2023YFC3206003, 2022YFA1004404), and the National Natural Science Foundation of China (grant U2340225).
Conflict of interest
Author YZ was employed by the company Shanghai Chengtou Raw Water Limited Company.
The remaining authors declare that the research was conducted in the absence of any commercial or financial relationships that could be construed as a potential conflict of interest.
Generative AI statement
The author(s) declare that no Generative AI was used in the creation of this manuscript.
Publisher’s note
All claims expressed in this article are solely those of the authors and do not necessarily represent those of their affiliated organizations, or those of the publisher, the editors and the reviewers. Any product that may be evaluated in this article, or claim that may be made by its manufacturer, is not guaranteed or endorsed by the publisher.
Abbreviations
NB, North Branch; SB, South Branch; NC, North Channel; SC, South Channel; CC, Coefficient; SS, Skill Score; RMSE, Root Mean Square Error.
References
1
Aristizábal M. F. Chant R. J. (2015). An observational study of salt fluxes in Delaware Bay. J. Geophysical Research: Oceans120, 2751–2768. doi: 10.1002/2014JC010680
2
Aziz D. Tarya A. (2024). Saltwater intrusion at kapuas besar estuary using 1-dimensional analytical method. Earth Environ. science.1298, 12003. doi: 10.1088/1755-1315/1298/1/012003
3
Chen C. Zhu J. Zheng L. Ralph E. Budd J. (2004). A non-orthogonal primitive equation coastal ocean circulation model: application to lake superior. J. Great Lakes Res.30, 41–54. doi: 10.1016/S0380-1330(04)70376-7
4
Costall A. Harris B. Pigois J. P. (2018). Electrical resistivity imaging and the saline water interface in high-quality coastal aquifers. Surveys Geophysics39, 753–816. doi: 10.1007/s10712-018-9468-0
5
Ding Z. Zhu J. Chen B. Bao D. (2021). A two-way nesting unstructured quadrilateral grid, finite-differencing, estuarine and coastal ocean model with high-order interpolation schemes. J. Marine Sci. Eng.9, 335. doi: 10.3390/jmse9030335
6
Duan A. Zhong Y. Xu G. Yang K. Tian B. Wu Y. et al . (2024). Quantifying the 2022 extreme drought in the Yangtze River Basin using GRACE-FO. J. Hydrology630, 130680. doi: 10.1016/j.jhydrol.2024.130680
7
Editorial Board For Marine Atlas (1992). Ocean atlas in huanhai sea and east China sea (Hydrology) (Beijing: China Ocean Press).
8
Egbert G. D. Erofeeva S. Y. (2002). Efficient inverse modeling of barotropic ocean tides. J. Atmospheric Oceanic Technol.19, 183–204. doi: 10.1175/1520-0426(2002)019<0183:EIMOBO>2.0.CO;2
9
Feng A. Chao Q. Liu L. Gao G. Wang G. Zhang X. et al . (2024). Will the 2022 compound heatwave–drought extreme over the Yangtze River Basin become Grey Rhino in the future? Adv. Climate Change Res. 15 (3), 547–556. doi: 10.1016/j.accre.2024.05.004
10
Fu Z. Zhou W. Xie S. Zhang R. Wang X. (2024). Dynamic pathway linking Pakistan flooding to East Asian heatwaves. Sci. advance10, eadk9250. doi: 10.1126/sciadv.adk9250
11
Geyer W. R. (1993). The importance of suppression of turbulence by stratification on the estuarine turbidity maximum. Estuaries16, 113–125. doi: 10.2307/1352769
12
Geyer W. R. (1997). Influence of wind on dynamics and flushing of shallow estuaries, estuarine. Coastal Shelf Sci.44, 713–722. doi: 10.1006/ecss.1996.0140
13
Guo W. Jiao X. Zhou H. Zhu Y. Wang H. (2022). Hydrologic regime alteration and influence factors in the Jialing River of the Yangtze River, China. Sci. Rep.12, 11166. doi: 10.1038/s41598-022-15127-4
14
Jumain M. Ibrahim Z. Makhtar M. R. Ishak R. Rusli N. M. Mat Salleh M. Z. et al . (2022). Spatio-temporal patterns of saltwater intrusion in A narrow meandering channel. Int. J. Integrated Eng.14, 188–194. doi: 10.30880/ijie.2022.14.09.024
15
Kolb P. Zorndt A. Burchard H. Gräwe U. Kösters F. (2022). Modelling the impact of anthropogenic measures on saltwater intrusion in the Weser estuary. Ocean Sci.18, 1725–1739. doi: 10.5194/os-18-1725-2022
16
Li D. Liu B. Lu Y. Fu J. (2024). The characteristic of compound drought and saltwater intrusion events in the several major river estuaries worldwide. J. Environ. Manage.350, 119659. doi: 10.1016/j.jenvman.2023.119659
17
Li L. Wang C. Pareja-Roman L. F. Zhu J. Chant R. J. Wang G. (2022). Effects of typhoon on saltwater intrusion in a high discharge estuary. J. Geophysical Research: Oceans127, e2021JC018206. doi: 10.1029/2021JC018206doi: 10.1029/2021JC018206
18
Li L. Zhu J. Wu H. (2012). Impacts of wind stress on saltwater intrusion in the Yangtze Estuary. Sci. China Earth Sci.55, 1178–1192. doi: 10.1007/s11430-011-4311-1
19
Lyu Z. Gao H. Gao R. Ding T. (2023). Extreme characteristics and causes of the drought event in the whole Yangtze River Basin in the midsummer of 2022. Adv. Climate Change Res.14, 642–650. doi: 10.1016/j.accre.2023.09.007
20
Lyu H. Zhu J. (2018). Impact of the bottom drag coefficient on saltwater intrusion in the extremely shallow estuary. J. Hydrology.557, 838–850. doi: 10.1016/j.jhydrol.2018.01.010
21
Ma R. Zhu J. Qiu C. (2024). A new scheme for two-way, nesting, quadrilateral grid in an estuarine model. Comput. Mathematics Appl.172, 152–167. doi: 10.1016/j.camwa.2024.08.001
22
Mekonnen M. M. Hoekstra A. Y. (2016). Four billion people facing severe water scarcity. Sci. Adv.2, e1500323. doi: 10.1126/sciadv.1500323
23
Murphy A. H. (1988). Skill scores based on the mean square error and their relationships to the correlation coefficient. Monthly Weather Rev.116, 2417–2424. doi: 10.1175/1520-0493(1988)116<2417:SSBOTM>2.0.CO;2
24
Pokavanich T. Guo X. (2024). Saltwater intrusion in Chao Phraya Estuary: A long, narrow and meandering partially mixed estuary influenced by water regulation and abstraction. J. Hydrology: Regional Stud.52, 101686. doi: 10.1016/j.ejrh.2024.101686
25
Prandle D. (1985). On salinity regimes and the vertical structure of residual flows in narrow tidal estuaries, Estuarine. Coastal Shelf Sci.20, 615–635. doi: 10.1016/0272-7714(85)90111-8
26
Qiu C. Zhu J. (2015). Assessing the influence of sea level rise on salt transport processes and estuarine circulation in the changjiang river estuary. J. Coastal Res.313, 661–670. doi: 10.2112/JCOASTRES-D-13-00138.1
27
Scully M. E. Friedrichs C. Brubaker J. (2005). Control of estuarine stratification and mixing by wind-induced straining of the estuarine density field. Estuaries28, 321–326. doi: 10.1007/BF02693915
28
Simpson J. H. Brown J. Matthews J. Allen G. (1990). Tidal straining, density currents, and stirring in the control of estuarine stratification. Estuaries13, 125–132. doi: 10.2307/1351581
29
Small C. Nicholls R. J. (2003). A global analysis of human settlement in coastal zones. J. Coastal Res.19, 584–599. doi: 10.2307/4299200
30
Tao Z. Chen Y. Pan S. Chu A. Xu C. Yao P. et al . (2024). The influence of wind and waves on saltwater intrusion in the yangtze estuary: A numerical modeling study. J. Geophysical Research: Oceans9 (9), e2024JC021076. doi: 10.1029/2024JC021076
31
Wada Y. Beek L. P. H. V. Viviroli D. Dürr H. H. Weingartner R. Bierkens M. F. P. (2011). Global monthly water stress: 2. Water demand and severity of water stress. Water Resour. Res.47 (7), W07518. doi: 10.1029/2010WR009792
32
Wang J. Hong B. (2021). Threat posed by future sea-level rise to freshwater resources in the upper pearl river estuary. J. Marine Sci. Engineering.9(3), 291. doi: 10.3390/jmse9030291
33
Wang Y. Jiang C. Cheng H. Li W. Teng L. (2021). Characteristics and driving mechanisms of mixing and stratification in the north passage of the changjiang estuary, China. J. Coastal Res.38, 140–153. doi: 10.2112/JCOASTRES-D-21-00053.1
34
WMO W. M. O. (2023). State of the global climate 2022 (WMO-no. 1316). Available online at: https://wmo.int/publication-series/state-of-global-climate-2022 (Accessed September 8, 2024).
35
Wu H. Shen J. Zhu J. Zhang J. Li L. (2014). Characteristics of the Changjiang plume and its extension along the Jiangsu Coast. Continental Shelf Res.76, 108–123. doi: 10.1016/j.csr.2014.01.007
36
Wu H. Zhu J. Chen B. Chen Y. (2006). Quantitative relationship of runoff and tide to saltwater spilling over from the North Branch in the Changjiang Estuary: A numerical study, Estuarine. Coastal Shelf Sci.69, 125–132. doi: 10.1016/j.ecss.2006.04.009
37
Wu T. Zhu J. Ma R. Qiu W. Yuan R. (2023). Freshwater resources around the reclaimed new land on the Eastern Hengsha Shoal in the Changjiang estuary. Front. Marine Sci.10. doi: 10.3389/fmars.2023.1302091
38
Yang F. Chen W. Lu C. Zou H. Wang Q. Wan D. (2023). Research on comprehensive prevention and control system of saltwater intrusion in the Guangdong-Hong Kong- Macao Greater Bay Area. Water Resour. Protection.39, 32–41. doi: 10.3880/j.issn.1004-6933.2023.01.005
39
Yang J. Zhang W. (2023). Storm-induced saltwater intrusion responds divergently to sea level rise in a complicated estuary. Environ. Res. Lett.19 (1), 014011. doi: 10.1088/1748-9326/ad0e32
40
Yang Y. Zhu J. Chen Z. Ma R. (2023). The impact of sluice construction in the north branch of the changjiang estuary on saltwater intrusion and freshwater resources. J. Marine Sci. Eng.11, 2107. doi: 10.3390/jmse11112107
41
Zhang J. Cheng L. Wang Y. Jiang C. (2023). The impact of tidal straining and advection on the stratification in a partially mixed estuary. Water.15, 339. doi: 10.3390/w15020339
42
Zhu J. Cheng X. Li L. Wu H. Gu J. Lyu H. (2020). Dynamic mechanism of an extremely severe saltwater intrusion in the Changjiang estuary in February 2014. Hydrology Earth System Sci.24, 5043–5056. doi: 10.5194/hess-24-5043-2020
43
Zhu J. Gu Y. Wu H. (2013). Determination of the period not suitabl e for taking domestic water supply to the Qingcaosha reservoir near Changjiang River Estuary. Oceanologia Limnologic Sin.5), 1138–1145. doi: 10.11693/hyhz201305003003
44
Zhu J. Qiu W. Tang C. Cheng X. (2021). Seasonal regulation of river discharge by the cascade reservoirs in the Lancang River and its effect on downstream freshwater and estuarine saltwater intrusion. Anthropocene Coasts4, 233–250. doi: 10.1139/anc-2021-0007
Summary
Keywords
saltwater intrusion extremes, numerical simulation, low river discharge, typhoon, dynamic mechanism
Citation
Ma R, Qiu C, Zhu J, Zhang Z, Zhu Y, Kong L, Ding L, Qiu W and Wu H (2025) Dynamic cause of saltwater intrusion extremes and freshwater challenges in the Changjiang Estuary in flood season of 2022. Front. Mar. Sci. 12:1573883. doi: 10.3389/fmars.2025.1573883
Received
10 February 2025
Accepted
07 April 2025
Published
29 April 2025
Volume
12 - 2025
Edited by
Kyung-Ae Park, Seoul National University, Republic of Korea
Reviewed by
Qinghua Ye, Deltares, Netherlands
Xiao Wu, Ocean University of China, China
Updates
Copyright
© 2025 Ma, Qiu, Zhu, Zhang, Zhu, Kong, Ding, Qiu and Wu.
This is an open-access article distributed under the terms of the Creative Commons Attribution License (CC BY). The use, distribution or reproduction in other forums is permitted, provided the original author(s) and the copyright owner(s) are credited and that the original publication in this journal is cited, in accordance with accepted academic practice. No use, distribution or reproduction is permitted which does not comply with these terms.
*Correspondence: Jianrong Zhu, jrzhu@sklec.ecnu.edu.cn
Disclaimer
All claims expressed in this article are solely those of the authors and do not necessarily represent those of their affiliated organizations, or those of the publisher, the editors and the reviewers. Any product that may be evaluated in this article or claim that may be made by its manufacturer is not guaranteed or endorsed by the publisher.