 Veeranjaneyulu Chinta
 Muhsan Ali Kalhoro
 Muhammad Tahir
 Zhenlin Liang
 Tony Song
- 1Ningbo Institute of Digital Twin, Eastern Institute of Technology, Ningbo, China
- 2Marine College, Shandong University, Weihai, China
- 3Faculty of Marine Sciences, Lasbela University of Agriculture, Water and Marine Sciences, Uthal, Pakistan
- 4School of Space Science and Technology, Shandong University, Weihai, China
Tropical cyclones (TCs) significantly alter the upper oceanic environment through physical and biogeochemical processes. This study investigates the impact of category 3 TC Tej (20–25 October 2023) on oceanic conditions in the Arabian Peninsula, using satellite remote sensing and model-based ocean reanalysis products. Ocean changes were assessed during the cyclone active period (20–25 October 2023) to capture its immediate impact on the oceanic environment. The cyclone induced Sea Surface Temperature (SST) cooling of 2.5°C to 4.0°C, particularly within cyclonic eddies and along the right side of the storm track, with cooling effects penetrating the upper 100 meters due to wind-induced vertical mixing (mixed layer depth to 40-50) Ekman upwelling. Concurrently, Chlorophyll-a (Chl-a) concentrations increased up to 6 mg/m3, reflecting a fourfold rise driven by nutrient entrainment. Enhanced subsurface Chl-a was observed down to 50 meters. Sea Surface Height (SSH) dropped below 0.05 m in cyclonic eddies (12°N, 56°E) and rose above 0.8 m in anticyclonic eddies (15°N, 55°E), revealing contrasting vertical motions. Surface pH declined by 0.05-0.1 units, while dissolved inorganic carbon (DIC) concentrations increased to 2.1-2.2 mol/m3 in the upper 100 meters, attributed to enhanced CO2 uptake and the upwelling of CO2-rich waters. Cyclonic eddies were linked to lower SSH, higher Chl-a, and elevated DIC levels. This study provides the first high-resolution vertical analysis of post-Tej biogeochemical responses in the Arabian Peninsula, highlighting eddy-modulated nutrient redistribution as a key driver of phytoplankton bloom. These findings enhance understanding of the coupled physical-biogeochemical impacts of TCs in the region.
1 Introduction
Tropical cyclones (TCs) are powerful atmospheric systems that develop over tropical oceans, with approximately 90 significant and intense events occurring globally each year (Strachan et al., 2013). The strength of TCs is strongly correlated with sea surface temperature (SST), and as global climatic warming continues, their intensity is expected to increase (Emanuel, 2013; Knutson et al., 2015). The high winds associated with TCs contribute to substantial oceanic mixing and upwelling, leading to significant physical and biological changes in the upper ocean. Numerous studies have reported a notable decrease in SST and an increase in surface chlorophyll-a (Chl-a) levels following TC events (Zheng and Tang, 2007; Zhao et al., 2015; Lin et al., 2017; Kalhoro et al., 2024). Phytoplankton growth often responds positively to nutrient inputs from deeper waters, illustrating how TCs can stimulate oceanic primary productivity (PP) (Sun et al., 2010; Chen et al., 2015; Pan et al., 2017a, b). The impact of TCs on marine ecosystems has been widely investigated using satellite observations and numerical models, particularly in regions frequently affected by these events (Babin et al., 2004; Lin, 2012). However, most research has focused on the short-term effects, typically examining individual or a few major TCs and their influence on SST cooling, phytoplankton blooms, and PP enhancement (e.g., Sun et al., 2010; Zhao et al., 2017). Additionally, the extent of oceanic response to TCs depends on several factors, including cyclone intensity, speed, size, and pre-existing ocean conditions (Price, 1981; Lin, 2012). While, monitoring oceanic conditions before and after individual TCs provides limited insights into their long-term effects on marine ecosystems. Foltz et al. (2015) found that TCs significantly influence spatially and seasonally integrated Chl-a concentrations in the western subtropical North Atlantic. Considering the significant role of TCs in shaping oceanic physical and biogeochemical processes, further investigation is fully required to fully understand their impacts, particularly in regions with frequent TC activity.
TCs commonly develop during the summer months over the Indian Ocean, significantly influencing the oceanic environment. These storms act as wind-driven mechanisms that enhance the transport of surface and subsurface Chl-a in nutrient-poor waters. This enhancement occurs through various processes, including vigorous vertical mixing, upwelling, and the generation of near-inertial waves, especially on the right-side of the storm track (Babin et al., 2004; Lin et al., 2003; Sun et al., 2015). These processes bring nutrients from deeper layers to the ocean surface (Zhao et al., 2013; Sun et al., 2015). Additionally, TCs can generate cyclonic eddies or weaken anticyclonic eddies, thereby affecting phytoplankton growth and distribution (Huang et al., 2017; Pan et al., 2017a; Walker et al., 2005). Chl-a is a key indicator of phytoplankton biomass and plays an essential role in marine carbon cycling, energy transfer, and environmental monitoring (Falkowski, 1994; Zhao et al., 2015). During the past four decades, the Sea of Oman exhibited an average Chl-a concentration of approximately 3.06 mg/m3, whereas the Arabian Sea showed concentrations exceeding 2 mg/m3 (Chinta et al., 2024; Kalhoro et al., 2025). Although phytoplankton photosynthesis contributes only 1-2% of the global plant carbon, it is responsible for sequestering about 40% of the carbon in the oceans (Falkowski, 1994). TCs consistently induce significant cooling of the surface temperature (SST), which plays a critical role in upper ocean stratification, particularly in tropical and subtropical regions along their paths (Pan et al., 2017b; Talley et al., 2011; Walker et al., 2005). SST cooling under TC conditions results from a combination of air-sea heat exchange and dynamic oceanic processes (Girishkumar et al., 2014). While it is known that net heat flux and horizontal advection account for approximately 33% of SST cooling during TCs (Girishkumar et al., 2014), this aspect remains underexplored in marine ecological studies. Ultimately, TCs impact the euphotic zone and nutrient distribution through various physical processes (Liang et al., 2018). More intense TCs tend to have a greater effect on the marine environment, and slower-moving TCs often exert a more profound impact compared to their faster-moving counterparts (Zhao et al., 2013; Sun et al., 2015).
The Arabian Peninsula presents a complex oceanographic environment shaped by density gradients, wind regimes, and tidal forces. Recent studies have reported a significant increase ranging from 52% to 80% in the frequency of TCs over the Arabian Sea (Deshpande et al., 2021). These cyclones commonly originate in the Arabian Sea and track westward, making landfall along the southern and eastern coasts of the Arabian Peninsula (Saleh et al., 2025). Earlier research also documented considerable variability in the intensity and frequency of TCs across the Bay of Bengal and Arabian Sea (Evan and Camargo, 2011). This region supports a dynamic system supports estuarine-like exchange of water with surrounding basins, influenced by seasonal changes (Pous et al., 2015; Azizpour et al., 2016; Lorenz et al., 2021). Seasonal variations in SST and wind patterns play a key role in modulating regional ocean circulation, vertical mixing, the distribution of biogeochemical matters, and nutrient transport, all of which are important for phytoplankton growth and overall marine productivity (Böhm et al., 1999; Al-Hashmi et al., 2019; Bakhtiar et al., 2020). SST variations in this region are strongly linked to seasonal solar radiation. A prominent feature of the Persian Gulf is the persistent northwesterly Shamal wind (Pous et al., 2013; Yu et al., 2016), which intensifies in the winter and weakens during summer (Bordbar et al., 2014). In summer, the Shamal wind helps reduce temperatures, mitigating thermal stress (Paparella et al., 2019). Intense Shamal winds are also associated with dust storms that enhance the nutrient content of seawater (Banks et al., 2017; Ghafarian et al., 2022). While the impacts of tropical cyclones on the Arabian Sea have been documented (Byju and Prasanna-Kumar, 2011; Kuttippurath et al., 2021; Kalhoro et al., 2024), this study focuses on TC Tej (October 2023), a slow-moving Category 3 system, to explore its unique influence on the coastal ocean dynamics of the Arabian Peninsula. Unlike prior work, present work integrates high resolution satellite data with vertical profiles of nitrate, phosphate, pH, and DIC from Copernicus Marine and Environment Monitoring Services (CMEMS) to quantify subsurface biogeochemical response. The role of cyclonic and anticyclonic eddies in modulating the effects of TC Tej also examines, addressing a critical gap in regional studies. This integrated approach provides a holistic view of cyclone-induced physical-biogeochemical coupling in a topographically complex coastal zone.
The analysis utilized a composite methodology based on satellite observations and vertical ocean profile data to assess the impact of TC Tej on the marine environment of the Arabian Peninsula during October 2023. The primary focus was on changes in the Chla, SST, SST gradient magnitude (GM), and sea surface height (SSH), Ekman pumping, and mixed layer depths (MLD). By investigating the alterations in surface Chl-a concentrations before, during, and after the passage of Tej, aim to understand the cyclone impact on Chl-a, which is crucial for primary productivity in marine ecosystems. Examining SST helps identify the extend of SST cooling induced by the cyclone, providing insights into the thermal structure of the upper ocean and the degree of vertical mixing and upwelling caused by the cyclone intense winds. Analyzing SSH will help to understand the redistribution of water masses and the potential formation of cyclonic or anticyclonic eddies. These physical changes in the oceanic environment are assessed in relation to biological responses, particularly phytoplankton growth and nutrient dynamics, to better understand how upwelled nutrients from deeper layers support enhanced marine productivity following a major cyclone event.
2 Materials and methods
2.1 Tropical cyclone data
The TC Tej (IO52023 >=96 kt) data for the Indian Ocean region in 2023 is available on the Regional and Mesoscale Meteorology Branch (RMMB) website (https://rammb-data.cira.colostate.edu/tc_realtime/storm.asp?storm_identifier=io052023). This cyclone occurred from October 20 to October 25, 2023 (9.0-16.0°N; 50.0-61.0°E). Its intensities ranged from >=25 knots to a maximum of >=105 knots, with the peak intensity exceeding 85 knots observed from October 21 to October 23 in the Arabian Peninsula. Lower intensities were recorded before and after this period. Tej unusual track and translation speed likely intensified its oceanic impact through prolonged wind forcing and enhanced vertical mixing.
2.2 Remote sensing observation
Global daily SST reprocessed product derived from OSTIA SST, with spatial resolution of 0.05° × 0.05° (Good et al., 2020), https://data.marine.copernicus.eu/product/SST_GLO_SST_L4_REP_OBSERVATIONS_010_011/description).The daily SST gradient magnitude (SSTGM) was determined using the method described by Belkin and O’Reilly (2009). The horizontal SST gradients in the x and y-directions (Gx and Gy) were calculated using Sobel-type convolution filters applied to 3x3 matric centered at each grid point:
Where Gx and Gy operators were defined as.
Where T defines a 3 x 3 SST matrix centered on the grid point of interest. A thermal front was identified when the SST GM exceeded 0.05°C/km following the threshold used by Jing et al. (2015) and Lao et al. (2023).
Daily Chl-a level 4 data were obtained from the Copernicus Marine and Environment Monitoring Service (CMEMS), with a spatial resolution of 4 × 4 km. The sea surface height (SSH) data were download from the Global-Ocean Gridded L4 Sea Surface Heights and Derived Variables Reprocessed datasets (https://data.marine.copernicus.eu/product/SEALEVEL_GLO_PHY_L4_MY_008_047/description), covering the cyclone period with a spatial resolution of 0.25° × 0.25°. The wind stress curl (WSC) and surface wind data during October 20 to October 31, 2023, were also obtained from CMEMS https://data.marine.copernicus.eu/product/WIND_GLO_PHY_L4_NRT_012_004/description. The daily heat flux data at spatial resolution 0.1° x0.1° was retrieved from https://apdrc.soest.hawaii.edu/las_ofes/v6/constrain?var=91; https://apdrc.soest.hawaii.edu/las_ofes/v6/dataset?catitem=2. The daily MLD data at Spatial resolution 0.083° × 0.083° was obtained from https://data.marine.copernicus.eu/product/GLOBAL_MULTIYEAR_PHY_001_030/download?dataset=cmems_mod_glo_phy_myint_0.083deg_P1D-m_202311. https://data.marine.copernicus.eu/product/GLOBAL_MULTIYEAR_PHY_001_030/services.
2.3 Surface and vertical profile data
The daily surface and vertical profile data (temperature, Chl-a, nitrate, phosphate, dissolved inorganic carbon (DIC), pH) along the cyclone track were retrieved from the Copernicus Marine and Environment Monitoring Service (CMEMS); https://data.marine.copernicus.eu/products (Global Ocean Biogeochemistry Analysis and Forecast, product, originated by the PISCES biogeochemical model and provide 3D global forecasts. ID: GLOBAL_ANALYSISFORECAST_BGC_001_028), which has a horizontal resolution of 0.25° × 0.25° and provides daily mean values.
3 Results
3.1 Chlorophyll-a
During the formation and high-intensity phase (October 20-25), mean Chl-a concentrations remained at baseline levels (0.52 ± 0.15 mg/m³). Following peak intensity (October 26-31), maximum Chl-a concentrations reached 6.3 mg/m³ (isolated pixel value in the cyclonic eddy core), while the spatial average across the study area increased to 1.8 ± 0.6 mg/m³ (Figure 1). This increase was accompanied by strong ocean currents and the formation of both cyclonic and anticyclonic eddies. Elevated Chl-a patches were particularly prominent along the cyclone track and within the cyclonic eddies (Figure 1), while no significant Chl-a levels were noted within anticyclonic eddies. The rise in Chl-a within the cyclonic eddies can be attributed to nutrient upwelling and vertical mixing processes. Cyclonic eddies are known to induce upwelling, bringing high nutrient waters to the upper surface from deeper waters. This nutrient influx provides phytoplankton with the essential resources needed for growth, thereby enhancing surface Chl-a levels. The highest Chl-a patches (>6 mg/m³) were predominantly located on the right side of the cyclone track (Figure 1), consistent with asymmetric wind forcing that generates stronger Ekman pumping and upwelling on the right flank of tropical cyclones (Huang and Oey, 2015; Zhao et al., 2017). This spatial distribution can be explained by the asymmetric wind field associated with the cyclone, which is typically stronger on the right side of the track. This stronger wind field enhances upwelling and vertical mixing more effectively on the right side, leading to higher nutrient availability, and consequently, higher Chl-a concentrations. In contrast, the absence of significant Chl-a levels in anticyclonic eddies can be attributed to the downwelling conditions within these eddies, which inhibit nutrient transport to the surface, thereby limiting phytoplankton growth (Figure 1). This analysis underscores the complex interactions between physical and biological processes in the ocean, highlighting the significant impact of cyclonic activity on nutrient dynamics and phytoplankton productivity. The observed patterns of Chl-a distribution offer valuable insights into the ecological consequences of TCs in affected marine areas, particularly concerning primary productivity and nutrient cycling.
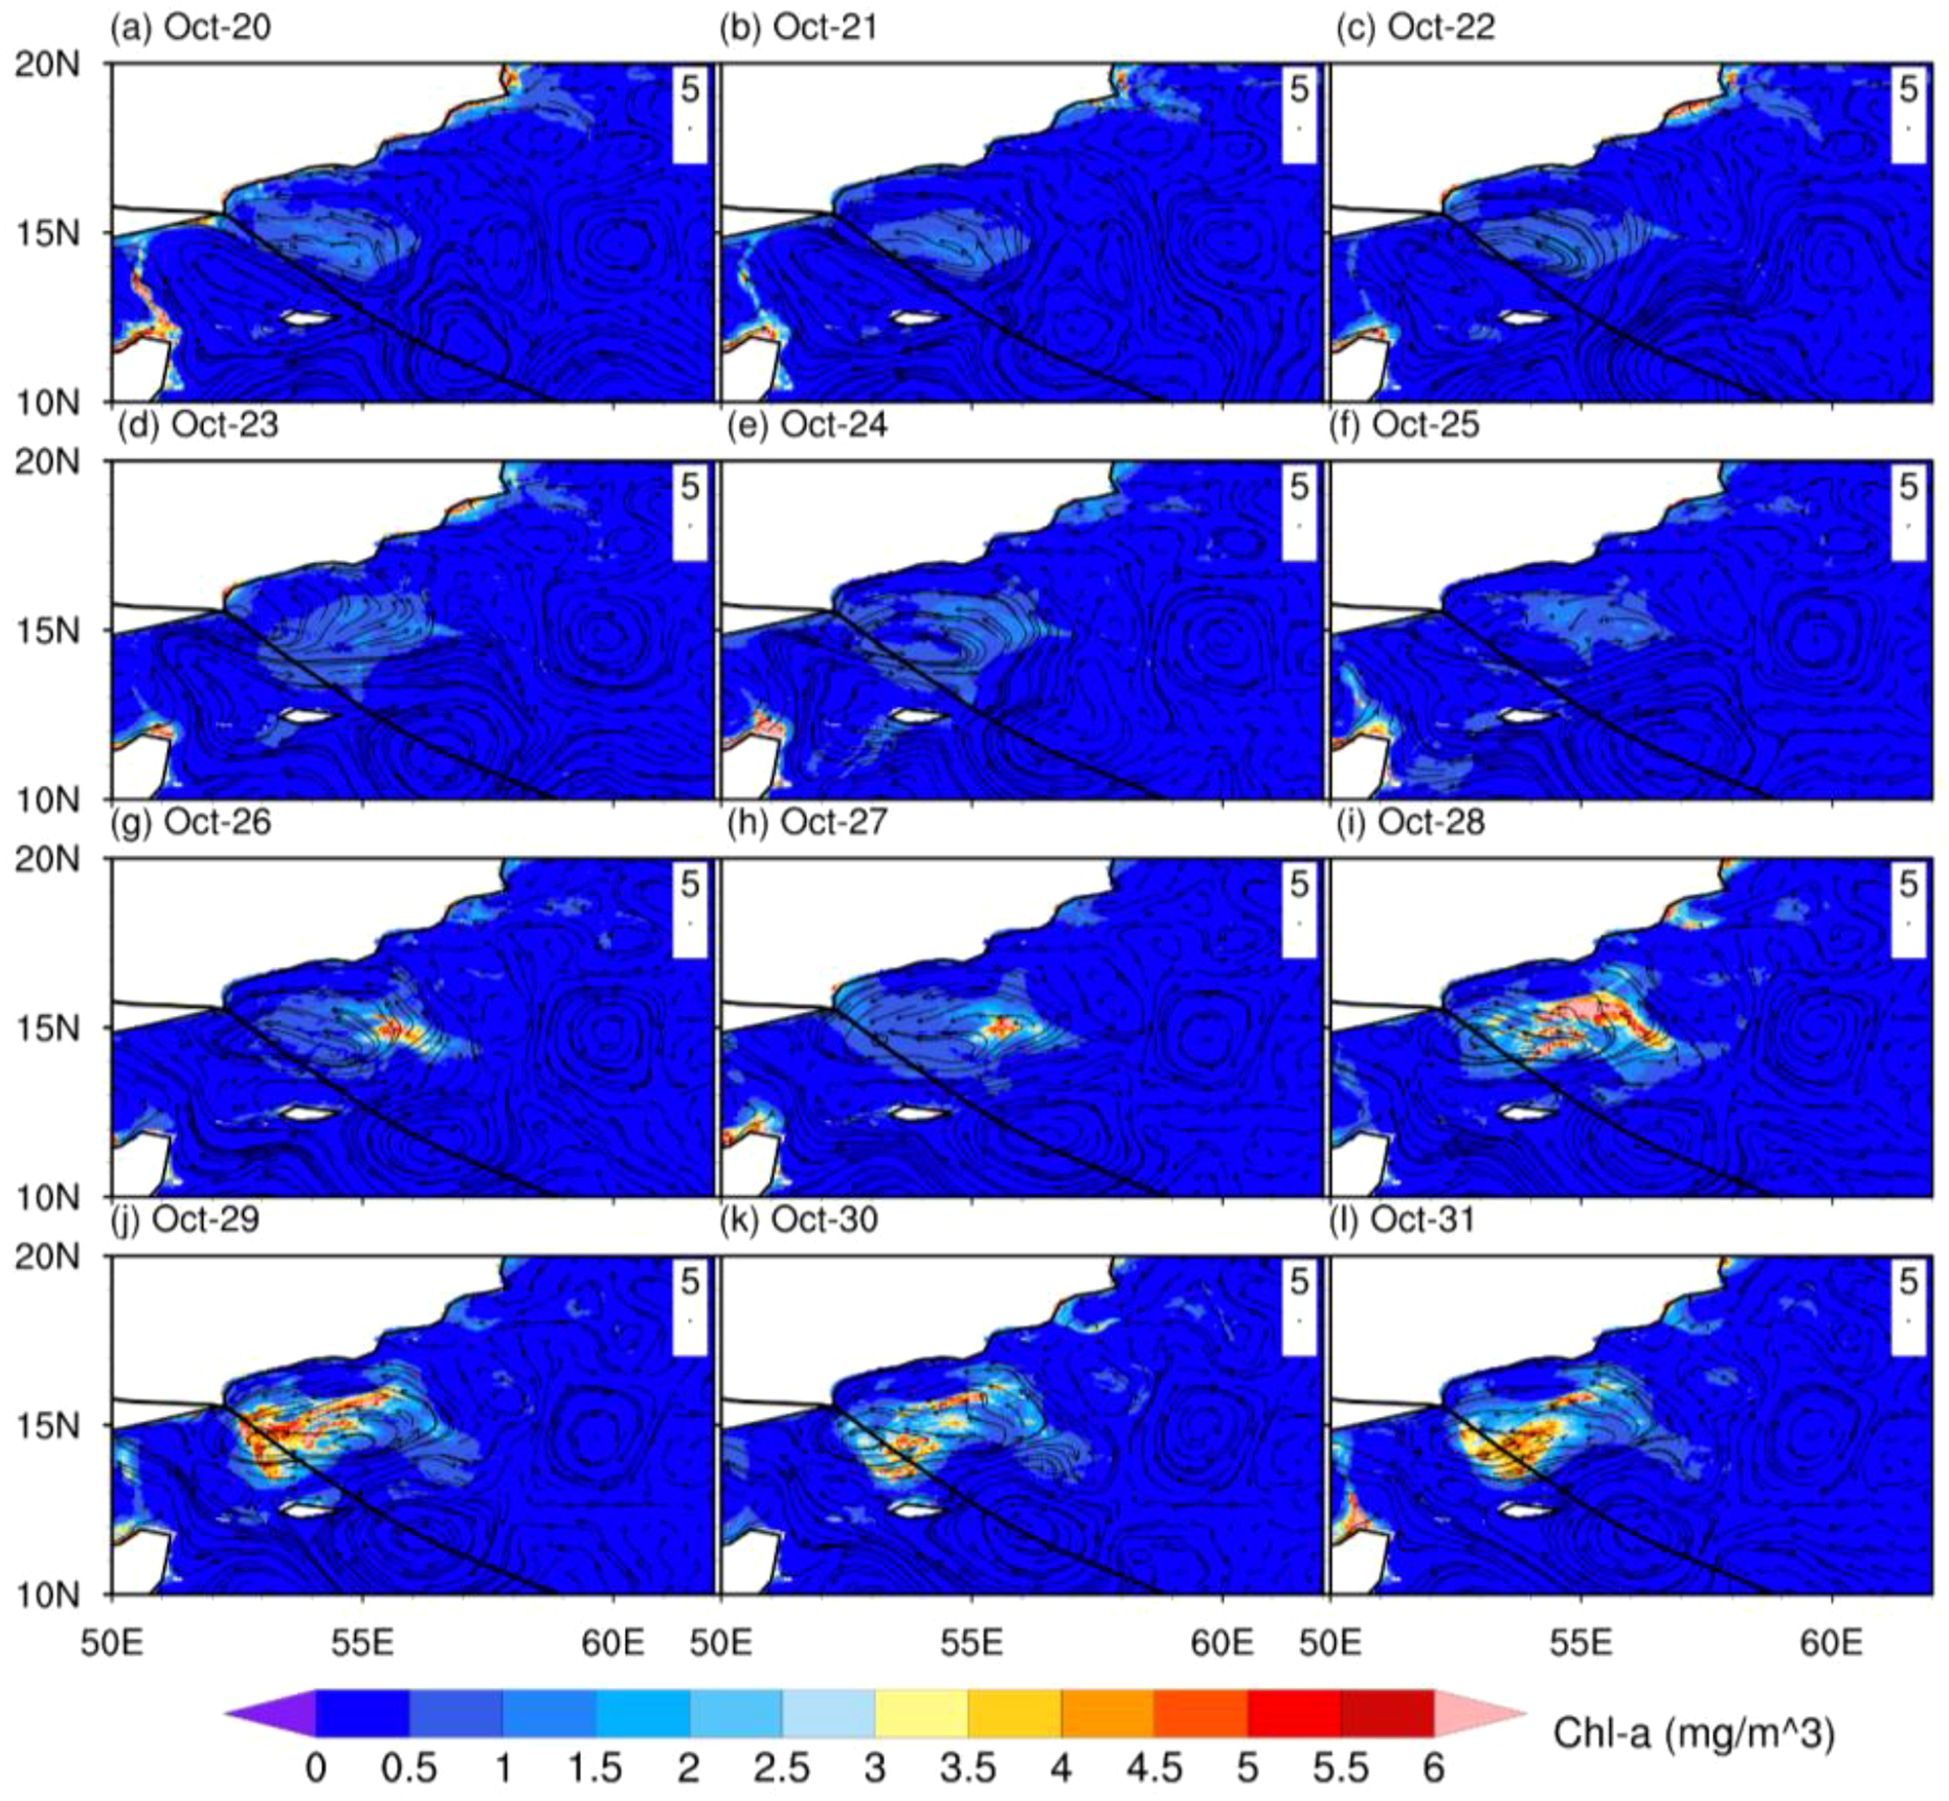
Figure 1. Chl-a concentrations (mg/m3) and ocean currents (➔: m/s) before, during, and after the TC Tej in October 2023 in the Arabian Peninsula (a-l). The black line represents the cyclone track.
3.2 SST and SST GM
During the formation of cyclone Tej from October 20 to 23, SST values exceeding 30°C were observed. The elevated SSTs are characteristic of TCs and contribute to storm intensification. Following the cyclone reaching peak intensity, significantly lower SST values (< 26°C) were detected within the cyclonic eddy (Figure 2). These lower SST patches were especially prominent on the right side of the cyclone track and within the cyclonic eddy. While higher SSTs persisted in the surrounding areas (Figure 2). Notably, a temperature difference of approximately 4°C was observed between the cyclone core and the surrounding waters (Figure 2). As the cyclone passed, SSTs recovered to within 0.3°C of pre-storm levels (28.5 ± 0.2°C; climatology) within 5–7 days, consistent with the region’s seasonal average for late October (28.7 ± 0.3°C). It was also observed that after the high-intensity phase of the cyclone, elevated SST GM levels, exceeding 0.16°C/km, were observed as distinct patches between October 23 to 31 (Figure 3). These high SST GM values were primarily detected at the edges of the cyclonic eddy along the cyclone track. While no significant SST GM values were found within the anticyclonic eddy (Figure 3).
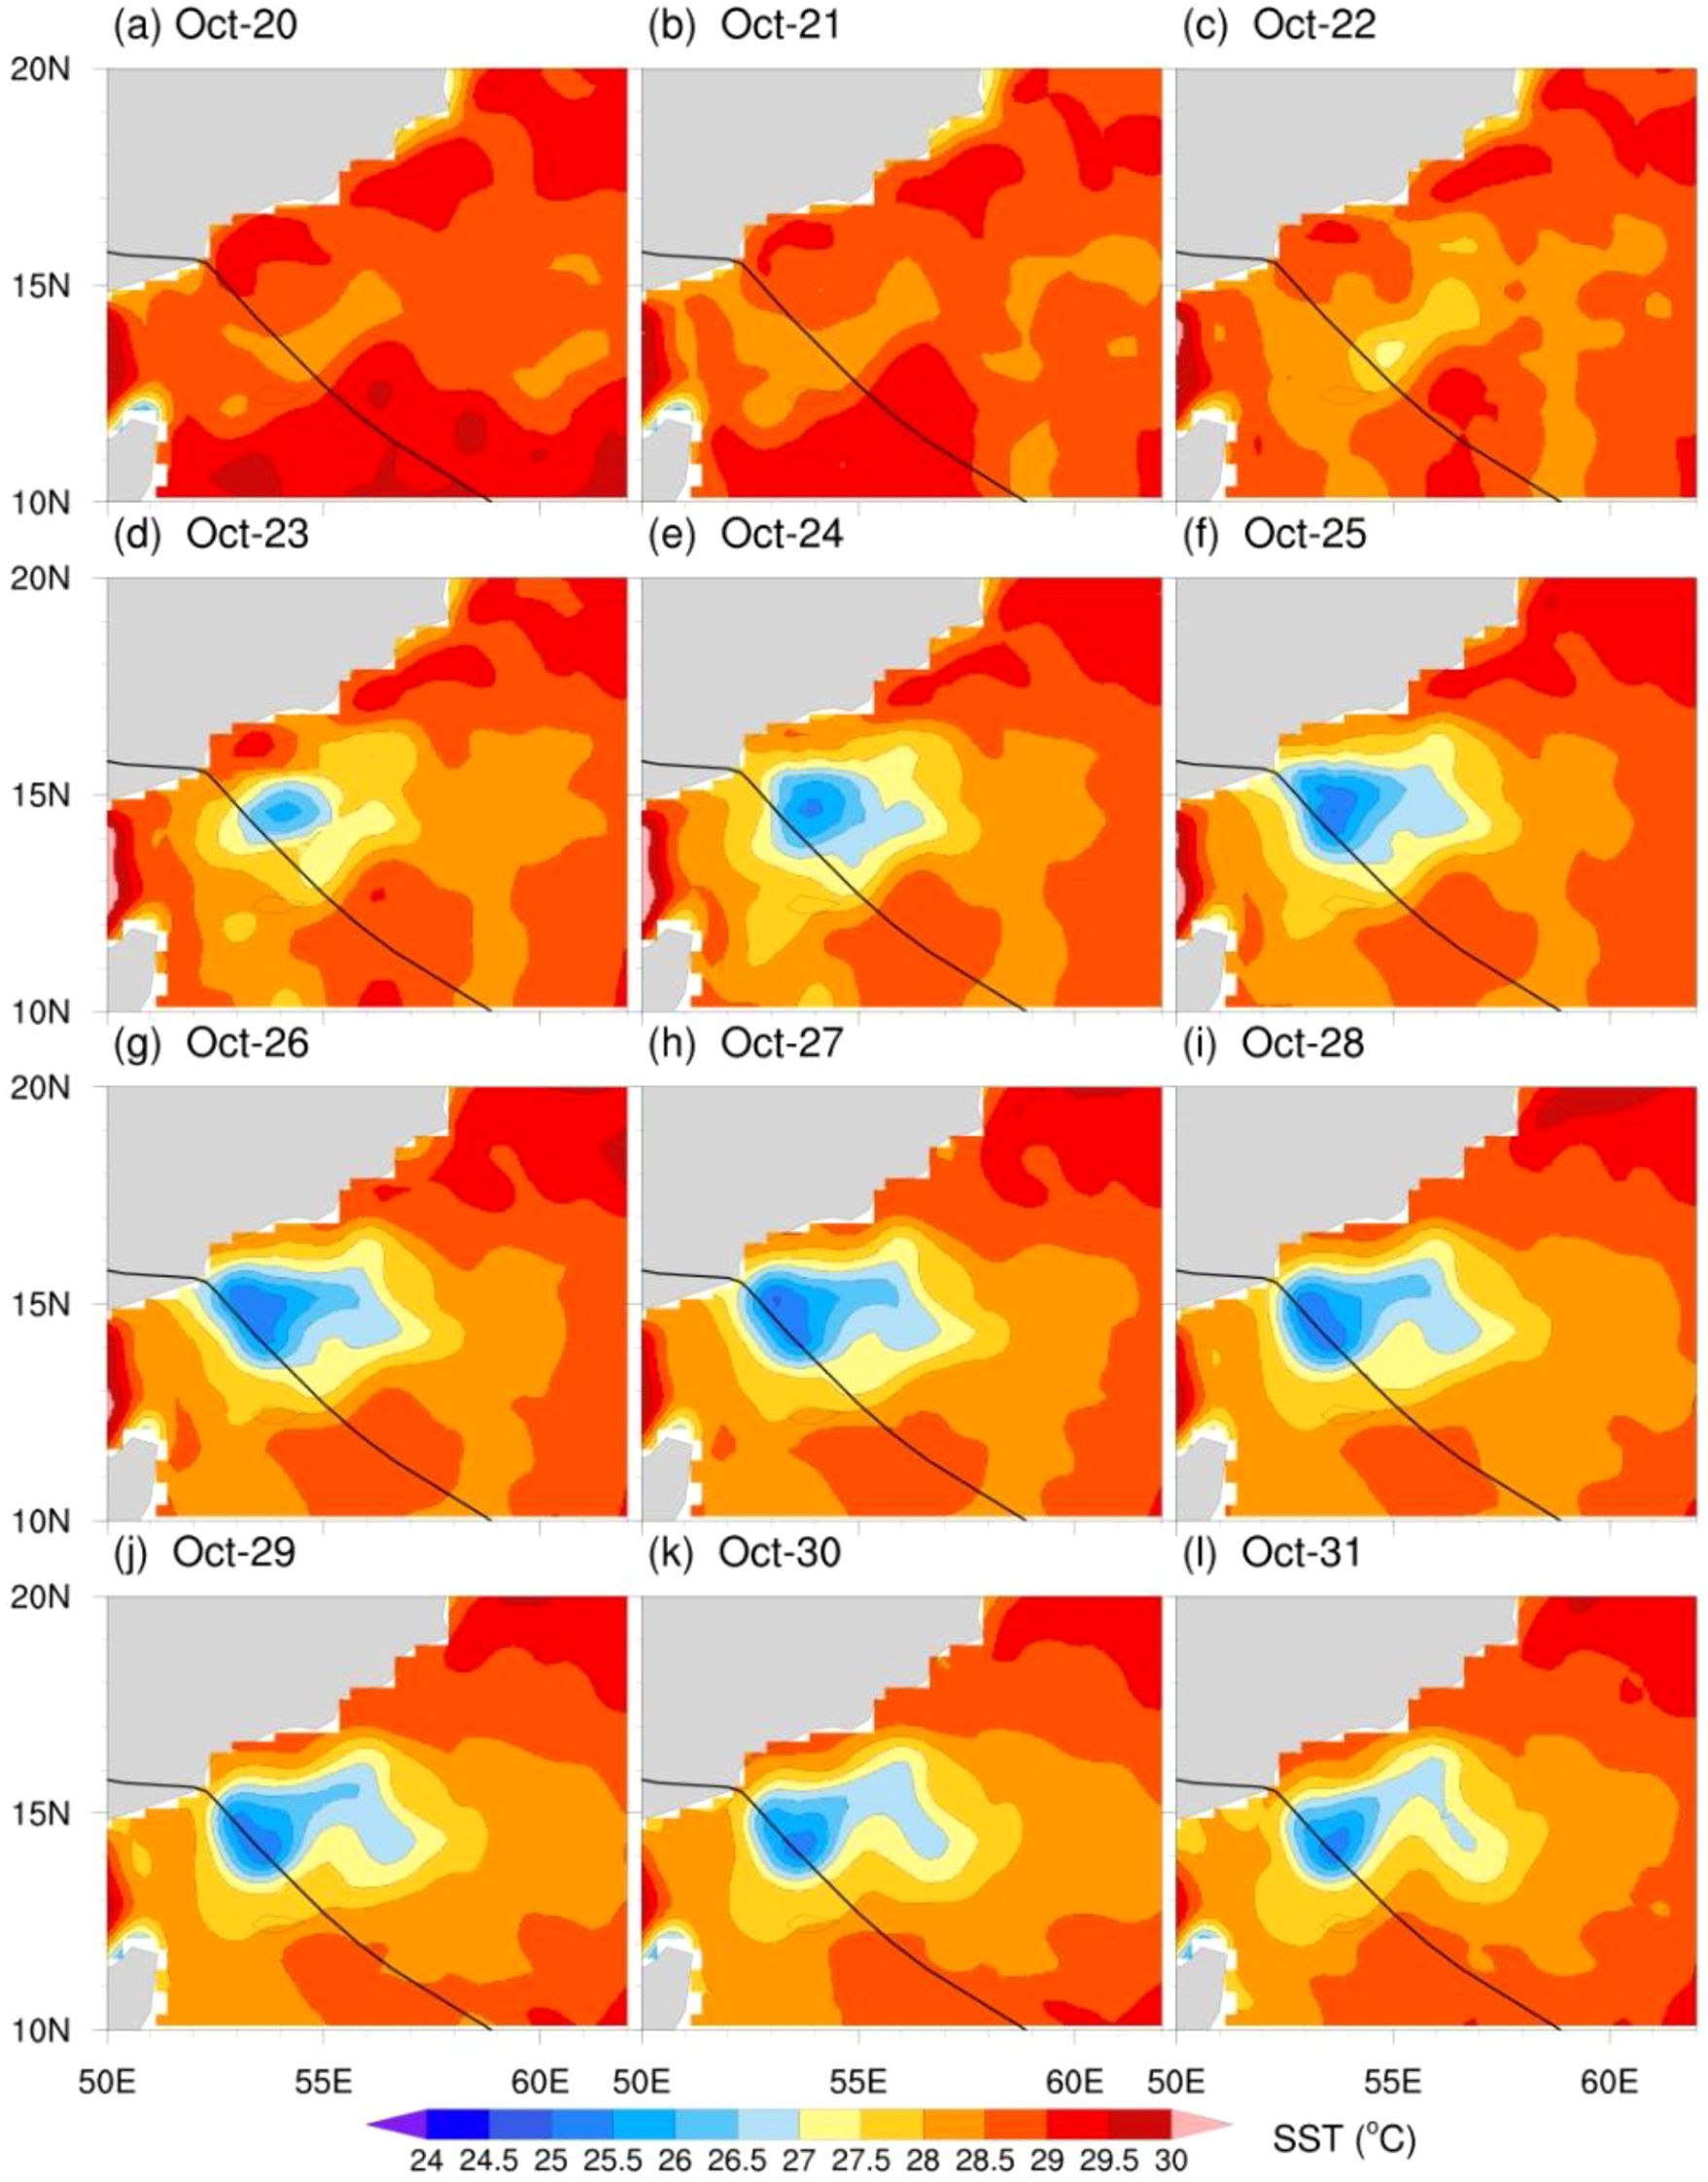
Figure 2. Impact of TC Tej on SST (°C) variation before, during, and after the cyclone in October 2023 in the Arabian Peninsula (a-l). The black line represents the cyclone track.
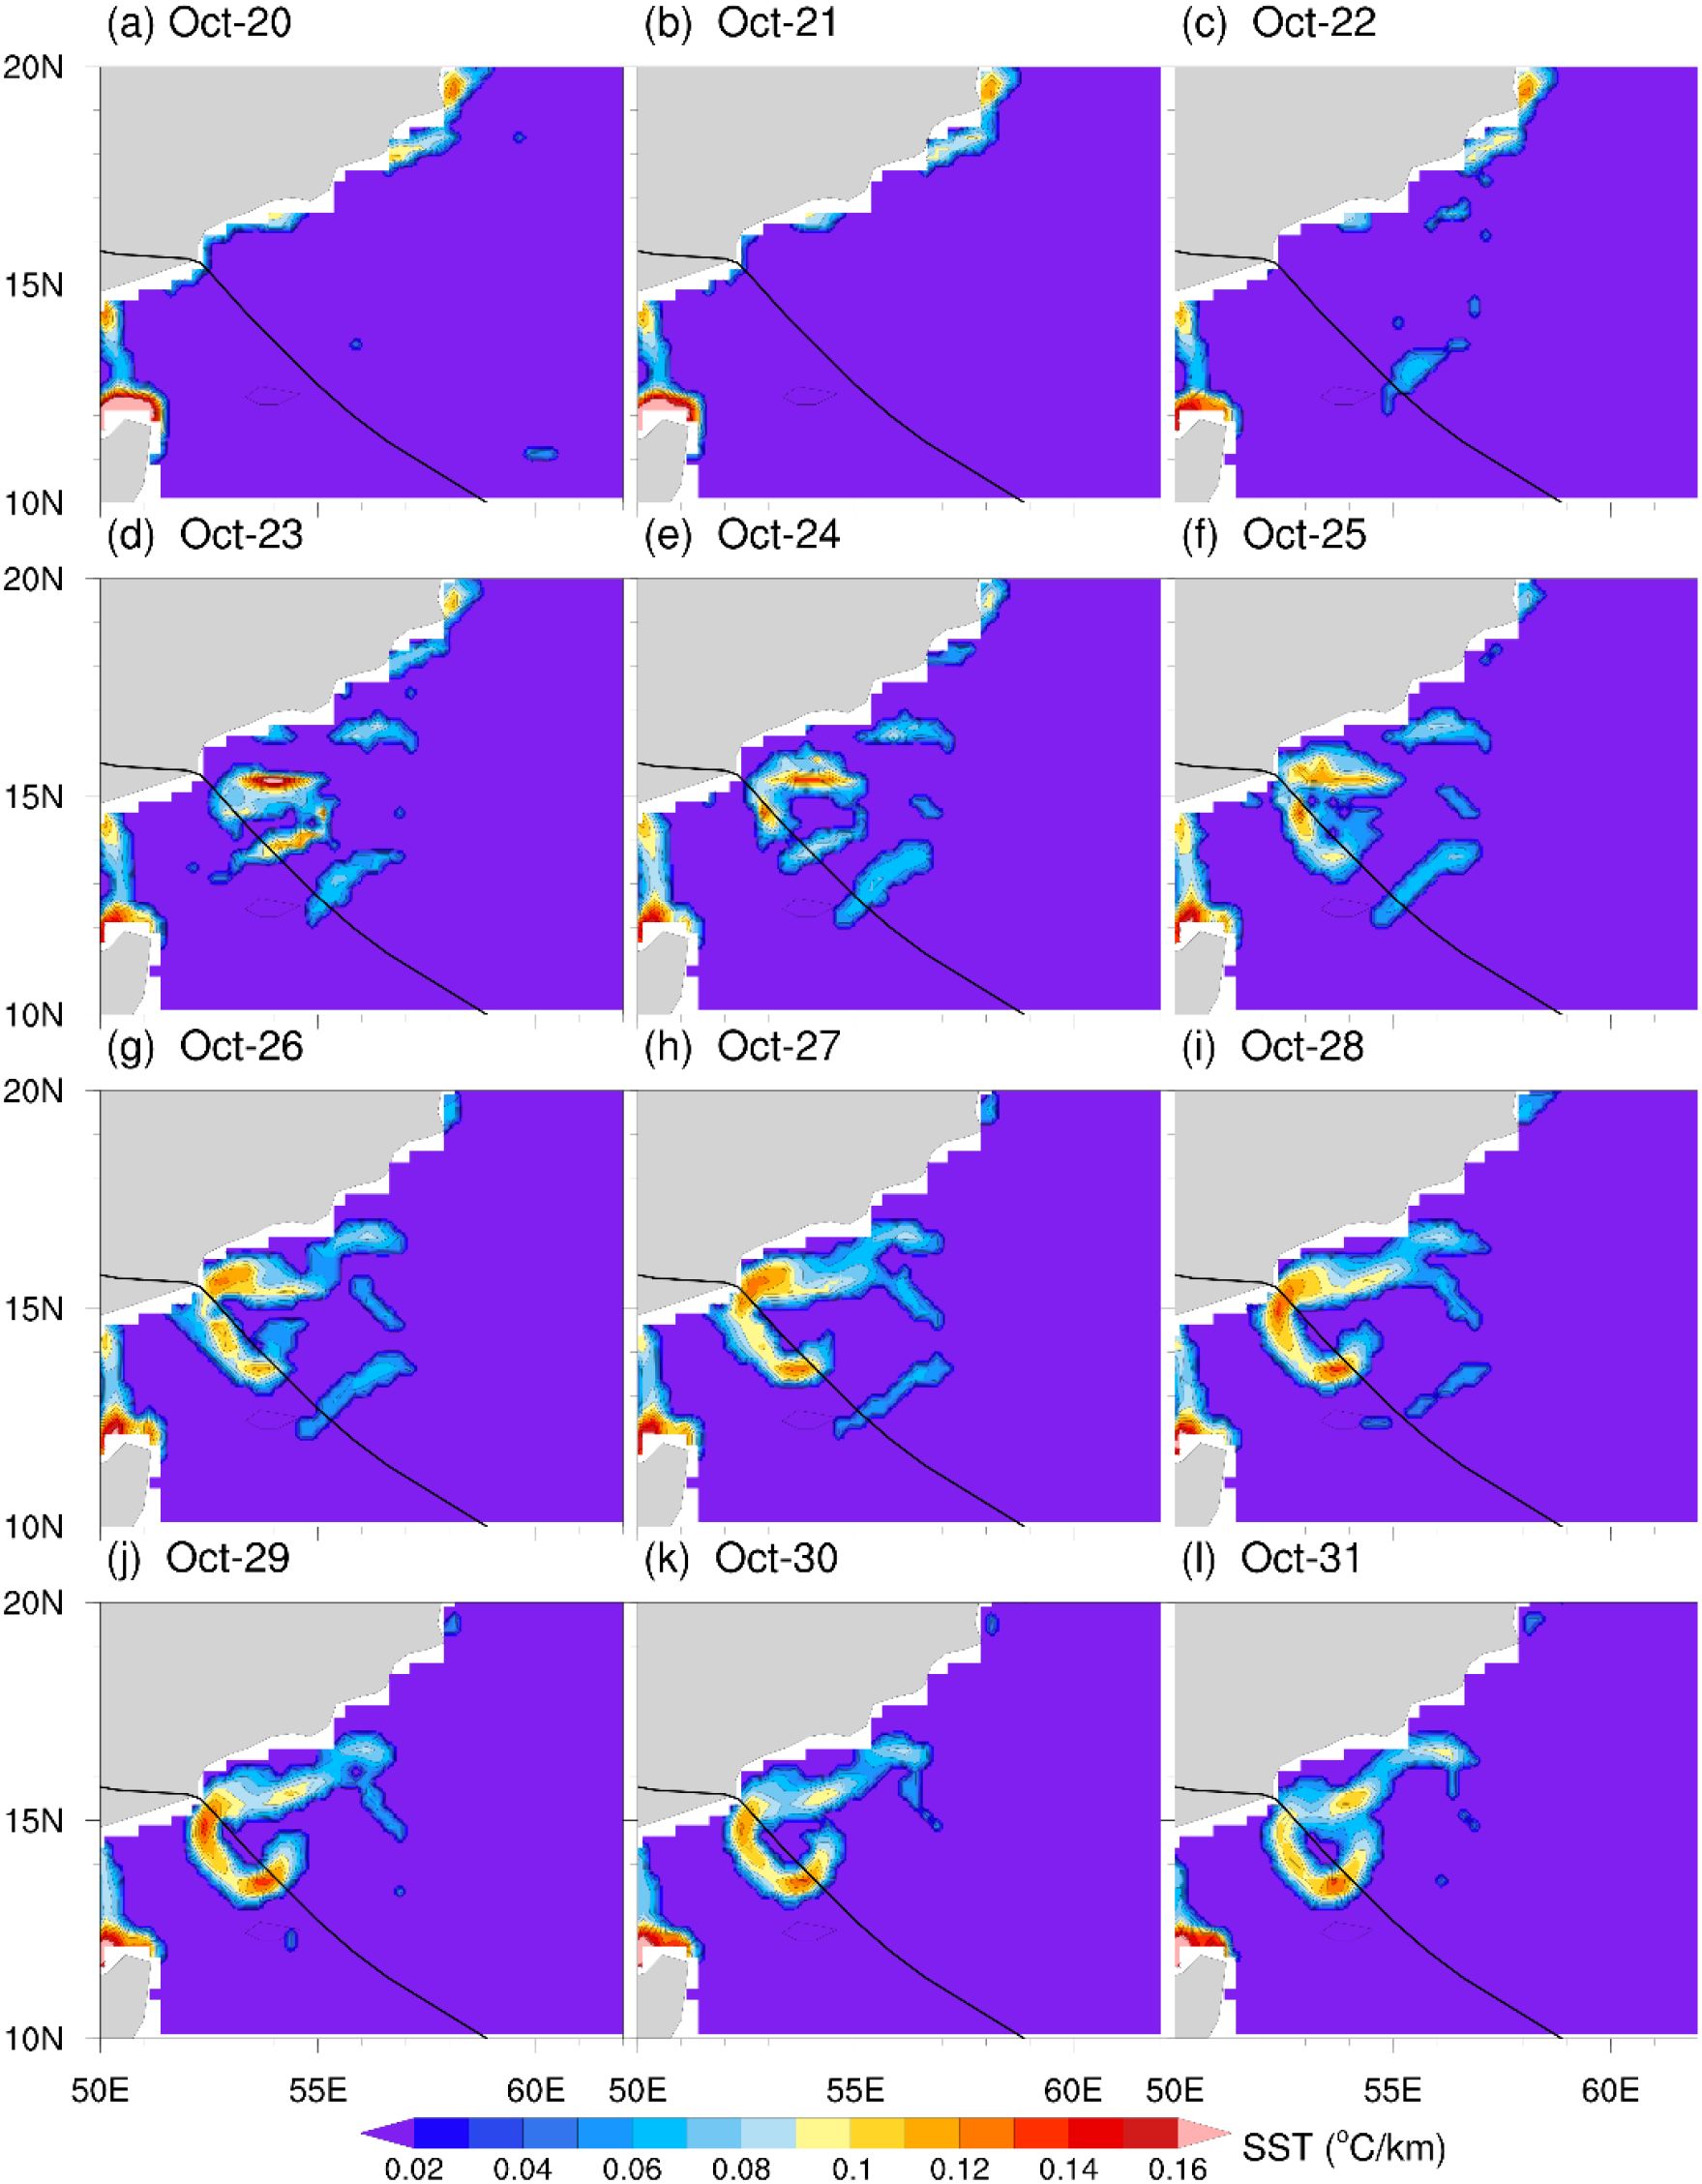
Figure 3. TC impact on SST GM (°C/km) during the cyclone in October 2023 in the Arabian Peninsula (a-l). The black line represents the cyclone track.
3.3 Sea surface height
During the initial and high-intensity phase of the cyclone from October 20 to 23, the formation of both cyclonic and anticyclonic eddies driven by oceanic currents was evident (Figure 4). Notably, low SSH values (< 0.05 m) were detected at or near the prominent cyclonic eddy around 12°N, 56°E. In contrast, high SSH values exceeding 0.8 m were observed within the anticyclonic eddy situated around 15°N, 55°E. From October 23 to 25, the anticyclonic eddy remained prominent but began to shift slightly eastward. Simultaneously, the cyclonic eddy also shifted slightly and intensified, with lower SSH values indicating stronger upwelling and mixing. Between October 26 and 28, the anticyclonic eddy became more elongated and continued to move eastward, while the cyclonic eddy maintained its position with slight changes in shape and intensity. From October 29 to 31, the anticyclonic eddy weakened and dispersed, whereas the cyclonic eddy persisted, showing slight movement to the north. The low SSH values within the cyclonic eddy region indicate upwelling and mixing due to strong ocean currents (Figure 4). The depressed SSH values (<0.05 m) (Figure 4) are indicative of Ekman pumping-driven upwelling (vertical velocities ~2.4 × 10⁻⁴ m/s) and geostrophic adjustment of the surface layer. Calculated Rossby numbers ranging from 0.8-1.2 suggest notable ageostrophic flow. In contrast, the high SSH values associated with the anticyclonic eddy reflect downwelling, where water converges and is pushed downward, often resulting in warmer, nutrient-poor surface layers. Conversely, the upwelling linked with low SSH in the cyclonic eddy region brings cooler, nutrient-rich water to the surface, enhancing primary productivity and supporting marine life. Additionally, a few other low-intensity cyclonic and anticyclonic eddies formed during this period, with minimal impact on upwelling and downwelling processes (Figure 4).
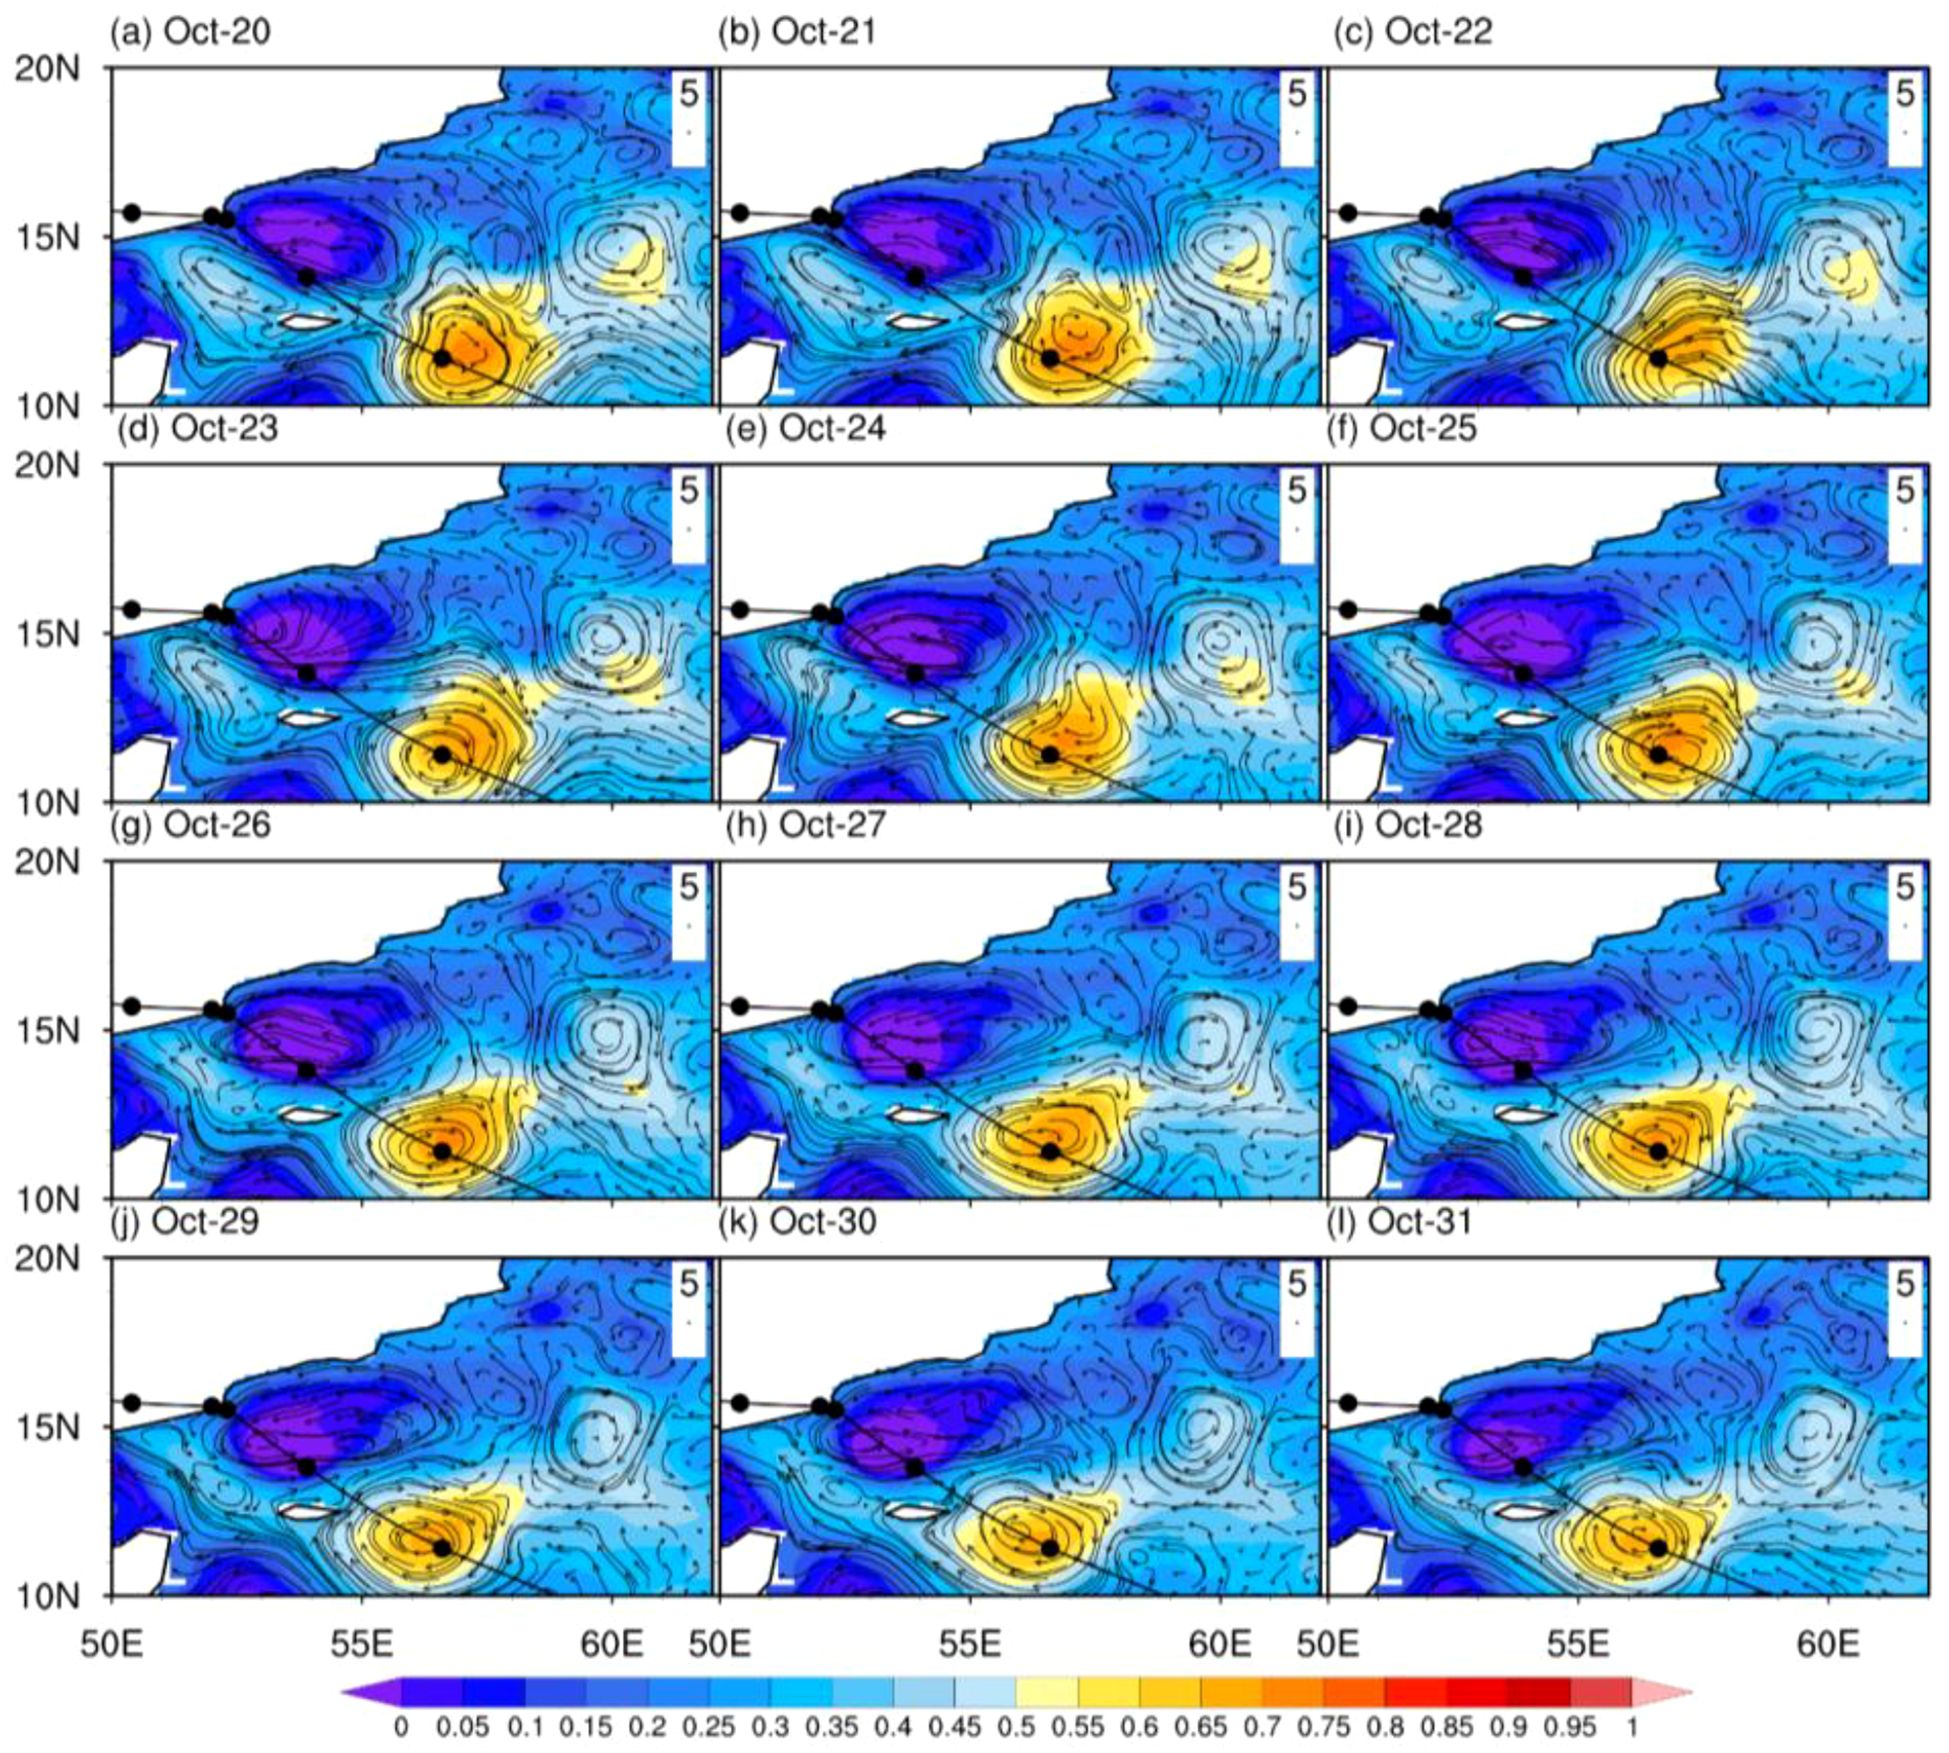
Figure 4. Sea surface height (m) and cyclonic and anticyclonic eddies, black line represents the cyclone track, contour lines represent ocean currents (➔: m/s) during TC Tej in October 2023 in the Arabian Peninsula (a-l).
3.4 Wind stress curl (N/m3) and surface winds (m/s)
The analysis of WSC and SW during the cyclone period reveals distinct variations across different cyclone states (Figure 5). During the intensification phase (October 20-23), WSC values exceeded 0.2 N/m³ (Figure 5), indicating strong cyclonic wind forcing capable of generating oceanic eddies. These peak WSC values reflect intense cyclonic wind stress, driving three key oceanic responses. Simultaneously, surface winds intensified and exhibited a well-defined cyclonic circulation pattern, with winds converging toward the cyclone center. After the cyclone passed, both WSC values and surface wind speeds declines, returning to pre-cyclone conditions (Figure 5). TC Tej generated Ekman suction velocities exceeding 2×10⁻⁴ m/s (Supplementary Figure S1), with the strongest effects observed along the cyclone’s right flank (12°–14°N, 55°–57°E), consistent with SST cooling and elevated Chl-a concentrations (Figures 1–2). Concurrently, the mixed layer depth (MLD) deepened by 40–50 m in these regions (Supplementary Figure S2), while net heat flux dropped to −100 W/m² (Supplementary Figure S3), indicating that wind-driven mixing and atmospheric cooling together contributed to upper-ocean perturbations.
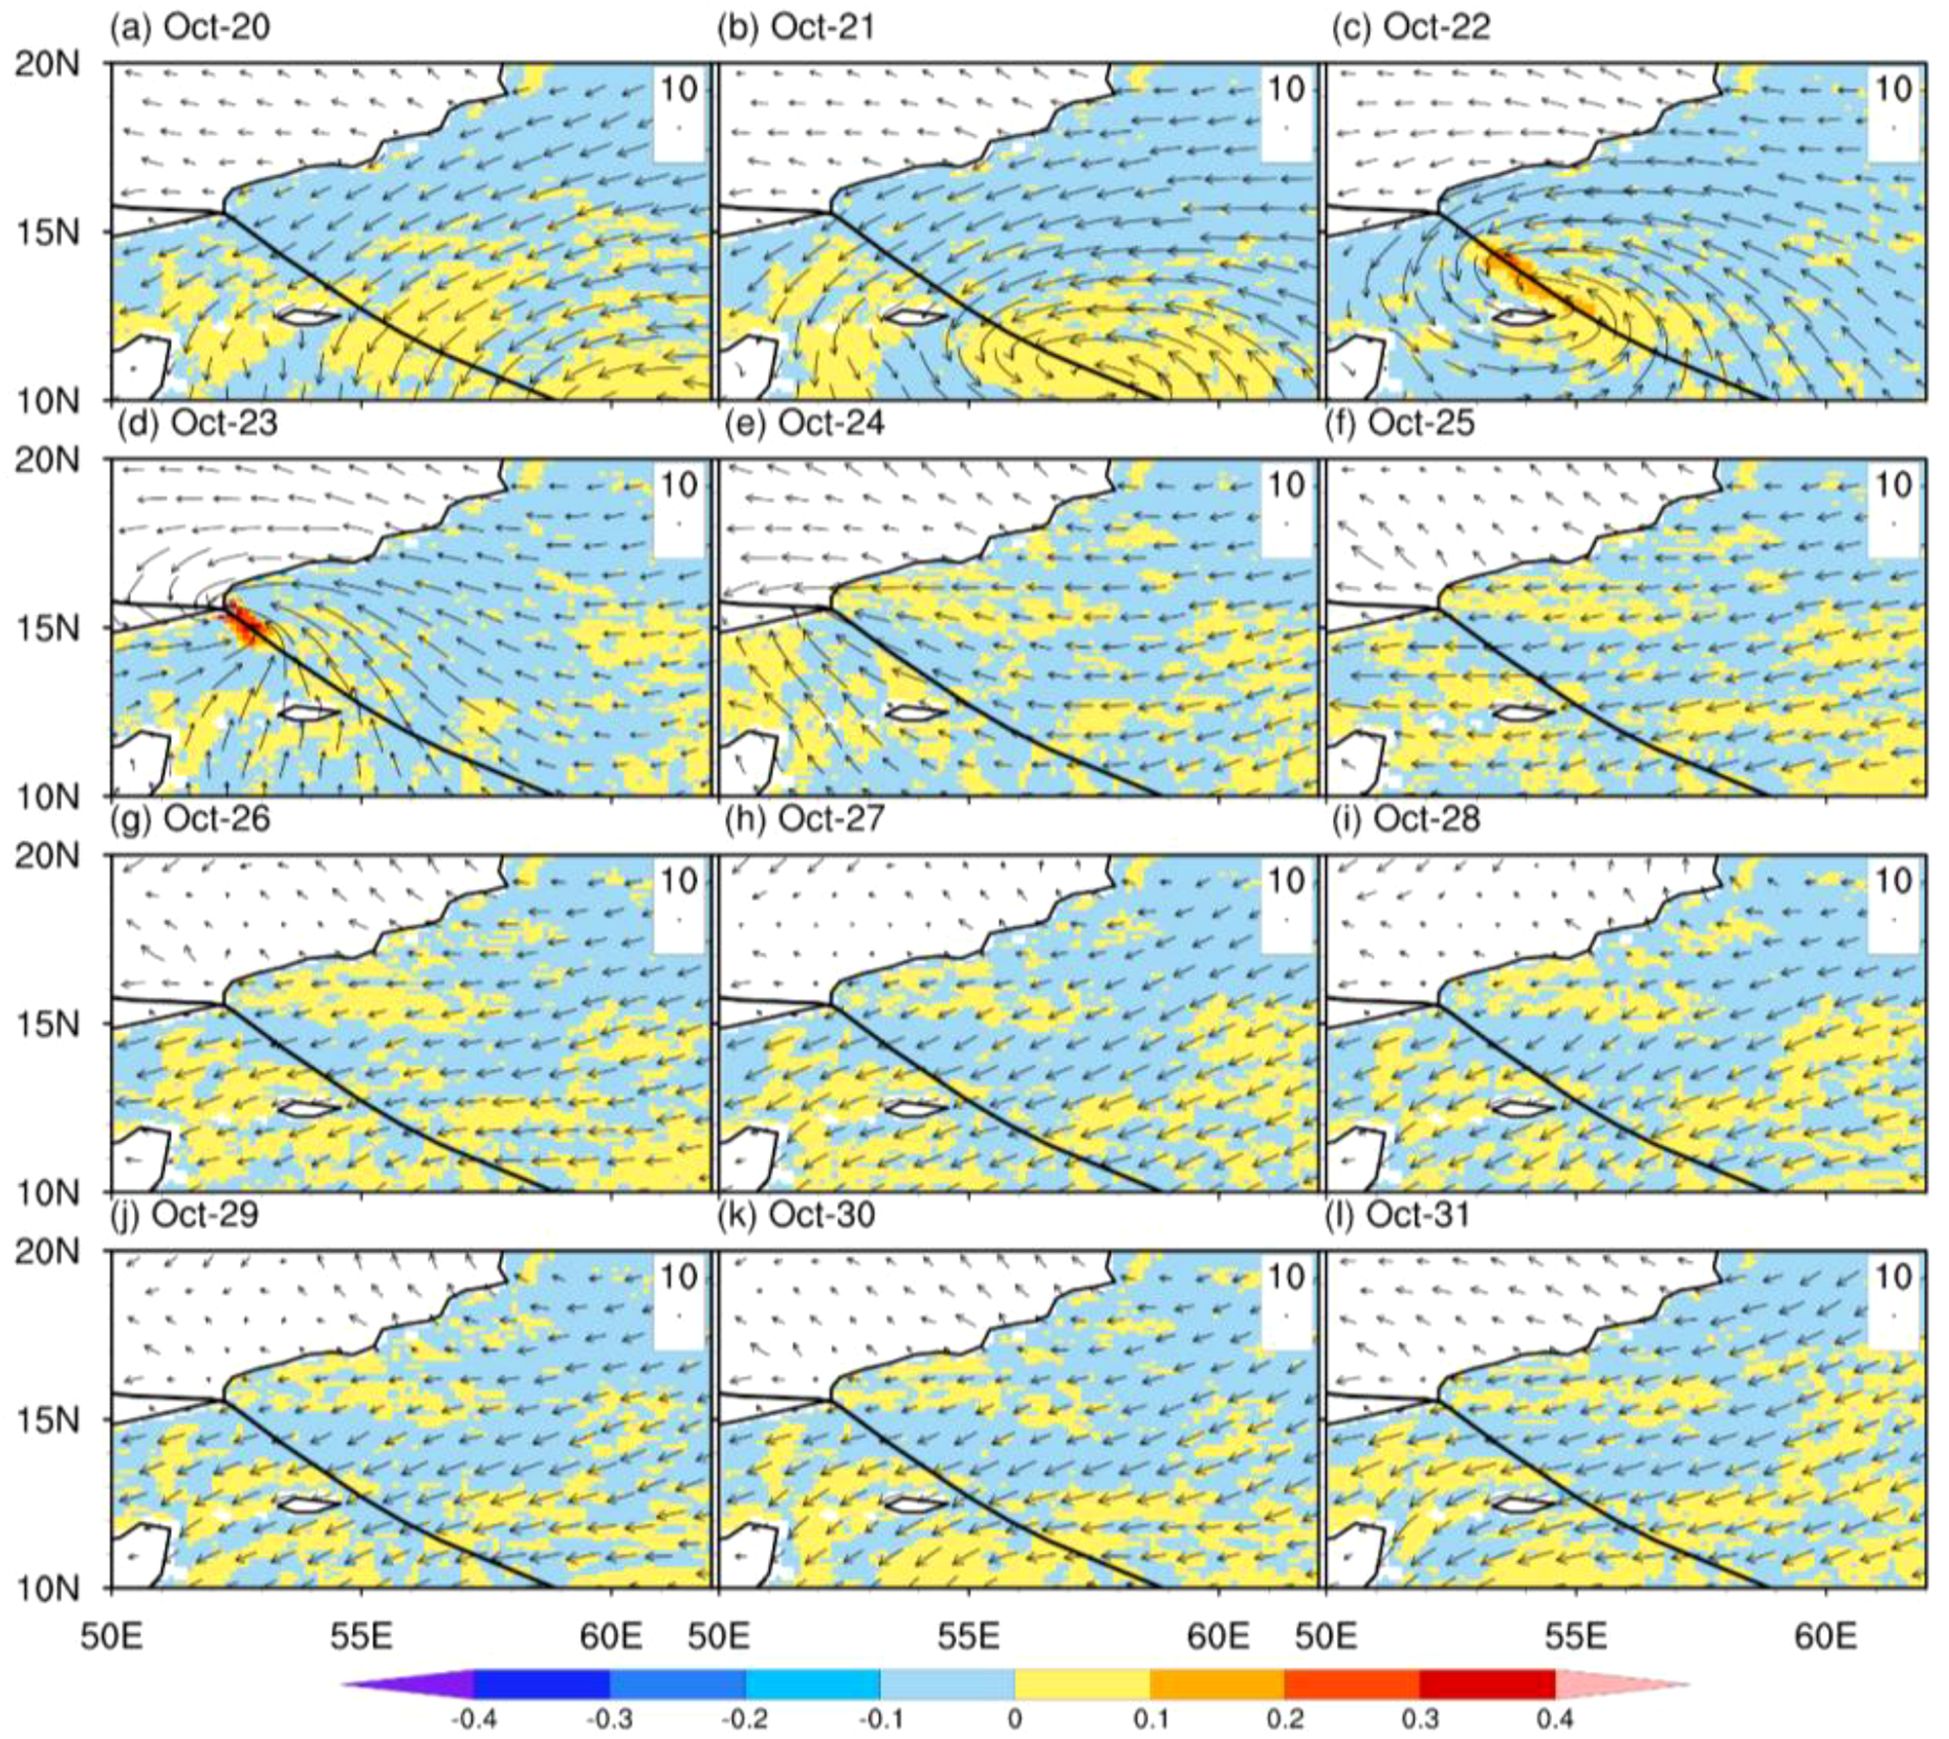
Figure 5. Wind stress curl (WSC) (N/m3), and surface winds (SW;➔: m/s) before, during, and after the TC Tej in the Arabian Peninsula (a-l). The black line represents the cyclone track. Contours represent winds (m/s).
3.5 Surface and vertical profile
The passage of TC Tej significantly impacted the surface and vertical profiles of various oceanic parameters, including temperature, Chl-a, nitrate, phosphate, dissolved inorganic carbon (DIC), and pH. These parameters were examined at different depths and over the days along the cyclone track, revealing notable changes, particularly in surface waters. The shaded color indicates the cyclonic eddy (13°N-16°N, 52°E-55°E), while contour lines indicate the anticyclonic eddy (10°N-13°N, 55°E-58°E) (Figure 6). A cyclonic eddy indicates an overall significant change in the oceanic upper environment. Before the cyclone’s peak intensity, surface temperatures exceeded 30°C, while deeper waters exhibited lower temperatures, below 26°C. During the cyclone, the upper layers (0–60 m) experienced a pronounced cooling, with temperatures dropping to between 26-28°C. Post-cyclone, while the upper layer temperatures began to stabilize, they remained cooler than pre-cyclone conditions, with values between 27°C and 28°C (Figure 6). The horizontal temperature patterns (Supplementary Figure S4) showed cooling of over 2°C along the cyclone path, indicating strong ocean-atmosphere interaction. Prior to the cyclone, Chl-a concentrations in the upper layers (0–10 m) were relatively low, ranging from 0.4 to 0.6 mg/m³, with higher values (~1.0 mg/m³) observed in the subsurface layers (40 m), based on CMEMS biogeochemical reanalysis data (Figure 6). During the cyclone, there was a prominent increase in Chl-a levels, particularly in upper layers (0–10 m), where concentrations reached up to 1.2 mg/m³. This suggests enhanced primary productivity driven by nutrient upwelling. After the cyclone’s passage, Chl-a levels remained elevated in the upper layers but gradually decreased, indicating a return to pre-cyclone levels (Figure 6). The surface Chl-a patterns (Supplementary Figure S5) showed enrichment exceeding 0.5 mg/m3 along the cyclone path, indicating an enhancement biological response to the storm. Before the cyclone, nitrate and phosphate concentrations in the upper layers were relatively low, ranging from 0–2 mmol/m³ and 0.6-1.2 mmol/m³, respectively. However, during the cyclone, nitrate concentration in the upper layers significantly increased to 2–8 mmol/m³ at 0–40 m depth, likely contributing to the observed increase in Chl-a levels. Similarly, phosphate levels in the surface and mid-layers increased slightly, reaching up to 1.5 mmol/m³, indicating nutrient upwelling similar to that observed with nitrate. Post-cyclone, both nitrate and phosphate levels gradually returned to pre-cyclone concentrations (Figure 6). The surface biogeochemical parameters provide robust validation that Figure 6 vertical patterns reflect genuine cyclone-driven upwelling. Temporally, surface nitrate (NO3) and phosphate (PO4) surges (> 6 mmol/m³ and >1.5 mmol/m³ respectively) first appear along the cyclone track (October 22-24) before expanding westward (October 26-28), matching the 36–48 hour delayed subsurface nutrient maxima at 40–60 m depth (Figure 6c-d; Supplementary Figure S6 – Supplementary Figure S7). Before the cyclone, DIC concentrations were higher in the deeper layers, around 2.2-2.3 mol/m³ at 40–200 m depth, and lower in the surface layers. During the cyclone, surface DIC concentrations increased slightly to approximately 2.1-2.2 mol/m³, suggesting mixing of carbon-rich deep waters with surface waters. After the cyclone, DIC levels in the upper layers remained slightly elevated but showed signs of stabilization toward the end of the observation period. Before the cyclone, pH values were higher in the surface layers (~8.1) and decreased with depth, reaching 7.6 at 200 m. During the cyclone, surface pH values decreased slightly (~7.8-8.0), likely reflecting increased CO2 uptake due to upwelling and enhanced biological activity. After the cyclone, pH values began to recover slightly, indicating a gradual return to pre-cyclone conditions. Spatially, surface DIC enrichment (2.1→2.2 mol/m³) and pH reduction closely correspond to physical indicators of upwelling, including sea surface cooling, cyclonic eddies (SSH < 0.05 m), and enhanced right-flank response consistent with Ekman pumping. Surface and subsurface signals are strongly coupled, exhibiting peak enrichment 2–3 days after the wind maximum, intensified gradients west of the track, and vertically coherent pH and DIC patterns indicating water-column-wide acidification driven by the upwelling of CO2-rich deep waters (Supplementary Figure S8 – Supplementary Figure S9). Overall, TC Tej induced significant oceanographic changes, particularly in the upper layers of the water column. There was a general trend of cooling, increased nutrient concentrations (nitrate and phosphate), and elevated Chl-a levels, all indicative of enhanced biological productivity. These changes were likely driven by cyclone-induced upwelling, which brought cooler, nutrient-rich waters to the surface. The effects of the cyclone gradually diminished after its passage, with most parameters trending back towards pre-cyclone conditions.
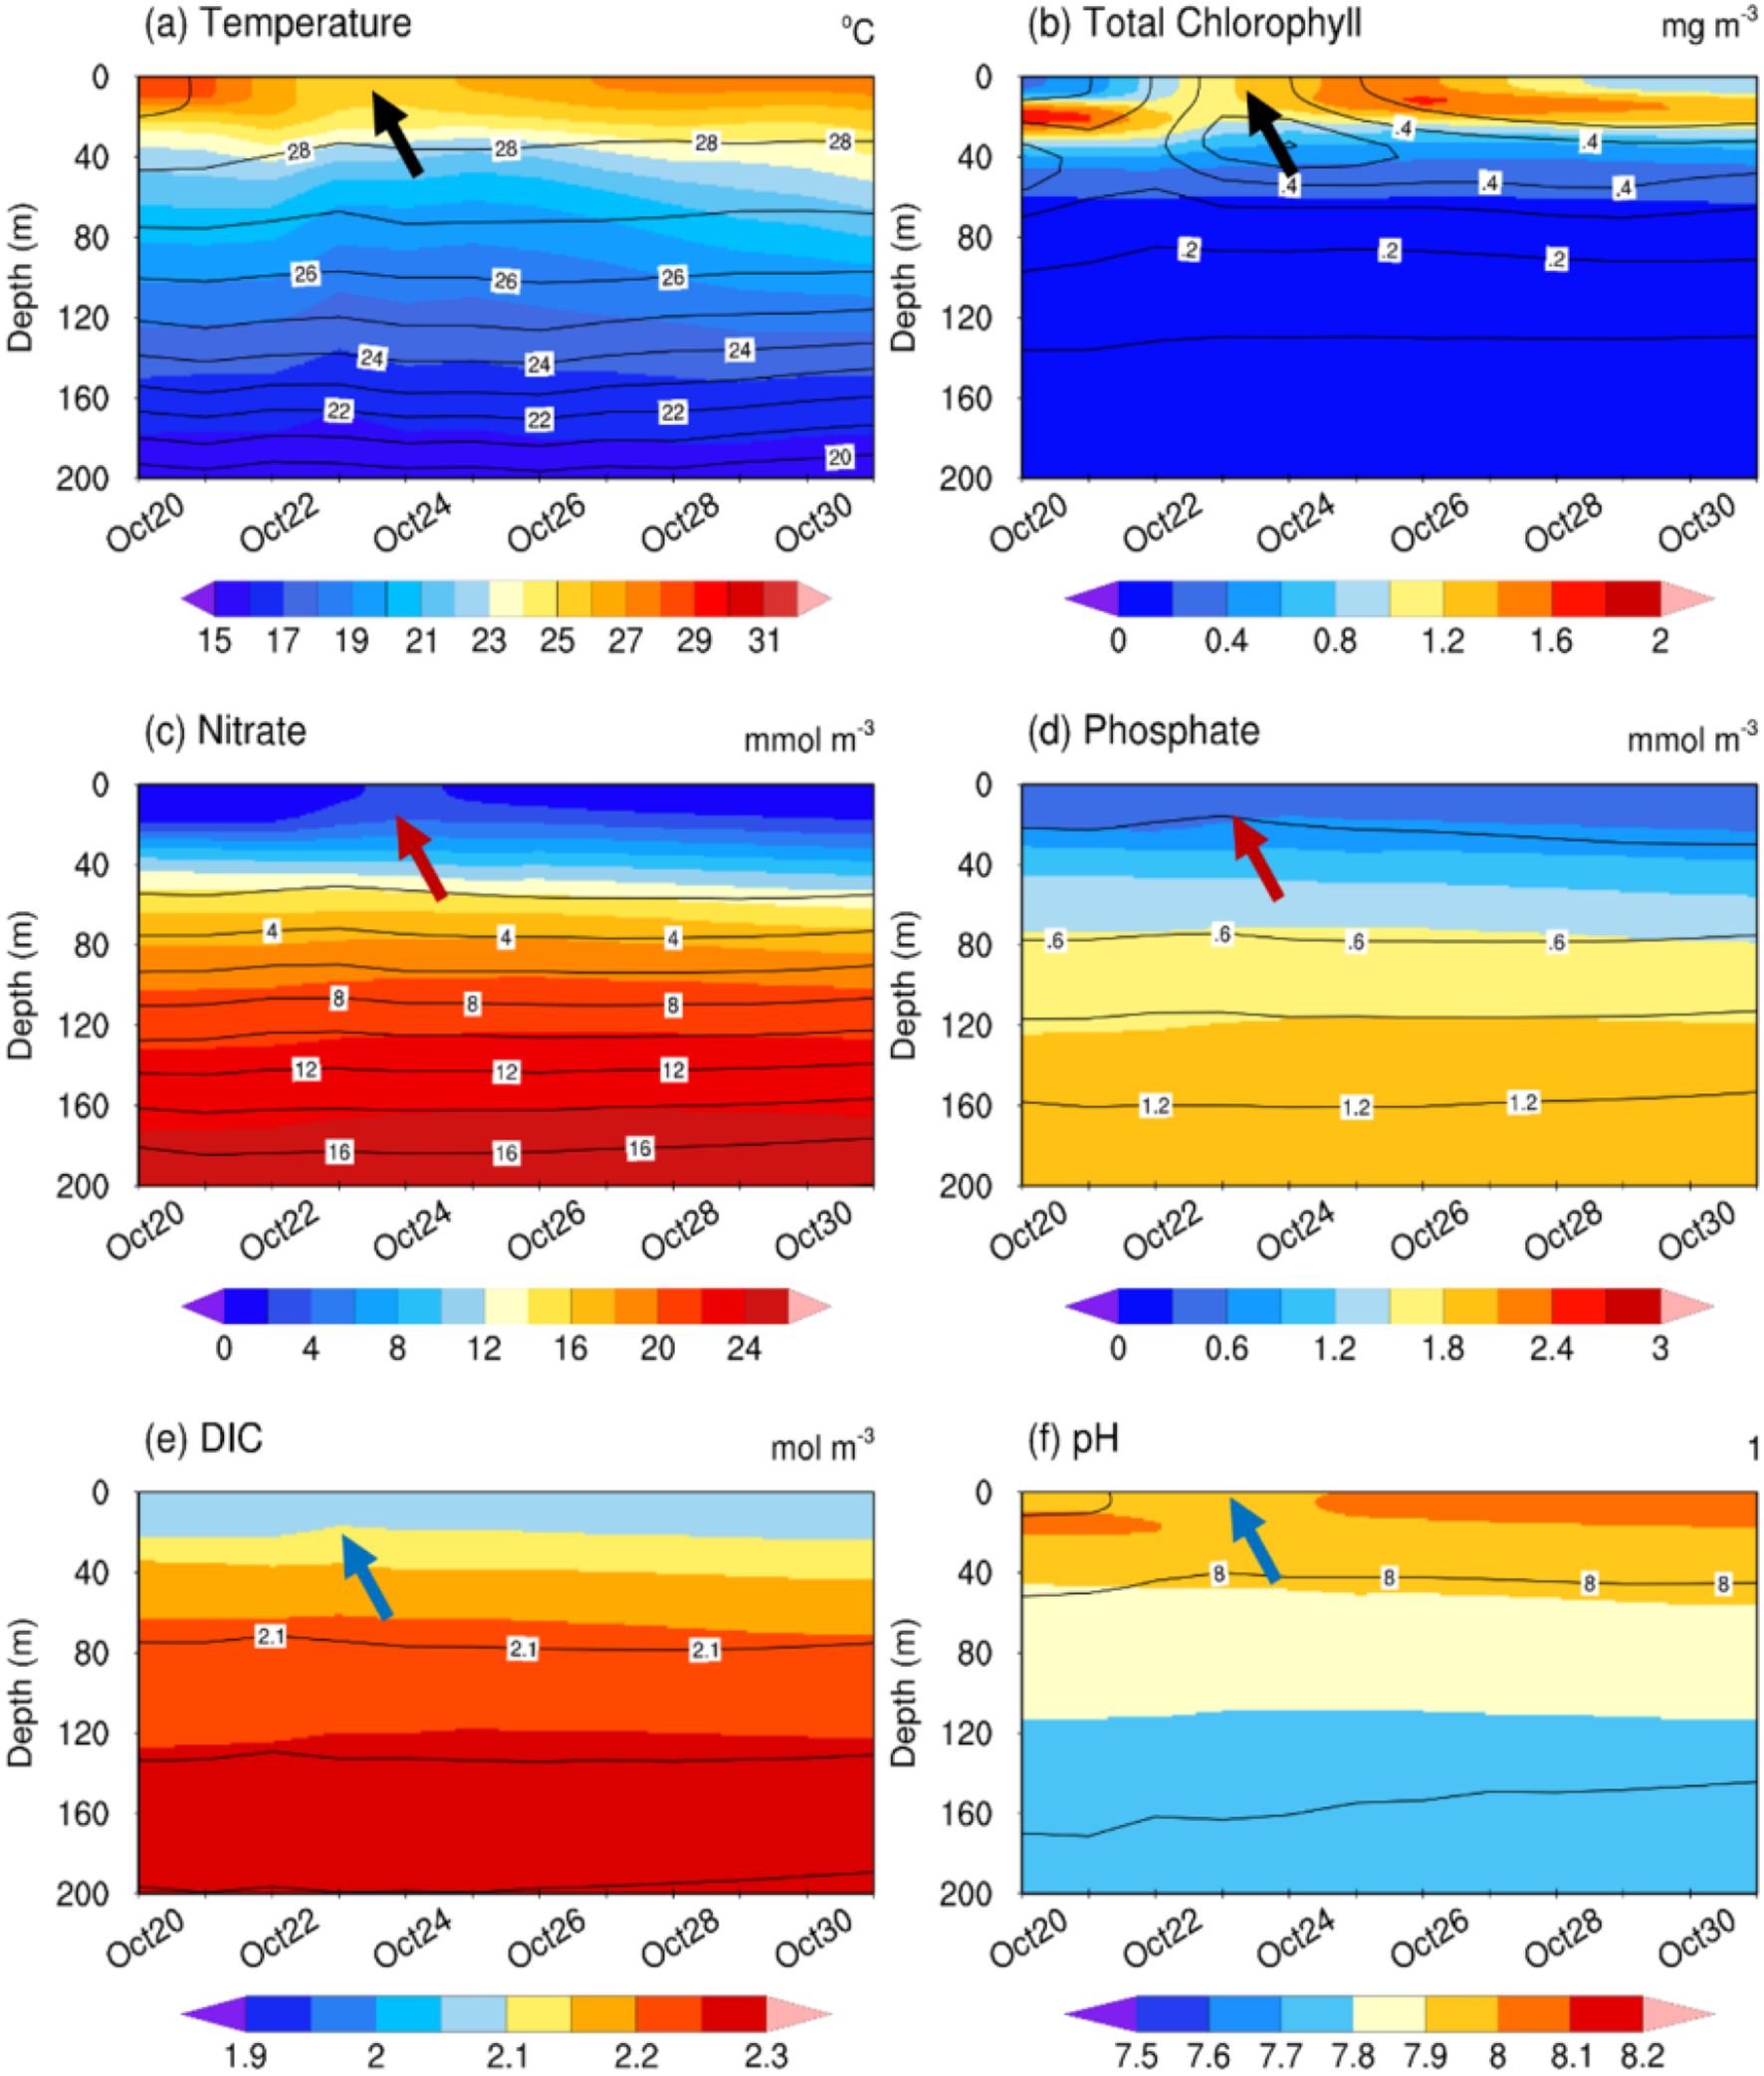
Figure 6. Vertical profile (0-200 meters) of (a) temperature (°C), (b) Total Chlorophyll-a (mg/m3), (c) Nitrate (mmol/m3), (d) phosphate (mmol/m3), (e) DIC (mol/m3), and (f) pH levels within the cyclone track during the TC Tej in the Arabian Peninsula. Arrows indicating the elevated oceanic conditions during the cyclone period. The shaded color indicates the cyclonic eddy (13°N-16°N, 52°E-55°E), while contour lines indicate the anticyclonic eddy (10°N-13°N, 55°E-58°E).
4 Discussion
TC Tej, which occurred from October 20 to October 25, 2023, had a pronounced influence on the oceanic conditions in the Arabian Peninsula, resulting in notable changes across various oceanic parameters. The cyclone influence was particularly evident in the SST, Chl-a concentrations, and nutrient dynamics, extending beyond surface changes to significantly impact the vertical profiles of these variables. The most striking surface changes were observed in SST, especially within the cyclonic eddies and on the right side of the cyclone track, where SST dropped by approximately 2.5°C to 4.0°C. Oceanic responses are notably pronounced on the right side of cyclone tracks, as documented in previous studies (Babin et al., 2004; Huang and Oey, 2015). This cooling, driven by cyclone-induced upwelling and vertical mixing, extended through upper layers of the ocean, with cooler temperatures observed down to a depth of 100 m. This vertical cooling is consistent with strong wind-induced mixing, which brought cooler, deeper water to the surface and redistributed heat content throughout the water column. It is estimated that around 80% of the observed SST decrease can be attributed to this upwelling mechanism (Sillmann et al., 2021). The extent of this cooling is also influenced by the cyclone strength and the duration of its persistence (Tory and Dare, 2015). The sharp SST GM in these areas highlights the spatial intensity of thermal changes caused by the cyclone, which has been similarly documented following previous TC events (Shenoi et al., 2002; Walker et al., 2005). The response of the upper ocean to TC Tej reflects a complex interplay of physical mechanisms that collectively drove significant biogeochemical changes. Strong Ekman pumping velocities (>0.5×10⁻⁴ m/s) (Supplementary Figure S1) were observed along the right-hand side of the cyclone track, particularly near cyclonic eddies, indicating enhanced localized upwelling. This mechanism accounts for the majority of SST cooling, aligned with earlier studies that attribute 70–80% of such cooling to Ekman dynamics (Girishkumar et al., 2014). Simultaneously, the mixed layer depth (MLD) deepened substantially up to 80–100 m, especially in regions directly impacted by the cyclone (Supplementary Figure S2). This deepening reflects intense wind-driven mixing that broke down thermal stratification and entrained nutrients from deeper layers, consistent with the timing and magnitude of the observed Chl-a bloom (Figure 6). Additionally, increased net heat loss at the ocean surface, with fluxes ranging from −150 to −100 W/m² (Supplementary Figure S3), further destabilized the upper ocean and reinforced vertical mixing. The spatial overlay among regions of deepened MLD, elevated Chl-a concentrations, strong upwelling, and pronounced SST cooling underscores a multi-process coupling between atmospheric forcing and oceanic response. These findings not only quantify the mechanisms involved but also strengthen and extend previous conceptual frameworks (Huang and Oey, 2015), offering event-specific evidence of how high-intensity, slow-moving tropical cyclones like Tej influence upper ocean structure and productivity.
The cyclone also caused a significant increase in surface Chl-a concentrations, with levels rising from an average of 0.5 mg/m3 to peaks of 6 mg/m3, particularly in regions affected by cyclonic eddies. The cyclonic eddies generally caused upwelling of subsurface rich nutrient water, increasing the Chl-a levels to the surface (He et al., 2020). This fourfold increase in Chl-a indicates a substantial enhancement of phytoplankton biomass, primarily driven by the upwelling of nutrient-rich subsurface waters. The vertical profiles of Chl-a further revealed that this increase extended down to the thermocline, with elevated concentrations observed up to 50 m below the surface. This vertical distribution of Chl-a is a clear response to the increased availability of nutrients such as nitrate and phosphate, which were upwelled from deeper waters into the euphotic zone, thereby fueling phytoplankton growth. This “fertilization effect” of cyclones has been consistently observed in various oceanic regions (Babin et al., 2004). This phenomenon occurs as upwelling transports nutrient-rich waters to the surface, subsequently boosting biological productivity, as observed in the Arabian Sea (Smitha et al., 2008; Tan et al., 2022). Previous research has also documented a similar pattern, where a rise in Chl-a was found following the passage of TC in different regions (Babin et al., 2004; Miller and Harding, 2007; Zhao et al., 2008; Chiang et al., 2011; Zhao et al., 2017; Chen et al., 2022), with a notable occurrence in the Indian Ocean region (Efendi et al., 2018; Aditya et al., 2021). TCs events trigger the upwelling of nutrient-rich subsurface waters, thereby boosting phytoplankton productivity in the Arabian Sea (Byju and Prasanna-Kumar, 2011; Lü et al., 2020; Kuttippurath et al., 2021). Similar phenomena were also found in different regions cyclone induce vertical mixing and upwelling can upwells cold, and rich nutrient waters to upper surface (Huang et al., 2017; Zhang et al., 2018). This process can after phytoplankton growth in the upper ocean (Babin et al., 2004; Sun et al., 2010). However, variations in Chl-a concentrations are highly contingent upon factors such as the timing of the cyclone, water depth, cyclone intensity, and the specific datasets analyzed (Parker et al., 2017; Kuttippurath et al., 2021). Typically, surface Chl-a tend to rise during, and after the passage of TCs (Zhao et al., 2015). However, not every TC event leads to increase in Chl-a levels (Lin et al., 2003; Lao et al., 2022). Occurrence of high Chl-a levels depends on whether the oceanic process initialed by TCs can enhance nutrient availability (Lao et al., 2022). It is significant to note, that more than 45% of typhoons do not result in elevated Chl-a concentrations (Pan et al., 2017a). Increased in Chl-a levels during the passage of cyclone Tej significantly indicating the importance of this cyclone on oceanic environment. TCs also impact on the regional dynamics and biogeochemical process (Robinson et al., 2007). The vertical profiles of pH and DIC also exhibited significant changes in response to cyclone Tej. Surface pH levels dropped slightly by about 0.05 to 0.1 units, indicating a mild acidification effect, while DIC concentrations increased by approximately 2.1-2.2 mol/m³ in the upper 100 m. These changes are likely a consequence of enhances CO2 absorption due to increased biological activity, as well as the upwelling of deeper, CO2-rich waters. Although, the acidification effect was modest, it is important to consider it as part of the broader impact of cyclones on ocean chemistry, particularly in relation to carbon cycling. These WSC and SW caused dynamic mixing, which cooled the upper ocean while inserting warm surface waters to deeper layers (Emanuel, 2001; Vincent et al., 2013; Chai et al., 2021). Rise in winds also cause the Ekman pumping which help to increase in Chl-a (Yang et al., 2012). The analysis of SSH provided additional insights into the vertical oceanic responses within the cyclonic and anticyclonic eddies. Cyclonic eddies were characterized by lower SST values, indicating upwelling and the associated transport of nutrients and CO2-rich waters to the surface. Conversely, anticyclonic eddies exhibited higher SSH values, suggesting downwelling and convergence of warmer, nutrient-poor waters, with less impact on the vertical distribution of these parameters. Therefore, vertical mixing serves as the primary mechanism responsible for altering the upper ocean characteristics beneath cyclones (Dare and McBride, 2011). The alignment of wind direction with wind-induced Ekman transport on the right side of the cyclone path (He et al., 2016), leads to more intense vertical mixing and the most significant SST cooling on the right side of the cyclone (Wang and Xiu, 2022). The lower SSH values with cyclonic eddies were strongly correlated with increased Chl-a concentrations and higher DIC levels, reinforcing the link between physical oceanographic processes and biological and chemical productivity. The vertical profiles used in this study are based on CMEMS biogeochemical reanalysis data, which carry uncertainties due to model resolution and interpolation, particularly under dynamic cyclone conditions. These limitations may affect the accuracy of fine-scale vertical variability. Thus, the results should be viewed as indicative of general patterns rather than precise values. Future validation using in-situ observations such as Argo float data, is recommended to validate and refine these findings.
TC Tej induced significant SST cooling, enhanced surface and subsurface Chl-a concentrations, and altered nutrient and chemical dynamics in the Arabian Peninsula Sea through mechanisms of upwelling and vertical mixing. The observed changes in pH, and DIC, coupled with spatial and vertical variability in oceanic responses, underscore the complex interactions between cyclonic activity and marine ecosystems. These findings contribute to the broader understanding of how TCs affect marine ecosystems, particularly in terms of primary productivity, nutrient cycling, and oceanic chemistry, and highlight the need for further research into the long-term ecological and biogeochemical impacts on such events in the region.
5 Conclusion
The impact of TC Tej on the Arabian Peninsula Sea was comprehensively analyzed using satellite remote sensing data, which provided critical insights into the cyclone’s effects on oceanographic conditions. The cyclone, occurring in October 2023, was associated with significant modifications in SST, SST GM, Chl-a concentrations, SSH, and various oceanic chemical parameters. Remote sensing observations revealed substantial cooling in SST, with reductions of up to 4°C in regions affected by the cyclone. This cooling was linked to enhance vertical mixing and upwelling processes induced by the cyclone. In particular, strong wind stress curl generated Ekman suction velocities exceeding 2×10⁻⁴ m/s along the right flank of the cyclone (12°–14°N, 55°–57°E), driving nutrient-enriched waters towards the surface and amplifying oceanic response. Satellite data also highlighted a marked increase in Chl-a concentrations, which rose from an average of 0.3 mg/m³ to peaks of 6 mg/m³. This increase reflects the cyclone’s role in stimulating primary productivity through the upwelling of nutrient-rich waters. Enhanced Chl-a levels were observed not only at the surface but also within the upper 50 meters of the water column, indicating widespread nutrient redistribution and subsequent phytoplankton growth. These biological responses were supported by physical oceanographic changes, including a deepening of the MLD by 40–50 m in the same regions, suggesting intensified upper-ocean mixing. Simultaneously, net heat flux dropped to -100 W/m2, highlighting the role of atmospheric cooling in reinforcing oceanic vertical exchange. In terms of ocean chemistry, the cyclone’s impact was evidenced by a slight decrease in surface pH (by 0.05 to 0.1 units) and an increase in DIC concentrations (by 5-10 µmol/kg). These changes are indicative of enhanced CO2 absorption and the upwelling of CO2-rich waters, which affect ocean acidification and carbon cycling processes. SSH data from satellite observations revealed the formation of cyclonic and anticyclonic eddies as a result of the cyclone. The low SSH at 0.05 m, was detected cyclonic eddy (12°N, 56°E), and high values exceeding 0.8 m were observed within the anticyclonic eddy (15°N, 55°E). Lower SSH values were associated with cyclonic eddies, which coincided with elevated Chl-a and DIC levels, while anticyclonic eddies showed relatively lesser impacts on nutrient dynamics. The formation of these eddies reflects the cyclone’s influence on ocean circulation patterns and its role in altering local marine conditions. Overall, the study demonstrates the significant influence of TC Tej on the marine environment, highlighting the effectiveness of satellite remote sensing in capturing these effects. The alterations in SST, Chl-a concentrations, Ekman pumping, MLD, heat flux, and oceanic chemistry underscore the cyclone’s role in reshaping oceanographic conditions and marine productivity. These findings contribute valuable insights into the broader implications of tropical cyclones on marine ecosystems, emphasizing the need for continued research into their impacts on regional fisheries and ocean health.
Data availability statement
The original contributions presented in the study are included in the article/Supplementary Material. Further inquiries can be directed to the corresponding authors.
Author contributions
VC: Funding acquisition, Resources, Supervision, Writing – review & editing. MK: Conceptualization, Data curation, Investigation, Methodology, Visualization, Writing – original draft, Writing – review & editing. MT: Methodology, Software, Validation, Visualization, Writing – review & editing. ZL: Conceptualization, Funding acquisition, Project administration, Resources, Supervision, Writing – review & editing. TS: Conceptualization, Data curation, Formal analysis, Investigation, Methodology, Software, Validation, Visualization, Writing – original draft, Writing – review & editing.
Funding
The author(s) declare financial support was received for the research and/or publication of this article. Present work is supported by Ningbo Institute of Digital Twin, Eastern Institute of Technology, Ningbo, China, and the Shandong University, Marine College, Weihai, China (202367800206).
Conflict of interest
The authors declare that the research was conducted in the absence of any commercial or financial relationships that could be construed as a potential conflict of interest.
Generative AI statement
The author(s) declare that no Generative AI was used in the creation of this manuscript.
Any alternative text (alt text) provided alongside figures in this article has been generated by Frontiers with the support of artificial intelligence and reasonable efforts have been made to ensure accuracy, including review by the authors wherever possible. If you identify any issues, please contact us.
Publisher’s note
All claims expressed in this article are solely those of the authors and do not necessarily represent those of their affiliated organizations, or those of the publisher, the editors and the reviewers. Any product that may be evaluated in this article, or claim that may be made by its manufacturer, is not guaranteed or endorsed by the publisher.
Supplementary material
The Supplementary Material for this article can be found online at: https://www.frontiersin.org/articles/10.3389/fmars.2025.1575203/full#supplementary-material
References
Aditya H. N., Wirasatriya A., Kunarso-Ismunarti D. H., Yusuf M., Rifai A., Purwanto Ismanto A., et al. (2021). Impact of tropical cyclones Cempaka and Dahlia to the variability of chlorophyll-a and sea surface temperature in the seas southern coast of Java Island. Ecol. Environ. Cnsev. 27, 379–387. Available online at: chrome-extension://efaidnbmnnnibpcajpcglclefindmkaj/https://www.envirobiotechjournals.com/EEC/27augsuppl2021/EEC-59.pdf
Al-Hashmi K. A., Sarma Y. V. B., Piontkovski S., Harrison P. J., and AL-Habsi H. (2019). Response of phytoplankton to changes in hydrographic properties in a subtropical embayment in the Sea of Oman. Int. J. Environ. Sci. 45, 71–84. Available online at: chrome-extension://efaidnbmnnnibpcajpcglclefindmkaj/https://www.researchgate.net/profile/Khalid-Al-Hashmi-2/publication/332752127_Response_of_Phytoplankton_to_Changes_in_Hydrographic_Properties_in_A_Subtropical_Embayment_in_the_Sea_of_Oman_International_Journal_of_Ecology_and_Environmental_Sciences_Vol_45_No_1/links/5d75f3f74585151ee4a8c5d1/Response-of-Phytoplankton-to-Changes-in-Hydrographic-Properties-in-A-Subtropical-Embayment-in-the-Sea-of-Oman-International-Journal-of-Ecology-and-Environmental-Sciences-Vol-45-No-1.pdf
Azizpour J., Siadatmousavi S. M., and Chegini V. (2016). Measurement of tidal and residual currents in the Strait of Hormuz. Estuar. Coast. Shelf Sci. 178, 101–109. doi: 10.1016/j.ecss.2016.06.004
Babin S. M., Carton J. A., Dickey T. D., and Wiggert J. D. (2004). Satellite evidence of hurricane-induced phytoplankton blooms in an oceanic desert. J. Geophys. Res. Ocean. 109, C03043. doi: 10.1029/2003JC001938
Bakhtiar M., Mazyak R. A., and Khosravi M. (2020). Ocean circulation to blame for red tide outbreak in the Persian Gulf and the sea of Oman. Int. J. Marit. Technol. 13, 31–39. Available online at: http://ijmt.ir/article-1-664-en.html. (Accessed June 6, 2020).
Banks J. R., Brindley H. E., Stenchikov G., and Schepanski K. (2017). Satellite retrievals of dust aerosol over the Red Sea and the Persian Gul–2015). Atmos. Chem. Phys. 17, 3987–4003. doi: 10.5194/acp-17-3987-2017
Belkin I. M. and O’Reilly J. E. (2009). An algorithm for oceanic front detection in chlorophyll and SST satellite imagery. J. Mar. Syst. 78, 319–326. doi: 10.1016/j.jmarsys.2008.11.018
Böhm E., Morrison J., Manghnani V., Kim H. S., and Flagg C. (1999). The Ras Al Hadd Jet: remotely sensed and acoustic Doppler current profiler observations in 1994–1995. Deep Sea Res. Part II Top. Stud. Oceanogr. 46, 1531–1549. doi: 10.1016/S0967-0645(99)00034-X
Bordbar M. H., Pedram M., and Hassanzadeh S. (2014). Behaviour of surface atmospheric flow passing over the northeast of the Persian Gulf. Meteorol. Appl. 21, 271–277. doi: 10.1002/met.1325
Byju P. and Prasanna-Kumar S. (2011). Physical and biological response of the Arabian Sea to tropical cyclone Phyan and its implications. Mar. Environ. Res. 71, 325–330. doi: 10.1016/j.marenvres.2011.02.008
Chai F., Wang Y., Xing X., Yan Y., Xue H., Wells M., et al. (2021). A limited effect of sub-tropical typhoons on phytoplankton dynamics. Biogeosciences 18, 849–859. doi: 10.5194/bg-18-849-2021
Chen X. Y., Pan D. L., Bai Y., He X. Q., Chen C. T. A., Kang Y., et al. (2015). Estimation of typhoon-enhanced primary production in the South China sea: a comparison with the Western North pacific. Cont. Shelf Res. 111, 286–293. doi: 10.1016/j.csr.2015.10.003
Chen Y., Ren C., Feng Y., Shi H., Pan G., Cooper M., et al. (2022). Different responses of chlorophyll a to the passage of the tropical storm wiph) in the coastal waters of the northern beibu gulf. Front. Mar. Sci. 9, 887240. doi: 10.3389/fmars.2022.887240
Chiang T. L., Wu C. R., and Oey L. Y. (2011). Typhoon kai-tak: an ocean’s perfect storm. J. Phys. Oceanogr. 41, 221–233. doi: 10.1175/2010JPO4518.1
Chinta V., Kalhoro M. A., Liang Z., Tahir M., Song G., and Zhang W. (2024). Decadal climate variability of chlorophyll-a in response to different oceanic factors in the Western Indian Ocean: The Sea of Oman. Clim. Dyn. 62, 8675–8690. doi: 10.1007/s00382-024-07354-4
Dare R. A. and McBride J. L. (2011). Sea surface temperature response to tropical cyclones. Mon. Weather Rev. 139, 3798–3808. doi: 10.1175/MWR-D-10-05019.1
Deshpande M., Singh V. K., Ganadhi M. K., Roxy M. K., Emmanuel R., Kumar U., et al. (2021). Changing status of tropical cyclones over the north Indian Ocean. Clim. Dyn. 57, 3545–3567. doi: 10.1007/s00382-021-05880-z
Efendi U., Fadlan A., and Hidayat A. M. (2018). Chlorophyll-a variability in the southern coast of Java Island, Indian Ocean: corresponding to the tropical cyclone of Ernie. In IOP Conference Series: Earth and Environmental Science. IOP Publishing 162, 1–12. doi: 10.1088/1755-1315/162/1/012035
Emanuel K. (2001). Contribution of tropical cyclones to meridional heat transport by the oceans. J. Geophys. Res. 106, 14771–14781. doi: 10.1029/2000jd900641
Emanuel K. A. (2013). Downscaling CMIP5 climate models shows increased tropical cyclone activity over the 21st century. Proc. Natl. Acad. Sci. 110, 12219–12224. doi: 10.1073/pnas.1301293110
Evan A. T. and Camargo S. J. (2011). A climatology of Arabian Sea cyclonic storms. J. Clim. 24, 140–158. doi: 10.1175/2010JCLI3611.1
Falkowski P. G. (1994). The role of phytoplankton photosynthesis in global biogeochemical cycles. Photosynth. Res. 39, 235–258. doi: 10.1007/BF00014586
Foltz G. R., Balaguru K., and Leung L. R. (2015). A reassessment of the integrated impact of tropical cyclones on surface chlorophyll in the western subtropical North Atlantic. Geophys. Res. Lett. 42, 1158–1164. doi: 10.1002/2015GL063222
Ghafarian P., Kabiri K., Delju A. H., and Fallahi M. (2022). Spatio-temporal variability of dust events in the northern Persian Gulf from 1991 to 2020. Atmos. pollut. Res. 13, 101357. doi: 10.1016/j.apr.2022.101357
Girishkumar M. S., Suprit K., Chiranjivi J., Bhaskar T. V. S. U., Ravichandran M., Shesu R. V., et al. (2014). Observed oceanic response to tropical cyclone Jal from a moored buoy in the south-western Bay of Bengal. Ocean Dyn. 64, 325–335. doi: 10.1007/s10236-014-0689-6
Good S., Fiedler E., Mao C., Martin M. J., Maycock A., Reid R., et al. (2020). The current configuration of the OSTIA system for operational production of foundation sea surface temperature and ice concentration analyses. Remote Sens. 12, 720. doi: 10.3390/rs12040720
He J., Chen Y., Wu J., Stow D. A., and Christakos G. (2020). Space-time chlorophyll-a retrieval in optically complex waters that accounts for remote sensing and modeling uncertainties and improves remote estimation accuracy. Water Res. 171, 115403. doi: 10.1016/j.watres.2019.115403
He Q., Zhan H., Cai S., and Li Z. (2016). Eddy effects on surface chlorophyll in the northern South China Sea: Mechanism investigation and temporal variability analysis. Deep Sea Res. Part I Oceanogr. Res. Pap. 112, 25–36. doi: 10.1016/j.dsr.2016.03.004
Huang S. M. and Oey L. Y. (2015). Right-side cooling and phytoplankton bloom in the wake of a tropical cyclone. J. Geophys. Res. Oceans. 120, 5735–5748. doi: 10.1002/2015JC010896
Huang L., Zhao H., Pan J., and Devlin A. (2017). Remote sensing observations of phytoplankton increases triggered by successive typhoons. Front. Earth Sci. 11, 1–8. doi: 10.1007/s11707-016-0608-x
Jing Z., Qi Y., Du Y., Zhang S., and Xie L. (2015). Summer upwelling and thermal fronts in the northwestern South China Sea: Observational analysis of two mesoscale mapping surveys. J. Geophys. Res. Ocean. 120, 1993–2006. doi: 10.1002/2014JC010601
Kalhoro M. A., Chinta V., de Mutsert K., Song G., Liu C., Tahir M., et al. (2024). Impact of tropical cyclone Biparjoy on oceanic parameters in the Arabian Sea. Mar. pollut. Bull. 208, 117046. doi: 10.1016/j.marpolbul.2024.117046
Kalhoro M. A., Chinta V., Tahir M., Liu C., Zhu L., Liang Z., et al. (2025). Assessing chlorophyll-a variability and its relationship with decadal climate patterns in the arabian sea. J. Mar. Sci. Eng. 13, 1170. doi: 10.3390/jmse13061170
Knutson T. R., Sirutis J. J., Zhao M., Tuleya R. E., Bender M., Vecchi G. A., et al. (2015). Global projections of intense tropical cyclone activity for the late twenty-first century from dynamical downscaling of CMIP5/RCP4.5 scenarios. J. Clim. 28, 7203–7224. doi: 10.1175/JCLI-D-15-0129.1
Kuttippurath J., Sunanda N., Martin M. V., and Chakrabort K. (2021). Tropical storms trigger phytoplankton blooms in the deserts of north Indian Ocean. NPJ Clim. Atmos. Sci. 4, 11. doi: 10.1038/s41612-021-00166-x
Lao Q., Liu S., Ling Z., Jin G., Chen F., Chen C., et al. (2023). External dynamic mechanisms controlling the periodic offshore blooms in Beibu Gulf. J. Geophys. Res. Oceans. 128(6), e2023JC019689. doi: 10.1029/2023JC019689
Lao Q., Lu X., Chen F., Jin G., Chen C., Zhou X., et al. (2022). Effects of upwelling and runoff on water mass mixing and nutrient supply induced by typhoons: Insight from dual water isotopes tracing. Limnol. Oceanogr. 68, 284–295. doi: 10.1002/lno.12266
Liang W., Tang D., and Luo X. (2018). Phytoplankton size structure in the western South China Sea under the influence of a ‘jet-eddy system’. J. Mar. Syst. 187, 82–95. doi: 10.1016/j.jmarsys.2018.07.001
Lin I. I. (2012). Typhoon-induced phytoplankton blooms and primary productivity increase in the western North Pacific subtropical ocean. J. Geophys. Res. . 117, C03039. doi: 10.1029/2011JC007626
Lin I. I., Liu W. T., Wu C. C., Wong G. T. F., Hu C. M., Chen Z. Q., et al. (2003). New evidence for enhanced ocean primary production triggered by tropical cyclone. Geophys. Res. Lett. 30, 1718. doi: 10.1029/2003GL017141
Lin S., Zhang W. Z., Shang S. P., and Hong H. S. (2017). Ocean response to typhoons in the western north pacific: composite results from argo data. Deep-Sea Res. PT Ind. 123, 62–74. doi: 10.1016/j.dsr.2017.03.007
Lorenz M., Klingbeil K., and Burchard H. (2021). Impact of evaporation and precipitation on estuarine mixing. J. Phys. Oceanogr. 51, 1319–1333. doi: 10.1175/JPO-D-20-0158.1
Lü H., Zhao X., Sun J., Zha G., Xi J., and Cai S. (2020). A case study of a phytoplankton bloom triggered by a tropical cyclone and cyclonic eddies. PloS One 15, e0230394. doi: 10.1371/journal.pone.0230394
Miller W. and Harding L. W. (2007). Climate forcing of the spring bloom in Chesapeake Bay. Mar. Ecol. Prog. Ser. 331, 11–22. doi: 10.3354/meps331011
Pan G., Chai F., Tang D., and Wang D. (2017a). Marine phytoplankton biomass responses to typhoon events in the South China Sea based on physical-biogeochemical model. Ecol. Model. 356, 38–47. doi: 10.1016/j.ecolmodel.2017.04.013
Pan S., Shi J., Gao H., Guo X., Yao X., and Gong X. (2017b). Contributions of physical and biogeochemical processes to phytoplankton biomass enhancement in the surface and subsurface layers during the passage of Typhoon Damrey. J. Geophys. Res. Biogeosci. 122, 212–229. doi: 10.1002/2016JG003331
Paparella F., Xu C., Vaughan G. O., and Burt J. A. (2019). Coral bleaching in the Persian/Arabian Gulf is modulated by summer winds. Front. Mar. Sci. 6. doi: 10.3389/fmars.2019.00205
Parker C., Lynch A., Spera S., and Spangler K. (2017). The relationship between tropical cyclone activity, nutrient loading, and algal blooms over the Great Barrier reef. Biogeosci. Discuss, 1–35. doi: 10.5194/bg-2017-23
Pous S., Carton X. J., and Lazure P. (2013). A process study of the wind-induced circulation in the Persian Gulf. Open J. Mar. Sci. 3, 27160. doi: 10.4236/ojms.2013.31001
Pous S., Lazure P., and Carton X. (2015). A model of the general circulation in the Persian Gulf and in the Strait of Hormuz: intraseasonal to interannual variability. Cont. Shelf Res. 94, 55–70. doi: 10.1016/j.csr.2014.12.008
Price J. F. (1981). Upper ocean response to a hurricane. J. Phys. Oceanogr. 11, 153–175. doi: 10.1175/1520-0485(1981)011<0153:UORTAH>2.0.CO;2
Robinson C., Li L., and Barry D. A. (2007). Effect of tidal forcing on a subterranean estuary. Adv. Water Resour. 30, 851–865. doi: 10.1016/j.advwatres.2006.07.006
Saleh H., Sultan M., Yan E., Save H., Elhaddad H., Karimi H., et al. (2025). Intensifying tropical cyclones in the Arabian Sea replenish depleting aquifers. Commun. Earth Environ. 6, 536. doi: 10.1038/s43247-025-02493-w
Shenoi S. S. C., Shankar D., and Shetye S. R. (2002). Differences in heat budgets of the near-surface Arabian Sea and Bay of Bengal: Implications for the summer monsoon. J. Geophys. Res. Oceans. 107(C6), 5–1. doi: 10.1029/2000JC000679
Sillmann J., Daloz A. S., Schaller N., and Schwingshackl C. (2021). Climate change 3rd ed: observed impacts on planet earth (USA: United States. Elsevier Inc).
Smitha B. R., Sanjeevan V. N., Vimalkumar K. G., and Revichandran C. (2008). On the upwelling off the southern tip and along the west coast of India. J. Coast. Res. 24, 95–102. doi: 10.2112/06-0779.1
Strachan J., Vidale P. L., Hodges K., Roberts M., and Demory M. E. (2013). Investigating global tropical cyclone activity with a hierarchy of AGCMs: the role of model resolution. J. Clim. 26, 133–152. doi: 10.1175/JCLI-D-12-00012.1
Sun J., Oey L. Y., Chang R., Xu F., and Huang S. M. (2015). Ocean response to typhoon Nur) in western Pacific and South China Sea. Ocean Dyn. 65, 735–749. doi: 10.1007/s10236-015-0823-0
Sun L., Yang Y., Tao X., Lu Z. M., and Fu Y. (2010). Strong enhancement of chlorophyll a concentration by a weak typhoon. Mar. Ecol. Prog. Ser. 404, 39–50. doi: 10.3354/meps08477
Talley L. D., Pickard G. L., Emery W. J., and Swift J. H. (2011). Chapter S5–mass, salt, and heat budgets and wind forcing: supplementary materials. Descr. Phys. Oceanogr, 1–11. doi: 10.1016/B978-0-7506-4552-2.10017-4
Tan S., Shi J., Wang G., Xing X., and Lü H. (2022). A case study of the westward transport of Chorophyll-a entrained by ocean eddies during a tropical cyclone. Reg. Stud. Mar. Sci. 52, 102256. doi: 10.1016/j.rsma.2022.102256
Tory K. J. and Dare R. A. (2015). Sea surface temperature thresholds for tropical cyclone formation. J. Clim. 28, 8171–8183. doi: 10.1175/JCLI-D-14-00637.1
Vincent E. M., Madec G., Lengaigne M., Vialard J., and Koch-Larrouy A. (2013). Influence of tropical cyclones on sea surface temperature seasonal cycle and ocean heat transport. Climate Dynamics 41, 2019–2038. doi: 10.1007/s00382-012-1556-0
Walker N. D., Leben R. R., and Balasubramanian S. (2005). Hurricane-forced upwelling and chlorophyll a enhancement within cold-core cyclones in the Gulf of Mexico. Geophys. Res. Lett. 32(18). doi: 10.1029/2005GL023716
Wang Y. and Xiu P. (2022). Typhoon footprints on ocean surface temperature and chlorophyll-a in the South China Sea. Sci. Total Environ. 840, 156686. doi: 10.1016/j.scitotenv.2022.156686
Yang L., Du Y., Xie S., and Wang D. (2012). An interdecadal change of tropical cyclone activity in the South China Sea in the early 1990s. Chin. J. Oceanology Limnology 30, 953–959. doi: 10.1007/s00343-012-1258-9
Yu Y., Notaro M., Kalashnikova O. V., and Garay M. J. (2016). Climatology of summer Shamal wind in the Middle East. J. Geophys. Res. Atmos. 121, 289–305. doi: 10.1002/2015JD024063
Zhang Q., Gu X., Li J., Shi P., and Singh V. P. (2018). The impact of tropical cyclones on extreme precipitation over coastal and inland areas of China and its association to ENSO. J. Clim. 31, 1865–1880. doi: 10.1175/JCLI-D-17-0474.1
Zhao H., Han G., Zhang S., and Wang D. (2013). Two phytoplankton blooms near Luzon Strait generated by lingering Typhoon Parma. J. Geophys. Res. Biogeo. 118, 412–421. doi: 10.1002/jgrg.20041
Zhao H., Pan J., Han G., Devlin T., Zhang S., and Hou Y. (2017). Effect of a fast-moving tropical storm Washi on phytoplankton in the northwestern South China Sea. J. Geophys. Res. Ocean. 122, 3404–3416. doi: 10.1002/2016JC012286
Zhao H., Shao J., Han G., Yang D., and Lv J. (2015). Influence of typhoon matsa on phytoplankton chlorophyll-a off east China. PloS One 10, e0137863. doi: 10.1371/journal.pone.0137863
Zhao H., Tang D., and Wang Y. (2008). Comparison of phytoplankton blooms triggered by two typhoons with different intensities and translation speeds in the South China Sea. Mar. Ecol. Prog. Ser. 365, 57–65. doi: 10.3354/meps07488
Keywords: tropical cyclone Tej, chlorophyll-a concentration, dissolved inorganic carbon, phosphate, Arabian Peninsula
Citation: Chinta V, Kalhoro MA, Tahir M, Liang Z and Song T (2025) Impact of tropical cyclone Tej on oceanic environment in the Arabian Peninsula. Front. Mar. Sci. 12:1575203. doi: 10.3389/fmars.2025.1575203
Received: 12 February 2025; Accepted: 14 August 2025;
Published: 01 September 2025.
Edited by:
Wen-Zhou Zhang, Xiamen University, ChinaReviewed by:
Borja Aguiar-González, University of Las Palmas de Gran Canaria, SpainJia Sun, Ministry of Natural Resources, China
Copyright © 2025 Chinta, Kalhoro, Tahir, Liang and Song. This is an open-access article distributed under the terms of the Creative Commons Attribution License (CC BY). The use, distribution or reproduction in other forums is permitted, provided the original author(s) and the copyright owner(s) are credited and that the original publication in this journal is cited, in accordance with accepted academic practice. No use, distribution or reproduction is permitted which does not comply with these terms.
*Correspondence: Tony Song, dHNvbmdAaWR0LmVpdGVjaC5lZHUuY24=; Muhsan Ali Kalhoro, bXVoc2FuQHNkdS5lZHUuY24=
†These authors have contributed equally to this work and share first authorship