 Hongzhi Miao
 Xinyuan Feng
 Xinwei Li
- 1College of Transportation Engineering, Dalian Maritime University, Dalian, China
- 2School of Law, Dalian Maritime University, Dalian, China
The accelerated melting of Arctic sea ice has established the Northern Sea Route (NSR) as an emerging alternative for international shipping. However, increased maritime activities pose significant environmental risks to this sensitive region. This study evaluates the economic implications of the International Maritime Organization (IMO) environmental regulations on Arctic shipping through a well-to-wake assessment framework. Using a multi-scenario economic analysis model, we compare transportation costs between the NSR and the traditional Suez Canal Route (SCR) under various IMO environmental policy scenarios. Our findings reveal: (1) Without carbon taxation, the NSR generally offers lower unit transportation costs than the SCR. However, the IMO’s prohibition of heavy fuel oil (HFO) in Arctic waters creates a 12-15% cost advantage for vessels using HFO on the SCR compared to those using clean fuels on the NSR. (2) However, the IMO’s prohibition of heavy fuel oil (HFO) in Arctic waters creates a 12-15% cost advantage for vessels using HFO on the SCR compared to those using clean fuels on the NSR. (3) In unilateral carbon tax scenarios, the NSR consistently remains less economically viable than the SCR using HFO, primarily due to mandatory clean fuel requirements in Arctic waters. (4) The environmental benefits of LNG propulsion demonstrate considerable technological sensitivity, with life-cycle emission reduction efficiency heavily dependent on engine selection and methane slip mitigation. Our analysis indicates that current Arctic environmental regulations lack policy coordination. To simultaneously achieve ecological protection and economic viability, we recommend implementing a dynamic carbon tax threshold mechanism linked to clean fuel technology standards.
1 Introduction
The accelerated melting of Arctic sea ice due to global warming has significantly enhanced the navigational potential of Arctic shipping routes, positioning them as emerging strategic corridors in international maritime transport (Quinn et al., 2008; Lindstad et al., 2016; Gunnarsson, 2021). However, this expansion of shipping activities intensifies environmental vulnerabilities in this ecologically sensitive region, with vessel emissions of black carbon, petroleum residues, and nitrogen oxides presenting significant ecological concerns (Dalsøren et al., 2007; Corbett et al., 2010; Lack and Corbett, 2012; Lindstad et al., 2016; Zhu et al., 2018; Raut et al., 2022). While black carbon emissions from Arctic shipping remain a concern, recent studies suggest that its direct climatic impact may be limited during summer months due to deposition in open waters (Li et al., 2021). In response to these environmental challenges, market-based policy instruments have gained prominence in global maritime governance (Harrison, 2010; World Bank, 2021). The International Maritime Organization’s (IMO) proposed carbon tax schemes ($18.75/$100/$150 per ton of CO2 equivalent emitted on a life cycle basis) (ISWG-GHG 17, 2024) represent a significant policy intervention whose cost transmission mechanisms are fundamentally reshaping the economic evaluation framework for Arctic routes (Zhang and Baranzini, 2004; Cheaitou et al., 2022). A systematic assessment of Arctic route feasibility under varying carbon tax scenarios not only informs operational decisions for shipping enterprises but also provides essential parametric support for developing sustainable Arctic shipping policy frameworks.
Current literature predominantly focuses on developing and validating economic viability assessment frameworks for Northern Sea Route (NSR) (Zhang and Baranzini, 2004; Pruyn, 2016; Zhang et al., 2016a; Zhang et al., 2016b; Milaković et al., 2018; Sui et al., 2021; Zhao et al., 2016). Container liner shipping has emerged as a primary research subject due to its pivotal role in global trade networks (Xu et al., 2011; Furuichi and Otsuka, 2013), followed by economic analyses of dry bulk carriers and tanker operations (Pruyn, 2016; Theocharis et al., 2018). Scholars typically employ evaluation metrics encompassing transit time, voyage distance, and comprehensive cost structures, with substantial evidence confirming the Arctic routes’ significant cost advantages over the traditional Suez Canal Route (SCR) (Otsuka et al., 2013; Xu and Yin, 2021; Li et al., 2023). However, several studies indicate potential operational cost increases or uncertainties attributable to icebreaker escort fees and insurance premiums (Verny and Grigentin, 2009; Liu and Kronbak, 2010; Lasserre, 2014; Zhang et al., 2016a). Notably, extended navigable windows are revealing the economic potential of combined NSR-SCR routing models, potentially reconfiguring traditional economies of scale dynamics in global shipping (Furuichi and Otsuka, 2015). Methodologically, mainstream studies employ three-tier cost decomposition models (operational/voyage/capital costs) to quantify environmental variables’ impacts (Theocharis et al., 2018), yet existing literature largely neglects internalization mechanisms for environmental externalities, particularly the economic effects of market-based instruments like carbon taxation.
Current Arctic shipping governance demonstrates marked asymmetry between academic consensus and regulatory implementation. While scholarly research has established clear consensus on environmental risks from shipping pollution (Liu and Kronbak, 2010; Pagano et al., 2012; Østreng et al., 2013; Furuichi and Otsuka, 2013; Lindstad et al., 2016; Yumashev et al., 2017; Zhu et al., 2018; Zhu et al., 2018; Makarova et al., 2021; Qi et al., 2024), policy responses lag behind operational realities. Although the Polar Code partially addresses environmental concerns through vessel technical standards (Liu, 2016), regulatory gaps persist – particularly the delayed implementation of Heavy Fuel Oil (HFO) restrictions until 2024 (IMO International Code for Ships Operating in Polar Waters (Polar Code), 2025) and absence of black carbon controls – revealing systemic limitations in current governance frameworks. This regulatory context elevates the strategic importance of carbon taxation as a Market-based measurement (MBM) instrument. Global carbon pricing practices demonstrate that carbon tax mechanisms in 35 countries already encompass 21.5% of global emissions, with maritime transport emerging as a new frontier – evidenced by EU’s inclusion of shipping in carbon markets and IMO’s legislative progress on global maritime carbon taxation (Harrison, 2010; Carl and Fedor, 2016). However, existing research inadequately addresses the coupling mechanisms between carbon taxation and Arctic route economics, particularly lacking systematic frameworks to analyze differential impacts of carbon pricing schemes on Arctic shipping cost structures. This knowledge gap hinders policymakers’ ability to anticipate carbon taxation’s constraining or optimizing effects on Arctic shipping development.
The impact of maritime carbon taxation on Arctic route economics demonstrates significant regulatory elasticity. As an environmental consumption tax levied on vessel operational emissions (Tiwari et al., 2021; Gao et al., 2022; Song et al., 2024), carbon pricing reshapes route selection decision models through cost transmission effects (Zhu et al., 2018; Joseph et al., 2021; Kavirathna et al., 2023). Studies indicate that uniform carbon taxation enables NSR to maintain economic advantages over SCR through voyage-shortening emission reductions that offset tax costs. Notably, current research predominantly focuses on micro-level operational analyses, lacking systematic modeling of carbon taxation’s macro-level impacts - including strategic Arctic adjustments by maritime powers and carbon market interactions (Xiang et al., 2025). Particularly, the evolutionary mechanisms governing shipping behaviors under carbon constraints for key Arctic stakeholders remain underexplored, constituting a critical theoretical gap.
Existing evaluations of NSR economic viability reveal three critical limitations in well-to-wake (WtW) based assessments of environmental policy impacts: First, excessive focus on explicit operational costs (fuel consumption/canal fees) neglects implicit factors like fuel production/transport emissions and engine technological disparities, resulting in distorted carbon intensity calculations for alternative fuel systems like Liquified Natural Gas (LNG). Second, insufficient dynamic analysis of policy combination effects, particularly unresolved synergistic/counteractive interactions between IMO’s carbon tax proposals and Arctic HFO bans. Third, neglect of differential impacts of vessel infrastructure and logistics efficiency along the route on emissions from different fuel types. This study addresses these limitations through a WtW analytical framework that systematically reveals environmental policies’ transmission mechanisms on NSR feasibility, with methodological innovations manifested in three dimensions:
1. Development of WtW Emission Assessment Framework: Overcomes the systemic boundary limitations of traditional Tank-to-Wake (TtW) analysis by integrating full-chain fuel production and transportation emissions data with engine technical parameters, establishing a precision measurement model for environmental benefits of alternative fuels in Arctic shipping.
2. Design of Policy Coupling Analysis Model: Employs multi-scenario simulations to reveal interactive effects between IMO’s carbon tax schemes and Arctic HFO bans, quantifying impact pathways of environmental policy combinations on route economics.
3. Geospatial Differentiated Empirical Research: Case validation across China’s three major hubs (Shanghai/Dalian/Shenzhen) demonstrates Shanghai Port’s cost optimization through route operational maturity under carbon taxation, while Shenzhen Port maintains competitiveness via SCR advantages, uncovering synergistic mechanisms between geographical features and environmental policies.
This study establishes a comparative economic analysis framework between NSR and SCR using China’s Dalian, Shanghai, Shenzhen ports and Russia’s Murmansk Port as origin-destination pairs, implemented through three phases (see Figure 1): (1) Data Standardization Phase: Integrates vessel technical parameters (deadweight tonnage, speed), fuel data (price, efficiency), engine efficiency metrics (carbon emission intensity, coefficients), and route parameters (distance, toll fees) into a unified dataset. (2) Cost Modeling Phase: Develops a three-tier cost accounting system – operational costs (fuel, canal fees and port charges), fleet costs (capital, labor, maintenance), and carbon tax costs (TtW and WtW cycles) – ultimately calculating unit transportation costs ($/TEU). (3) Comparative Analysis Phase: Implements four scenarios – carbon tax-free baseline, differentiated carbon tax policies, NSR-specific taxation, and sensitivity testing (port and vessel size variations) – systematically revealing carbon taxation’s impact mechanisms on route economics.
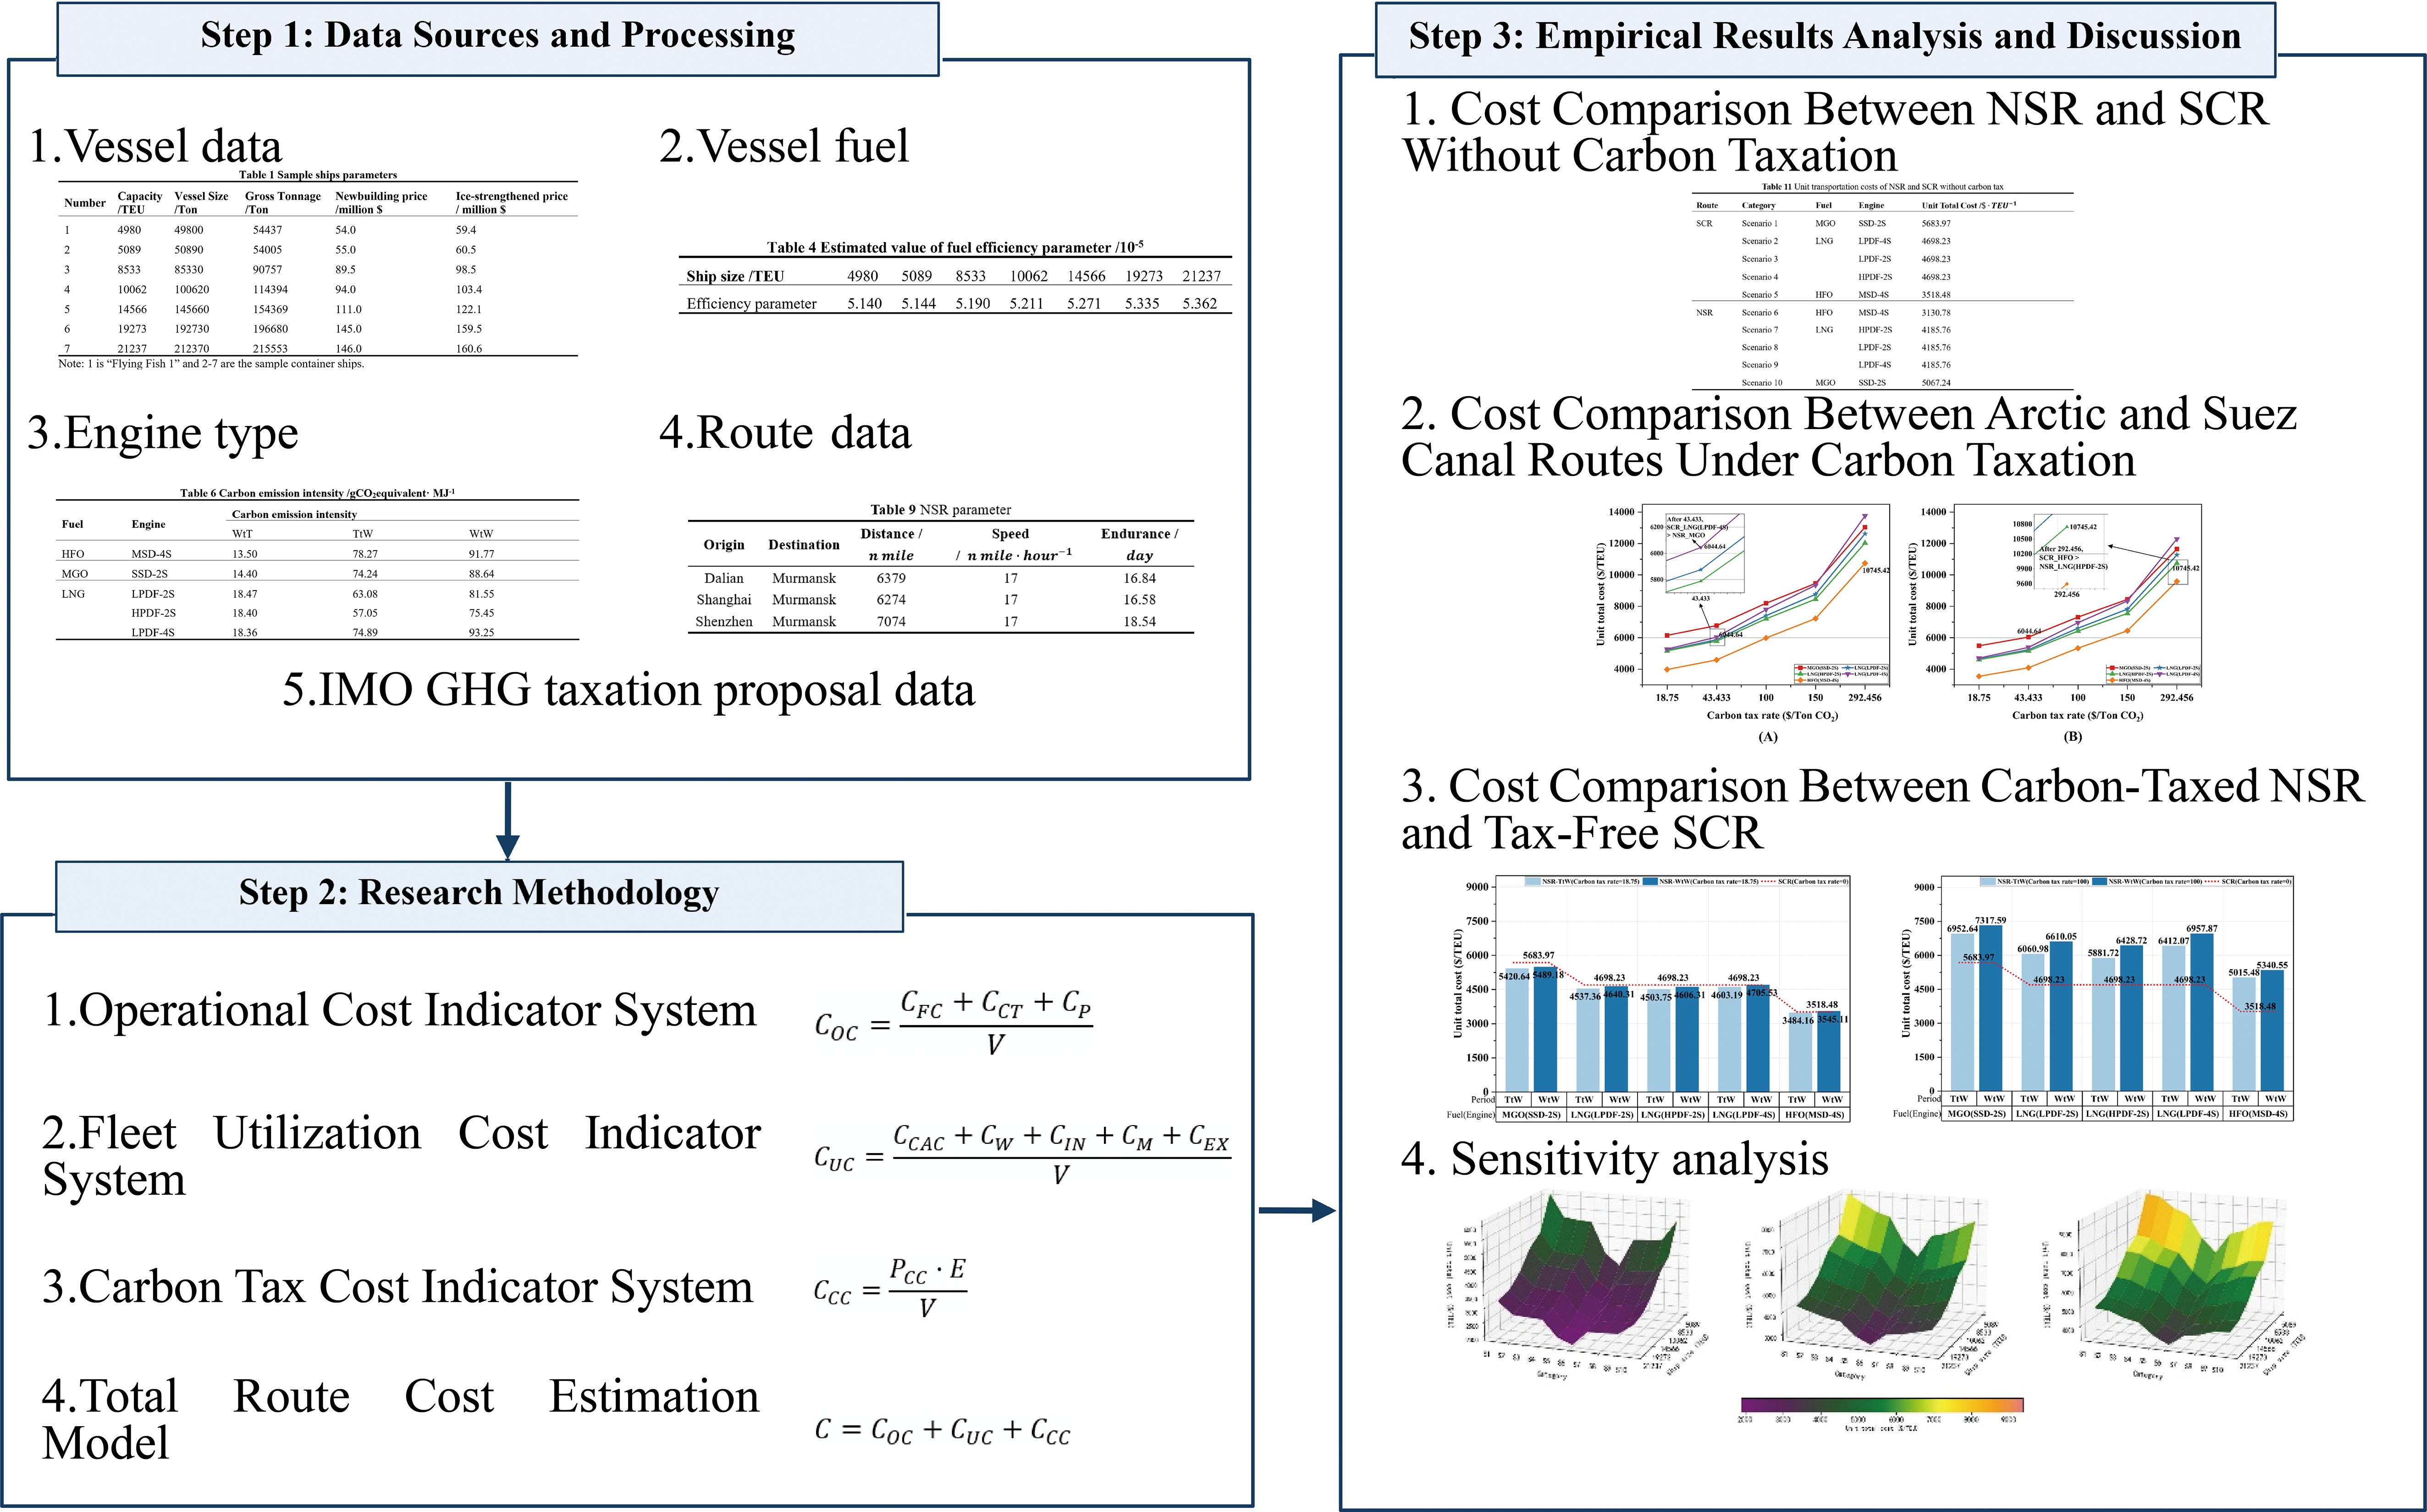
Figure 1. The framework of the study.
The remainder of this article is organized as follows: Section 2 outlines the economic assessment framework for Arctic shipping, focusing on core parameters and methodologies for evaluating capital costs, operational costs, and environmental externalities. Section 3 employs a cost-benefit model to quantitatively compare the lifecycle economic performance of vessels powered by HFO, LNG, and Marine Gas Oil (MGO) on the NSR versus SCR, elucidating the mechanisms through which policy interventions shape route competitiveness. Section 4 conducts scenario-based sensitivity analyses to assess the marginal effects of dynamic factors, including ice-class upgrades, energy price volatility, and carbon trading mechanisms, on investment decisions. Finally, Section 5 synthesizes the findings, proposes tailored recommendations for stakeholders, and identifies future research directions for low-carbon transitions in Arctic shipping. For ease of understanding, Appendices A and B have been added in this article to facilitate the reference of the meanings of symbols and abbreviations.
2 Data sources and research methodology
2.1 Data sources and processing
This study draws on comprehensive data from academic databases, industry reports, and public datasets, focusing on vessel operational parameters for the NSR and SCR from 2011 to 2024. The dataset encompasses critical operational metrics including voyage distance, sailing speed, fuel consumption, and carbon emissions, with a particular focus on container ships of varying capacities. Data processing follows a standardized three-stage workflow: (1) harmonizing vessel capacity units across different ship types to ensure cross-class comparability, (2) imputing missing values through validated statistical models based on historical data patterns, and (3) developing a unified unit transportation cost calculation framework that enables systematic economic comparisons between routes under varying environmental policy scenarios.
2.1.1 Vessel data
Container ships were selected as the analytical focus due to their optimal operational flexibility and efficiency for long-haul routes. Given the significant impact of vessel capacity on economic performance, the sample capacity range was established at 5,000–24,000 TEU—the lower bound aligns with minimum transoceanic transport requirements, while the upper limit corresponds to the Suez Canal’s maximum recorded vessel transit capacity. The sample includes six COSCO Shipping mainstream vessel types spanning this capacity range, complemented by the Arctic-experienced “Flying Fish 1” vessel. Arctic navigation necessitates ice-class vessels, whose construction standards significantly influence economic viability. This study assumes NSR operations employ Arc4 ice-class vessels (approximately 10% costlier than conventional ships (Erikstad and Ehlers, 2012)), while SCR utilizes standard vessel types (Table 1). Arc4-certified vessels are engineered to navigate through ice with a maximum thickness of 0.6 meters during winter/spring and 0.8 meters during summer/autumn, requiring reinforced hulls, enhanced propulsion systems, and specialized equipment to ensure safe navigation in seasonal ice conditions (Gong, 2017). This classification balances ice navigability and construction costs: Arc4-class ships satisfy basic Arctic transit requirements while demonstrating superior per-voyage cost-saving advantages through route shortening (Pruyn and Van Hassel, 2022). Crew allocation complies with China’s Minimum Safe Manning Regulations for Ships, requiring a minimum of 19 personnel for oceangoing vessels (7 deck officers, 10 engine department staff, 2 service crew). Per-voyage labor costs are calculated based on total monthly crew salaries, with position-specific wages benchmarked against the Shanghai Shipping Exchange’s International Seafarer Salary Index (Table 2).
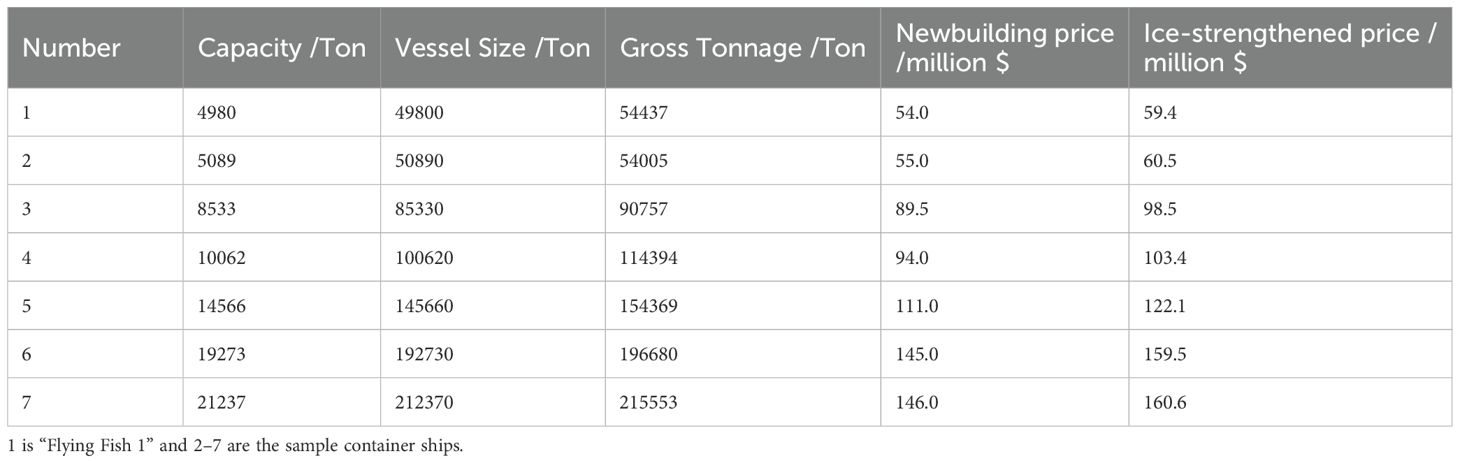
Table 1. Sample ships parameters.
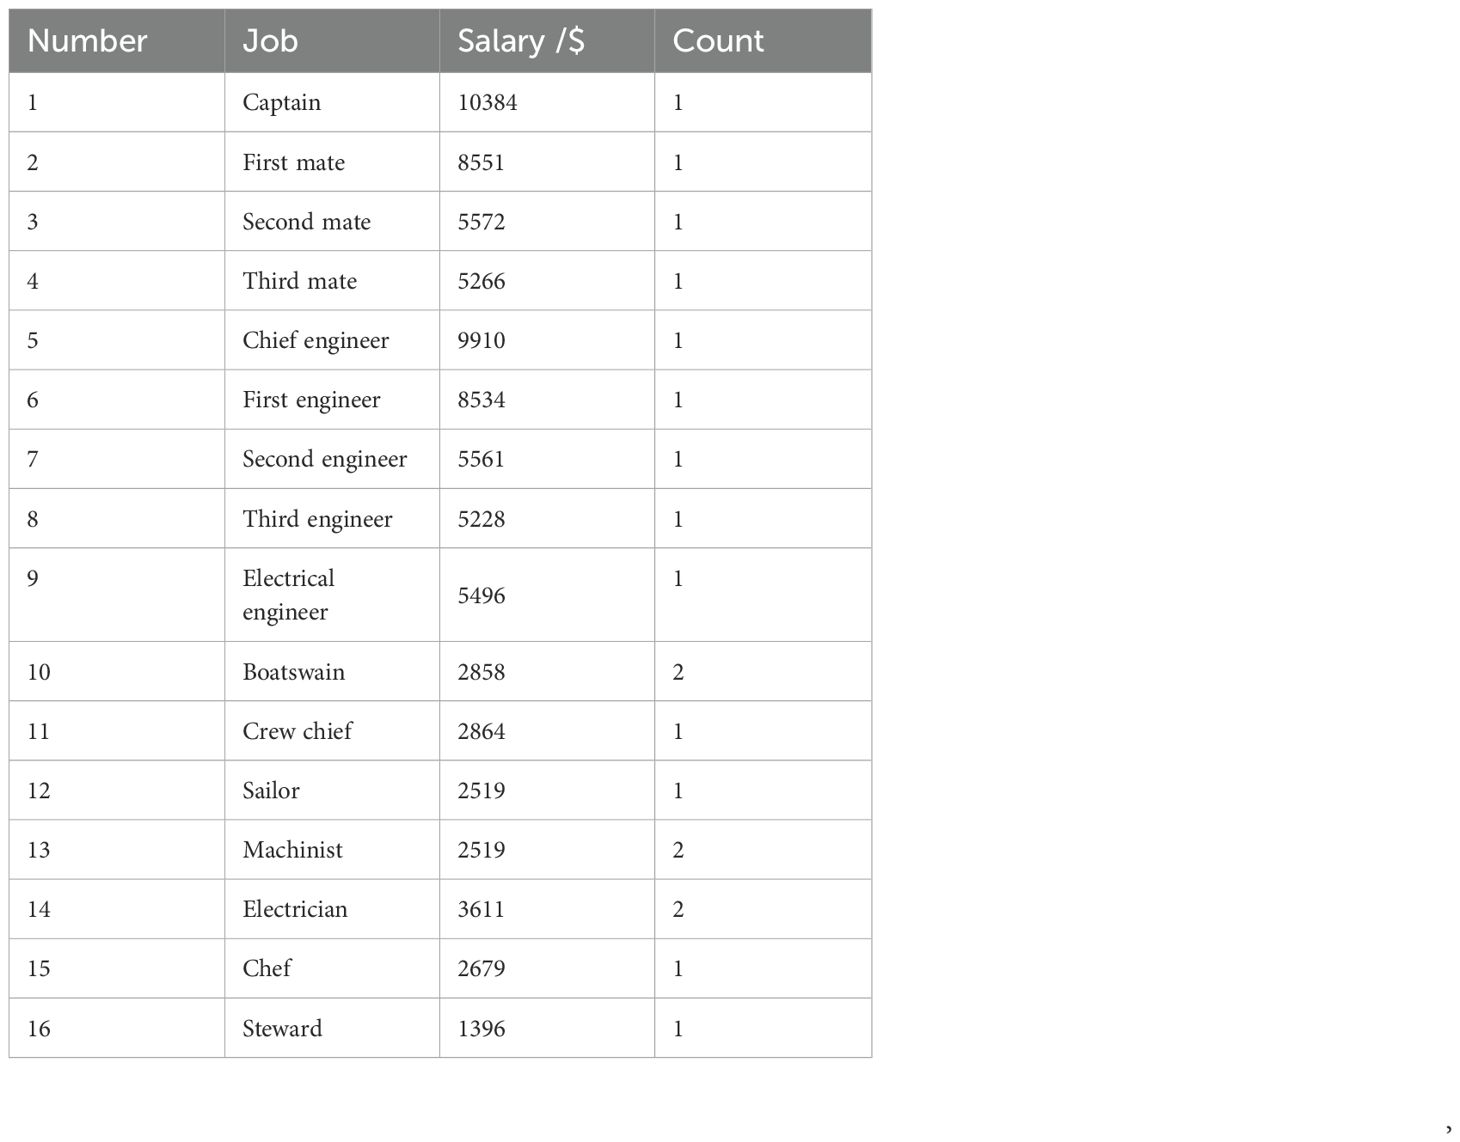
Table 2. Seamen’s monthly salary.
2.1.2 Vessel fuel
The study examines three primary marine fuel types: HFO, MGO, and LNG. Industry data indicates LNG dual-fuel vessels account for 70% of newbuild orders in 2024, reflecting the maritime industry’s accelerating decarbonization trends (Park et al., 2024). The analysis assumes all sample vessels possess multi-fuel compatibility (HFO/MGO/LNG), with retrofit costs excluded to maintain model consistency. Fuel price parameters follow standardized calculation methods (see Table 3): LNG and HFO costs utilize Ding et al.’s (Ding et al., 2020) model validated against International Energy Agency policy scenarios, while MGO pricing references the 2025 week 3 Marine Bunker Exchange index. Fuel efficiency parameters demonstrate significant capacity-dependent characteristics, a correlation substantiated by Notteboom et al (Notteboom and Vernimmen, 2009), with specific values detailed in Table 4.

Table 3. Different fuel unit prices /$ Ton-1.
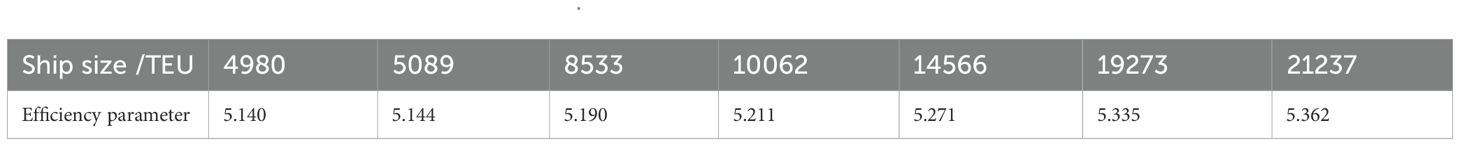
Table 4. Estimated value of fuel efficiency parameter /10-5.
2.1.3 Engine types
Engine technologies significantly influence carbon emission profiles through variations in combustion characteristics. LNG-fueled vessels equipped with low-pressure dual-fuel engines (LPDF-4S/LPDF-2S) exhibit higher methane slip compared to high-pressure dual-fuel engines (HPDF-2S), yet existing research frequently overlooks this technological disparity, leading to systematically biased assessments of LNG’s environmental benefits. Concurrently, medium-speed four-stroke engines (MSD-4S) using HFO generate higher CO₂ concentrations and exhaust temperatures than slow-speed two-stroke engines (SSD-2S) utilizing MGO. This thermodynamic variation directly impacts carbon emission intensity calculations through Oh’s (Oh et al., 2024) fuel consumption-emission correlation model (Tables 5–7). The research reveals that neglecting engine-specific technological features introduces systematic biases in carbon emission cost evaluations. Methane slip—the phenomenon where unburned methane (CH₄) is directly emitted during LNG engine operation—occurs particularly in low-pressure dual-fuel four-stroke engines due to incomplete combustion or system leakage (Oh et al., 2024), significantly undermining LNG’s greenhouse gas reduction potential.

Table 5. Lower calorific values for fossil fuels /MJ g-1.

Table 6. Carbon emission intensity /gCO2 equivalent MJ-1.
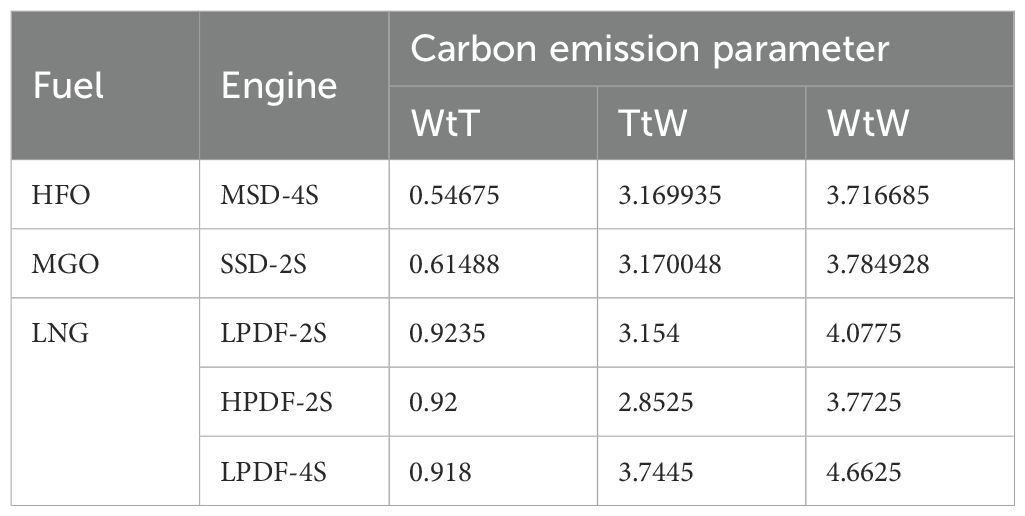
Table 7. Carbon emission parameter /gCO2 equivalent gfuel-1.
2.1.4 Route data
This study establishes a comparative framework for NSR and SCR between Asia and Europe using Dalian, Shanghai, and Shenzhen ports in China alongside Murmansk Port in Russia. The selection rationale is as follows: Murmansk serves as the NSR core hub with year-round navigability and 10-million-ton throughput capacity; Shanghai Port, an international shipping nexus, handles over 50 million TEUs annually; Dalian Port manages 97% of Northeast China’s foreign trade container volume, functioning as a regional economic gateway; Shenzhen Port demonstrates southern China’s maritime vitality through 265 international routes and 13% foreign trade growth. The geographical and functional diversity of these four ports provides a multidimensional basis for route economic comparisons. Port cost calculations adopt a dual framework of handling and pilotage fees: Chinese ports follow the Ministry of Transport Port Charging Rules (Foreign Trade Section) (handling fee: $ 61/TEU; pilotage fee: $ 0.075 per freight ton), while Murmansk’s fees are set at $ 100/TEU for handling (Furuichi and Otsuka, 2013) and $ 0.065 per freight ton for pilotage based on existing studies.
Route comparisons reveal SCR’s ice-free advantage ensures operational efficiency, whereas NSR’s ice-covered segments necessitate speed reduction, potentially increasing fuel consumption and operational costs despite shorter distances (voyage distance differences detailed in Table 8). Speed parameters are set using industry benchmarks: SCR speeds reference Clarksons’ 2024 annual average for container ships, while NSR speeds are calibrated to ice navigation characteristics at 17 knots (typical range: 13–25 knots). Complete technical parameter configurations for both routes are detailed in Table 9. SCR transit fees employ a progressive surcharge system based on net tonnage, with differentiated rates by vessel type and gross tonnage. Following Furuichi et al.’s methodology (Furuichi and Otsuka, 2013), this study substitutes gross tonnage for net tonnage in calculations, reflecting the fee structure’s inherent characteristic: unit rates decrease with increasing gross tonnage for same-type vessels. Specific fee standards are derived from official Suez Canal Authority data (see Table 10).
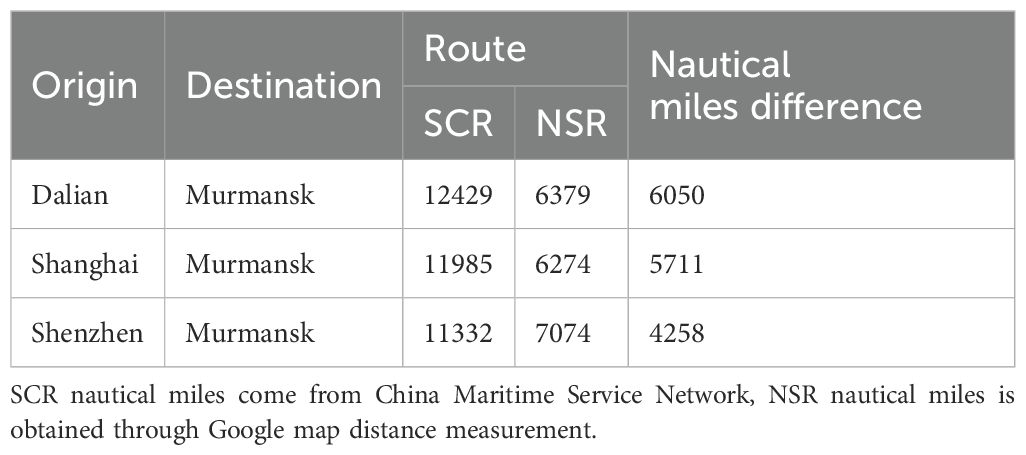
Table 8. Distance from China port to Murmansk Port NSR and SCR nautical miles /n mile.
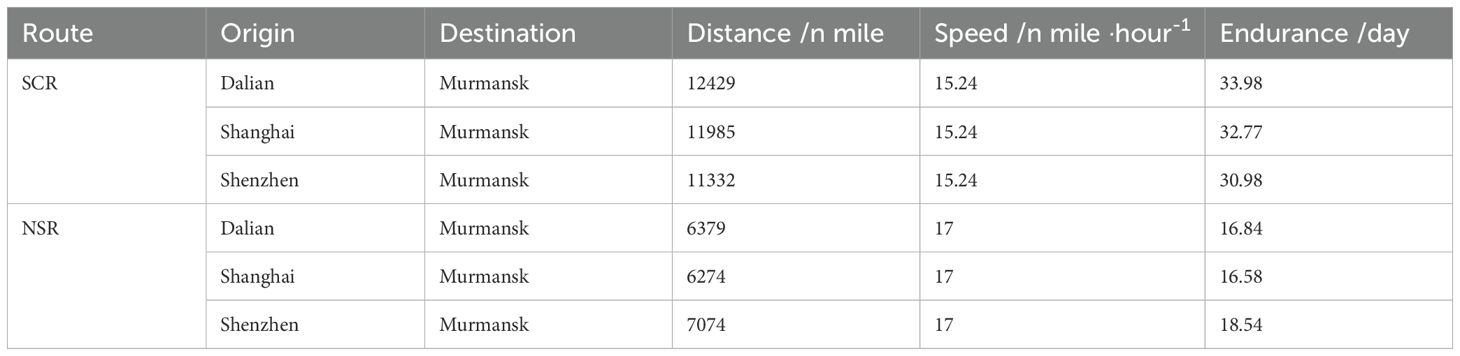
Table 9. SCR parameter and NSR parameter.
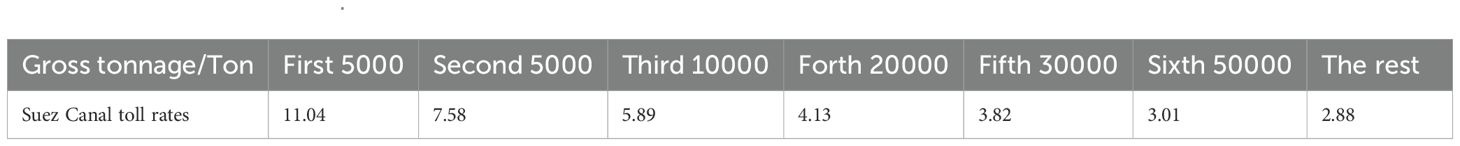
Table 10. Suez Canal tolls /$ GT-1.
2.1.5 IMO GHG taxation proposal data
The IMO has proposed a three-tier carbon tax framework: $18.75 per ton CO₂e (International Chamber of Shipping proposal), $100 per ton CO₂e (EU-Japan coalition proposal), and $150 per ton CO₂e (Small Island States proposal). This proposal introduces a Well-to-Wake (WtW) lifecycle accounting methodology, dividing emissions into fuel production and transportation (Well-to-Tank, WtT) and vessel utilization (Tank-to-Wake, TtW) phases. The framework mandates taxation coverage for full lifecycle emissions of CO₂, CH₄, and N₂O, representing a significant advancement beyond current research predominantly limited to TtW analyses.
2.2 Operational cost indicator system construction
Operational costs encompass all expenses incurred during vessel navigation, primarily including fuel cost , canal transit fee , and port usage fee . Accounting for variations across vessel types and routes, this study models the unit TEU operational cost through Equation 1:
The specific calculation methodologies for each cost component are developed as follows.
2.2.1 Fuel cost estimation methodology
The unit TEU fuel cost for both routes is modeled as Equation 2:
where denotes fuel price, represents total fuel consumption for the entire voyage, and indicates vessel container capacity (TEU). Total fuel consumption is modeled as Equation 3:
where is the adjustable fuel consumption coefficient for the route (, accounting for ice-class vessels’ 30% higher daily fuel consumption), represents the fuel efficiency parameter, denotes vessel size, is average sailing speed, signifies total voyage time. The relationship between fuel consumption and speed is derived from Ding’s modeling assumption (Ding et al., 2020).
2.2.2 Canal transit fee estimation methodology
Canal transit fee varies by route selection: NSR incurs icebreaking service fees, while SCR involves canal transit charges. The SCR per-voyage canal fee is modeled as Equation 4:
where denotes the progressive surcharge rate, and represents the vessel’s gross tonnage transiting the Suez Canal. Thus, SCR’s unit TEU canal transit fee is expressed as Equation 5:
According to the Northern Sea Route Administration (NSRA) access rules, NSR-transiting vessels require icebreaking services with associated fees. Given NSR’s high summer utilization, this study adopts Ding’s assumption of a summer icebreaking fee rate of $5/ton (Ding et al., 2020). NSR’s unit TEU canal transit fee is formulated as Equation 6:
where denotes the per-voyage icebreaking service fee for NSR.
2.2.3 Port fee estimation methodology
All ports calculate cargo handling and pilotage fees using fixed rates. The unit TEU port fee is modeled as Equation 7:
where denotes the unit TEU pilotage fee and represents the unit TEU cargo handling fee.
2.3 Fleet utilization cost indicator system construction
Fleet utilization costs encompass all expenses for maintaining daily operations, primarily including capital cost , crew wages , vessel insurance , maintenance , and other expenses . This study models the unit TEU fleet utilization cost as Equation 8:
The specific calculation methodologies for each cost component are modeled as follow.
2.3.1 Capital cost estimation methodology
Capital costs originate from vessel depreciation. According to the Baltic and International Maritime Council (BIMCO) latest market report, nearly 70% of container ships have been in service for over a decade. With China’s shipping fleet ranking third among global top-ten ship-owning nations by gross tonnage and maintaining an average vessel age of 10.2 years, this study assumes a 10-year average vessel lifespan. Annual capital cost per vessel is estimated as one-tenth of newbuild prices , see Equation 9:
This 10-year vessel lifespan assumption aligns with industry trends reported by BIMCO and simplifies depreciation calculations for consistent comparison with prior studies (Furuichi and Otsuka, 2013). However, this approach may not fully capture operational variability such as maintenance practices and market-driven retirements or regulatory shifts affecting lifespan constraints. Annual voyage frequency is derived from voyage time , enabling the allocation of to individual voyages and subsequent averaging per TEU, yielding the capital cost per TEU per voyage , see Equation 10:
2.3.2 Crew cost estimation methodology
Crew wages encompass base salaries, allowances, bonuses, and social benefits. Referencing the Shanghai Shipping Exchange’s International Seafarer Salary Index, the unit TEU crew cost is modeled as Equation 11:
where denotes the monthly salary for the -th position, and represents the number of crew members in the -th position.
2.3.3 Insurance cost estimation methodology
Maritime navigation faces various risks including severe weather, piracy, and collisions. Annual insurance costs are assumed to equal 1% of the newbuild price (Furuichi and Otsuka, 2013). This cost is allocated across the vessel’s operational lifespan and averaged per TEU, as shown in Equation 12:
2.3.4 Vessel maintenance cost estimation methodology
Regular inspections (annual, biennial, and quinquennial) are critical for maritime safety. Maintenance costs are estimated at 3% of (Wang, 2019), annually allocated and averaged per TEU, as shown in Equation 13:
2.3.5 Other utilization cost estimation methodology
Vessel operations incur additional expenses including corporate administration and management costs. These costs are estimated at 2% of the newbuild price (Wang, 2019), as shown in Equation 14:
2.4 Carbon tax cost indicator system construction
Carbon taxation levies fees on vessel emissions proportional to transportation-related carbon output. The unit TEU carbon tax is modeled as Equation 15:
where denotes the carbon tax rate, and represents total carbon emissions, expressed as Equation 16:
where signifies carbon emission intensity, and denotes fuel calorific value.
2.4.1 TtW carbon emission estimation methodology
Existing research predominantly focuses on carbon emissions from fuel combustion during transportation (TtW phase). Following Oh’s study (Oh et al., 2024), the TtW carbon emission intensity varies by fuel type, the calculation method is shown as Equations 17, 18:
where denotes the fuel consumption of fuel , represents the fuel consumption of fuel in energy converter , is the lower calorific value of fuel , refers to the TtW greenhouse gas emission factor for methane emissions associated with petroleum fuels, stands for global warming potential, and indicates the emissions generated by energy converter .
2.4.2 WtW carbon tax cost estimation methodology
Unlike TtW calculations, WtW accounting encompasses full fuel lifecycle emissions. The full lifecycle carbon emission intensity is derived as the sum of WtT and TtW emissions, the calculation method is shown as Equations 19, 20:
where represents the WtT carbon emission intensity, and denotes the WtT greenhouse gas emission factor for fuel , expressed in CO₂ equivalent terms.
2.5 Total route cost estimation model construction
Integrating operational and utilization costs, the unit transportation cost without carbon taxation is expressed as Equation 21:
Under carbon taxation, the unit transportation cost becomes (as shown in Equation 22):
3 Empirical results analysis and discussion
3.1 Cost comparison between NSR and SCR without carbon taxation
Under carbon tax-free conditions, NSR and SCR exhibit significant fuel-specific economic disparities (Table 11). The cost hierarchy follows HFO< LNG< MGO, driven by fuel market price gradients: HFO maintains cost advantages through its lower market price, though its high carbon intensity would become an economic liability under environmental cost internalization. MGO incurs the highest operational costs due to refining expenses, though its low-carbon advantages emerge progressively under carbon taxation. LNG occupies an intermediate position, balancing environmental benefits with moderate operational costs, though upstream emissions and methane slip require careful consideration in lifecycle assessments.
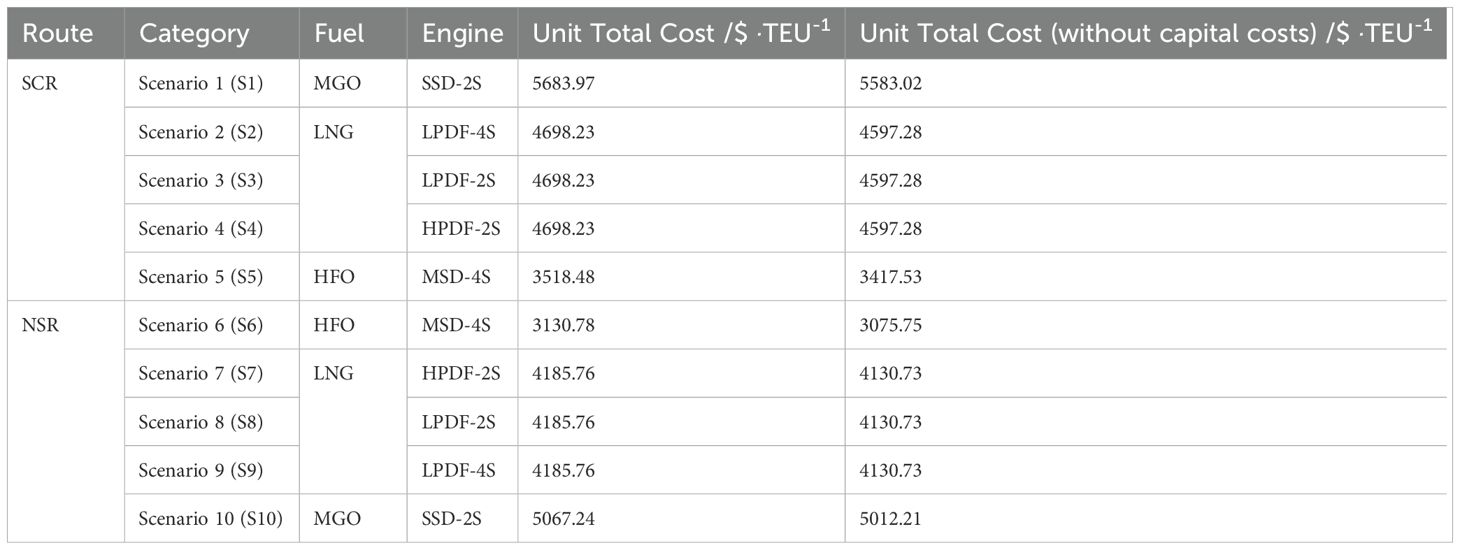
Table 11. Unit total cost of NSR and SCR without carbon taxation.
With identical fuel configurations, NSR demonstrates superior unit transportation costs through voyage-shortening advantages: reduced sailing durations enhance fleet turnover efficiency while decreasing fuel consumption and emissions. However, the IMO’s 2024 Arctic HFO ban compels NSR vessels to adopt cleaner fuels, substantially increasing operational costs. In contrast, SCR retains cost competitiveness through continued HFO utilization in tax-free conditions. Carbon taxation implementation fundamentally alters this dynamic—by internalizing environmental externalities, SCR’s HFO advantages gradually diminish, while NSR’s clean fuel transition evolves into a long-term competitive advantage, demonstrating synergistic effects between environmental regulation and market mechanisms.
The last column in Table 11 reveals unit transportation costs excluding capital costs for both routes. The data demonstrates that capital costs represent a fixed expense with notable differences in unit allocation between routes: SCR’s capital cost is $100.95/TEU while NSR’s is significantly lower at $55.03/TEU. This disparity primarily stems from voyage duration differences: SCR’s longer transit times and fewer annual voyages result in weaker cost distribution capacity and higher unit capital costs, leading to more substantial cost reductions when capital expenses are excluded. In contrast, NSR’s shorter voyages and higher annual frequency enable more efficient cost distribution, resulting in lower unit capital costs and consequently smaller impact when these costs are removed. Nevertheless, even after excluding capital costs, NSR maintains considerable economic advantages over SCR, confirming that its competitiveness extends beyond capital cost efficiencies.
3.2 Cost comparison between NSR and SCR under carbon taxation
3.2.1 Carbon tax calculation based on TtW
TtW cycle cost analysis under varying carbon tax levels ($18.75/$100/$150 per ton of CO₂ equivalent) reveals that SCR consistently incurs higher unit transportation costs than NSR with identical fuel configurations, primarily due to SCR’s extended voyage distances increasing fuel consumption (Figure 2). When tax rates fall below $61.01 per ton of CO₂ equivalent, HFO maintains optimal economic viability through price advantages. However, constrained by the Arctic HFO ban, SCR using HFO emerges as the de facto lowest-cost option, remaining cheaper than NSR’s LNG/MGO alternatives. As rates rise to $61.01 per ton of CO₂ equivalent, SCR’s high-emission LNG engine costs surpass NSR’s MGO usage, indicating NSR’s environmental advantages from cleaner fuels gradually translate into economic competitiveness. At rates exceeding $162.105 per ton of CO₂ equivalent, SCR’s HFO costs are overtaken by NSR’s low-emission LNG engines, though MGO and high-emission LNG options still lack cost advantages, demonstrating a threshold effect in carbon taxation’s suppression of high-carbon fuels. Notably, even at $287.155 per ton of CO₂ equivalent, NSR’s MGO and high-emission LNG solutions remain costlier than SCR’s HFO, underscoring the necessity to balance environmental objectives with maritime economic realities in policy design.
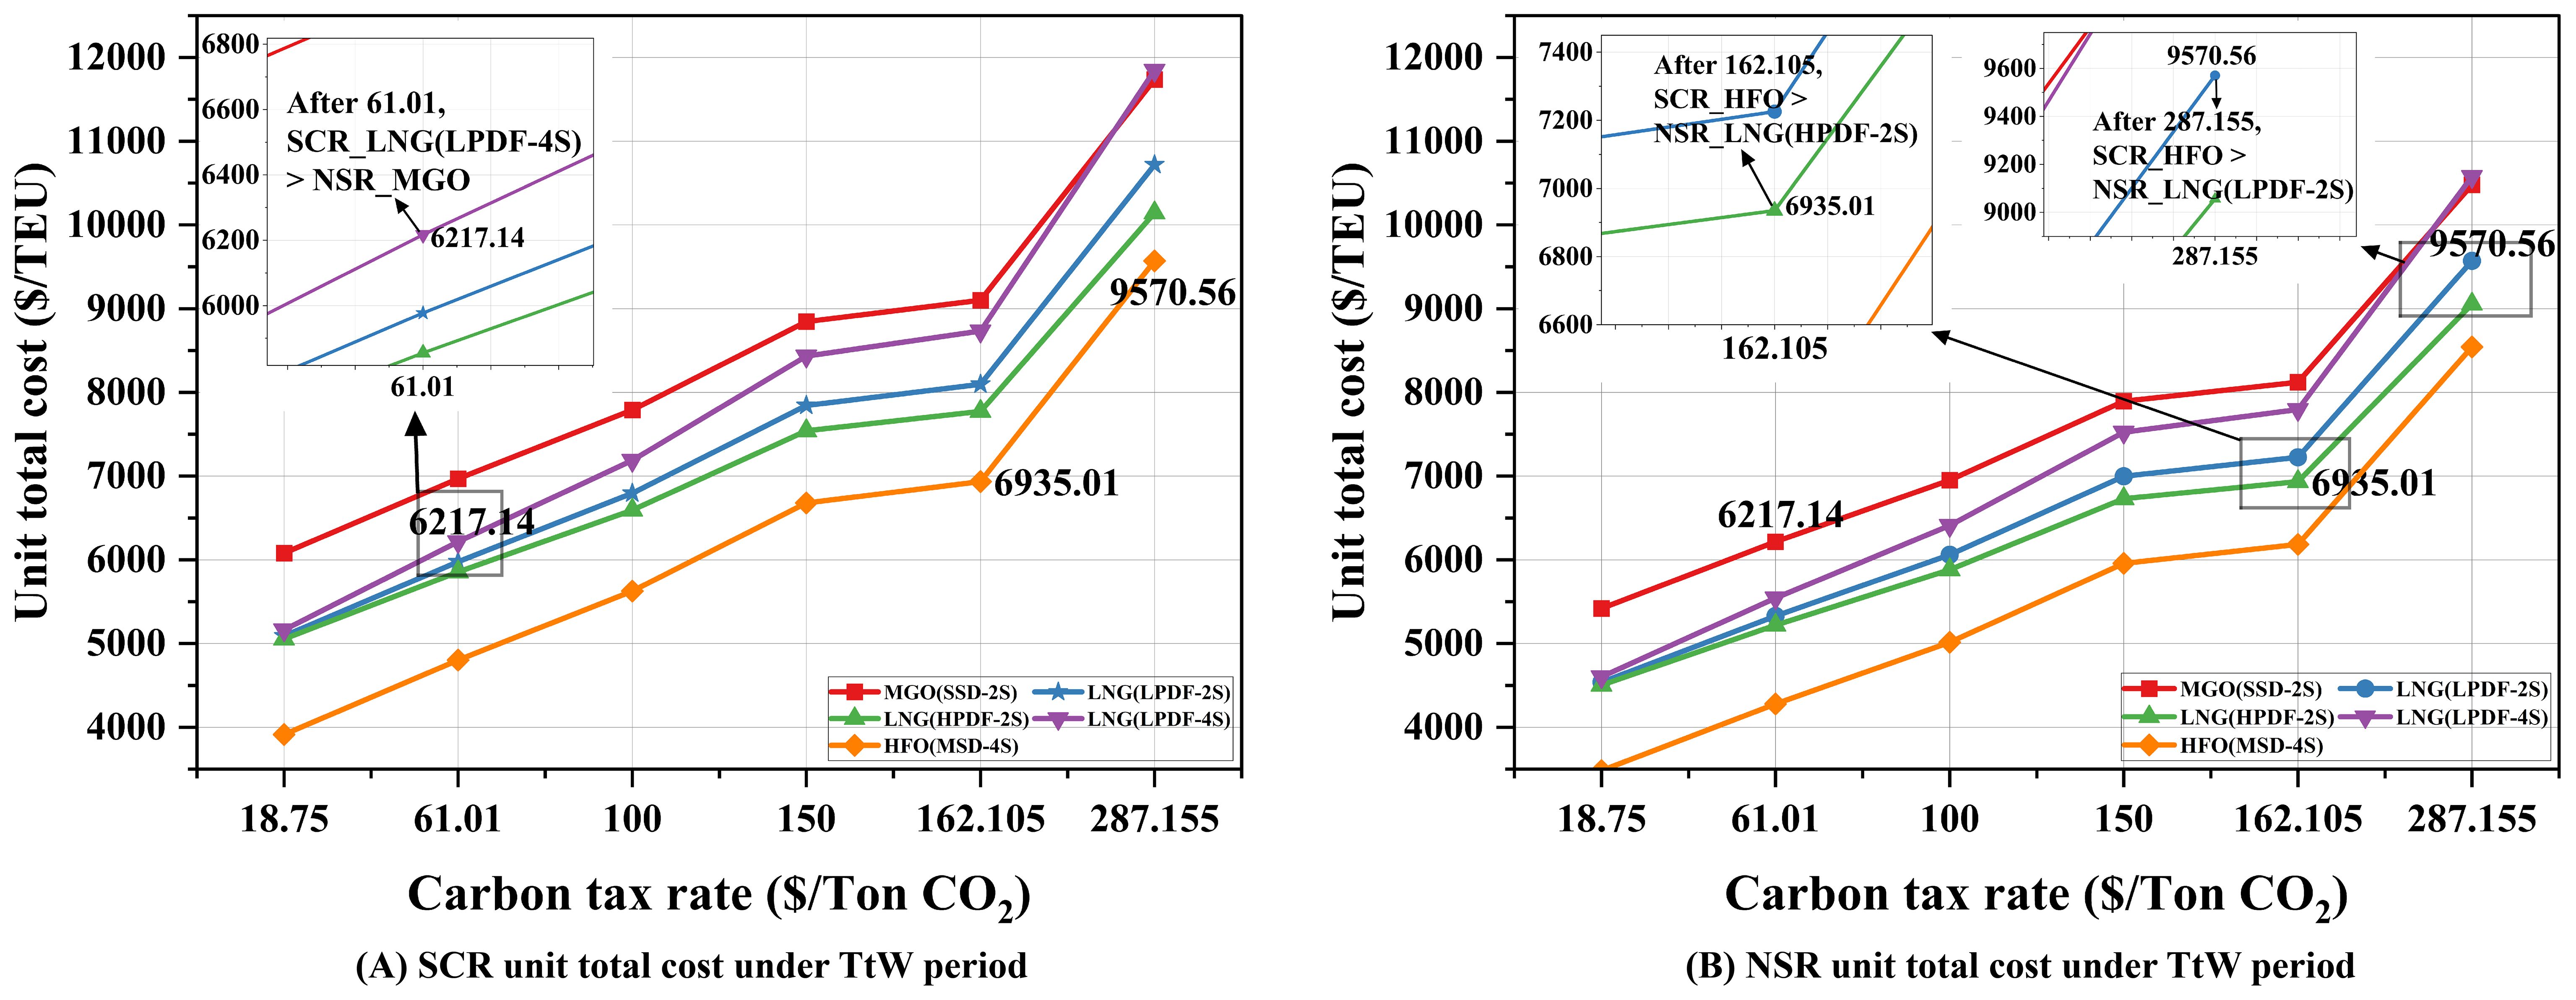
Figure 2. (A, B) Unit total cost under TtW period.
3.2.2 Carbon tax calculation based on WtW
Under the WtW lifecycle perspective, varying carbon tax levels ($18.75/$100/$150 per ton of CO₂ equivalent) exert distinct impacts on route economics (as shown in Figure 3). With identical fuel configurations, SCR’s unit transportation costs persistently exceed NSR’s, consistent with TtW cycle conclusions, but fuel-specific economic rankings undergo structural shifts. LNG’s WtW tax costs rise significantly due to high upstream production and transport emissions (24.5–32.25% higher than TtW phase), eroding its economic advantages. In contrast, HFO and MGO exhibit smaller WtW emission increments (17.25% and 19.4%), maintaining more stable cost profiles.
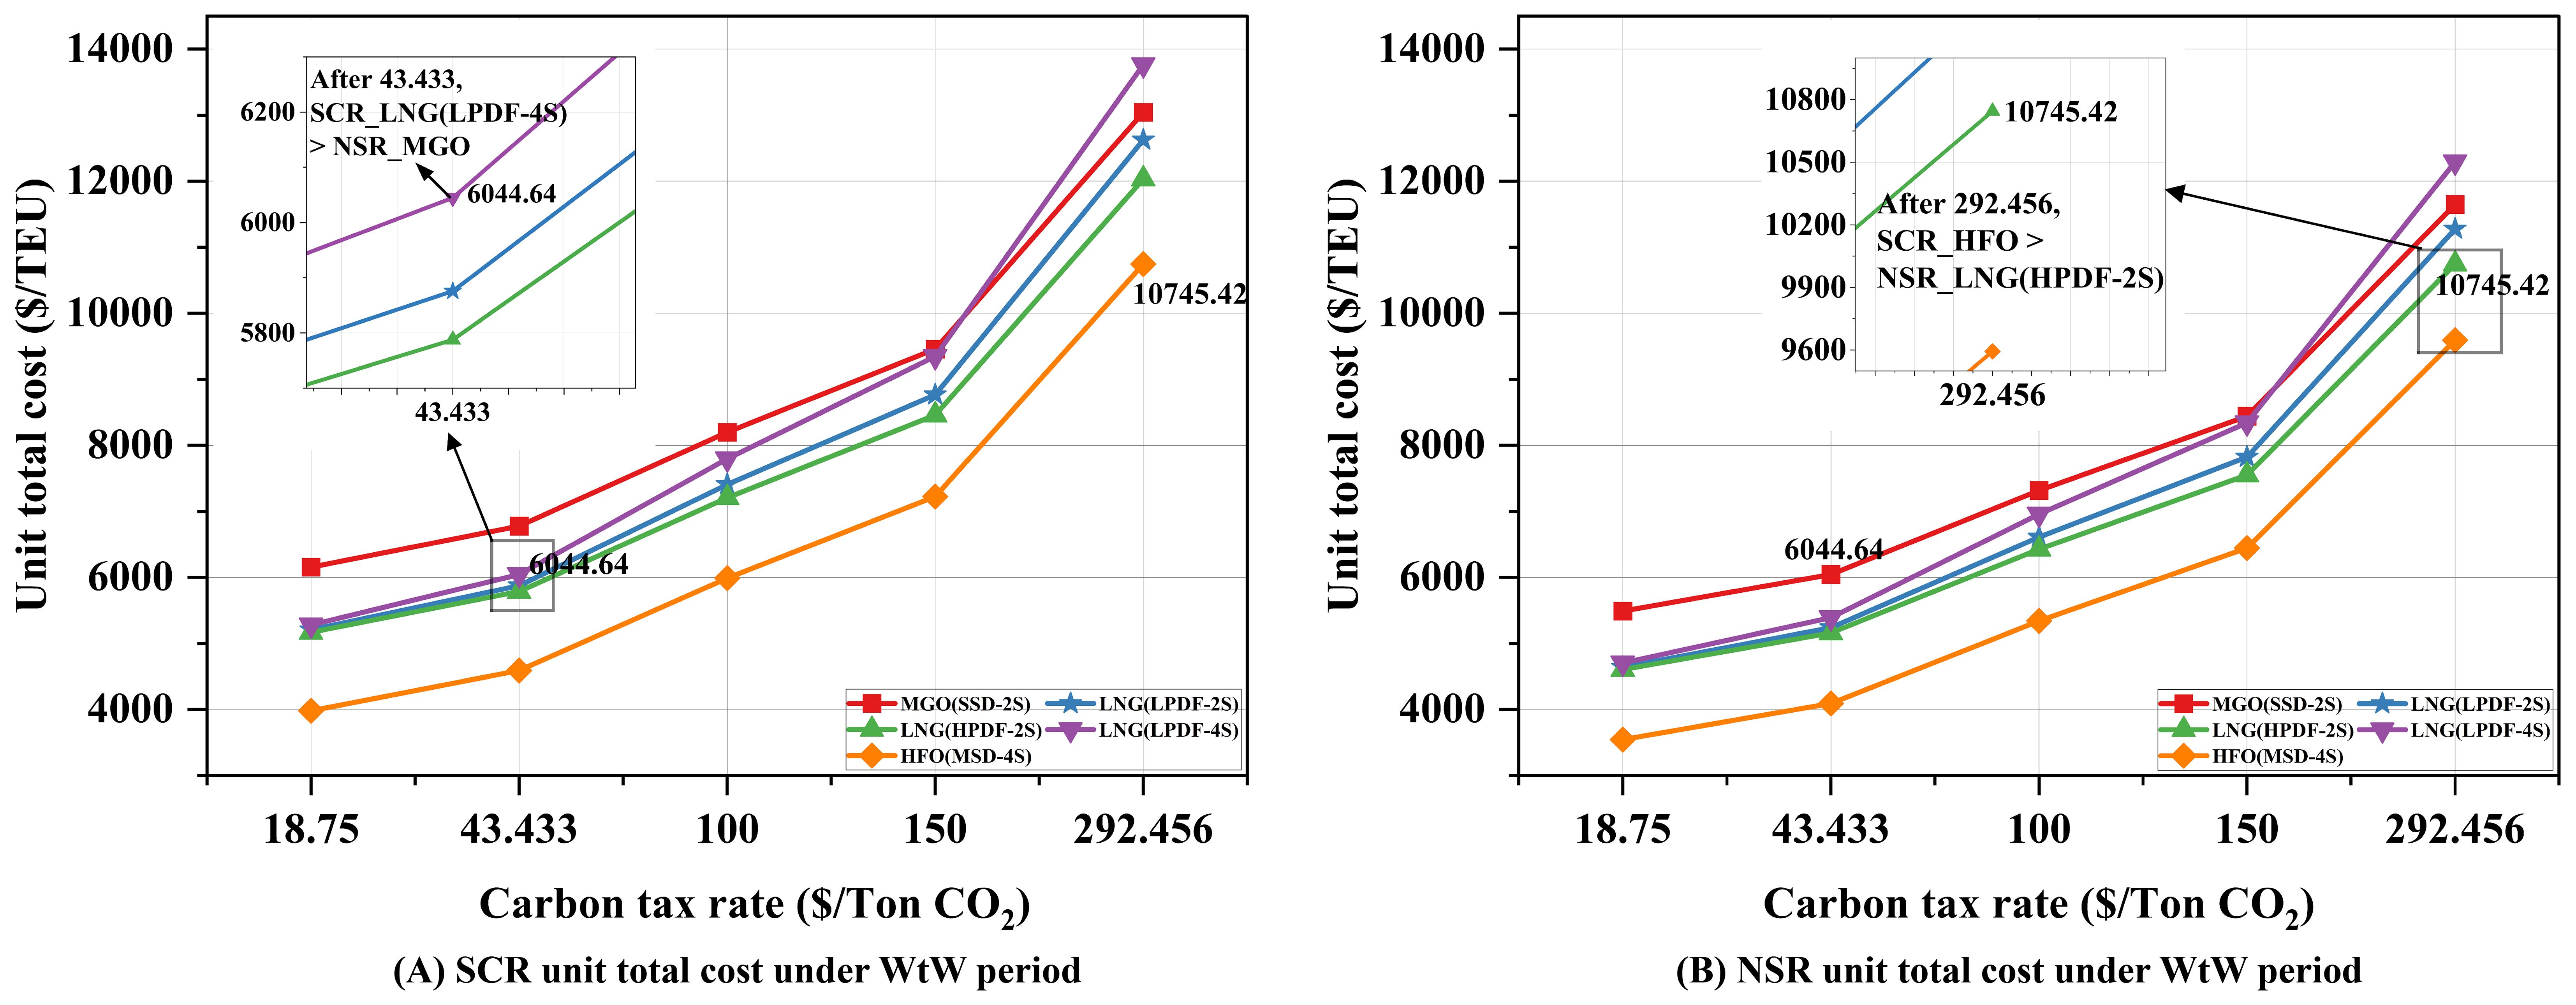
Figure 3. (A, B) Unit total cost under WtW period.
When tax rates remain below $43.433 per ton of CO₂ equivalent, HFO retains optimal economic viability, yet SCR using HFO becomes the practical low-cost option under Arctic HFO ban constraints. As rates reach $43.433 per ton of CO₂ equivalent, SCR’s high-emission LNG solutions are surpassed by NSR’s MGO applications, marking the transition of environmental advantages into economic competitiveness. Notably, under IMO’s maximum tax rate ($150 per ton of CO₂ equivalent), NSR still fails to outperform SCR’s HFO-based economics. Only when rates escalate to $292.456 per ton of CO₂ equivalent does NSR’s low-emission LNG strategy demonstrate cost superiority, exposing the limited incentivizing effect of current carbon tax schemes on Arctic route adoption.
3.2.3 Impact of carbon emissions from fuel production based on WtW carbon tax calculations
The previous section presented detailed calculations of full lifecycle fuel emissions, including the production phase. However, since carbon taxation policies may not always encompass fuel production stages, analyzing emissions excluding this phase becomes necessary. This section compares the economic viability of SCR and NSR based on adjusted emission data. According to Pavlenko et al (Pavlenko and Bryan, 2020), the LNG liquefaction process contributes 30-60% of emissions in the WtT phase, with the remaining emissions primarily originating from production activities. Based on these findings, this study adopts 50% as the proportion of LNG production-related emissions within the WtT phase. For MGO and HFO fuels, which do not require liquefaction processing, production activities constitute a larger share of WtT emissions, estimated at 80% in this research. Table 12 presents the carbon emission coefficients for various fuels after excluding the production phase.
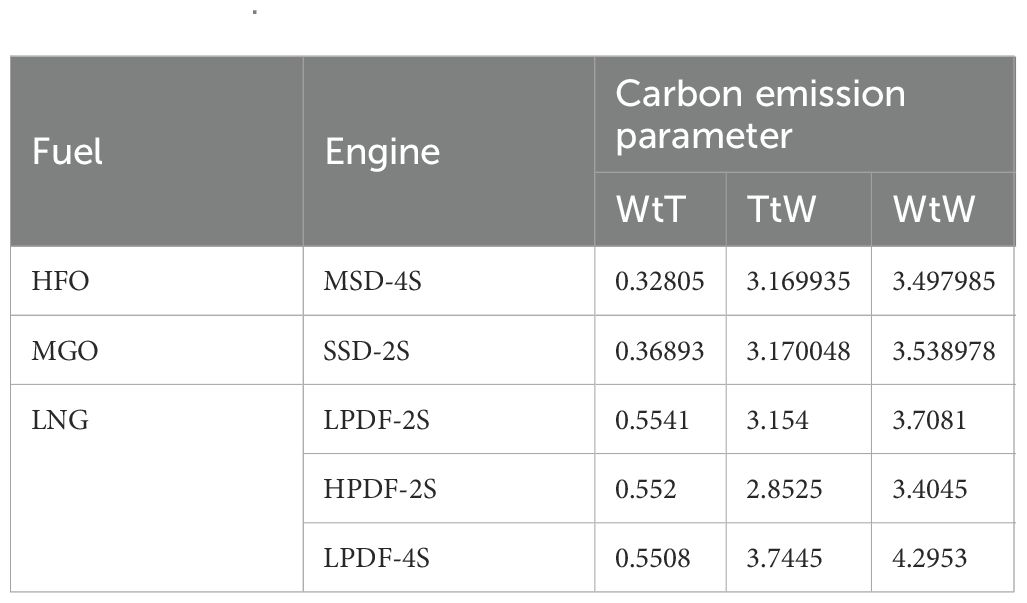
Table 12. Carbon emission parameter without production stage /gCO2 equivalent gfuel-1.
Experimental results in Table 13 demonstrate that removing the fuel production phase reduces unit transportation costs across all scenarios, with cost differentials for identical fuel types widening as carbon tax rates increase. Carbon tax costs are influenced by the combined effects of fuel consumption, fuel price, and carbon emission coefficients (derived from emission volumes). Different fuel types exhibit distinct characteristics: though HFO has a high proportion of production emissions removed (80%), its inherently low WtT emissions result in limited changes to carbon tax costs; MGO, despite relatively low WtT emissions, shows the largest carbon tax cost variations due to its high price; LNG, with moderate pricing but substantial WtT emissions, exhibits significant emission reductions when production emissions are excluded, yielding considerable carbon tax cost decreases. Comparing SCR and NSR routes, the impact of removing production emissions on costs is relatively similar proportionally. Consequently, NSR maintains significant cost advantages that remain robust across various scenarios, demonstrating the consistency of its economic benefits regardless of emission accounting methodologies.
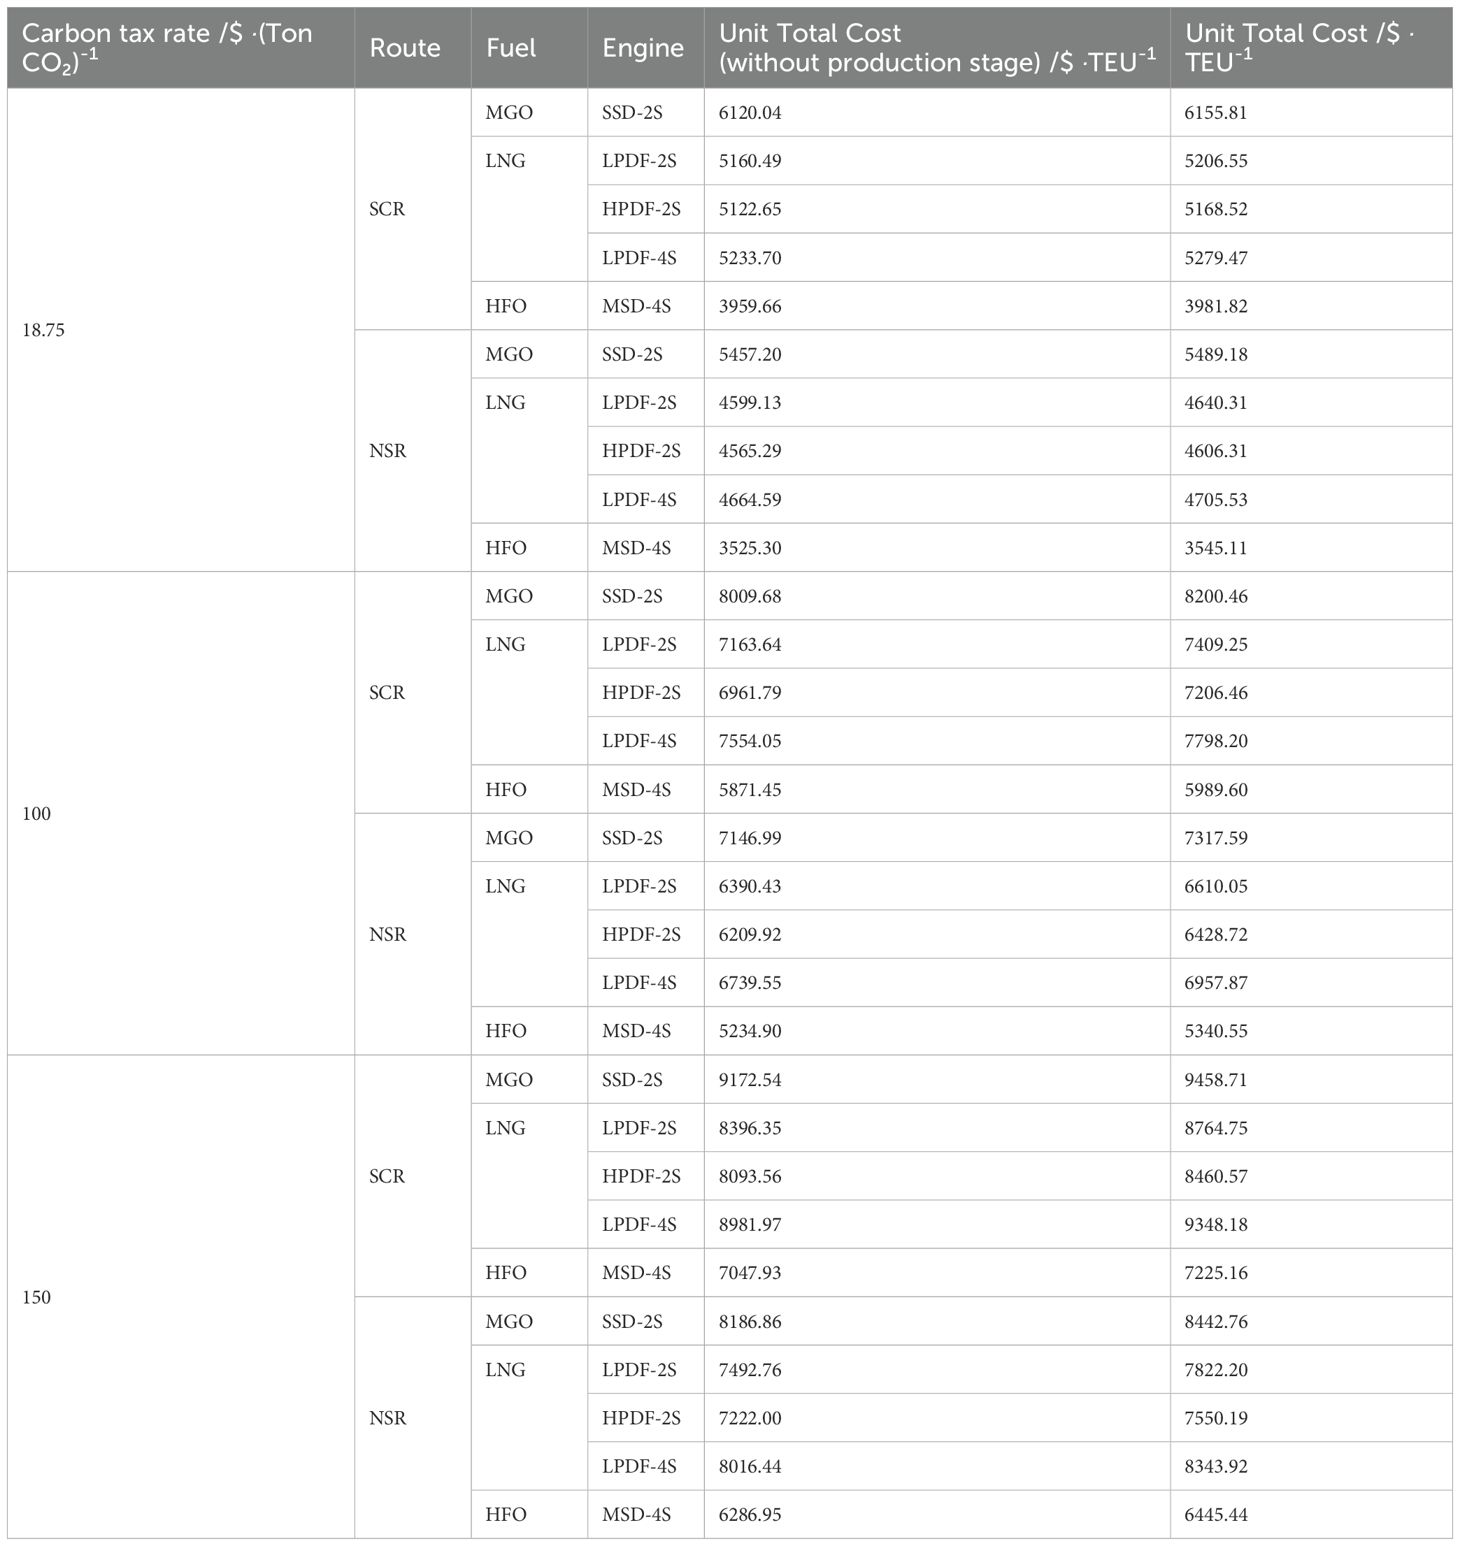
Table 13. Impact of carbon emissions from fuel production based on WtW carbon tax calculations.
3.3 Cost comparison between carbon-taxed NSR and tax-free SCR
3.3.1 Carbon tax calculation based on TtW
Unilateral carbon taxation on NSR creates significant economic disparities compared to the tax-exempt SCR (Figure 4 and Table 14). At low tax rates, NSR maintains competitiveness through its shorter voyage distance advantage. However, this advantage systematically erodes as carbon tax rates increase, with a clear progression of economic tipping points for different fuel types. The economic viability thresholds reveal a distinct hierarchy of fuel sensitivity to carbon taxation. HFO loses its economic advantage first at just $20.57 per ton of CO₂ equivalent, demonstrating its high vulnerability to carbon taxation due to elevated emission intensity. LNG follows with engine-specific thresholds: high-emission engines ($23.02), medium-emission engines ($27.33), and low-emission engines ($30.22) per ton of CO₂ equivalent. MGO demonstrates the greatest resilience, maintaining economic viability until reaching $32.73 per ton of CO₂ equivalent.
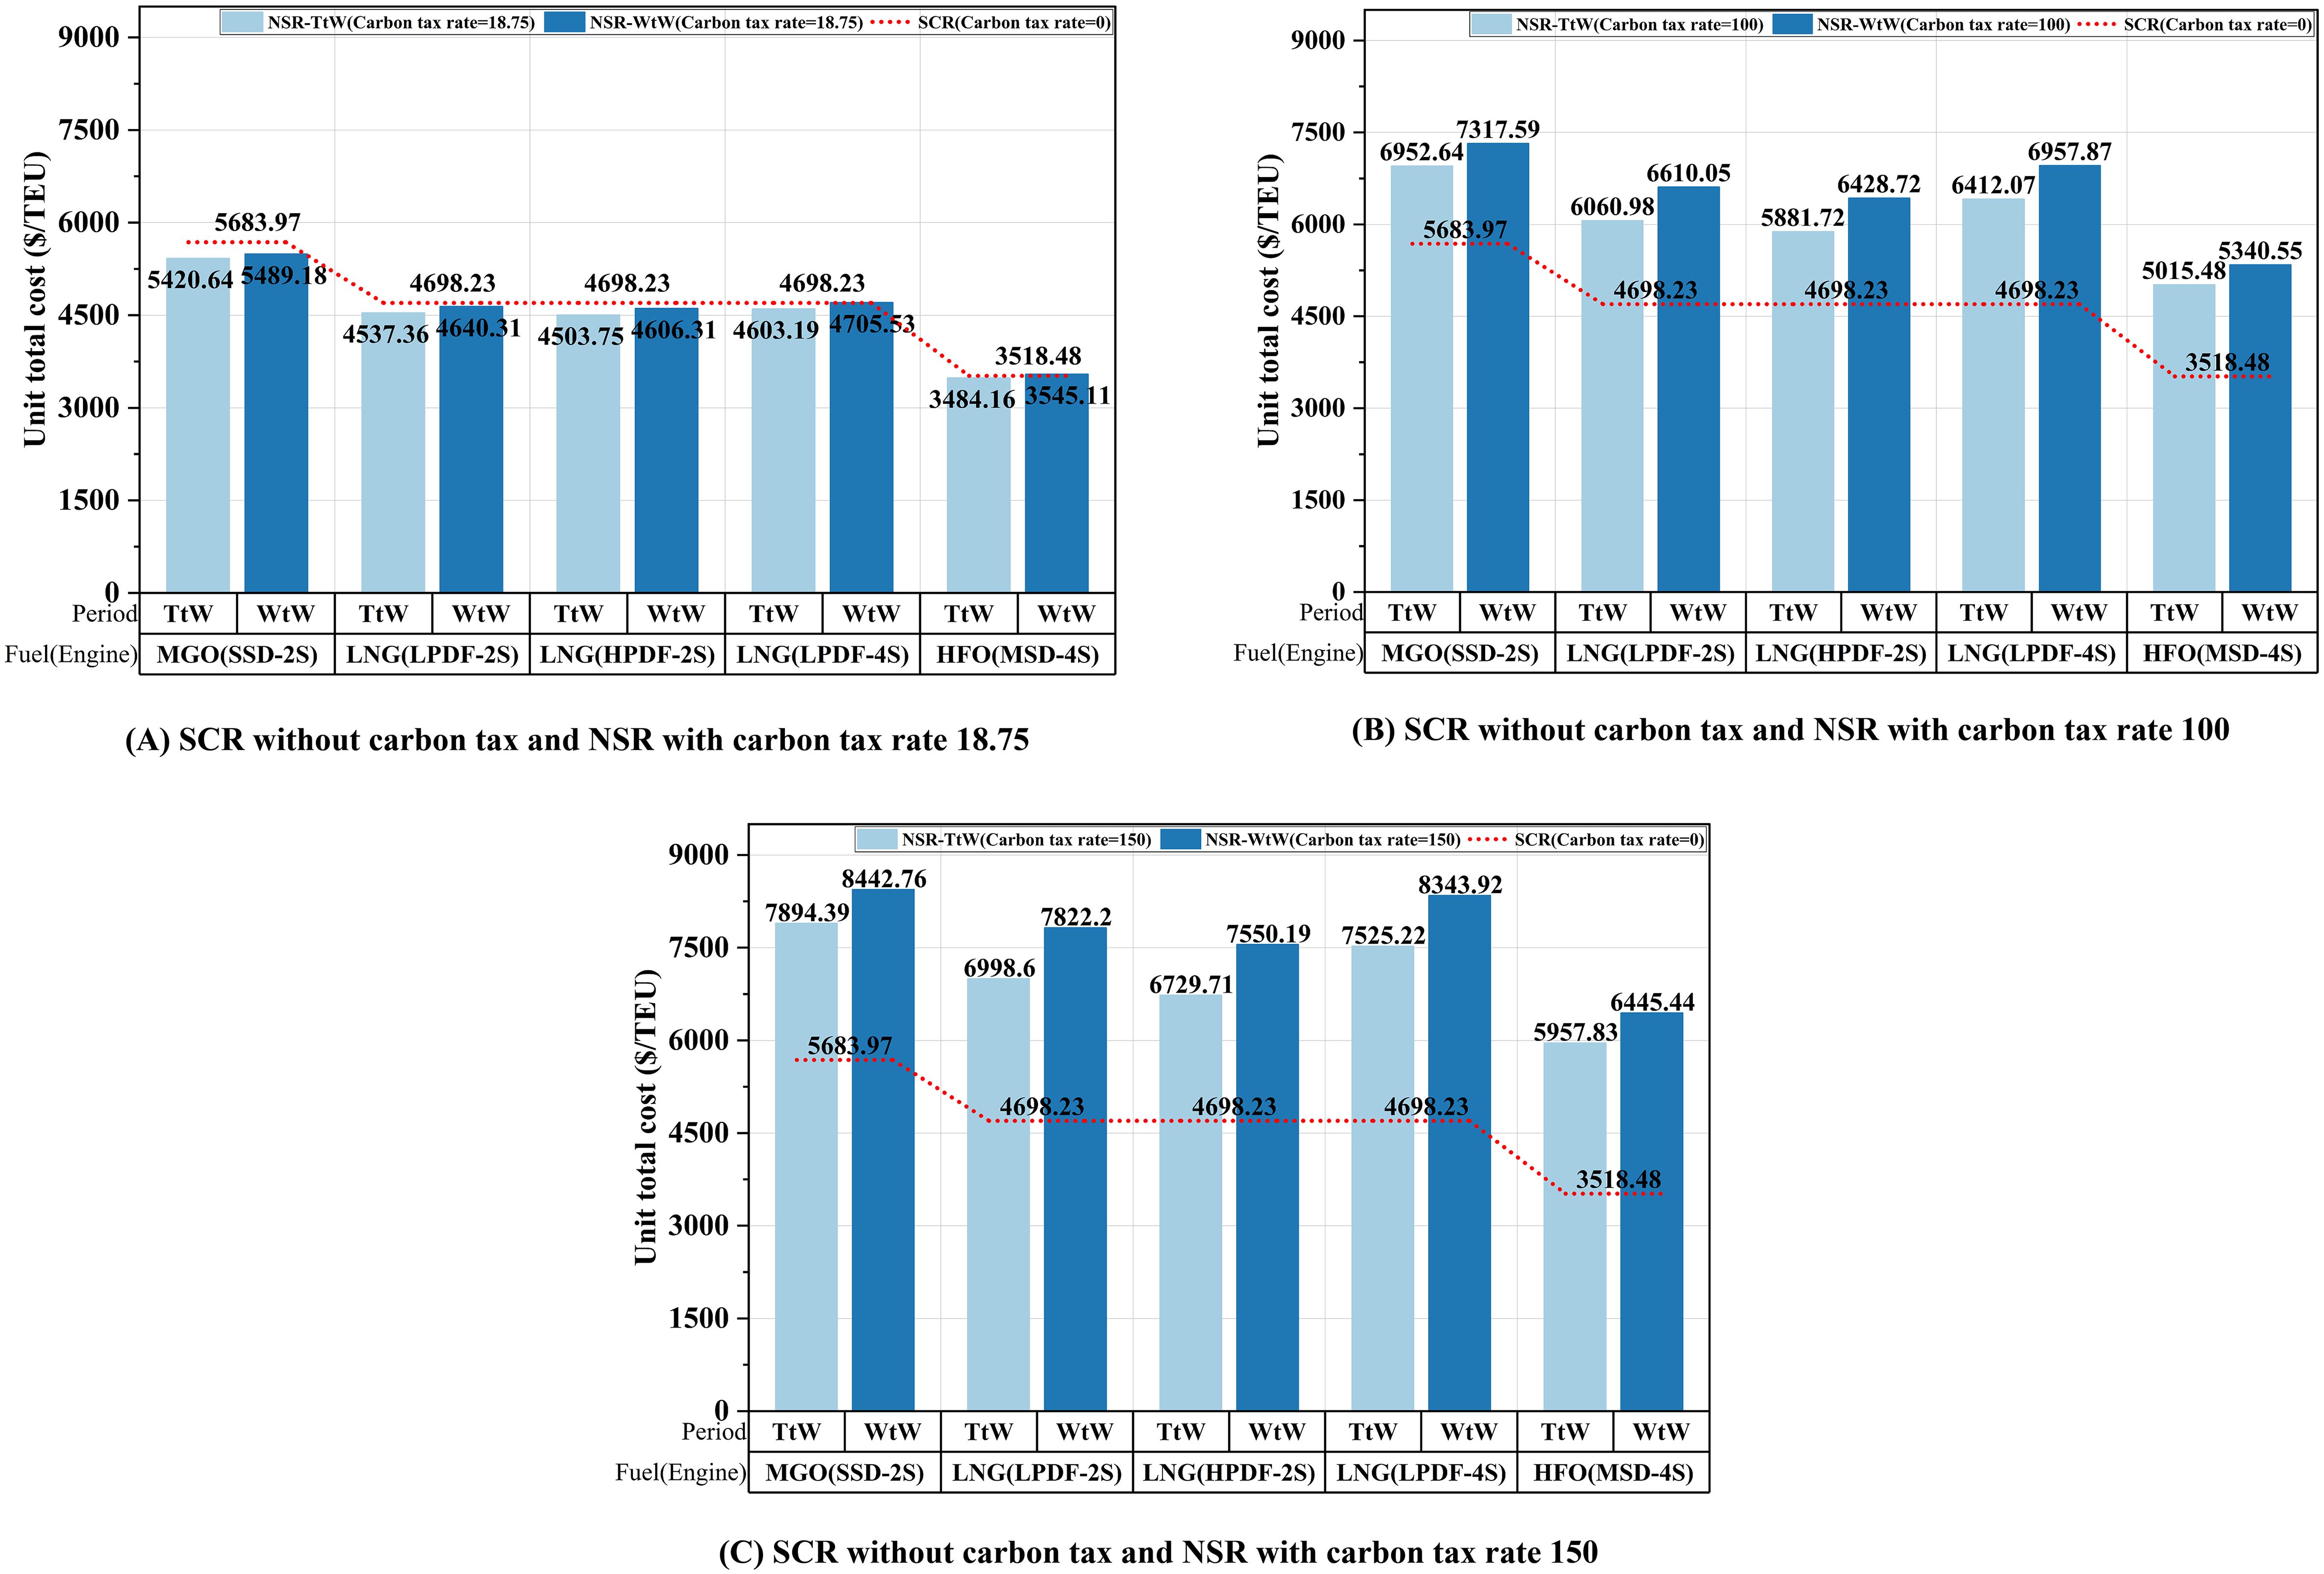
Figure 4. Unit total cost of SCR without carbon tax and NSR with carbon tax.
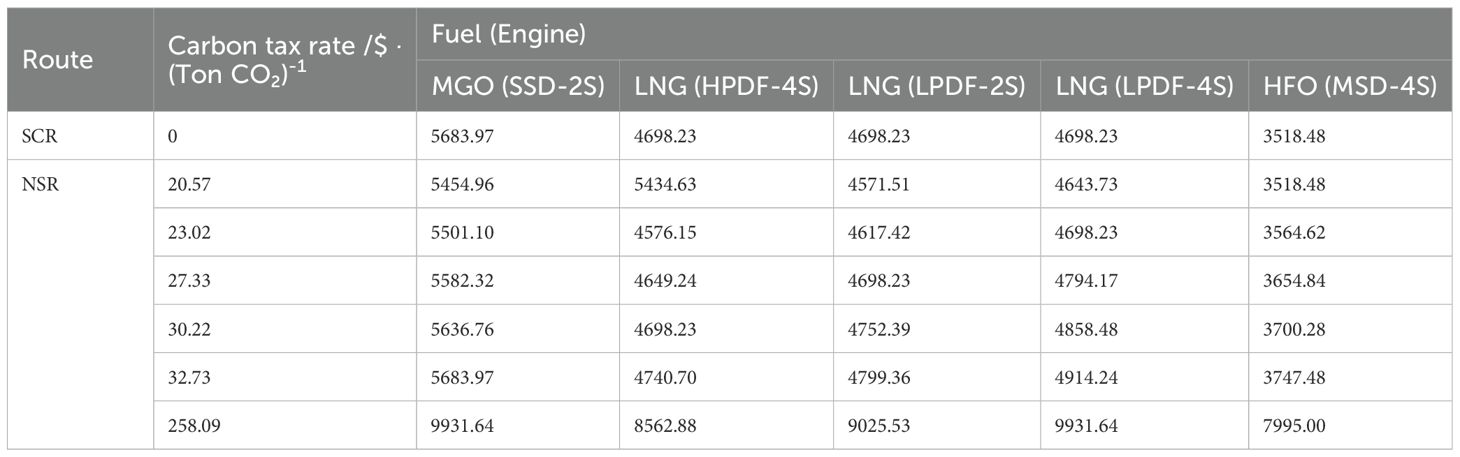
Table 14. Unit total cost of SCR without carbon tax and NSR with other carbon tax under TtW period.
This sequenced transition highlights the varying policy sensitivity across marine fuel technologies, with HFO exhibiting the greatest economic fragility under carbon taxation, while MGO offers superior policy resilience despite higher initial costs. Despite these thresholds, the IMO Arctic HFO ban creates a regulatory paradox: NSR vessels must use cleaner fuels (MGO/LNG), but even at the IMO’s maximum proposed carbon tax rate ($150 per ton of CO₂ equivalent), these environmentally preferable options cannot economically compete with SCR’s untaxed HFO operations. This regulatory asymmetry undermines the intended decarbonization incentives of both policies.
3.3.2 Carbon tax calculation based on WtW
Expanding the analysis to include full lifecycle emissions (WtW) reveals two significant shifts in the economic dynamics between NSR and SCR under asymmetric carbon taxation (as shown in Table 15): First, the economic viability thresholds universally decrease by 23-28% compared to TtW calculations. HFO’s critical point drops to $17.55 per ton of CO₂ equivalent. LNG engines show graduated reductions: high-emission ($18.49), medium-emission ($21.14), and low-emission ($22.85) per ton of CO₂ equivalent. MGO’s threshold decreases to $27.41 per ton of CO₂ equivalent. This systematic reduction in viability thresholds demonstrates that WtW accounting accelerates the economic impact of carbon taxation by internalizing previously excluded upstream emissions.
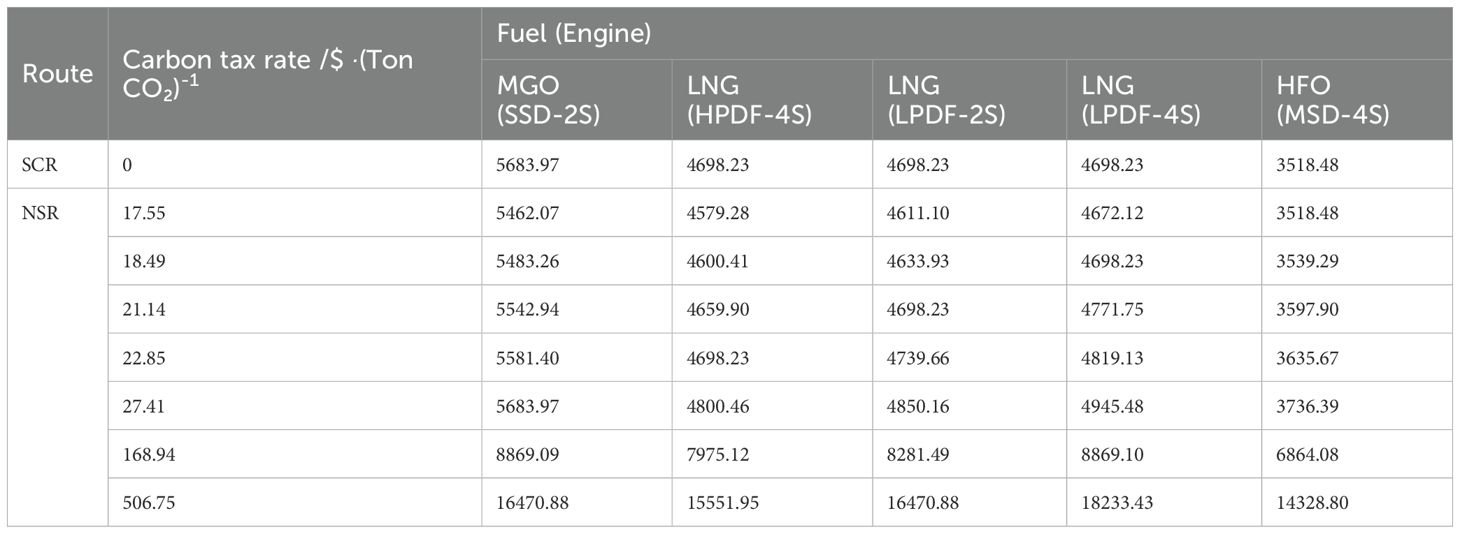
Table 15. Unit total cost of SCR without carbon tax and NSR with other carbon tax under WtW period.
Second, LNG’s economic profile deteriorates significantly under WtW accounting. Most notably, at $506.75 per ton of CO₂ equivalent, medium-emission LNG engine costs exceed MGO solutions—a crossover that does not occur in TtW calculations. This reveals LNG’s particular vulnerability to comprehensive emissions accounting due to its substantial upstream emissions during production and transportation phases, whereas MGO maintains relatively greater policy resilience with more modest full-cycle emission increments (19.4% above TtW).
While WtW analysis generally reinforces TtW trends, it exposes a fundamental contradiction in current environmental policy design: carbon taxation alone creates insufficient alignment between environmental and economic incentives for LNG adoption. The analysis demonstrates that effective environmental policy for Arctic shipping requires a coordinated approach combining carbon taxation with targeted technological standards to address specific challenges like methane slip in LNG engines.
3.4 Cost comparison with navigation condition changing based on WtW
Given the trend of decreasing summer sea ice coverage in Arctic waters, several assumptions in previous calculations warrant reassessment (see Table 16). These include the necessity of ice-class vessels, icebreaker assistance requirements, elevated fuel consumption factors, and speed restrictions. More critically, with continued global warming, these assumptions may become obsolete by 2030, 2035, or beyond. This section reconstructs the calculation model by eliminating all these restrictive assumptions to provide a more comprehensive and objective assessment of NSR’s long-term economic viability compared to SCR.
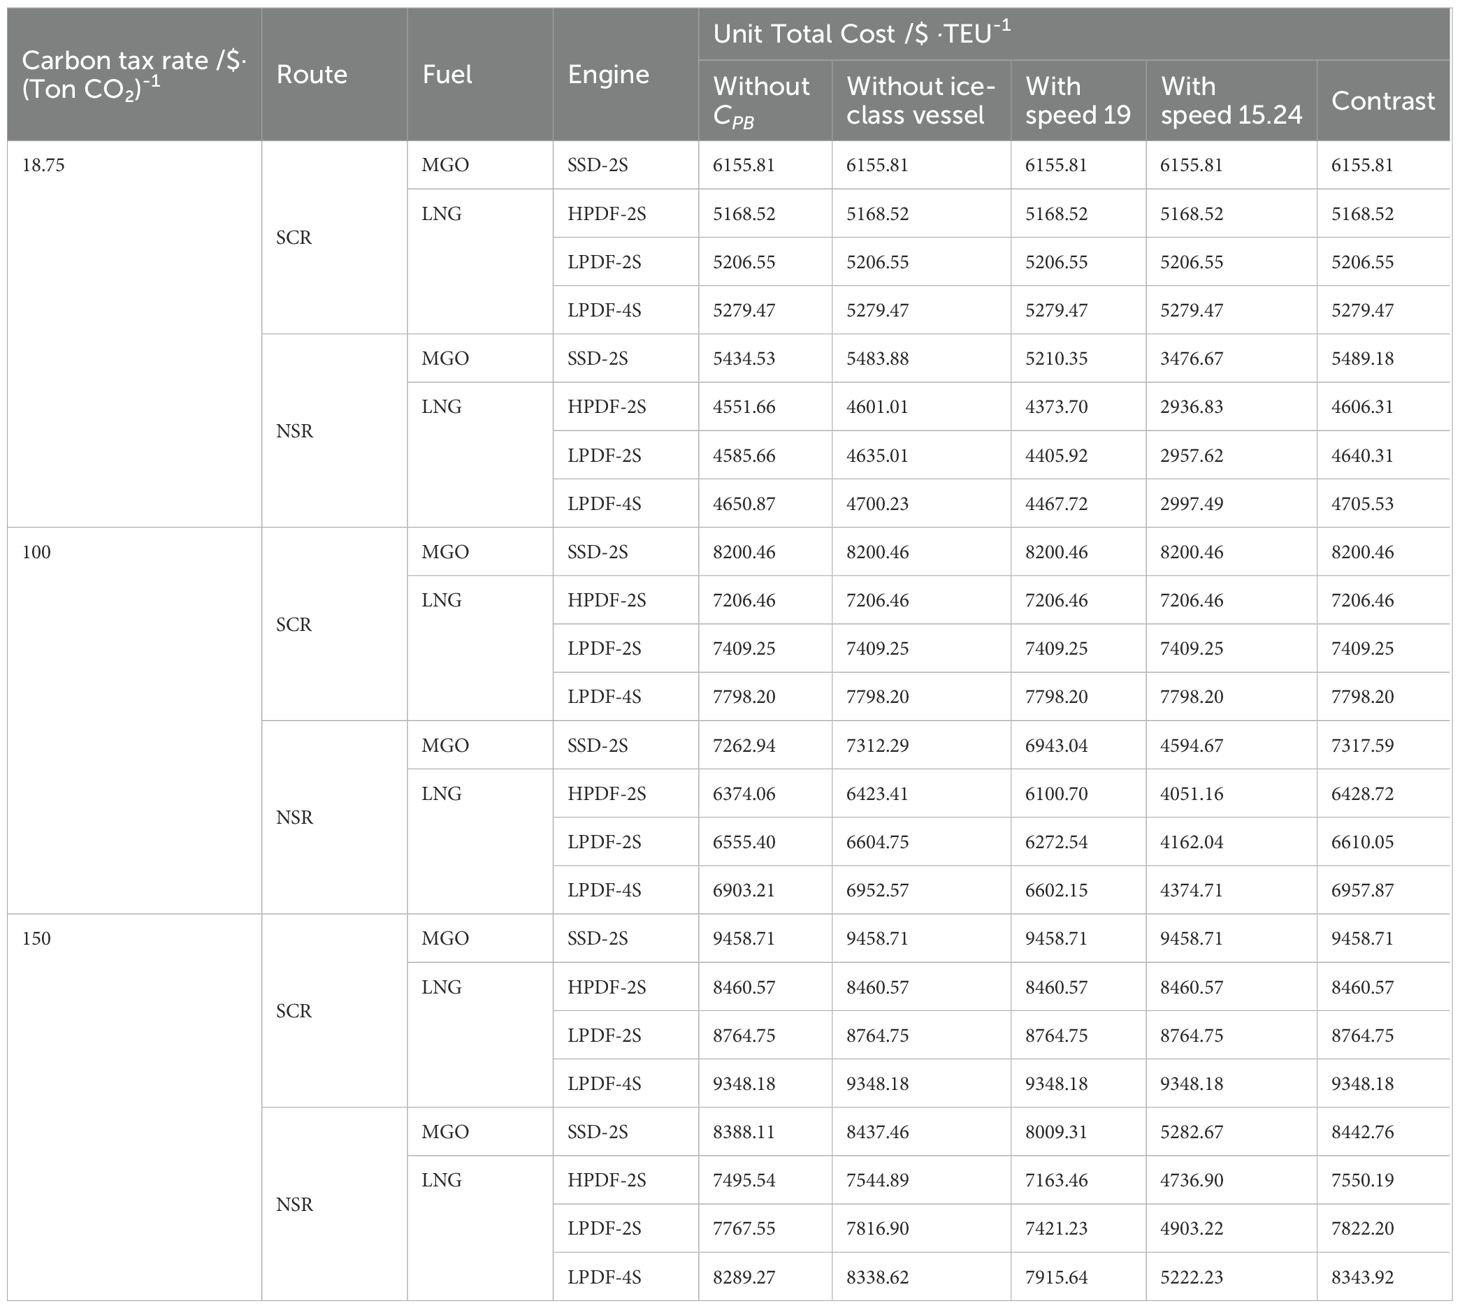
Table 16. Impact of Navigation condition on WtW carbon tax calculations.
As greenhouse effects continue to accelerate Arctic sea ice retreat, multiple studies indicate that NSR’s navigational conditions will gradually approach those of SCR, potentially eliminating the need for ice-class vessels and icebreaker support (Pastusiak, 2020; Li et al., 2021). Based on this premise, this section evaluates the impact on NSR transportation costs (see Table 16). Analysis shows that removing the ice-class vessel requirement reduces NSR unit transportation costs by a fixed $5.3/TEU, enhancing its economic advantage. However, this impact remains relatively limited, primarily because the additional costs of ice-class vessels are effectively distributed through NSR’s higher annual voyage frequency, contributing minimally to unit costs. More significantly, eliminating icebreaker fees reduces NSR route unit transportation costs by a fixed $54.65/TEU. As a key fixed cost component of the NSR route, removing this fee substantially improves NSR’s economic competitiveness relative to SCR.
Continual improvement in NSR navigational conditions will significantly narrow the fuel efficiency gap with SCR and enable more optimal sailing speeds. This section analyzes the impact on unit transportation costs after reducing fuel efficiency coefficient disparities and eliminating speed restrictions, reassessing NSR’s economic performance compared to SCR (see Table 16). Referencing existing research (Cheaitou et al., 2022), this analysis sets NSR’s optimal sailing speed at 19 n mile·hour-1 under ideal navigational conditions, while also comparing cost variations when NSR matches SCR’s speed of 15.24 n mile·hour-1. Results demonstrate significant cost differences across three scenarios: NSR maintaining its original speed of 17 n mile·hour-1 with high fuel factors yields the highest costs; increasing speed to 19 n mile·hour-1, despite non-linear growth in fuel consumption and carbon emissions, shows sufficient fuel efficiency improvements to offset these negative impacts; reducing speed to 15.24 n mile·hour-1 combines lower fuel factors with reduced speed to significantly decrease fuel and carbon tax costs, emerging as the most cost-effective option. The research indicates that with improved fuel efficiency, NSR speed can be optimally adjusted to maintain competitive advantages in both cost and transit time simultaneously.
3.5 Sensitivity analysis
3.5.1 Impact of vessel types based on WtW carbon tax calculations
Vessel size analysis (Figure 5) reveals a nonlinear attenuation in economies of scale: unit transportation cost reductions decelerate significantly for vessels exceeding 10,000 TEU. This stems from dual constraints: Larger vessels dilute unit construction costs through capacity expansion, but physical hull dimension limits restrict further cost reductions. Ultra-large vessels reduce per-TEU canal fee allocations but incur escalating absolute toll charges with increasing tonnage. Under IMO’s three-tier carbon tax scheme, vessel cost rankings remain stable, yet heightened tax intensity diminishes marginal returns from scale effects, particularly pronounced in large vessel categories.
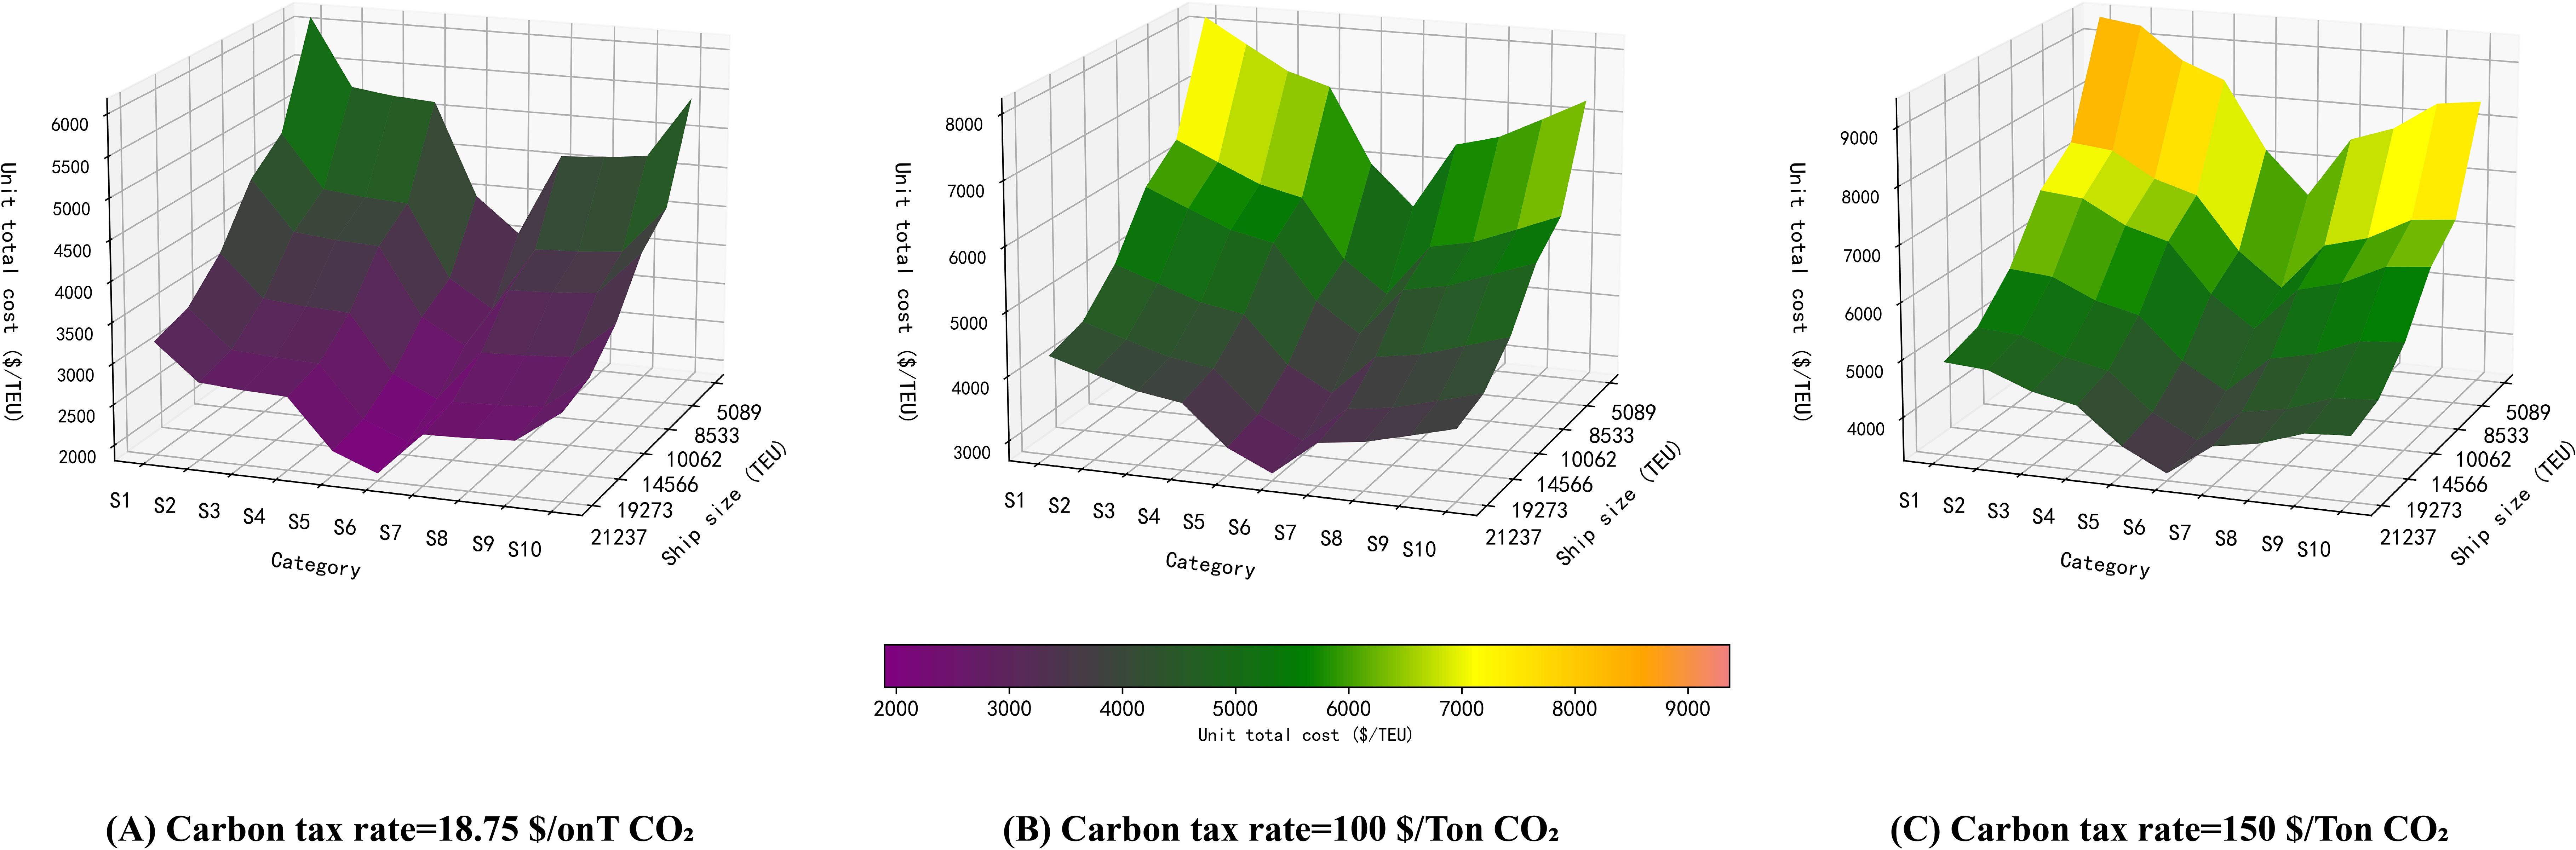
Figure 5. The impact of different ship sizes on unit transportation costs under WtW period.
3.5.2 Impact of ports based on WtW carbon tax calculations
Empirical analysis of the “Flying Fish 1” (Figure 6) reveals significant spatial differentiation in NSR-SCR economic performance across China’s three major ports. Under a $100/ton CO₂e carbon tax scenario: Shanghai Port’s NSR achieves the lowest unit costs through mature route operations, outperforming its SCR counterpart by 10.5%. Dalian Port’s NSR shows only a 12.7% cost reduction over SCR despite geographical advantages due to limited Arctic navigation experience. Shenzhen Port’s SCR maintains a 5.96% cost advantage over NSR, leveraging proximity to traditional route hubs. This spatial pattern stems from dual drivers: northern ports overcome geographical constraints through NSR operational optimization, while southern ports sustain competitiveness via SCR’s established advantages. Shanghai Port’s case demonstrates that route operational maturity can supersede pure geographical advantages, offering critical insights for developing Arctic shipping capabilities.
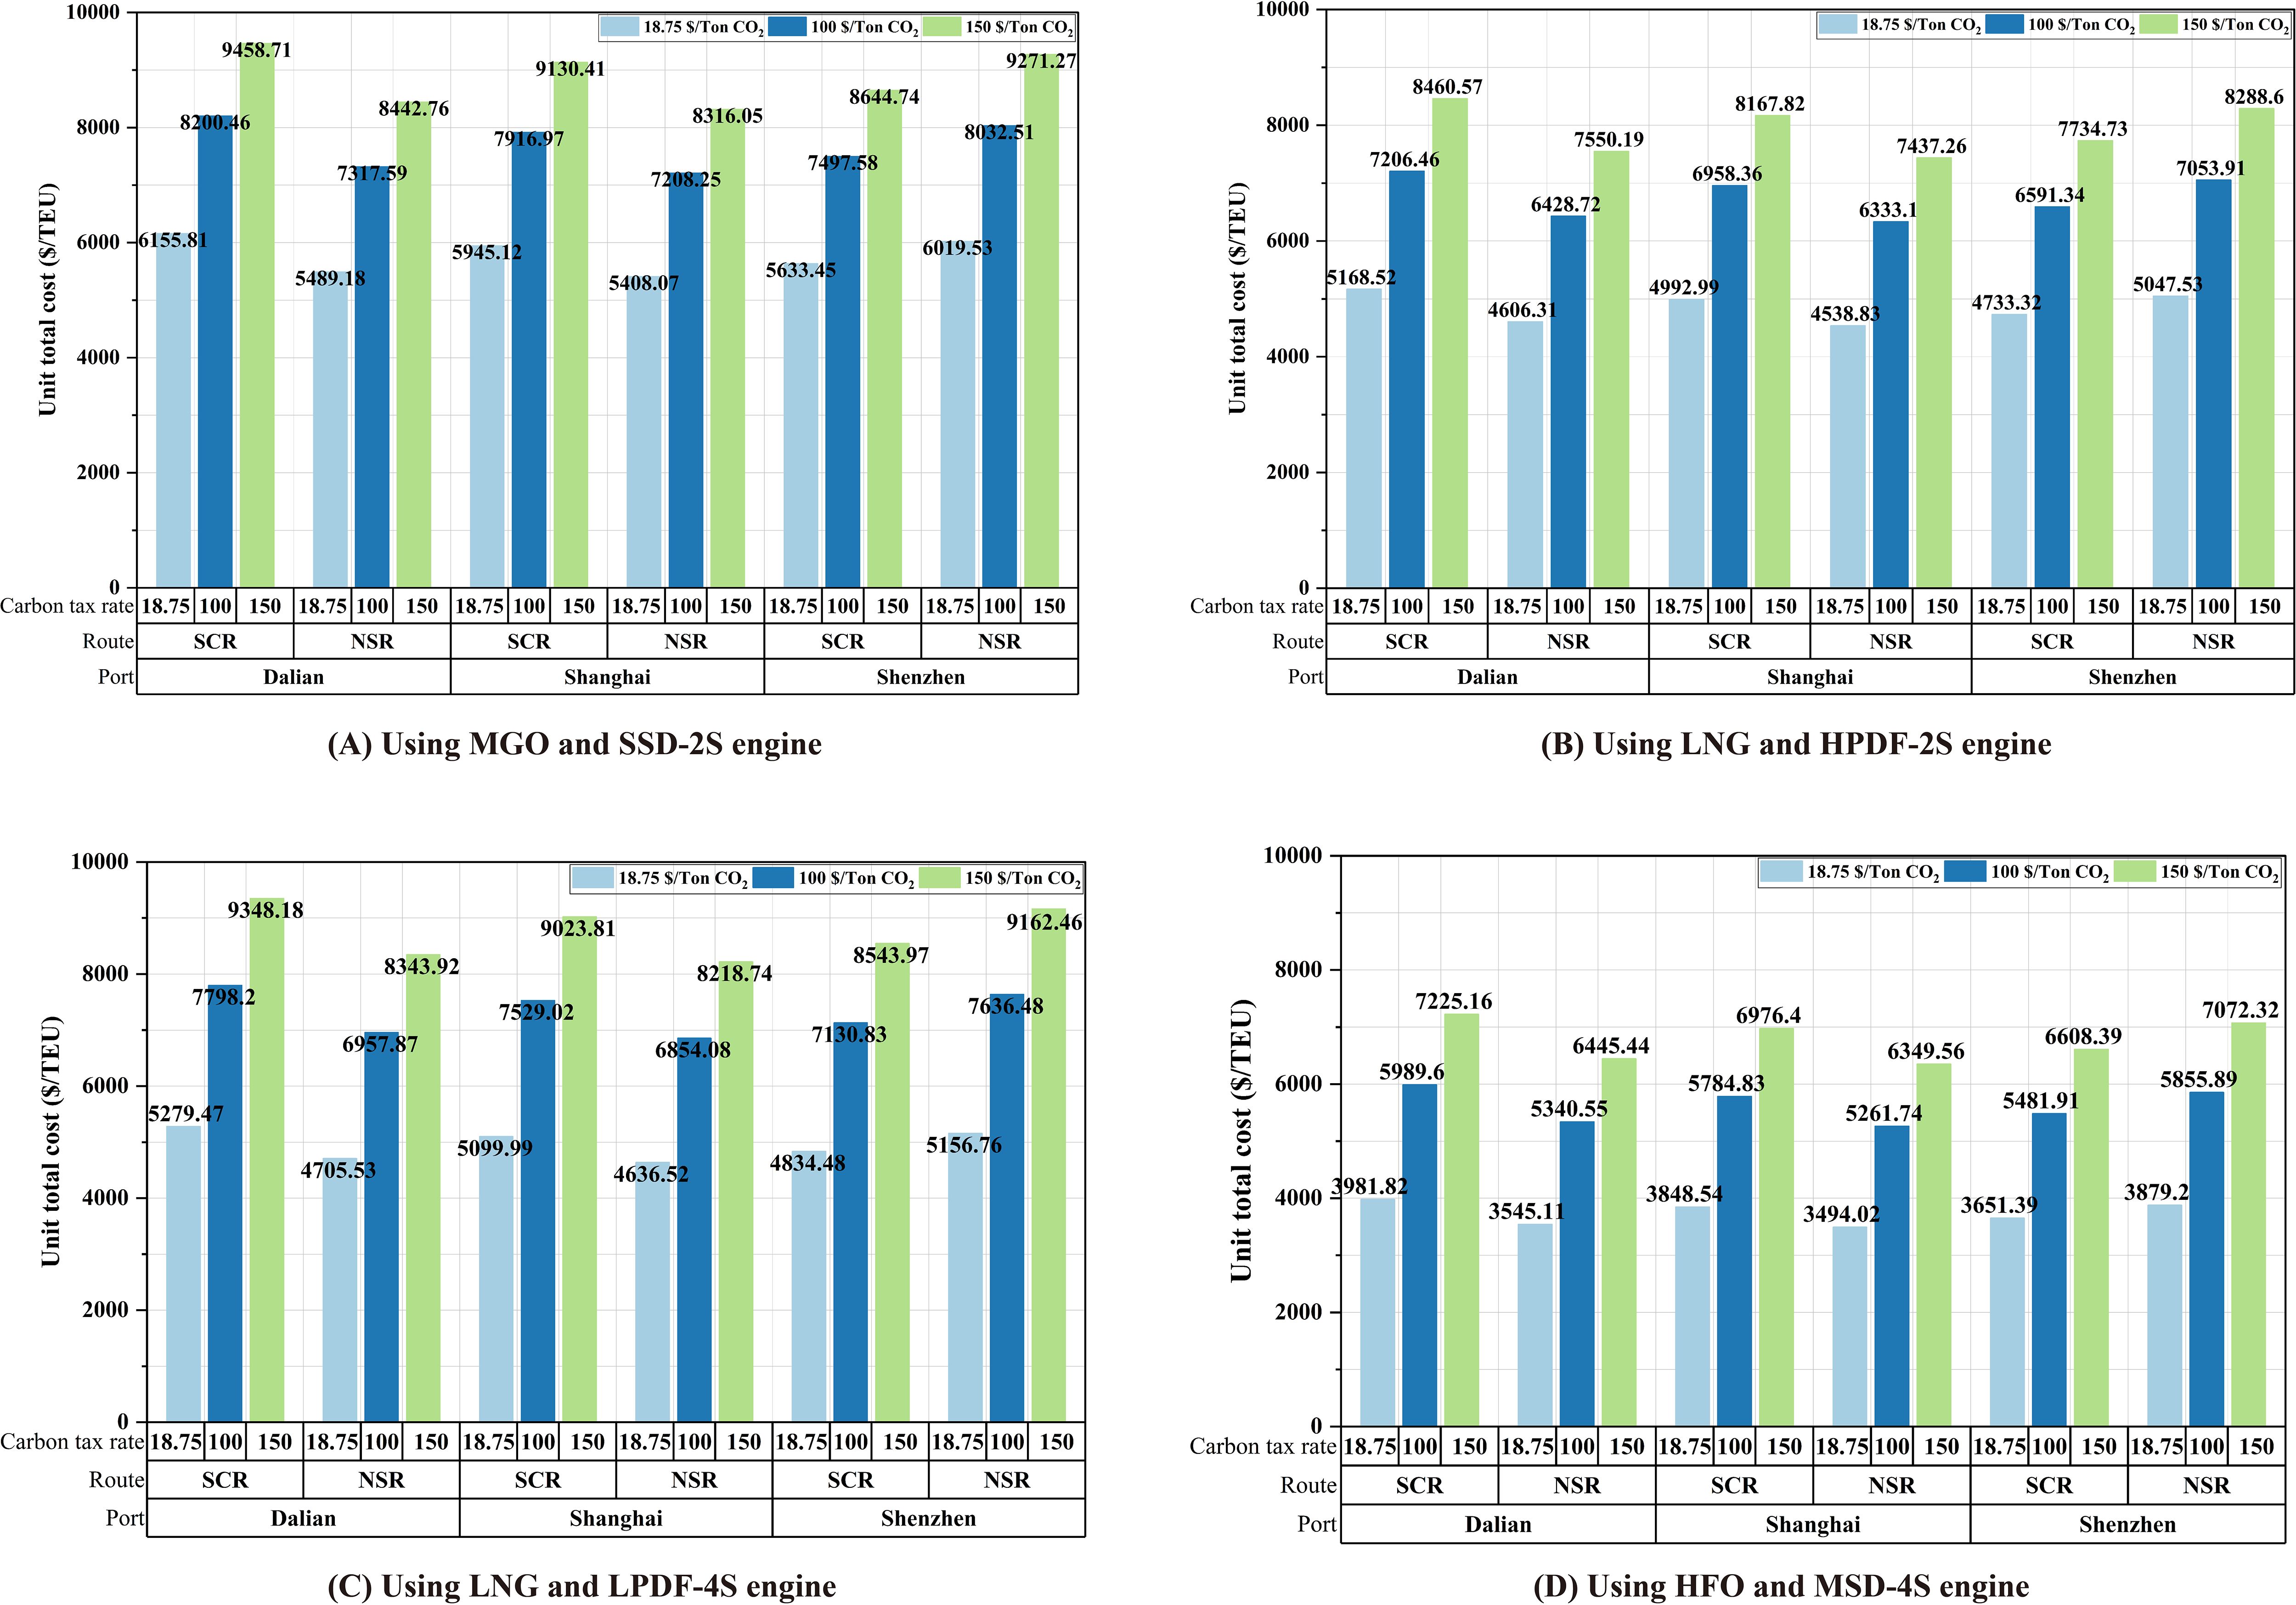
Figure 6. The impact of different ports on unit transport costs under WtW period.
3.5.3 Impact of delay cost
This section examines potential delay costs that shippers might incur due to extended voyage durations across different cargo value scenarios (as shown in Table 17). Research indicates these costs can range from 0.6% to 2.1% of containerized cargo value (Hummels and Schaur, 2013; Goldstein et al., 2022). Our analysis employs two delay cost calculation methodologies: fixed delay ratios and variable delay ratios. Under fixed delay ratios, higher-value cargo typically incurs proportionally higher delay costs, while variable delay ratios assign specific percentages to different cargo types based on their time sensitivity. The analysis focuses on three distinct cargo categories—consumer goods, automotive products, and capital goods—conducting sensitivity analysis on delay costs under asymmetric carbon taxation (NSR taxed, SCR untaxed).
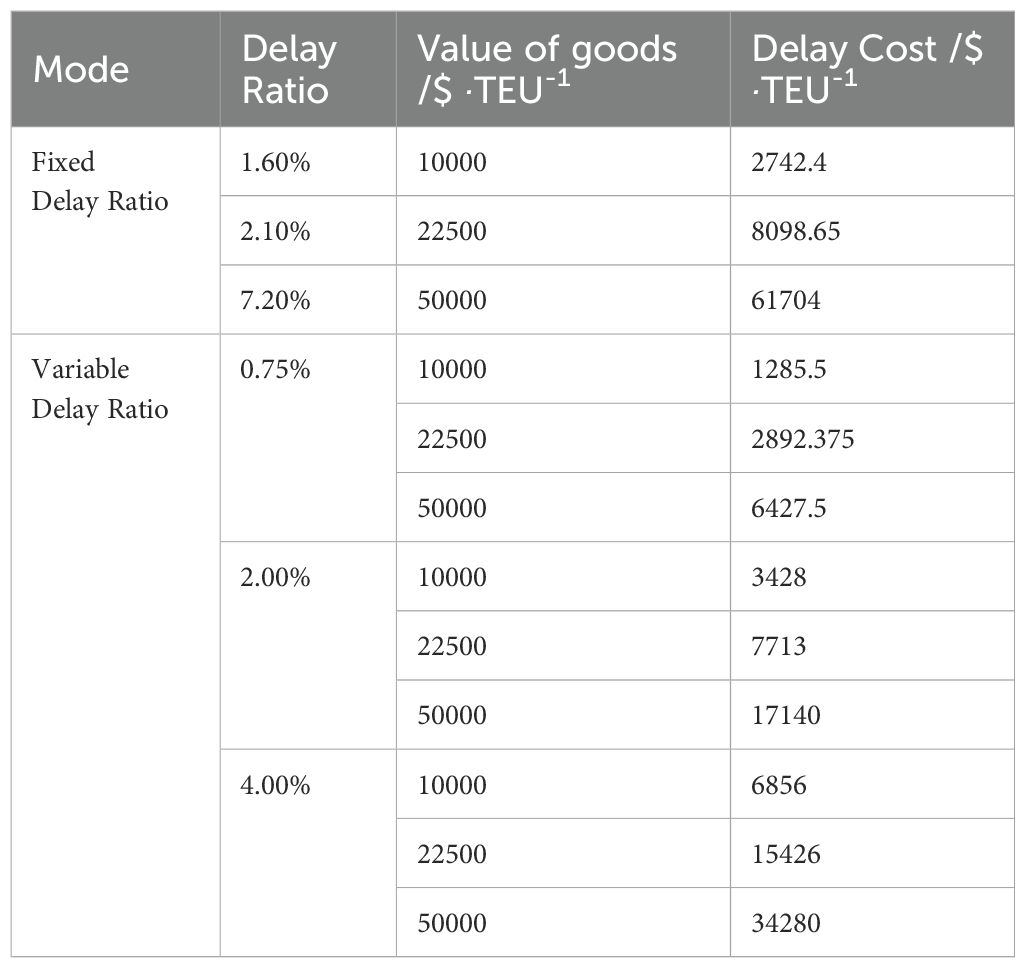
Table 17. Impact of delay cost.
Under fixed delay ratio scenarios with carbon taxation at $18.75 per ton of CO₂ equivalent, NSR’s inherent economic advantages over SCR become more pronounced when delay costs are considered. When carbon tax increases to $100 per ton of CO₂ equivalent, even for consumer goods with the lowest delay cost ratio and cargo value, SCR’s total costs exceed NSR’s, indicating shippers’ willingness to absorb higher carbon tax costs for NSR’s expedited transit. At $150 per ton of CO₂ equivalent, consumer goods show comparable costs between routes, requiring comprehensive evaluation by shippers, while high-value cargo (automotive and capital goods) generates such substantial delay costs that shippers consistently prefer NSR to avoid these additional expenses.
Under variable delay ratio scenarios at $18.75 per ton of CO₂ equivalent, NSR maintains consistent economic advantages, with shippers preferring NSR despite carbon taxation. When carbon tax rises to $100 per ton of CO₂ equivalent with low delay ratios, shippers transporting consumer goods may evaluate both routes, while those shipping high-value cargo prefer NSR due to elevated delay costs; with medium-to-high delay ratios, shippers across all cargo categories favor NSR. At $150 per ton of CO₂ equivalent with low delay ratios, consumer goods shippers may select SCR while capital goods shippers prefer NSR; as delay ratios increase, shipper preference shifts decisively toward NSR to avoid substantial delay costs. Overall, NSR’s economic advantages become most pronounced with high-value cargo and high delay sensitivity, offsetting carbon taxation’s impact on route selection decisions.
4 Conclusions
The rapid retreat of Arctic sea ice has transformed the NSR into a potentially viable alternative to traditional shipping corridors, promising shorter transit times between Asia and Europe. However, this opportunity creates a fundamental tension between economic development and environmental protection in one of Earth’s most fragile ecosystems. Our study examines this tension through the lens of carbon taxation, evaluating whether market-based instruments can effectively balance shipping economics with ecological imperatives. Our findings reveal a significant policy misalignment in current Arctic shipping governance. The IMO’s dual approach—banning HFO in Arctic waters while proposing global carbon taxation—creates unintended consequences that undermine both economic and environmental objectives. Without carbon taxation, the HFO ban places NSR at a 12-17% cost disadvantage compared to the SCR, redirecting traffic to longer routes with potentially higher total emissions. Even with carbon taxation, our Well-to-Wake (WtW) analysis demonstrates that current proposed tax rates (up to $150 per ton of CO₂ equivalent) remain insufficient to overcome this disadvantage and incentivize cleaner Arctic shipping.
The study exposes critical technological dependencies that policy must address. LNG, often promoted as a transitional clean fuel, demonstrates significant sensitivity to engine technology selection, with methane slip from certain engine configurations substantially eroding its environmental benefits. This technological variability creates a complex decision landscape for shipowners that carbon taxation alone cannot effectively navigate. Our spatial analysis reveals that port location and operational maturity significantly influence route economics under carbon taxation. Northern Chinese ports, particularly Shanghai, can leverage NSR advantages despite regulatory constraints, while southern ports maintain SCR competitiveness. This geographic differentiation suggests that carbon tax policies will have regionally varied impacts on shipping patterns and investment decisions.
These findings point to the need for an integrated policy approach beyond simple carbon taxation. Rather than uniform global mechanisms, effective Arctic shipping governance requires a coordinated policy framework that: (1) Aligns carbon taxation thresholds with clean fuel technology standards to create consistent economic signals for shipping operators; (2) Implements dynamic carbon taxation that accounts for technological advancement in engine efficiency and methane slip reduction; (3) Develops differentiated port infrastructure strategies that reflect regional variation in route economics under environmental regulation; (4) Creates targeted incentives for technological innovation that address specific environmental challenges like methane slip in LNG engines.
Data availability statement
The original contributions presented in the study are included in the article/supplementary material. Further inquiries can be directed to the corresponding author.
Author contributions
HM: Conceptualization, Data curation, Funding acquisition, Resources, Writing – original draft. XF: Conceptualization, Methodology, Supervision, Writing – original draft. XL: Methodology, Writing – review & editing.
Funding
The author(s) declare that financial support was received for the research and/or publication of this article. This work was supported by the MOE Liberal Arts and Social Sciences Foundation under Grant No.23YJC790101, the Liaoning Province Social Science Planning Foundation under Grant No.L21CGL008/L21CSH002, and the Liaoning Province Economic and Social Development Research Project under Grant No.2025lslqnkt-048/2025lslqnwzzkt-005.
Conflict of interest
The authors declare that the research was conducted in the absence of any commercial or financial relationships that could be construed as a potential conflict of interest.
Generative AI statement
The author(s) declare that no Generative AI was used in the creation of this manuscript.
Publisher’s note
All claims expressed in this article are solely those of the authors and do not necessarily represent those of their affiliated organizations, or those of the publisher, the editors and the reviewers. Any product that may be evaluated in this article, or claim that may be made by its manufacturer, is not guaranteed or endorsed by the publisher.
References
Carl J. and Fedor D. (2016). Tracking global carbon revenues: A survey of carbon taxes versus cap-and-trade in the real world. Energy Policy 96, 50–77. doi: 10.1016/j.enpol.2016.05.023
Cheaitou A., Faury O., Etienne L., Fedi L., Rigot-Müller P., and Stephenson S. (2022). Impact of CO2 emission taxation and fuel types on Arctic shipping attractiveness. Transp Res. Part Transp Environ. 112, 103491. doi: 10.1016/j.trd.2022.103491
Corbett J. J., Lack D. A., Winebrake J. J., Harder S., Silberman J. A., and Gold M. (2010). Arctic shipping emissions inventories and future scenarios. Atmospheric Chem. Phys. 10, 9689–9704. doi: 10.5194/acp-10-9689-2010
Dalsøren S. B., Endresen Ø, Isaksen I. S. A., Gravir G., and Sørgård E. (2007). Environmental impacts of the expected increase in sea transportation, with a particular focus on oil and gas scenarios for Norway and northwest Russia. J. Geophys Res. Atmospheres. 112, 1–30. doi: 10.1029/2005JD006927
Ding W., Wang Y., Dai L., and Hu H. (2020). Does a carbon tax affect the feasibility of Arctic shipping? Transp Res. Part Transp Environ. 80, 102257. doi: 10.1016/j.trd.2020.102257
Erikstad S. O. and Ehlers S. (2012). Decision support framework for exploiting northern sea route transport opportunities. Ship Technol. Res. 59, 34–42. doi: 10.1179/str.2012.59.2.003
Furuichi M. and Otsuka N. (2013). Cost analysis of the northern sea route (NSR) and the conventional route shipping. Int. Assoc. Marit. Econ. 1–22.
Furuichi M. and Otsuka N. (2015). Proposing a common platform of shipping cost analysis of the Northern Sea Route and the Suez Canal Route. Marit Econ Logist 17, 9–31. doi: 10.1057/mel.2014.29
Gao S., Xin X., Li C., Liu Y., and Chen K. (2022). Container ocean shipping network design considering carbon tax and choice inertia of cargo owners. Ocean Coast. Manag 216, 105986. doi: 10.1016/j.ocecoaman.2021.105986
Goldstein M. A., Lynch A. H., Li X., and Norchi C. H. (2022). Sanctions or sea ice: Costs of closing the Northern Sea Route. Finance Res. Lett. 50, 103257. doi: 10.1016/j.frl.2022.103257
Gong C. (2017). Comparative study of structural design rules for polar icebreaker ships. Ship&Boat 28, 84–93. doi: 10.19423/j.cnki.31-1561/u.2017.01.084.
Gunnarsson B. (2021). Recent ship traffic and developing shipping trends on the Northern Sea Route—Policy implications for future arctic shipping. Mar. Policy 124, 104369. doi: 10.1016/j.marpol.2020.104369
Harrison K. (2010). The comparative politics of carbon taxation. Annu. Rev. Law Soc. Sci. 6, 507–529. doi: 10.1146/annurev.lawsocsci.093008.131545
Hummels D. and Schaur G. (2013). Time as a trade barrier. Am. Econ Rev. 103, 2935–2959. doi: 10.1257/aer.103.7.2935
IMO International Code for Ships Operating in Polar Waters (Polar Code) (IMO). (2025). Available online at: https://www.imo.org/en/ourwork/safety/pages/polar-code.aspx (Accessed 17 Jan 2025).
ISWG-GHG 17 (2024). Consolidation of the proposals for an economic element of the mid-term measures based on a GHG levy/contribution, Int Marit Organ, Vol. 9.
Joseph L., Giles T., Nishatabbas R., and Tristan S. (2021). A techno-economic environmental cost model for Arctic shipping. Transp Res. Part Policy Pract. 151, 28–51. doi: 10.1016/j.tra.2021.06.022
Kavirathna C. A., Shibasaki R., Ding W., and Otsuka N. (2023). Feasibility of the Northern Sea route with the effect of emission control measures. Transp Res. Part Transp Environ. 123, 103896. doi: 10.1016/j.trd.2023.103896
Lack D. A. and Corbett J. J. (2012). Black carbon from ships: a review of the effects of ship speed, fuel quality and exhaust gas scrubbing. Atmospheric Chem. Phys. 12, 3985–4000. doi: 10.5194/acp-12-3985-2012
Lasserre F. (2014). Case studies of shipping along Arctic routes. Analysis and profitability perspectives for the container sector. Transp Res. Part Policy Pract. 66, 144–161. doi: 10.1016/j.tra.2014.05.005
Li X., Lynch A. H., Bailey D. A., Stephenson S. R., and Veland S. (2021). The impact of black carbon emissions from projected Arctic shipping on regional ice transport. Clim Dyn 57, 2453–2466. doi: 10.1007/s00382-021-05814-9
Li Z., Ding L., Huang L., Ringsberg J. W., Gong H., Fournier N., et al. (2023). Cost–benefit analysis of a trans-arctic alternative route to the suez canal: A method based on high-fidelity ship performance, weather, and ice forecast models. J. Mar. Sci. Eng. 11, 711–731. doi: 10.3390/jmse11040711
Lindstad H., Bright R. M., and Strømman A. H. (2016). Economic savings linked to future Arctic shipping trade are at odds with climate change mitigation. Transp Policy 45, 24–30. doi: 10.1016/j.tranpol.2015.09.002
Liu M. and Kronbak J. (2010). The potential economic viability of using the Northern Sea Route (NSR) as an alternative route between Asia and Europe. J. Transp Geogr. 18, 434–444. doi: 10.1016/j.jtrangeo.2009.08.004
Makarova I., Gubacheva L., Makarov D., and Buyvol P. (2021). Economic and environmental aspects of the development possibilities for the northern sea route. Transp Res. Proc. 57, 347–355. doi: 10.1016/j.trpro.2021.09.060
Milaković A.-S., Gunnarsson B., Balmasov S., Hong S., Kim K., Schütz P., et al. (2018). Current status and future operational models for transit shipping along the Northern Sea Route. Mar. Policy 94, 53–60. doi: 10.1016/j.marpol.2018.04.027
Notteboom T. E. and Vernimmen B. (2009). The effect of high fuel costs on liner service configuration in container shipping. J. Transp Geogr. 17, 325–337. doi: 10.1016/j.jtrangeo.2008.05.003
Oh J., Kim D., Roussanaly S., and Lim Y. (2024). Greenhouse gas emissions of shipping with onboard carbon capture under the FuelEU Maritime regulation: A well-to-wake evaluation of different propulsion scenarios. Chem. Eng. J. 498, 155407. doi: 10.1016/j.cej.2024.155407
Østreng W., Eger K., Fløistad B., Jøgensen-Dahl A., Lothe L., Mejlnder-Larsen M., et al. (2013). Shipping in Arctic Waters: A comparison of the Northeast, Northwest and Trans Polar Passages. Shipp Arct Waters Comp Northeast Northwest Trans Polar. Passages 414. doi: 10.1007/978-3-642-16790-4
Otsuka N., Izumiyama K., and Furuichi M. (2013). ) study on feasibility of the northern sea route from recent voyages. Port Ocean Eng. Arct. Cond. 1–10. doi: 10.13140/2.1.1826.3043
Pagano A., Light M., Sánchez O., Ungo R., and Tapiero E. (2012). Impact of the Panama Canal expansion on the Panamanian economy. Marit Policy Manage 39, 705–722. doi: 10.1080/03088839.2012.729273
Park C., Hwang I., Jang H., Jeong B., Ha S., Kim J., et al. (2024). Comparative analysis of marine alternative fuels for offshore supply vessels. Appl. Sci. 14, 11196. doi: 10.3390/app142311196
Pastusiak T. (2020). Navigating a vessel without an ice class on the NSR close to the front of ice-free zone during ice melting period. TransNav Int. J. Mar. Navig Saf. Sea Transp 14, 227–233. doi: 10.12716/1001
Pavlenko N. and Bryan C. (2020). The climate implications of using LNG as a marine fuel. Int Counc Clean Transp ICCT Work. 1–40.
Pruyn J. F. J. (2016). Will the Northern Sea Route ever be a viable alternative? Marit Policy Manag 43, 661–675. doi: 10.1080/03088839.2015.1131864
Pruyn J. F. J. and Van Hassel E. (2022). The impact of adding the Northern sea route to the Belt and Road Initiative for Europe: A chain cost approach. Transp Res. Interdiscip Perspect. 15, 100659. doi: 10.1016/j.trip.2022.100659
Qi X., Li Z., Zhao C., Zhang Q., and Zhou Y. (2024). Environmental impacts of Arctic shipping activities: A review. Ocean Coast. Manag 247, 106936. doi: 10.1016/j.ocecoaman.2023.106936
Quinn P. K., Bates T. S., Baum E., Doubleday N, Fiore AM, Flanner M, et al. (2008). Short-lived pollutants in the Arctic: their climate impact and possible mitigation strategies. Atmospheric Chem. Phys. 8, 1723–1735. doi: 10.5194/acp-8-1723-2008
Raut J.-C., Law K. S., Onishi T., Daskalakis N., and Marelle L. (2022). Impact of shipping emissions on air pollution and pollutant deposition over the Barents Sea. Environ. pollut. 298, 118832. doi: 10.1016/j.envpol.2022.118832
Song J., Xu C., and Wang C. (2024). Impacts of the carbon tax on green shipping supply chain under the port competition. Expert Syst. 41, e13229. doi: 10.1111/exsy.13229
Sui Y., Fu D., and Su F. (2021). Trade volume prediction based on a three-stage model when arctic sea routes open. Symmetry 13, 610–625. doi: 10.3390/sym13040610
Theocharis D., Pettit S., Rodrigues V. S., and Haider J. (2018). Arctic shipping: A systematic literature review of comparative studies. J. Transp Geogr. 69, 112–128. doi: 10.1016/j.jtrangeo.2018.04.010
Tiwari S., Wee H. M., Zhou Y., and Tjoeng L. (2021). Freight consolidation and containerization strategy under business as usual scenario & carbon tax regulation. J. Clean Prod 279, 123270. doi: 10.1016/j.jclepro.2020.123270
Verny J. and Grigentin C. (2009). Container shipping on the northern sea route. Int. J. Prod Econ 122, 107–117. doi: 10.1016/j.ijpe.2009.03.018
Wang G. (2019). The economic analysis of LNG-FSRU construction and operation. Dalian University of Technology. 1–62.
Xiang Z., Xu X., Zhang T., Chen K., and Liu M. (2025). Asia–Europe liner shipping network design model considering Arctic route and black carbon tax. Ocean Coast. Manage. 261, 107492–10809. doi: 10.1016/j.ocecoaman
Xu H. and Yin Z. (2021). The optimal icebreaking tariffs and the economic performance of tramp shipping on the Northern Sea Route. Transp Res. Part Policy Pract. 149, 76–97. doi: 10.1016/j.tra.2021.04.017
Xu H., Yin Z., Jia D., Jin F., and Ouyang H. (2011). The potential seasonal alternative of Asia–Europe container service via Northern sea route under the Arctic sea ice retreat. Marit Policy Manag 38, 541–560. doi: 10.1080/03088839.2011.597449
Yumashev D., Hussen K., Gille J., and Whiteman G. (2017). Towards a balanced view of Arctic shipping: estimating economic impacts of emissions from increased traffic on the Northern Sea Route. Clim Change 143, 1–13. doi: 10.1007/s10584-017-1980-6
Zhang Z. and Baranzini A. (2004). What do we know about carbon taxes? An inquiry into their impacts on competitiveness and distribution of income. Energy Policy 32, 507–518. doi: 10.1016/S0301-4215(03)00152-6
Zhang Y., Meng Q., and Ng S. H. (2016a). Shipping efficiency comparison between Northern Sea Route and the conventional Asia-Europe shipping route via Suez Canal. J. Transp Geogr. 57, 241–249. doi: 10.1016/j.jtrangeo.2016.09.008
Zhang Y., Meng Q., and Zhang L. (2016b). Is Northern Sea Route attractive to shipping companies? Some Insights Recent ship traffic data. Mar. Policy 73, 53–60. doi: 10.1016/j.marpol.2016.07.030
Zhao H., Hu H., and Lin Y. (2016). Study on China-EU container shipping network in the context of Northern Sea Route. J. Transp Geogr. 53, 50–60. doi: 10.1016/j.jtrangeo.2016.01.013
Zhu S., Fu X., Ng A. K. Y., Luo M., and Ge Y.-E. (2018). The environmental costs and economic implications of container shipping on the Northern Sea Route. Marit Policy Manag 45, 456–477. doi: 10.1080/03088839.2018.1443228
Zhu M., Yuen K. F., Ge J., and Li K. (2018). Impact of maritime emissions trading system on fleet deployment and mitigation of CO2 emission. Transp Res. Part Transp Environ. 62, 474–488. doi: 10.1016/j.trd.2018.03.016
Appendix A Table of abbreviations
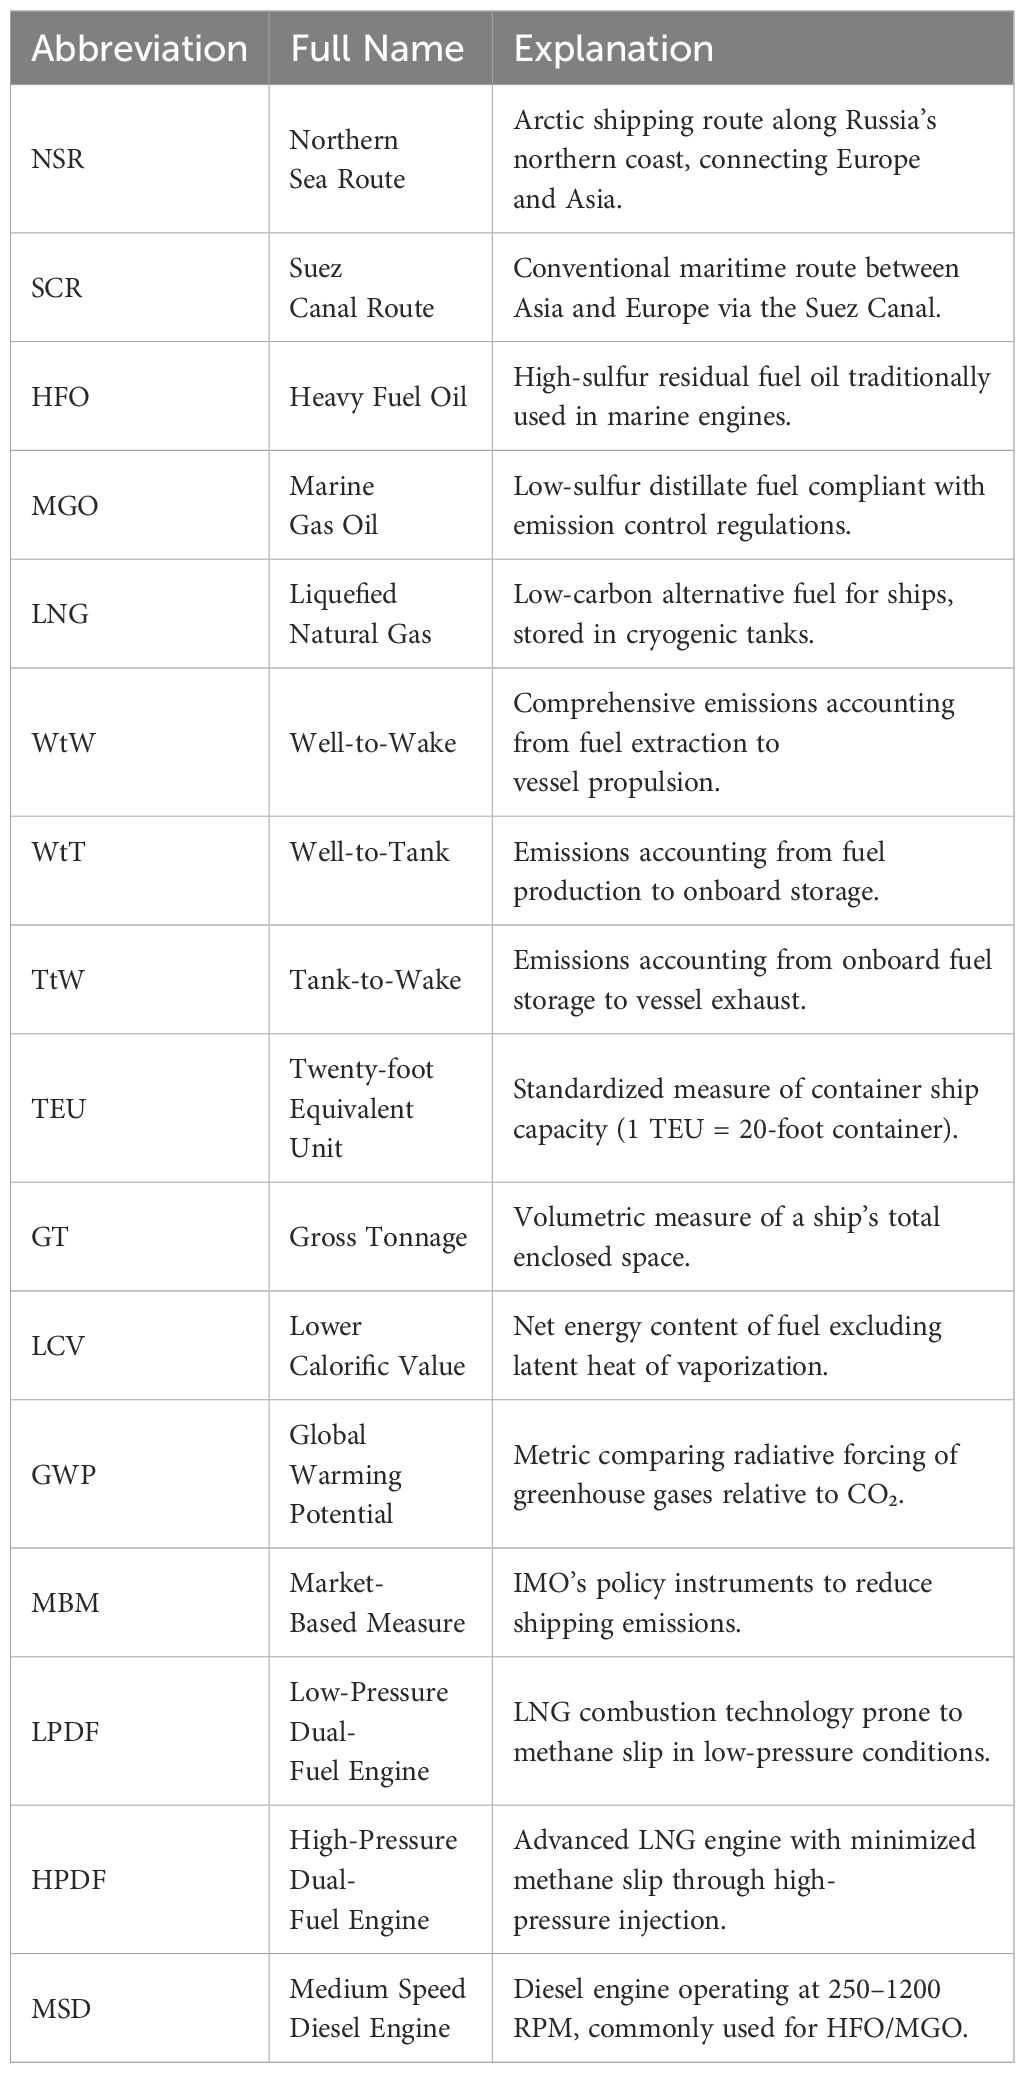
.
Appendix B Table of notation.
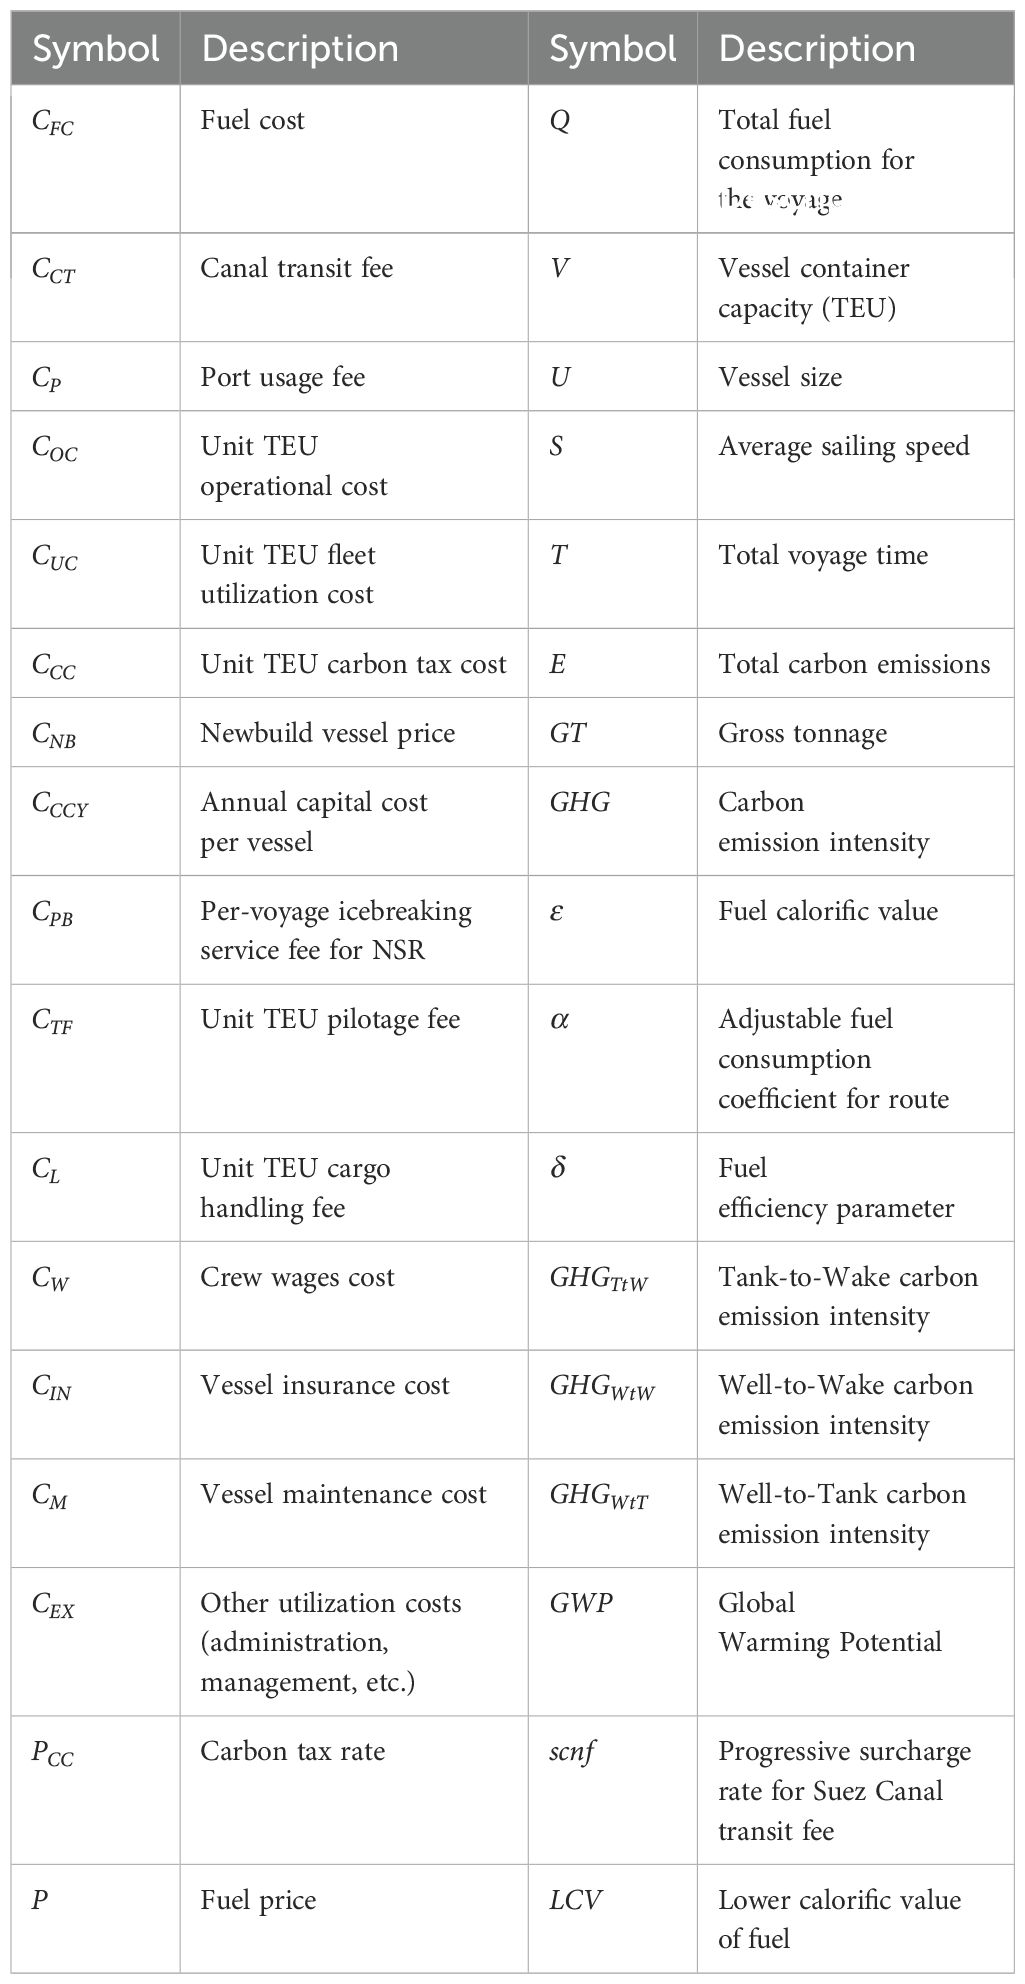
.
Keywords: Northern Sea Route, IMO environmental regulations, economic viability, carbon tax, well-to-wake
Citation: Miao H, Feng X and Li X (2025) Economic viability of arctic shipping under IMO environmental regulations: a well-to-wake assessment of different carbon tax scenarios. Front. Mar. Sci. 12:1575551. doi: 10.3389/fmars.2025.1575551
Received: 12 February 2025; Accepted: 24 April 2025;
Published: 23 May 2025.
Edited by:
Zhongzhen Yang, Ningbo University, ChinaReviewed by:
Carlos Pérez-Collazo, University of Vigo, SpainJiangchen Li, Nanjing University of Aeronautics and Astronautics, China
Wu Li, Kunming University of Science and Technology, China
Michael Goldstein, Babson College, United States
Copyright © 2025 Miao, Feng and Li. This is an open-access article distributed under the terms of the Creative Commons Attribution License (CC BY). The use, distribution or reproduction in other forums is permitted, provided the original author(s) and the copyright owner(s) are credited and that the original publication in this journal is cited, in accordance with accepted academic practice. No use, distribution or reproduction is permitted which does not comply with these terms.
*Correspondence: Xinwei Li, bHh3QGRsbXUuZWR1LmNu