Abstract
The Northern California Current (NCC) system is a productive coastal ecosystem with a mosaic of temporal and spatial features. The phytoplankton community plays a crucial role in supporting the rich ecosystem and economically important fisheries of the NCC. Our study integrates data across two years (2022-2023) and multiple transects to investigate the community composition of two major phytoplankton groups in the NCC: picocyanobacteria and photosynthetic picoeukaryotes (PPE). The abundances and cell sizes of the phytoplankton were measured using flow cytometry. We found PPE present at similar concentrations in both summer and winter, while picocyanobacteria were much more abundant in the summer than the winter. The relationship between the picocyanobacteria and PPE varied across on- to off-shore transects with different coastal bathymetry. Abundances of both picophytoplankton increased with distance from shore. Cell size also varied along these gradients. Sampling during a marine heatwave in summer 2023 revealed a shift towards smaller picophytoplankton. Overall, these data reveal a dynamic microbial community underlying a productive coastal system, which could inform management decisions and future ecosystem models in the context of climate change and marine heat waves.
1 Introduction
Marine phytoplankton are key players in the ocean ecosystem, producing about 50 Pg C yr-1 or nearly half of global net primary production (Beardall et al., 2009; Behrenfeld and Falkowski, 1997; Field et al., 1998; Longhurst et al., 1995). Phytoplankton can also indicate ecosystem health and larval fish biomass (Frederiksen et al., 2006) and fuel the microbial loop (Azam et al., 1983; Cole et al., 1988; Worden et al., 2015), and thus have a strong impact on life in the ocean. Understanding the drivers of phytoplankton in a dynamic ecosystem is crucial, as fluctuations in phytoplankton communities can trigger large changes in oxygen production, carbon sequestration, and biogeochemical cycles (Richardson and Schoeman, 2004).
Phytoplankton size can indicate their roles in an ecosystem, such as trophic level, metabolic rate, and relative abundance compared to organisms of other sizes (Heneghan et al., 2019). The differences in nutrient requirements between large and small phytoplankton can partially explain their distribution: smaller cells are more often associated with oligotrophic areas where nutrients are recycled, and larger cells dominate nutrient-rich areas with variable environmental inputs such as upwelling or river runoff (Cermeño and Figueiras, 2008; Stukel et al., 2024; Vallina et al., 2023). Because phytoplankton cell size drives important functions such as nutrient uptake, predation, biomass, and ecosystem-level productivity (Stukel et al., 2024; Taylor and Landry, 2018; Wickman et al., 2024), understanding size structure can lead to a more complete understanding of marine ecosystems and their responses to environmental changes.
The smallest phytoplankton, the picophytoplankton (≤ ~2 µm in diameter), are among the most abundant microorganisms in the ocean (Flombaum et al., 2013; Li et al., 1983; Partensky et al., 1999; Waterbury et al., 1979). Picophytoplankton consist of pigmented picoeukaryotes (PPE) and picocyanobacteria, including Synechococcus spp. and Prochlorococcus. PPE are a diverse functional group that accounts for about 60-80% of overall picophytoplankton biomass and primary production (Jimenez et al., 2024; Massana, 2011), but this number varies regionally and by trophic state (Jimenez et al., 2024; Rii et al., 2016). Synechococcus is globally widespread and co-dominates with PPE in coastal systems (Massana, 2011; Sherr et al., 2005; Taylor and Landry, 2018). Prochlorococcus dominates the nutrient-poor open ocean, where it is confined due to temperature optima (Johnson et al., 2006), predation interactions (Follett et al., 2022), and preference for low nutrient concentrations (Moore et al., 2002). The factors that contribute to these different community structures are foundational drivers of the ocean system.
The Northern California Current (NCC) Ecosystem is a complex and dynamic system of seasonally-active currents that is ideal for exploring the interplay between biogeochemical cycling, food web structure, and the picophytoplankton communities. The NCC is noted for its productivity due to a variety of factors such as intermittent upwelling and freshwater input from the Columbia River (Hickey and Banas, 2008; MacFadyen et al., 2008). The northern portion of the NCC has a wide shelf, and the southern part of the NCC has a narrow, steep shelf with wide portions that alter water flow such as Heceta Bank (Barth et al., 2000, 2024; Hickey and Banas, 2008) (Figure 1A). Regional heat waves, which are increasing in frequency and intensity, have also been shown to alter plankton and trophic community and spatial dynamics in the Northern and Southern California Current (Cavole et al., 2016; Gomes et al., 2024a; Landry et al., 2024). While phytoplankton dynamics have been heavily studied in the Southern part of the California Current (Bialonski et al., 2016; Landry et al., 2023, 2024; Linacre et al., 2010; Taylor and Landry, 2018; Venrick, 2012), phytoplankton in the Northern part of the system (i.e. the NCC) are understudied (Schmid et al., 2023; Sherr et al., 2005).
Figure 1
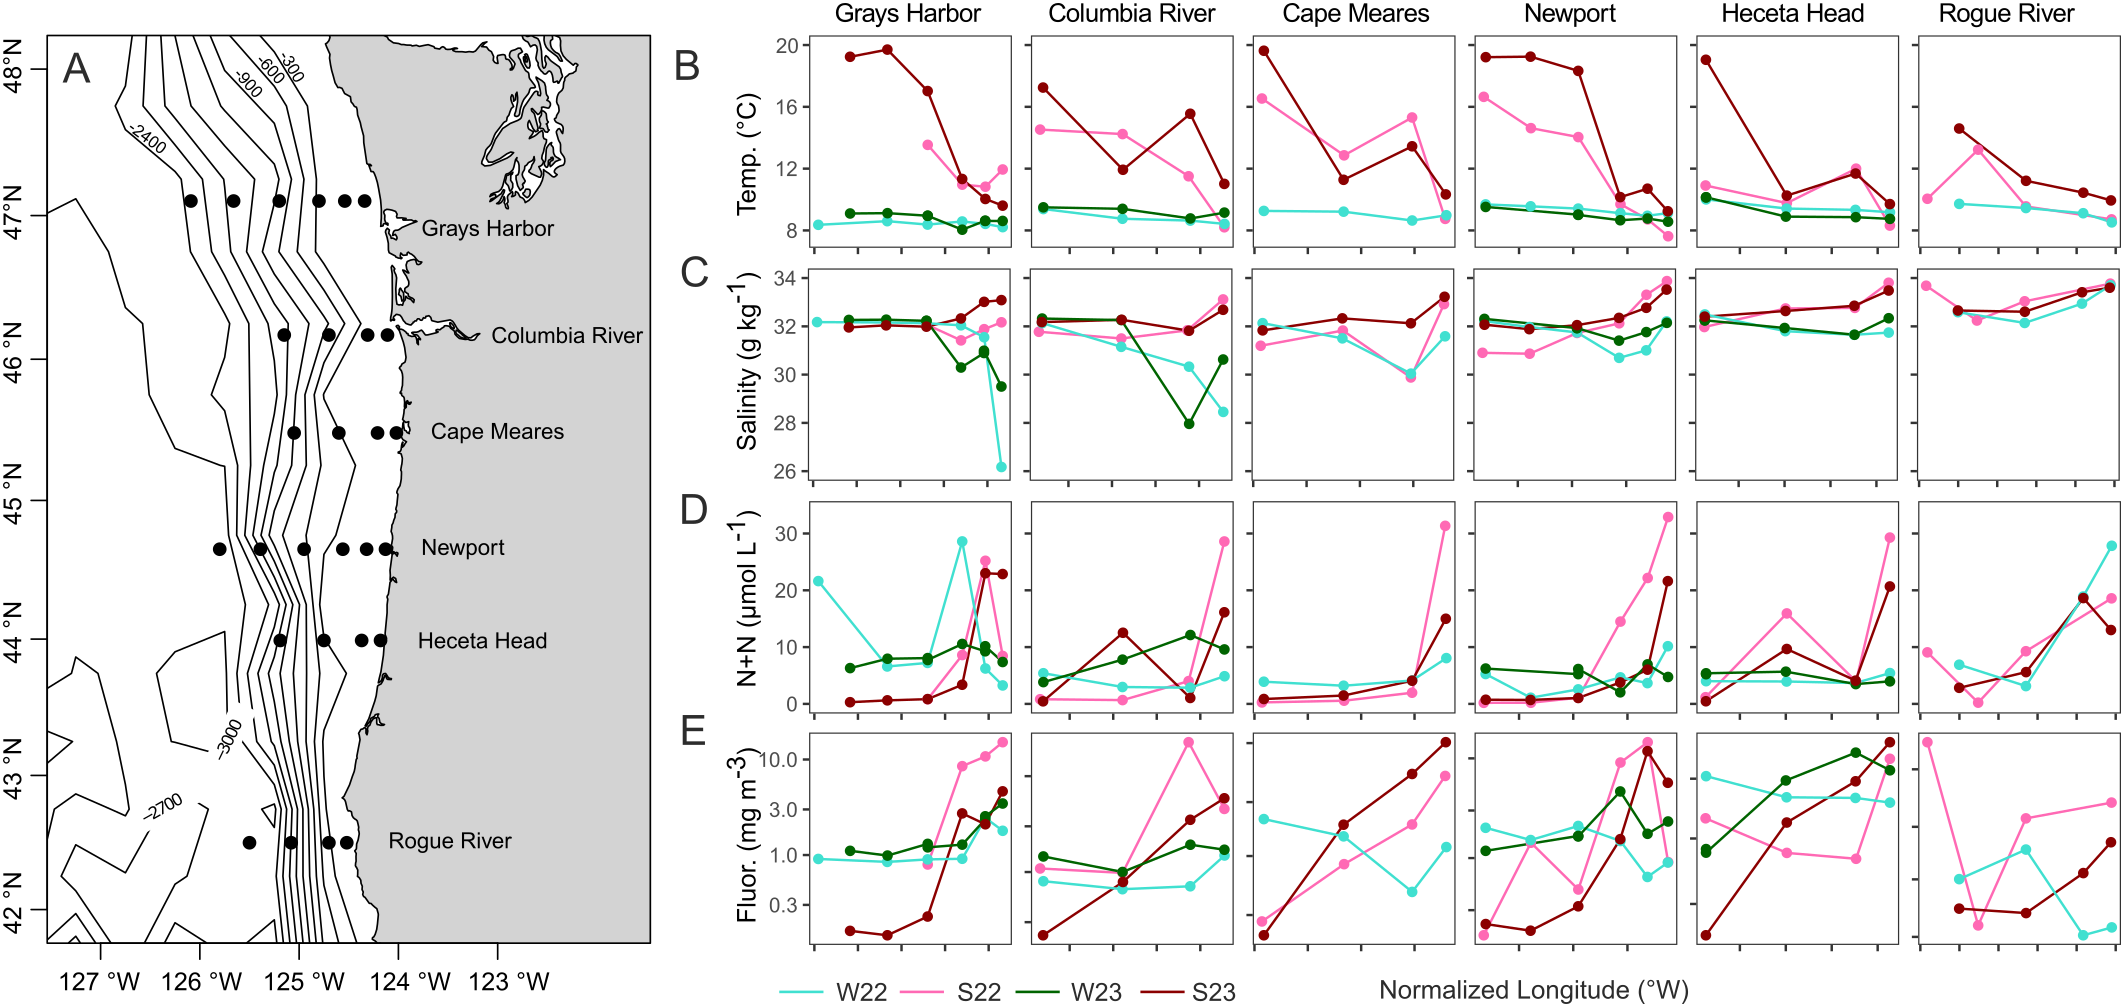
Oceanographic context for the study region. (A) The six transect locations and sampling points along the Washington and Oregon coast sampled in summer and winter of 2022 and 2023. Bathymetry lines are in 300-meter intervals. A wide oceanic shelf with gradual slope is present in the northern transects; in the southern area the shelf is much narrower and steeper. Temperature (B), salinity (C), nitrogen (N+N) (D), and fluorescence (E) measured at each station along transect during each of the four cruises, taken from surface layer (<25 m depth) collections. W22, S22, W23, S23: Winter 2022, Summer 2022, Winter 2023, Summer 2023 respectively. The farthest offshore Grays Harbor station was collected slightly (0.365°) too far west in winter 2022. Cape Meares and Rogue River were not sampled in winter 2023 due to storms.
This study examines picophytoplankton community composition and cell size along spatial and seasonal gradients in the NCC. We examined the correlations between picophytoplankton patterns and environmental factors, both localized and region-wide. Our approach is based on collections at sea for two summers and two winters, and used flow cytometry for identifying cell type, pigmentation, and estimating cell size. A summer marine heat wave (2023) offered the opportunity to study the effects of heat waves on picophytoplankton of the NCC, which revealed a shift to smaller cells. We also found higher abundances of both picophytoplankton groups offshore than on shelf, with greater picocyanobacteria abundances in the summer. As phytoplankton are sensitive to environmental change (Jimenez et al., 2024) and support so many trophic levels above them that are crucial to coastal fisheries, our findings are relevant for coastal resource management in the NCC (Gomes et al., 2024b) as well as a broader understanding of picophytoplankton environmental controls and dynamics in a changing climate.
2 Materials and methods
2.1 Oceanographic sampling
Four oceanographic research cruises were conducted along the Oregon and Washington coasts over two years: winter 2022 and 2023, and summer 2022 and 2023 (R/V Sikuliaq SKQ202204S March 1-12, 2022, SKQ202303S February 16-March 1, 2023, R/V Langseth MGL2207 July 18-30, 2022, and R/V Sally Ride SR2317 August 9-21, 2023, respectively). Water samples were collected using a Seabird SBE-9 CTD (Seabird Scientific, Bellevue, Washington) equipped with 24 10-liter (L) Niskin bottles and the following sensors: a SBE 3 temperature sensor, SBE 4 conductivity sensor, SBE 42/43 dissolved oxygen, 410K-023 Digiquartz pressure sensor, and ECO-AFL fluorescence sensor for chlorophyll-a.
Water samples were collected at 4–6 stations along six transects called Grays Harbor (GH), Columbia River (CR), Cape Meares (CM), Newport (NH), Heceta Head (HH), and Rogue River (RR) (Figure 1A), each extending up to 120 miles from shore, and from four depths between 0–100 meters (m) (excepting winter 2023, when the CM and RR transects were not sampled due to weather and mechanical issues). The winter 2022 sampling of the farthest offshore GH station was sampled 0.365° farther west than on the other cruises but are still considered as station GH6. At nearshore stations in shallow water, fewer than four collection depths were chosen.
At each station and depth, samples for flow cytometry, DNA, and inorganic nutrient analysis were collected. This study examines the surface samples (i.e. from the top 25 m) only, and the full dataset is available as Supplementary Materials (Supplementary Table S1). This microbial dataset corresponds to data available on plankton distribution and abundance through the Biological and Chemical Oceanography Data Management Office (BCO-DMO, www.bco-dmo.org/project/855248).
2.2 Satellite data
To provide context for the environmental conditions during the 2023 marine heat wave, we assessed regional sea surface temperature (SST) with satellite data (Figure 2). Region-wide satellite-derived sea surface temperature anomaly maps of the northeast Pacific Ocean were created from the online NOAA ERDDAP data server (www.ncei.noaa.gov/erddap/index.html) and GRIDDAP Multi-scale Ultra-high Resolution (MUR) SST Analysis Anomaly fv04.1 dataset. One image each for August 9 and 18, 2023, corresponding to the beginning and end stages of the research cruise, were examined.
Figure 2
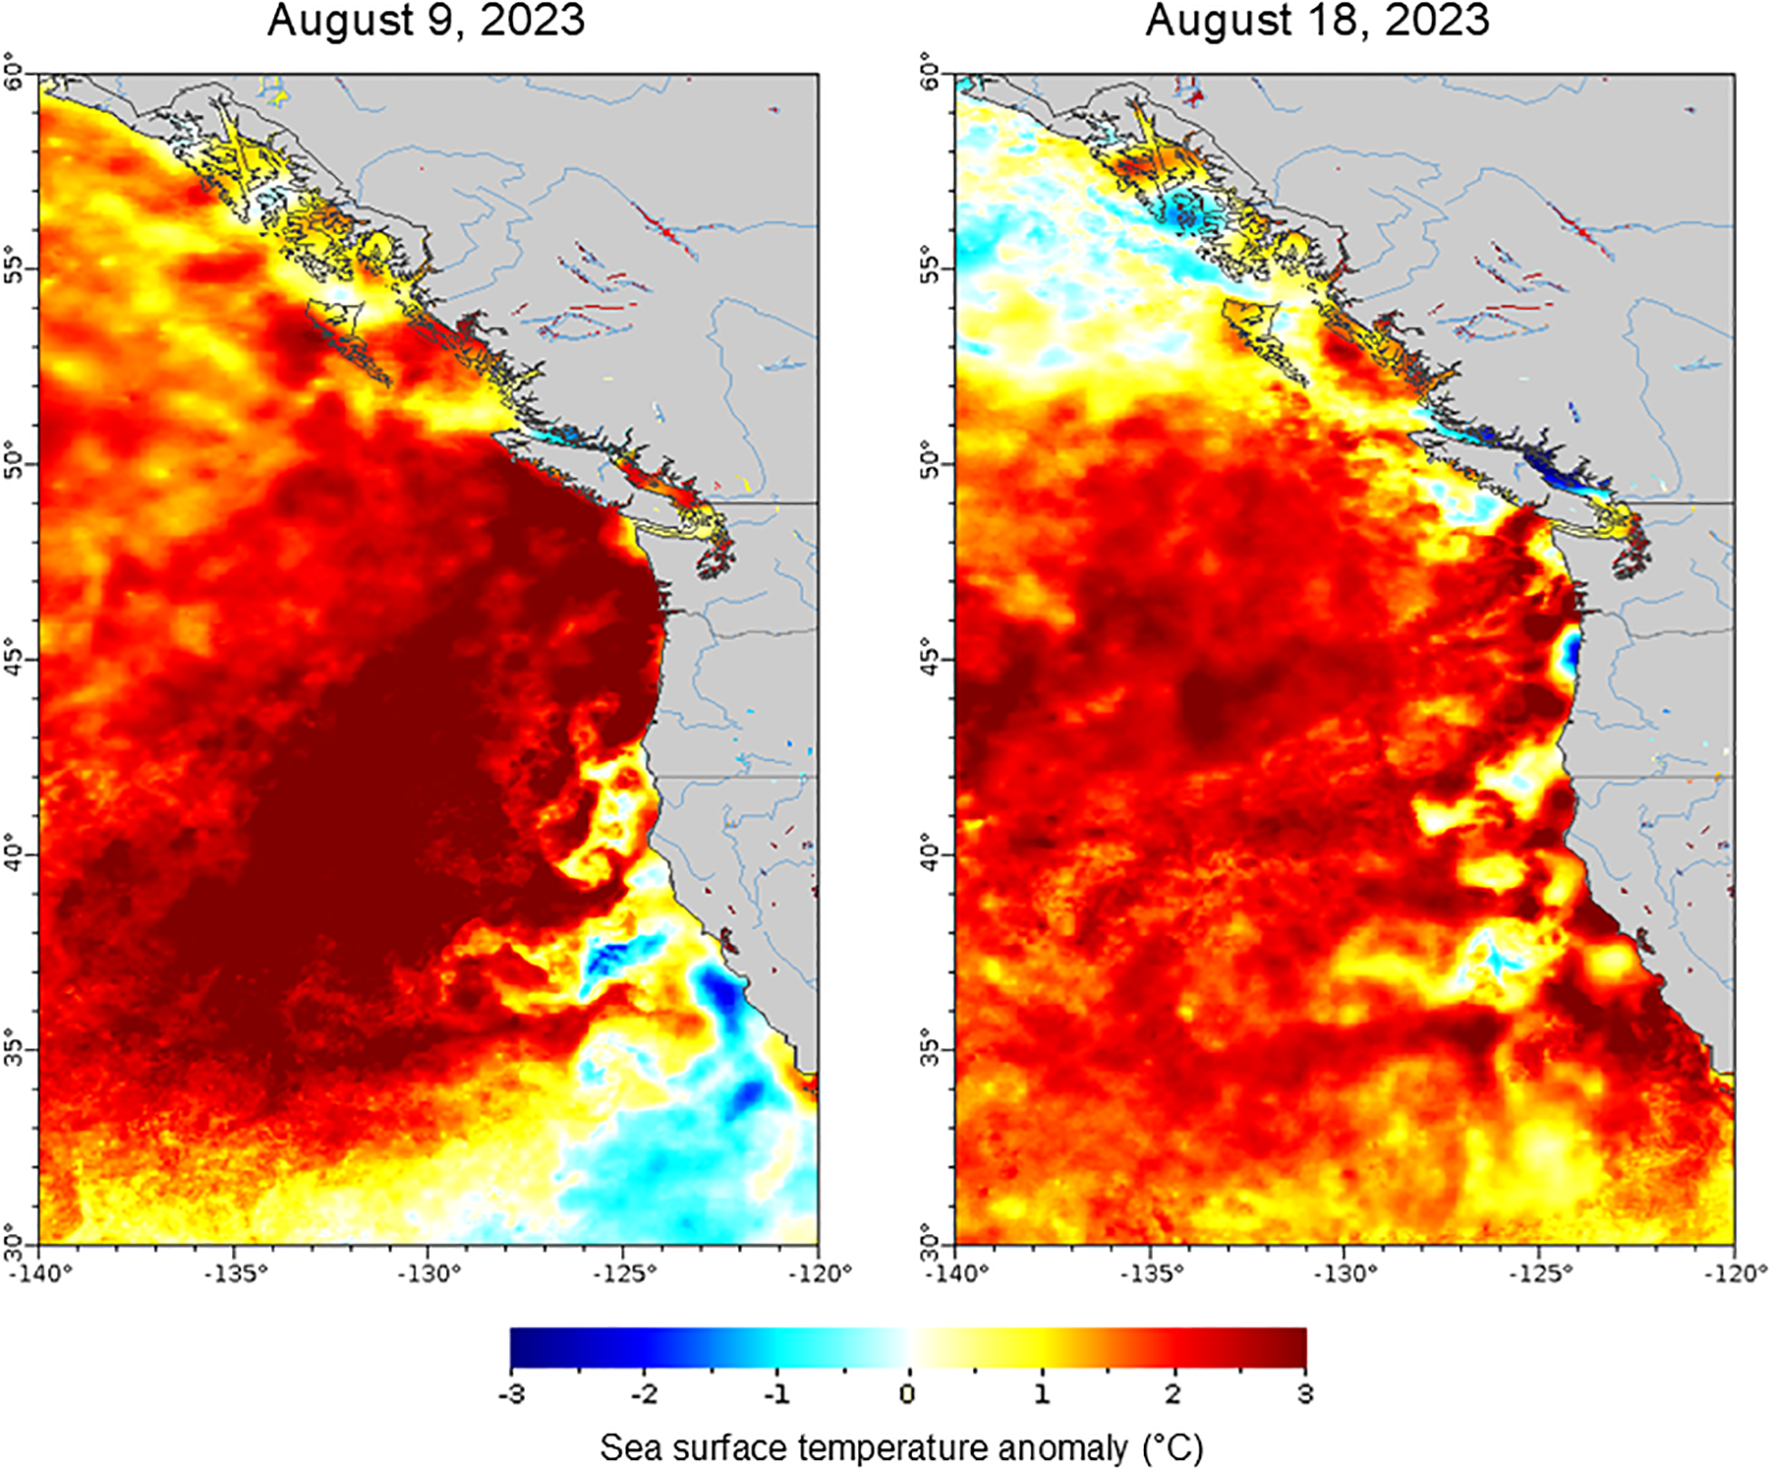
Sea surface temperature anomaly from average (°C). Cool colors (blues) indicate a decrease and warm colors (yellow-red) indicate an increase in sea surface temperature in the northeastern Pacific Ocean during the 2023 marine heat wave that coincided with the summer research cruise. Satellite imagery is from the second day of the cruise (August 9th 2023), near the peak of the heat wave; and two days before the end of the cruise (August 18th 2023), when the heat wave had waned. Data are from NOAA ERDDAP data server and GRIDDAP Multi-scale Ultra-high Resolution (MUR) SST Analysis Anomaly fv04.1 dataset.
2.3 Flow cytometry
Flow cytometry was used to determine phytoplankton cell size and abundance. At sea, 1 mL of seawater from each station and depth was fixed to a final concentration of 0.125% electron-microscopy grade glutaraldehyde (Electron Microscopy Sciences, Hatfield, Pennsylvania), incubated in the dark at room temperature for 10 minutes, flash frozen in liquid nitrogen, and stored at -80°C. A BD Influx flow cytometer (BD Biosciences, San Jose, California) equipped with a small particle detector and 488 nm laser was used for flow cytometry analysis, with trigger of data collection on forward light scatter. Samples were thawed and then 900 μL of each sample was combined with 5 μl of 1.00 μm Fluoresbrite® YG Microspheres (Polysciences, Inc., Warrington, Pennsylvania), and 5 μl of 3.8 μm SPHERO™ Ultra Rainbow Fluorescent Particles Cat. URFP-38-2 (Spherotech, Inc., Lake Forest, Illinois) for internal calibration. Samples were analyzed for 8 minutes and 30 seconds. The volume of each sample that was analyzed was calculated by dividing the flow cytometer’s flowrate by the duration of time each sample was analyzed. Cells per mL were calculated by the flow cytometry cell counts of each group divided by the volume processed.
Flow cytometry data were analyzed using FlowJo version 10.9.0 (BD Biosciences, San Jose, California) and R version 4.2.2 (R Foundation for Statistical Computing, Vienna, Austria) with RStudio Desktop 2023.12.1 (Posit PBC, Boston, Massachusetts). To estimate cell counts, sample outputs were plotted in FlowJo, first by forward scatter versus chlorophyll to restrict the sample to only cells containing chlorophyll, and then this group was plotted by chlorophyll versus phycoerythrin. Gates were drawn around distinct populations. PPE was identifiable by its high chlorophyll and low phycoerythrin, and Synechococcus by its characteristic upward slope in the center of the plot just above the 1μm beads, with low to medium chlorophyll and high phycoerythrin (Supplementary Figure S1), as in prior studies (Olson et al., 1990; Sherr et al., 2005). For cases in which the Synechococcus population overlapped with the 1 μm beads, the Synechococcus population was isolated from the beads by examining forward scatter against side scatter.
2.4 Cell diameter
The diameter of each particle was estimated by calibrating forward light scatter from cells to the diameter of standard beads and cells measured by microscopy using Mie light scatter theory, following prior protocols (Ribalet et al., 2019), adapted for the instrument we used. Cell forward scatter median and standard deviations were divided by the forward scatter median and standard deviation of the beads and calibrated to intervals of refractive indices. Cell diameter was then used in the calculation of biomass per cell, as in Ribalet et al. (2019).
2.5 Inorganic nutrient analysis
Water samples (35 mL) for nutrient analysis were collected at each station and depth into sterile 50mL polypropylene tubes. Nutrient samples were processed at the Oregon State University Elemental Analyzer Facility with a hybrid Continuous Flow Analysis system. A 3-channel Alpkem Rapid Flow Analyzer (OQEMA, Korschenbroich, Germany) was used for silicic acid (Si(OH)4) as well as nitrate (NO3-) plus nitrite (NO2-) (N+N), and a Technicon AutoAnalyzer II (Technicon Corporation, Oakland, California) was used for phosphate (PO4), and ammonium (NH4).
2.6 Statistical tests
Populations were compared in R using the package ‘ggplot2’ (Wickham, 2016). Statistical similarities between groups were calculated using Kruskal-Wallis mean comparison and Wilcoxon pairwise comparisons with Bonferroni correction for multiple comparisons. Pairwise comparisons were performed between picocyanobacteria and PPE population average abundances per cruise, as well as abundances and diameters between cruises per each cell type. Wilcoxon tests were also used to compare PPE and picocyanobacteria abundance and diameters across the six different transects. Pairwise comparisons were also made between cell types comparing the two summers and two winters across transects for both abundances and diameters.
3 Results
3.1 Oceanographic context
To provide context to the microbial community dynamics in the region, we examined ship-based water temperature (Figure 1B), salinity (Figure 1C), nitrogen (N+N) (Figure 1D), chlorophyll-a fluorescence (Figure 1E), and satellite-based SST (Figure 2).
Temperature was dynamic on the individual transects and region wide. For all transects, temperatures were highest offshore, particularly in the two summers. Summer surface temperatures were sometimes more than 10 °C higher than winter for the same transect (Figure 1B). Surface temperatures at the Rogue River were the lowest and most constant overall, consistent with the narrow shelf (Figure 1A) and persistent upwelling. The highest temperatures were in Summer 2023, consistent with a regional marine heat wave that peaked in August (Figure 2). The heat wave broke temperature records for the area (Leising et al., 2024), with sea surface temperature anomalies up to 3 °C warmer than average, as shown with regional NOAA ERDDAP high-resolution satellite data (Figure 2).
For salinity, the near-shore stations on the two northernmost transects, Grays Harbor and Columbia River, were lower in the winter than the other transects (Figure 1C), consistent with their proximity to the Columbia River discharge (Figure 1A). In the summer, salinity was similar across all transects. In the southern part of the system, overall salinity values for Rogue River were significantly higher than GH (p-value < 0.0001, Kruskal-Wallis), CR, NH (p-value < 0.001), and CM (p-value < 0.01) (Supplementary Figure S2).
Combined inorganic nitrogen (N+N) was examined as an indication of coastal upwelling (Figure 1D). Inorganic nitrogen concentrations were greater closer to shore on both summer cruises, consistent with the effects of coastal upwelling and shore processes; winter nitrogen concentrations varied less. The greatest concentrations (34.5 μmol/L) were observed in Summer 2022.
Chlorophyll-a fluorescence was examined as a proxy for phytoplankton biomass. Overall, fluorescence was higher closer to shore, with highest concentrations in the summers (Figure 1E). Fluorescence varied the most between on- and off-shore in the summers and was less dynamic over the shelf break during the winters. There was a negative correlation between chlorophyll-a fluorescence and sea surface temperature (Supplementary Figure S3), with the most variation in both fluorescence and temperature in the summers. Winters had low temperatures as well as low fluorescence, whereas the highest fluorescence occurred in the summers and coincided with lower summer temperatures.
3.2 Phytoplankton community structure and dynamics
Picophytoplankton abundances and community structure in surface waters were compared across the spatial and temporal gradients of the system (Figure 3). Between picocyanobacteria and PPE across the individual cruises, average picocyanobacteria abundances were significantly greater than PPE in summer 2023 (i.e. marine heat wave) (p-value < 0.001, Kruskal-Wallis); otherwise, the two phytoplankton types had similar average abundances (p-values > 0.05, Kruskal-Wallis) (Figure 3A). Picocyanobacteria population average abundances over time were consistent every cruise except for summer 2023. Summer 2023 picocyanobacteria population average abundances were significantly greater (Figure 3B), with median population averages around 37,000 cells per mL and in some cases over 100,000 cells per mL. For PPE abundances, summer 2022 (i.e. non heat wave) was lower than summer 2023 and both winter cruises (significantly lower in summer 2022 versus summer and winter 2023 with p-value ≤ 0.001, but not significant between summer and winter 2022 with p-value > 0.05; Kruskal-Wallis) (Figure 3C).
Figure 3
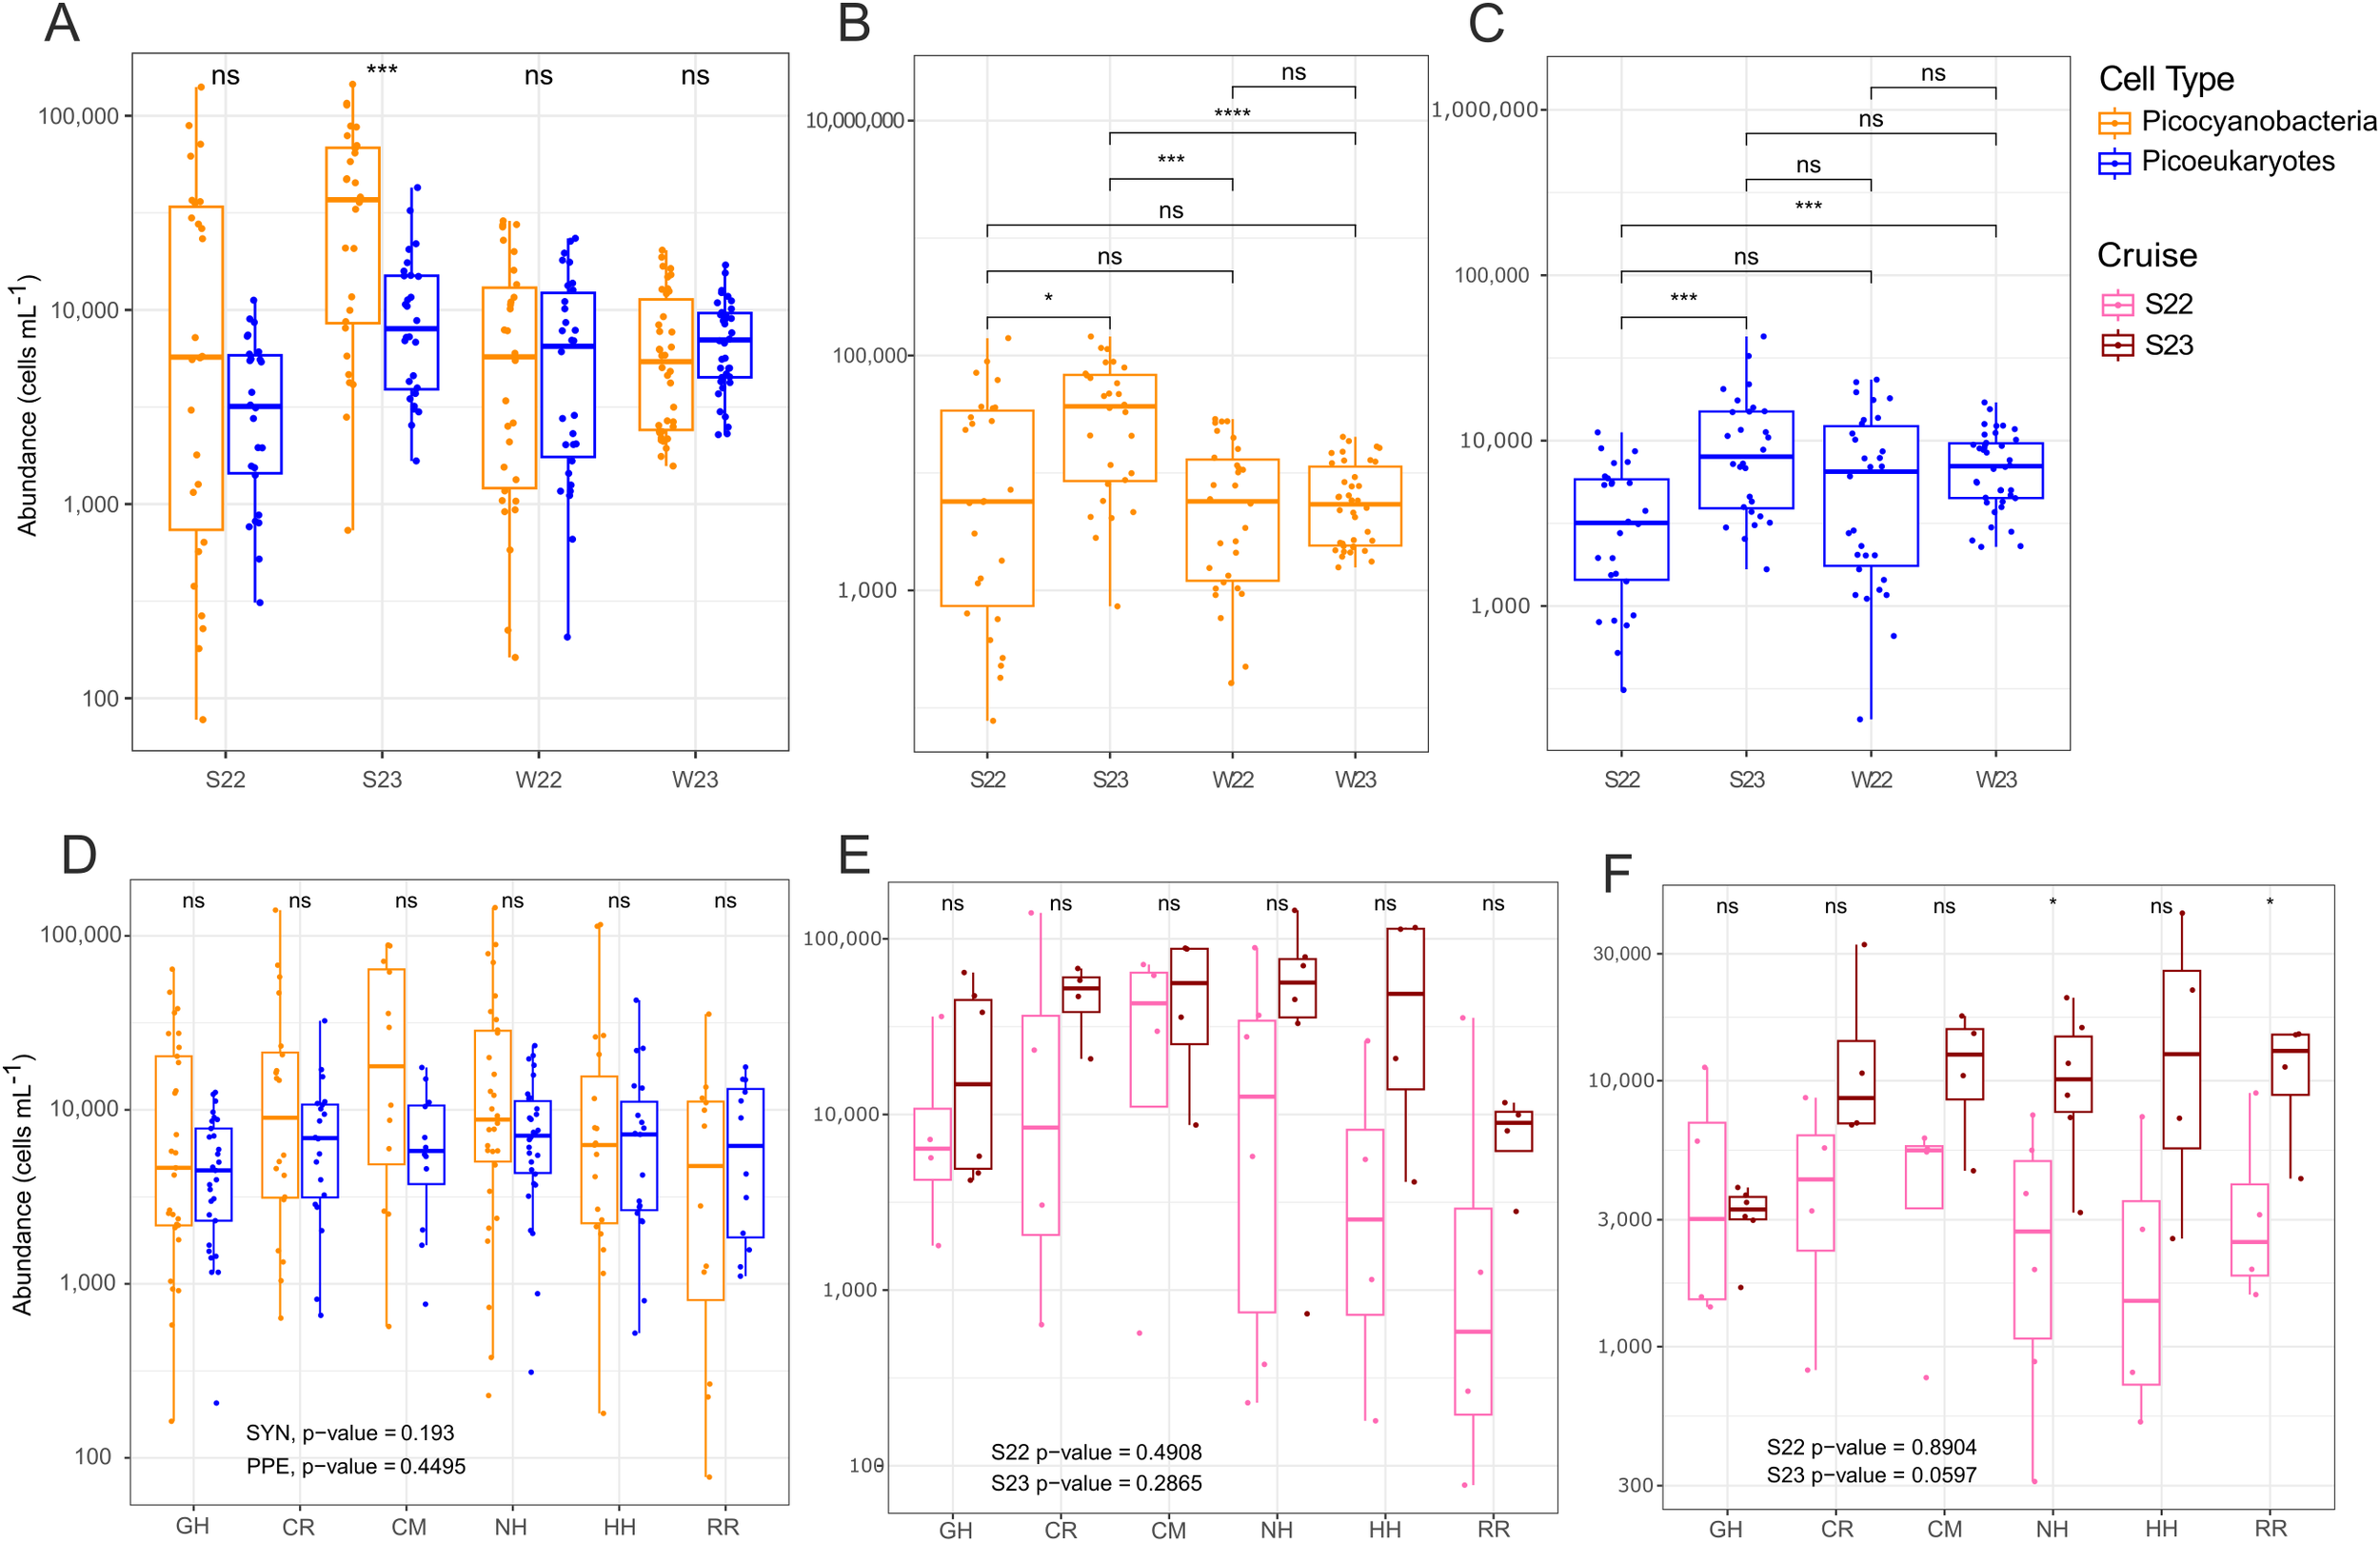
Surface (0-25 m depth) picocyanobacteria (orange) and photosynthetic picoeukaryote (PPE) (blue) abundances across temporal and spatial gradients. (A) Abundances of picocyanobacteria and PPE within the top 25 m of the water column between summer and winter cruises. Pairwise comparisons were done using Wilcoxon test for picocyanobacteria (B) and PPE (C) between seasons. (D) Abundances of surface picocyanobacteria and PPE over different transects (x-axis) combined across seasons and years. (E) Abundances of picocyanobacteria in the top 25 m compared between summers. (F) PPE abundance in the top 25 m compared between summers at each transect. Logarithmic scale is used on the y-axis for all panels. Significance of p-values (Kruskal-Wallis) is denoted by asterisks as follows: * < 0.5, *** ≤ 0.001, ns= not significant. Abbreviations: S22, S23, W22, W23: Summer 2022, Summer 2023, Winter 2022, Winter 2023 respectively. Transect abbreviations in panels (D-F) are as follows: GH, Grays Harbor; CR, Columbia River; CM, Cape Meares; NH, Newport; HH, Heceta Head; RR, Rogue River.
We compared surface picocyanobacteria and PPE abundance across the different transects to see how abundances changed with the different positions along major currents, bathymetry, and freshwater inputs of each transect. For the whole dataset (Figure 3D), including all cruises, there was no statistical support for different average abundances of picocyanobacteria and PPE on any transect or between transects (p-values > 0.05, Kruskal-Wallis). However, the maximum picocyanobacterial abundances, and the range of picocyanobacterial abundances, were always higher than PPE for all transects.
For a more specific comparison between a non-heat wave summer (2022) and marine heat wave conditions (2023), we examined differences between data from just the summer cruises (Figure 3E, F). Summer 2023 had higher mean abundances of both picocyanobacteria (Figure 3E) and PPE (Figure 3F) for all transects and a narrower abundance range within each transect. Strong variation between on- and off-shelf samples (Figure 4) meant that the differences of each summer were not statistically supported.
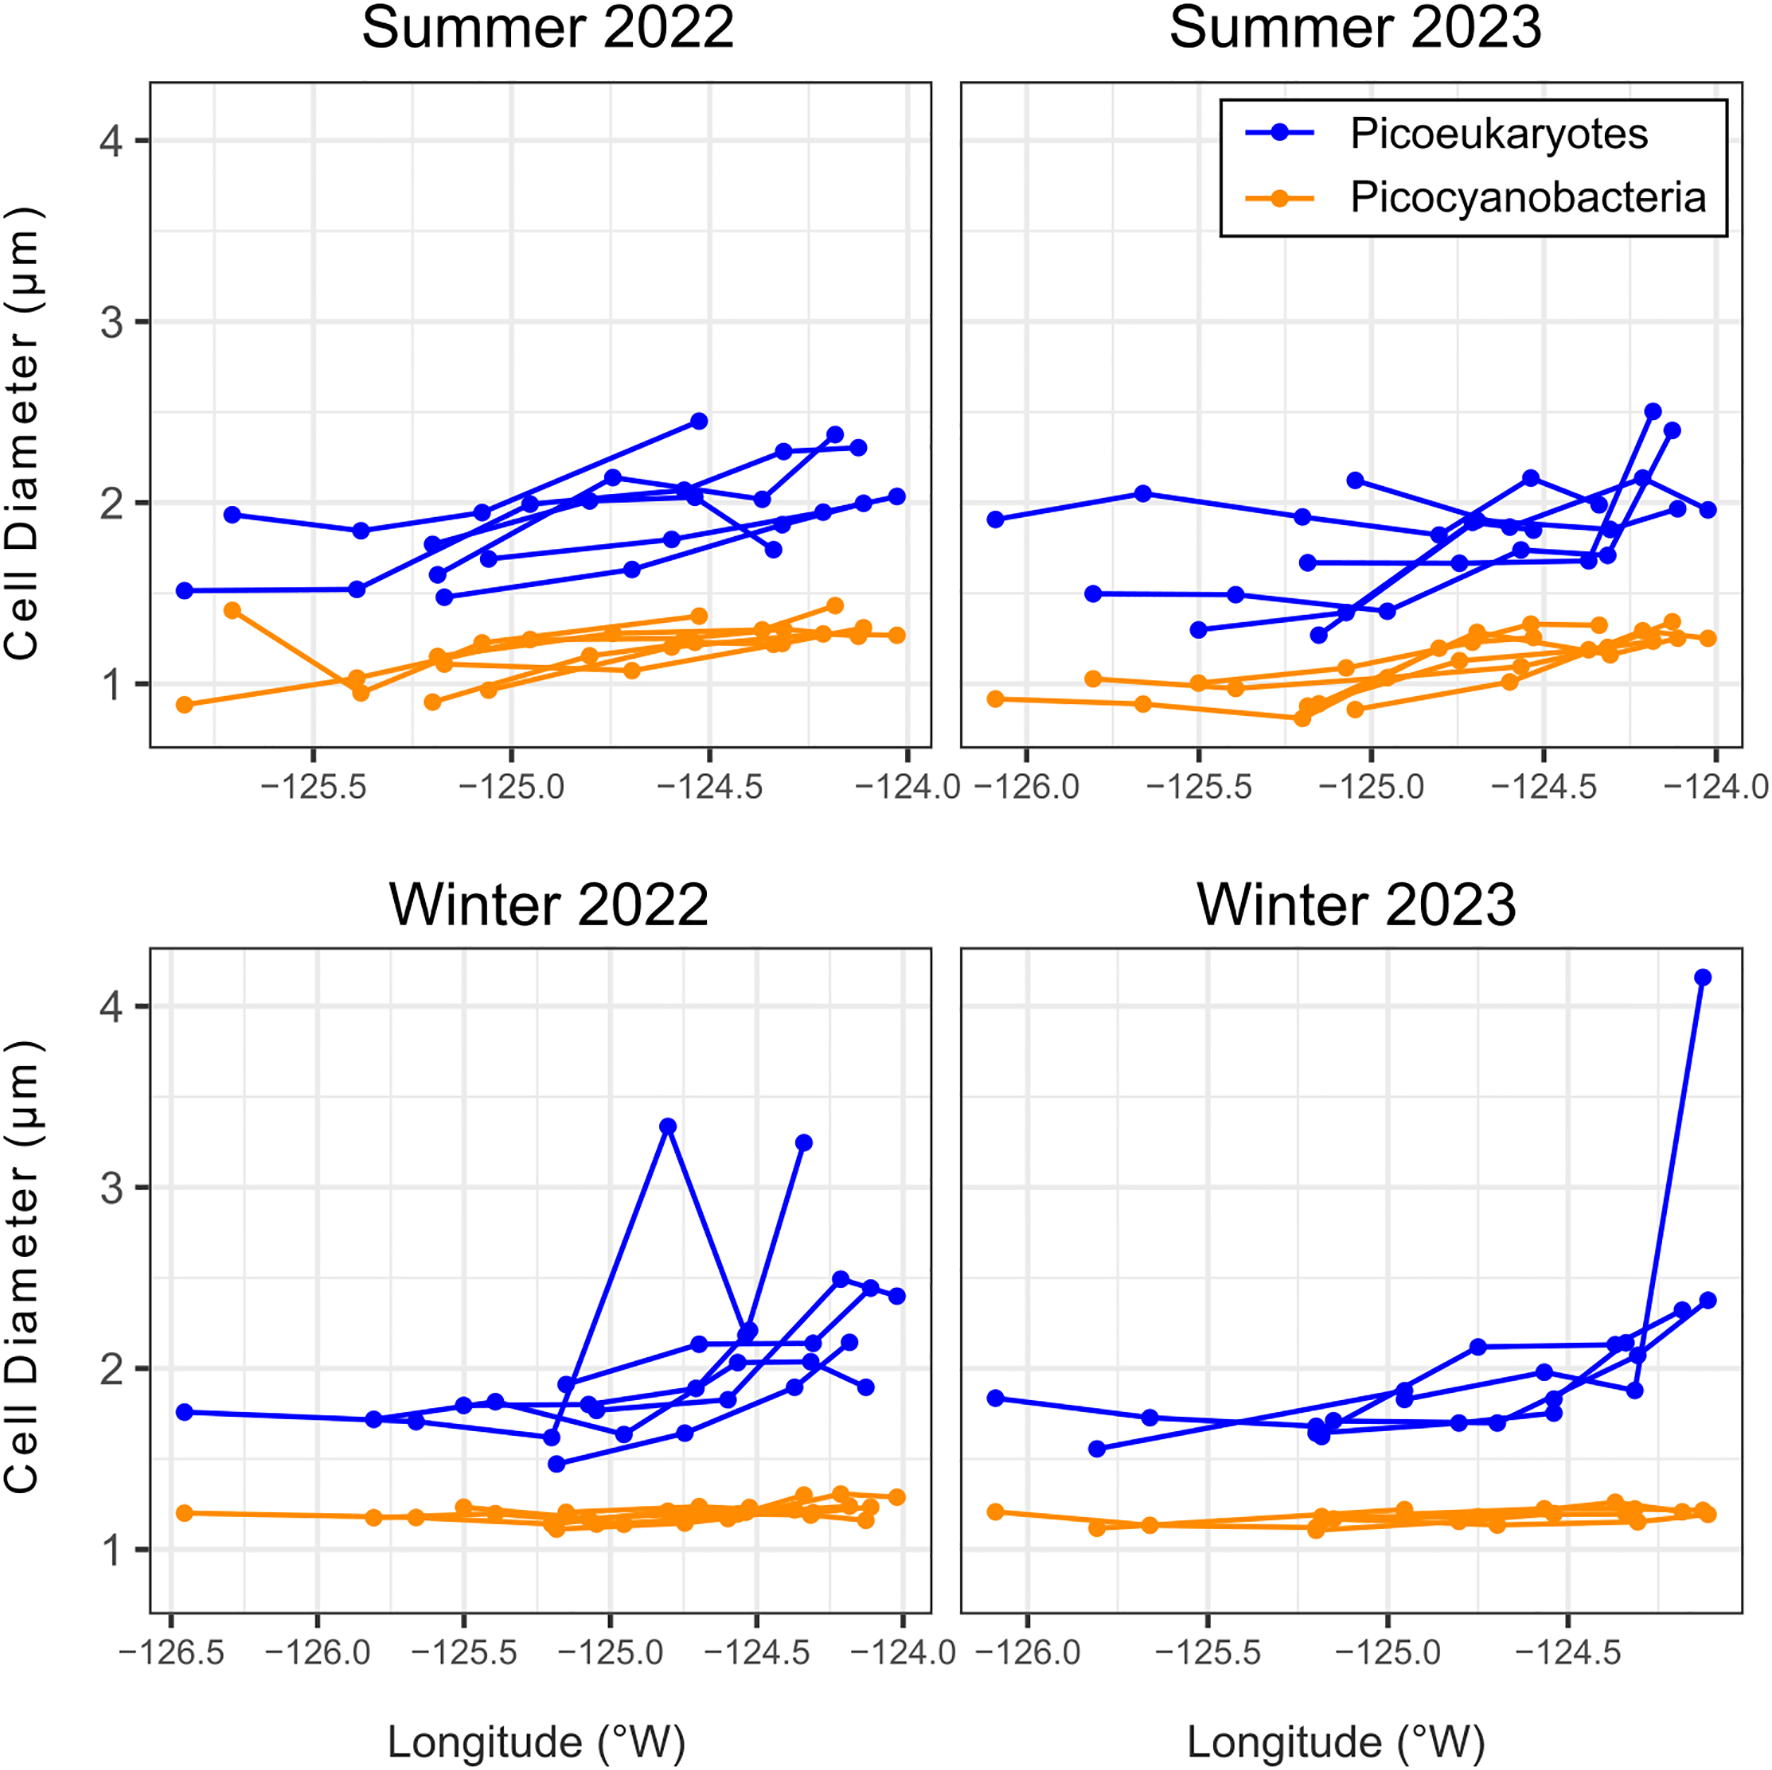
Figure 4
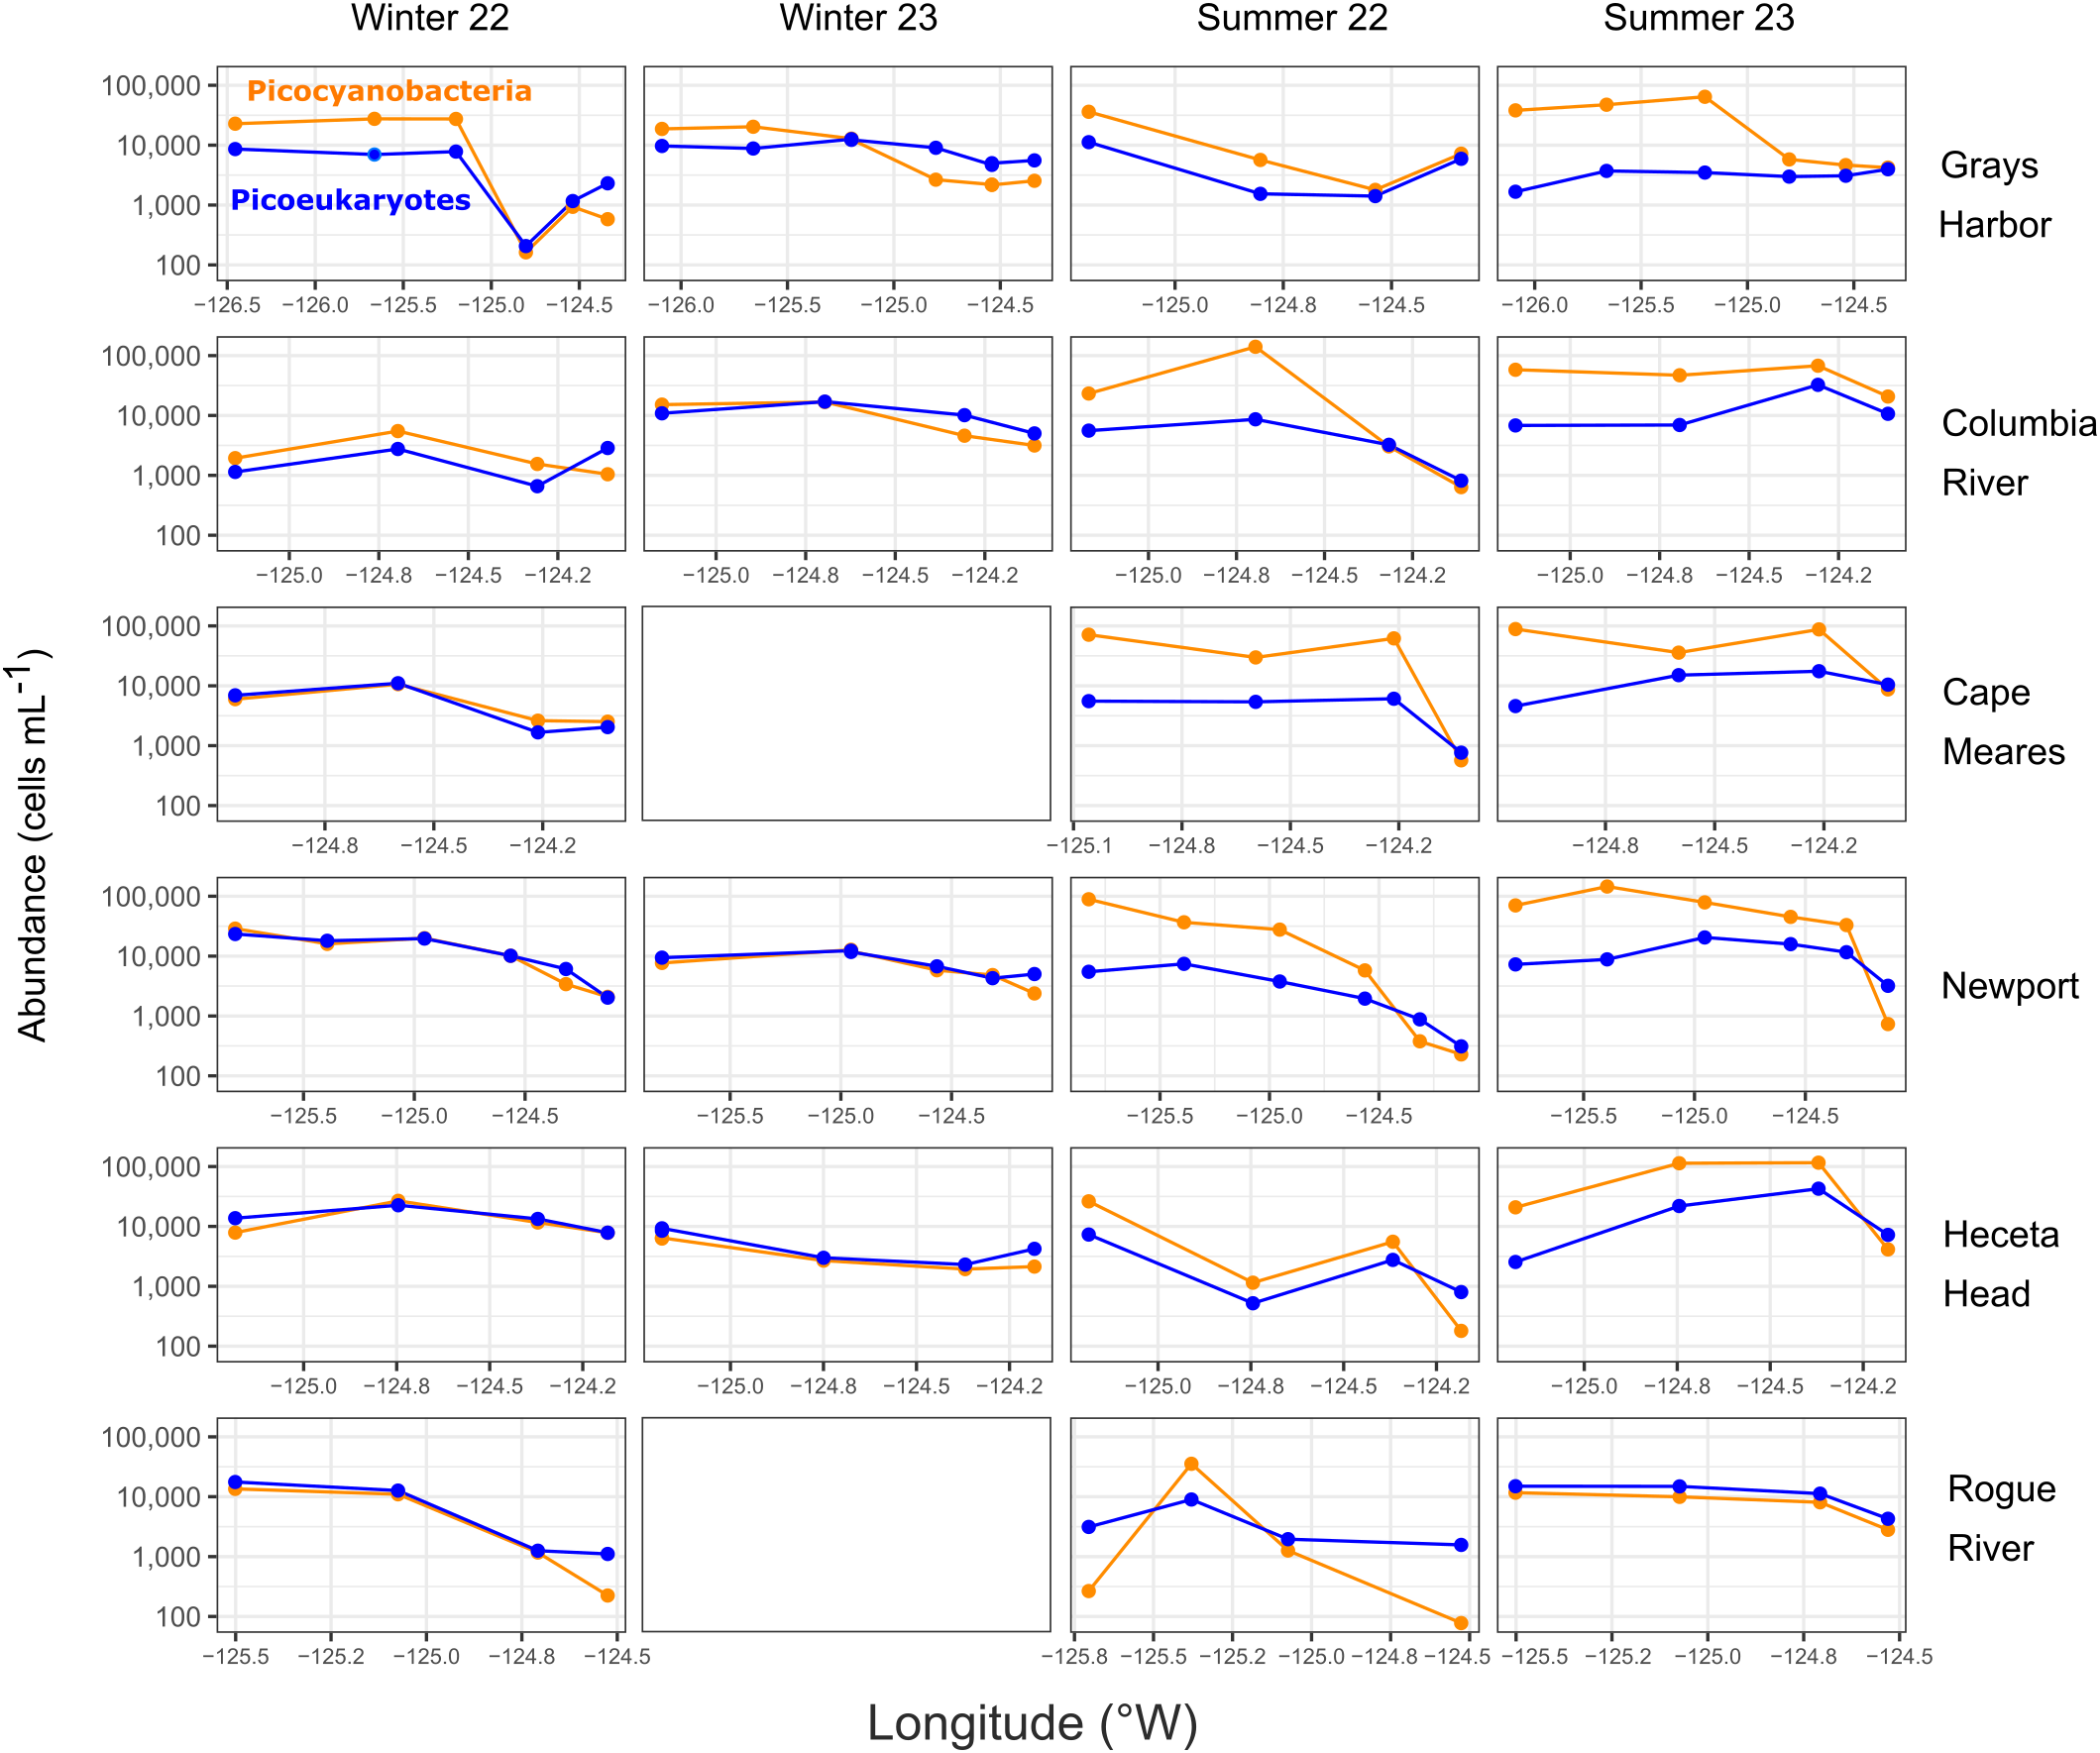
Surface abundances of picocyanobacteria and photosynthetic picoeukaryotes (PPE) over a longitudinal gradient from inshore to offshore. Two transects were not sampled in winter 2023 due to inclement weather (empty panels).
We also compared the two winters for each transect (Supplementary Figure S4). For both phytoplankton, average abundances in winter 2023 were higher on the Grays Harbor and Columbia River transects, but 2022 averages were higher on Newport and Heceta Head. These differences were significant on the Columbia River (p-value < 0.05, Kruskal-Wallis) and Heceta Head (p-value ≤ 0.01, Kruskal-Wallis) transects for picocyanobacteria (Supplementary Figure S4A) and on Grays Harbor (p-value < 0.05, Kruskal-Wallis), Columbia River (p-value ≤ 0.01, Kruskal-Wallis), and Heceta Head (p-value < 0.05, Kruskal-Wallis) for PPE (Supplementary Figure S4B). There was no statistical difference between transects in either winter for picocyanobacteria, but for PPE, each winters showed statistical difference between transects (p-values < 0.05, Kruskal-Wallis). Due to weather and mechanical issues, Cape Meares and Rogue River were not sampled in winter 2023, and thus are not included in this comparison.
Finally, we examined the surface abundances of the two phytoplankton over on- to off-shore spatial gradients of each transect (Figure 4), which covered many different bathymetries (Figure 1A). Overall, slightly higher cell abundances were found offshore than inshore. In the winter, abundances of PPE and picocyanobacteria were similar, except for the two northernmost transects (Grays Harbor and Columbia River), where offshore picocyanobacteria abundances were about twice as high (up to four times higher at GH5 in winter 2022). In the summer, picocyanobacteria abundance was higher than PPE, particularly offshore; this was consistent in all transects except for Rogue River, where summer picocyanobacteria numbers were lower than PPE offshore as well as inshore. Each transect and each season had different abundance patterns across the shelf gradient for both cell types.
3.3 Picophytoplankton sizes
To examine how oceanographic dynamics influenced picophytoplankton cell size, we estimated cell diameter with flow cytometry from surface samples over the many gradients of the system (Figure 5). Surface picocyanobacterial population average cell diameters averaged 1.17 μm and ranged between 0.81-1.43 μm. Surface PPE population average cell diameters averaged 2.00 μm and ranged between 1.27-5.51 μm. These diameters are consistent with expected average population diameters for Synechococcus (Ribalet et al., 2019; Sherr et al., 2005) and picoeukaryotes (Massana, 2011; Sherr et al., 2005). A subset of samples had average cell diameters less than is typical for Synechococcus (i.e. < 1 μm) but more typical of Prochlorococcus. However, qPCR analysis of DNA from these samples for the two most globally abundant Prochlorococcus ecotypes (eMED4 and eMIT9312), were negative, supporting their identity as Synechococcus (Supplementary Figure S5).
Figure 5
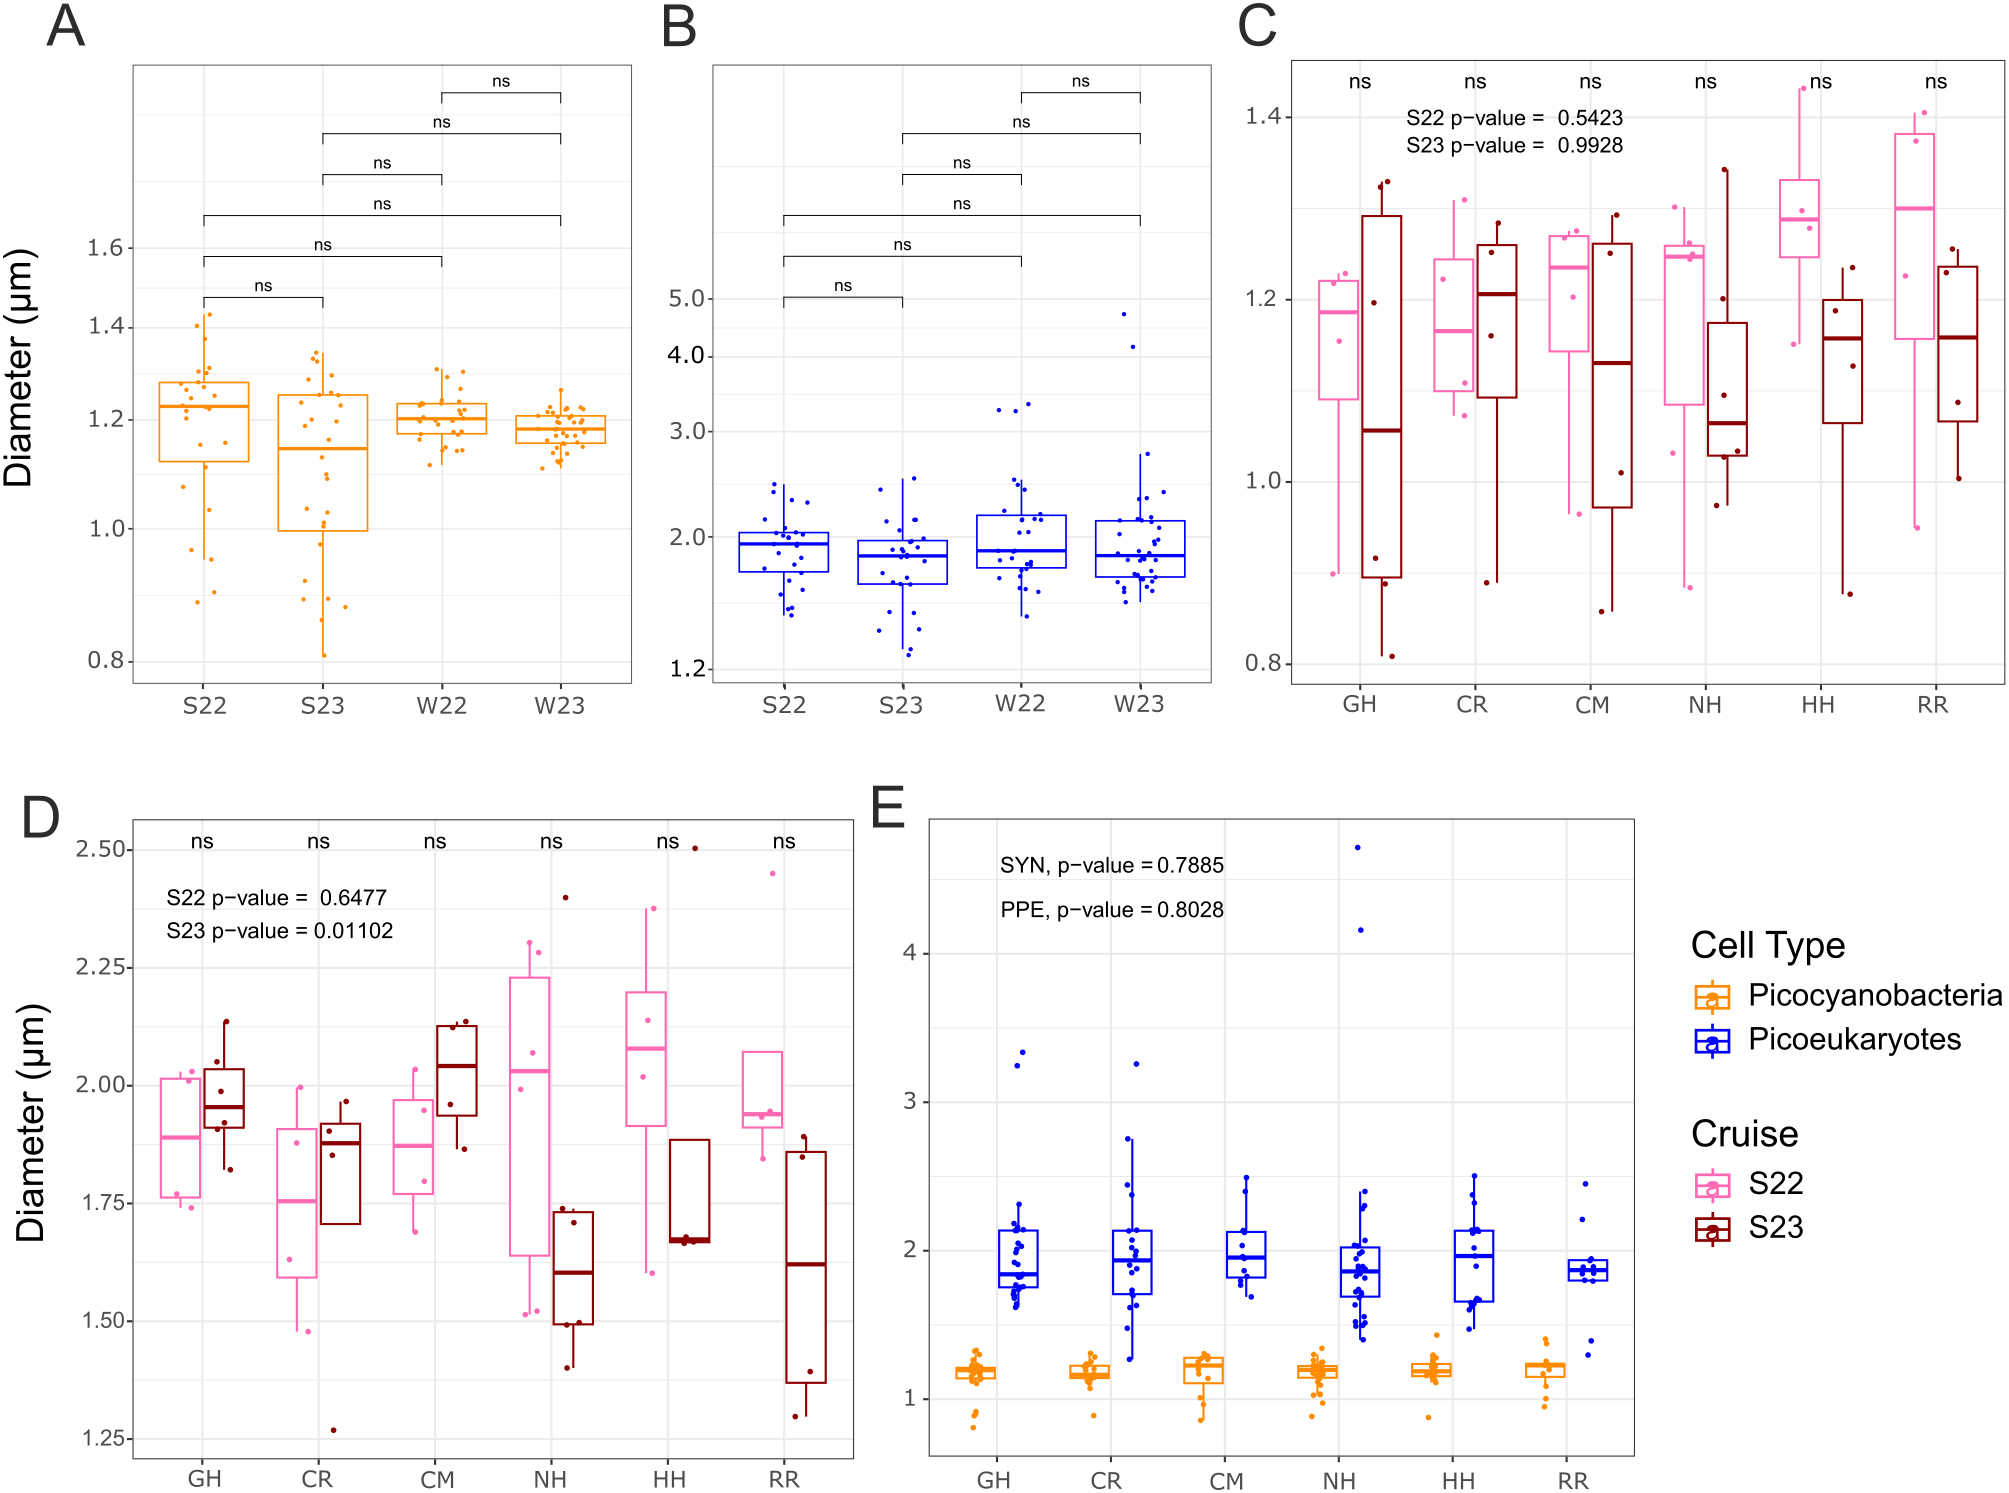
Average population cell diameters for surface picocyanobacteria (orange) and photosynthetic picoeukaryotes (PPE) (blue) across temporal and spatial gradients. (A) Picocyanobacteria population average diameters compared between cruises. (B) PPE population average diameters compared between cruises. (C) Picocyanobacteria population average diameters during the two summer cruises plotted by transect. (D) PPE population average cell diameters during the two summer cruises plotted by transect. (E) Cell diameters for all cruises compared across transects. Note that logarithmic scales are used on the y-axis for panels (A-C), and linear for (D-E). Significance of p-values (Kruskal-Wallis) is denoted as follows: ns = not significant. S22, S23, W22, W23: Summer 2022, Summer 2023, Winter 2022, Winter 2023 respectively. Transect abbreviations in panels (C-E) are as follows: GH, Grays Harbor; CR, Columbia River; CM, Cape Meares; NH, Newport; HH, Heceta Head; RR, Rogue River.
To examine changes in cell size over temporal gradients, we looked at picocyanobacteria and PPE diameters between cruises. No statistical support for differences was found for either picocyanobacteria or PPE between the different cruises, but the mean picocyanobacteria diameter was lowest in summer 2023 (marine heat wave) and the range of cell sizes was much greater in both summers than in the winters (Figure 5A). Mean PPE cell diameters were consistent (around 1.98 μm) for all cruises (p-values > 0.05). The largest PPE population diameters we observed occurred during the winters, and the smallest PPE population diameters were present in summer 2023 (marine heat wave) (Figure 5B), although these did not change the average overall.
To compare picophytoplankton cell diameters during a standard versus marine heat wave summer, mean surface picocyanobacteria and PPE diameters for each transect from the two summer cruises were compared (Figures 5C, D). For picocyanobacteria, mean cell diameters were smaller in 2023 than in 2022 on all transects except CR (Figure 5C); however, the variation over the on-off-shore transects means these differences were not statistically supported (p-values > 0.05, Kruskal-Wallis). Differences in PPE average cell diameter between each summer and at each transect showed a more complex pattern than the picocyanobacteria that depended on north to south location (Figure 5D). Specifically, PPE were larger in 2023 than 2022 in the northern half of the system, but in the southern half of the system PPE were much smaller in 2023 than in 2022 (Figure 5D).
Mean cell diameters for each transect were also compared between winters (Supplementary Figure S6). Picocyanobacteria diameters were not statistically different between transects during winter 2022 (p-value = 0.297, Kruskal-Wallis), but were different between transects during winter 2023 (p-value = 0.00714, Kruskal-Wallis). Diameters of picocyanobacteria were significantly larger in winter 2022 than 2023 along Grays Harbor and Columbia River (p-value <0.05 and p-value < 0.01, respectively; Kruskal-Wallis). For PPE, no significant size differences were present in the winter either between transects or between winters (all p-values > 0.05, Kruskal-Wallis).
To address size over spatial gradients, cell diameters were examined across transects to test the size patterns in context of the different bathymetry and freshwater inputs along shore, as well as in comparison with distance from shore. In comparing cell size by transect, no statistical difference was found for either picocyanobacteria or PPE between transects (Figure 5E). Cell size was also examined across a longitudinal gradient to see if oceanographic differences between on shelf and offshore correlated with size patterns. Cell size of picocyanobacteria remained relatively constant in the winter around 1.2 μm; PPE size during all cruises and picocyanobacteria during summer cruises decreased slightly with distance from shore (Figure 6).
Figure 6
Population average cell diameters of surface picocyanobacteria and photosynthetic picoeukaryotes (PPE) over a longitudinal gradient from inshore to offshore, grouped by cruise.
To address correlations with surface water temperature, we examined abundance and diameter of both cell types compared to water temperature (Figure 7). Below 10 °C, abundances of picocyanobacteria and PPE in surface waters had similar linear responses correlated positively to temperature, but above 10 °C, picocyanobacteria concentrations remained high along an asymptote whereas PPE concentrations gradually began to decrease with higher temperatures (Figure 7A). Conversely, temperature and cell diameter for both types of cells displayed a negative correlation, with a similar slope for PPE and picocyanobacteria (-0.0107 and -0.0111, respectively) (Figure 7B). R2 values for the picocyanobacteria models were higher for both comparisons (0.508 for abundance and 0.54 for diameter, versus PPE with values of 0.158 for abundance and 0.14 for diameter).
Figure 7
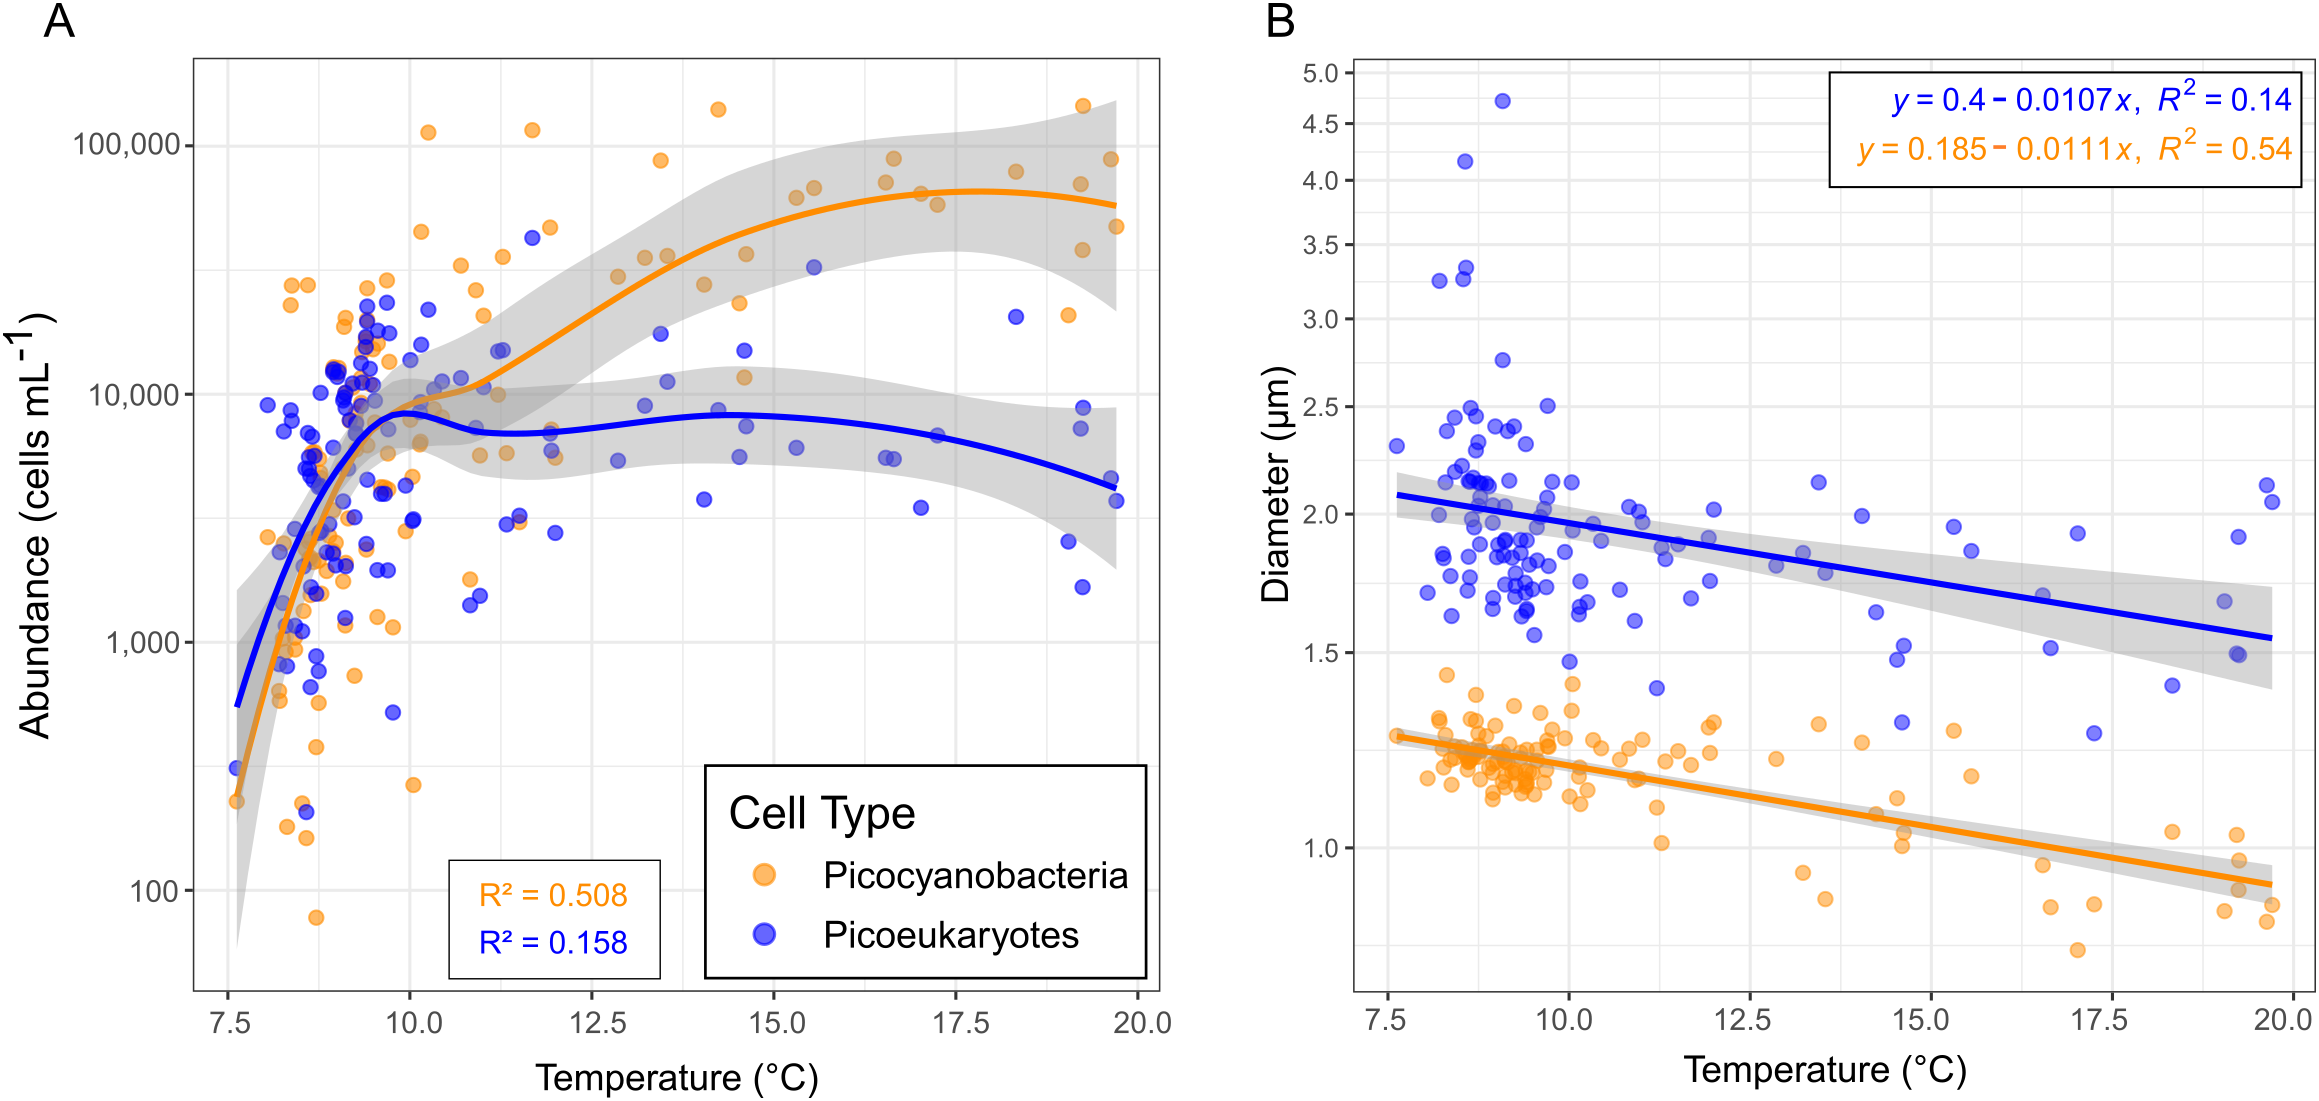
Correlations between water temperature and picocyanobacteria and photosynthetic picoeukaryote (PPE) abundance (A) and diameter (B) in surface water (< 25 m). Grey bands denote 95% confidence interval. Note differences in y-axis logarithmic scales between panels.
Picophytoplankton correlations with nutrient levels were also examined. We compared N+N, PO4, Si(OH)4, NO2-, and NH4 to picophytoplankton abundance and diameter. Negative correlations were found between nutrient concentrations and the abundance of both types of picophytoplankton. No correlation was found between NH4 and picophytoplankton diameter, but the other nutrients displayed a slight positive correlation (Figure 8).
Figure 8
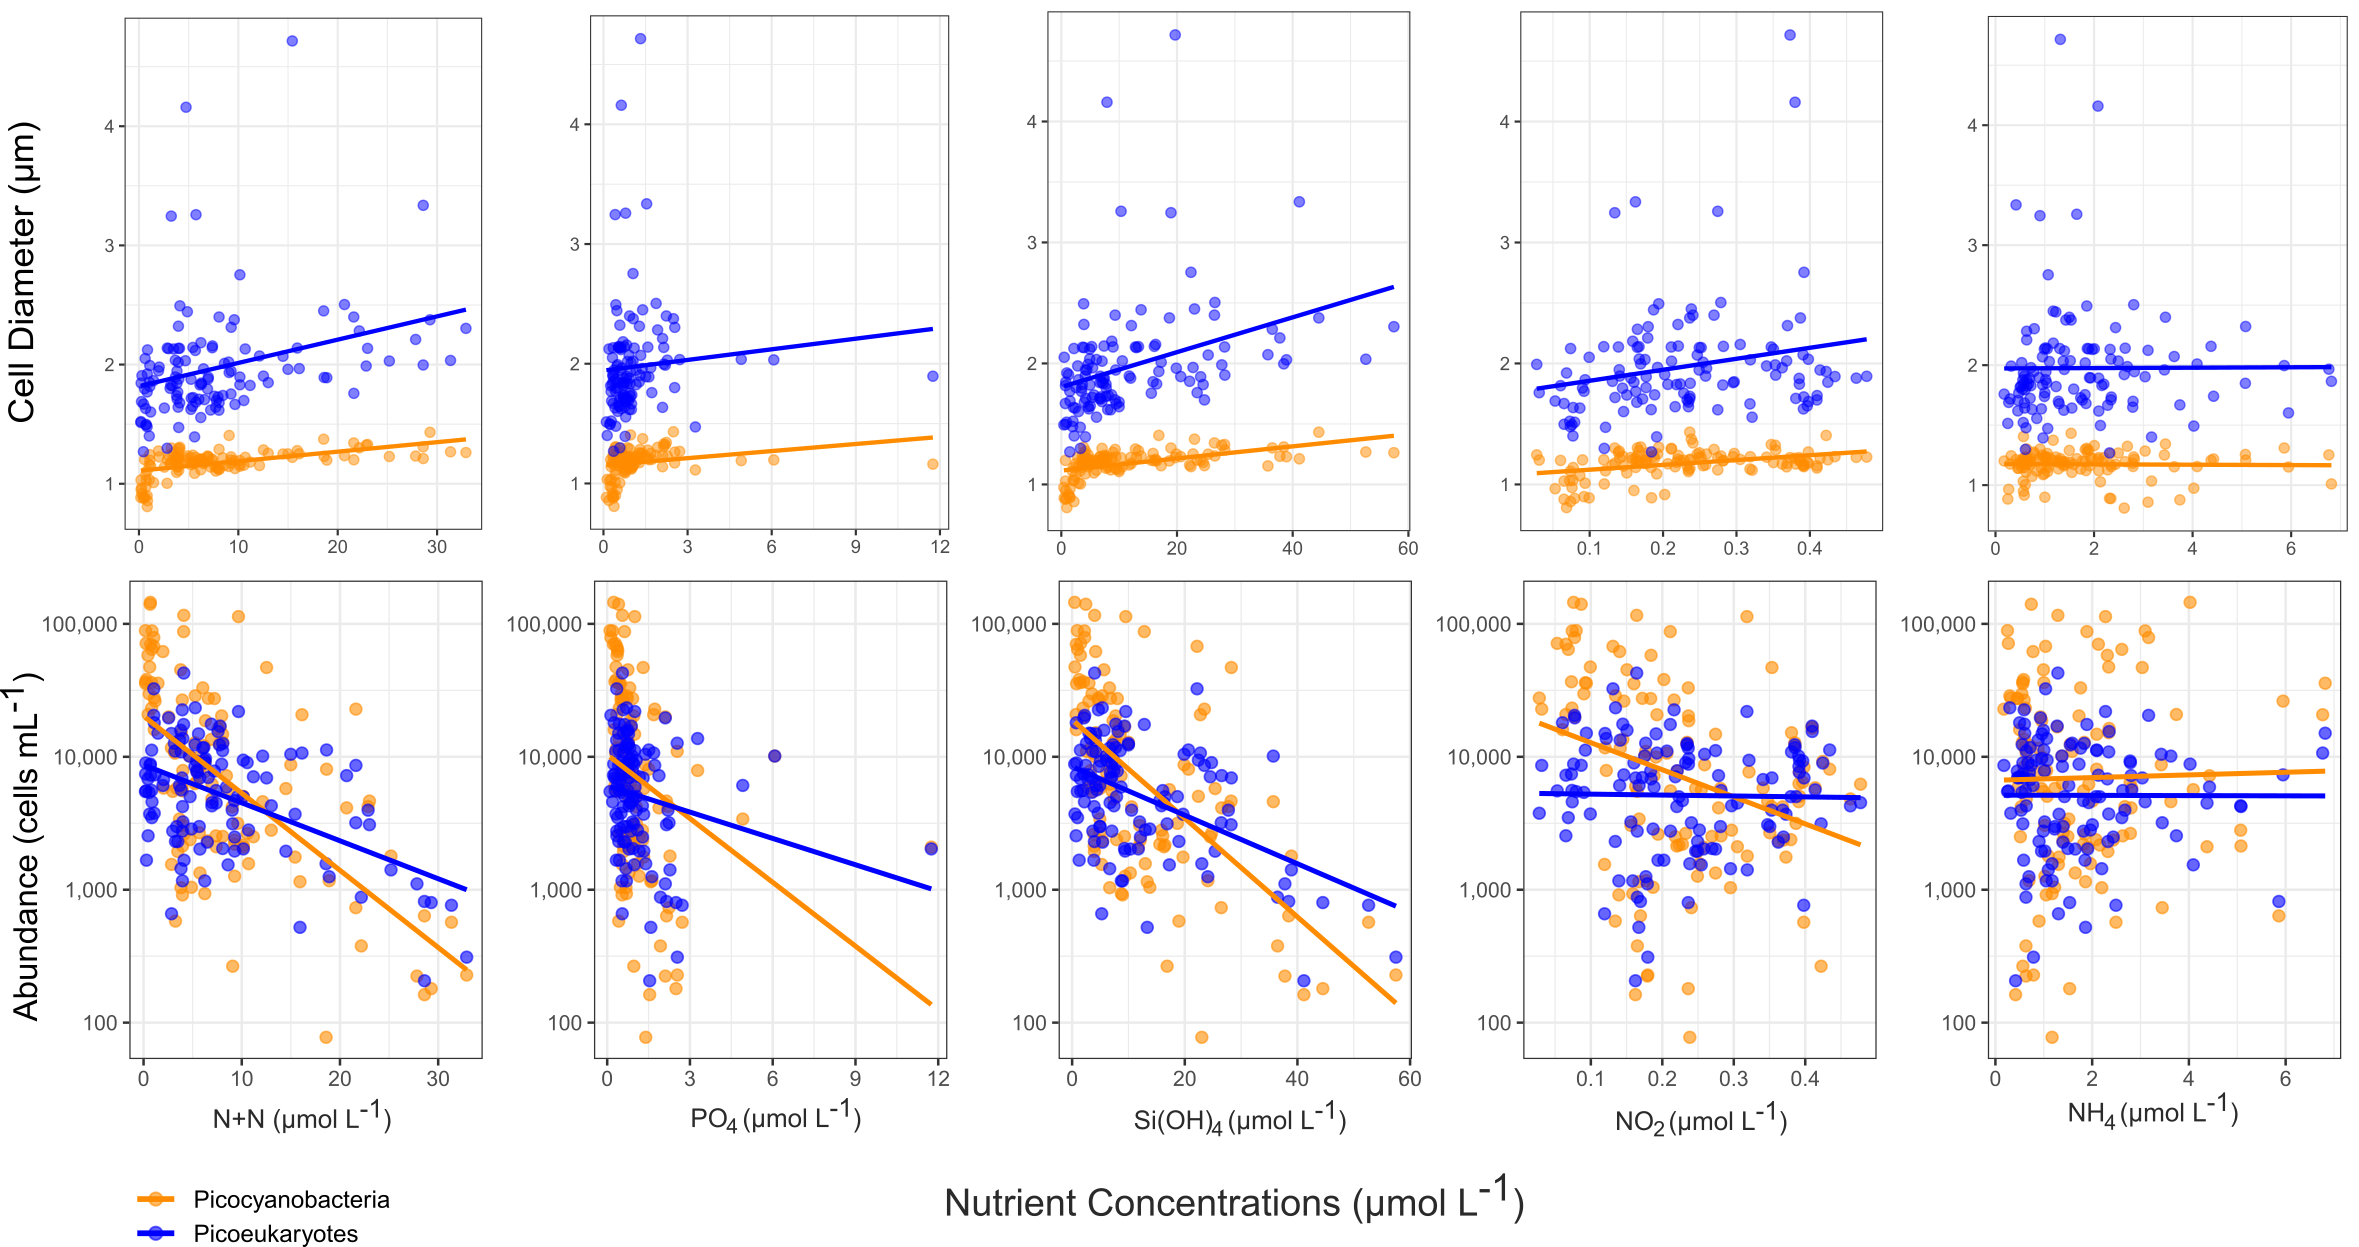
Population average cell diameters and abundances for both types of picophytoplankton versus surface (<25 m depth) nutrient concentrations of nitrate plus nitrite (N+N), phosphate (PO4), silicic acid (Si(OH)4), nitrite (NO2-), and ammonium (NH4).
Lastly, we examined the total picophytoplankton biomass, as well as proportional biomass of each picophytoplankton type. Total biomass was greatest in Summer 2023 (Figure 9A). A significantly greater proportion of the biomass (p-value < 0.0001, Kruskal-Wallis) can be attributed to Synechococcus in summer compared to winter when the contributions of PPE and Synechococcus were more equal (Figure 9B). The ratios of Synechococcus to PPE biomass also varied along a north-to-south gradient (Figure 9C). We found statistical support for the lower proportion of Synechococcus biomass along RR compared to CM (p-value < 0.01, Kruskal-Wallis) and NH (p-value < 0.05). We also found a greater proportion of Synechococcus biomass further offshore in summer (Figure 9D).
Figure 9
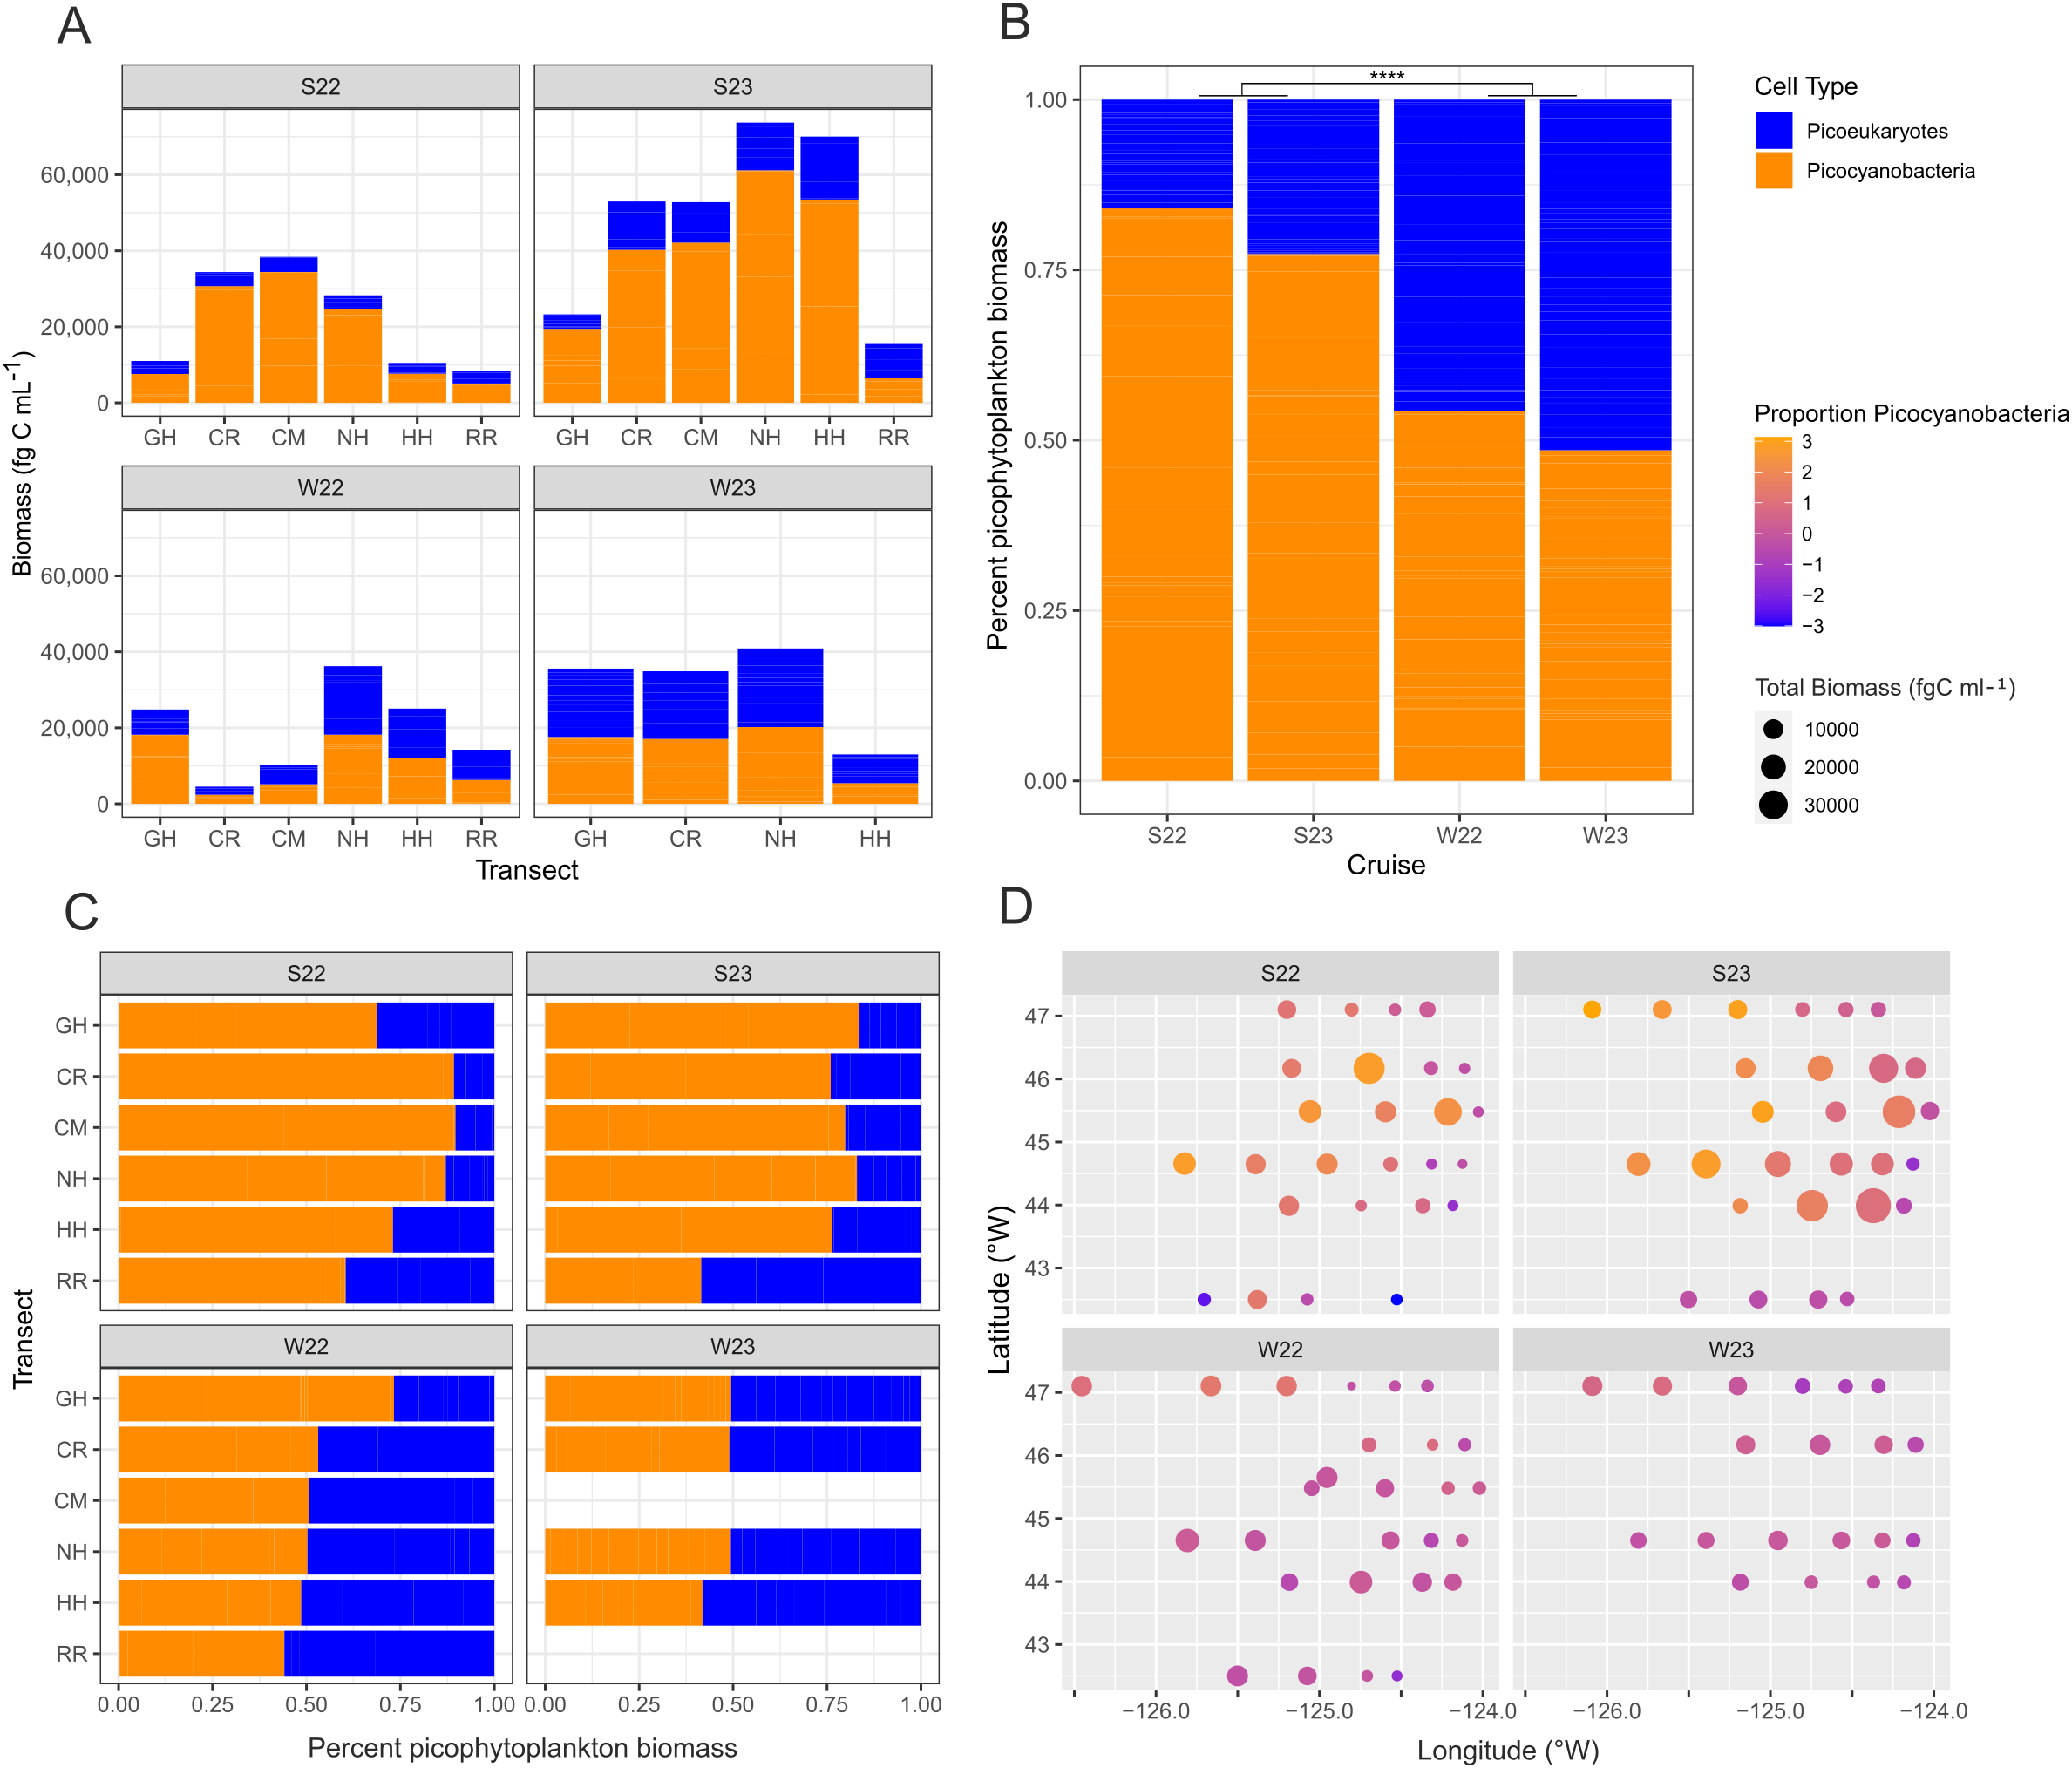
Biomass of picocyanobacteria (orange) and photosynthetic picoeukaryotes (PPE) (blue) across gradients. (A) Overall biomass at each of the different transects per season. (B) Percentage of total picophytoplankton biomass contributions of picocyanobacteria and PPE by cruise. (C) Percentage of total picophytoplankton biomass contributions of picocyanobacteria and PPE by transect. (D) Proportion of picocyanobacteria biomass compared to PPE across a longitudinal gradient per cruise. Significance of p-values (Kruskal-Wallis) is denoted by asterisks as follows: * < 0.05, ** ≤ 0.01, *** ≤ 0.001, **** ≤ 0.0001, ns = not significant. S22, S23, W22, W23: Summer 2022, Summer 2023, Winter 2022, Winter 2023 respectively. Transect abbreviations are as follows: GH, Grays Harbor; CR, Columbia River; CM, Cape Meares; NH, Newport; HH, Heceta Head; RR, Rogue River.
4 Discussion
This study addressed the spatial and temporal patterns of picophytoplankton community and cell size in the Northern California Current System. Our sampling covered varying coastal shelf steepness and topographical features, terrestrial influence through rivers, different seasons, and a record-breaking marine heat wave (August 2023). Studies focusing specifically on picophytoplankton ecology and community dynamics in the northern part of the system are rare (Schmid et al., 2023; Sherr et al., 2005), despite frequent study of its complex physical and chemical oceanography (Amos et al., 2019; Barth et al., 2024; Checkley and Barth, 2009; Connolly et al., 2010; Goñi et al., 2021; Halpern, 1976; Hickey and Banas, 2008; Hill and Wheeler, 2002; Kudela et al., 2008; MacFadyen et al., 2008; Mazzini et al., 2014) and a strong body of work on phytoplankton from the southern part of the system (Bialonski et al., 2016; Chen et al., 2024; Landry et al., 2023, 2024; Linacre et al., 2010; Taylor and Landry, 2018; Venrick, 2012). We found that picophytoplankton community structure and size varied across all the gradients we measured including across seasons, north to south along the coast, and along on-offshore gradients, which mirrored the patchy and dynamic oceanographic conditions for which the system is known. A record-breaking marine heatwave in summer 2023 corresponded to smaller cell sizes and higher picophytoplankton abundances. Because picophytoplankton are critical to supporting ecologically and economically important marine species, this work is relevant to how we manage and monitor the productivity of this coastal ecosystem (Frederiksen et al., 2006).
4.1 Dynamic picophytoplankton community structure reflects patchy oceanographic conditions
Picophytoplankton community structure varied across all the gradients we measured (Figure 3), reflecting the underlying patchiness of the oceanographic parameters known along the Washington, Oregon, and Northern California coasts (Figure 1B, E). Picocyanobacteria abundances were more dynamic than PPE abundances (Figures 3A, D, 4), suggesting that these populations have different responses to conditions in the system as a result of their unique niches in the ecosystem in terms of biomass, nutrient requirements, and selective predation on them (Schmid et al., 2023; Steinman et al., 2025). Interestingly, Synechococcus in the Southern California Current does not display similarly dynamic seasonal patterns in abundance (Nagarkar et al., 2021; Tai and Palenik, 2009). However, our observation is consistent with dynamic Synechococcus abundances and relatively stable PPE production during spring blooms in other systems: the Northeast US shelf (Fowler et al., 2020; Stevens et al., 2023) and the North Pacific Subtropical Gyre (Rii et al., 2016), emphasizing that community structure of picophytoplankton, not just overall abundance, is an important aspect of sunlit marine ecosystems.
The spatial patterns of PPE and Synechococcus from shallow coastal waters to offshore were consistent with research in the NCC twenty years prior to our study (Sherr et al., 2005) and the southern part of the California Current (Taylor and Landry, 2018). These patterns in both parts of the California Current system differ from global Synechococcus patterns, which generally show Synechococcus decreasing between shelf and offshore (Farias et al., 2023; Olson et al., 1990; Sherr et al., 2005; Stevens et al., 2023). Our results also indicated that both PPE and Synechococcus abundance decreased with increasing nutrients (Figure 8). The reasons for these patterns in the California Current are unclear, but could include microzooplankton grazing pressure on the shelf (Kudela et al., 2008), larger phytoplankton making up more of the inshore biomass, opportunistic diatom blooms taking advantage of the high nutrient pulses from upwelling, or toxic heavy metals such as cadmium in the shelf waters of Oregon and California affecting large and small phytoplankton differently (Linacre et al., 2010; Sherr et al., 2005).
We also found important differences in community composition north-south along the NCC (Figure 4). The unique physical features along the coast of the NCC, such as the Columbia River plume in the north and steep shelf in the south by the Rogue River, align with the markedly different community composition patterns, particularly the strong picocyanobacteria dynamics (more abundant than PPE in the winter along GH and CR, and less abundant than PPE in the summers at RR). This is noteworthy because it indicates picocyanobacteria may be more sensitive than PPE to these regional-level differences in topography and currents. In turn, these variations in composition may have implications to regional gradients of grazing, food web structure, nutrient cycling, and carbon contributions in different parts of the system. Particularly, microbial loop activity has been shown to drive overall community structure in the NCC (Schmid et al., 2023). While some overall patterns unite the entire system between the California, Oregon, and Washington coasts, this work shows numerous micro-habitats and regimes within the system (Jimenez et al., 2024), which are important to understand for resource management.
4.2 Picophytoplankton size reflects community and environmental dynamics
Picophytoplankton cell size was also dynamic across all the gradients of the NCC, which could support seasonal differences in carbon export of the system and food web structure, emergent features of the ecosystem which are related to cell size. While Sherr et al. (2005) estimated cell sizes using carbon biomass conversion and size fractionation with membrane filters, our study is the first in the NCC to estimate cell size at the single cell level (Figure 5). The slight decrease in PPE and picocyanobacteria average cell diameters between the shelf and offshore (Figure 6) aligns with nutrients being generally lower offshore (Figure 1D), which is consistent with the importance of resource availability to support larger cell size (Fowler et al., 2020; Landry et al., 2023; Marañón, 2015) and supported by the positive correlation we found between overall nutrient availability and cell diameter (Figure 8). The instances of large population average PPE even at low nutrient concentrations suggests another mechanism behind the differences in cell size spatially and temporally, such as different taxa present in different seasons (Vallina et al., 2023). The change in picophytoplankton size between smaller cells in summer and larger in winter could suggest different carbon fixation and export rates between seasons, with more export during winter due to the presence of larger cells (Ma et al., 2019). Thus, changes in cell size across temporal and spatial gradients of the system could play a role in the shifting carbon contributions of the ecosystem.
4.3 Marine heatwave drove picophytoplankton community towards smaller cells
This project coincided with a marine heat wave of record-breaking temperatures in summer 2023 (Leising et al., 2024) (Figure 2), which provided the opportunity to examine how marine heat waves influence phytoplankton in the Northern California Current, in comparison to previous work in the southern part of the system (Chen et al., 2024; Landry et al., 2024). Additionally, it offered an opportunity to compare phytoplankton responses in this coastal system to global predictions of temperature and primary production (Flombaum and Martiny, 2021).
We found that the marine heat wave corresponded to a shift towards higher numbers of smaller cells, and greater total picophytoplankton biomass. This observation is supported by the increased abundance of both cell types (Figure 3B) in the heat wave summer, along with decreased size of picocyanobacteria throughout the system (Figure 5C) and PPE in the southern half of the system (Figure 5D). Despite smaller cells, their greater abundance was reflected in a greater total biomass during the heat wave (Figure 9A). Additionally, the highest observed surface temperature observations during our study coincided with the lowest chlorophyll-a (Supplementary Figure S3). This could be due to the greater proportion of Synechococcus during the summers, which have less chlorophyll fluorescence than PPE. This shift is distinct from effects on phytoplankton in the Southern California Current (Landry et al., 2024), where Synechococcus and PPE abundance decreased during the 2014–15 marine heat wave while abundance of the smaller Prochlorococcus increased towards shore. In our study Prochlorococcus was absent (Supplementary Figure S5), although it has been found occasionally in the NCC (Sherr et al., 2005), in contrast to the Southern California Current where it is more abundant. However, what both regions of the California Current have in common is a shift towards smaller cells during heatwaves. This effect is consistent with satellite observations and models, which have also found shifts towards increased picophytoplankton dominance and smaller-sized species in eastern boundary upwelling systems and reduced overall phytoplankton biomass (Zhan et al., 2024) with warming water and decreasing nutrients (Dutkiewicz et al., 2021; Visintini et al., 2021). The strongest impacts on phytoplankton biomass have been associated with heat wave intensity rather than duration (Chen et al., 2024).
The changes in phytoplankton size with the marine heat wave raise the question of how grazing and trophic transfer efficiency might change in this productive upwelling system with ocean warming. In the southern part of the system, the 2014–15 heat wave increased trophic transfer and led to reduced phytoplankton predation by mesozooplankton (Landry et al., 2024), consistent with model predictions that the shift to smaller cells and different species composition triggers a decrease in transfer efficiency to higher trophic levels and altered food chain length (Dutkiewicz et al., 2021; Richardson, 2008). The consequences of a shift to small cells in the NCC could mean that phytoplankton have lower nutritional value, affecting zooplankton biomass, as seen experimentally in lab and field studies (Kim et al., 2024; Roemmich and McGowan, 1995). Because more heat waves are predicted with climate warming (Oliver et al., 2018), future shifts in a warming ocean could see altered species composition such as Prochlorococcus expanding into the NCC (Flombaum et al., 2013; Landry et al., 2024) as Prochlorococcus growth is limited by the colder temperatures of the NCC (Johnson et al., 2006) and indirect trophic interactions (Follett et al., 2022).
Future research to expand upon the current understanding of picophytoplankton dynamics in the NCC could focus on higher trophic levels in the context of picophytoplankton community patterns. This would provide a more comprehensive picture of how picophytoplankton patterns are linked to patterns in the rest of the food web.
5 Conclusions
This work expands understanding of picophytoplankton size and community structure in the dynamic Northern California Current ecosystem, as only the third study in over 20 years to look at picophytoplankton community structure and size in the system. We found that picocyanobacteria were more dramatic in seasonal shifts in abundance than pigmented picoeukaryotes, and that offshore both types of picophytoplankton are more abundant than closer to shore. Temporal variation in the phytoplankton depended on location north to south in the system, suggesting that the region may have many subsystems within it depending on coastal influences and oceanic currents. Both phytoplankton types became smaller and more abundant during a marine heatwave, suggesting that climate change could significantly impact microbial functions, carbon exports, and trophic transfer to fishery stocks. Phytoplankton in this system could indicate marine community structure and health and should be considered in risk assessment and mitigation for large-scale fishing as well as offshore wind projects and other related ocean-derived energy extraction.
Statements
Data availability statement
The original contributions presented in the study are included in the article/Supplementary Material, further inquiries can be directed to the corresponding author/s.
Author contributions
KF: Conceptualization, Formal Analysis, Investigation, Methodology, Visualization, Writing – original draft, Writing – review & editing. CS: Investigation, Methodology, Writing – review & editing. MS: Investigation, Methodology, Writing – review & editing. AK: Formal Analysis, Investigation, Methodology, Visualization, Writing – review & editing. TP: Methodology, Writing – review & editing. AT: Conceptualization, Formal Analysis, Funding acquisition, Investigation, Methodology, Supervision, Visualization, Writing – original draft, Writing – review & editing.
Funding
The author(s) declare that financial support was received for the research and/or publication of this article. Funding was provided through a PSU Faculty Development Grant to AWT, NSF-OCE 1851412 to AWT, and Simons Foundation award LS-ECIAMEE-00001481 to AWT. The research cruises described in this work were funded by NSF OCE-2125407 (to Robert Cowen and Su Sponaugle) and OCE-2125408 (Kelly Sutherland).
Acknowledgments
We thank Robert Cowen, Su Sponaugle, and Kelly Sutherland for the opportunity to participate in the research cruises described in this work. Additional thanks to the captain and crew of cruises SKQ202204S, MGL2207, SKQ202303S, and SR2317. We also thank our reviewers for their feedback and insight.
Conflict of interest
The authors declare that the research was conducted in the absence of any commercial or financial relationships that could be construed as a potential conflict of interest.
Generative AI statement
The author(s) declare that no Generative AI was used in the creation of this manuscript.
Publisher’s note
All claims expressed in this article are solely those of the authors and do not necessarily represent those of their affiliated organizations, or those of the publisher, the editors and the reviewers. Any product that may be evaluated in this article, or claim that may be made by its manufacturer, is not guaranteed or endorsed by the publisher.
Supplementary material
The Supplementary Material for this article can be found online at: https://www.frontiersin.org/articles/10.3389/fmars.2025.1575767/full#supplementary-material
References
1
Amos C. M. Castelao R. M. Medeiros P. M. (2019). Offshore transport of particulate organic carbon in the California Current System by mesoscale eddies. Nat. Commun.10, Article 1. doi: 10.1038/s41467-019-12783-5
2
Azam F. Fenchel T. Field J. Gray J. S. Meyer L. Thingstad T. F. (1983). The ecological role of water-column microbes in the sea. Mar. Ecol. Prog. Ser.10, 257–263. doi: 10.3354/meps010257
3
Barth J. A. Pierce S. D. Carter B. R. Chan F. Erofeev A. Y. Fisher J. L. et al . (2024). Widespread and increasing near-bottom hypoxia in the coastal ocean off the United States Pacific Northwest. Sci. Rep.14, Article 1. doi: 10.1038/s41598-024-54476-0
4
Barth J. A. Pierce S. D. Smith R. L. (2000). A separating coastal upwelling jet at Cape Blanco, Oregon and its connection to the California Current System. Deep Sea Res. Part II: Topical Stud. Oceanogr.47, 783–810. doi: 10.1016/S0967-0645(99)00127-7
5
Beardall J. Stojkovic S. Larsen S. (2009). Living in a high CO2 world: Impacts of global climate change on marine phytoplankton. Plant Ecol. Diversity2, 191–205. doi: 10.1080/17550870903271363
6
Behrenfeld M. J. Falkowski P. G. (1997). Photosynthetic rates derived from satellite-based chlorophyll concentration. Limnol. Oceanogr.42, 1–20. doi: 10.4319/lo.1997.42.1.0001
7
Bialonski S. Caron D. A. Schloen J. Feudel U. Kantz H. Moorthi S. D. (2016). Phytoplankton dynamics in the Southern California Bight indicate a complex mixture of transport and biology. J. Plankton Res.38, 1077–1091. doi: 10.1093/plankt/fbv122
8
Cavole L. Demko A. Diner R. Giddings A. Koester I. Pagniello C. et al . (2016). Biological impacts of the 2013–2015 warm-water anomaly in the northeast pacific: winners, losers, and the future. Oceanography29, 273–285. doi: 10.5670/oceanog.2016.32
9
Cermeño P. Figueiras F. G. (2008). Species richness and cell-size distribution: Size structure of phytoplankton communities. Mar. Ecology-Progress Ser. - Mar. ECOL-PROGR Ser.357, 79–85. doi: 10.3354/meps07293
10
Checkley D. M. Barth J. A. (2009). Patterns and processes in the California current system. Prog. Oceanogr.83, 49–64. doi: 10.1016/j.pocean.2009.07.028
11
Chen T. Kahru M. Landry M. R. Ohman M. D. Thompson A. R. Stukel M. R. (2024). Multi-trophic level responses to marine heatwave disturbances in the California current ecosystem. Ecol. Lett.27, e14502. doi: 10.1111/ele.14502
12
Cole J. Findlay S. Pace M. (1988). Bacterial production in fresh and saltwater ecosystems: A cross-system overview. Mar. Ecol. Prog. Ser.43, 1–10. doi: 10.3354/meps043001
13
Connolly T. P. Hickey B. M. Geier S. L. Cochlan W. P. (2010). Processes influencing seasonal hypoxia in the northern California Current System. J. Geophysical Res.: Oceans115. doi: 10.1029/2009JC005283
14
Dutkiewicz S. Boyd P. W. Riebesell U. (2021). Exploring biogeochemical and ecological redundancy in phytoplankton communities in the global ocean. Global Change Biol.27, 1196–1213. doi: 10.1111/gcb.15493
15
Farias G. B. Melo P. A. M. de C. López-Abbate M. C. Bertrand A. Carré C. et al . (2023). Nutrient availability regulates the microbial biomass structure in marine oligotrophic waters. Hydrobiologia851, 1923–1938. doi: 10.1007/s10750-023-05427-9
16
Field C. B. Behrenfeld M. J. Randerson J. T. Falkowski P. (1998). Primary production of the biosphere: integrating terrestrial and oceanic components. Science281, 237–240. doi: 10.1126/science.281.5374.237
17
Flombaum P. Gallegos J. L. Gordillo R. A. Rincón J. Zabala L. L. Jiao N. et al . (2013). Present and future global distributions of the marine Cyanobacteria Prochlorococcus and Synechococcus. Proc. Natl. Acad. Sci.110, 9824–9829. doi: 10.1073/pnas.1307701110
18
Flombaum P. Martiny A. C. (2021). Diverse but uncertain responses of picophytoplankton lineages to future climate change. Limnol. Oceanogr.66, 4171–4181. doi: 10.1002/lno.11951
19
Follett C. L. Dutkiewicz S. Ribalet F. Zakem E. Caron D. Armbrust E. V. et al . (2022). Trophic interactions with heterotrophic bacteria limit the range of Prochlorococcus. Proc. Natl. Acad. Sci.119, e2110993118. doi: 10.1073/pnas.2110993118
20
Fowler B. L. Neubert M. G. Hunter-Cevera K. R. Olson R. J. Shalapyonok A. Solow A. R. et al . (2020). Dynamics and functional diversity of the smallest phytoplankton on the Northeast US Shelf. Proc. Natl. Acad. Sci.117, 12215–12221. doi: 10.1073/pnas.1918439117
21
Frederiksen M. Edwards M. Richardson A. J. Halliday N. C. Wanless S. (2006). From plankton to top predators: Bottom-up control of a marine food web across four trophic levels. J. Anim. Ecol.75, 1259–1268. doi: 10.1111/j.1365-2656.2006.01148.x
22
Gomes D. G. E. Ruzicka J. J. Crozier L. G. Huff D. D. Brodeur R. D. Stewart J. D. (2024a). Marine heatwaves disrupt ecosystem structure and function via altered food webs and energy flux. Nat. Commun.15, 1988. doi: 10.1038/s41467-024-46263-2
23
Gomes D. G. E. Ruzicka J. J. Crozier L. G. Huff D. D. Phillips E. M. Hernvann P.-Y. et al . (2024b). An updated end-to-end ecosystem model of the Northern California Current reflecting ecosystem changes due to recent marine heatwaves. PloS One19, e0280366. doi: 10.1371/journal.pone.0280366
24
Goñi M. A. Welch K. A. Alegria E. Alleau Y. Watkins-Brandt K. White A. E. (2021). Wintertime particulate organic matter distributions in surface waters of the northern California current system. Continental Shelf Res.213, 104312. doi: 10.1016/j.csr.2020.104312
25
Halpern D. (1976). Measurements of near-surface wind stress over an upwelling region near the oregon coast. J. Phys. Oceanogr.6, 108–112. doi: 10.1175/1520-0485(1976)006<0108:MONSWS>2.0.CO;2
26
Heneghan R. F. Hatton I. A. Galbraith E. D. (2019). Climate change impacts on marine ecosystems through the lens of the size spectrum. Emerging Topics Life Sci.3, 233–243. doi: 10.1042/ETLS20190042
27
Hickey B. M. Banas N. S. (2008). Why is the northern end of the California current system so productive? Oceanography21, 90–107. doi: 10.5670/oceanog.2008.07
28
Hill J. K. Wheeler P. A. (2002). Organic carbon and nitrogen in the northern California current system: Comparison of offshore, river plume, and coastally upwelled waters. Prog. Oceanogr.53, 369–387. doi: 10.1016/S0079-6611(02)00037-X
29
Jimenez V. Sudek S. Eckmann C. Bachy C. Poirier C. Wittmers F. et al . (2024). Distinct phytoplankton assemblages underlie hotspots of primary production in the eastern North Pacific Ocean. Limnol. Oceanogr.9999, 1–16. doi: 10.1002/lno.12771
30
Johnson Z. I. Zinser E. R. Coe A. McNulty N. P. Woodward E. M. S. Chisholm S. W. (2006). Niche partitioning among prochlorococcus ecotypes along ocean-scale environmental gradients. Science311, 1737–1740. doi: 10.1126/science.1118052
31
Kim J. O. Dimitriou A. Forster I. Tseng M. (2024). Heatwave-mediated decreases in phytoplankton quality negatively affect zooplankton productivity. Funct. Ecol.38, 778–791. doi: 10.1111/1365-2435.14530
32
Kudela R. M. Banas N. S. Barth J. A. Frame E. R. Jay D. A. Largier J. L. et al . (2008). New insights into the controls and mechanisms of plankton productivity in coastal upwelling waters of the northern California current system. Oceanography21, 46–59. doi: 10.5670/oceanog.2008.04
33
Landry M. R. Freibott A. L. Stukel M. R. Selph K. E. Allen A. E. Rabines A. (2024). Phytoplankton growth and grazing dynamics during anomalous heat wave and suppressed upwelling conditions in the southern California Current. Deep Sea Res. Part I: Oceanographic Res. Papers210, 104353. doi: 10.1016/j.dsr.2024.104353
34
Landry M. R. Stukel M. R. Selph K. E. Goericke R. (2023). Coexisting picoplankton experience different relative grazing pressures across an ocean productivity gradient. Proc. Natl. Acad. Sci.120, e2220771120. doi: 10.1073/pnas.2220771120
35
Leising A. DeWitt L. Williams G. (2024). The California current marine heatwave tracker—Blobtracker | Integrated ecosystem assessment (La Jolla, CA, USA: Integrated Ecosystem Management - NOAA). Available online at: https://www.integratedecosystemassessment.noaa.gov/regions/california-current/california-current-marine-heatwave-tracker-blobtracker (Accessed August 9, 2024).
36
Li W. K. W. Rao D. V. S. Harrison W. G. Smith J. C. Cullen J. J. Irwin B. et al . (1983). Autotrophic picoplankton in the tropical ocean. Science219, 292–295. doi: 10.1126/science.219.4582.292
37
Linacre L. P. Landry M. R. Lara-Lara J. R. Hernández-Ayón J. M. Bazán-Guzmán C. (2010). Picoplankton dynamics during contrasting seasonal oceanographic conditions at a coastal upwelling station off Northern Baja California, México. J. Plankton Res.32, 539–557. doi: 10.1093/plankt/fbp148
38
Longhurst A. Sathyendranath S. Platt T. Caverhill C. (1995). An estimate of global primary production in the ocean from satellite radiometer data. J. Plankton Res.17, 1245–1271. doi: 10.1093/plankt/17.6.1245
39
Ma W. Xiu P. Chai F. Li H. (2019). Seasonal variability of the carbon export in the central South China Sea. Ocean Dynamics69, 955–966. doi: 10.1007/s10236-019-01286-y
40
MacFadyen A. Hickey B. M. Cochlan W. P. (2008). Influences of the Juan de Fuca Eddy on circulation, nutrients, and phytoplankton production in the northern California Current System. J. Geophysical Res.: Oceans113. doi: 10.1029/2007JC004412
41
Marañón E. (2015). Cell size as a key determinant of phytoplankton metabolism and community structure. Annu. Rev. Mar. Sci.7, 241–264. doi: 10.1146/annurev-marine-010814-015955
42
Massana R. (2011). Eukaryotic picoplankton in surface oceans. Annu. Rev. Microbiol.65, 91–110. doi: 10.1146/annurev-micro-090110-102903
43
Mazzini P. L. F. Barth J. A. Shearman R. K. Erofeev A. (2014). Buoyancy-Driven Coastal Currents off Oregon during Fall and Winter. J. Phys. Oceanogr.44, 2854–2876. doi: 10.1175/JPO-D-14-0012.1
44
Moore L. R. Post A. F. Rocap G. Chisholm S. W. (2002). Utilization of different nitrogen sources by the marine cyanobacteria Prochlorococcus and Synechococcus. Limnol. Oceanogr.47, 989–996. doi: 10.4319/lo.2002.47.4.0989
45
Nagarkar M. Wang M. Valencia B. Palenik B. (2021). Spatial and temporal variations in Synechococcus microdiversity in the Southern California coastal ecosystem. Environ. Microbiol.23, 252–266. doi: 10.1111/1462-2920.15307
46
Oliver E. C. J. Donat M. G. Burrows M. T. Moore P. J. Smale D. A. Alexander L. V. et al . (2018). Longer and more frequent marine heatwaves over the past century. Nat. Commun.9, 1324. doi: 10.1038/s41467-018-03732-9
47
Olson R. J. Chisholm S. W. Zettler E. R. Armbrust E. V. (1990). Pigments, size, and distributions of Synechococcus in the North Atlantic and Pacific Oceans. Limnol. Oceanogr.35, 45–58. doi: 10.4319/lo.1990.35.1.0045
48
Partensky F. Hess W. R. Vaulot D. (1999). Prochlorococcus, a marine photosynthetic prokaryote of global significance. Microbiol. Mol. Biol. Rev.63, 106–127. doi: 10.1128/MMBR.63.1.106-127.1999
49
Ribalet F. Berthiaume C. Hynes A. Swalwell J. Carlson M. Clayton S. et al . (2019). SeaFlow data v1, high-resolution abundance, size and biomass of small phytoplankton in the North Pacific. Sci. Data6, 277. doi: 10.1038/s41597-019-0292-2
50
Richardson A. J. (2008). In hot water: Zooplankton and climate change. ICES J. Mar. Sci.65, 279–295. doi: 10.1093/icesjms/fsn028
51
Richardson A. J. Schoeman D. S. (2004). Climate impact on plankton ecosystems in the northeast Atlantic. Science305, 1609–1612. doi: 10.1126/science.1100958
52
Rii Y. Karl D. Church M. (2016). Temporal and vertical variability in picophytoplankton primary productivity in the North Pacific Subtropical Gyre. Mar. Ecol. Prog. Ser.562, 1–18. doi: 10.3354/meps11954
53
Roemmich D. McGowan J. (1995). Climatic warming and the decline of zooplankton in the California current. Science267, 1324–1326. doi: 10.1126/science.267.5202.1324
54
Schmid M. S. Sponaugle S. Thompson A. W. Sutherland K. R. Cowen R. K. (2023). Drivers of plankton community structure in intermittent and continuous coastal upwelling systems–from microbes and microscale in-situ imaging to large scale patterns. Front. Mar. Sci.10. doi: 10.3389/fmars.2023.1166629
55
Sherr E. B. Sherr B. F. Wheeler P. A. (2005). Distribution of coccoid cyanobacteria and small eukaryotic phytoplankton in the upwelling ecosystem off the Oregon coast during 2001 and 2002. Deep Sea Res. Part II: Topical Stud. Oceanogr.52, 317–330. doi: 10.1016/j.dsr2.2004.09.020
56
Steinman M. Schmid M. S. Cowen R. K. Sponaugle S. Sutherland K. R. Thompson A. W. (2025). The microorganisms associated with doliolids in a productive coastal upwelling system. Limnol. Oceanogr.70, 244–257. doi: 10.1002/lno.12748
57
Stevens B. L. F. Crockford E. T. Peacock E. E. Neubert M. G. Sosik H. M. (2023). Temperature regulates Synechococcus population dynamics seasonally and across the continental shelf. Limnol. Oceanogr. Lett. 9 (3), 183–190. doi: 10.1002/lol2.10331
58
Stukel M. Décima M. Kelly T. Landry M. Nodder S. Ohman M. et al . (2024). Relationships between plankton size spectra, net primary production, and the biological carbon pump. Global Biogeochemical Cycles38. doi: 10.1029/2023GB007994
59
Tai V. Palenik B. (2009). Temporal variation of Synechococcus clades at a coastal Pacific Ocean monitoring site. ISME J.3, 903–915. doi: 10.1038/ismej.2009.35
60
Taylor A. Landry M. (2018). Phytoplankton biomass and size structure across trophic gradients in the southern California Current and adjacent ocean ecosystems. Mar. Ecol. Prog. Ser.592, 1–17. doi: 10.3354/meps12526
61
Vallina S. M. Gaborit C. Marrase C. Gasol J. M. Bahamon N. Follows M. J. et al . (2023). Seasonal dynamics of phytoplankton community assembly at the Blanes Bay Microbial Observatory (BBMO), NW Mediterranean Sea. Prog. Oceanogr.219, 103125. doi: 10.1016/j.pocean.2023.103125
62
Venrick E. (2012). Phytoplankton in the California Current system off southern California: Changes in a changing environment. Prog. Oceanogr.104, 46–58. doi: 10.1016/j.pocean.2012.05.005
63
Visintini N. Martiny A. C. Flombaum P. (2021). Prochlorococcus, Synechococcus, and picoeukaryotic phytoplankton abundances in the global ocean. Limnol. Oceanogr. Lett.6, 207–215. doi: 10.1002/lol2.10188
64
Wickham H . (2016). ggplot2: Elegant Graphics for Data Analysis. (Springer-Verlag New York). ISBN 978-3-319-24277-4. Available online at: https://ggplot2.tidyverse.org.
65
Waterbury J. B. Watson S. W. Guillard R. R. L. Brand L. E. (1979). Widespread occurrence of a unicellular, marine, planktonic, cyanobacterium. Nature277, 293. doi: 10.1038/277293a0
66
Wickman J. Litchman E. Klausmeier C. A. (2024). Eco-evolutionary emergence of macroecological scaling in plankton communities. Science383, 777–782. doi: 10.1126/science.adk6901
67
Worden A. Z. Follows M. J. Giovannoni S. J. Wilken S. Zimmerman A. E. Keeling P. J. (2015). Rethinking the marine carbon cycle: Factoring in the multifarious lifestyles of microbes. Science347, 1257594. doi: 10.1126/science.1257594
68
Zhan W. Feng M. Zhang Y. Shen X. Zhan H. He Q. (2024). Reduced and smaller phytoplankton during marine heatwaves in eastern boundary upwelling systems. Commun. Earth Environ.5, 1–11. doi: 10.1038/s43247-024-01805-w
Summary
Keywords
phytoplankton, Northern California current, marine heat wave, microbial ecology, Synechococcus , flow cytometry, picophytoplankton
Citation
Forgrave KE, Sweeney CP, Steinman M, Kerkar AU, Pettit TM and Thompson AW (2025) Impact of oceanographic gradients and marine heatwaves on the picophytoplankton community in the Northern California Current System. Front. Mar. Sci. 12:1575767. doi: 10.3389/fmars.2025.1575767
Received
12 February 2025
Accepted
13 June 2025
Published
27 June 2025
Volume
12 - 2025
Edited by
Stefano Aliani, National Research Council (CNR), Italy
Reviewed by
Stacy Louise Deppeler, National Institute of Water and Atmospheric Research (NIWA), New Zealand
Bob Brewin, University of Exeter, United Kingdom
Isabelle Cox, University of Exeter, United Kingdom in collaboration with reviewer BB
Updates
Copyright
© 2025 Forgrave, Sweeney, Steinman, Kerkar, Pettit and Thompson.
This is an open-access article distributed under the terms of the Creative Commons Attribution License (CC BY). The use, distribution or reproduction in other forums is permitted, provided the original author(s) and the copyright owner(s) are credited and that the original publication in this journal is cited, in accordance with accepted academic practice. No use, distribution or reproduction is permitted which does not comply with these terms.
*Correspondence: Anne W. Thompson, awt@pdx.edu
Disclaimer
All claims expressed in this article are solely those of the authors and do not necessarily represent those of their affiliated organizations, or those of the publisher, the editors and the reviewers. Any product that may be evaluated in this article or claim that may be made by its manufacturer is not guaranteed or endorsed by the publisher.