Abstract
Corallivory, or predation on corals, is a naturally occurring process that, at high levels, can impair coral growth, reproduction, and recovery. Traditionally, fish corallivory monitoring has been achieved through in situ visual surveys and analysis of 2D photoquadrats. However, 3D imaging techniques such as structure-from-motion (SfM) can provide a powerful tool to collect high-resolution colony-level data with limited field effort. Here, we conducted fish corallivory surveys using a recently developed SfM method at 10 sites around the island of O‘ahu, Hawai‘i, paired with in situ surveys to evaluate the accuracy of SfM as a fish corallivory monitoring tool. Our primary objectives were to test for differences in fish bite counts between methods and to understand how variables such as depth, hard coral cover, type of fish predator, and coral species further influenced that difference. Based on bite mark characteristics, we identified four types of fish predators: blennies, parrotfishes, scrapers, and excavators, with the latter two including triggerfish, pufferfish, and, to a lesser extent, parrotfish. Overall, fish bite counts varied significantly between methodologies, with higher counts recorded through SfM annotations and an average difference between methods of 17.34 bite marks m−2 ( ± SD: SfM = 39.64 ± 56.71; in situ = 22.30 ± 25.09 bite marks m−²). The nature of these differences further varied depending on the type of predator and the coral species they consumed. Lastly, at deeper and higher coral cover sites, the difference in bite counts between methods was greater than at shallower and lower cover sites, with more bite counts recorded with SfM. These differences likely reflect inherent air and time limitations divers face that do not exist when annotating SfM models. Despite differences in absolute fish bite mark counts, both methods were consistent in the qualitative patterns of relative fish corallivory across sites, whereby methods aligned in the ranked order of sites from the least to most fish corallivory observed. Overall, our results indicate that SfM is a viable tool to quantify fish corallivory, with the added benefit of enhanced accuracy at sites where diver-based surveys are logistically limited.
1 Introduction
Corallivores, or coral predators, encompass a diverse range of taxa, including fishes, seastars, and annelids (Rotjan and Lewis, 2008). Corallivorous fishes are some of the most conspicuous and widespread corallivores and confer important benefits to coral reefs. For example, they mediate coral–coral (Cox, 1986; Littler et al., 1989) and coral–algal competition (Miller and Hay, 1998), prevent other coral predators from accessing coral colonies through interference competition (Hourigan, 1987; Carlson, 1992; Tricas and Boyle, 2014), and disperse beneficial coral symbionts through their feces (Grupstra et al., 2021). However, corallivores can also negatively affect corals. At the colony level, fish predation can inhibit coral growth and reproduction as metabolic resources are diverted to wound healing (Henry and Hart, 2005; Lenihan and Edmunds, 2010; Palacios et al., 2014). Corallivorous fishes are also known to selectively feed on gravid polyps (Rotjan, 2007) and cause complete colony mortality (Jayewardene et al., 2009), and they may negatively influence coral disease dynamics (Renzi et al., 2022). Moreover, corallivorous fishes feed on coral recruits and/or juveniles, which may slow reef-level recovery following disturbance events (Mumby et al., 2016). High levels of predation are also commonly observed on recently outplanted corals, potentially threatening the efficacy of coral restoration efforts (Koval et al., 2020; Smith et al., 2021).
Aside from the adverse effects of fish corallivory, coral reefs face many other threats at both global [e.g., ocean warming and acidification (Hoegh-Guldberg and Bruno, 2010; Hughes et al., 2018)] and local scales [e.g., sedimentation (Erftemeijer et al., 2012), sewage discharge (Sutherland et al., 2010), and nutrient enrichment (D’Angelo and Wiedenmann, 2014)], which can further compound the effects of corallivory. For example, prolonged elevated temperatures can hinder wound healing from corallivores in Acropora spp (Bonesso et al., 2017), and nutrient enrichment can prolong wound repair in some coral species (Renegar et al., 2008). As threats to corals escalate and compound the effects of corallivory, coral reef managers increasingly need to implement monitoring strategies to track changes in corallivory.
The effect corallivorous fishes have on corals can be determined by their feeding mode. The four modes are as follows: 1) mucus eaters (e.g., filefishes and butterflyfishes) consume only mucus and some coral tissue; 2) browsers (e.g., butterflyfishes and blennies) remove only coral tissue; 3) scrapers (e.g., pufferfishes, filefishes, and parrotfishes) remove living tissue and a superficial layer of skeleton; and 4) excavators (e.g., pufferfishes, filefishes, and parrotfishes) remove substantial tissue and coral skeleton (Rotjan and Lewis, 2008; Rice et al., 2019). While some corallivores, like blennies, fit exclusively into one category (i.e., browsers), others can exhibit multiple feeding modes, such as triggerfishes, which can function as both excavators and scrapers. Differentiating between these feeding modes is important because they can lead to varying coral healing rates, which further vary among coral species (Rempel et al., 2020). For instance, scraper and browser bite marks heal more rapidly on Pocillopora meandrina than massive Porites species, whereas excavator lesions exhibit faster healing rates on massive Porites than P. meandrina (Cameron and Edmunds, 2014). Therefore, monitoring tools must be able to distinguish between feeding modes as these can lead to distinct outcomes for coral colonies and coral reef community dynamics.
Fish corallivory assessments have historically been completed using in situ surveys, where divers count bite marks while underwater, and from photoquadrats, which are post hoc estimates of bite counts derived from assessments of individual photos. While in situ visual surveys are the current “gold standard” method, they are field-intensive and require multiple divers surveying the sample area to validate, further limiting the spatial extent of surveys as more resources are devoted to a single location. Alternatively, photoquadrats offer a rapid way to gather corallivory data, but typically capture small, non-continuous reef areas and may underestimate fish corallivory due to the challenge of studying a 3D environment with a 2D image (Rice et al., 2020). Structure-from-motion (SfM) photogrammetry is an imagery-based technique that is increasingly being used to monitor coral reefs (Remmers et al., 2024). SfM surveys capture hundreds to thousands of overlapping photographs of a coral reef, which are then assembled using computer software to construct 3D point clouds and 2D, top-down projections of the reef. Using SfM as a corallivory monitoring tool would enable researchers to survey continuous reef areas, thereby expanding coverage, and because imagery for multiple models can be captured in one dive, more surveys can be conducted per site. Furthermore, annotators can validate observations with each other without using field time, resulting in more accurate estimates than those derived from photoquadrats because surveyors have access to multiple images from different angles of the same reef area. Lastly, the high-quality images captured from multiple angles can allow annotators to differentiate between various types of bite marks. Within the context of corallivory surveys, SfM has been used to study only parrotfish corallivory (Charendoff et al., 2023a), with no studies conducted to assess its validity in quantifying fish corallivory more broadly.
Here, we conducted fish corallivory surveys using a recently developed SfM methodology paired with in situ visual surveys, hereafter in situ surveys, to evaluate the accuracy of SfM as a fish corallivory monitoring tool. The goals of this study were to 1) understand how fish corallivory rates derived from SfM annotations compared to estimates from in situ surveys; 2) assess the strengths of SfM by evaluating how variables that could impose time limitations in the field, specifically depth and hard coral cover, correlated with recorded bite mark counts; and 3) evaluate how specific nuances in quantifying different types of fish predation on various coral species affected estimates from SfM. For instance, certain predation types may be more visible on specific coral species depending on the method used.
2 Materials and methods
2.1 Sampling design
Between June 2021 and October 2022, we surveyed between two and six 20 m transects (sample size varied due to logistical constraints) at 10 sites around O‘ahu for a total of 39 transects (Figure 1). All sites were at least 3 km apart, and transects within each site were separated by at least 20 m. Sites were selected to encompass a range in coral cover, rugosity, habitat type (as described in Winston et al., 2020), and depth (Supplementary Table 1). Transect placements within each site were haphazardly chosen along each depth contour.
Figure 1
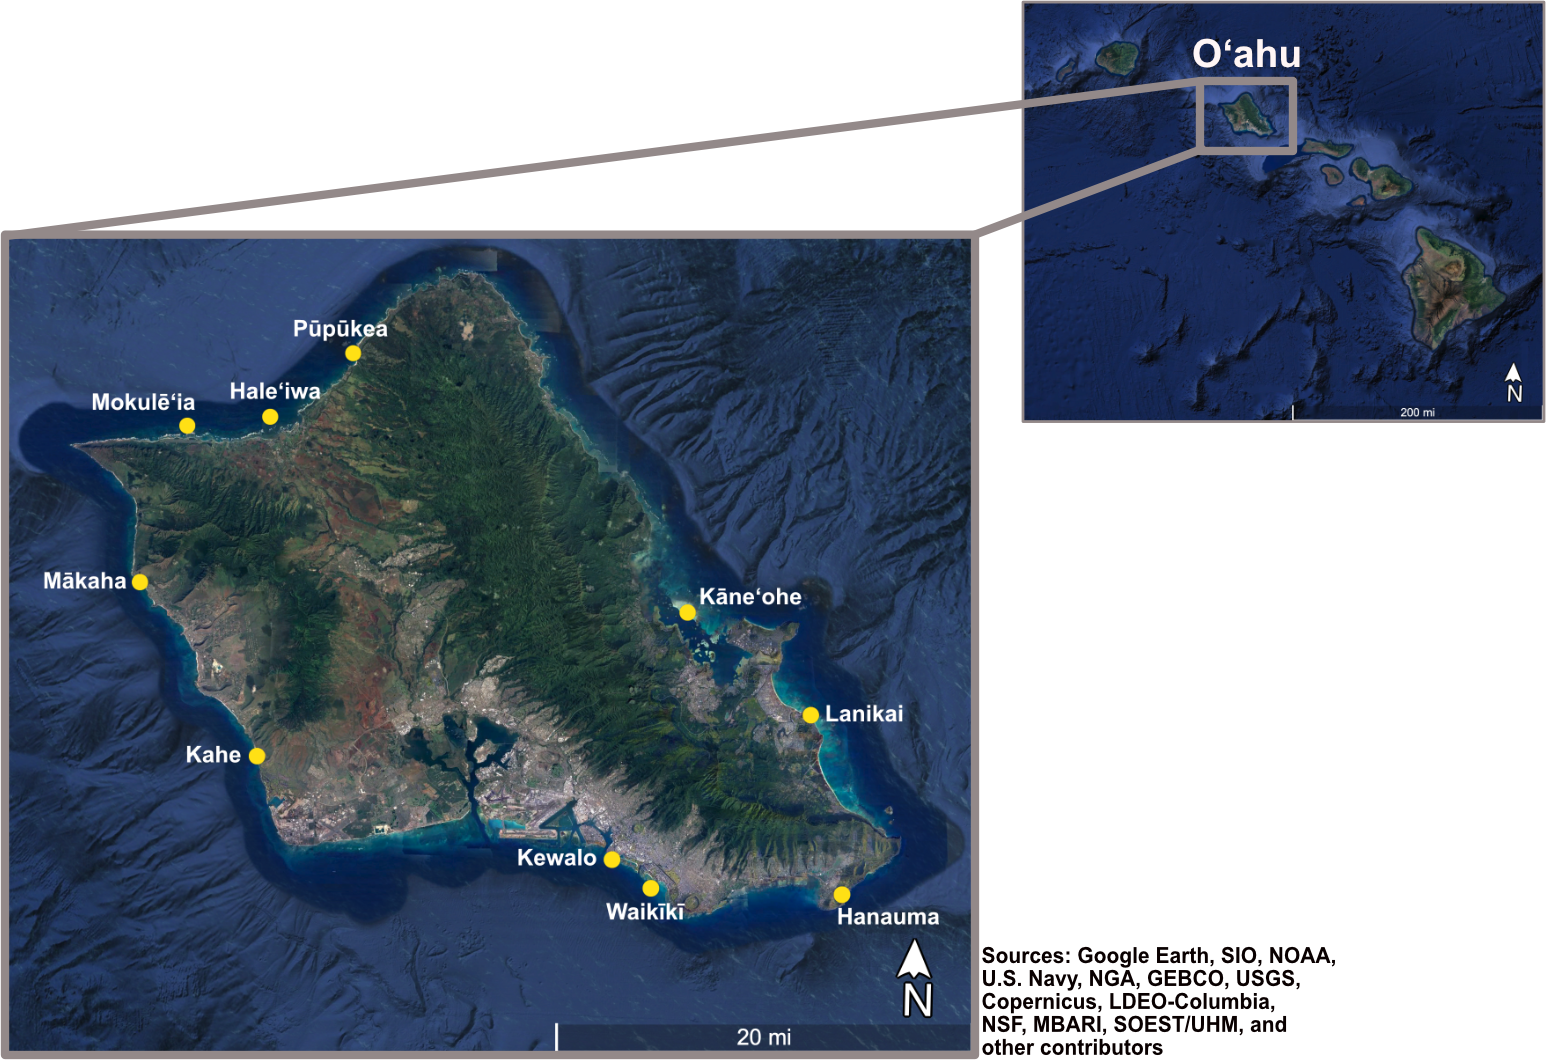
Location of the 10 survey sites (yellow dots) around the island of O‘ahu, Hawai‘i.
2.2 In situ data collection
We surveyed all live coral tissue within seven 1 m × 1 m quadrats spaced 3 m apart along each 20 m transect. We recorded the number of bite marks produced by fish on all live coral tissue as well as the coral species and the type of predation mark (hereafter “bite mark category”; Table 1; Escontrela Dieguez et al., 2023). We placed a painted fishing weight at the start of each quadrat to mark its location for post hoc SfM analysis. Quadrats were haphazardly selected to encompass a range in coral cover, rugosity, and habitat types.
Table 1
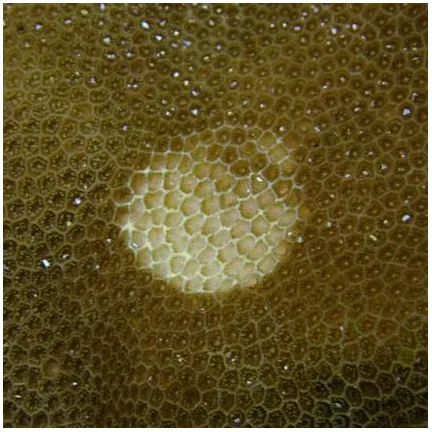
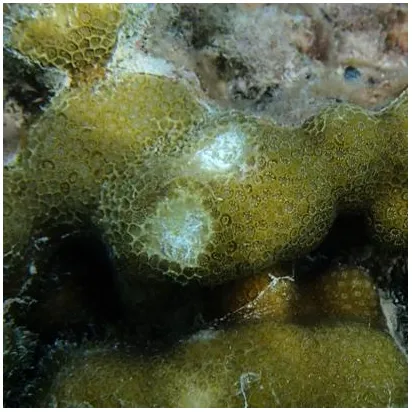
| Bite mark category | Blenny | Parrotfish | Scraper | Excavator |
|---|---|---|---|---|
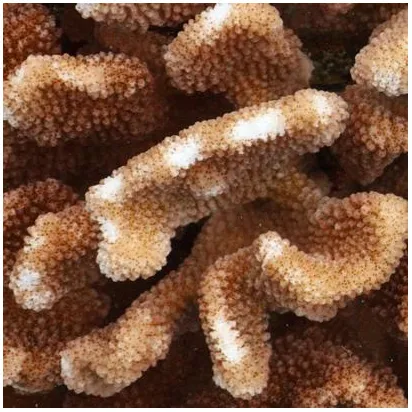
| Fish corallivore | Shortbodied blenny (Exallias brevis) | Stareye parrotfish (Calotomus carolinus) Spectacled parrotfish (Chlorurus perspicillatus) |
Barred filefish (Cantherhines dumerilii) Spotted pufferfish (Arothron meleagris) Subfamily Scarinae |
|
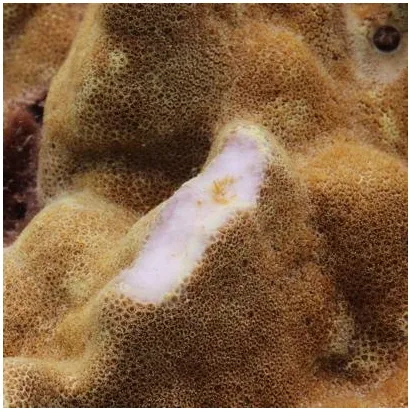
| Description | Small circles with only tissue removal | Paired, oval bite marks with superficial skeleton removal (gap between ovals not always evident) | Shallow sections of skeleton removed (shallower than 3 mm) | Large portions of skeleton removed (deeper than 3 mm) |
| References | Carlson (2012) (species and bite mark description) |
Rotjan and Lewis (2008) (species descriptions); Bonaldo et al. (2011) (bite mark descriptions) |
Jayewardene et al. (2009) (species descriptions); Rice et al. (2019) (bite mark descriptions) |
|
| Photograph |
|
|
|
|
Fish bite mark categories, the associated fish species causing each bite mark, descriptions of the categories, and accompanying close-up photographs.
Note that parrotfishes are known to be scrapers and/or excavators; however, bite marks were categorized as parrotfish bite marks when they had the characteristic shape described above. Scrapers and excavators could include parrotfishes when there is no distinct shape.
Bite mark categories were assigned based on information from the scientific literature (see Table 1 for references). Although parrotfishes are considered scrapers and excavators, their bite marks were categorized separately because they had a unique bite mark shape that was easy to identify on most coral species. Note that parrotfish bites were not discernible on Pocillopora spp. and were lumped into the scraper and excavator category in those instances. Similarly, blennies produced bite marks with a distinct shape, leading to their categorization as a separate group. We identified all corals to the species-level except Porites lobata and P. evermanni, which were both categorized as “Massive Porites” and Leptastrea bewickensis, L. purpurea, and L. transversa, which were categorized as “Leptastrea species” due to difficulties in species-level identification. We documented invertebrate predation by Drupella snails and seastars but excluded these predation types from analysis due to infrequent occurrence (n = 24 out of 273 quadrats).
2.3 Structure-from-motion data collection
We collected SfM imagery covering the same transect area where we laid down quadrats to conduct fish corallivory surveys following techniques delineated in Suka et al. (2019). Briefly, we captured all imagery using a Canon SL2 camera with an Ikelite housing and an 18–55 mm lens fixed at 18 mm. We inspected all imagery for issues with quality and uploaded it to the software Agisoft Metashape to construct 3D dense point clouds and 2D top-down orthomosaics, or geometrically accurate composite images based on the 3D structure of the dense point cloud. We then exported orthomosaics from Agisoft Metashape (1 mm/pix resolution) and imported them into ArcGIS Pro, where we added a geodatabase to each model and delineated transect lines and quadrats, as described in Escontrela Dieguez et al. (2023). The fishing weights served as a guide for quadrat and transect placement in each ArcGIS Pro project and helped ensure the same reef areas were annotated as in the in situ surveys. Using the software Viscore, we inspected the underlying imagery for all live coral tissue found within each quadrat. When we found bite marks produced by fish, we used the multipoint tool in ArcGIS Pro to annotate each bite mark and recorded the number of bite marks, the coral species on which they were found, and the bite mark category. Before commencing the full annotation process, both annotators independently annotated the same six quadrats (out of the 273) to calibrate with each other.
2.4 Hard coral cover data collection
To estimate the percent cover of live coral per quadrat, we extracted high-resolution images of each quadrat from the orthomosaics (default resolution < 1 mm/pix), hereafter orthoblocks, using the methods described in Escontrela Dieguez et al. (2023). We imported these orthoblocks to CoralNet, a software used for benthic image analysis, where we annotated 35 randomly selected points to the lowest taxonomic level of coral species or genus. The percent hard coral cover for each quadrat was then calculated by dividing the number of points that were categorized as hard coral species by 35.
2.5 Data analysis
We analyzed all data using the statistical software R version 4.3.1 (R Core Team, 2023). The number of fish bite marks, between-method count differences, hard coral cover, and depth were averaged across quadrats per transect. We tested for homoscedasticity using plots of residuals versus fitted values and tested the assumptions of normality using q-q plots of residuals.
To understand how fish corallivory rates derived from SfM annotations compared to estimates from in situ surveys, we employed the Wilcoxon rank test with and without outliers to test for differences in the total number of bite marks between methods. We defined outliers according to Baumann et al. (2022) (1.5 IQR above the third quartile or below the first quartile). To assess the methodological strengths of SfM in quantifying fish corallivory, we ran two analyses evaluating how variables that could impose time limitations in the field influenced recorded bite mark counts. First, we examined how fish bite mark counts varied between methods with depth by constructing a generalized linear mixed effects model (GLMM) using the Poisson distribution and site as a random effect. Second, we used a GLMM with a Poisson distribution to examine how fish bite mark counts varied between methods and bite mark categories with hard coral cover. In addition to the site, we added depth, binned into 5 m increments, as a random effect to account for variability not explained in our fixed effects. Lastly, to evaluate nuances specific to quantifying fish corallivory with SfM, we examined how between-method differences varied between coral species with hard coral cover by building linear mixed effects models (LMMs) for each bite mark category with site and depth, binned into 5 m increments, as random effects. For these models, we removed all coral species in each bite mark category with fewer than four observations.
The fixed effects in each model were evaluated for significance using likelihood ratio tests (LRTs). Upon identifying a significant interaction, we tested for differences between slopes using the “lstrends” function in R (Lenth, 2016). When interactions were not significant but individual predictors were, we tested for differences between levels using post hoc Tukey’s test for pairwise comparisons.
3 Results
3.1 SfM versus in situ surveys
Fish bite mark counts significantly differed between methods (Wilcoxon signed-rank test, z = −3.09, p = 0.002), even when outliers were excluded (z = −2.21, p = 0.03). We identified five outliers: three at Hanauma Bay and two at Kewalo (Figure 2A). The mean difference between methods (SfM counts minus in situ counts) was 17.34 bite marks m−2 ( ± SD: SfM = 39.64 ± 56.71; in situ = 22.30 ± 25.09 bite marks m−²). We recorded 77.8% more bite marks with SfM than in situ surveys, and this difference was more pronounced above 50 bite marks m−2 (Figure 2A). Despite differences in absolute counts, the trends in fish corallivory rates across sites were consistent between methods. That is, sites that exhibited high corallivory densities with SfM similarly had high densities when quantified with in situ surveys and vice versa (Figure 2B).
Figure 2
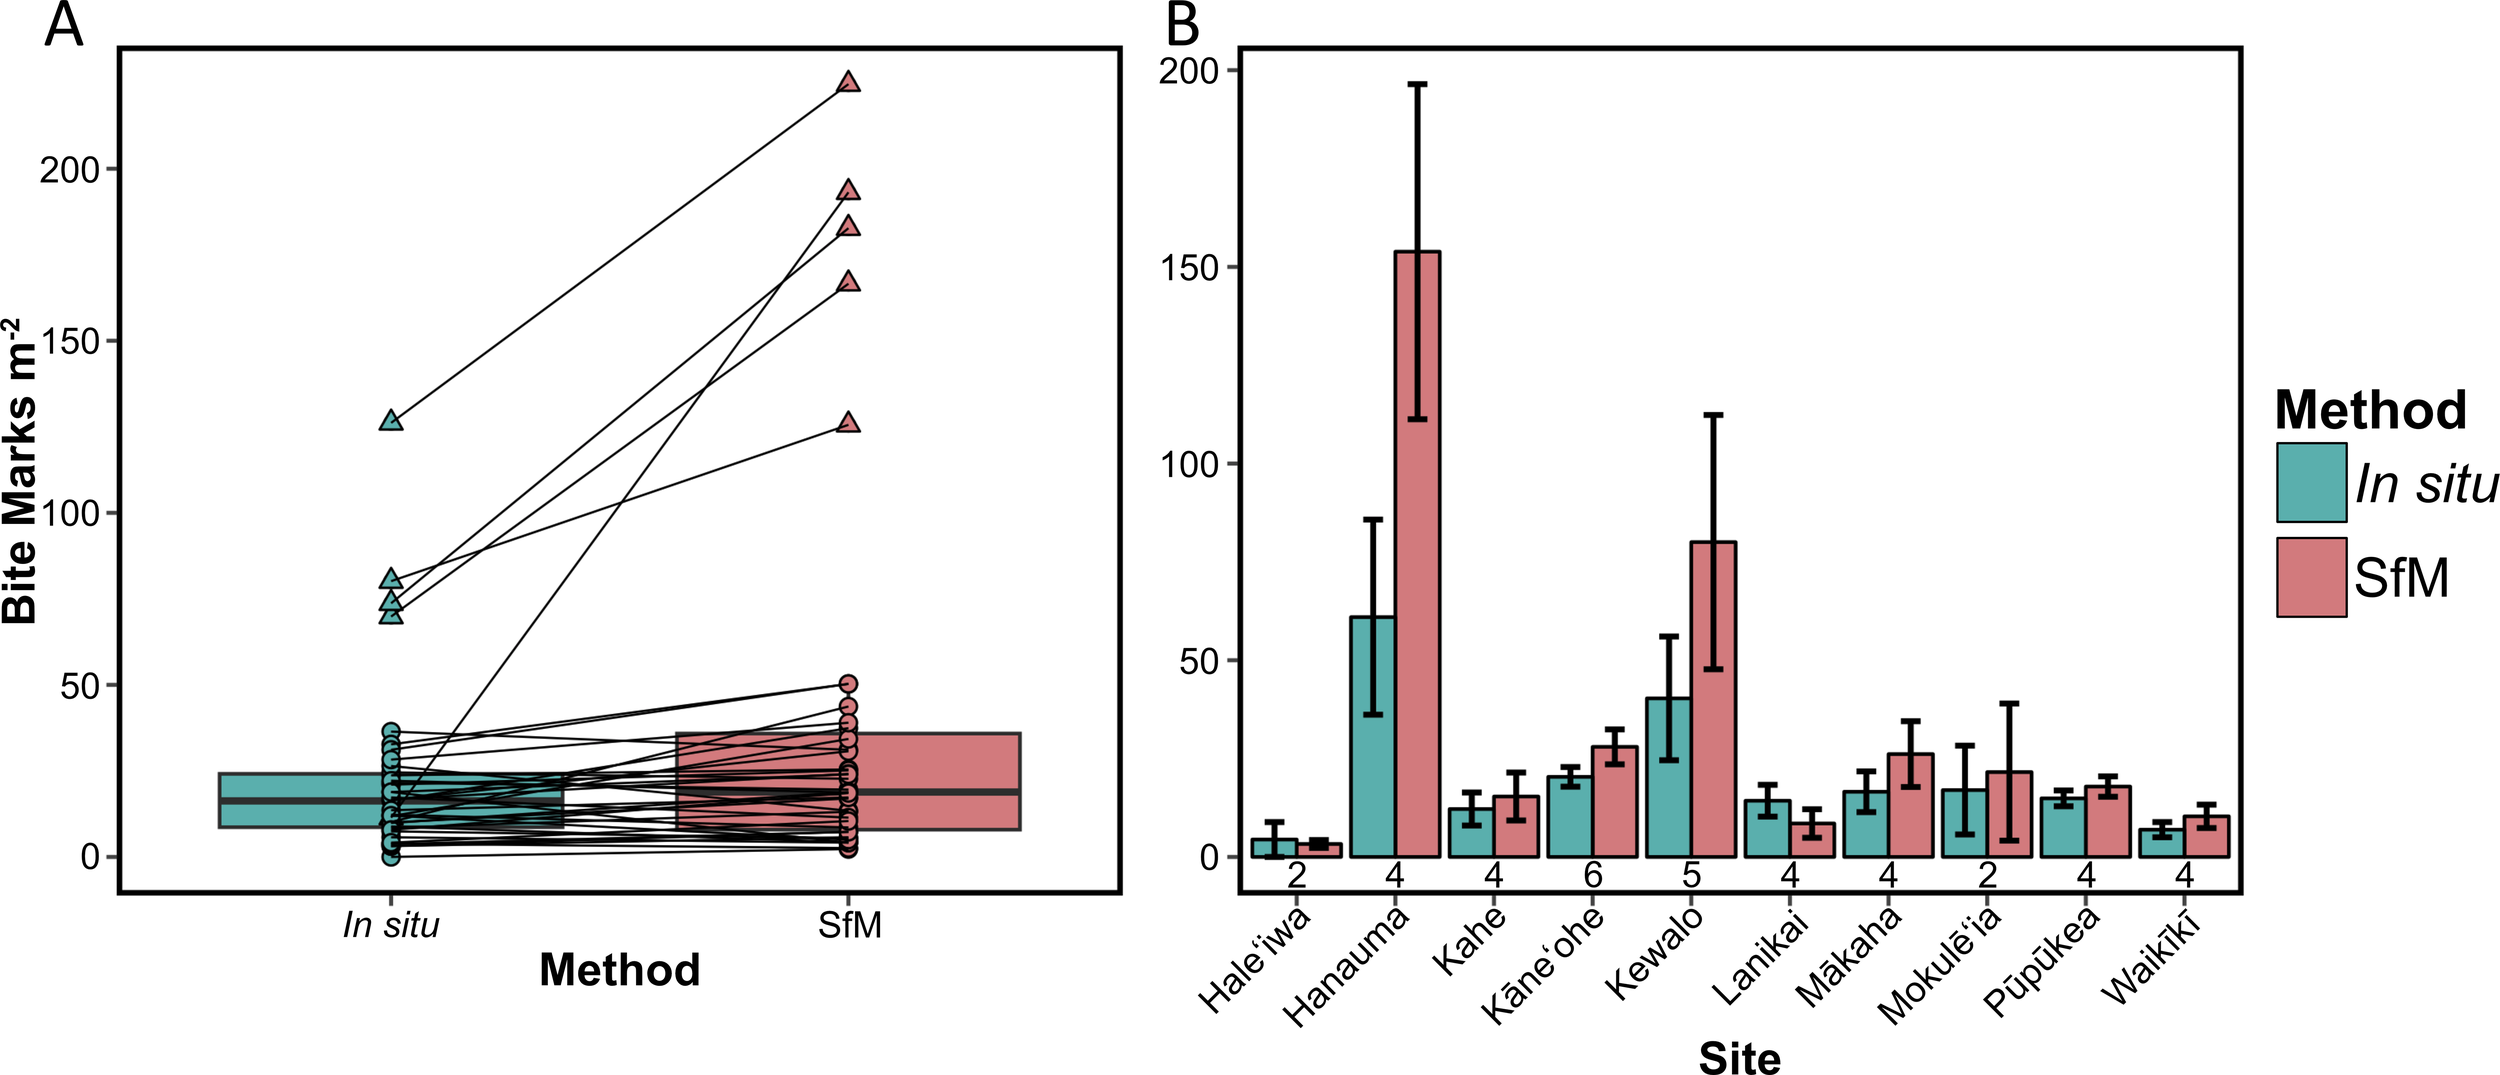
(A) Boxplot illustrating transect-level corallivory density by method; black lines connect transect-level data between methods and triangles denote outliers. (B) Bar graph illustrating bite mark density across sites by method ( ± SE). The numbers below the bars denote the number of transects surveyed at each site (teal = in situ, pink = SfM).
3.2 SfM strengths
We found that the number of bite marks inflicted by fish varied across depth depending on the method used (method × depth, LRT, p < 0.0001; Supplementary Table 2). We detected higher fish corallivory rates through SfM surveys than in situ surveys, with greater differences between methods at deeper sites (Figure 3). Bite counts from SfM surveys increased with depth (slope = 0.04), particularly deeper than 8 m, while counts from in situ surveys decreased with depth (slope = −0.05).
Figure 3
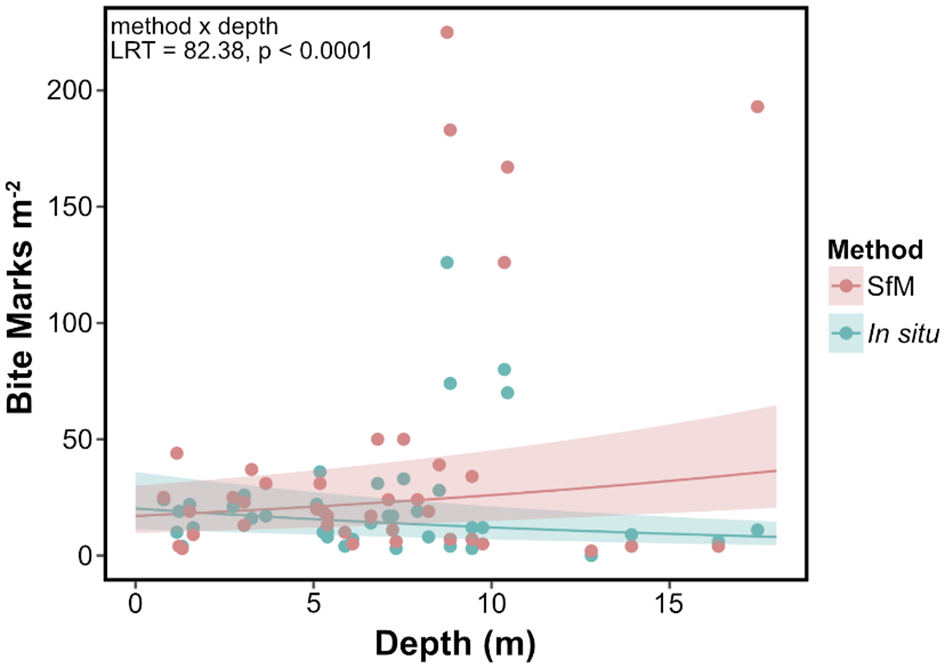
Marginal effects plot depicting corallivory density against depth with predicted values (lines) and 95% confidence intervals (shaded areas) from the GLMM by method (slope ± SE: SfM = 0.04 ± 0.008; in situ = −0.05 ± 0.01; pink = SfM, teal = in situ).
Fish bite mark counts varied with hard coral cover, depending on the method and bite mark category (method × hard coral cover × bite mark category, LRT, p < 0.0001; Supplementary Table 2). Because the three-way interaction was significant, we built GLMMs for each fish bite mark category, which further confirmed that for all predation types, bite mark counts varied with hard coral cover depending on the method used (method × hard coral cover, LRT, p < 0.01; Supplementary Table 2). For all fish bite mark categories, the difference in bite counts between methods was greater at higher percent hard coral cover, with higher bite mark detection through SfM annotations. This interactive effect was particularly evident for blenny and parrotfish bites when coral cover was above 40% (Figure 4).
Figure 4
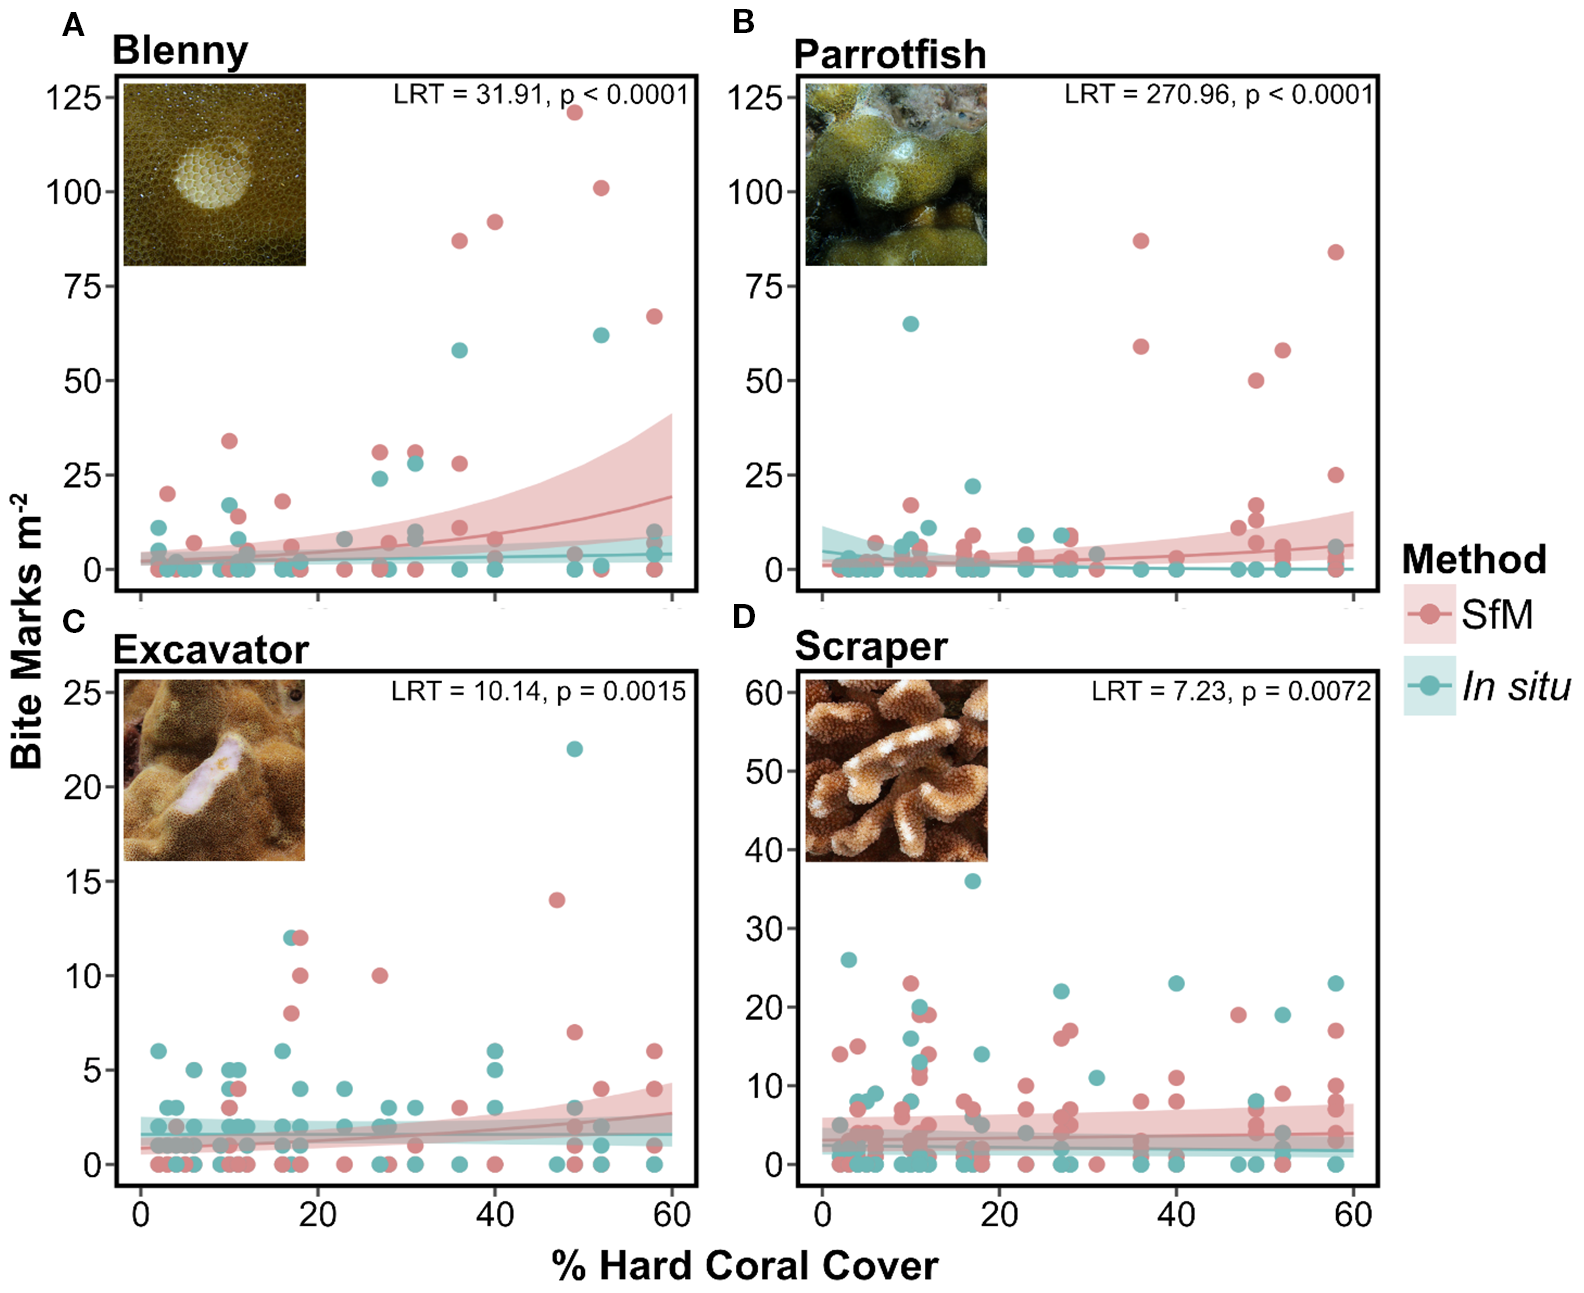
Marginal effects plots depicting corallivory density as a function of hard coral cover for (A) blenny (slope ± SE: SfM = 0.04 ± 0.005; in situ = 0.01 ± 0.006), (B) parrotfish (SfM = 0.03 ± 0.004; in situ = −0.07 ± 0.009), (C) excavator (SfM = 0.02 ± 0.005; in situ = 0.00 ± 0.008), and (D) scraper (SfM = 0.004 ± 0.003; in situ = −0.005 ± 0.005) bite mark categories. Predicted values (lines) and 95% confidence intervals (shaded areas) are shown for GLMMs by method (teal = in situ, pink = SfM). Likelihood ratio test (LRT) statistics and associated p-values for the method × hard coral cover interactions are shown in the top right corner of each panel.
Considering the potential confusion between scraper and excavator bite marks (inflicted by filefish, pufferfish, and, to a lesser extent, parrotfish), we also tested the three-way interaction with scraper and excavator bite marks combined. The three-way interaction as well as the subsequent method × coral cover GLMM for the combined category remained significant (Supplementary Tables 2, 3).
3.3 SfM annotation nuances
Analysis of fish bite marks across coral species/genera revealed the exclusive detection through SfM annotations (i.e., bite marks were not seen on these coral species in situ) of parrotfish bite marks on Pavona duerdeni and P. meandrina, excavator bite marks on Pocillopora grandis, and scraper bite marks on P. duerdeni.
Only for blenny bite marks, the difference between methods varied with coral cover depending on the coral species (hard coral cover × coral species, LRT, p < 0.05; Figure 5 and Supplementary Table 2). However, pairwise comparisons of slopes between coral species were not significant. Between-method differences remained close to zero irrespective of coral cover for Porites compressa and Montipora patula. However, for massive Porites, as hard coral cover increased, more bite marks were counted with SfM than in situ surveys.
Figure 5
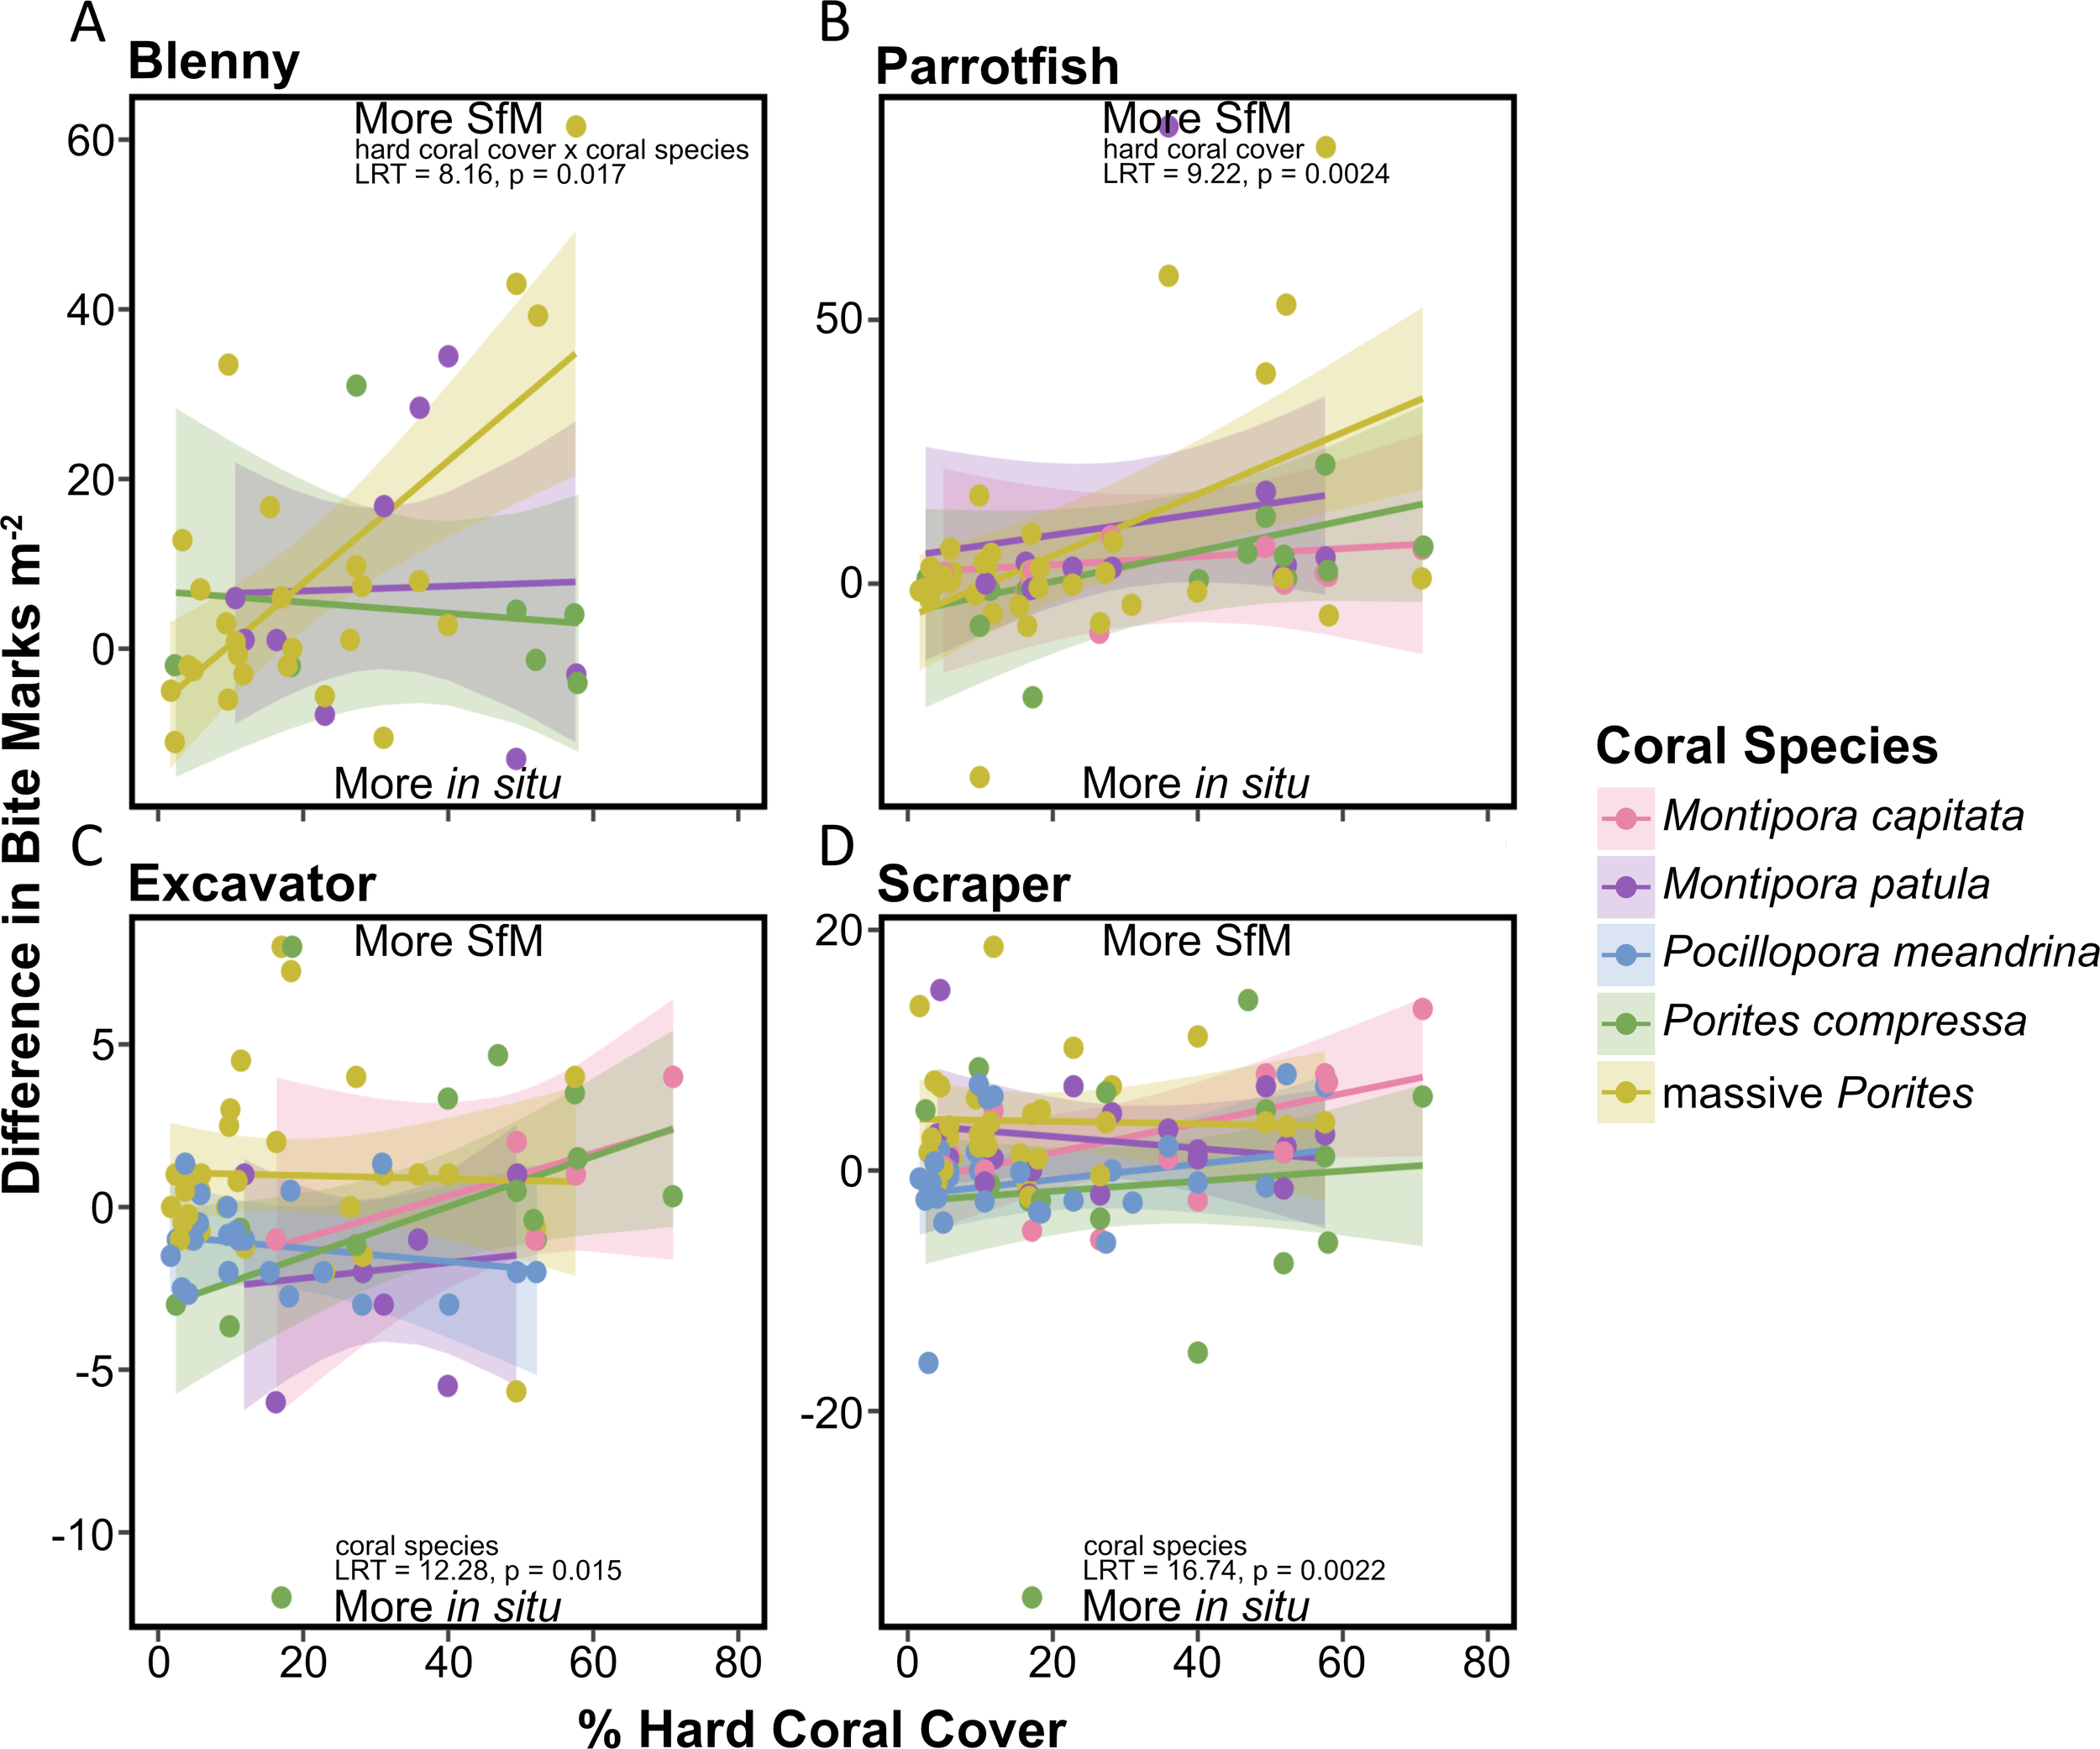
Marginal effects plot showing between-method differences in bite mark counts (m−2) as a function of percent hard coral cover for (A) blenny, (B) parrotfish, (C) excavator, and (D) scraper categories (see Supplementary Table 4 for slope ± SE estimates). Predicted values (lines) with 95% confidence intervals (shaded areas) are derived from LMMs categorized by coral species/genus (pink = Montipora capitata, purple = Montipora patula, blue = Pocillopora meandrina, green = Porites compressa, yellow = massive Porites). Likelihood ratio test (LRT) statistics and associated p-values for significant fixed effects are shown in each panel; LRT results for non-significant fixed effects are provided in Supplementary Table 2. Positive values indicate higher SfM bite mark counts, while negative values indicate higher in situ bite mark counts. Coral species with fewer than four observations in each bite mark category were excluded.
For all other fish bite mark categories (parrotfish, excavator, and scraper), the relationship between hard coral cover and differences between methods did not vary by coral species (hard coral cover × coral species, LRT, p > 0.05; Figure 5 and Supplementary Table 2). For parrotfish, between-method differences varied with coral cover (hard coral cover, LRT, p < 0.01; Supplementary Table 2). As hard coral cover increased, more parrotfish bite marks were counted with SfM than in situ surveys for all coral species. For excavators and scrapers (filefish, pufferfish, and, to a lesser extent, parrotfish), the difference between methods varied across coral species (coral species, LRT, p < 0.05; Supplementary Table 2). Excavator bite marks on massive Porites were more frequently observed in SfM surveys, in contrast to P. meandrina, which had higher predation detection through in situ surveys (Figure 6). Similarly, scraper bite marks on massive Porites were more frequently detected through SfM surveys, while scraper bite marks on P. meandrina and P. compressa were more frequently seen during in situ surveys (Figure 6).
Figure 6
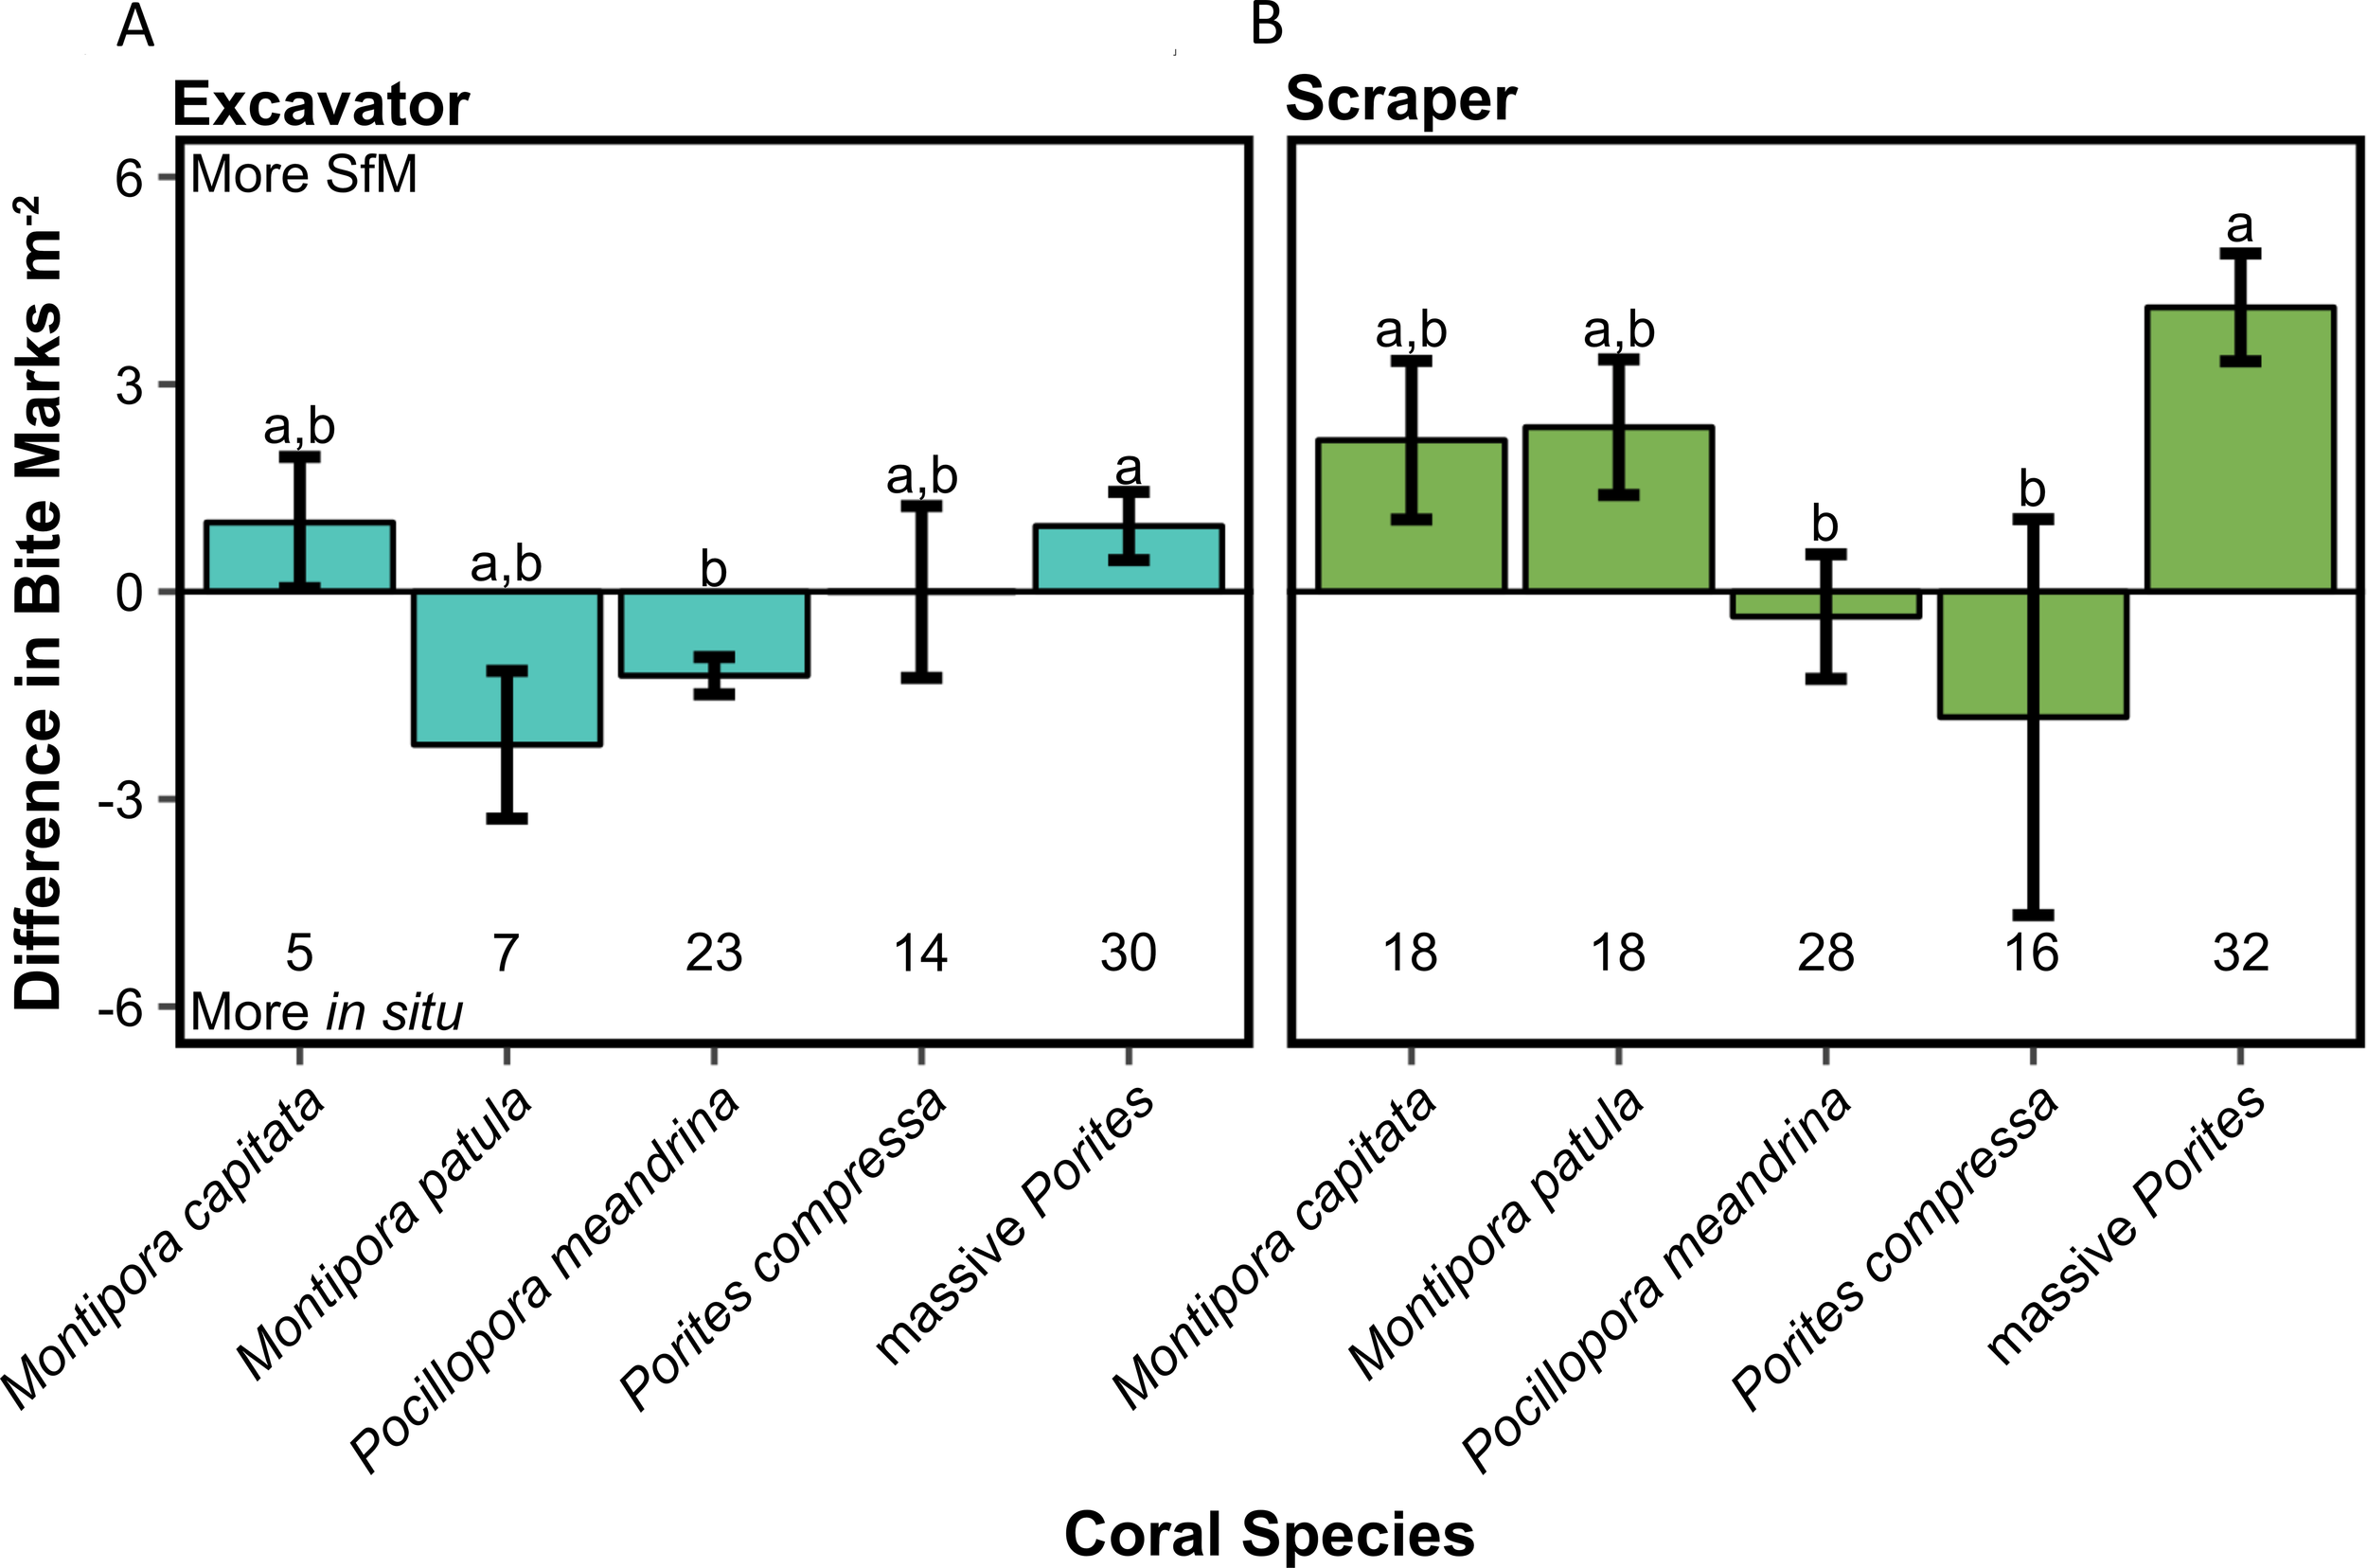
Bar graphs illustrating between-method differences in the number of (A) excavator and (B) scraper bite mark categories by coral species ( ± SE). Positive values indicate more SfM bite mark counts, while negative values indicate more in situ bite mark counts. The numbers below the bars denote the sample size for each coral species/genus. Different letters (a, b) atop the bars indicate a significant difference between groups (post hoc Tukey’s test for pairwise comparisons, p < 0.05).
The difference between methods for combined scraper and excavator bite marks (bite marks from filefish, pufferfish, and to a lesser extent parrotfish) did not vary with hard coral cover nor was there a significant interaction of hard coral cover × coral species (Supplementary Table 2). However, similar to the individual fish bite mark categories, coral species had a significant effect on between-method differences for this combined category (Supplementary Table 2). The trends in differences between methods across coral species were the same as when these bite marks were considered individually.
4 Discussion
We have demonstrated that SfM is a dependable coral reef monitoring tool to accurately measure fish corallivory. Our SfM surveys produced high-resolution images, enabling us to quantify bite mark densities and distinguish between fish bite mark categories. Corallivores affect coral colonies directly [e.g., mortality (Jayewardene et al., 2009)] and indirectly [e.g., reductions in growth and reproduction as wounds heal (Henry and Hart, 2005; Lenihan and Edmunds, 2010; Palacios et al., 2014)], with effects that vary depending on the predator type and coral species (Cameron and Edmunds, 2014). They can also affect corals at multiple scales, from the individual colony (Rotjan, 2007) to the reefscape level (Cox, 1986).
SfM surveys consistently detected more bite marks than in situ surveys, with an average difference of 17.34 bite marks m−2 (55.82 bite marks m−2 when standardized to live coral tissue). Although this difference is modest relative to the wide range of bite marks observed across transects (in situ: 0 to 419.58 bite marks m−2 of live coral tissue; SfM: 15.36 to 567.93 bite marks m−2 of live coral tissue), it highlights how the survey method can influence absolute estimates of corallivory. These estimates are comparable to those reported in another in situ study conducted on O‘ahu, where Jayewardene et al. (2009) found 117 bite marks m−2 of live coral tissue on P. meandrina by barred filefish and 69 bite marks m−2 of live coral tissue on P. compressa by spotted pufferfish. Despite variations between methods, trends in corallivory rates across sites were generally consistent between methods (Figure 2B), indicating that SfM is an effective tool for quantifying corallivory.
The difference in corallivory rates between methods was greater at deeper sites and those with high coral cover, with more bite marks detected with SfM. This bias is likely the result of time and air limitations for scuba divers during in situ surveys. For example, a transect at 17.4 m depth in Hanauma Bay had abundant P. compressa beds characterized by long, slender branches. While the surveyor had air and time constraints underwater, spending approximately 60 min conducting the survey and capturing SfM imagery, annotators dedicated approximately 50 h to reviewing the underlying imagery. This resulted in higher fish bite count estimates with SfM than in situ surveys, with a difference of 30.73 bite marks m−2 along this specific transect.
Differences between methods were also more apparent for blenny and parrotfish bite marks, which can be small and densely concentrated, usually with considerable overlap, which demand more time to survey (Bruckner et al., 2000; Carlson, 2012). The shared characteristics of these bite marks (i.e., small and densely concentrated), coupled with time constraints at deep sites and the additional time required to survey areas with extensive coral cover, resulted in more pronounced differences between methods for these two bite mark categories. For example, at the Kewalo site, overlapping blenny bite marks on M. patula and Montipora capitata formed long, white tracks on coral colonies. Underwater, surveyors more rapidly estimated bite mark numbers based on the size and shape of an individual bite mark, while annotators took their time to discern individual bite marks when looking at imagery. These differences between methods when counting small features align with the findings from Charendoff et al. (2023b), which indicated that SfM annotations led to increased counts of small, cryptic juvenile coral colonies compared to in situ surveys. Overall, SfM enabled us to surpass the air and time limitations inherent with in situ surveys, thereby granting us additional time to locate and distinguish individual bite marks.
Between-method differences in blenny, scraper, and excavator bite mark counts varied by coral species, likely due to species-specific challenges in identifying bite marks. For instance, coral species such as P. meandrina often exhibit pale branch tips. These pale tips can result from delayed Symbiodinium colonization, as documented with Acropora spp (Oliver, 1984), bleaching stress (Jones et al., 2021), or healing from excavator or scraper bite marks (Palacios et al., 2014). Using SfM, identifying small features like missing skeletal parts can be difficult. Therefore, these pale branch tips were excluded from the tally of bite marks when the missing skeletal parts were not discernible. Conversely, during in situ surveys, divers could closely examine coral branches to check for missing skeletal parts, potentially contributing to higher and more accurate counts of corals with pale branch tips.
Similar challenges were encountered when quantifying bite marks on P. compressa, where scraper and excavator bite marks could resemble natural fragmentation. Although these bite marks can be discerned by the presence of tooth marks (Jayewardene et al., 2009), limited underwater time during in situ surveys and pixelation of photos upon zooming in restricted our ability to inspect each branch for the presence of tooth marks, especially in dense thickets. Limitations with both methods led us to exclude potential bite marks when broken branches were in the vicinity. Due to time constraints underwater, our ability to search for broken branches in situ was limited, sometimes leading to an overestimation of scraper bite marks during in situ assessments. Both methods for corallivory monitoring examined here involve inherent trade-offs, highlighted by the nuances related to specific coral species and types of predation.
Understanding the direction and magnitude of methodological bias in detail is crucial given the context-dependent effects of corallivory (Rotjan and Lewis, 2008; Rice et al., 2019). At the colony level, corallivory can cause coral mortality (direct effects; Jayewardene et al., 2009) and decreases in growth and reproduction (indirect effects; Henry and Hart, 2005). Therefore, under- or overestimating bite mark densities could influence our understanding of these direct and indirect processes. Underestimating predation can also mask early signs of stress, which is especially important for vulnerable and ecologically significant taxa. For example, Pocillopora spp. are highly susceptible to other human-related stressors [e.g., bleaching (Winston et al., 2022)] and are one of the few branching corals in Hawai‘i, providing shelter for many fish and invertebrates (Counsell et al., 2018; Brush, 2025).
At the reefscape level, inaccurate bite count estimates can lead to ineffective management, which in turn may compromise ecosystem function. For example, excavators and scrapers contribute to coral reef bioerosion by consuming both coral skeleton and tissue (Bellwood and Choat, 1990; Rotjan and Lewis, 2008). Accurately distinguishing these predation types is essential for reliable estimates of bioerosion, sediment deposition, and reef accretion. Likewise, chronic predation by corallivores such as butterflyfish (Cox, 1986) and parrotfish (Littler et al., 1989) can suppress the growth of faster-growing coral species, altering competitive interactions and shaping community structure. Mischaracterizing not only overall predation rates but also predator types and coral species affected can result in an incomplete understanding of coral reef community dynamics.
From a management and restoration perspective, an incomplete understanding of corallivory can lead to misguided interventions. Overestimating predation, for instance, may prompt unnecessary removal of corallivores, potentially altering coral community structure. Conversely, underestimating predation can result in insufficient action, leading to elevated bioerosion rates, reduced reef growth, and higher coral mortality. In the context of coral restoration, failing to recognize species-specific predation may lead to misplaced priorities, with species facing high predation being overlooked while those under less threat are prioritized. Recognizing and addressing these methodological biases is therefore critical for effective management, which must consider not only overall predation intensity but also predator identity, the coral species affected, and the ways these interactions influence broader ecological functioning.
4.1 Utility and future directions
Similar to other coral reef surveys (Couch et al., 2021), there is no “gold standard” for monitoring corallivory, and each method comes with its unique set of strengths and weaknesses (Table 2). Method selection will be context-specific and depends on the research questions, available resources, and data requirements. The type of question being asked, for example, will determine whether a more detailed or broad-scale approach is needed. Due to time and air limitations during in situ surveys, SfM is a better option for researchers wishing to obtain precise estimates of corallivory. At smaller scales, repeated SfM surveys can track predated colonies over time to assess the effects of corallivory on coral colony survival, growth, and overall health. This application will be particularly beneficial for outplanted coral colonies, which are highly vulnerable to corallivory (Knoester et al., 2023). Furthermore, given our ability to extract multiple metrics from one model (Burns et al., 2015; Bryson et al., 2017; Ferrari et al., 2017; House et al., 2018; Lange and Perry, 2020; Couch et al., 2021; Kornder et al., 2021), SfM is a valuable tool for investigating factors influencing corallivory. Even though we only surveyed discrete quadrats in this study, SfM can be used to quantify corallivory across continuous stretches of reef.
Table 2
| SfM | In situ surveys | |
|---|---|---|
| Metrics collected per survey | Coral cover, rugosity, bleaching, coral disease, corallivory rate, etc. | Corallivory rate |
| Time limitations | None | Limited by depth and air |
| Area surveyed per unit time | Many transects over many reefs | Less transects over fewer reefs |
| Costs | High up-front costs | High long-term costs |
| Corallivory-specific nuances | More likely to miss cryptic marks Harder to differentiate categories Harder to distinguish between pale branch tips and healed marks |
Less likely to miss cryptic marks Easier to differentiate categories Easier to distinguish between pale branch tips and healed marks |
| Reviewing annotations | Can go back in time and can confer with other annotators | Cannot go back in time and difficult to confer with other surveyors |
| Time to data in hand | Weeks to months | Out of water with data in hand |
Comparison of the strengths and weaknesses of SfM and in situ surveys.
Availability of resources is another important consideration when choosing methodology. While SfM entails high initial costs, including camera equipment, computers, and software, in situ surveys have both high up-front and long-term expenses. Furthermore, with in situ surveys, divers are limited to conducting one to a handful of surveys per dive. This means surveyors would need to revisit the same transect multiple times to collect data on various reef metrics. The extra underwater time results in long-term expenses associated with the need for scuba gear, personnel costs, and additional boat time.
Lastly, the urgency with which data are needed is a crucial factor to consider. When rapid estimates of corallivory are required, in situ surveys are more suitable, as the post-processing time for SfM models is lengthy. In this study, most in situ surveys took between 45 and 90 min, and divers walked out of the water with data in hand. Alternatively, a single model took between 4 and 50 h to build and annotate, depending on the quantity and quality of images and the complexity of the site. Ultimately, this study showed that SfM is a valuable tool, but the choice to use it will depend on various factors.
While this study was a first step toward using SfM as a corallivory monitoring tool, these methods are not without improvement. For example, surveyors could take detailed site notes pre- and/or post-image collection, noting the presence of corallivorous fish species, providing annotators with an idea of which bite mark categories they should expect to encounter. Because SfM imagery capture requires only one diver, a second diver could document and photograph regions exhibiting excess corallivory. Given that pale branch tips on Pocillopora spp. could be the result of predation or reduced symbiont density at growth margins, surveyors should closely inspect these colonies underwater to determine whether parts of the skeleton are missing. Similarly, surveyors should closely inspect P. compressa colonies for toothmarks and the surrounding area for broken branches. These notes can serve as a useful guide for annotators to make more informed decisions when determining whether mechanical damage should be considered corallivory or not.
To enhance the utility of this method, we also suggest a dedicated study to evaluate the applicability of these methods to invertebrate corallivory (e.g., Drupella snails, Acanthaster planci, Culcita novaeguineae), which we were unable to assess here due to the low incidence of corallivory by invertebrate predators. Lastly, implementing trained image classifiers such as CoralNet can automate and expedite the annotation process, a method already applied to detect features such as coral disease (Ani Brown Mary and Dharma, 2019). However, a major challenge in detecting fish corallivory is obtaining high-resolution images that clearly show subtle features, such as missing skeletal parts, which are essential for distinguishing between different coral conditions. Human annotators can sometimes overcome these image resolution limitations by using contextual knowledge about the site, such as fish species present or knowledge of other physical damage to the site, something current classifiers are not yet capable of doing.
As threats to coral reefs intensify, efficient monitoring tools that can capture diverse coral reef metrics are critical for timely management interventions. SfM is gaining traction among coral reef managers and restoration practitioners, as new metrics, such as corallivory, are continually derived from a single model. With its ability to deliver scalable, high-resolution data, SfM can become a core component of reef monitoring programs and a powerful tool used for informed decision-making in the face of accelerated coral reef decline.
Statements
Data availability statement
The datasets presented in this study can be found in online repositories. The names of the repository/repositories and accession number(s) can be found at: 10.25921/hqq9-w471.
Author contributions
DED: Conceptualization, Data curation, Formal Analysis, Funding acquisition, Investigation, Methodology, Project administration, Resources, Software, Supervision, Validation, Visualization, Writing – original draft, Writing – review & editing. RL: Investigation, Methodology, Data curation, Formal Analysis, Software, Visualization, Writing – review & editing. CC: Methodology, Resources, Software, Formal Analysis, Visualization, Writing – review & editing. JC: Methodology, Software, Writing – review & editing. TK: Methodology, Resources, Software, Supervision, Conceptualization, Formal Analysis, Funding acquisition, Visualization, Writing – review & editing.
Funding
The author(s) declare financial support was received for the research and/or publication of this article. This study was funded by the NOAA Coral Reef Conservation Program (Project No. 31349). This material is also based upon work supported by the National Science Foundation Graduate Research Fellowship Program and INTERN program under Grant No. 1842402. Additional funding was provided by the Hsiao Endowment provided to Mark Hixon.
Acknowledgments
We want to thank Mark Hixon (PhD advisor to DED), Jake Ferguson, Megan Donahue, Elizabeth Madin, and John Casken for their constructive comments on the manuscript; Kylie Bebe, Erik Brush, Richard Chen, Chloè-Rose Colombero, Ryan Jones, Amy Moran, and Elena Turner for field assistance; Dr. Roger Pfeffer and Sarah Masciangelo for logistical support; and Rhonda Suka and Andrew Gray for method development and equipment selection guidance.
Conflict of interest
The authors declare that the research was conducted in the absence of any commercial or financial relationships that could be construed as a potential conflict of interest.
Generative AI statement
The author(s) declare that no Generative AI was used in the creation of this manuscript.
Any alternative text (alt text) provided alongside figures in this article has been generated by Frontiers with the support of artificial intelligence and reasonable efforts have been made to ensure accuracy, including review by the authors wherever possible. If you identify any issues, please contact us.
Publisher’s note
All claims expressed in this article are solely those of the authors and do not necessarily represent those of their affiliated organizations, or those of the publisher, the editors and the reviewers. Any product that may be evaluated in this article, or claim that may be made by its manufacturer, is not guaranteed or endorsed by the publisher.
Author disclaimer
Any opinions, findings, and conclusions or recommendations expressed in this material are those of the authors and do not necessarily reflect the views of the National Science Foundation.
Supplementary material
The Supplementary Material for this article can be found online at: https://www.frontiersin.org/articles/10.3389/fmars.2025.1577091/full#supplementary-material
References
1
Ani Brown Mary N. Dharma D. (2019). A novel framework for real-time diseased coral reef image classification. Multimed Tools Appl.78, 11387–11425. doi: 10.1007/s11042-018-6673-2
2
Baumann J. H. Zhao L. Z. Stier A. C. Bruno J. F. (2022). Remoteness does not enhance coral reef resilience. Glob Change Biol.28, 417–428. doi: 10.1111/gcb.15904
3
Bellwood D. R. Choat H. (1990). A functional analysis of grazing in parrotfishes (family Scaridae): the ecological implications. Environ. Biol. Fish28, 189–214. doi: 10.1007/BF00751035
4
Bonaldo R. M. Krajewski J. P. Bellwood D. R. (2011). Relative impact of parrotfish grazing scars on massive Porites corals at Lizard Island, Great Barrier Reef. Mar. Ecol. Prog. Ser.423, 223–233. doi: 10.3354/meps08946
5
Bonesso J. L. Leggat W. Ainsworth T. D. (2017). Exposure to elevated sea-surface temperatures below the bleaching threshold impairs coral recovery and regeneration following injury. PeerJ5, e3719. doi: 10.7717/peerj.3719
6
Bruckner A. W. Bruckner R. J. Sollins P. (2000). Parrotfish predation on live coral: “spot biting” and “focused biting. Coral Reefs19, 50–50. doi: 10.1007/s003380050225
7
Brush E. G. (2025). Assemblage structure of fishes and invertebrates inhabiting the coral Pocillopora grandis in Hawai‘i. Coral Reefs44, 85–98. doi: 10.1007/s00338-024-02588-4
8
Bryson M. Ferrari R. Figueira W. Pizarro O. Madin J. Williams S. et al . (2017). Characterization of measurement errors using structure-from-motion and photogrammetry to measure marine habitat structural complexity. Ecol. Evol.7, 5669–5681. doi: 10.1002/ece3.3127
9
Burns J. H. R. Delparte D. Gates R. D. Takabayashi M. (2015). Integrating structure-from-motion photogrammetry with geospatial software as a novel technique for quantifying 3D ecological characteristics of coral reefs. PeerJ3, e1077. doi: 10.7717/peerj.1077
10
Cameron C. Edmunds P. (2014). Effects of simulated fish predation on small colonies of massive Porites spp. and Pocillopora meandrina. Mar. Ecol. Prog. Ser.508, 139–148. doi: 10.3354/meps10862
11
Carlson B. A. (1992). The life history and reproductive success of the coral blenny, Exallias brevis (Kner 1968) (Honolulu, HI: University of Hawaii).
12
Carlson B. (2012). Feeding activity by the blenny Exallias brevis causes multifocal bleaching in corals: Comment on Zvuloni et al. (2011). Mar. Ecol. Prog. Ser.463, 297–299. doi: 10.3354/meps10002
13
Charendoff J. A. Edwards C. B. Pedersen N. E. Petrovic V. Zgliczynski B. Sandin S. A. et al . (2023a). Variability in composition of parrotfish bite scars across space and over time on a central Pacific atoll. Coral Reefs42, 905–918. doi: 10.1007/s00338-023-02392-6
14
Charendoff J. A. Couch C. Oliver T. Lamirand M. Amir C. Basden I. et al . (2023b). Comparing coral demographic surveys from in situ observations and structure-from-motion photogrammetry on high diversity reefs shows low methodological bias but highlights persistent areas of concern. (U.S. Dept. of Commerce, NOAA Technical Memorandum NOAA-TM-NMFS-PIFSC-153), 52. doi: 10.25923/8r7f-t404
15
Couch C. S. Oliver T. A. Suka R. Lamirand M. Asbury M. Amir C. et al . (2021). Comparing coral colony surveys from in-water observations and structure-from-motion imagery shows low methodological bias. Front. Mar. Sci.8. doi: 10.3389/fmars.2021.647943
16
Counsell C. W. W. Donahue M. J. Edwards K. F. Franklin E. C. Hixon M. A. (2018). Variation in coral-associated cryptofaunal communities across spatial scales and environmental gradients. Coral Reefs37, 827–840. doi: 10.1007/s00338-018-1709-7
17
Cox E. F. (1986). The effects of a selective corallivore on growth rates and competition for space between two species of Hawaiian corals. J. Exp. Mar. Bio Eco101, 161–174. doi: 10.1016/0022-0981(86)90047-X
18
D’Angelo C. Wiedenmann J. (2014). Impacts of nutrient enrichment on coral reefs: new perspectives and implications for coastal management and reef survival. Env. Sust7, 82–93. doi: 10.1016/j.cosust.2013.11.029
19
Erftemeijer P. L. A. Riegl B. Hoeksema B. W. Todd P. A. (2012). Environmental impacts of dredging and other sediment disturbances on corals: A review. Mar. pollut. Bull.64, 1737–1765. doi: 10.1016/j.marpolbul.2012.05.008
20
Escontrela Dieguez D. Lee R. Kindinger T. Couch C. S. Charendoff J. (2023). Quantifying corallivory from structure-from-motion models (United States: Pacific Islands Fisheries Science Center (U.S). Available online at: https://doi.org/10.25923/c64k-gh75.
21
Ferrari R. Figueira W. F. Pratchett M. S. Boube T. Adam A. Kobelkowsky-Vidrio T. et al . (2017). 3D photogrammetry quantifies growth and external erosion of individual coral colonies and skeletons. Sci. Rep.7, 16737. doi: 10.1038/s41598-017-16408-z
22
Grupstra C. G. B. Rabbitt K. M. Howe-Kerr L. I. Correa A. M. S. (2021). Fish predation on corals promotes the dispersal of coral symbionts. Anim. Microbiome3, 25. doi: 10.1186/s42523-021-00086-4
23
Henry L.-A. Hart M. (2005). Regeneration from injury and resource allocation in sponges and corals – a review. Internat Rev. Hydro90, 125–158. doi: 10.1002/iroh.200410759
24
Hoegh-Guldberg O. Bruno J. F. (2010). The impact of climate change on the world’s marine ecosystems. Science328, 1523–1528. doi: 10.1126/science.1189930
25
Hourigan T. F. (1987). The behavioral ecology of three species of butterflyfishes (family Chaetodontidae) (Honolulu, HI: University of Hawaii).
26
House J. E. Brambilla V. Bidaut L. M. Christie A. P. Pizarro O. Madin J. S. et al . (2018). Moving to 3D: relationships between coral planar area, surface area and volume. PeerJ6, e4280. doi: 10.7717/peerj.4280
27
Hughes T. P. Kerry J. T. Baird A. H. Connolly S. R. Dietzel A. Eakin C. M. et al . (2018). Global warming transforms coral reef assemblages. Nature556, 492–496. doi: 10.1038/s41586-018-0041-2
28
Jayewardene D. Donahue M. J. Birkeland C. (2009). Effects of frequent fish predation on corals in Hawai‘i. Coral Reefs28, 499–506. doi: 10.1007/s00338-009-0475-y
29
Jones R. N. Brush E. G. Dilley E. R. Hixon M. A. (2021). Autumn coral bleaching in Hawai’i. Mar. Ecol. Prog. Ser.675, 199–205. doi: 10.3354/meps13837
30
Knoester E. G. Klerks N. Vroege-Kolkman S. B. Murk A. J. Sande S. O. Osinga R. (2023). Coral predation and implications for restoration of Kenyan reefs: The effects of site selection, coral species and fisheries management. J. Exp. Mar. Biol. Ecol.566, 151924. doi: 10.1016/j.jembe.2023.151924
31
Kornder N. A. Cappelletto J. Mueller B. Zalm M. J. L. Martinez S. J. Vermeij M. J. A. et al . (2021). Implications of 2D versus 3D surveys to measure the abundance and composition of benthic coral reef communities. Coral Reefs40, 1137–1153. doi: 10.1007/s00338-021-02118-6
32
Koval G. Rivas N. D’Alessandro M. Hesley D. Santos R. Lirman D. (2020). Fish predation hinders the success of coral restoration efforts using fragmented massive corals. PeerJ8, e9978. doi: 10.7717/peerj.9978
33
Lange I. D. Perry C. T. (2020). A quick, easy and non-invasive method to quantify coral growth rates using photogrammetry and 3D model comparisons. Methods Ecol. Evol.11, 714–726. doi: 10.1111/2041-210X.13388
34
Lenihan H. Edmunds P. (2010). Response of Pocillopora verrucosa to corallivory varies with environmental conditions. Mar. Ecol. Prog. Ser.409, 51–63. doi: 10.3354/meps08595
35
Lenth R. V. (2016). Least-squares means: the R package lsmeans. J. Stat. Soft.69, 1–33. doi: 10.18637/jss.v069.i01
36
Littler M. M. Taylor P. R. Littler D. S. (1989). Complex interactions in the control of coral zonation on a Caribbean reef flat. Oecologia80, 331–340. doi: 10.1007/BF00379034
37
Miller M. W. Hay M. E. (1998). Effects of fish predation and seaweed competition on the survival and growth of corals. Oecologia113, 231–238. doi: 10.1007/s004420050373
38
Mumby P. J. Steneck R. S. Adjeroud M. Arnold S. N. (2016). High resilience masks underlying sensitivity to algal phase shifts of Pacific coral reefs. Oikos125, 644–655. doi: 10.1111/oik.02673
39
Oliver J. K. (1984). Intra-colony variation in the growth of Acropora formosa: extension rates and skeletal structure of white (zooxanthellae-free) and brown-tipped branches. Coral Reefs3, 139–147. doi: 10.1007/BF00301958
40
Palacios M. M. Muñoz C. G. Zapata F. A. (2014). Fish corallivory on a pocilloporid reef and experimental coral responses to predation. Coral Reefs33, 625–636. doi: 10.1007/s00338-014-1173-y
41
R Core Team . (2023). R: A language and environment for statistical computing. (Vienna, Austria: R Foundation for Statistical Computing,). Available online at: https://www.R-project.org/.
42
Remmers T. Grech A. Roelfsema C. Gordon S. Lechene M. Ferrari R. (2024). Close-range underwater photogrammetry for coral reef ecology: a systematic literature review. Coral Reefs43, 35–52. doi: 10.1007/s00338-023-02445-w
43
Rempel H. S. Bodwin K. N. Ruttenberg B. I. (2020). Impacts of parrotfish predation on a major reef-building coral: quantifying healing rates and thresholds of coral recovery. Coral Reefs39, 1441–1452. doi: 10.1007/s00338-020-01977-9
44
Renegar D. Blackwelder P. L. Alison M . (2008). “Coral ultrastructural response to elevated pCO2 and nutrients during tissue repair and regeneration.” in Proceedings of the 11th International Coral Reef Symposium, Ft. Lauderdale, Florida, 7–11 July. 2008. 1320–1324.
45
Renzi J. J. Shaver E. C. Burkepile D. E. Silliman B. R. (2022). The role of predators in coral disease dynamics. Coral Reefs41, 405–422. doi: 10.1007/s00338-022-02219-w
46
Rice M. M. Ezzat L. Burkepile D. E. (2019). Corallivory in the anthropocene: interactive effects of anthropogenic stressors and corallivory on coral reefs. Front. Mar. Sci.5. doi: 10.3389/fmars.2018.00525nicole
47
Rice M. M. Maher R. L. Correa A. M. S. Moeller H. V. Lemoine N. P. Shantz A. A. et al . (2020). Macroborer presence on corals increases with nutrient input and promotes parrotfish bioerosion. Coral Reefs39, 409–418. doi: 10.1007/s00338-020-01904-y
48
Rotjan R. D. (2007). The patterns, causes, and consequences of parrotfish corallivory in Belize. (Doctoral dissertation). (Boston, MA: Tufts University). Available online at: https://www.proquest.com/dissertations-theses/patterns-causes-consequences-parrotfish/docview/304784622/se-2?accountid=147035.
49
Rotjan R. D. Lewis S. M. (2008). Impact of coral predators on tropical reefs. Mar. Ecol. Prog. Ser.367, 73–91. doi: 10.3354/meps07531
50
Smith K. M. Pharo D. M. Shea C. P. Reckenbeil B. A. Maxwell K. E. Sharp C. (2021). Recovery from finfish predation on newly outplanted boulder coral colonies on three reefs in the Florida Keys. B Mar. Sci.97, 337–350. doi: 10.5343/bms.2020.0056
51
Suka R. Asbury M. Gray A. E. Winston M. Oliver T. Thomas A. et al . (2019). Processing photomosaic imagery of coral reefs using structure-from-motion standard operating procedures (United States: Pacific Islands Fisheries Science Center (U.S). Available online at: https://doi.org/10.25923/h2q8-jv47.
52
Sutherland K. P. Porter J. W. Turner J. W. Thomas B. J. Looney E. E. Luna T. P. et al . (2010). Human sewage identified as likely source of white pox disease of the threatened Caribbean elkhorn coral, Acropora palmata. Environ. Microbiol.12, 1122–1131. doi: 10.1111/j.1462-2920.2010.02152.x
53
Tricas T. C. Boyle K. S. (2014). Acoustic behaviors in Hawaiian coral reef fish communities. Mar. Ecol. Prog. Ser.511, 1–16. doi: 10.3354/meps10930
54
Winston W. Couch C. Huntingon B. Vargas-Ángel B . (2020). Ecosystem Sciences Divisionstandard operating procedures: data collection for rapid ecological assessment benthic surveys, 2019 update. NOAA Tech. Memo. NMFS-PIFSC-96, 56.
55
Winston M. Oliver T. Couch C. Donovan M. K. Asner G. P. Conklin E. et al . (2022). Coral taxonomy and local stressors drive bleaching prevalence across the Hawaiian Archipelago in 2019. PloS One17, e0269068. doi: 10.1371/journal.pone.0269068
Summary
Keywords
corallivory, coral predation, coral reef, photogrammetry, structure-from-motion, benthic monitoring, Hawai‘i
Citation
Escontrela Dieguez D, Lee RM, Couch CS, Charendoff JA and Kindinger TL (2025) Whose bite? Evaluating the use of structure-from-motion for monitoring fish corallivory. Front. Mar. Sci. 12:1577091. doi: 10.3389/fmars.2025.1577091
Received
15 February 2025
Accepted
12 September 2025
Published
15 October 2025
Volume
12 - 2025
Edited by
Jesús Ernesto Arias González, Research Center for Advanced Studies, Mexico
Reviewed by
Diana Morales-de-Anda, Research Center for Advanced Studies, Mexico; Ana Lilia Molina Hernandez, National Autonomous University of Mexico, Mexico
Updates
Copyright
© 2025 Escontrela Dieguez, Lee, Couch, Charendoff and Kindinger.
This is an open-access article distributed under the terms of the Creative Commons Attribution License (CC BY). The use, distribution or reproduction in other forums is permitted, provided the original author(s) and the copyright owner(s) are credited and that the original publication in this journal is cited, in accordance with accepted academic practice. No use, distribution or reproduction is permitted which does not comply with these terms.
*Correspondence: Daniela Escontrela Dieguez, d.escontreladieguez@seattleaquarium.org
Disclaimer
All claims expressed in this article are solely those of the authors and do not necessarily represent those of their affiliated organizations, or those of the publisher, the editors and the reviewers. Any product that may be evaluated in this article or claim that may be made by its manufacturer is not guaranteed or endorsed by the publisher.