 Xuzhen Zhang1,2,3,4
 Hongxian Chu1,2Meiling Yin1,2Yadong Liu1,2Peng Chen1,2Qiangqiang Zhang1,2Xuejian Dai5
 Linghao Kong1,2,3*
- 1Yantai Center of Coastal Zone Geological Survey, China Geological Survey, Yantai, China
- 2Observation and Research Station of Seawater Intrusion and Soil Salinization, Laizhou Bay, Ministry of Natural Resources, Qingdao, Shandong, China
- 3Ministry of Natural Resources Observation and Research Station of Land-Sea Interaction Field in the Yellow River Estuary, Yantai, China
- 4School of Oceanology, China University of Geosciences, Wuhan, China
- 5Research Center of Applied Geology of China Geological Survey, Chengdu, China
Marine ecosystems are the most important sinks for microplastics (MPs) from inland sources, and the input of large quantities of MPs into the oceans poses a serious threat to marine organisms and ecosystems. However, the characteristics of MPs contamination and its risk in semi-enclosed seas remain poorly understood. In this research, we conducted a comprehensive analysis and evaluation of the distribution patterns and ecological risks related to MPs found in the surface sediments of Laizhou Bay. We gathered surface sediments from various locations within the bay, which were then processed and analyzed to assess the MP content. According to the results, MPs in Laizhou Bay were widely distributed, with abundances ranging from 36–2125.5 items/g d.w. at different points, with an average of 534.7 items/g d.w. The MP forms were mainly fragments (61.91%) and particles (37.45%), with polyamide (PA) (32.73%), polyethylene terephthalate (PET) (12.42%), and polyurethane (PU) (10.81%) being the most dominant polymer types. MPs mainly originated from marine aquaculture, fishing, and domestic plastic waste; the contribution from marine activities was higher than that from land-based inputs, and their migration and dispersion were mainly affected by the hydrodynamics of water body exchange and intra-bay circulation. According to the pollution load index, the risk index of MPs in Laizhou Bay ranged from 1 to 7.68, indicating a low pollution level. However, the polymer risk index indicated that microplastic pollution in Laizhou Bay was at high risk, and PU and polyvinyl chloride were identified as the primary high-risk sources. This study systematically analyzed the composition, distribution, and multiple source characteristics of MPs in Laizhou Bay. The ecological risks associated with these MPs were assessed through the analysis of pollution load and polymer risk indices. This research offers a valuable dataset and a scientific foundation for understanding and managing MP pollution in semi-enclosed marine environments.
1 Introduction
Microplastics, usually defined as plastic fragments or particles with a diameter smaller than 5 mm (Pervez et al., 2023; Jiang et al., 2020), can be categorized as primary and secondary microplastics (Zhang et al., 2020). Microbeads, among others, are primary microplastics (Kye et al., 2023), whereas secondary microplastics originate from the decomposition of large-sized plastics through complex and long-term chemical, biological, and physical processes, and can even decompose into nanoplastics (< 1 μm) (Tong et al., 2023; Han et al., 2020; Seeley et al., 2020). Microplastics do not easily degrade due to their small volume and high resistance to environmental processes (Zhang et al., 2020; Lv et al., 2022). Riverine and atmospheric transport (Sun et al., 2022; Pan et al., 2021), oceanic currents (Ikenoue et al., 2023), and human activities, such as aquaculture and ship navigation (Yao et al., 2021), contribute to the accumulation of seafloor sediments, which have become a significant microplastic sink (Nash et al., 2023). Owing to the ongoing continuous increase in plastic production and consumption worldwide (Harris et al., 2021), an estimated 4.8 to 12.7 million tons of plastic waste enter the oceans from coastal regions (Liu et al., 2021). Microplastics have been detected within the marine waters of most coastal countries (Eo et al., 2023; Rakib et al., 2022; Curren and Yew Leong, 2023; Higgins and Turner, 2023), and even in polar regions (Perfetti-Bolaño et al., 2022). Consequently, microplastic pollution in marine ecosystems has become a significant global issue (Sun et al., 2021).
As microplastics and organisms at lower trophic levels in marine ecosystems (Alam et al., 2019; Hou et al., 2024), such as plankton and microalgae (Walkinshaw et al., 2020), are similar in size, organisms with high nutrient levels through the food chain, including fish (Felline et al., 2022) and benthic organisms, such as sea cucumbers and oysters (Mohsen et al., 2019; Jahan et al., 2019), are at risk of accidental microplastics Ingestion. These particles may then enter the food chain. Research has demonstrated that polyethylene (PE) microplastics induce intestinal damage in fish, potentially impeding growth and resulting in severe mortality (Xu et al., 2023). Moreover, microplastics have been detected in human tissue (Horvatits, 2022); research shows that microplastics with a diameter of ≤10 μm can enter the human body anywhere (Barceló et al., 2023). Polyvinyl chloride (PVC), polypropylene (PP), and polyethylene terephthalate (PET) are the main polymers in microplastics (Zhu et al., 2024; Winiarska et al., 2024; Roslan et al., 2024; Guan et al., 2023). Research indicates that microplastics found in human tissues can lead to overall tissue damage (Bilbao-Kareaga et al., 2023), exacerbate the risk of arterial clogging (Marfella et al., 2024). Furthermore, studies have demonstrated that microplastics can accelerate premature aging in humans (Huang et al., 2024). Additionally, microplastics have been observed to form complexes with heavy metals, thereby functioning as metal transporters (Ashton et al., 2010), which further exacerbates pollution in the marine environment. Semi-enclosed seas are extensively utilized for mariculture (Xu et al., 2020), thereby increasing the likelihood of microplastics adversely impacting humans and the environment via the food chain. The hydrodynamic conditions in semi-enclosed seas, influenced by rivers, tides, and winds (Ulses et al., 2005; Mazoyer et al., 2020), affect water circulation and exchange. Rivers serve as a conduit for microplastics to enter the ocean from land (Hou et al., 2024), leading to substantial deposits in bays due to the hydrodynamic conditions present in semi-enclosed seas (Shi et al., 2022). This phenomenon plays a pivotal role in shaping the distribution patterns of microplastic abundance within bays (Liu et al., 2021). Consequently, there is a growing imperative to undertake comprehensive studies investigating the distribution and characterizing the nature of microplastics present within the sediments of semi-enclosed seas.
Numerous researchers have documented the distribution and contamination of microplastics in the surface sediment of semi-enclosed seas. Eo et al. (2023) investigated the distribution of microplastics in Dungyang Bay and Zhenhai Bay, Korea, and concluded that the distribution of microplastic contamination was influenced by anthropogenic activity. Ye et al. (2023) conducted a study on the presence of microplastics in the sediments of Liaodong Bay in the Bohai Sea by employing the pollution load index (PLI). Their findings indicated that the average abundance of microplastics varied between 32.33 to 49.91 items/kg d.w., with all sampling sites being categorized as hazardous. A more detailed analysis and study of microplastics in seawater, sediments, and fish from coastal rivers (Shi et al., 2022) to Laizhou Bay (Teng et al., 2020) was conducted, and the results confirmed that the riverine inputs were a primary source of microplastics within the Laizhou Bay watershed–estuary–shore system. Moreover, the patterns of spatial distribution of microplastics in sediments differ from those found in surface seawater. Additionally, microplastics exhibit substantial variations in shape, size, and polymer type across surface seawater, sediments, and biota. While previous studies on semi-enclosed seas are abundant, they have not evaluated the risk of microplastic contamination of surface sediments in Laizhou Bay. Furthermore, these studies may produce inconsistent results regarding the types, sources, and abundance of microplastics due to the different locations of sampling sites.
Laizhou Bay is a paradigmatic example of a semi-enclosed bay, distinguished by its abundance of rivers along the coast and a protracted water exchange cycle. Laizhou Bay was selected as the sampling area for this study, and the distribution characteristics and pollution status of microplastics were investigated using the PLI and polymer index methods. This study had three main objectives: to (1) examine the distribution characteristics of microplastics found in the surface sediments of Laizhou Bay; (2) investigate the source of microplastics present in the sediments of Laizhou Bay; and (3) perform a risk assessment regarding microplastic pollution. The results of this research should provide a scientific basis for managing natural resources and governing the ecology of the Laizhou Bay waters.
2 Materials and methods
2.1 Study area
Laizhou Bay, situated in the northern region of the Shandong Peninsula, China (37° 10´–37° 50´ N; 119° 00´–120° 15´ E), is a representative semi-enclosed bay bordered by land on three sides (Zhang et al., 2022). The bay’s primary economic activities include the development of the petrochemical industry, ship transportation, and aquaculture (Li X, et al., 2023). The region is abundant in fishery resources and possesses a distinctive natural environment. The region is characterized by numerous rivers that empty into the sea along the coast of Laizhou Bay, including the Jiao Lai, Ze, Yu, Yellow, Xiaoqing, and Bailang Rivers, which exhibit a high degree of interaction with seawater (Zhang et al., 2012).
2.2 Sediment sampling
To study the spatial distribution and source integrity of microplastics in the sea area, we systematically and uniformly set up sampling points. Thirty surface sediment samples were collected from the Laizhou Bay area in May 2023. The sampling points were equally spaced and are shown in Figure 1. During sample collection, a grab sampler was used. The depth of the collected sediment samples exceeded 20 cm, and the water depth ranged from 9 to 15.5 m. The collected sediment samples were separated on site, and only the 0–5-cm surface layer of the sediment samples was selected. The original weight of the sample for microplastic testing was at least 500 g (wet weight). To prevent the samples from being contaminated by other plastic products during the division process, the surface layer samples were separated using a wooden spatula and placed in tin foil. The samples were then stored at –15°C. All samples were sent for testing immediately after collection.
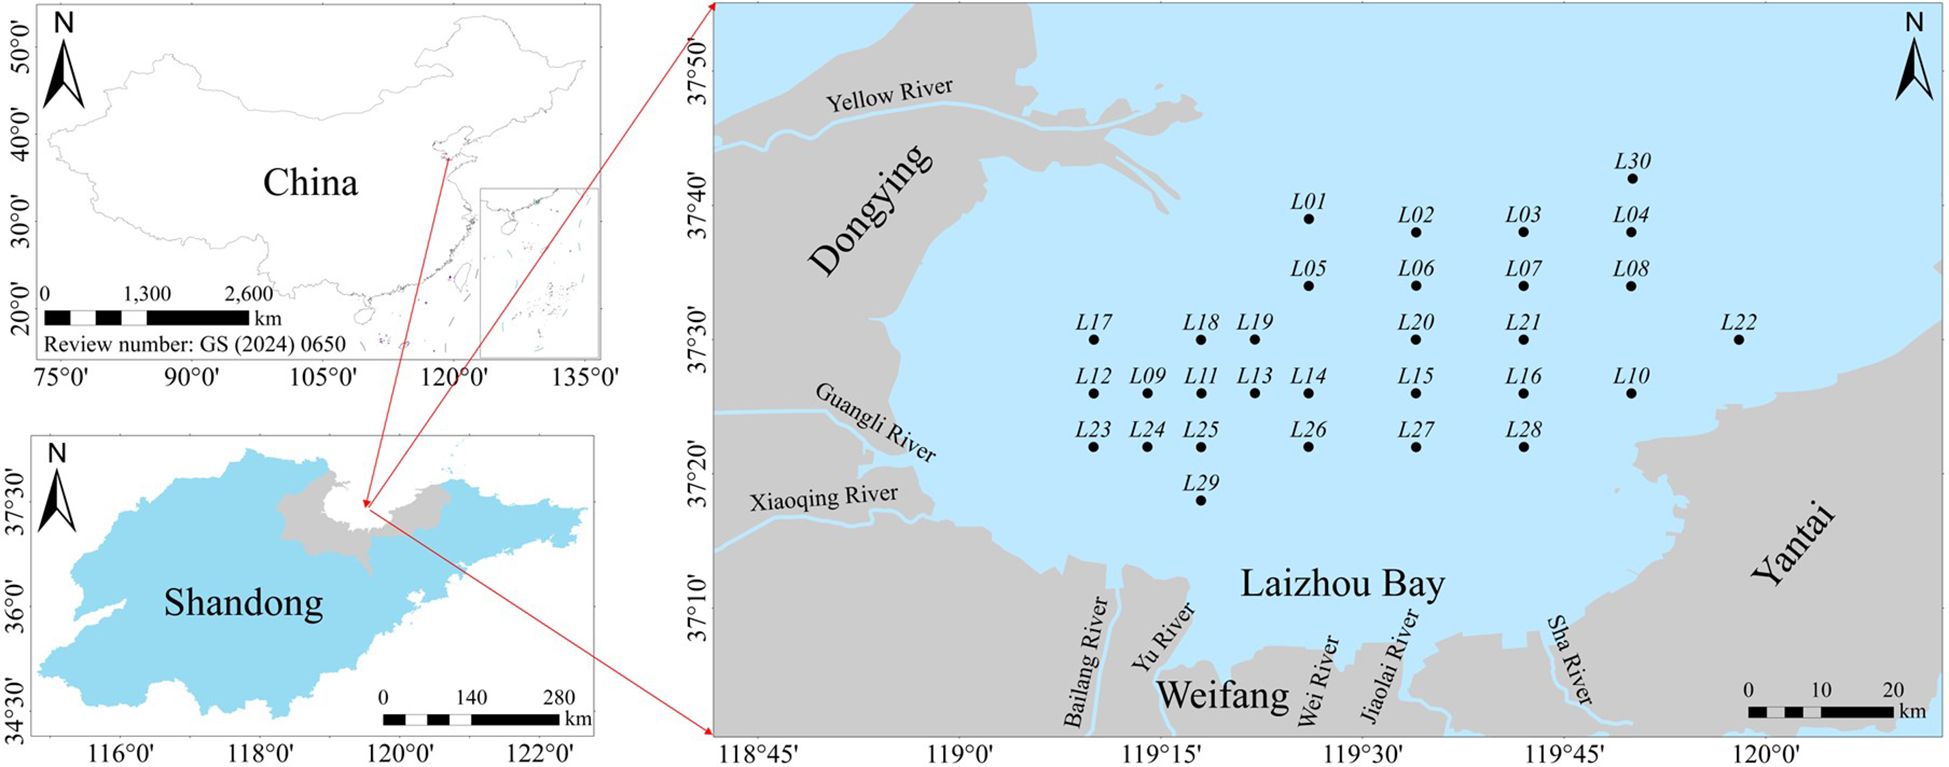
Figure 1. Surface sediment sampling locations in Laizhou Bay.
2.3 Separation and characterization of microplastics
A continuous flow separation flotation device for microplastics, developed by the Institute of Coastal Zone Research, Chinese Academy of Sciences (Jia et al., 2022), was utilized to separate the microplastics. After drying and crushing the surface sediment sample, 50 g was weighed and placed in a 5-L beaker for microplastic detection. Ten liters of saturated sodium chloride solution (NaCl, density up to 1.2 g/cm3) and sodium iodide solution (NaI, density up to 1.8 g/cm3) solutions were meticulously prepared and filtered through a nitrate fiber filter membrane (Whatman AE 98, Germany) with a pore size of 5 μm. The filtrate was then stored in a sealed 30-L container. The separation process involved two flotation passes. Initially, the filtered saturated NaCl solution was transferred to a 5-L sample cup at a flow rate of 1.0 L/min until the solution neared 2 L. The solution was thoroughly stirred and mixed for 10 min. Subsequently, the mixture was filtered using a stainless-steel sieve with a pore size of 15 μm (1000 mesh), effectively capturing the microplastics and concluding the first flotation stage. The aforementioned steps were then repeated, this time using 1.5 L of saturated sodium iodide solution on the sieve, to complete the second flotation. The filter membrane was subjected to biodegradation with 40 mL of hydrogen peroxide (30%), and the membrane was subsequently rinsed with distilled water to remove the degraded membrane. The remaining liquid was then filtered, and vacuum filtration was conducted using a polytetrafluoroethylene (PTEE) membrane with a pore size of 0.22 μm. The membrane was then rinsed with ultrapure water several times and subsequently placed in a 50-mL flask. Thereafter, 20 mL of anhydrous ethanol solution (99%) was added to the membrane, and the mouth of the flask was sealed with aluminum foil. The membrane was then filtered and rinsed with ultrapure water. The pretreatment was then finalized, and the waste liquid was poured into a specialized waste liquid bucket. To verify the feasibility and reliability of the continuous-flow separation flotation device for separating microplastics from the tidal beach samples, a microplastic recovery rate test was conducted. The mass of the two pre-prepared microplastics, polyethylene and polypropylene, was 0.4573 g. The final mass of the recovered microplastics was approximately 0.4445 g, and the recovery rate was approximately 97%. The pretreated flask was subsequently placed into an ultrasonic oscillator, operating at a temperature below 35°C and 40 Hz for a duration of 1 h. The surface of the filter membrane was then rinsed with ethanol, and ultrasonication was continued for an additional 0.5 h. After ultrasonication, the beaker was transferred to a thermostatic water bath (90°C) and concentrated to approximately 1.0 mL for online testing.
Microplastics were detected using an 8700 LDIR laser infrared imager for automated analytical testing of particles in the size range of 10–1000 μm (Jia et al., 2022). This device can rapidly achieve qualitative and quantitative analysis of microplastics, automatically obtain statistical data information, achieve single-wavelength rapid chemical imaging, automatically locate all microplastic particles, automatically conduct full-spectrum scanning and retrieval of microplastic particles, and automatically present statistical data on chemical composition, size, estimated mass, etc., of microplastics using a built-in spectral library of 41 of the most common polymers (over 420 reference spectra), with a match accuracy of over 65% of the results for qualitative analysis. Natural sources [cellulose, silicates, coal, chitin, and natural polyamides (PAs)] were eliminated from the results for qualitative and quantitative analysis.
2.4 Quality control
The laboratory personnel wore dust-free laboratory coats and nitrile gloves to prevent contamination by polyester microplastics. During the experiment, the doors and windows were closed and the containers containing the samples were sealed to prevent the indoor environment or fibers and other impurities in clothes from affecting the experimental results. The solutions utilized for the experiments (including NaCl and NaI solutions) were filtered using 5-µm filter membranes, and the experimental equipment was predominantly composed of glass and stainless steel. All vessels, measuring cylinders, beakers, forceps, and other instruments were thoroughly washed three times with ultrapure water prior to use. During the experiment, a blank control group and a comparison of sediment samples were established. The control test revealed an average of 31 interfering microplastics detected in the anhydrous ethanol, NaCl solution, and NaI solution utilized. The final abundance was calculated by subtracting the background value of 31. Sediment samples for comparison were obtained from the same site, and secondary measurements were conducted with a confidence level exceeding 90% for the final results.
2.5 Microplastics risk assessment methodology
The term “ecological risk” is defined as the probability of an impact of external factors on ecosystems, which could potentially compromise their integrity and security. In this study, the microplastics concentration was utilized as a surrogate for pollutants to assess the ecological risk of surface sediments in Laizhou Bay. The pollution load index (PLI) and polymer risk index (PRI) methods were employed to evaluate this risk.
(1). PLI is frequently employed to evaluate ecological risks in both aquatic and terrestrial environments (Tomlinson et al., 1980). The formula used for its assessment is outlined as follows (Xu et al., 2018):
In this context, Ci is the microplastic concentration at each sampling location, whereas Coi is the background concentration of microplastics in the sediment prior to the expansion of the plastic industry. The contamination coefficient is indicated by CFi. Due to the absence of a standardized method for evaluating the microplastic contamination risk and the lack of established background values for microplastic contamination in Laizhou Bay sediments, the lowest observed abundance of microplastics was adopted as the background value for this research (Rakib et al., 2022). The n-root of nPLI for all sites was obtained for the PLIzone value of surface sediments in Laizhou Bay.
(2). The PRI reflects the risk of microplastics (Pan et al., 2021; Geng et al., 2023; Wang et al., 2024a) and is determined using the following equation:
In this context, Pi is the proportion of each polymer within the sample, whereas Sn is the hazard score associated with a specific polymer. The scores for various polymers are as follows: polyethylene (PE) 11, polyurethane (PU) 7384, polypropylene (PP) 1, polyvinyl chloride (PVC) 10,551, polystyrene (PS) 30, polyethylene terephthalate (PET) 4, and polyamide (PA) 47 (Xu et al., 2018; Lithner et al., 2011; Peng et al., 2024). Additionally, PRIi is the polymer risk index for microplastics in the samples, whereas PRIzone is the polymer risk index for microplastics found in the sediments of the study area.
The classification of microplastic pollution risk management is supported by the pollution risk level criteria shown in Table 1 (Xu et al., 2018; Ye et al., 2023).
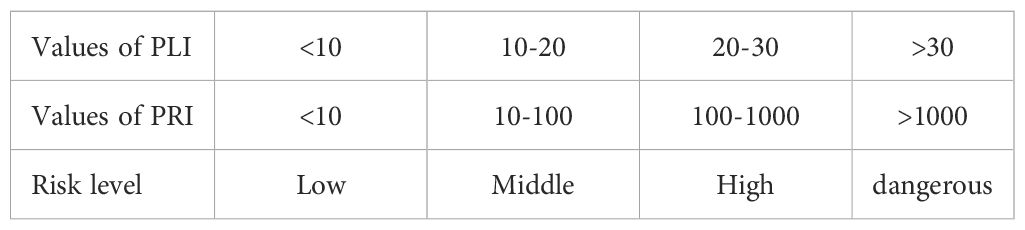
Table 1. Risk level criteria for microplastics based on the evaluation of PLI and PRI.
2.6 Data analysis and processing
The ArcGIS 10.8 software was used to generate maps depicting the locations of sampling stations as well as the distribution of microplastic abundance and associated risks. For statistical analysis and data visualization, Origin 2022 and Office 2016 were employed. A one-sample t-test was conducted using SPSS to assess the correlation between microplastic abundance in the sediment, with the significance level set at p < 0.05. The abundance of microplastics was quantified based on the number of items per gram of dry weight in the sediment, expressed in units of items/g d.w.
3 Result and discussion
3.1 Abundance and morphological characterization of microplastics
A total of 30 sampling sites of surface sediments were analyzed for microplastic contamination, with findings indicating the presence of microplastics at every location (Figure 2A). The concentration of microplastics in the sediment samples varied from 36 to 2125 items/g d.w., yielding an average of 534.7 items/g d.w. The most common abundance values fell within the range of 500–1000 items/g d.w., representing approximately 37% of the overall total. The one-sample t-test indicated that the abundance values of microplastics at different points in the surface sediments of Laizhou Bay were significantly different (P< 0.05). The different levels of abundance of microplastics were related to the marine circulation of Laizhou Bay. The hydrodynamic structure was relatively complex. The western area of the sea area in the summer exhibited clockwise circulation, whereas in the eastern area, it exhibited counterclockwise circulation, and in the middle area, it exhibited a northeast-oriented outflow (Sun et al., 2021). This is similar to the spatial distribution of microplastics in Laizhou Bay. Thus, circulation plays an important role in the distribution of microplastics in the sea area. Moreover, from the perspective of the distribution of microplastics, the abundance was relatively high in the direction of the extension of the Guangli, Xiaoqing, and Bailang Rivers toward the sea area, indicating concentration in this area. This is because aquaculture areas in the sea are mostly distributed in the extension areas of estuaries. Substances that are easily transported via rivers can further provide nutrients for aquaculture areas. However, this also leads to the further enrichment of microplastics in the extension areas of estuaries. The lowest abundance value was observed at point L11 (3.6 items/g d.w.), and the highest abundance value was recorded in the sea area of Yantai Laizhou Gripe Mouth (point L10; 2125.5 items/g d.w.). The findings demonstrate a substantial increase in magnitude relative to the microplastic abundance values (461.6 items/kg d.w.) observed in Laizhou Bay in 2017 (Teng et al., 2020). This discrepancy is primarily due to the absence of a standardized detection process for microplastics on a global scale (Ye et al., 2023); the discrepancy in detection methodologies may have led to substantial variations in the magnitude of the abundance. In this study, we employed laser infrared detection (Jia et al., 2022), which achieves substantially better microplastic detection than conventional methods, such as Raman (Chen et al., 2020) and Fourier transform infrared (Renner et al., 2017) spectroscopy. However, the disadvantage is that the color of the microplastic itself cannot be accurately identified. Furthermore, an increase in microplastic abundance was observed following years of sedimentation. The microplastics in the waters of Laizhou Bay exhibited higher concentrations compared with those found in Yueqing Bay (6.13 items/kg d.w.) and Zhenhai Bay (Korea, 2474 items/kg d.w.), which are also semi-enclosed seas. This phenomenon can be attributed to the presence of a greater number of rivers along the coast of Laizhou Bay, which is an active area for aquaculture and fishing. Consequently, the influx of microplastics into the bay was significantly higher compared with that in Yueqing Bay and Jinhae (South Korea) due to river inputs and marine activities.
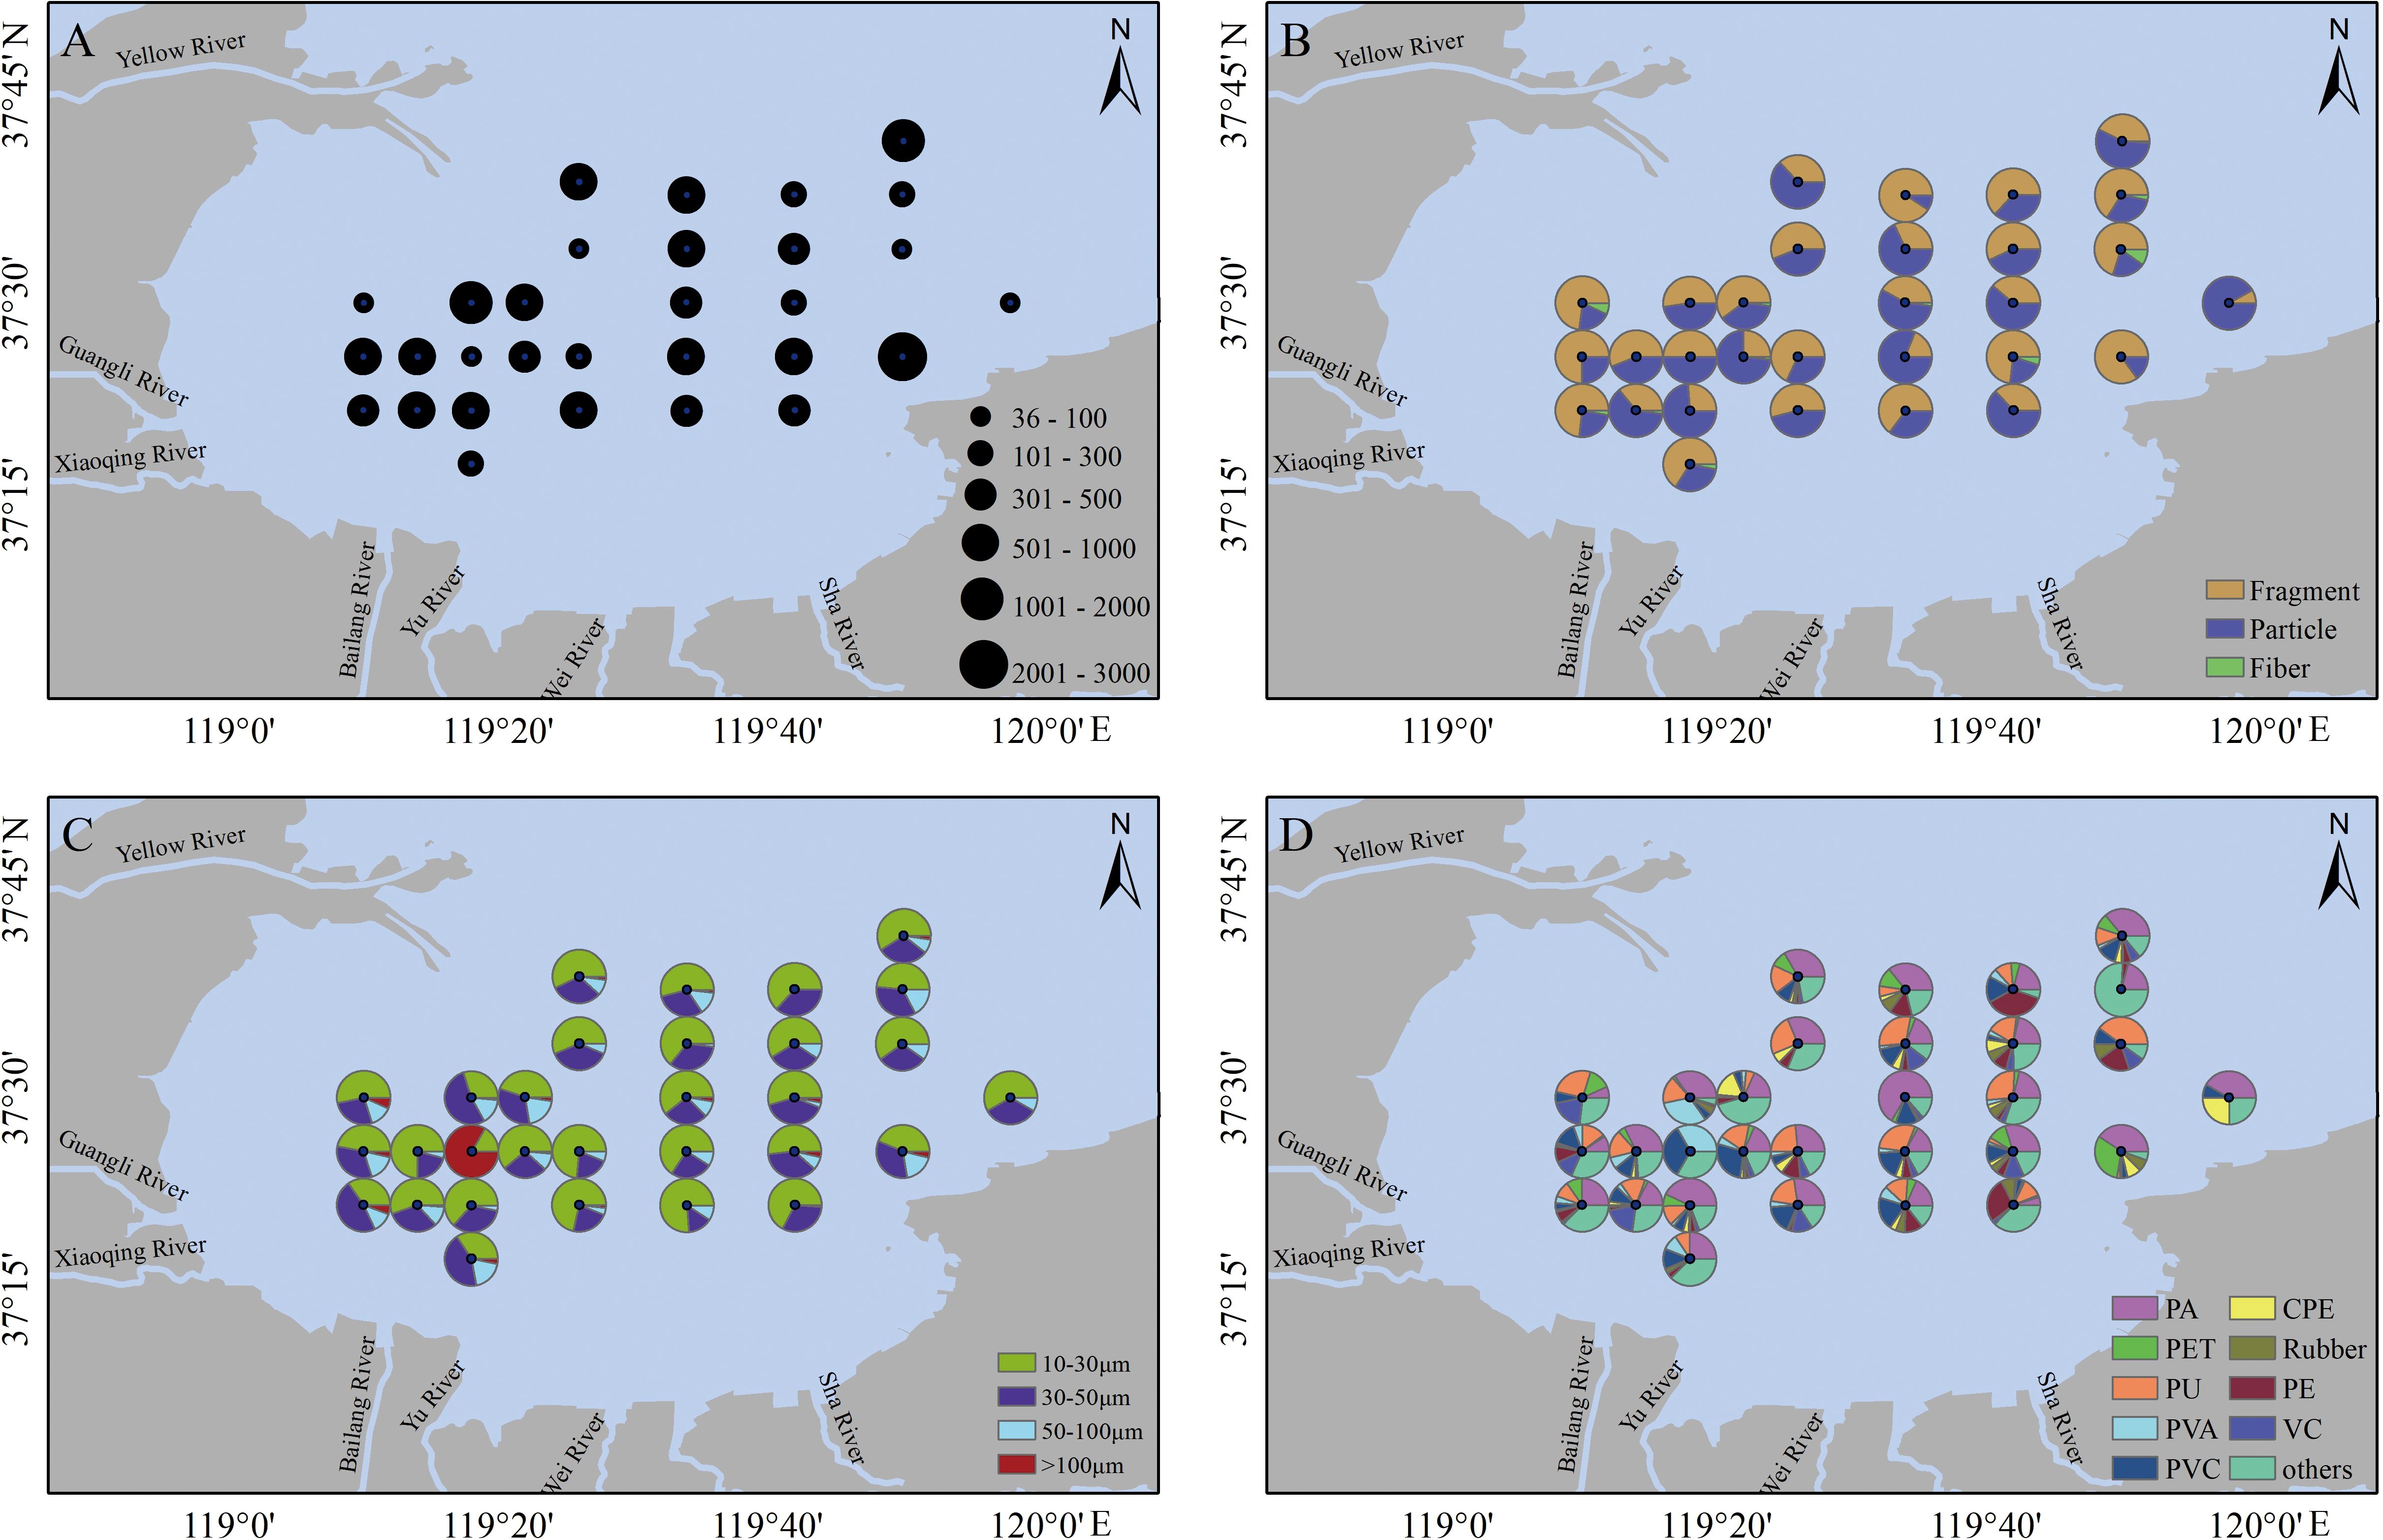
Figure 2. Distribution and proportion of microplastics based on their abundance (A), shape (B), particle size (C), and compositional distribution (D) at various points in the waters of Laizhou Bay.
The analysis of microplastics in Laizhou Bay sediments revealed three predominant shapes: fragments, granules, and fibers. Among these, fragments were the most common, constituting 61.91% of the total microplastic count, whereas granules accounted for 37.45%. Fibrous microplastics were detected at 15 stations, constituting the least abundant category, with a percentage of 0.64%. Fragmented microplastics exhibited the widest distribution, as shown in Figures 2B and 3A, which is because fragmented microplastics are more buoyant than particulate microplastics and are more easily transported to a wider location by oceanic currents (Wang et al., 2018).

Figure 3. Box line diagram of microplastic distribution in Laizhou Bay based on shape (A), particle size (B), and composition (C).
The particle size of microplastics in the surface sediment was divided into four categories: 10–30, 30–50, 50–100, and >100 μm. Granules smaller than 50 μm were found to be predominant, accounting for 84.00%, as shown in Figures 2C and 3B. Most of the stations exhibited a preponderance of microplastics in the 10–30-μm size category, accounting for 47% of the total. The remaining size categories accounted for a comparatively lower proportion. The proportion of particles within the 30–50 μm size range constituted 37% of the total, whereas those in the 50–100 μm size range represented 14%. Particles exceeding 100 μm accounted for only 2%. These findings indicate a consistent decline in the proportion of particles with increasing size.
3.2 Composition, distribution, and sources of microplastics
The 8700 LDIR laser infrared imager analysis of the samples showed that the surface sediment samples from Laizhou bay were rich in microplastic polymer types, with a total of 4550 microplastics detected, containing 27 microplastic types, indicating extensive microplastic contamination in Laizhou Bay. Among the microplastics detected, PA (32.73%), PET (12.42%), and PU (10.81%) were the three main types of polymers, accounting for more than 55.96% of the total, as shown in Figure 3C. The infrared spectra of these three types of microplastics are shown in Figure 4. The proportions of PVA and PVC were 9.16% and 6.92%, respectively, not exceeding 10%. The contents of the other 22 types of microplastics ranged from 0.04–4.53%, which were less than 5%, and they accounted for 27.96% in total, including polyethylene chlorinated, rubber, polyethylene, vinyl chloride, methyle cellulose, polypropylene, polyether, polyacrylamide, polylactic acid, high density polyethylene, polymethylmethacrylate, polycarbonate, polyimide, polytetrafluoroethylene, polybutadiene, acrylonitrile butadiene, cellulose acetate, polycaprolactone, polysulfones, polystyrene, ethylene vinyl acetate, and polyacetal.
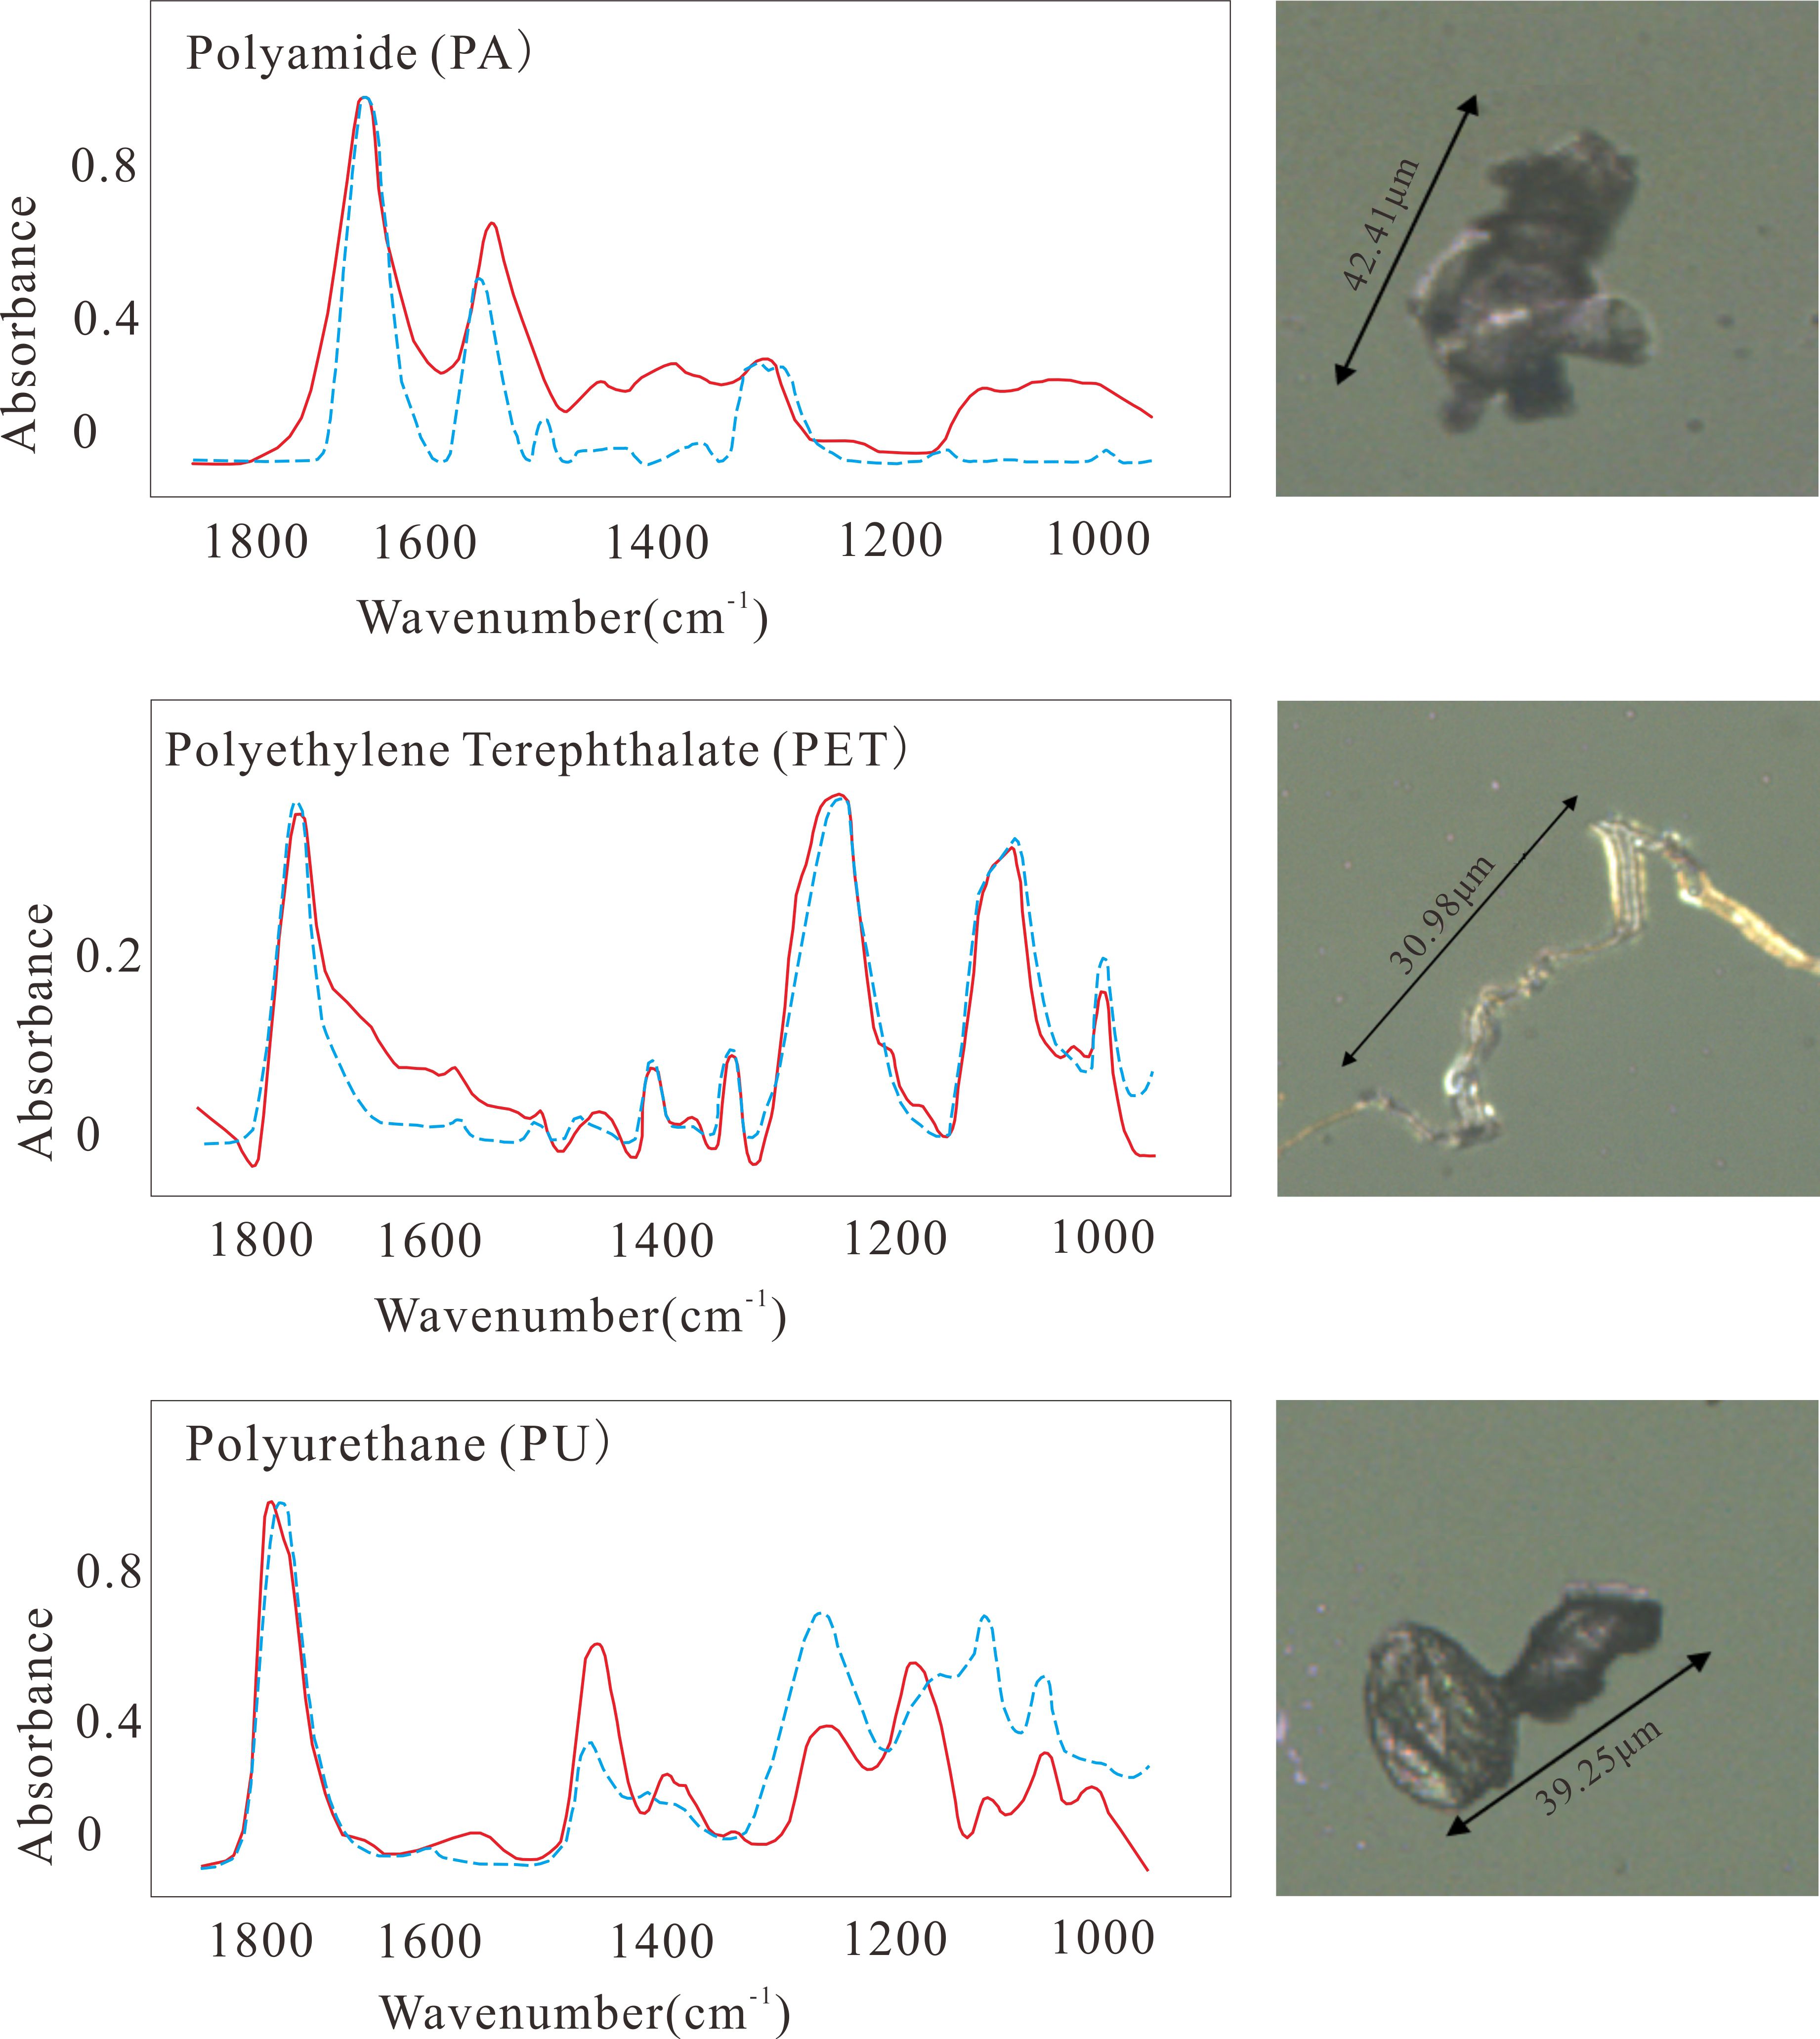
Figure 4. Typical infrared spectra of microplastics (blue and red lines indicate standard and detected spectra, respectively).
The spatial distribution of different types of microplastics in Laizhou Bay varied significantly, as illustrated in Figure 2D. Despite having the highest concentration, PA was present in smaller quantities in the extended sea area where it met the river, primarily concentrated in the central region. Polyethylene terephthalate was predominantly concentrated at point L10, with a proportion of 79% and accounting for 61% of the total. PU exhibited a more homogeneous distribution, excluding station L18. The number of microplastics detected at each station varied. At L10, 23 types of microplastics were identified, with PA accounting for 569 of the total, accounting for 40.16%. Notably, two types of microplastics, polybutadiene and poly(ethylene terephthalate), were exclusively present at this station. In contrast, only four types of microplastics were detected at L11, excluding PA, PET, and PU. The analysis revealed that three primary types of microplastics (PA, PET, and PU) were present at different concentrations across the remaining sites. Laizhou Bay, characterized as a semi-enclosed body of water with limited exchange capacity, facilitates the dispersion of microplastics influenced by circulation dynamics (Pan et al., 2021). The spatial distribution of microplastics is also related to their density (Wan et al., 2024). For example, the densities of PA and PET are 1.24 and 1.38 g/cm³, respectively. These are high-density polymers, and they are more likely to deposit in the marine environment (Chubarenko et al., 2016; Wu et al., 2019). This explains why microplastics are so widely distributed in surface sediments. Other microplastics exhibit lower density, which facilitates their transportation to the seafloor and subsequent deposition under the influence of circulation. Additionally, the transportation of microplastics by marine organisms should not be overlooked. Cultured oysters have been observed to possess a notable accumulation capacity for microplastics with small particle sizes. However, large-scale culture could modify microplastic sedimentation and transport processes (Li et al., 2024).
Owing to their small size, microplastics pose a significant challenge in terms of visual identification, thereby hindering the ability to trace their provenance. Consequently, the composition of microplastics has emerged as a pivotal factor in determining their source (Xu et al., 2019). Laizhou Bay, a semi-enclosed sea area, is characterized by its extensive marine culture area, spanning 41,157 hm², and hosts regular marine activities, including ship navigation and fishing. As shown in Figure 5, with the exception of vinyl chloride, different types of microplastics show strong spatial correlations, indicating that microplastics have a greater consistency in their sources of spatial inputs such as land or sea. The most prevalent microplastic detected in the surface sediments of Laizhou Bay was PA, which is predominantly derived from fishing nets and other anthropogenic sources (Bošković et al., 2022). PA is extensively utilized in various production activities, such as mariculture, which generates a substantial quantity of fragments or particles through abrasion (Li Y, et al., 2023). This finding is consistent with the results of this study, which elucidates the pervasive distribution of PA in the Laizhou Bay region. PET was the second most abundant microplastic, primarily originating from textile fibers, beverage bottles, and fishing nets (Tajwar et al., 2022; Osorio et al., 2021). Its prevalence is well-documented, and studies have demonstrated that as much as 6 million fragments or fibers can be released from 5 kg of material (Sait et al., 2021). PU is the third most abundant microplastic, primarily utilized as a surface coating on ships. It is dislodged by the impact of water currents during navigation or fishing, subsequently accumulating in the sediment (Teng et al., 2020). However, another study reported the absence of PU (Sait et al., 2021), possibly attributable to variations in sampling density and detection methods. In previous studies on microplastics in inflowing water, the most abundant types of microplastics were cellophane, PET, polyvinylidene fluoride, EVA, and PE (Yang et al., 2021; Shi et al., 2022); however, in this study, except for PET, the contents of the other polymers were low. In particular, the content of EVA was only 0.04%, which was different from the results of the studies conducted by Sun et al. (2021) and Teng (2022). It is hypothesized that the amount of land-based microplastics entering Laizhou Bay through coastal rivers has decreased in recent years due to the further tightening of plastic management policies, which also indicates that the amount of microplastics generated from offshore activities has been higher than the land-based inputs in recent years.

Figure 5. Correlation heat map of microplastics types in the sediments.
3.3 Risk assessment of microplastics
The ecological risk posed by microplastics in the surface sediments of Laizhou Bay was evaluated using the PLI. PLI values at the sampling sites varied from 1.00 to 7.68, with an average of 3.52, whereas the overall PLIzone value for the area was 3.16, with all values remaining below the threshold of 10 (Figure 6). These values exceeded those observed in Liaodong Bay (PLIzone of 2.33) (Ye et al., 2023) and Yueqing Bay (PLIzone of 2.65) (Wang et al., 2024a). Based on the classification of microplastic contamination levels, all sampling sites fell into the low-hazard category, suggesting that microplastic contamination in the sediments of the study area is relatively stable and remains at a low level.
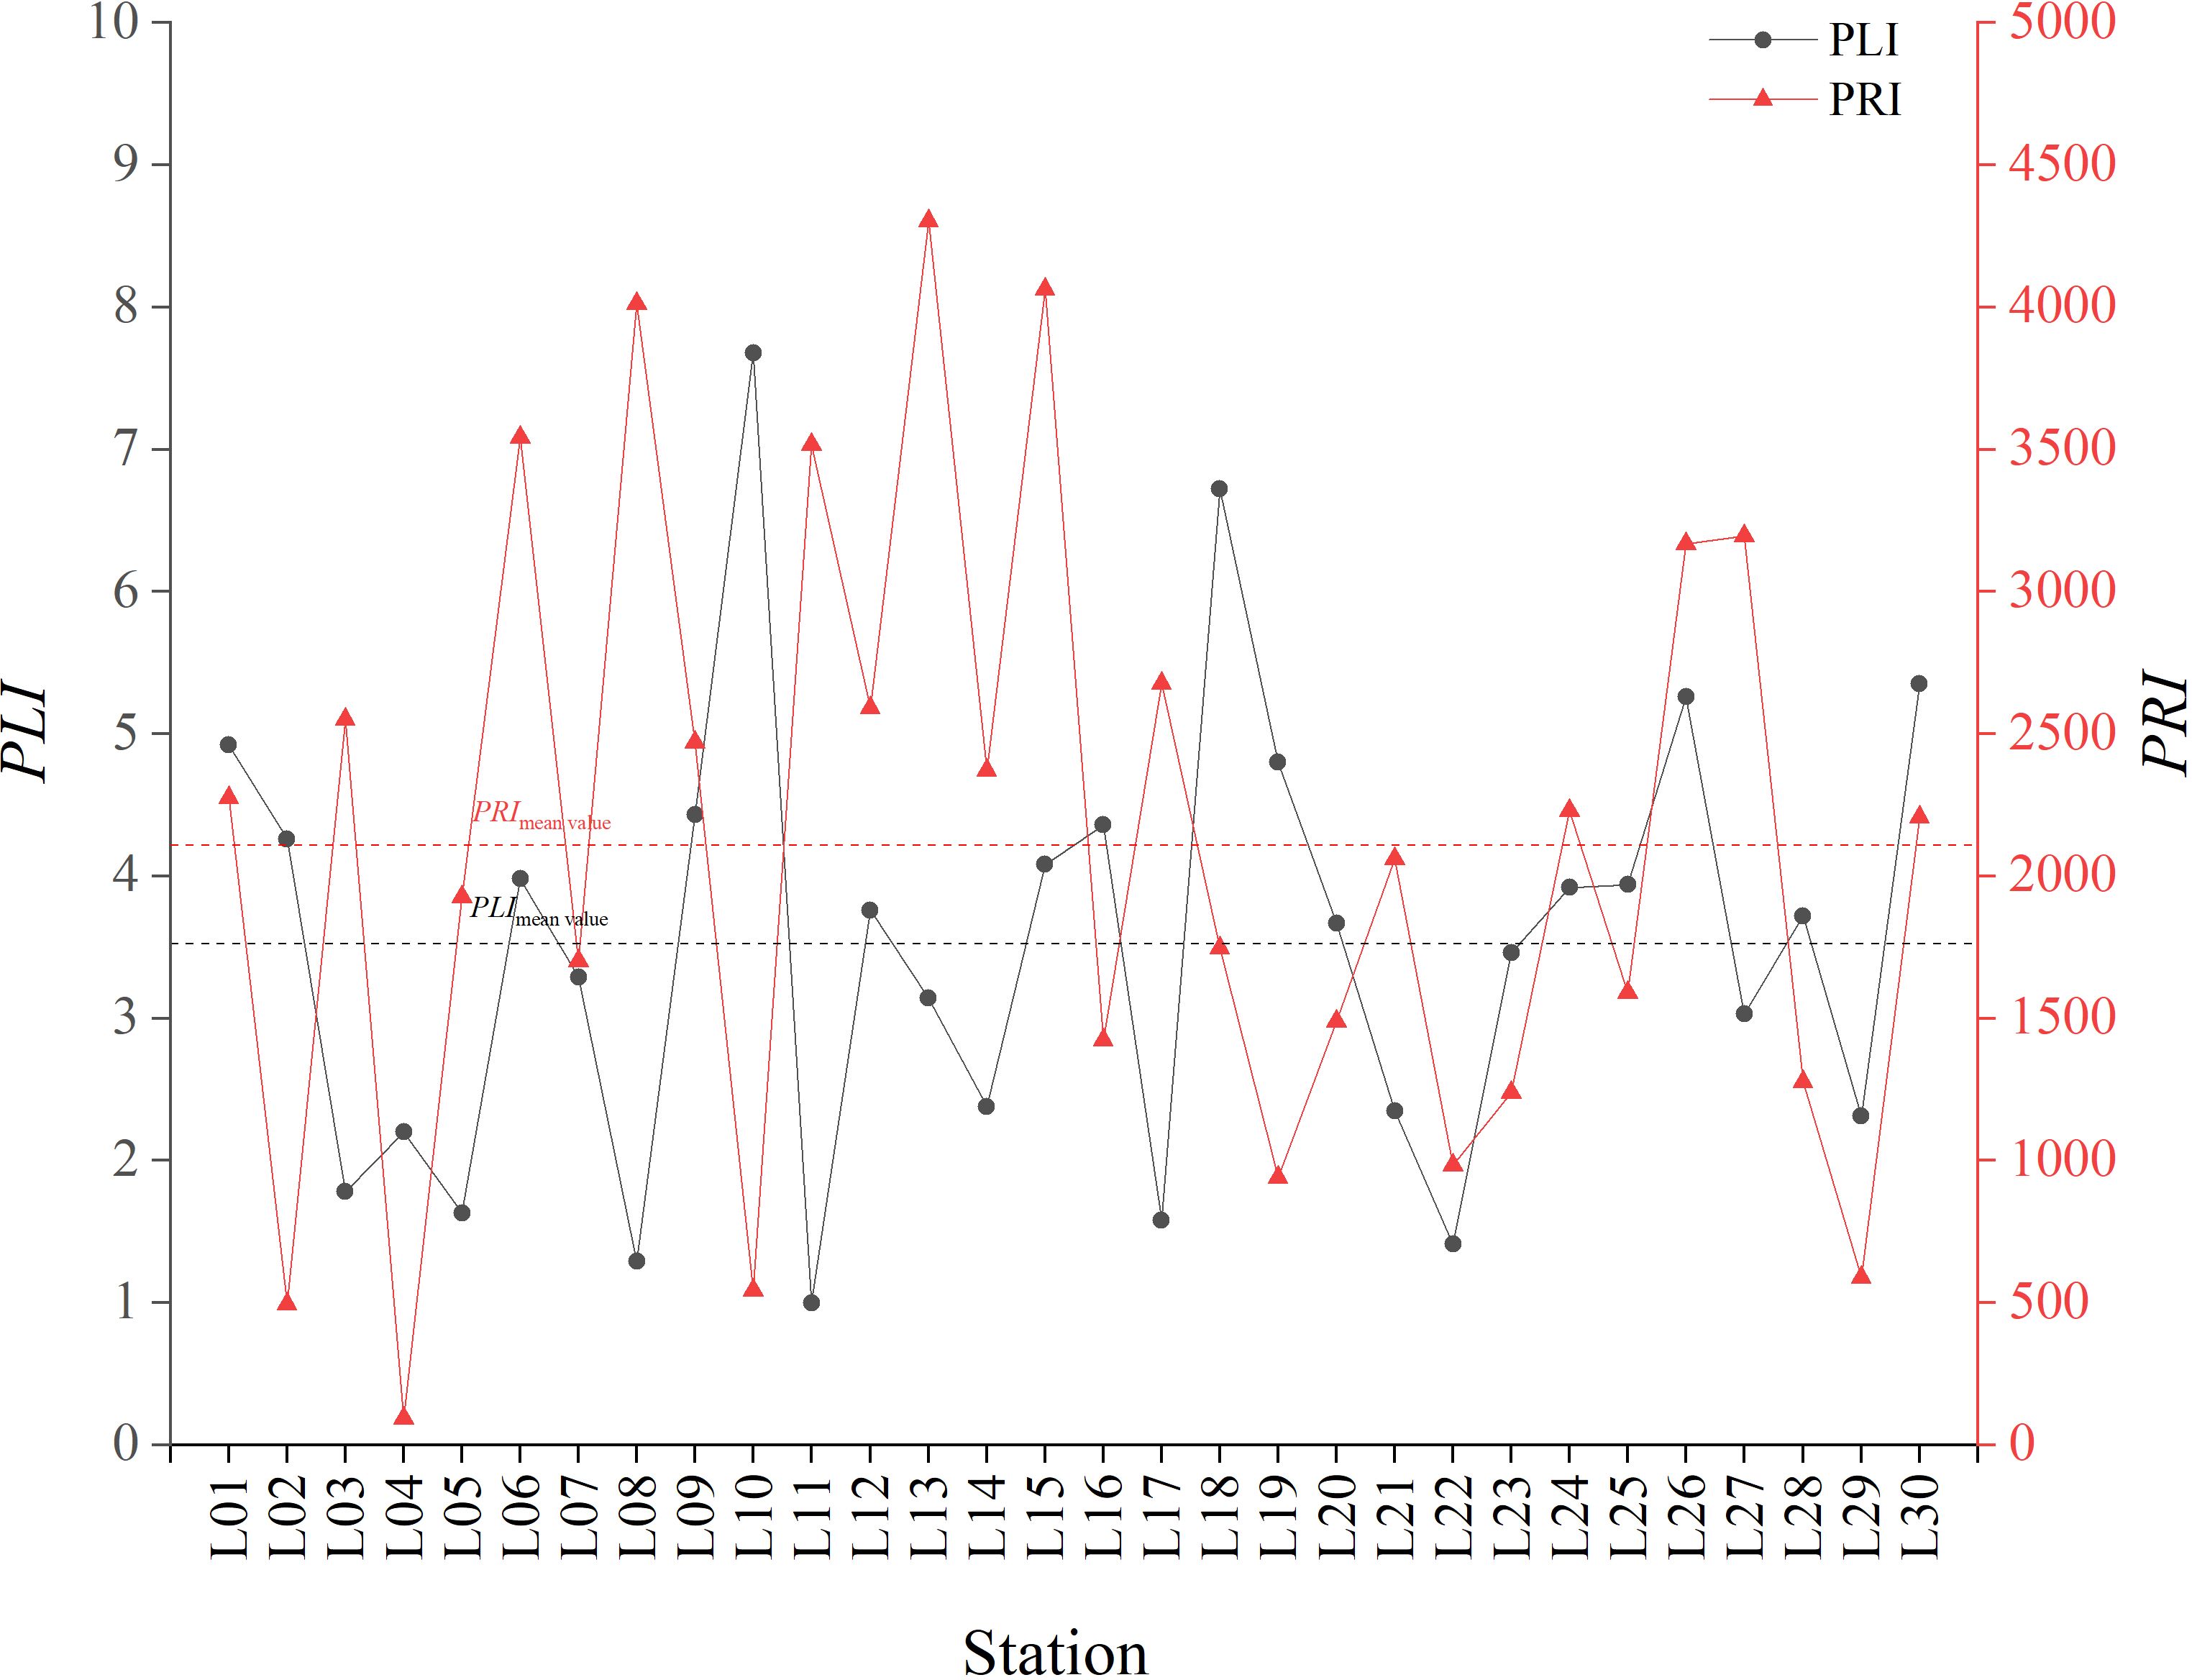
Figure 6. Risk distribution map of microplastics in the sediments.
The PLI was calculated using the lowest microplastic abundance value, thereby ensuring that the effect of different microplastic components on the PLI could be ignored. Nevertheless, the toxic effect of microplastic components constitutes a pivotal component of microplastic pollution analysis. To address this critical aspect, the PRI was investigated in conjunction with hazard scores for the typical and abundant microplastics present in the samples. This approach served to compensate for the absence of a comprehensive pollution evaluation. The PRI values of each sampling site ranged from 93.62 to 4303.36, with the highest values observed at sites L04 and L13, yielding a mean value of 2108.62 and PRIzone value of 1701.98 (Figure 6). This value was higher than the PRI value of Haizhou Bay (Lu et al., 2023). This result indicates that the overall PRI of microplastics in sediments was at a very high risk level, which was due to the presence of PU and PVC, which accounted for relatively small proportions of 10.81% and 6.92%, respectively, but high scores of 7384 and 10551, making a significant contribution to the PRI value of Laizhou Bay. Thus, the risk level of microplastics in the sediment was very high.
The results of this study reveal a minimal correlation between microplastic abundance and the PRI, i.e., P = –0.223. Figure 6 supports these findings, highlighting the limitations of relying solely on abundance values to evaluate the risk of microplastic contamination in sediments. Consequently, neglecting the specific types of microplastics and their associated risks could lead to a significant distortion in the assessment of ecological risks to the environment.
4 Conclusion
This study investigated the characteristics and sources of microplastics in the surface sediments of Laizhou Bay as well as their associated ecological risks. The average abundance of microplastics was found to be 534.7 items per gram of dry weight. The predominant forms identified were fragments and particles, whereas fibers constituted a smaller proportion of the total microplastic composition. The detection and analysis of microplastic components were conducted using a laser infrared method, which revealed the predominant types to be PA, PET, PU, and PVC. The results also indicated that the input of microplastics from marine activities exceeded that from land-based sources. The PRI indicated that microplastics in the study area exhibited a high risk level, with PU and PVC identified as significant sources of high-risk pollution. It is imperative that plastic products utilized in marine activities be further regulated or enhanced. This study was constrained by the limitations of the laser infrared detection method in accurately determining the color of different microplastics, which introduced a degree of bias in the analysis of microplastic sources. This study provides basic data for understanding the distribution and influencing factors of microplastics in Laizhou Bay, while providing also a global context for microplastic pollution when compared to other studies on marine microplastics in semi-enclosed sea areas around the world. In summary, a unified microplastic detection standard and evaluation method should be established in subsequent research and management to control harmful pollution caused by microplastics in coastal zones, shallow seas or deep seas in a timely manner.
Data availability statement
The raw data supporting the conclusions of this article will be made available by the authors, without undue reservation.
Author contributions
XZ: Data curation, Investigation, Software, Writing – original draft. HC: Conceptualization, Writing – original draft, Writing – review & editing. MY: Writing – original draft. YL: Writing – original draft. PC: Writing – original draft. QZ: Writing – original draft. XD: Writing – original draft. LK: Conceptualization, Writing – review & editing.
Funding
The author(s) declare that financial support was received for the research and/or publication of this article. This study was supported by Open Research Fund of Observation and Research Station of Seawater Intrusion and Soil Salinization, Laizhou Bay, Ministry of Natural Resources (2024LZORS003) and the Geological Survey Programs of the People’s Republic of China (DD20243124).
Conflict of interest
The authors declare that the research was conducted in the absence of any commercial or financial relationships that could be construed as a potential conflict of interest.
Generative AI statement
The author(s) declare that no Generative AI was used in the creation of this manuscript.
Any alternative text (alt text) provided alongside figures in this article has been generated by Frontiers with the support of artificial intelligence and reasonable efforts have been made to ensure accuracy, including review by the authors wherever possible. If you identify any issues, please contact us.
Publisher’s note
All claims expressed in this article are solely those of the authors and do not necessarily represent those of their affiliated organizations, or those of the publisher, the editors and the reviewers. Any product that may be evaluated in this article, or claim that may be made by its manufacturer, is not guaranteed or endorsed by the publisher.
References
Alam F. C., Sembiring E., Muntalif B. S., and Suendo V. (2019). Microplastic distribution in surface water and sediment river around slum and industrial area (case study: Ciwalengke River, Majalaya district, Indonesia). Chemosphere 224, 637–645. doi: 10.1016/j.chemosphere.2019.02.188
Ashton K., Holmes L., and Turner A. (2010). Association of metals with plastic production pellets in the marine environment. Mar. pollut. Bull. 60, 2050–2055. doi: 10.1016/j.marpolbul.2010.07.014
Barceló D., Picó Y., and Alfarhan A. H. (2023). Microplastics: Detection in human samples, cell line studies, and health impacts. Environ. Toxicol. Pharmacol. 101, 104204. doi: 10.1016/j.etap.2023.104204
Bilbao-Kareaga A., Menendez D., Peón P., Ardura A., and Garcia-Vazquez E. (2023). Microplastics in jellifying algae in the Bay of Biscay. Implications consumers’ Health Algal Res. 72, 103080. doi: 10.1016/j.algal.2023.103080
Bošković N., Joksimović D., Perošević-Bajčeta A., Peković M., and Bajt O. (2022). Distribution and characterization of microplastics in marine sediments from the Montenegrin coast. J. Soils Sediments 22, 2958–2967. doi: 10.1007/s11368-022-03166-3
Chen Y., Leng Y., Liu X., and Wang J. (2020). Microplastic pollution in vegetable farmlands of suburb Wuhan, central China. Environ. pollut. 257, 113449. doi: 10.1016/j.envpol.2019.113449
Chubarenko I., Bagaev A., Zobkov M., and Esiukova E. (2016). On some physical and dynamical properties of microplastic particles in marine environment. Mar. pollut. Bull. 108, 105–112. doi: 10.1016/j.marpolbul.2016.04.048
Curren E. and Yew Leong S. C. (2023). Spatiotemporal characterisation of microplastics in the coastal regions of Singapore. Heliyon 9, e12961. doi: 10.1016/j.heliyon.2023.e12961
Eo S., Hong S. H., Cho Y., Song Y. K., Han G. M., and Shim W. J. (2023). Spatial distribution and historical trend of microplastic pollution in sediments from enclosed bays of South Korea. Mar. pollut. Bull. 193, 115121. doi: 10.1016/j.marpolbul.2023.115121
Felline S., Piccardo M., De Benedetto G. E., Malitesta C., and Terlizzi A. (2022). Microplastics’ Occurrence in Edible Fish Species (Mullus barbatus and M. surmuletus) from an Italian Marine Protected Area. Microplastics 1, 291–302. doi: 10.3390/microplastics1020021
Geng N., Zhao G., Zhang D., Yuan H., and Li X. (2023). Distribution, sources and risk assessment of microplastics in surface sediments of the Yellow River Delta wetlands. Environ. Sci. 44, 5046–5054. doi: 10.13227/j.hjkx.202210339
Guan Q., Jiang J., Huang Y., Wang Q., Liu Z., Ma X., et al. (2023). The landscape of micron-scale particles including microplastics in human enclosed body fluids. J. Hazardous Materials 442, 130138. doi: 10.1016/j.jhazmat.2022.130138
Han M., Niu X., Tang M., Zhang B. T., Wang G., Yue W., et al. (2020). Distribution of microplastics in surface water of the lower Yellow River near estuary. Sci. Total Environ. 707, 135601. doi: 10.1016/j.scitotenv.2019.135601
Harris L. S. T., Fennell J., Fales R. J., and Carrington E. (2021). Spatial–temporal growth, distribution, and diffusion of marine microplastic research and national plastic policies. Water Air Soil pollut. 232, 1–18. doi: 10.1007/s11270-021-05352-4
Higgins C. and Turner A. (2023). Microplastics in surface coastal waters around Plymouth, UK, and the contribution of boating and shipping activities. Sci. Total Environ. 893, 164695. doi: 10.1016/j.scitotenv.2023.164695
Horvatits (2022). Microplastics detected in cirrhotic liver tissue. eBioMedicine 82, 104147. doi: 10.1016/j.ebiom.2022.104147
Hou X., Li J., Li H., Du S., Liu S., Jiao S., et al. (2024). Microplastics distribution, ecological risk and outflows of rivers in the Bohai Rim region of China - A flux model considering small and medium-sized rivers. Sci. Total Environ. 953, 176035. doi: 10.1016/j.scitotenv.2024.176035
Huang H., Hou J., Xing B., and Xi B. (2024). Accelerated aging: The hidden harm of microplastic exposure. Sci. Bull. 69, 2357–2361. doi: 10.1016/j.scib.2024.05.020
Ikenoue T., Nakajima R., Fujiwara A., Onodera J., Itoh M., Toyoshima J., et al. (2023). Horizontal distribution of surface microplastic concentrations and water-column microplastic inventories in the Chukchi Sea, western Arctic Ocean. Sci. Total Environ. 855, 159564. doi: 10.1016/j.scitotenv.2022.159564
Jahan S., Strezov V., Weldekidan H., Kumar R., Kan T., Sarkodie S. A., et al. (2019). Interrelationship of microplastic pollution in sediments and oysters in a seaport environment of the eastern coast of Australia. Sci. Total Environ. 695, 133924. doi: 10.1016/j.scitotenv.2019.133924
Jia W., Karapetrova A., Zhang M., Xu L., Li K., Huang M., et al. (2022). Automated identification and quantification of invisible microplastics in agricultural soils. Sci. Total Environ. 844, 156853. doi: 10.1016/j.scitotenv.2022.156853
Jiang B., Kauffman A. E., Li L., Mcfee W., Cai B., Weinstein J., et al. (2020). Health impacts of environmental contamination of micro- and nanoplastics: a review. Environ. Health Prev. Med. 25, 1–15. doi: 10.1186/s12199-020-00870-9
Kye H., Kim J., Ju S., Lee J., Lim C., and Yoon Y. (2023). Microplastics in water systems: A review of their impacts on the environment and their potential hazards. Heliyon 9, e14359. doi: 10.1016/j.heliyon.2023.e14359
Li X., Han B., Wang G., Gao W., Zheng L., Chi W., et al. (2023). Analysis of PAHs content, source and risk assessment in surface sediments from Laizhou Bay and Bohai Bay. Mar. pollut. Bull. 197, 115698. doi: 10.1016/j.marpolbul.2023.115698
Li J., Liu J., Wang X., Zhang T., Wang D., Shan E., et al. (2024). Vertical transfer of microplastics in nearshore water by cultured filter-feeding oysters. J. Hazardous Materials 475, 134769. doi: 10.1016/j.jhazmat.2024.134769
Li Y., Xiao P., Donnici S., Cheng J., and Tang C. (2023). Spatial and seasonal distribution of microplastics in various environmental compartments around Sishili Bay of North Yellow Sea, China. Mar. pollut. Bull. 186, 114372. doi: 10.1016/j.marpolbul.2022.114372
Lithner D., Larsson Å, and Dave G. (2011). Environmental and health hazard ranking and assessment of plastic polymers based on chemical composition. Sci. Total Environ. 409, 3309–3324. doi: 10.1016/j.scitotenv.2011.04.038
Liu K., Zhang Z., Wu H., Wang J., Wang R., Zhang T., et al. (2021). Accumulation of microplastics in a downstream area of a semi-enclosed bay: Implications of input from coastal currents. Sci. Total Environ. 791, 148280. doi: 10.1016/j.scitotenv.2021.148280
Lu L., Gao S., Lu J., and Fu G. (2023). Microplastic distribution and ecological risk in water and sediments of marine ranching area in Haizhou Bay. Regional Stud. Mar. Sci. 68, 103274. doi: 10.1016/j.rsma.2023.103274
Lv M., Jiang B., Xing Y., Ya H., Zhang T., and Wang X. (2022). Recent advances in the breakdown of microplastics: strategies and future prospectives. Environ. Sci. pollut. Res. 29, 65887–65903. doi: 10.1007/s11356-022-22004-0
Marfella R., Prattichizzo F., Sardu C., Fulgenzi G., Graciotti L., Spadoni T., et al. (2024). Microplastics and nanoplastics in atheromas and cardiovascular events. New Engl. J. Med. 390, 900–910. doi: 10.1056/NEJMoa2309822
Mazoyer C., Vanneste H., Dufresne C., Ourmières Y., Magaldi M. G., and Molcard A. (2020). Impact of wind-driven circulation on contaminant dispersion in a semi-enclosed bay. Estuarine Coast. Shelf Sci. 233, 106529. doi: 10.1016/j.ecss.2019.106529
Mohsen M., Wang Q., Zhang L., Sun L., Lin C., and Yang H. (2019). Microplastic ingestion by the farmed sea cucumber Apostichopus japonicus in China. Environ. pollut. 245, 1071–1078. doi: 10.1016/j.envpol.2018.11.083
Nash R., Joyce H., Pagter E., Frias J., Guinan J., Healy L., et al. (2023). Deep sea microplastic pollution extends out to sediments in the northeast atlantic ocean margins. Environ. Sci. Technol. 57, 201–213. doi: 10.1021/acs.est.2c05926
Osorio E. D., Tanchuling M. A. N., and Diola M. B. L. D. (2021). Microplastics occurrence in surface waters and sediments in five river mouths of manila bay. Front. Environ. Sci. 9. doi: 10.3389/fenvs.2021.719274
Pan Z., Liu Q., Jiang R., Li W., Sun X., Lin H., et al. (2021). Microplastic pollution and ecological risk assessment in an estuarine environment: The Dongshan Bay of China. Chemosphere 262, 127876. doi: 10.1016/j.chemosphere.2020.127876
Peng X., Zhang G., Yan Y., Yao C., Liu Q., Tang Q., et al. (2024). Characteristics of microplastic distribution and ecological risk assessment of surface sediments in coastal wetlands of Yancheng, Jiangsu. Mar. Environ. Sci. 43, 320–328. doi: 10.13634/j.cnki.mes.2024.02.017
Perfetti-Bolaño A., Araneda A., Muñoz K., and Barra R. O. (2022). Occurrence and distribution of microplastics in soils and intertidal sediments at fildes bay, maritime Antarctica. Front. Mar. Sci. 8. doi: 10.3389/fmars.2021.774055
Pervez R., Lai Y., Song Y., Li X., and Lai Z. (2023). Impact of microplastic pollution on coastal ecosystems using comprehensive beach quality indices. Mar. pollut. Bull. 194, 115304. doi: 10.1016/j.marpolbul.2023.115304
Rakib M. R. J., Hossain M. B., Kumar R., Ullah M. A., Al Nahian S., Rima N. N., et al. (2022). Spatial distribution and risk assessments due to the microplastics pollution in sediments of Karnaphuli River Estuary, Bangladesh. Sci. Rep. 12, 8581. doi: 10.1038/s41598-022-12296-0
Renner G., Schmidt T. C., and Schram J. (2017). A new chemometric approach for automatic identification of microplastics from environmental compartments based on FT-IR spectroscopy. Analytical Chem. 89, 12045–12053. doi: 10.1021/acs.analchem.7b02472
Roslan N. S., Lee Y. Y., Ibrahim Y. S., Tuan Anuar S., Yusof K. M. K. K., Lai L. A., et al. (2024). Detection of microplastics in human tissues and organs: A scoping review. J. Global Health 14, 4179. doi: 10.7189/jogh.14.04179
Sait S. T. L., Sørensen L., Kubowicz S., Vike-Jonas K., Gonzalez S. V., Asimakopoulos A. G., et al. (2021). Microplastic fibres from synthetic textiles: Environmental degradation and additive chemical content. Environ. pollut. 268, 115745. doi: 10.1016/j.envpol.2020.115745
Seeley M. E., Song B., Passie R., and Hale R. C. (2020). Microplastics affect sedimentary microbial communities and nitrogen cycling. Nat. Commun. 11, 1–10. doi: 10.1038/s41467-020-16235-3
Shi H., Yu D., Yin L., Sui Y., Liu Y., Qiao S., et al. (2022). Source-sink process of microplastics in watershed-estuary-offshore system. J. Cleaner Production 338, 130612. doi: 10.1016/j.jclepro.2022.130612
Sun J., Peng Z., Zhu Z. R., Fu W., Dai X., and Ni B. J. (2022). The atmospheric microplastics deposition contributes to microplastic pollution in urban waters. Water Res. 225, 119116. doi: 10.1016/j.watres.2022.119116
Sun X., Wang T., Chen B., Booth A. M., Liu S., Wang R., et al. (2021). Factors influencing the occurrence and distribution of microplastics in coastal sediments: From source to sink. J. Hazardous Materials 410, 124982. doi: 10.1016/j.jhazmat.2020.124982
Tajwar M., Shreya S. S., Gazi Md Y., Hasan M., and Saha S. K. (2022). Microplastic contamination in the sediments of the Saint Martin’s Island, Bangladesh. Regional Stud. Mar. Sci. 53, 102401. doi: 10.1016/j.rsma.2022.102401
Teng J. (2022). Characterization of microplastic pollution in Laizhou Bay and its ecotoxic effect on typical bivalve shellfish (University of Chinese Academy of Sciences.Yantai, Shandong Province, China) (Yantai Institute of Coastal Zone Research, Chinese Academy of Sciences). doi: 10.27841/d.cnki.gytha.2021.000014
Teng J., Zhao J., Zhang C., Cheng B., Koelmans A. A., Wu D., et al. (2020). A systems analysis of microplastic pollution in Laizhou Bay, China. Sci. Total Environ. 745, 140815. doi: 10.1016/j.scitotenv.2020.140815
Tomlinson D. L., Wilson J. G., Harris C. R., and Jeffrey D. W. (1980). Problems in the assessment of heavy-metal levels in estuaries and the formation of a pollution index. Helgoländer Meeresuntersuchungen 33, 566–575. doi: 10.1007/BF02414780
Tong Y., Lin L., Tao Y., Huang Y., and Zhu X. (2023). The occurrence, speciation, and ecological effect of plastic pollution in the bay ecosystems. Sci. Total Environ. 857, 159601. doi: 10.1016/j.scitotenv.2022.159601
Ulses C., Grenz C., Marsaleix P., Schaaff E., Estournel C., Meulé S., et al. (2005). Circulation in a semi-enclosed bay under influence of strong freshwater input. J. Mar. Syst. 56, 113–132. doi: 10.1016/j.jmarsys.2005.02.001
Walkinshaw C., Lindeque P. K., Thompson R., Tolhurst T., and Cole M. (2020). Microplastics and seafood: lower trophic organisms at highest risk of contamination. Ecotoxicology Environ. Saf. 190, 110066. doi: 10.1016/j.ecoenv.2019.110066
Wan S., Xu G., Xiong P., Qiao H., Chen X., Gu L., et al. (2024). Microplastic pollution characteristics and ecological risk assessment in the Wuding River Basin, China. Environ. pollut. 356, 124228. doi: 10.1016/j.envpol.2024.124228
Wang Z., Su B., Xu X., Di D., Huang H., Mei K., et al. (2018). Preferential accumulation of small (<300 μm) microplastics in the sediments of a coastal plain river network in eastern China. Water Res. 144, 393–401. doi: 10.1016/j.watres.2018.07.050
Wang Y., Zhong Z., Chen X., Sokolova I., Ma L., Yang Q., et al. (2024a). Microplastic pollution and ecological risk assessment of Yueqing Bay affected by intensive human activities. J. Hazardous Materials 461, 132603. doi: 10.1016/j.jhazmat.2023.132603
Winiarska E., Jutel M., and Zemelka-Wiacek M. (2024). The potential impact of nano- and microplastics on human health: Understanding human health risks. Environ. Res. 251, 118535. doi: 10.1016/j.envres.2024.118535
Wu N., Zhang Y., Zhang X., Zhao Z., He J., Li W., et al. (2019). Occurrence and distribution of microplastics in the surface water and sediment of two typical estuaries in Bohai Bay, China. Environ. Science: Processes Impacts 21, 1143–1152. doi: 10.1039/C9EM00148D
Xu T., Cui J., Xu R., Cao J., and Guo M. Y. (2023). Microplastics induced inflammation and apoptosis via ferroptosis and the NF-κB pathway in carp. Aquat. Toxicol. 262, 106659. doi: 10.1016/j.aquatox.2023.106659
Xu P., Peng G., Su L., Gao Y., Gao L., and Li D. (2018). Microplastic risk assessment in surface waters: A case study in the Changjiang Estuary, China. Mar. pollut. Bull. 133, 647–654. doi: 10.1016/j.marpolbul.2018.06.020
Xu P., Peng G., Zhu L., Bai M., and Li D. (2019). Spatial and temporal distribution of microplastics in the Yangtze River Estuary and risk evaluation. China Environ. Sci. 39, 2071–2077. doi: 10.19674/j.cnki.issn1000-6923.2019.0248
Xu C., Yang B., Dan S. F., Zhang D., Liao R., Lu D., et al. (2020). Spatiotemporal variations of biogenic elements and sources of sedimentary organic matter in the largest oyster mariculture bay (Maowei Sea), Southwest China. Sci. Total Environ. 730, 139056. doi: 10.1016/j.scitotenv.2020.139056
Yang Z., Hu H., Wang X., Jiao J., Wang X., and Chen G. (2021). Characterization of microplastic inputs to the inlet streams of Laizhou Bay. Mar. Lakes Marshes Bull. 5, 73–81. doi: 10.13984/j.cnki.cn37-1141.2021.05.010
Yao C., Liu X., Wang H., Sun X., Qian Q., and Zhou J. (2021). Occurrence of microplastics in fish and shrimp feeds. Bull. Environ. Contamination Toxicol. 107, 684–692. doi: 10.1007/s00128-021-03328-y
Ye Y., Zhang A., Teng J., Yang X., Yuan X., Wang Q., et al. (2023). Pollution characteristics and ecological risk of microplastic in sediments of Liaodong Bay from the northern Bohai Sea in China. Mar. pollut. Bull. 187, 114505. doi: 10.1016/j.marpolbul.2022.114505
Zhang B., Chen L., Chao J., Yang X., and Wang Q. (2020). Research progress of microplastics in freshwater sediments in China. Environ. Sci. pollut. Res. 27, 31046–31060. doi: 10.1007/s11356-020-09473-x
Zhang M., Lu Q., Wang D., Ding D., Cui Z., and Shi H. (2022). Spatiotemporal evolution of nutrients and the influencing factors in Laizhou Bay over the past 40 years. Mar. pollut. Bull. 184, 114186. doi: 10.1016/j.marpolbul.2022.114186
Zhang R., Zhang G., Zheng Q., Tang J., Chen Y., Xu W., et al. (2012). Occurrence and risks of antibiotics in the Laizhou Bay, China: Impacts of river discharge. Ecotoxicology Environ. Saf. 80, 208–215. doi: 10.1016/j.ecoenv.2012.03.002
Keywords: microplastics, Laizhou Bay, sediment, risk assessment, semi-enclosed sea area
Citation: Zhang X, Chu H, Yin M, Liu Y, Chen P, Zhang Q, Dai X and Kong L (2025) Spatial distribution and risk assessment of microplastics in surface sediments in semi-enclosed waters: a case study of Laizhou Bay. Front. Mar. Sci. 12:1578167. doi: 10.3389/fmars.2025.1578167
Received: 17 February 2025; Accepted: 28 July 2025;
Published: 20 August 2025.
Edited by:
Chaomeng Dai, Tongji University, ChinaReviewed by:
Gabriela Verónica Aguirre-Martínez, Arturo Prat University, ChileMehmet Aksu, Ege University, Türkiye
Copyright © 2025 Zhang, Chu, Yin, Liu, Chen, Zhang, Dai and Kong. This is an open-access article distributed under the terms of the Creative Commons Attribution License (CC BY). The use, distribution or reproduction in other forums is permitted, provided the original author(s) and the copyright owner(s) are credited and that the original publication in this journal is cited, in accordance with accepted academic practice. No use, distribution or reproduction is permitted which does not comply with these terms.
*Correspondence: Linghao Kong, a29uZ2xpbmdoYW85MTE1QDE2My5jb20=