Abstract
Introduction:
Marine habitat mapping serves as a critical tool for ecosystem-based management and scientific research. This study reviews the environmental characteristics of the Beibu Gulf and proposes a habitat classification system to support spatial ecological analysis and regional planning.
Methods:
A habitat classification system was developed that integrates biological zones, substrate types, and vegetation, based on multidisciplinary data sources—including bathymetry, optical remote sensing, geomorphology, and biological surveys—combined with GIS techniques to produce detailed habitat maps.
Results:
A total of 19 habitat types were identified, comprising 8 intertidal, 5 infralittoral, 5 circalittoral, and 1 deep circalittoral habitats. The most dominant habitats were deep circalittoral mud (55%), circalittoral mud (19%), and infralittoral mud (14%), while littoral mangroves, saltmarshes, and seagrass each accounted for less than 1%. Map confidence was generally moderate, with lower accuracy observed at the boundaries between biological zones, and higher confidence in the littoral zones.
Discussion:
These findings provide a comprehensive and detailed habitat basemap that supports marine monitoring, scientific research, ecological conservation, and regional planning. The study highlights the significant application potential of habitat mapping in coastal and marine management.
1 Introduction
As an effective tool for marine ecosystem conservation and management, marine habitat mapping systematically organizes and visualizes heterogeneous biotic and environmental datasets, thereby depicting the characteristics, distribution and extent of physical environments. More importantly, it can be used to predict species and communities distributions, thus providing essential information for fisheries management, marine spatial planning, marine protected area (MPA) designation, coastal oil and gas infrastructure, port and shipping lane design, tourism and seabed mining (Peter and Elaine, 2020).
Since the early 21st century, the United States, the European Union, Australia, and other countries have successively proposed marine habitat classification schemes and mapping products. The United States has released the Coastal and Marine Ecological Classification Standard (CMECS) (FGDC, 2012) and implemented mapping applications in the Northeast Pacific (Bassett et al., 2017), the Northern Gulf of Mexico (Allee et al., 2014), and Greenwich Bay (Shumchenia and King, 2010). The EU’s EUSeaMap, based on the European Nature Information System (EUNIS), has supported assessments of ecological status in the Northeast Atlantic (OSPAR, 2017), environmental impact assessments of the Hornsea Three offshore wind farm (RPS group, 2018), blue carbon accounting in Orkney waters (Porter et al., 2020) and compilation of the European Red List of Marine Habitats (Gubbay et al., 2016). Australia has produced SEAMAP Australia (Seamap Australia, n.d) underpinned by the Australian Benthic Marine Habitat Classification Scheme. Consequently, marine habitat mapping is recognized internationally as a key tool for ecosystem-based natural resource management, bridging science and policy (Ball et al., 2006). In recent years, Chinese researchers have also advanced ecosystem-based marine spatial management by establishing a national marine ecological classification system (Ministry of Natural Resources of China, 2020), delineating ecological zones in coastal and adjacent seas (Huang et al., 2023) and exploring suitable habitat mapping techniques.
This study selected the Beibu Gulf (north-western South China Sea) as a pilot area for habitat mapping. The gulf contains diverse coastal habitats, including mangroves, coral reefs, salt marshes, seagrass beds, sandflats and mudflats (Fan et al., 2015; Xie et al., 2020; Tian and Li, 2018). Approximately 30 macroalgal, 200 molluscan, 20 cephalopod, 100 crustacean and 240 fish species have been documented (Yu and Mu, 2006). However, existing information on habitat and community distribution remains largely descriptive, with limited to no prior habitat mapping efforts.
Based on the regional characteristics of the Beibu Gulf region, this study developed a habitat classification method that integrates biological zones, substrate types, and vegetation, maximizing the integration and utilization of multidisciplinary, multi-source data including bathymetry, optics remote sensing, substrates, geomorphology, and biology. The resulting habitat distribution maps not only fill the gap in habitat mapping within the Beibu Gulf, but also contribute to global marine spatial planning by providing a replicable framework for data-poor regions. This study enhances the understanding of regional biodiversity patterns while providing spatially explicit data to support climate vulnerability assessments, marine protected area (MPA) design, and ecosystem-based management strategies.
2 Study area
The scope of this study is the Beibu Gulf, northern South China Sea (Figure 1), extending from 108.1° to 110.02°E and 20.2° to 21.9°N. Situated in the in the subtropical zone, bottom-water temperature is 24-27°C and salinity is 33-34 PSU throughout the year, with only minor seasonal fluctuations (Chen et al., 2011a, b). The seabed is dominated by unconsolidated sediment, principally well-sorted fine sand, fine-grained sediment, and gravel (Ma et al., 2019). Coastal habitats within the gulf comprise mangroves, mudflats, sandflats, saltmarshes, seagrass beds and coral reefs.
Figure 1
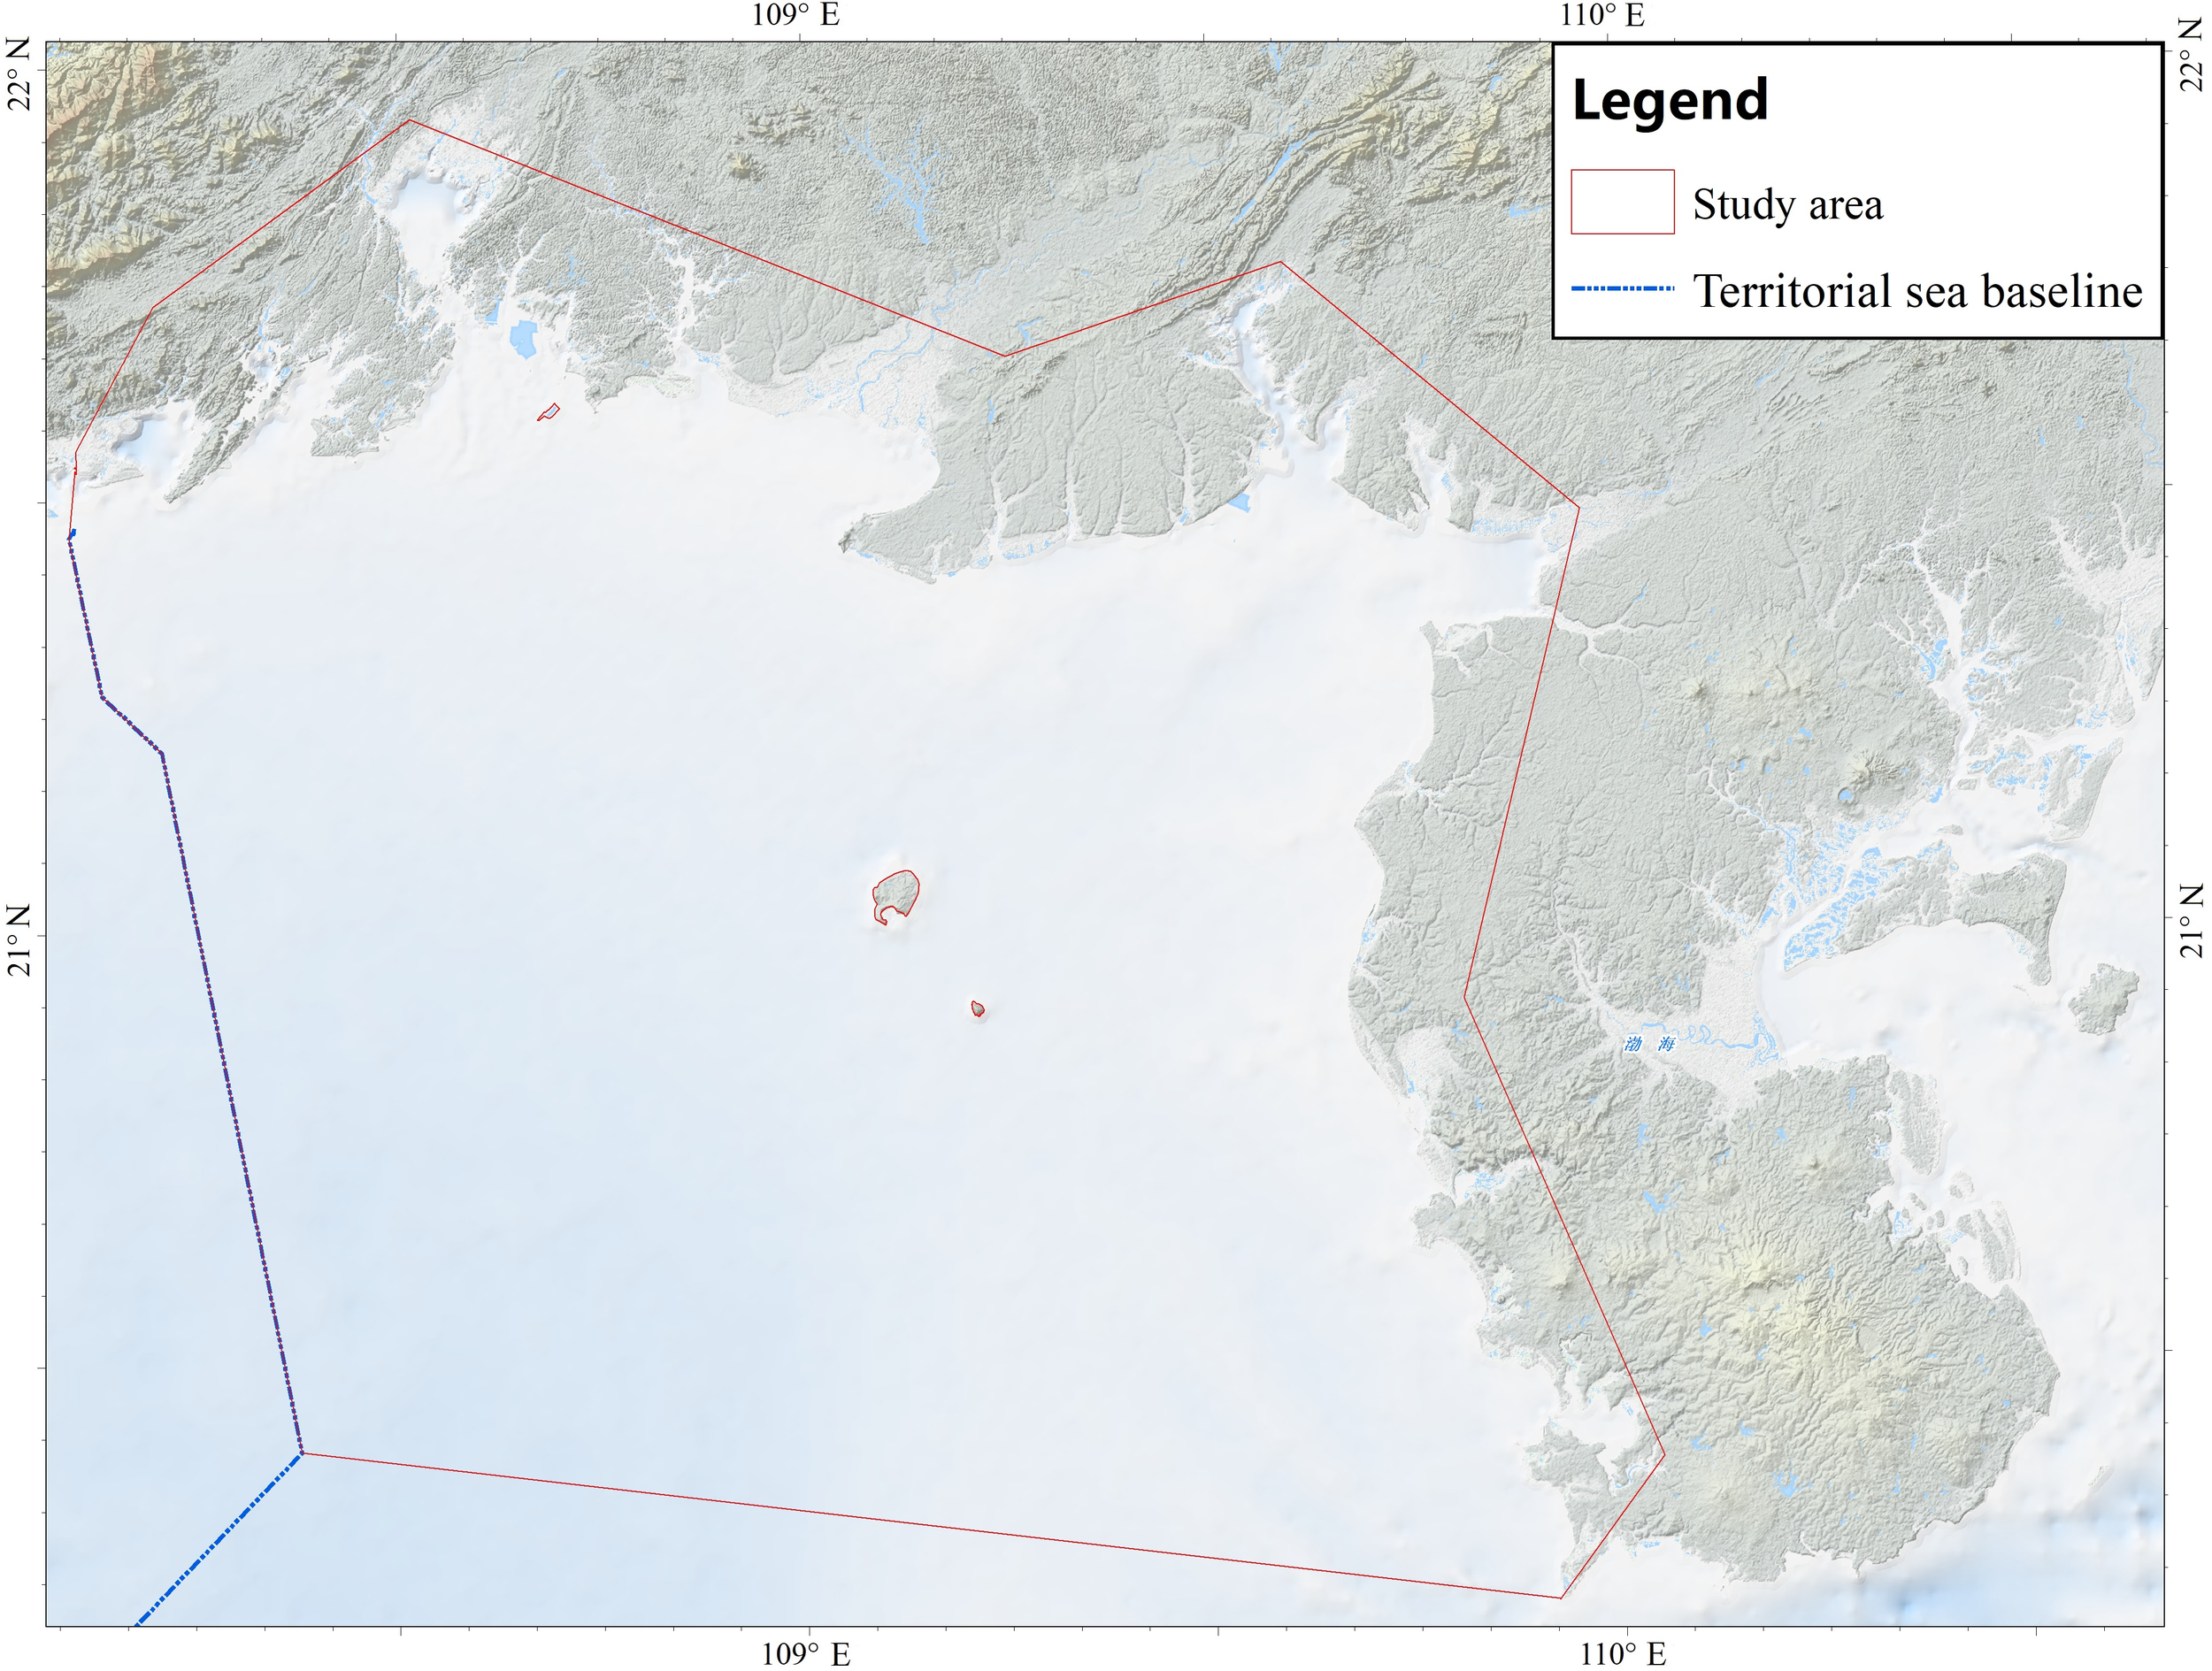
Study area map of the Beibu Gulf.
3 Materials and methods
3.1 Marine habitat classification
In this study, the ecological classification was conducted based on the 2022 EUNIS marine habitat classification for benthic habitats, with modifications to reflect the characteristics of the study area. Habitat types were determined by integrating biological zones, substrate types, and vegetation types. The biological zones comprised the littoral, infralittoral, circalittoral, and deep circalittoral zones. Substrates were classified into two major categories, namely hard substrates (rocks and biogenic substrate) and soft substrates (gravel, sand, and mud). Dominant vegetation was categorized as mangrove, salt marsh, seagrass, or seaweed.
3.2 Mapping method
The creation of the seabed habitat map was carried out in three main steps: 1) data collection, analysis, and processing; 2) creation of classification layers, including classified biological zones, classified substrate, classified vegetation, and confidence assessment maps for each classified layer; 3) production of seabed habitat map and confidence map. Spatial distribution layers for each element were derived by analyzing and integrating the collected environmental and biological data. These layers were then subjected to spatial analysis, classification, and combination to produce the classification layers. Finally, the classification layers were superimposed to generate the habitat maps. When the classified environmental variables were combined, specific habitat types were assigned accordingly (see Figure 2 for technology roadmap).
Figure 2
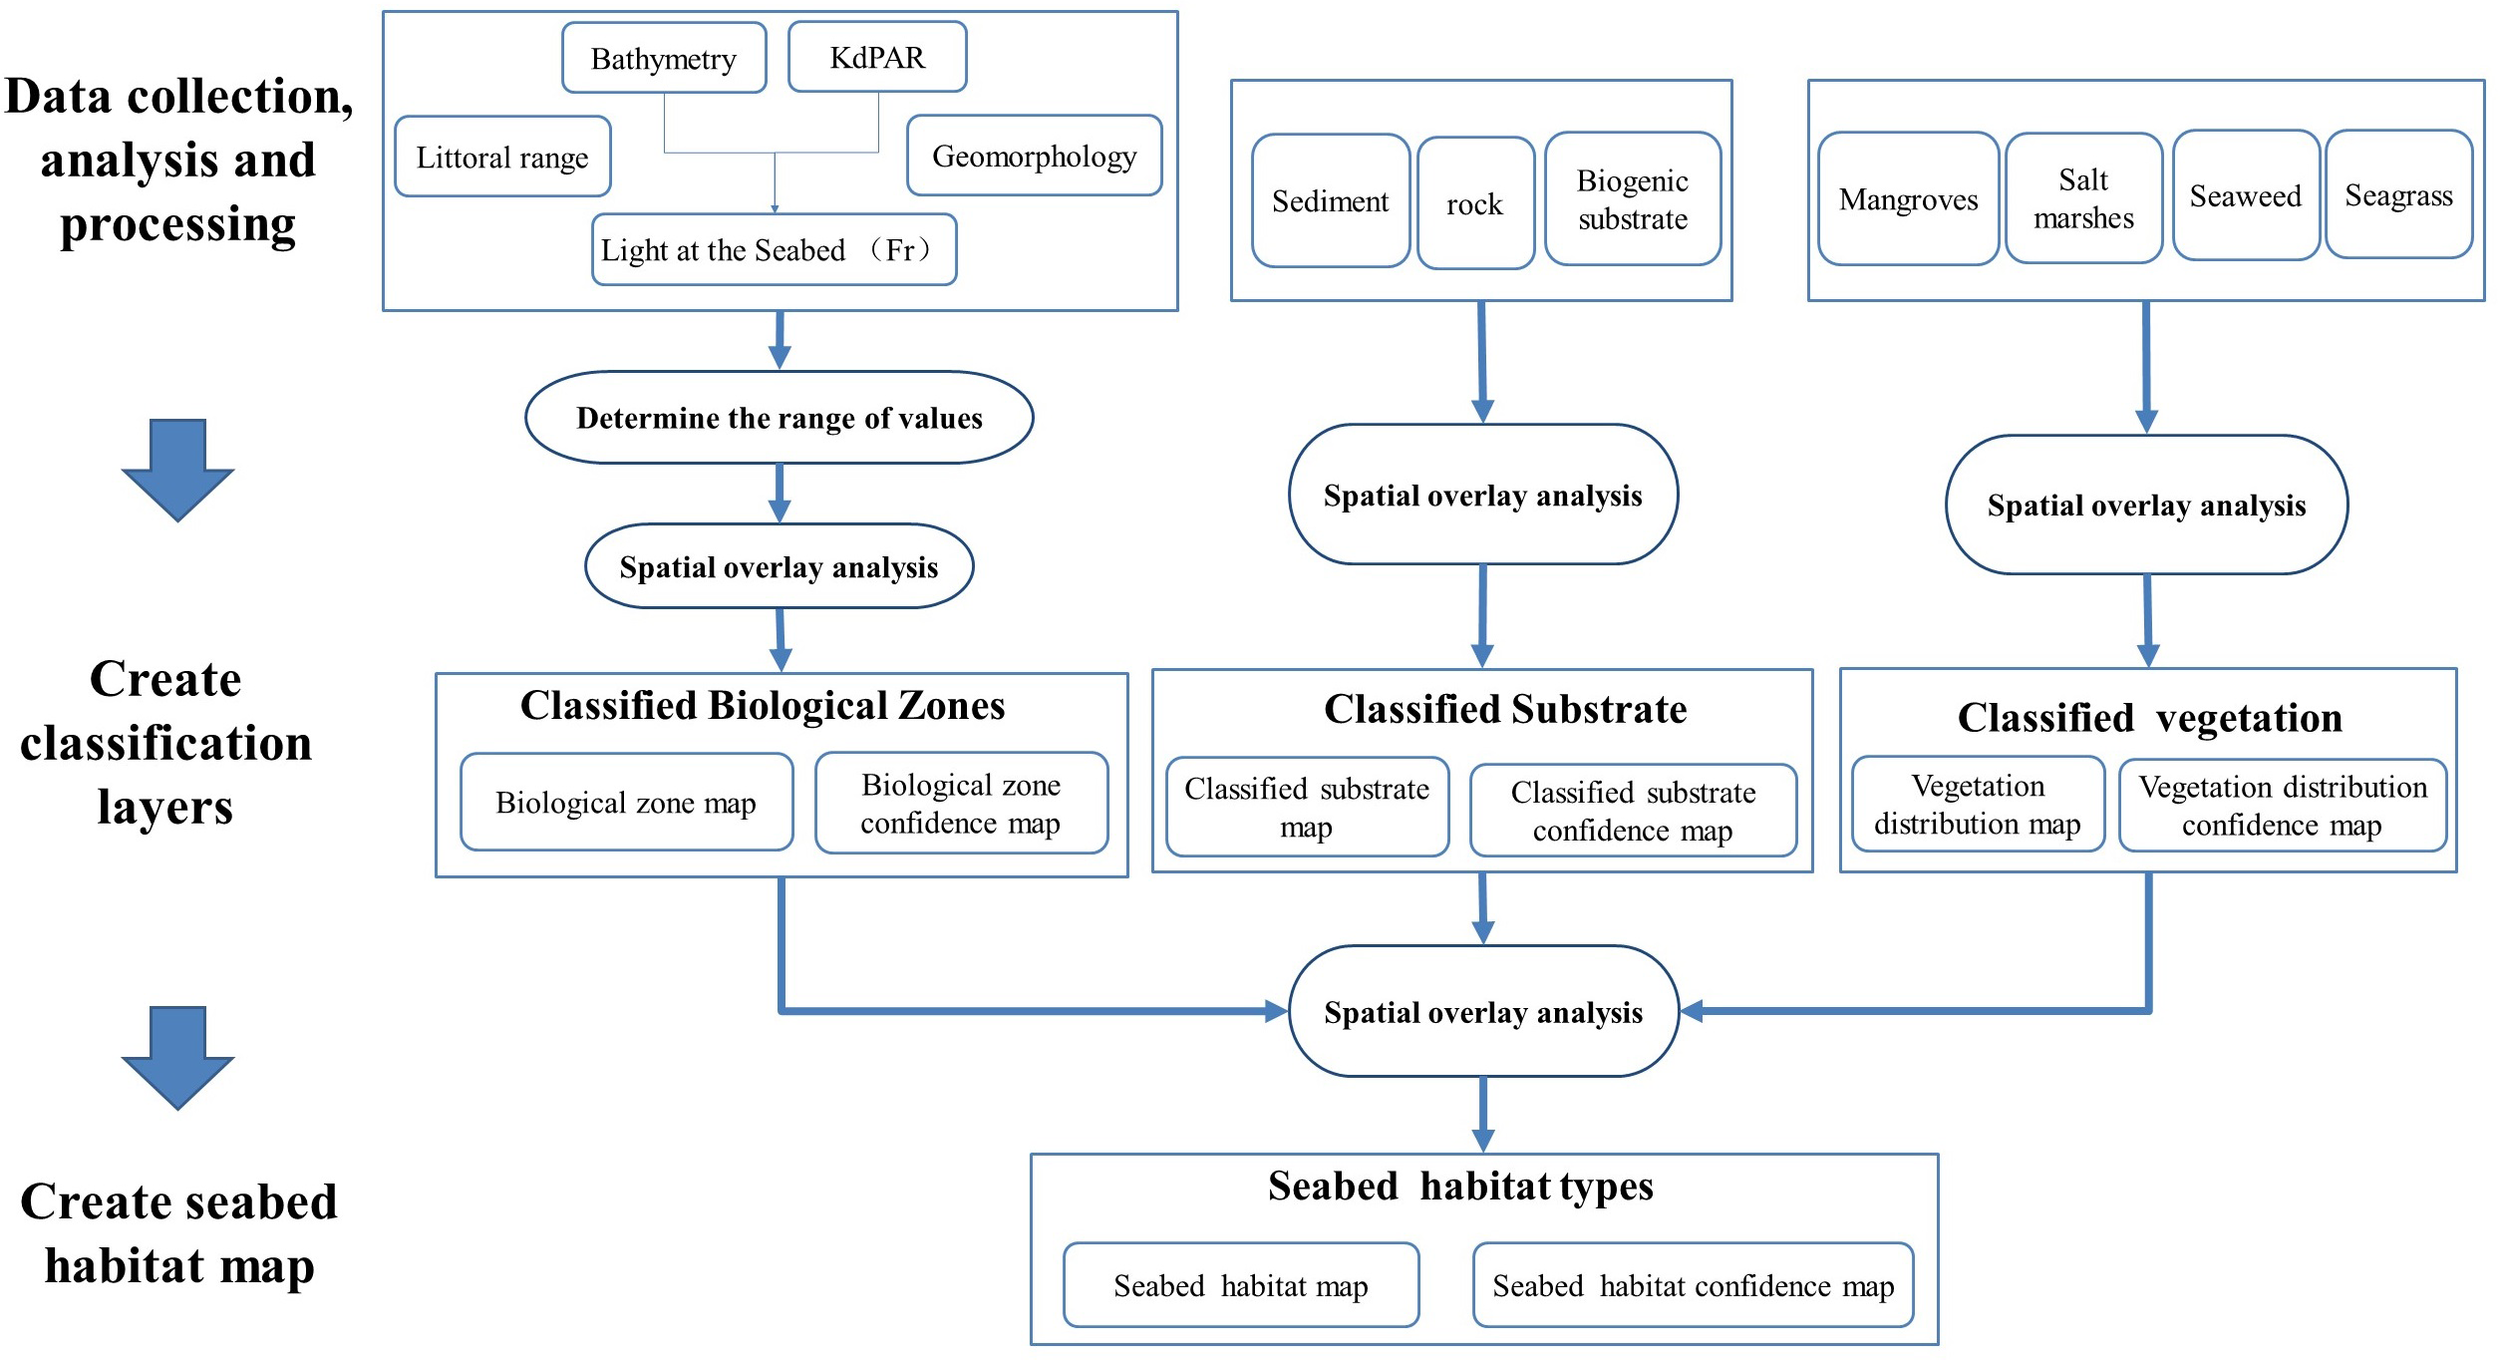
Workflow of seabed habitat mapping.
3.3 Data collection and processing
The data required for the seabed habitat mapping in the study area were collected, including bathymetry, KdPAR, littoral range, geoform, spatial distribution of sediments, rocks, biological substrates, mangroves, salt marshes, seagrasses, seaweeds, etc. These datasets were integrated and processed to generate corresponding spatial data layers.
3.3.1 The bathymetry layer
A composite bathymetry layer covering the entire study area was generated at a resolution of 200 meters by integrating five distinct datasets: 1) multibeam survey data from 2008-2009; 2) single-beam survey data from 2008-2009; 3) chart soundings data with spatial resolutions ranging from 1:2000 to 1:500,000 from 2013-2020; 4) satellite-derived bathymetry (SDB) data in estuarine areas; and 5) the General Bathymetric Chart of the Oceans (GEBCO) global bathymetry map (version2020).
3.3.2 Fraction of light at the seabed layer
The fraction of light reaching the seabed was calculated using bathymetric data and the diffuse attenuation coefficient of photosynthetically available radiation (KdPAR) in the water column. KdPAR data were obtained from the EMODnet Partnership for China and Europe, based on averaged value from 2017 to 2020, with a spatial resolution of 300 meters.
3.3.3 The substrate layer
The substrate layer was developed by integrating four different datasets: 1) spatial distribution data of sediment types from the Special Survey of China’s Offshore in 2007-2008; 2) spatial distribution data of bedrock from the Special Survey of Guangxi Province Coast in 2006-2007; 3) China Coral Reef Survey data in 2019-2020; 4) data from the Allen Coral Atlas in 2018-2021; and 5) data from the Typical Coastal Ecosystems Survey in 2023.
3.3.4 The geoform layer
The geomorphology data used in this study were derived from the Geomorphological Atlas of the China Offshore Marine Comprehensive Survey and Evaluation Project to generate the geoform layer.
3.3.5 The Vegetation distribution layer
Vegetation data were derived from the Typical Coastal Ecosystems Survey conducted in 2021 and 2023. Vegetation spatial distribution data were extracted and integrated to form the vegetation layer.
3.4 Create seabed habitat distribution map
3.4.1 Create classified biological zones layer
Using the bathymetry data (denoted as h) and the diffuse attenuation coefficient for photosynthetically active radiation (KdPAR), the fraction of surface light reaching the seabed (Fr) was calculated. This relationship is described by the Beer–Lambert law and can be expressed as:
where: Io is the incident light intensity at the water surface, Ih is the light intensity at depth h, KdPA is the light attenuation coefficient (m-¹), and h is the water depth (m).
This formula describes the exponential decay of light, which is essential for estimating the availability of light for benthic photosynthetic organisms such as seagrasses, macroalgae, and symbiotic corals (Kirk, 1994; Culver and Perry, 1999). Using Fr=1% (a widely accepted threshold for the minimum light required to sustain photosynthesis) as the threshold range, overlaying the 0m depth contour line and the underwater shoreline from the geomorphology geoform data to generate the biological layer.
3.4.2 Create classified substrate layer
Sediment, rock, and biogenic substrate data were integrated to generate classified substrate layers, based on the classification method described in section 3.1.
3.4.3 Create classified vegetation layer
The spatial distribution data of vegetation, including mangroves, salt marshes, seagrass beds, and seaweeds were integrated to form classified vegetation distribution layers.
3.4.4 Seabed habitat mapping
The biological zone layers and substrate classification layers were first spatially overlaid, followed by overlaying with the vegetation distribution layers, to produce the final seabed habitat map. In areas where vegetation and substrate data overlapped, vegetation attributes were prioritized during classification. Habitat names followed the format: biological zone-substrate type or biological zone-vegetation type.
3.5 Confidence assessment
The purpose of the confidence assessment was to characterize the overall uncertainty of the habitat map. Confidence scores were assigned quantitatively, rather than derived from a quantitative accuracy assessment, and were expressed at three levels (high, moderate, low). The assessment comprised three components:
(1) Input data confidence. Bathymetry, fraction of light at the seabed, substrate, geoform, and vegetation layers were evaluated. The confidence level of each dataset was inferred from the confidence reported in the original source and from the acquisition method (e.g., remote-sensing interpretation, field validation, or in-situ sampling). (2) Confidence of classified thematic layers. Biological zones, classified substrate, and classified vegetation layers were assessed. Confidence was derived from the input datasets using a conservative rule in which the lowest (or, when different, the intermediate) confidence adopted. For example, the overlay of high and moderate confidence layers yielded a moderate confidence, whereas the overlay of high and low confidence layers also yielded a moderate confidence. For biological zones, we additionally considered the fuzziness thresholds between that occur between adjacent classes, which reflect natural transitions (Populus et al., 2017). In this study, the upper boundary of the circalittoral zone was set to Fr = 0.01 ± 0.001, and the lower boundary was determined as subaqueous slope line ± 2.5 km. (3) Confidence of the seabed habitat map. which was similarly determined based on the confidence of its input classified layers. All confidence assessments were conducted in a GIS-based raster mode, with each cell assigned a confidence score of 1 (low), 2 (moderate), or 3 (high).
4 Results and discussion
4.1 Biological zones
The Beibu Gulf study area was stratified into four biological zones (Figure 3): littoral, infralittoral, circalittoral and deep circalittoral. The deep circalittoral zone is the most extensive, occupying 12224 km² (≈ 55% of the total area). The circalittoral and infralittoral zones account for about 21% and 19%, respectively, whereas the littoral zone is smallest (≈ 6%). This spatial pattern partially reflects the unique hydrodynamic characteristics, depth gradients, and variations in seabed light availability, which collectively govern habitat suitability for numerous taxa.
Figure 3
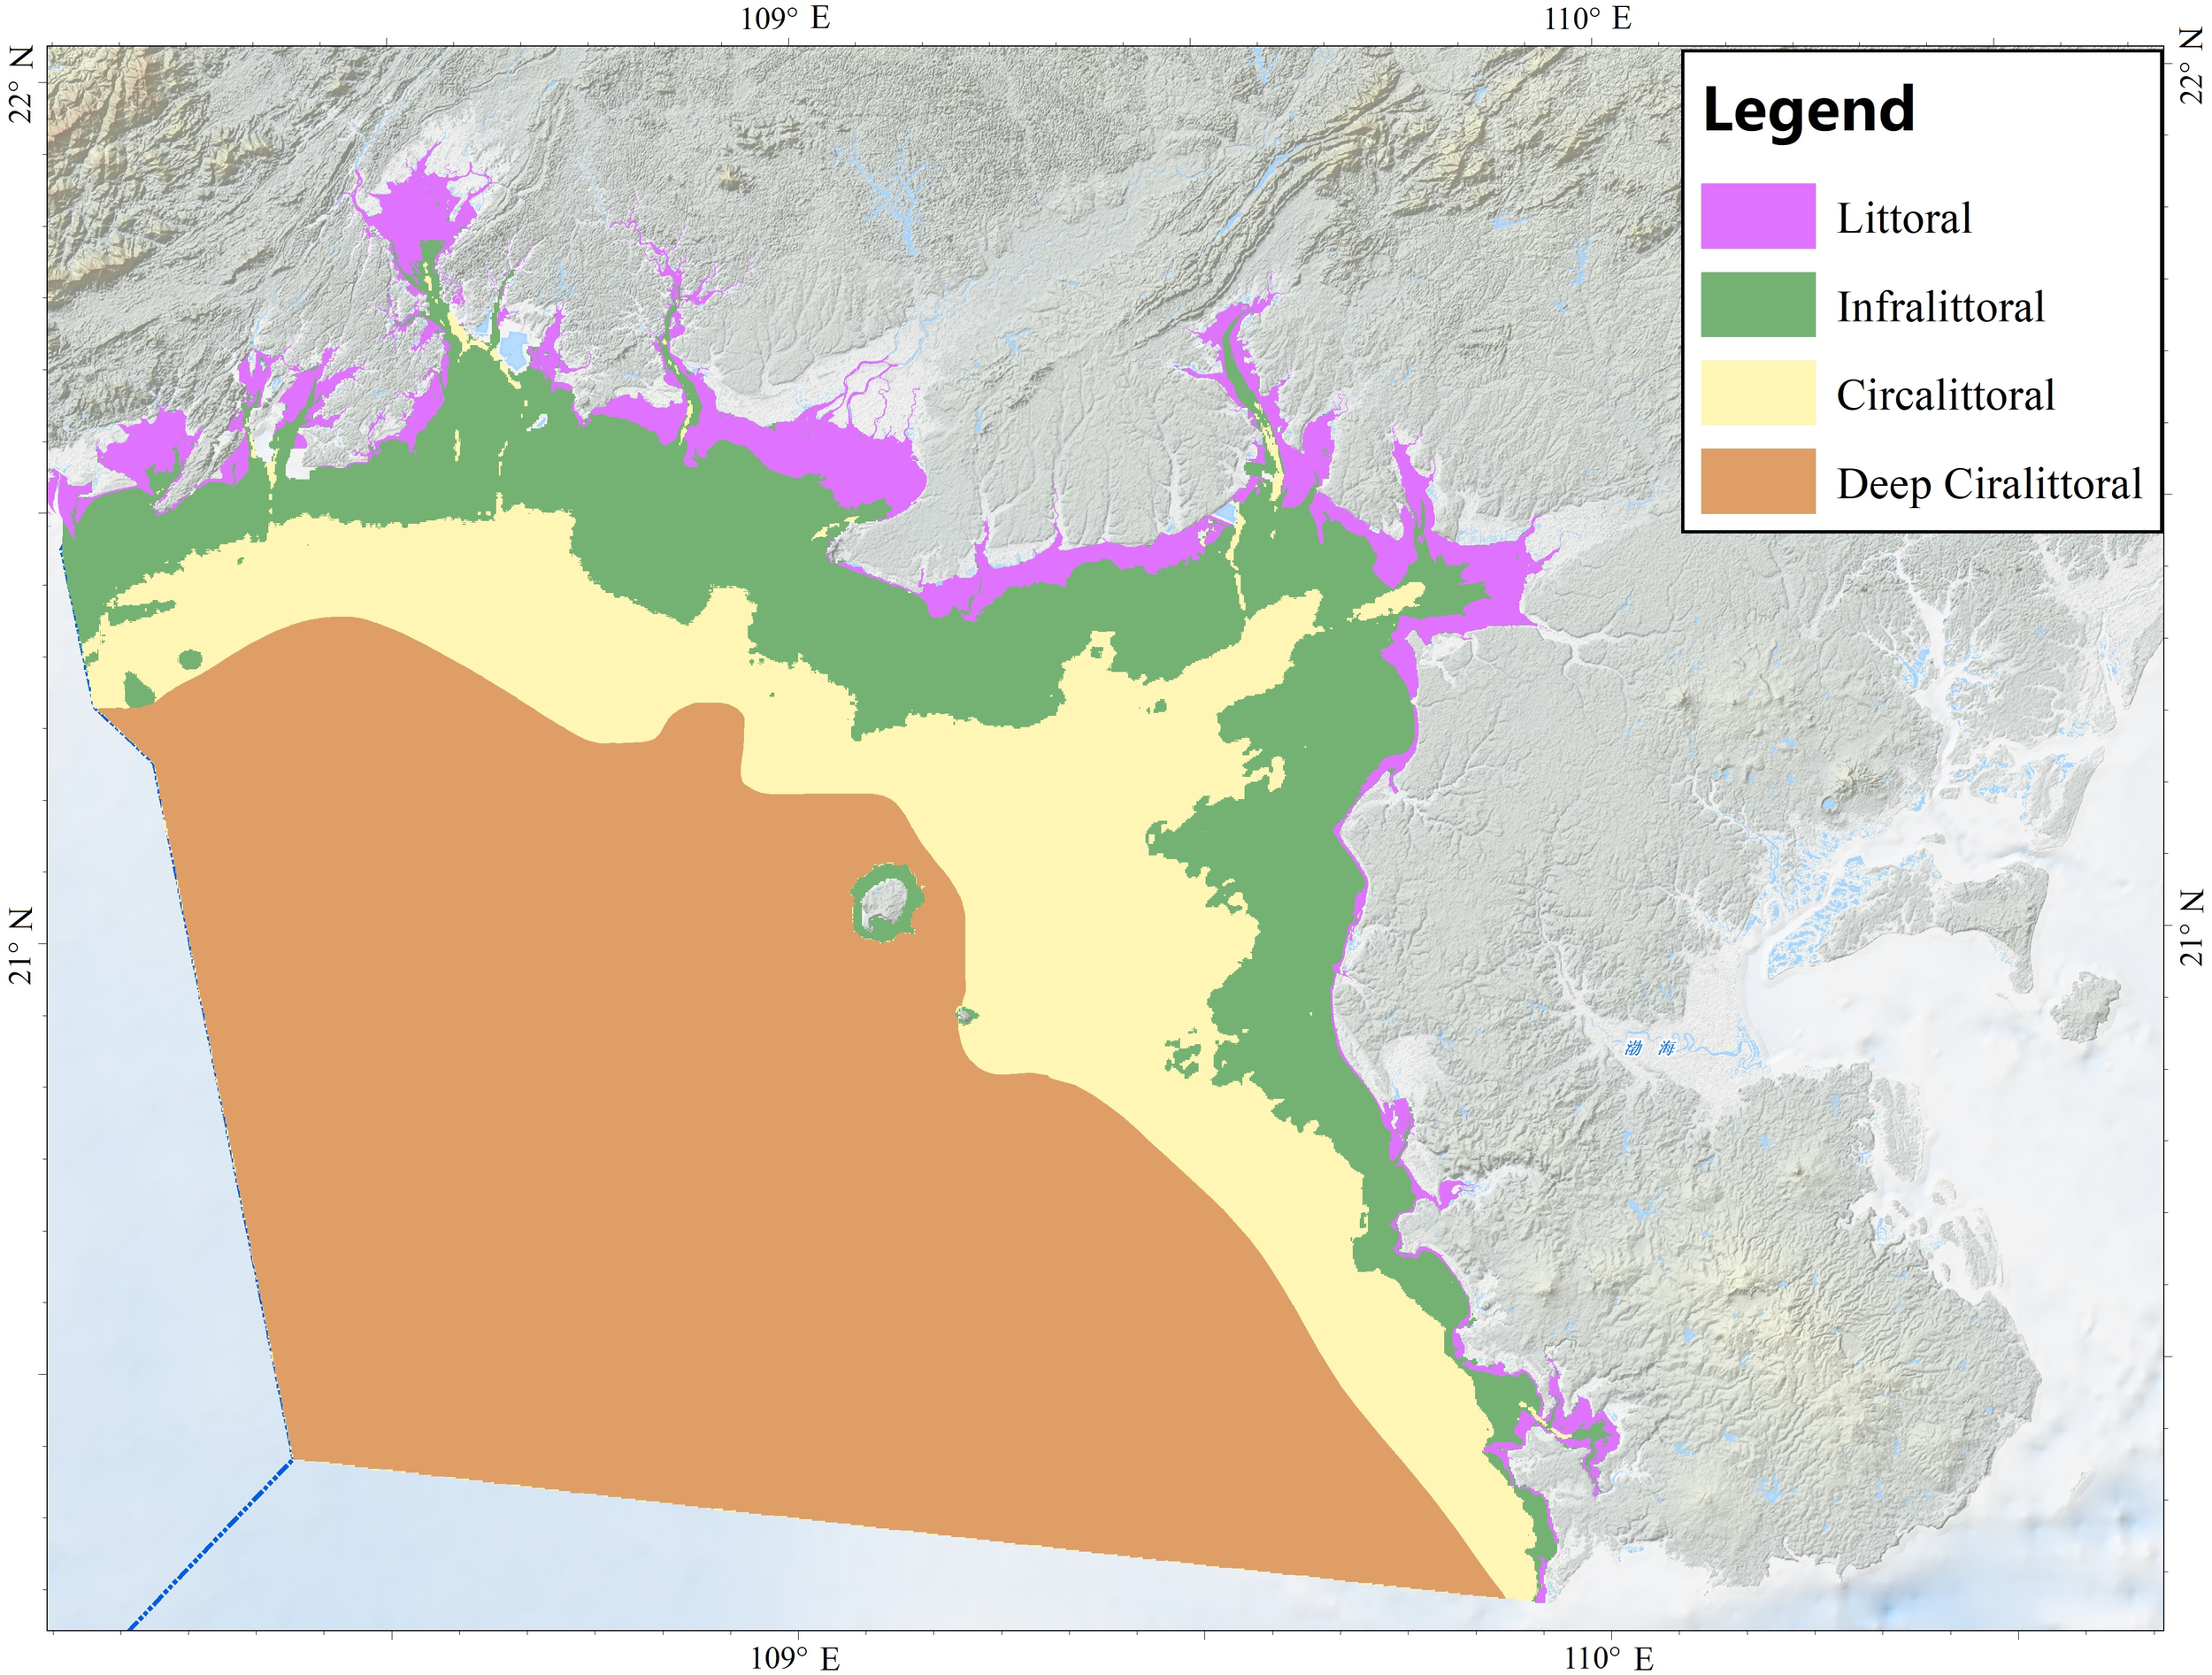
Map of biological zones.
The littoral zone corresponds to the area between mean high water spring tides and mean high water neap tides, approximately corresponding to the coastline - 0 m isobath on nautical charts. The infralittoral zone is defined as the seabed receiving ≥ 1% of surface irradiance, providing sufficient photosynthetically active radiation for t seagrasses and macroalgae; its lower boundary therefore marks the depth boundary of photophilic vegetation. The circalittoral zone extends from the base of the infralittoral to the wave base. i.e. the depth at which orbital motion no longer perturbs the seabed (theoretically depth ≈ ½ wavelength). This sector is characterized by sparse algal cover and the dominance of sciaphilic algae and sessile benthic fauna. Below the wave base lies the deep Circalittoral zone, where macrophytes disappear, temperature variability is minimal, and hydrodynamic energy is markedly reduced. Zone definitions follow Vasquez et al. (2015) and Populus et al. (2017). However, due to the unavailability of direct wave data, this study adopts a modified approach for delineating the boundary between the circalittoral and deep circalittoral zones. Specifically, the seaward edge of the subaqueous slope, as interpreted from existing geoform maps, is used as a proxy for the wave base.
A three-class confidence layer was produced (Figure 4). Confidence is generally high, decreases toward zone boundaries, and is intermediate within outer buffer areas. For the infralittoral–circalittoral interface, a fuzzy band of ± 0.9% around the Fr=1% irradiance threshold was delimited by expert judgement: cells within ± 0.2% were assigned low confidence (red), those between 0.2% and 0.6% moderate (yellow), and the remainder high (green). For the circalittoral–deep-circalittoral interface, a 2.5 km buffer–equivalent to the spacing of single beam survey lines–was centered on the slope line; the first 1 km band was labelled low confidence, the next 1 km moderate, and the outer remainder high.
Figure 4
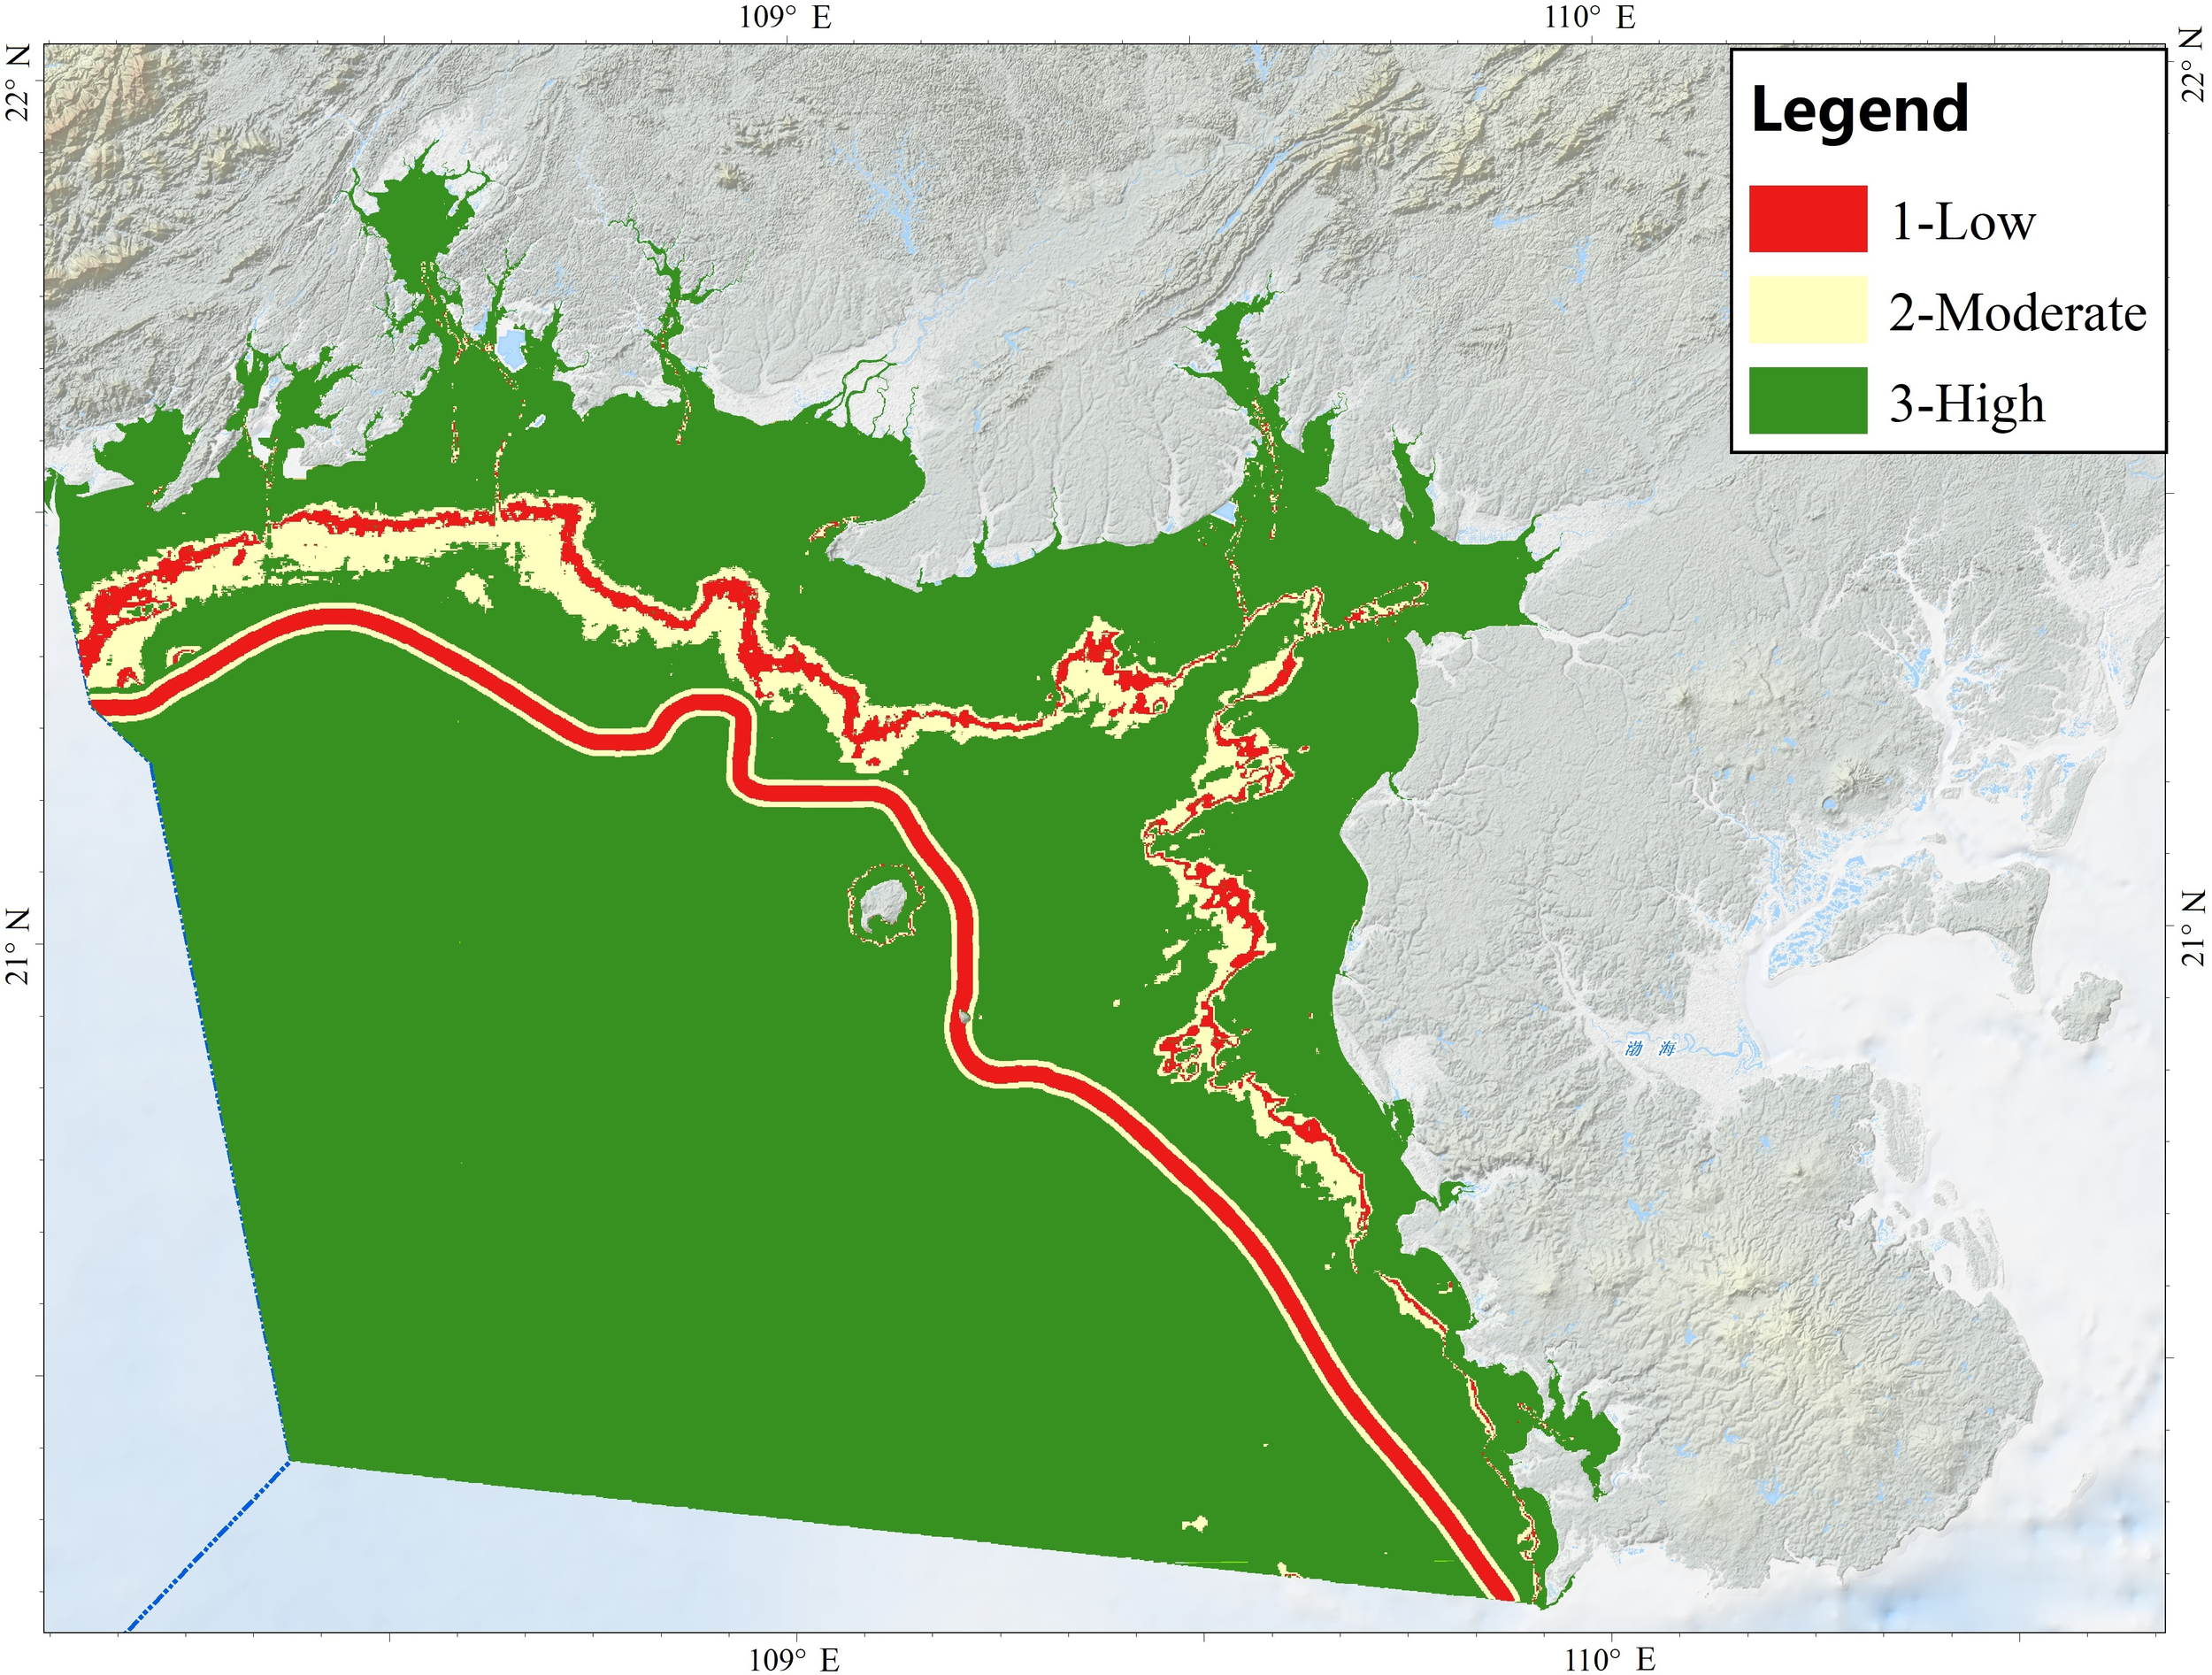
Confidence map of biological zones.
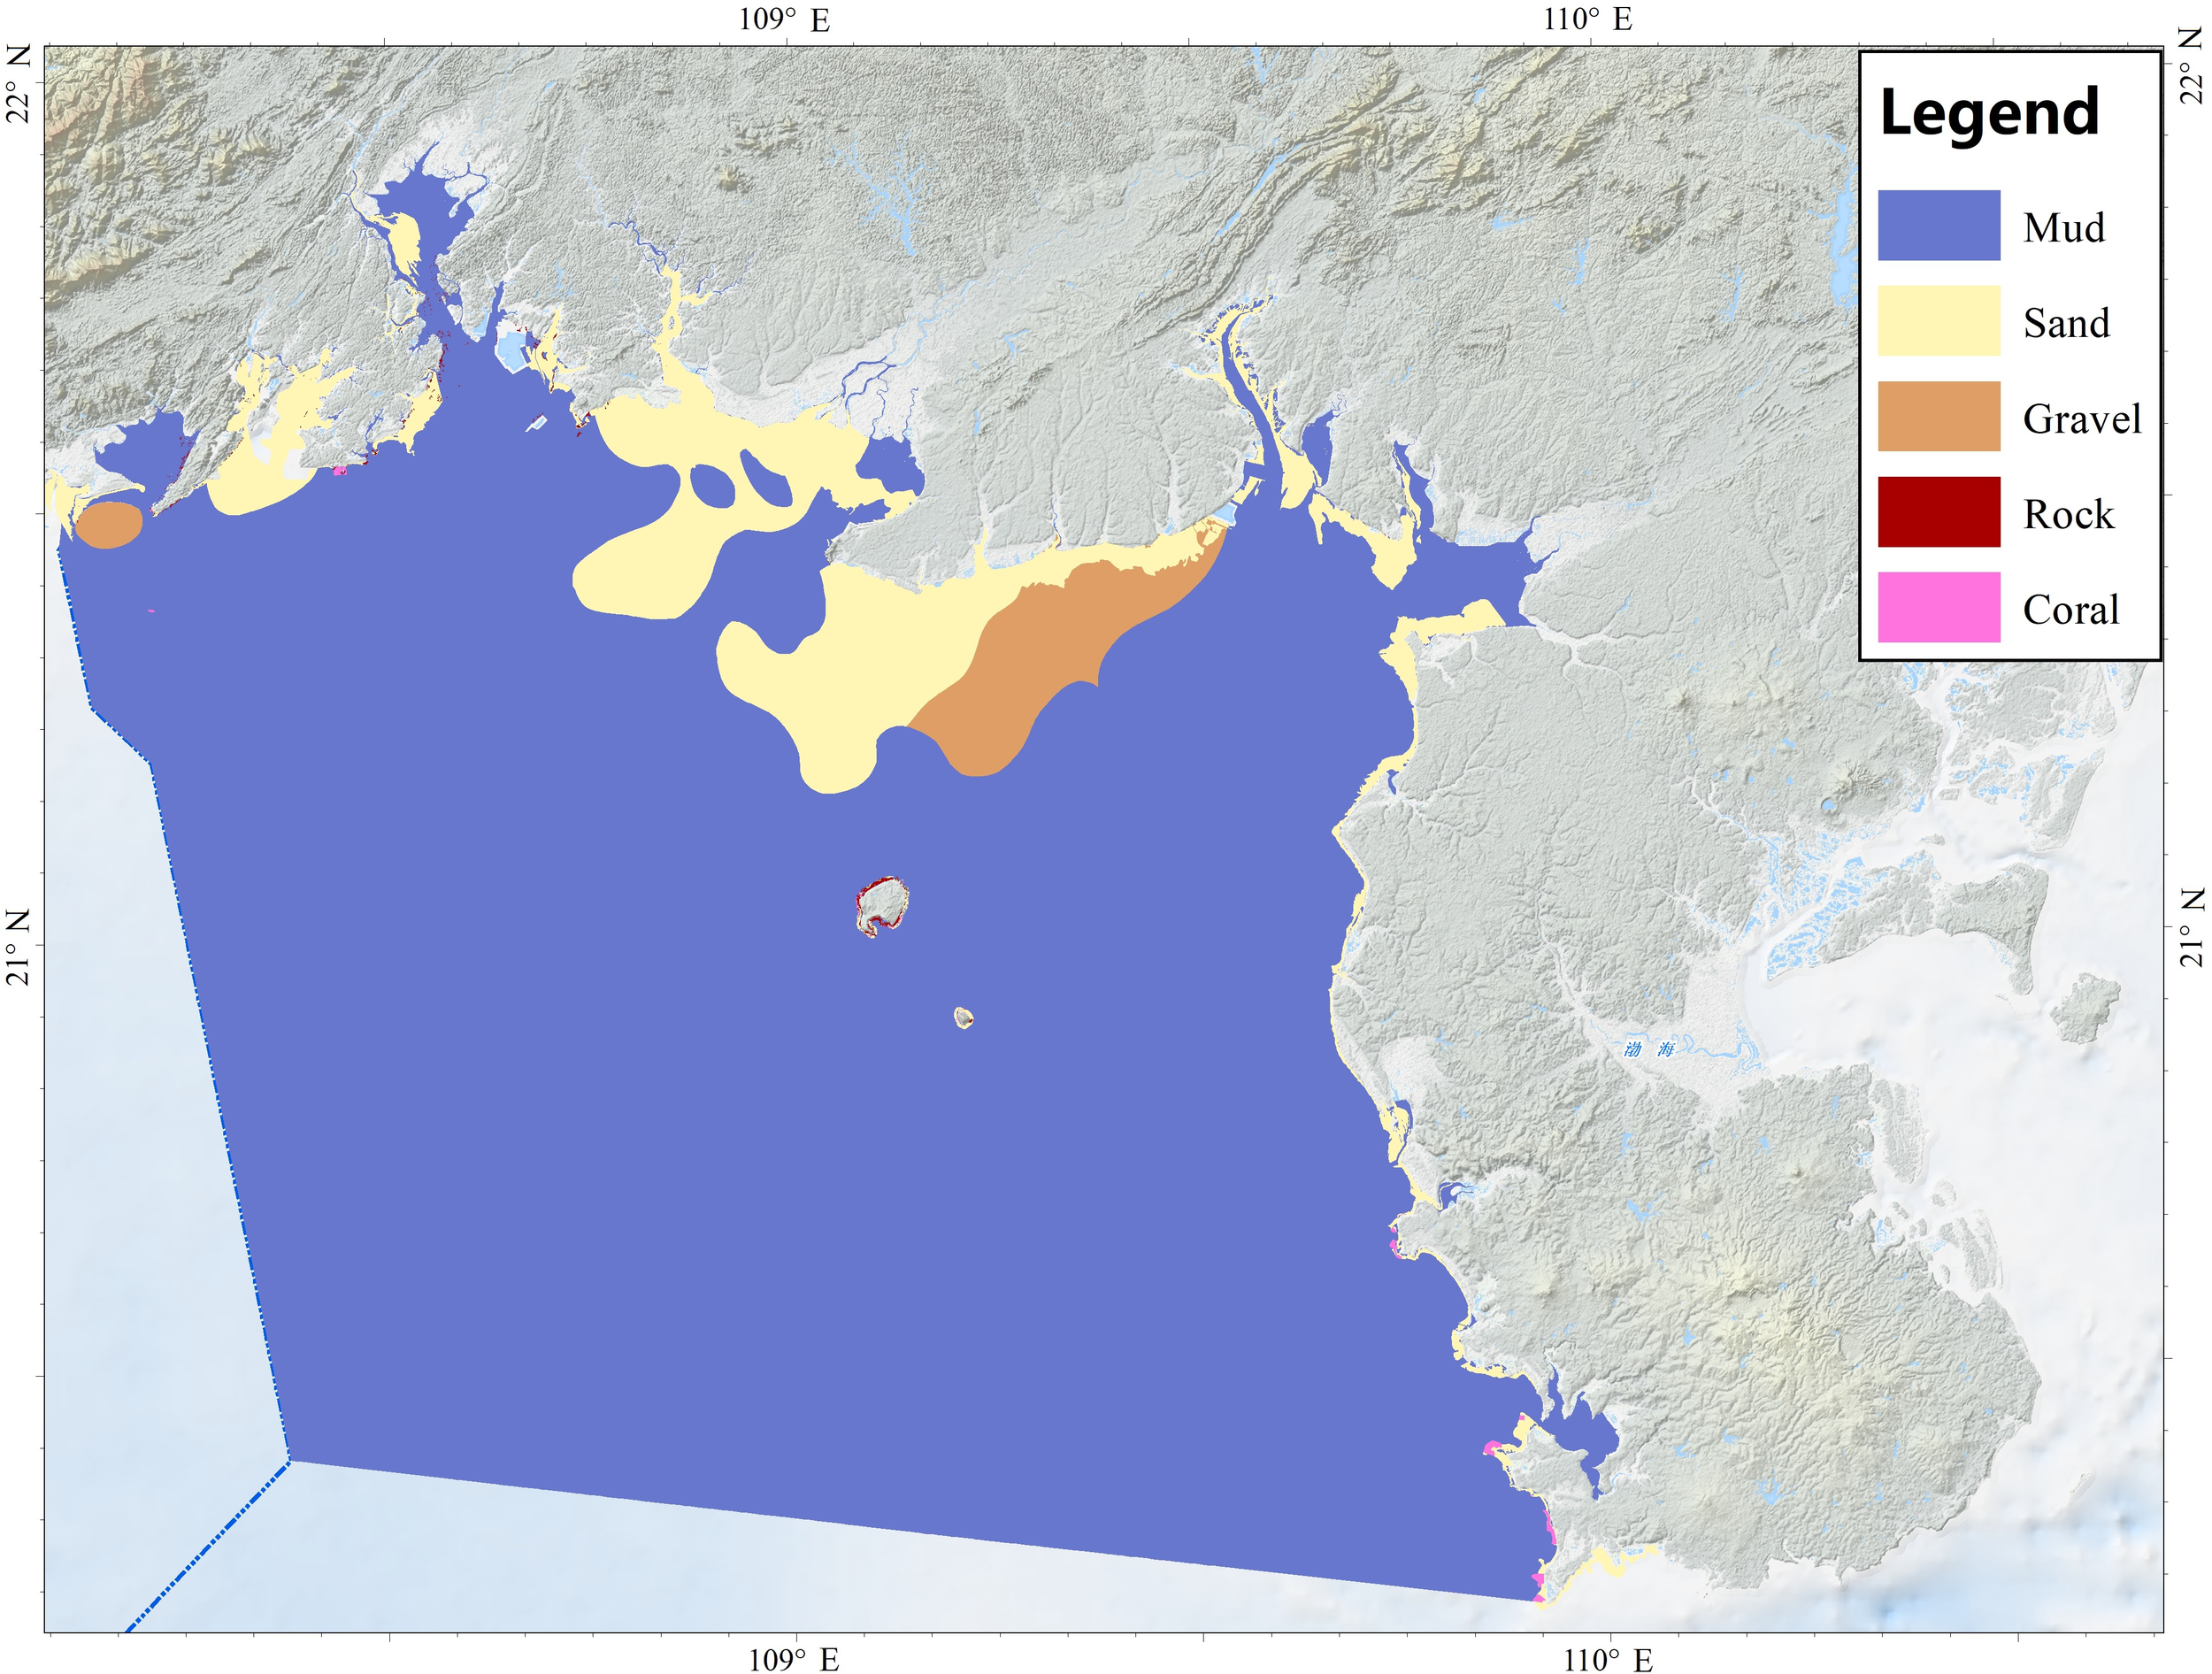
4.2 Classified substrate distribution
The substrate classification (Figure 5) indicates three unconsolidated substrates (gravel, sand and mud) and two hard substrates (rock and coral reef). Corroborating previous descriptions of the area’s characteristics (Fan et al., 2015; Ma et al., 2019; Xie et al., 2020). Mud dominates the seafloor, whereas sand occurs mainly in the nearshore regions of Fangchenggang and Beihai (Guangxi province). West of Beihai, the seabed grades from sand to gravel, and small gravel patches also occur in the northern sector of the study area. Rock and coral reefs are concentrated around Weizhou and Xieyang Islands, and along the Guangxi coast. Because hard substrate data are lacking for the subtidal zone, additional occurrences of rock and coral reef elsewhere cannot be cannot be excluded. The literature also reports oyster reefs in Qinzhou (TNC, 2022), but their spatial distribution data were not acquired in this study.
Figure 5
Substrate classification map of the Beibu Gulf.
The overall substrate assemblage resembles that depicted in the European broad-scale habitat map (EUSeaMap), comprising sedimentary, rocky and biogenic categories. Nevertheless, the two products differ in sediment classification. EUSeaMap derives classes from acoustic data interpreted with the Folk classification system, whose regional boundaries between mud and sand may deviate from local conditions and thus cause mismatches with national maps (Vasquez et al., 2023). Here, we applied the Shepard classification system directly to grab-sample data and converted the results through a class cross-walk, thereby reducing such inconsistencies.
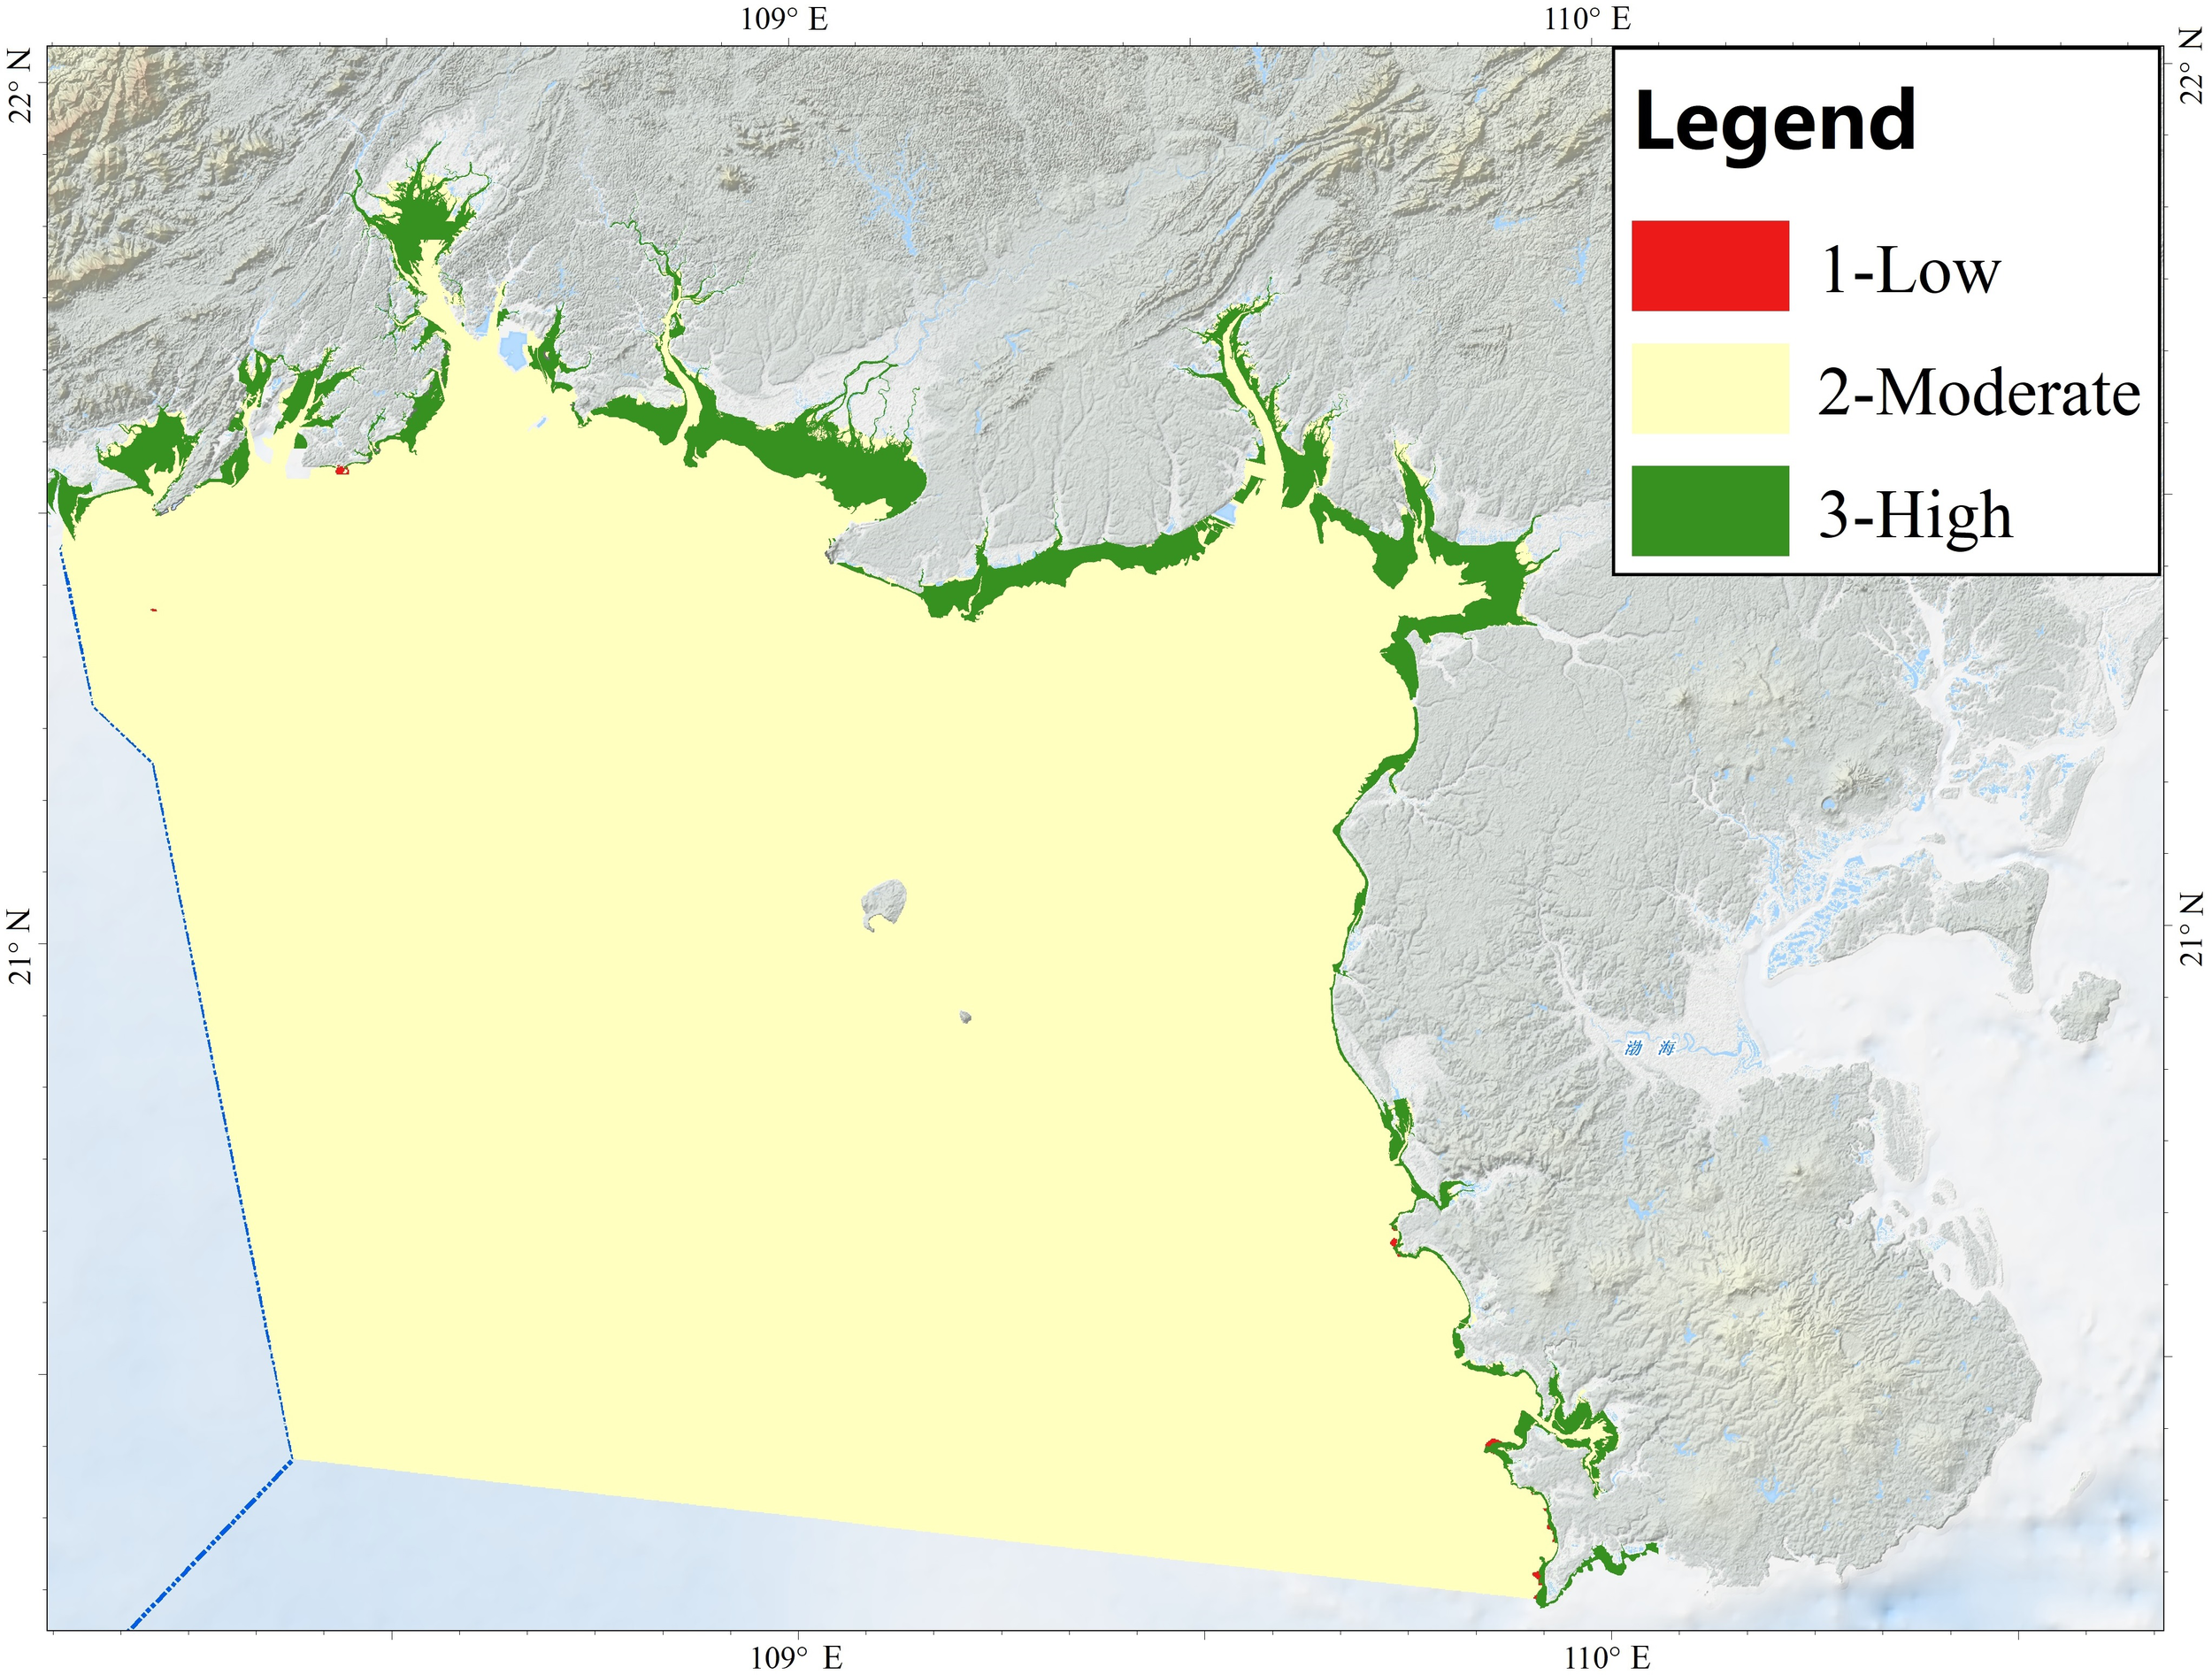
The confidence assessment of the substrate map (Figure 6) is predominantly moderate. Confidence is limited offshore because the map relies chiefly on dense point samples interpolated by spatial analysis without supporting acoustic data. Around the islands, interpretations from optical remote sensing, on-site verification is lacking. The substrate data in the littoral zone are interpreted from optical imagery lack in-situ validation and are therefore also rated moderate. In contrast, littoral sediments, extracted from optical imagery and ground-truthed in the field, attain high confidence. Confidence in the coral reef polygons in the southwestern and northeastern corners of the study area is remains because these boundaries are drawn from only a few diver observations.
Figure 6
Confidence map of substrate classification.
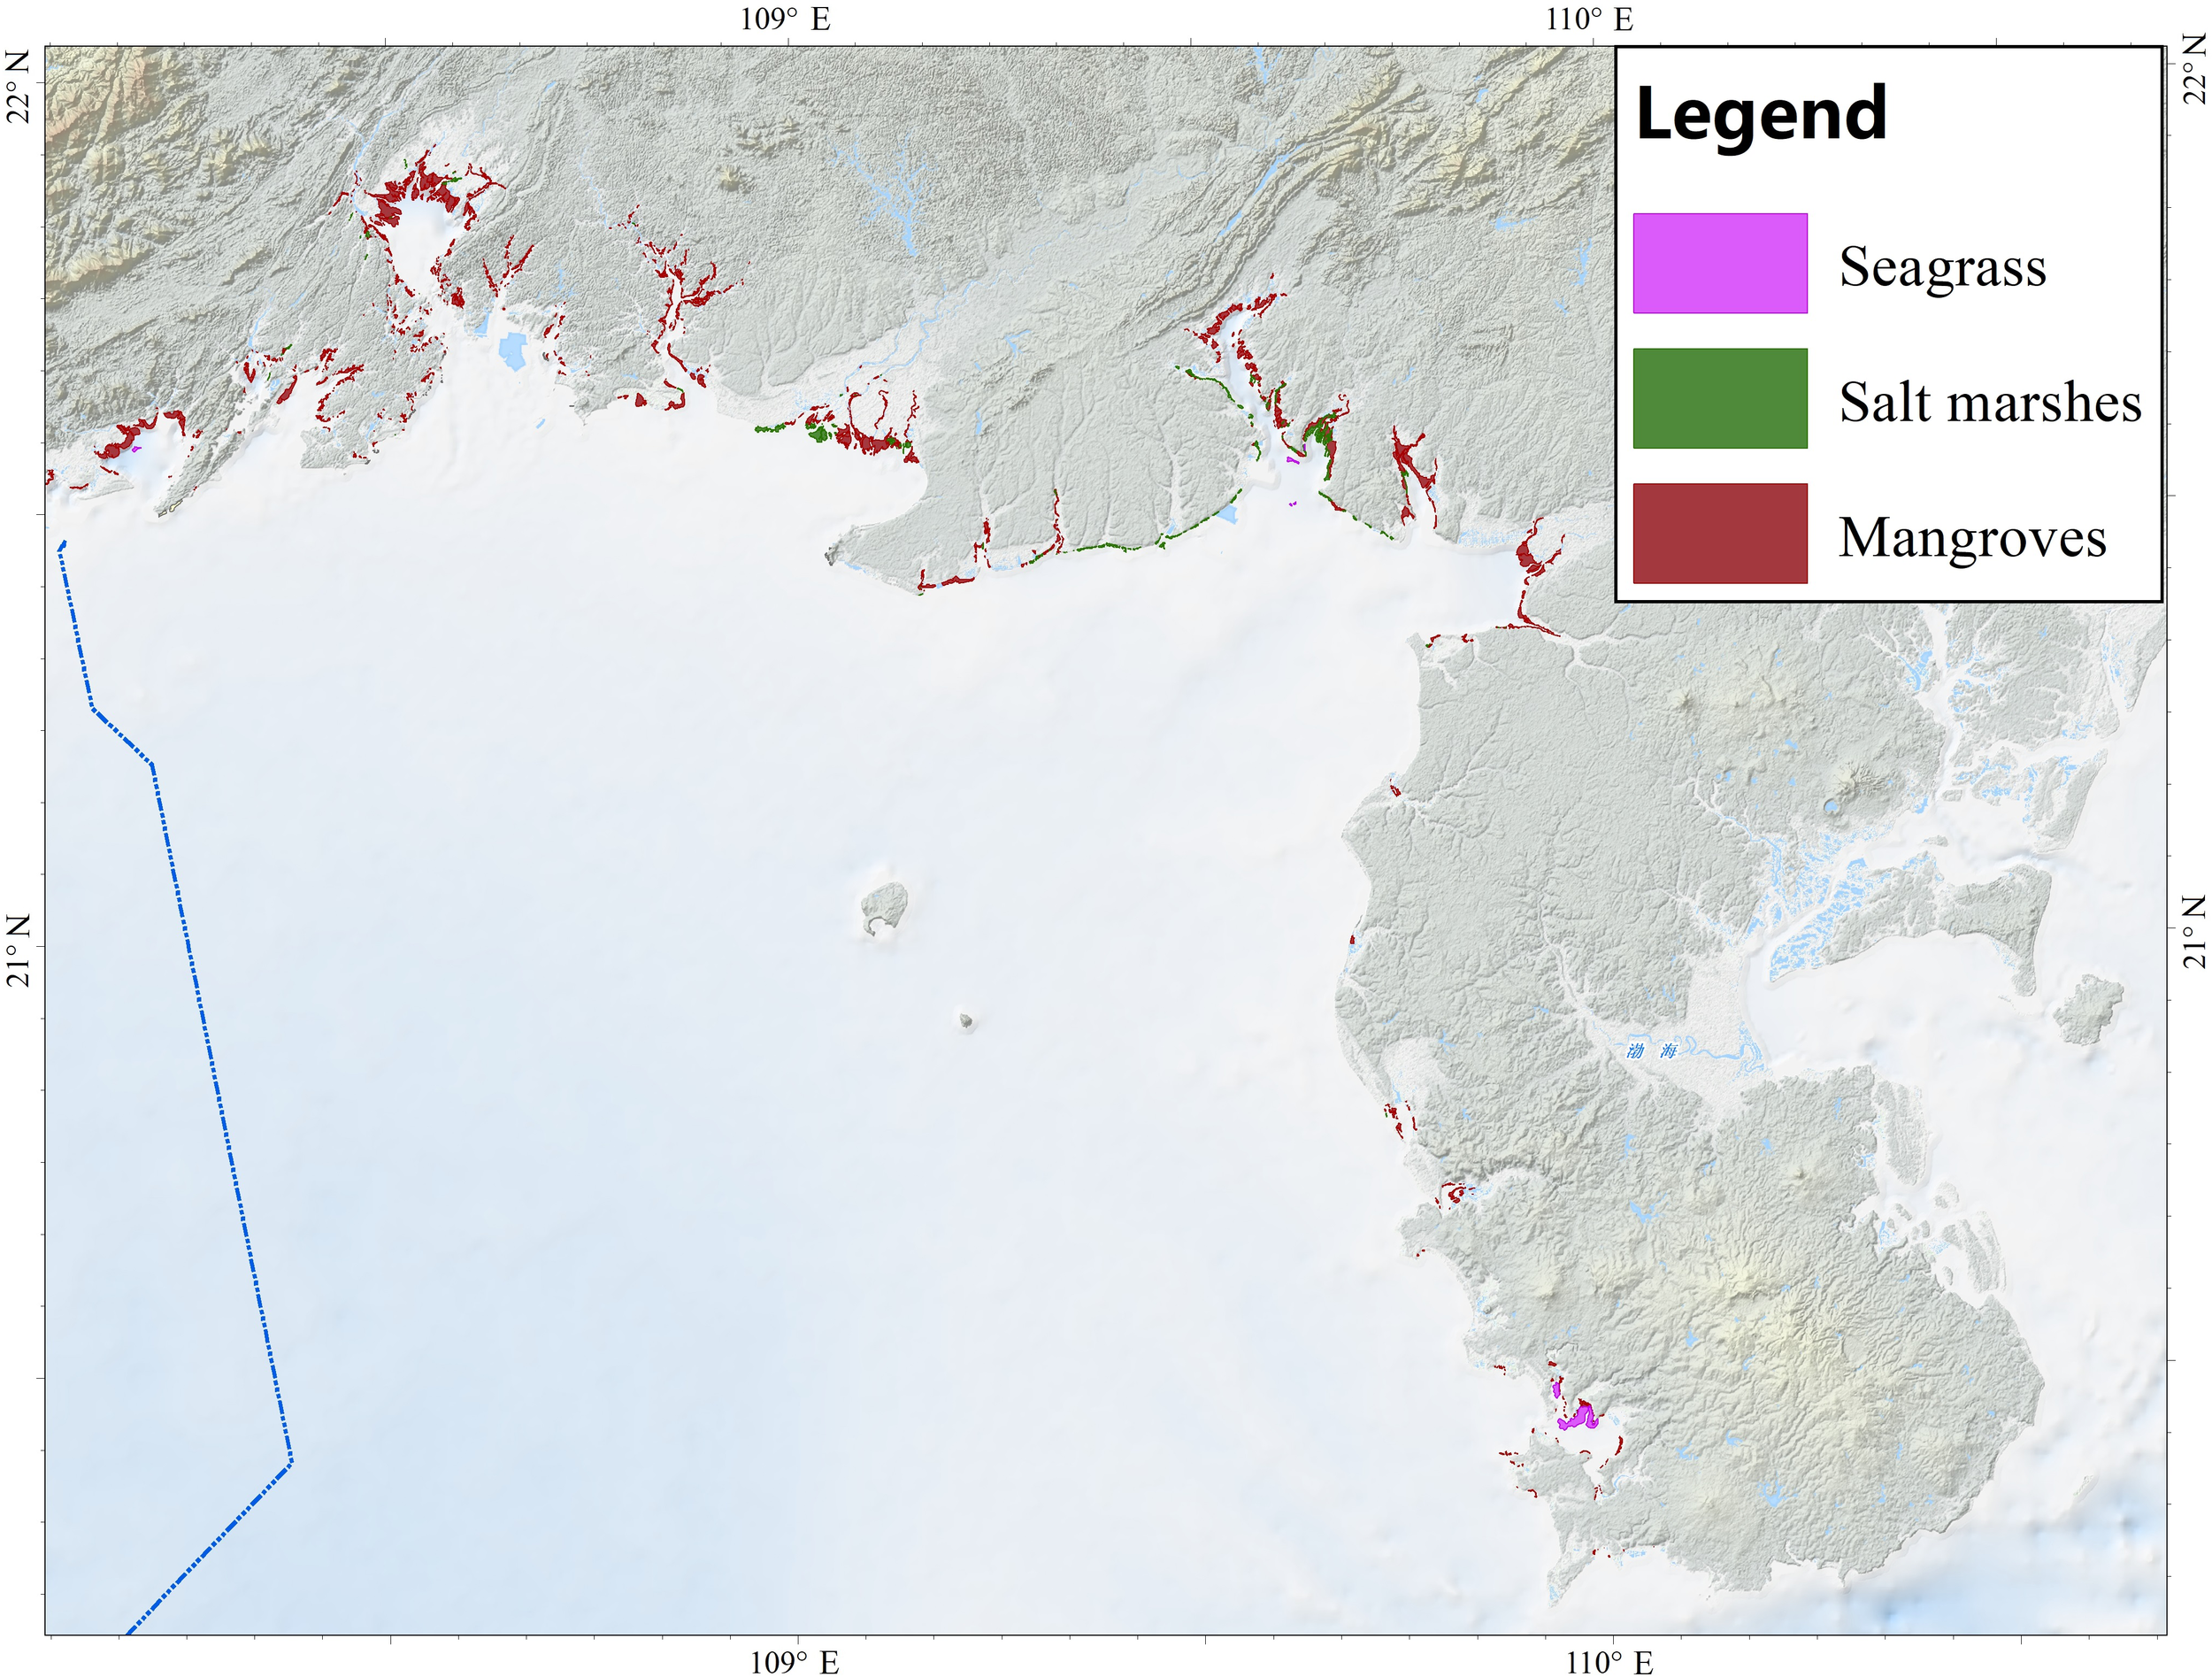
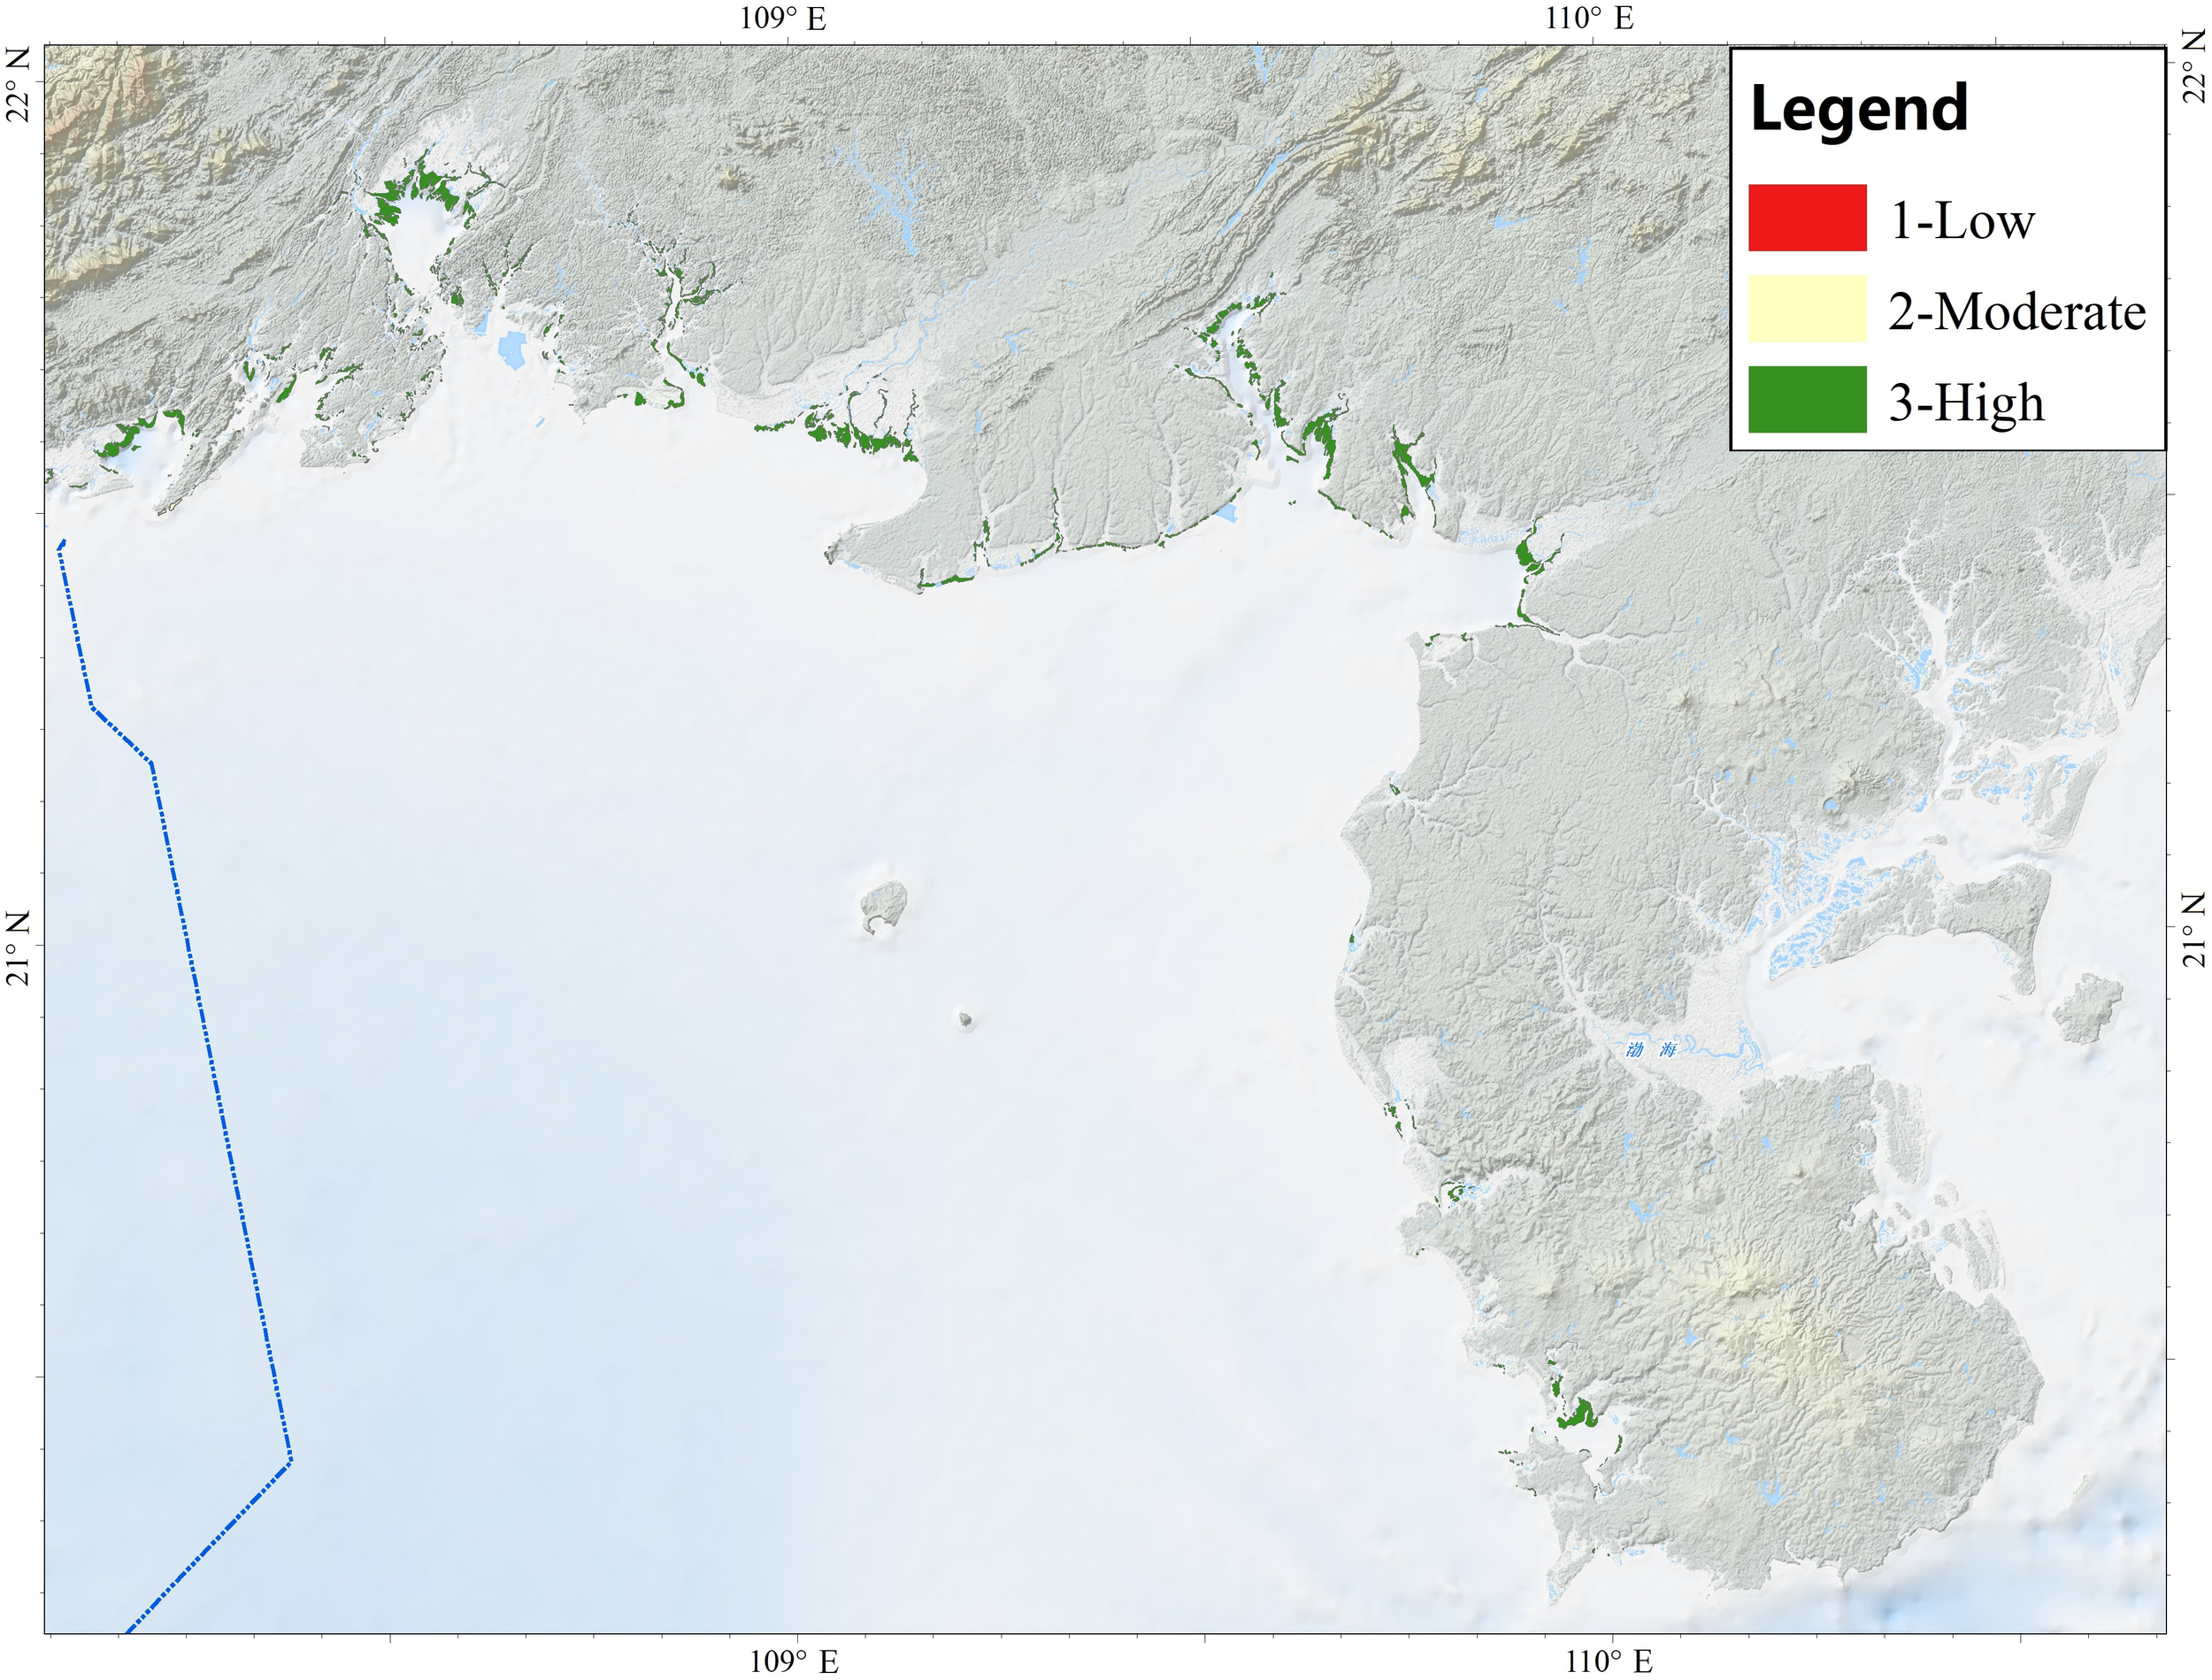
4.3 Vegetation distribution
Figure 7 depicts the spatial distribution of coastal vegetation in the study area, which comprises mangroves, salt marshes, and seagrass beds concentrated within the littoral zone. The confidence map (Figure 8) indicates that most of the records were derived from remote sensing identification followed by ground-truthing, and are therefore assigned a high confidence level. Seaweed beds have been documented off Xiniujiao Town (Qinzhou City) and the Bailong Peninsula (Fangchenggang City); Nevertheless, this study failed to acquire data on their spatial distribution. Likewise, although the benthic euphotic zone theoretically constitutes the principal habitat for vegetation such as seagrass and seaweed, no corresponding spatial distribution data obtained as well. Previous studies (Fan et al., 2015; Shi, 2002; Xie et al., 2020) documented the high vegetation diversity of the Beibu Gulf coast but were restricted to site-specific species inventories. This study overcomes that limitation by providing the region-wide map of coastal vegetation for the area.
Figure 7
Vegetation distribution map of the Beibu Gulf.
Figure 8
Confidence map of vegetation classification.
4.4 The seabed habitat distribution
By integrating the biological zones layer with the classified substrate layer, 19 habitat classes were delineated within the study area (Figure 9; Table 1). Most of the mapped area received moderate confidence scores; confidence was low along zone boundaries and transition areas, and high within the littoral zone (Figure 10). Eight habitat types were identified in the littoral zone, five in the infralittoral zone and five in the circalittoral zone, whereas only a single type in the deep circalittoral zone. Deep circalittoral mud accounts for more than half of the total extent (55%), followed by circalittoral mud (19%) and infralittoral mud (14%). Littoral sand (4%), infralittoral sand (3%), infralittoral gravel (2%) and littoral mud (2%) occupy comparatively small proportions, while all remaining classes, such as littoral mangroves, each cover ≤1% of the study area.
Figure 9
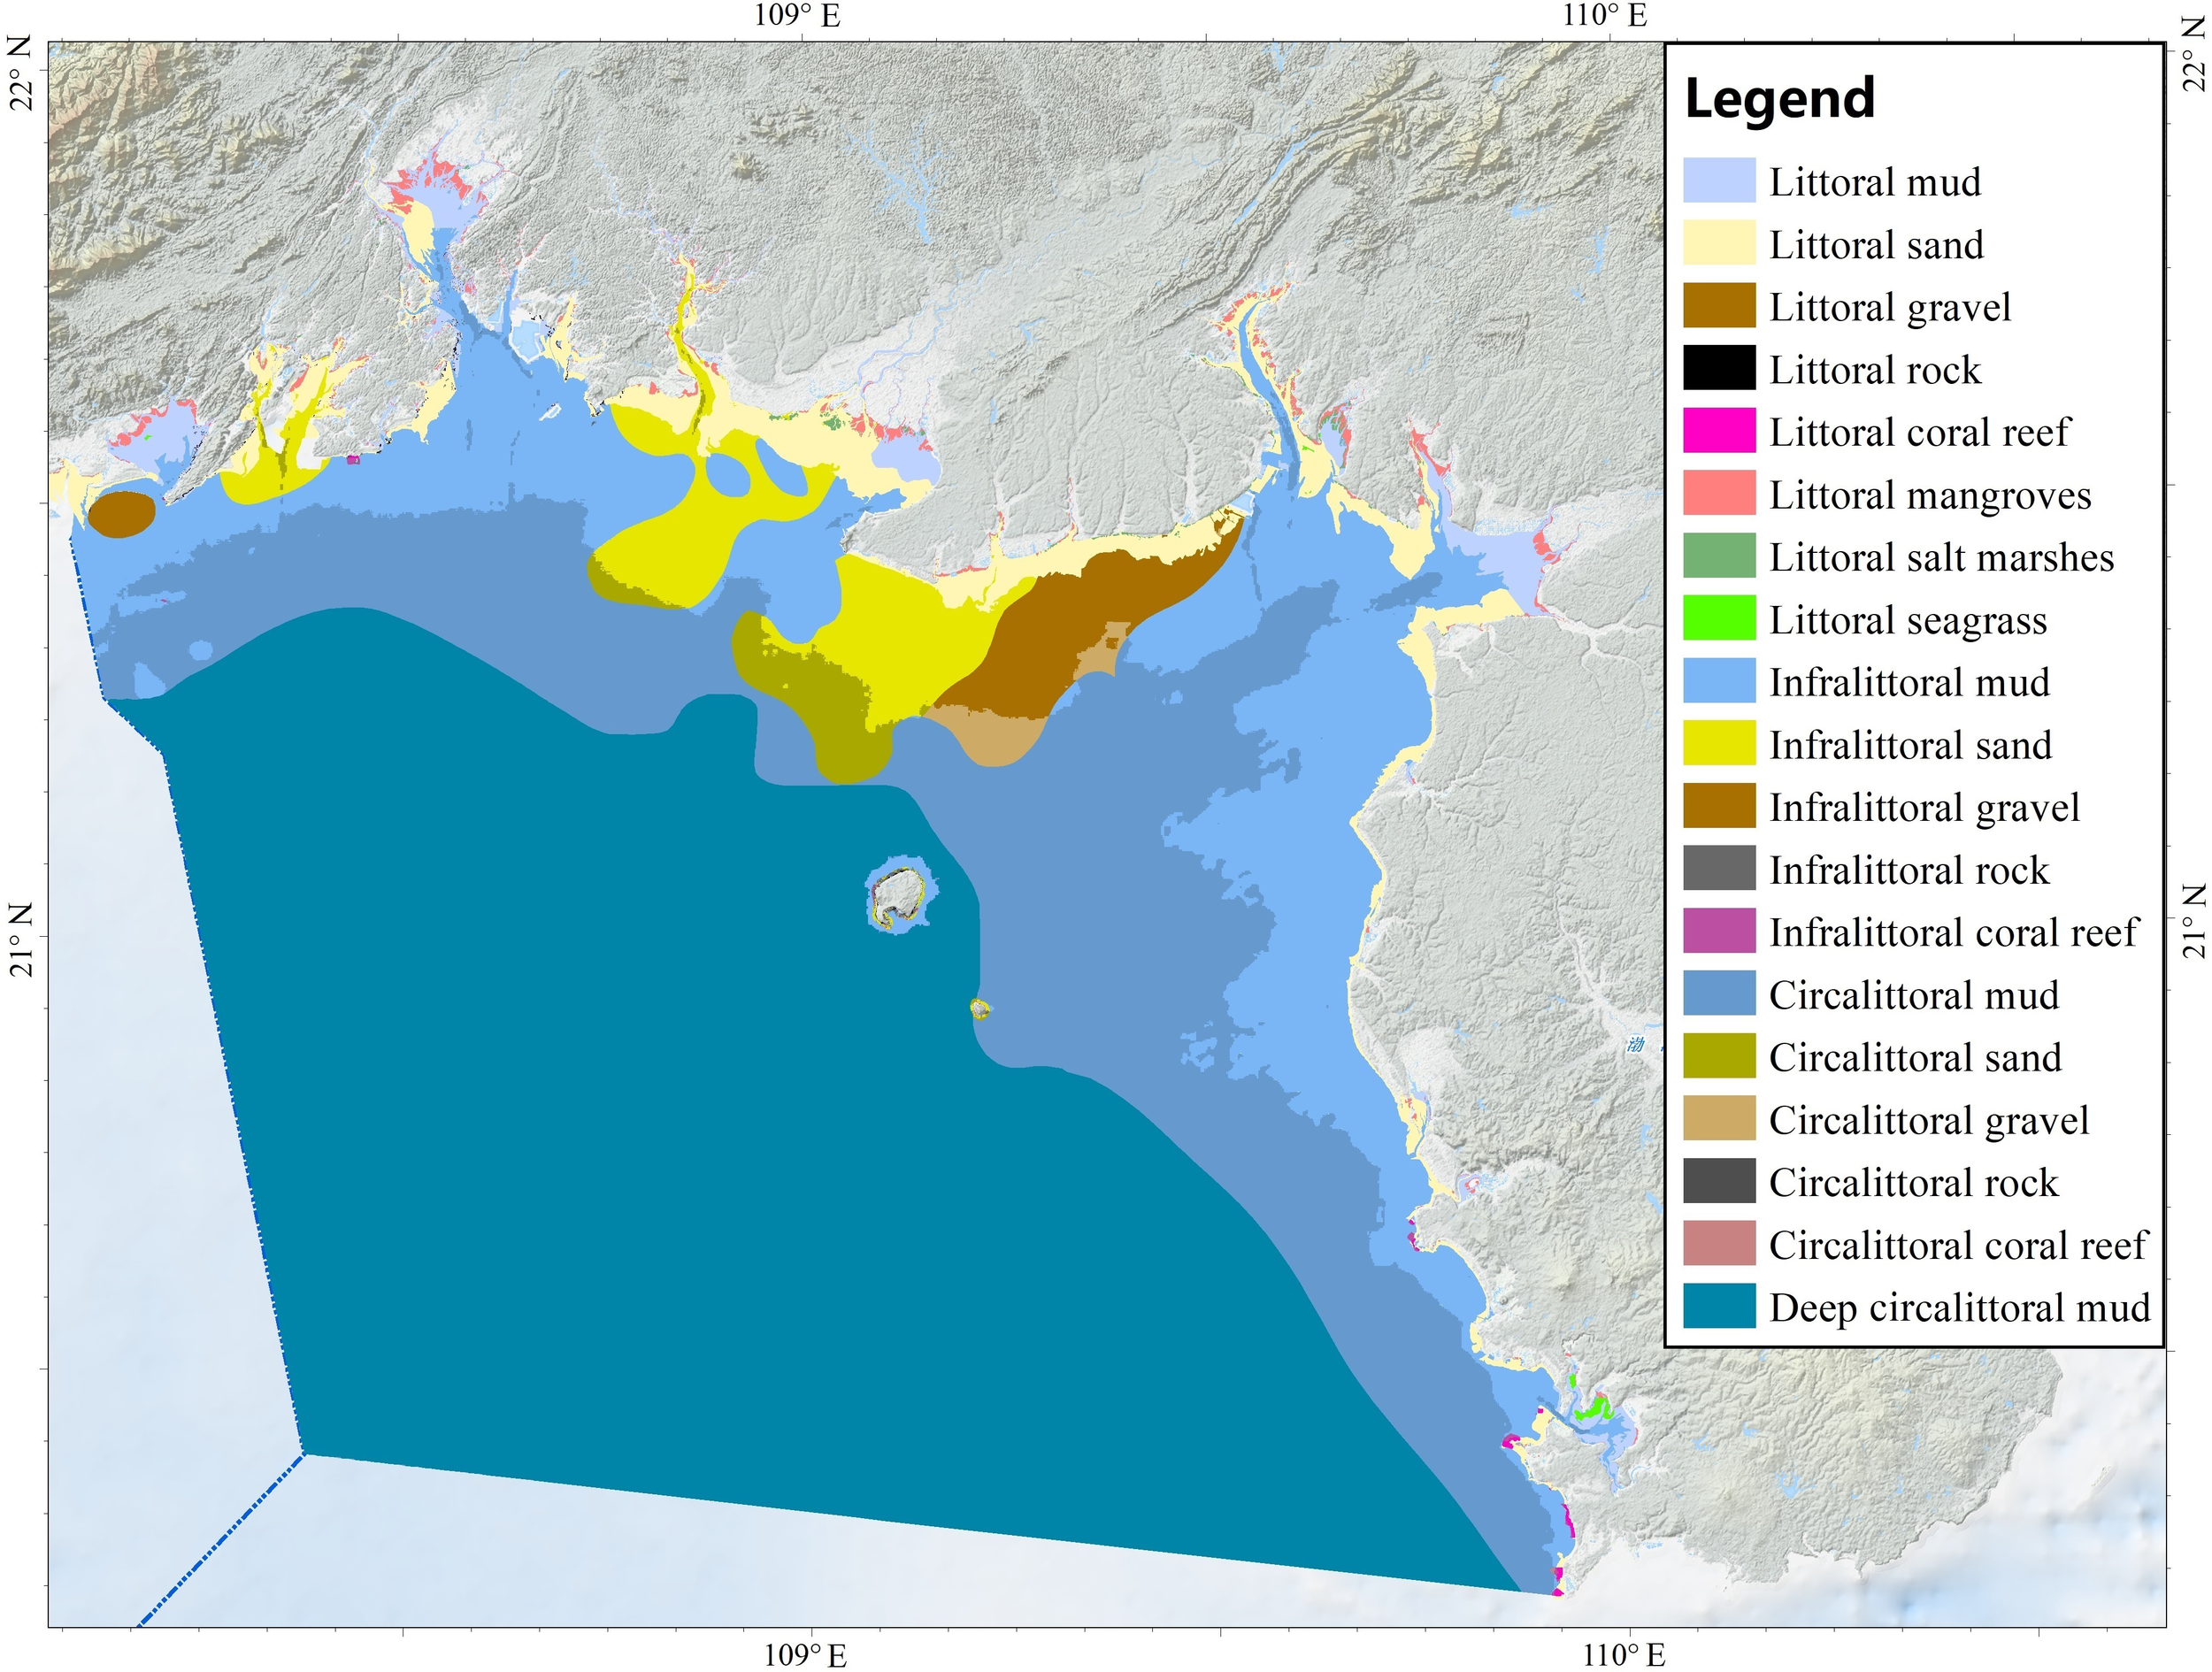
Habitats distribution map of the Beibu Gulf.
Table 1
| No. | Habitat Class | Predicted area coverage (km2) | % of study area represented |
|---|---|---|---|
| Littoral total | 1367 | 6% | |
| 1 | Littoral mud | 370 | 2% |
| 2 | Littoral sand | 836 | 4% |
| 3 | Littoral gravel | 2 | <1% |
| 4 | Littoral rock | 6 | <1% |
| 5 | Littoral coral reef | 7 | <1% |
| 6 | Littoral mangroves | 123 | 1% |
| 7 | Littoral salt marshes | 16 | <1% |
| 8 | Littoral seagrass | 8 | <1% |
| Infralittoral total | 4184 | 19% | |
| 9 | Infralittoral mud | 3059 | 14% |
| 10 | Infralittoral sand | 728 | 3% |
| 11 | Infralittoral gravel | 384 | 2% |
| 12 | Infralittoral rock | 7 | 0% |
| 13 | Infralittoral coral reef | 6 | 0% |
| Circalittoral total | 4620 | 21% | |
| 14 | Circalittoral mud | 4289 | 19% |
| 15 | Circalittoral sand | 234 | 1% |
| 16 | Circalittoral gravel | 96 | <1% |
| 17 | Circalittoral rock | <1 | <1% |
| 18 | Circalittoral coral reef | <1 | <1% |
| Deep circalittoral total | 12224 | 55% | |
| 19 | Deep circalittoral mud | 12224 | 55% |
Area and proportional coverage of habitat classes.
Figure 10
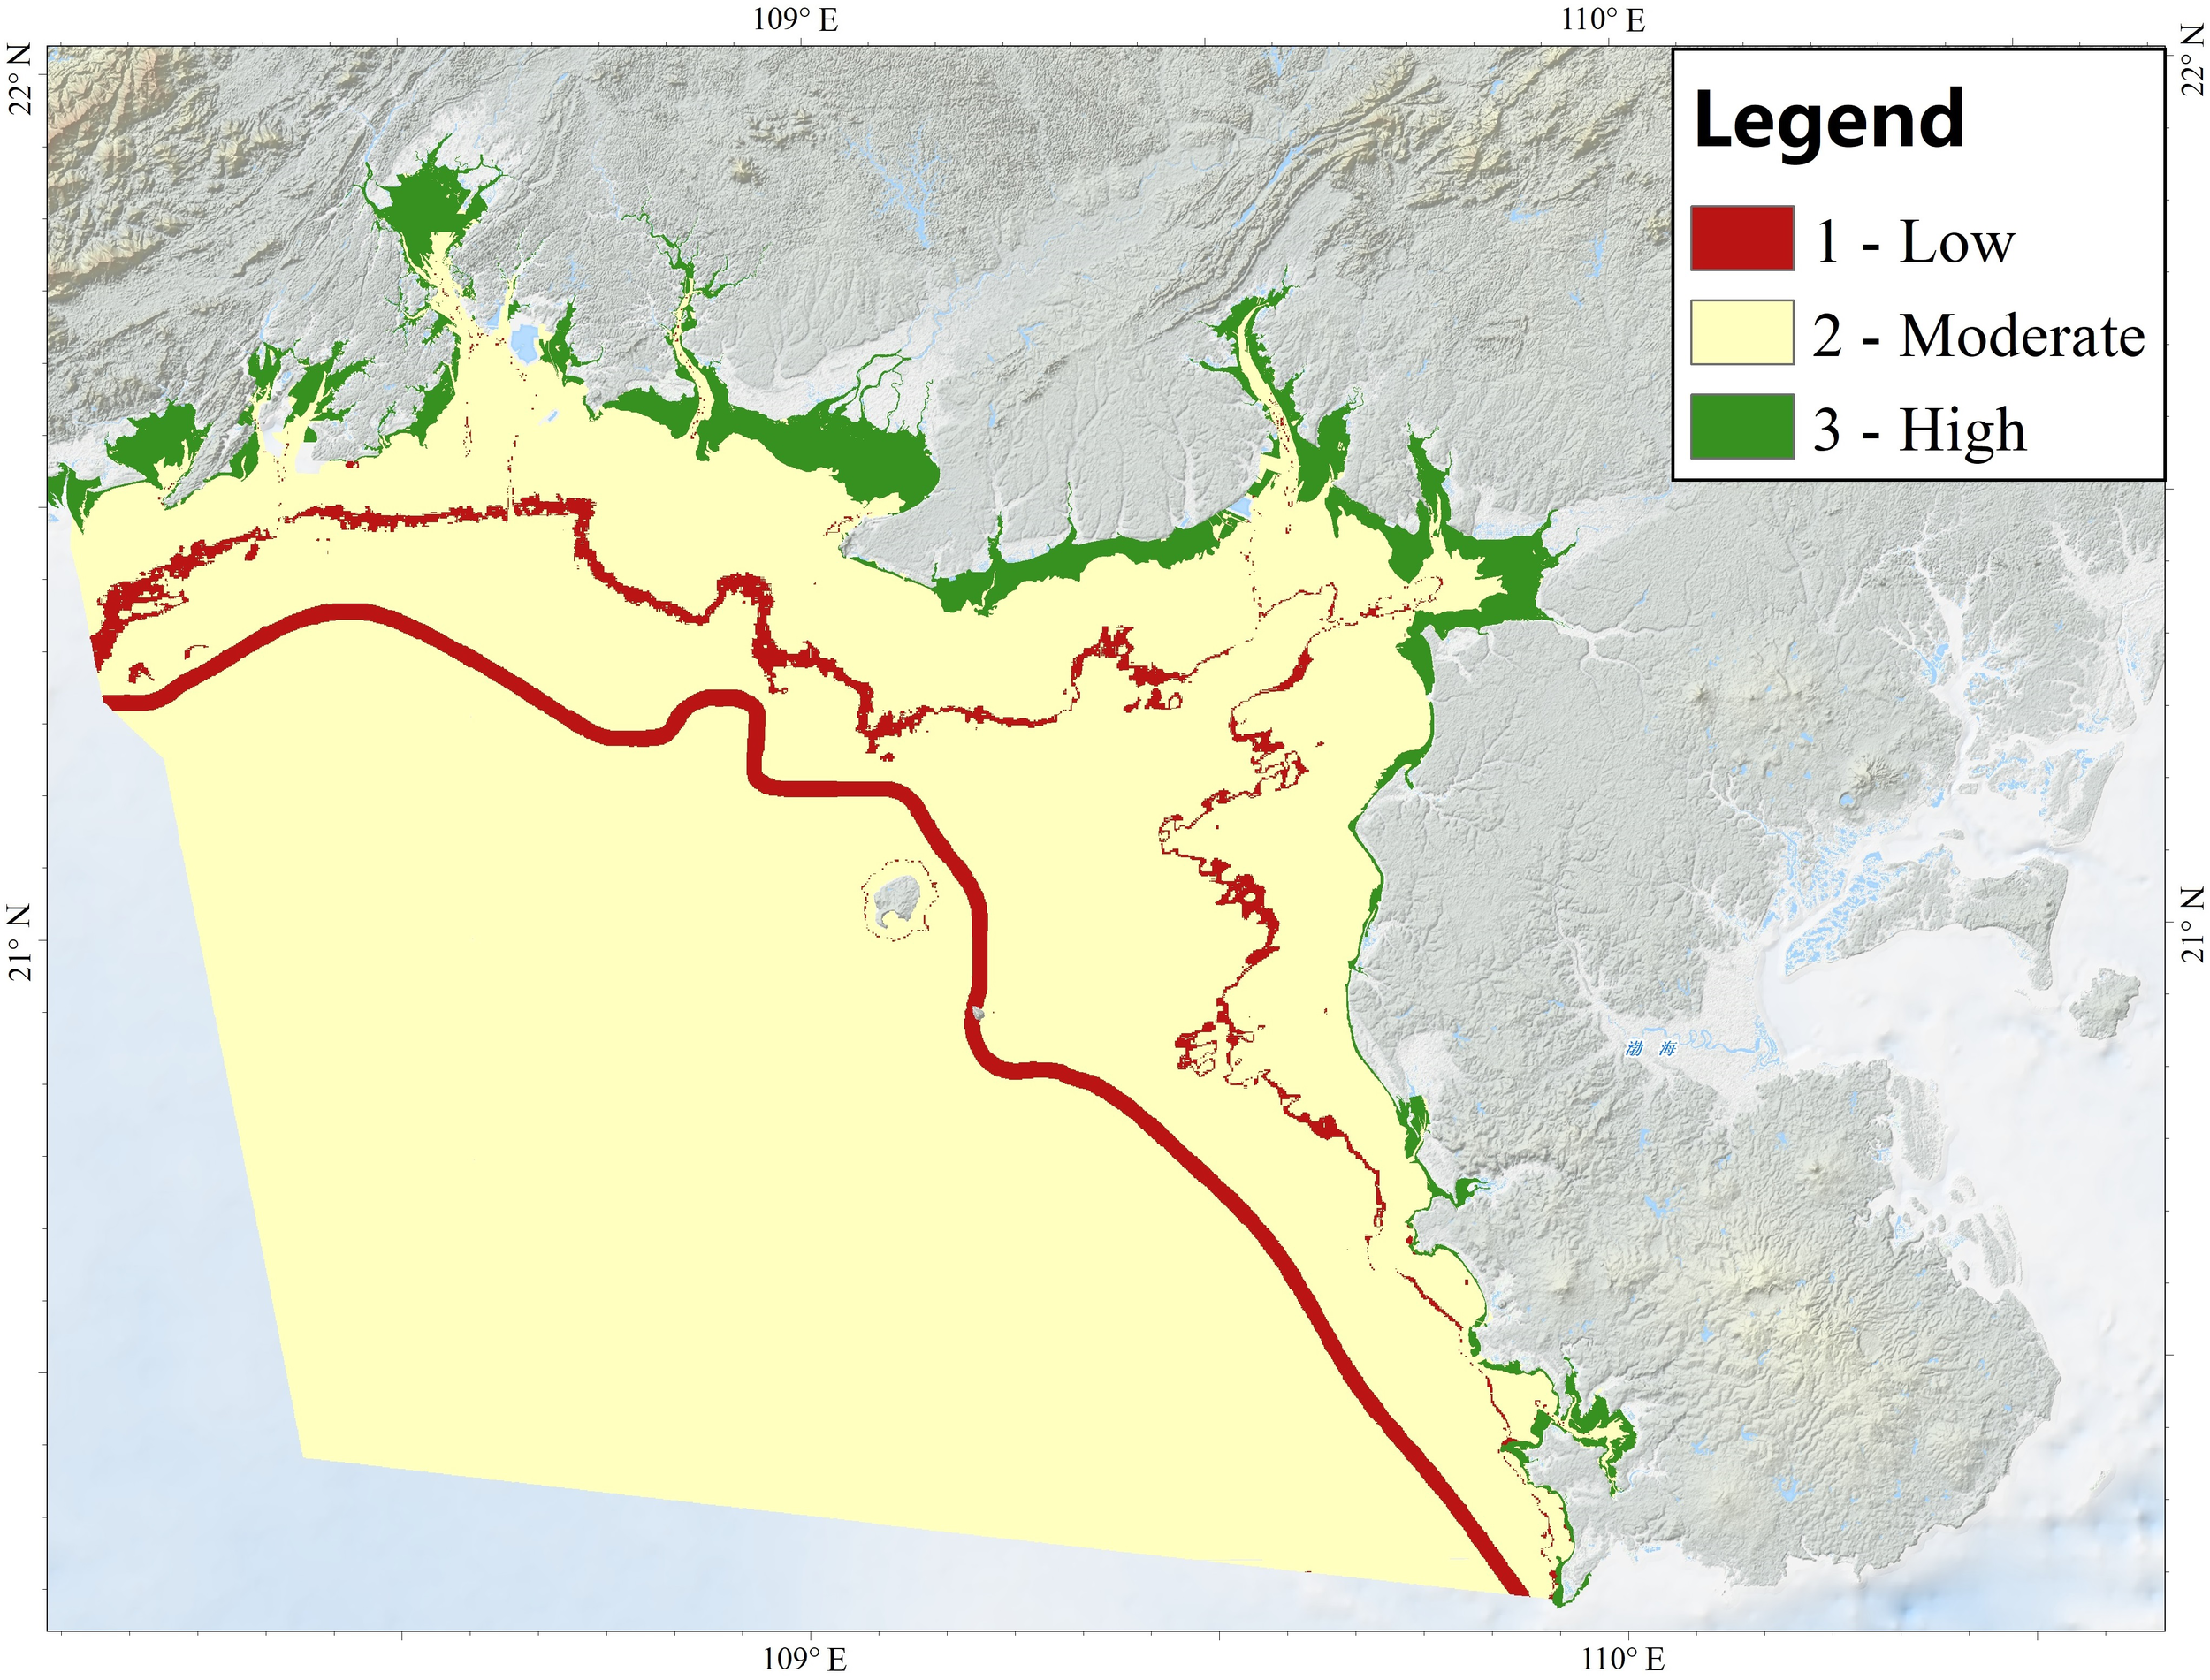
Confidence map of habitat classification.
Existing data indicate that mangroves, salt marshes and seagrass beds are confined to littoral zone, collectively covering approximately 148 km2 with high confidence. Mangroves extent is relatively stable, whereas salt marshes and seagrass beds cover exhibit pronounced seasonal variability driven by phenology. Rocky substrates occur within the littoral, infralittoral, and circalittoral zones, covering approximately 13 km2 and supply hard surfaces for seaweed and benthic animals. This estimate is likely conservative because acoustic remote sensing techniques capable of detecting rocky substrates have not yet been applied in the region. Coral reefs distribution (totaling 12 km2), derived by integrating the Allen Coral Atlas with data from the China Coral Reef Survey. All identified reef habitats occur within the coastal zone, consistent with the light requirements of most coral species.
In contrast to the European Broad-scale Seabed Habitat Map (Vasquez et al., 2023), which primarily covers habitats from the sublittoral to bathyal zones, our map extends the landward boundary to include the anthropogenically influenced intertidal zone and its vegetated habitats within a unified framework. For the first time, our research systematically characterizes the spatial gradient differentiation of marine habitats along the land-to-sea continuum in the Beibu Gulf, revealing ecological continuity from intertidal mangrove-salt marsh complexes to deep circalittoral mud-dominated zones. These innovative results not only provide spatial data foundations for ecosystem service assessments (e.g., blue carbon stock evaluations, priority area identification for biodiversity conservation) but also offer scientific support for coastal ecological protection and resource management policies.
4.5 The importance of marine habitat mapping
Marine habitat maps are essential tools for ecosystem-based management (EBM) and have been widely applied in various domains, including ecosystem risk assessments (Obura et al., 2021), evaluations of habitat importance and the development of Red Lists (Gubbay et al., 2016), blue carbon stock accounting (Porter et al., 2020), environmental impact assessments for infrastructure projects (RPS group, 2018), and decision-making related to marine development and conservation (Conley et al., 2017). In addition, the habitat map generated in this study provides spatial distribution data of marine habitats in the Beibu Gulf, supporting local ecosystem conservation efforts and assessments of climate change impacts. By identifying existing data gaps, the map can guide future ecological surveys—for instance, subtidal seaweed beds can be targeted based on suitable conditions, such as infralittoral rock areas, as defined by the Ministry of Natural Resources (MNR (Ministry of Natural Resources of the People's Republic of China), 2021). Furthermore, regional assessments and delineation of ecologically important habitats offer a scientific basis for the planning and adjustment of Marine Protected Areas (MPAs) and Marine Ecological Red Lines (MERLs) in the region (Zeng et al., 2024), thereby advancing ecosystem-based marine management by clarifying conservation zones and specifying permitted and prohibited human activities.
5 Conclusion
This study developed a novel fusion framework for multi-source, multi-temporal, and multi-disciplinary data (bathymetry, optics, substrates, geoform, and vegetation) to create the first large-scale benthic habitat distribution map of the Beibu Gulf, China. The results identified 19 habitat types, including eight littoral, five infralittoral, five circalittoral, and one deep circalittoral habitat, with dominant types (deep circalittoral mud, circalittoral mud, and infralittoral mud) covering 55%, 19%, and 14% respectively. The habitat map’s confidence level was moderate overall, with low confidence in transitional zones due to data heterogeneity, and high confidence in the littoral zone with field validation.
Building upon the EUNIS classification system, this study proposed a tailored methodological innovation by integrating biological zones, substrate, and vegetation cover, while addressing regional data gaps through an alternative approach for biological zone delineation in n the absence of wave data. The accuracy of the habitat map the lack of acoustic remote sensing data for substrate and benthic community characterization, highlighting the need for advanced data fusion techniques in future studies.
The study revealed that ecologically critical habitats (coral reefs, mangroves, salt marshes, and seagrass beds) are concentrated in intertidal and infralittoral zones, whereas extensive subtidal areas are presently described only in terms of their physical attributes. The absence spatial data on subtidal vegetation and the l the limited understanding of benthic community distributions, therefore represent clear priorities for forthcoming surveys and modelling efforts. Habitat maps have the potential to integrate and utilize a wide range of multidisciplinary and multisource data, objectively presenting the types and spatial distribution status of habitats. This provides detailed base map support for marine monitoring surveys, scientific research, ecological conservation, and development activities, thus offering broad prospects for applications.
Statements
Data availability statement
The data analyzed in this study is subject to the following licenses/restrictions: The dataset cannot be shared publicly due to confidentiality agreements with the data provider. Requests to access these datasets should be directed to Luhhaaa@163.com.
Author contributions
HH: Conceptualization, Methodology, Visualization, Writing – original draft, Writing – review & editing. WL: Funding acquisition, Writing – review & editing. CL: Writing – original draft. YT: Writing – review & editing. LK: Methodology, Writing – review & editing. GZ: Software, Writing – review & editing. LY: Writing – review & editing. YX: Writing – review & editing. YZ: Writing – review & editing. ZL: Writing – review & editing. YM: Writing – review & editing.
Funding
The author(s) declare that financial support was received for the research and/or publication of this article. This study was supported by National Key R&D Plan of China (Grant No. 2023YFC3108004, 2023YFC3108003).
Acknowledgments
Thanks to Eleonora Manca (JNCC), Lewis Castle (JNCC), Mickaël Vasquez (Ifremer) from the EMODnet Partnership for China and Europe (EMOD-PACE) Working Package Four (WP4) for their assistance with mapping techniques and providing support for KdPAR data.
Conflict of interest
The authors declare that the research was conducted in the absence of any commercial or financial relationships that could be construed as a potential conflict of interest.
Generative AI statement
The author(s) declare that no Generative AI was used in the creation of this manuscript.
Publisher’s note
All claims expressed in this article are solely those of the authors and do not necessarily represent those of their affiliated organizations, or those of the publisher, the editors and the reviewers. Any product that may be evaluated in this article, or claim that may be made by its manufacturer, is not guaranteed or endorsed by the publisher.
References
1
Allee R. J. Kurtz J. Gould R. W. Jr. Ko D. S. Finkbeiner M. Goodin K . (2014). Application of the coastal and marine ecological classification standard using satellite-derived and modeled data products for pelagic habitats in the Northern Gulf of Mexico. Ocean Coast. Manage.88, 13–20. doi: 10.1016/j.ocecoaman.2013.10.021
2
Ball D. Blake S. Plummer A. (2006). Review of Marine Habitat Classification Systems (Melbourne, Australia: Parks Victoria).
3
Bassett R. D. Finkbeiner M. Etnoyer P. J. (2017). Application of the coastal and marine ecological classification standard (CMECS) to deep-sea benthic surveys in the northeast Pacific: lessons from field tests in 2015. NOAA Technical Memorandum NOS NCCOS 228 (Charleston, SC: NOAA National Ocean Service).
4
Chen S. Li Y. Hu J. Zheng A. Huang L. Lin Y . (2011a). Multiparameter cluster analysis of seasonal variation of water masses in the eastern Beibu Gulf. J. oceanography67, 709–718. doi: 10.1007/s10872-011-0071-y
5
Chen Z. Qiu Y. Xu S. (2011b). Changes in trophic flows and ecosystem properties of the Beibu Gulf ecosystem before and after the collapse of fish stocks. Ocean Coast. Management.54, 601–611. doi: 10.1016/j.ocecoaman.2011.06.003
6
Conley M. F. Anderson M. G. Geselbracht L. Newton R. Weaver K. J. Barnett A. et al . (2017). The South Atlantic bight marine assessment: species, habitats and ecosystems. Nat. Conservancy Eastern Conserv. Sci. Available at: https://easterndivision.s3.amazonaws.com/Marine/SABMA/SABMA_Report_26Dec2017.pdf
7
Culver D. A. Perry J. F. (1999). The relevance of the 1 % light level criterion to the depth distribution of aquatic macrophytes. Aquat. Bot.63, 307–325.
8
Fan H. Li G. Zhou H . (2015). Typical Marine Ecosystems in the Beibu Gulf of Guangxi: Current Status and Challenges (Beijing: Science Press).
9
FGDC (Federal Geographic Data Committee) (2012). Coastal and Marine Ecological Classification Standard. FGDC-STD-018-2012 (United States). Available at: https://www.fgdc.gov/standards/projects/cmecs-folder/CMECS_Version_06-2012_FINAL.pdf/at_download/file
10
Gubbay S. Sanders N. Haynes T. Janssen J. A. M. Rodwell J. R. Nieto A. et al . (2016). European Red List of Habitats Part 1. Marine habitats (Luxembourg: Publications Office of the European Union). doi: 10.2779/032638
11
Huang H. Lu W. Zuo G. Liu Z. Liu C. Wang X. et al . (2023). Ecological distribution patterns in Chinese seas and adjacent waters: Marine ecological zones. Sci. Total Environ.905, 167259. doi: 10.1016/j.scitotenv.2023.167259
12
Kirk J. T. O. (1994). Light and Photosynthesis in Aquatic Ecosystems. 2nd ed (Cambridge University Press). doi: 10.1017/CBO9781139168212
13
Ma X. Yan J. Song Y. Liu X. Zhang J. Traykovski P. A . (2019). Morphology and maintenance of steep dunes near dune asymmetry transitional areas on the shallow shelf (Beibu Gulf, northwest South China Sea). Mar. Geology412, 37–52. doi: 10.1016/j.margeo.2019.03.006
14
Ministry of Natural Resources of China (2020). Guidelines for Marine Ecological Classification (Trial). Beijing: Ministry of Natural Resources of China Press
15
MNR (Ministry of Natural Resources of the People's Republic of China) (2021). Technical guidelines for marine ecological restoration (Trial). Available online at: https://www.gov.cn/zhengce/zhengceku/2021-07/14/content_5624823.htm (Accessed July, 2021).
16
Obura D. Gudka M. Samoilys M. Osuka K. Mbugua J. Keith D. A. et al . (2021). Vulnerability to collapse of coral reef ecosystems in the Western Indian Ocean. Nat. Sustainability5, 104–113. doi: 10.1038/s41893-021-00817-0
17
OSPAR (2017). Intermediate Assessment 2017. Available at: https://oap.ospar.org/en/ospar-assessments/intermediateassessment-2017
18
Peter T. H. Elaine B. (2020). Seafloor Geomorphology as Benthic Habitat, GeoHab Atlas of Seafloor Geomorphic Features and Benthic Habitats-Second Edition (Elsevier publications).
19
Populus J. Vasquez M. Albrecht J. Eleonora M. Sabrina A. Zyad A. H. et al . (2017). EUSeaMap. A European broad-scale seabed habitat map. European Marine Observation and Data Network. doi: 10.13155/49975
20
Porter J. S. Austin W. E. N. Burrows M. T. Clarke D. Davies G. Kamenos N. et al . (2020). Blue carbon audit of Orkney waters. Scottish Mar. Freshw. Sci.11, 3. doi: 10.7489/12262-1
21
RPS group (2018). Hornsea Project Three Offshore Wind Farm. Environmental Statement: Volume 5, Annex 2.1 - Benthic Ecology Technical Report. PINS Document Reference: A6.5.2.1 APFP Regulation 5(2)(a). Available online at: http://hornseaproject3.co.uk/en/Application-documents (Accessed May, 2024).
22
Seamap Australia . Available online at: https://seamapAustralia.org (Accessed May, 2024).
23
Shi L. (2002). Distribution, growth environment and environmental adaptability of mangroves in China. Marine Information4, 14–18. doi: 10.3969/j.issn.1005-1724.2002.04.005
24
Shumchenia E. J. King J. W. (2010). Comparison of methods for integrating biological and physical data for marine habitat mapping and classification. Continental Shelf Res.30, 1717–1729. doi: 10.1016/j.csr.2010.07.007
25
Tian Q. Li S. (2018). “Mangrove recognition and extraction using multispectral remote sensing data in Beibu Gulf,” in Multispectral, Hyperspectral, and Ultraspectral Remote Sensing Technology, Techniques and Applications VII, vol. 10780. (International Society for Optics and Photonics), 107800C. doi: 10.1117/12.2324701
26
TNC (2022). Research report on conservation and restoration of Chinese oyster reef habitat (Beijing). Available online at: https://tnc.org.cn/resources/report_3.html (Accessed June, 2022).
27
Vasquez M. Al-Hamdani Z. Agnesi S. Aldo A. Natalie A. Doncheva V. et al . (2023). EUSeaMap 2023: A European broad-scale seabed habitat map (Technical Report) (European Marine Observation and Data Network (EMODnet). doi: 10.13155/97116
28
Vasquez M. Chacón D. M. Tempera F. O'Keeffe E. Galparsorok I. Alonso J. L. S. et al . (2015). Broad-scale mapping of seafloor habitats in the north-east Atlantic using existing environmental data. J. Sea Res.100, 120–132. doi: 10.1016/j.seares.2014.09.011
29
Xie X. Wu Z. Wang C. C. Fu Y. Wang X. Xu P. et al . (2020). Nursery habitat for Asian horseshoe crabs along the northern Beibu Gulf, China: Implications for conservation management under baseline gaps. Aquat. Conservation: Mar. Freshw. Ecosyst.30, 260–272. doi: 10.1017/CBO9781139168212
30
Yu Y. Mu Y. (2006). The new institutional arrangements for fisheries management in Beibu Gulf. Mar. Policy.30, 249–260. doi: 10.1016/j.marpol.2004.12.006
31
Zeng R. Xu Y. Yang L. Ai Y. Liu J. Liu C. et al . (2024). Adjustment of the marine ecological red lines in China. Sci. Rep.14, 19247. doi: 10.1038/s41598-024-69606-x
Summary
Keywords
marine habitat spatial distribution, marine habitat mapping, marine habitat classification, biological zone, classified substrate, classified vegetation
Citation
Huang H, Lu W, Liu C, Tao Y, Kang L, Zuo G, Yang L, Xu Y, Zhang Y, Liu Z and Ma Y (2025) Study on spatial distribution characteristics of marine habitat in the Beibu Gulf based on GIS and existing environmental and vegetation data. Front. Mar. Sci. 12:1578892. doi: 10.3389/fmars.2025.1578892
Received
18 February 2025
Accepted
13 June 2025
Published
04 July 2025
Volume
12 - 2025
Edited by
Rosaria Ester Musumeci, University of Catania, Italy
Reviewed by
Xuechu Chen, East China Normal University, China
Filippo Luzzu, Agenzia Regionale per la Prevenzione e Protezione Ambientale, Italy
Updates
Copyright
© 2025 Huang, Lu, Liu, Tao, Kang, Zuo, Yang, Xu, Zhang, Liu and Ma.
This is an open-access article distributed under the terms of the Creative Commons Attribution License (CC BY). The use, distribution or reproduction in other forums is permitted, provided the original author(s) and the copyright owner(s) are credited and that the original publication in this journal is cited, in accordance with accepted academic practice. No use, distribution or reproduction is permitted which does not comply with these terms.
*Correspondence: Wenhai Lu, Luhhaaa@163.com
Disclaimer
All claims expressed in this article are solely those of the authors and do not necessarily represent those of their affiliated organizations, or those of the publisher, the editors and the reviewers. Any product that may be evaluated in this article or claim that may be made by its manufacturer is not guaranteed or endorsed by the publisher.