Abstract
This study examines the wave climate and its influence on potential Longshore Sediment Transport (LST) along the Shippagan coast of the Gulf of St. Lawrence, eastern Canada. Using a combination of in-situ observations and ERA5 reanalysis data, the research evaluates both seasonal and annual variations in wave dynamics and sediment transport, with particular attention to the role of extreme weather events. The wave climate shows pronounced seasonality, with higher wave activity in winter and lower activity in summer, while wave direction remains consistently from the southeast. Estimated potential LST rates, derived from renowned three empirical formulae, i.e., CERC, Kaczmarek and Komar show variability in both magnitude and direction over the three-year study period (2021-2023), reflecting the complex sediment dynamics of the region. According to CERC formula, the estimated net annual rates were -6.0 to 6.4 x10⁵ m3, while estimates from the Kaczmarek formula ranged from -6.1 to -1.8 x10⁵ m3 over the same period. The Komar formula provided net annual LST estimates ranging from -6.2 to 6.5 × 10⁵ m³, which are in close agreement with the CERC results. The predominant direction of net potential LST rates is towards southeast direction. Seasonal analysis highlights winter season waves are the dominant contributor to sediment transport, followed by spring and fall. Although, post-tropical storms contributed 5% to the total gross potential LST rates. Additionally, long-term analysis (1992–2023) reveals increasing trends in wave heights (0.4 cm year-1) and potential LST rates. These findings provide valuable insights into sediment dynamics, supporting improved modeling and prediction of the fate of nourished sediments, and contributing to the optimization of nature-based solutions like the Sand Engine for sustainable coastal management.
Highlights
-
Long-term analysis reveals increase in wave heights with 0.4cm year-1.
-
The predominant direction of net potential LST is towards southeast direction.
-
Post-tropical storms contributed 5% to total gross potential LST rates.
-
The study presents the first long-term estimation of potential LST rates along the Shippagan.
-
Findings enhance sediment transport modeling and inform sustainable coastal management strategies like the Sand Engine.
1 Introduction
In response to coastal habitat destruction of an endangered Piping Plover (Charadrius melodus) in Atlantic Canada, two novel restoration techniques are being employed in Shippagan, New Brunswick, Canada: (1) a “sand engine”, and (2) construction of a marsh with sill living shoreline (Bowron et al., 2022). The sand engine, based on a concept piloted in the Netherlands, involves placing a substantial volume of dredged material on the foreshore, where natural coastal processes distribute it along the shore, nourishing beaches, dunes and marshes (de Schipper et al., 2016). This approach relies on natural wave action in nearshore regions, which plays an important role in transporting sediments parallel to the shoreline (Longshore Sediment Transport, hereafter LST) (Başaran and Güner, 2021; Toimil et al., 2017a). Potential LST plays a pivotal role in coastal geomorphology, and it significantly influences the dynamic evolution of beaches (Mil-Homens et al., 2013). Variations in wave climate and potential LST driven by storms, seasonal effects, climate variability, and climate change influence shoreline dynamics (Toimil et al., 2017b). In a changing climate scenario, Atlantic Canada is being affected by sea-level rise, coastal erosion and intensified storms (Greenan et al., 2019). Addressing these challenges requires advanced restoration and mitigation strategies, along with a comprehensive understanding of the wave climate and its influence on potential LST, to ensure the long-term stability and resilience of Atlantic Canada’s coastlines. The variability in the wave climate of the north Atlantic Ocean is driven by the climatic oscillations, which influence wind patterns, fetch, and resulting wave energy and frequency (Feser et al., 2015; Freitas et al., 2022; Ambaum et al., 2001). Additionally, in the nearshore regions the wave interactions with the bottom topography and shoaling can results in localized wave transformation such as wave refraction, diffraction, and breaking, which can alter coastal processes significantly (da Silva et al., 2012). These dynamic interactions emphasize the importance of understanding the wave climate and associated potential LST rates for coastal management and engineering applications, as they directly impact coastal stability and the resilience of coastal communities (Rölfer et al., 2022).
Accurate datasets are essential for analyzing a region’s wave climate and potential LST rates, capturing both seasonal and annual variations effectively. Ocean wave data can be obtained from in-situ observations, satellite measurements, and modelled or reanalysis products. However, satellite data has quality issues when it is closer to the coast (Walker et al., 2014; Van Vledder and Akpınar, 2015) and measured wave data is limited to sparsely distributed networks of point observations. As a result, researchers frequently rely on numerical models such as SWAN (Simulating Waves Nearshore) (Wood et al., 2001; Akpınar et al., 2016; Liang et al., 2019) and WAVEWATCH III (Mentaschi et al., 2015; Umesh and Behera, 2020; Zheng et al., 2022) to analyze wave characteristics (Cavaleri et al., 2018). In recent decades, advances in data assimilation techniques have further improved reanalysis products like ERA5 (Hersbach et al., 2020), which provide extensive spatial and temporal coverage, delivering comprehensive global data on wave climate and wind patterns. Several researchers have endeavored to understand wave climate and dynamic coastal processes using observations, modelling, satellite and reanalysis data (e.g., Zhang et al., 2004; Ardhuin et al., 2010; Maia et al., 2023; Semedo et al., 2011; George and Kumar, 2019, 2021). On the other hand, potential LST rates have been estimated using two primary approaches. The first involves employing bulk transport formulae, such as those proposed by CERC (USACE, 1973), Kamphuis (2002), Walton and Bruno (1989), and Kaczmarek et al., 2005. The second approach utilizes process-based numerical models, such as Delft3D (Lesser et al., 2004) and Mike 3 (Saengsupavanich et al., 2022), or one-line models like GenCADE, LITPACK, and UNIBEST (Frey et al., 2012; Townsend et al., 2014). Numerous studies on potential LST have been conducted all around the world for different oceanic conditions using these approaches (Wang et al., 1998; Falqués, 2006; Splinter et al., 2012; Almar et al., 2015; Chowdhury and Behera, 2017; George et al., 2020).
Along the northwest Atlantic and the Gulf of St Lawrence (GSL), several studies have investigated wave climates and extreme wave conditions (Forbes et al., 2004; Swail et al., 2006; Ruest et al., 2013; Guo and Sheng, 2015; Ruest et al., 2016; Wang et al., 2018). In contrast, limited research has focused on calculating potential LST rates in the GSL, and these studies are based on empirical formulae and model approaches with limited measured data (Armon and McCann, 1977; Davies, 2011 (not peer-reviewed); Manson et al., 2016). For e.g., Armon and McCann (1977) estimated potential LST based on CERC (USACE, 1973) along a 43 km barrier island shoreline at Malpeque, Prince Edward Island (PEI) in the GSL. The results showed that net potential LST is directed towards the southwest direction, with potential LST rates varying from 0.4–2 x10⁵ m3 year-1. Davies (2011) used the Kamphuis formula to estimate the potential LST along PEI in the GSL, finding dominant west-to-east transport. Manson et al. (2016) used the Delft3D numerical model to estimate sediment transport along the north shore of PEI in the GSL, finding that the average transport is southeast-ward (4.9 x10⁵ m3·s-1·m-1), with change in direction and quantity of transport depending on storm winds and high wave conditions. Most previous studies on wave characteristics and potential LST rates have focused on PEI, leaving the Shippagan coast, situated north of PEI, largely unexplored.
The wave characteristics and associated potential LST along the Shippagan region remain unknown, even as the region undergoes continuous changes due to Nature-Based Solutions (NBS) efforts as discussed above. A detailed assessment of potential LST and the wave climate in this region is critical for the effective management of its dynamic coastlines. Additionally, there is limited understanding of how extreme weather events, such as tropical and extratropical hurricanes, influence wave patterns and potential LST in this area. Hence this study aims to address these gaps by examining the seasonal and annual variability of the wave climate and evaluating the contributions and impacts of extreme weather events on potential LST and wave characteristics, providing essential insights for sustainable coastal management. The insights into potential LST derived from this study are pivotal for improving strategies to manage coastal flood and erosion risks. This understanding supports the development of NBS, such as the Shippagan Sand Engine, which leverage natural processes to achieve sustainable coastal protection and foster habitat creation.
2 Study area
The GSL is a large semi-enclosed shelf sea covering an area of about 240,000 km2 located in eastern Canada that connects to the northwest Atlantic through the relatively shallow (50–80 m) Strait of Belle Isle (Bailey 1958) and the deep (480 m) Cabot strait (Figure 1). Waters flowing in through the Strait of Belle Isle are mostly of Arctic origin [see Figure 1 of Lavoie et al. (2021)], while waters entering at Cabot Strait are a mixture of cold water from the Labrador Current and warmer North Atlantic Central Water. The GSL is characterized by deep channels (Laurentian, Esquiman, and Anticosti) bordered by relatively narrow shelves, except for the Magdalen Shallows, a vast shelf that covers most of the southern GSL with an average depth of 60–65 m. The GSL is also characterized by an important inflow of freshwater. The Great Lakes-St. Lawrence River system is one of the largest watersheds (1.3 million km2) in the world and the third largest in North America, after the Mississippi and Mackenzie Rivers, with 80% of the runoff flowing into the Lower St. Lawrence Estuary (Lavoie et al., 2021) and 20% using essential resources for drinking, transportation, agriculture and industry (Gronewold and Stow, 2014). This freshwater discharge generates an estuarine-like circulation, with fresher water moving out of the system at the surface, and saline water in the deeper channels flowing upstream into the estuary.
Figure 1
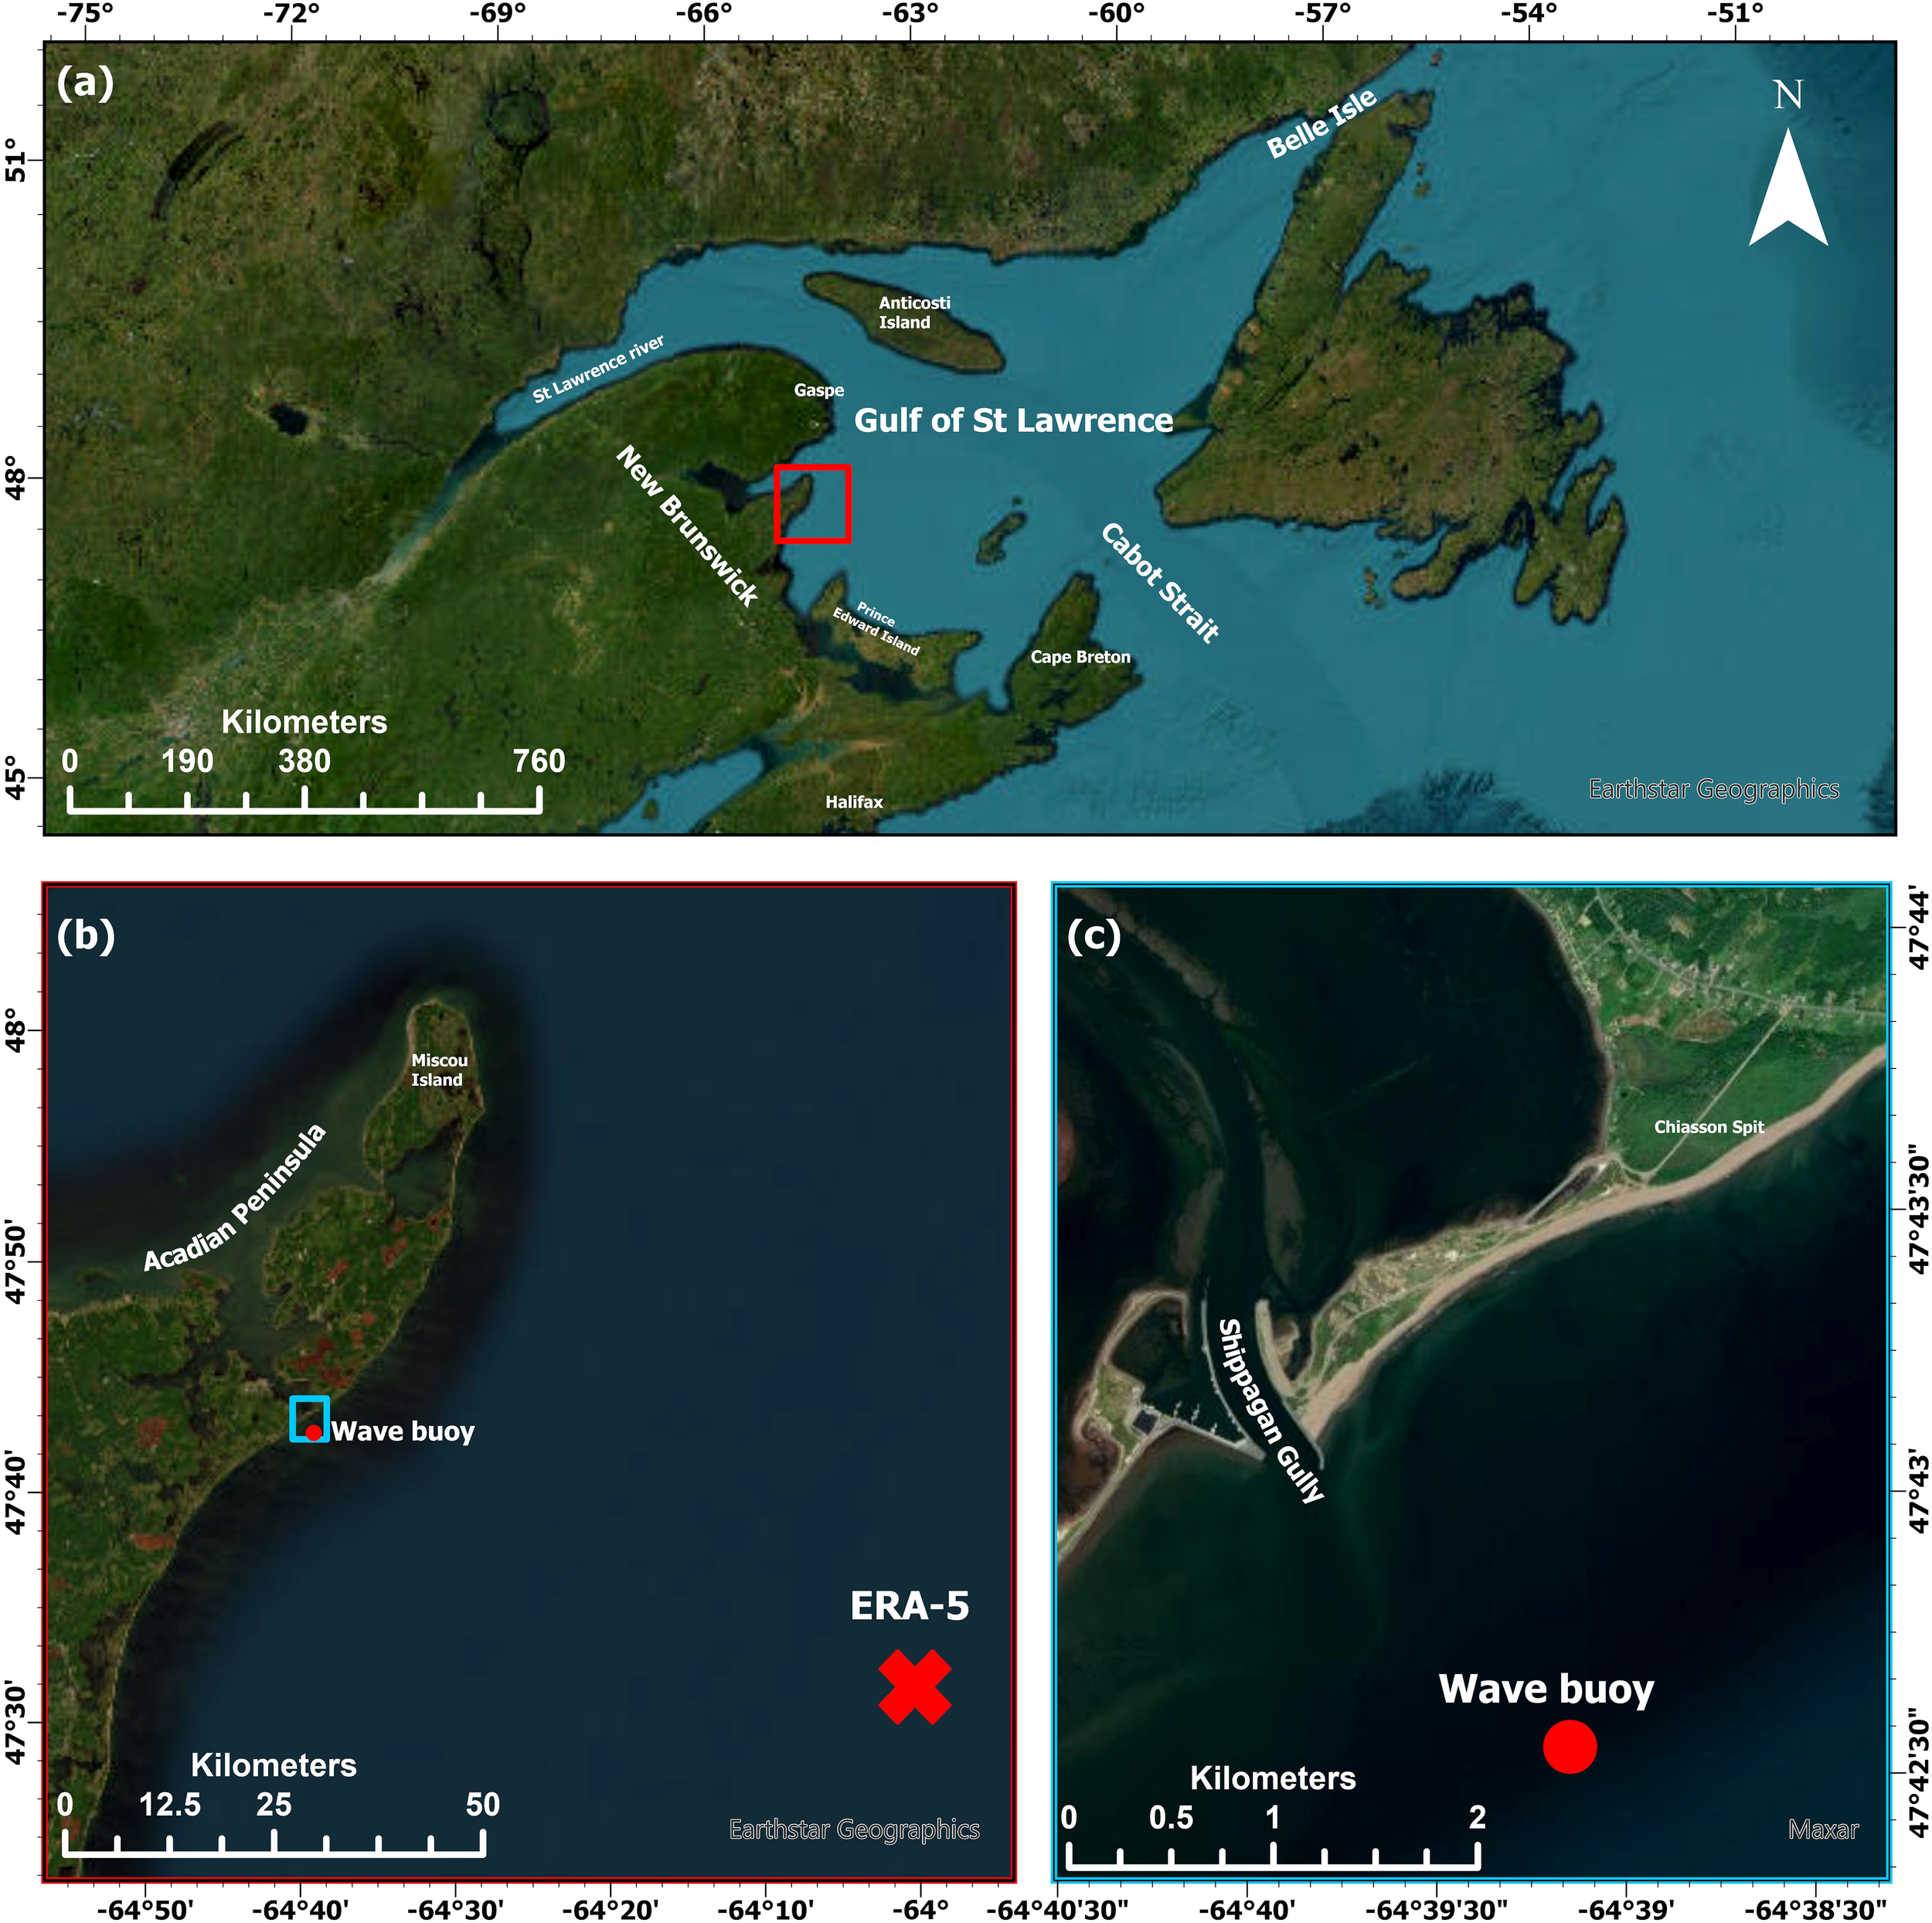
(a) The study region in the Gulf of St. Lawrence is highlighted by the red box. (b) A closer view of the Acadian Peninsula, with the ERA5 grid location marked, approximately 50 km from the shoreline and wave spotter location. (c) A detailed view of the Shippagan Gully, showing the deployment location of wave spotter, indicated by a circle (Source: Google Earth).
Shippagan (Figure 1), located on the Acadian Peninsula in northeastern New Brunswick, experiences mixed semi-diurnal tides (Bowron et al., 2022). The tidal range in Shippagan is moderate, typically varying between 1 to 2 m. The average current speed in the area ranges from 0.2 to 1 m.s-1 along the coast, with variations depending on the specific location and tidal phase. In the Shippagan Gully, current speed exceeds 2 m.s-1 during ebb flows which is twice as strong as the flood flows (Provan et al., 2018). In northern New Brunswick, residents say that the most damaging wind and waves come from the northeast and refer to these winds and associated violent storms as ‘les nordets’ (O’Carroll, 2008). The nearshore wave climate at the region features significant wave heights ranging from 0.5 m up to ~4 m and peak wave periods from 3 to 11 s. The historical evolution of the inlet provides clear evidence of a wave-driven net LST flowing from NE to SW (Provan et al., 2014). The dominant wind directions in the study area were northwesterly (NW) and southwesterly (SW), with maximum wind speeds exceeding 16 m·s⁻¹. Seasonal variations in wind patterns were observed, with prevailing winds shifting between northwesterly (NW) and northeasterly (NE) during the spring. In contrast, southwesterly (SW) winds were most common during the summer months. During winter, winds predominantly originated from the northwest (NW). Wind speeds exhibited seasonal variability, with the lowest values recorded in the summer (ranging between 12 and 16 m·s⁻¹), while the highest wind speeds, exceeding 16 m·s⁻¹, were observed in the spring (Baker et al., 2024).
3 Data and methodology
3.1 Wave and wind data
Wave and wind parameters were measured from the study area by deploying a GPS-based wave buoy (Spotter buoy by Sofar Ocean) for a period of one month (9th August 2023 to 12th September 2023) at 12 m water depth (47.7090 N, -64.6520 E) off Shippagan gully, New Brunswick, Canada (Figure 1). Waves were measured and recorded at hourly intervals. The Spotter is a compact, GPS based marine instrument designed for precise wave and wind measurements, providing data on significant wave height, period and direction along with wind speed and direction with reasonable accuracy (Beckman and Long, 2022). These data are used to locally verify the wave reanalysis data, as establishment for understanding the wave climate and associated potential LST rates in the study region.
Additionally, the significant wave height (Hs), peak wave period (Tp), mean wave period (Tm), mean wave direction (mwd) and easterly/northerly components of wind speeds (U, V) were obtained at hourly intervals from the ERA5 global atmospheric reanalysis (Hersbach et al., 2020) produced by European Centre for Medium-Range Weather Forecasts (ECMRWF) for the grid point closest to the Shippagan coast (Figure 1). ERA5 is the 5th generation ECMRWF reanalysis with a spatial resolution of 0.25°x 0.25°for atmospheric variables, and the wave model is based on the WAM model (Group, 1988) with a spatial resolution of 0.5° x 0.5°. The dataset used in this study consisted of a total of 24,458 hourly records of wind and wave data spanning three years (2021–2023). Based on an expected 8,760 data points per year, the total number of records should be 26,280. However, 1,822 records were missing, including 167 in 2021, 1,031 in 2022, and 624 in 2023. These data gaps occurred predominantly during the winter season, primarily due to the influence of ice formation. Additionally, the wind and wave climate were determined from annual averages of wind speed, significant wave height (Hs), mean wave period (Tm), peak wave period (Tp) and mean wave direction (MWD) from 1993-2023.
Statistical approaches were employed to conduct a quantitative comparison of local wave measurements to the reanalysis data (ERA5) using metrics such as bias (BIAS) (Equation 2), root-mean-square error (RMSE) (Equation 1), and correlation coefficient (R) (Equation 3). The details are given below.
RMS error
The root-mean-square error (RMSE) is used to evaluate the accuracy of the reanalysis data (predictions, ) compared to the measurements (observations, ):
BIAS
The bias expressed the mean error or difference between the observations and predictions:
Correlation coefficient
The Pearson correlation coefficient (or R value) measures the degree of correlation between observations and predictions, with values ranging from -1 (negative correlation) to 1 (positive correlation). R2 values approaching unity indicate strong correlation.
n is the number of observations
Pi represents the predicted value at the ith instance
Oi represents the observed value at the ith instance
3.2 Longshore sediment transport
Most potential LST formulae require breaking wave parameters to be specified as inputs, but global wave reanalysis such as ERA-5 typically only provide deep-water wave characteristics. In this study, the Kaczmarek et al. (2005) formula is used to calculate potential LST rates (Equations 4, 5) in the study region and is given as:
Additionally, we evaluate potential LST rates using the CERC formula (USACE, 1973) and Komar (1977) in the study region. The CERC formula, primarily designed for sandy beaches (van Rijn, 2014), is widely used to calculate potential LST rates (da Silva et al., 2012). In the CERC formula (Equation 6), the potential LST rate is also expressed as a function of the breaking wave height and angle relative to the shoreline. In the Komar formula (Equation 7), the potential LST rate is expressed as a function of significant wave height.
where is the wave breaker index (/; is the breaking wave height and is the water depth at breaking. This formula assumes that the volumetric rate of potential LST ‘Qlst’ for the entire surf zone is proportional to the average longshore current velocity component (V) (Equation 8) and is given as:
where g is the gravitational acceleration (9.81 m s-2), is a site-specific constant chosen as 2.7 based on Komar and Inman, 1970 for wave-dominated regions, and is the angle between the shoreline and the crests of breaking waves. We have used the equations proposed by Larson et al. (2010) to calculate the breaking wave height () and breaker wave angle () (Equations 9–15) corresponding to offshore wave conditions provided by the ERA-5 and wave buoy data (Section 3.1)
where is a correction factor and is defined as
Where C is the deep-water celerity given by C = 1.56 , is the group celerity; is the deepwater wavelength, and is the wave breaker index (taken for this study to be 0.78; USACE, 1984).
In addition to this, hourly wave parameters were extracted, and long-term potential LST were computed for the extended period from 1992 to 2023 to assess the long-term behavior of wave climate and potential LST along the study region.
4 Results and discussion
4.1 Wind and wave parameters in the GSL
Figure 2 shows the annual climatology of wind speed & direction, Hs, Tm, Tp and mwd covering the northwest Atlantic Ocean and GSL based on 30 years of ERA5 reanalysis datasets. Wind speed ranges from 2.8 m·s-1 to 8.8 m· s-1, with predominantly eastward directed wind (Figure 2a). The highest annual mean wind speed is observed in the Atlantic Ocean (8.6 m·s-1), followed by 8.2 m·s-1at the mouth of the GSL, Cabot strait (Figure 1a) and less than 8 m·s-1 is observed in the other region of GSL. Interestingly, the annual averaged wind speed along the Shippagan region is higher (>7.0 m·s-1) as compared to nearby regions inside the GSL.
Figure 2
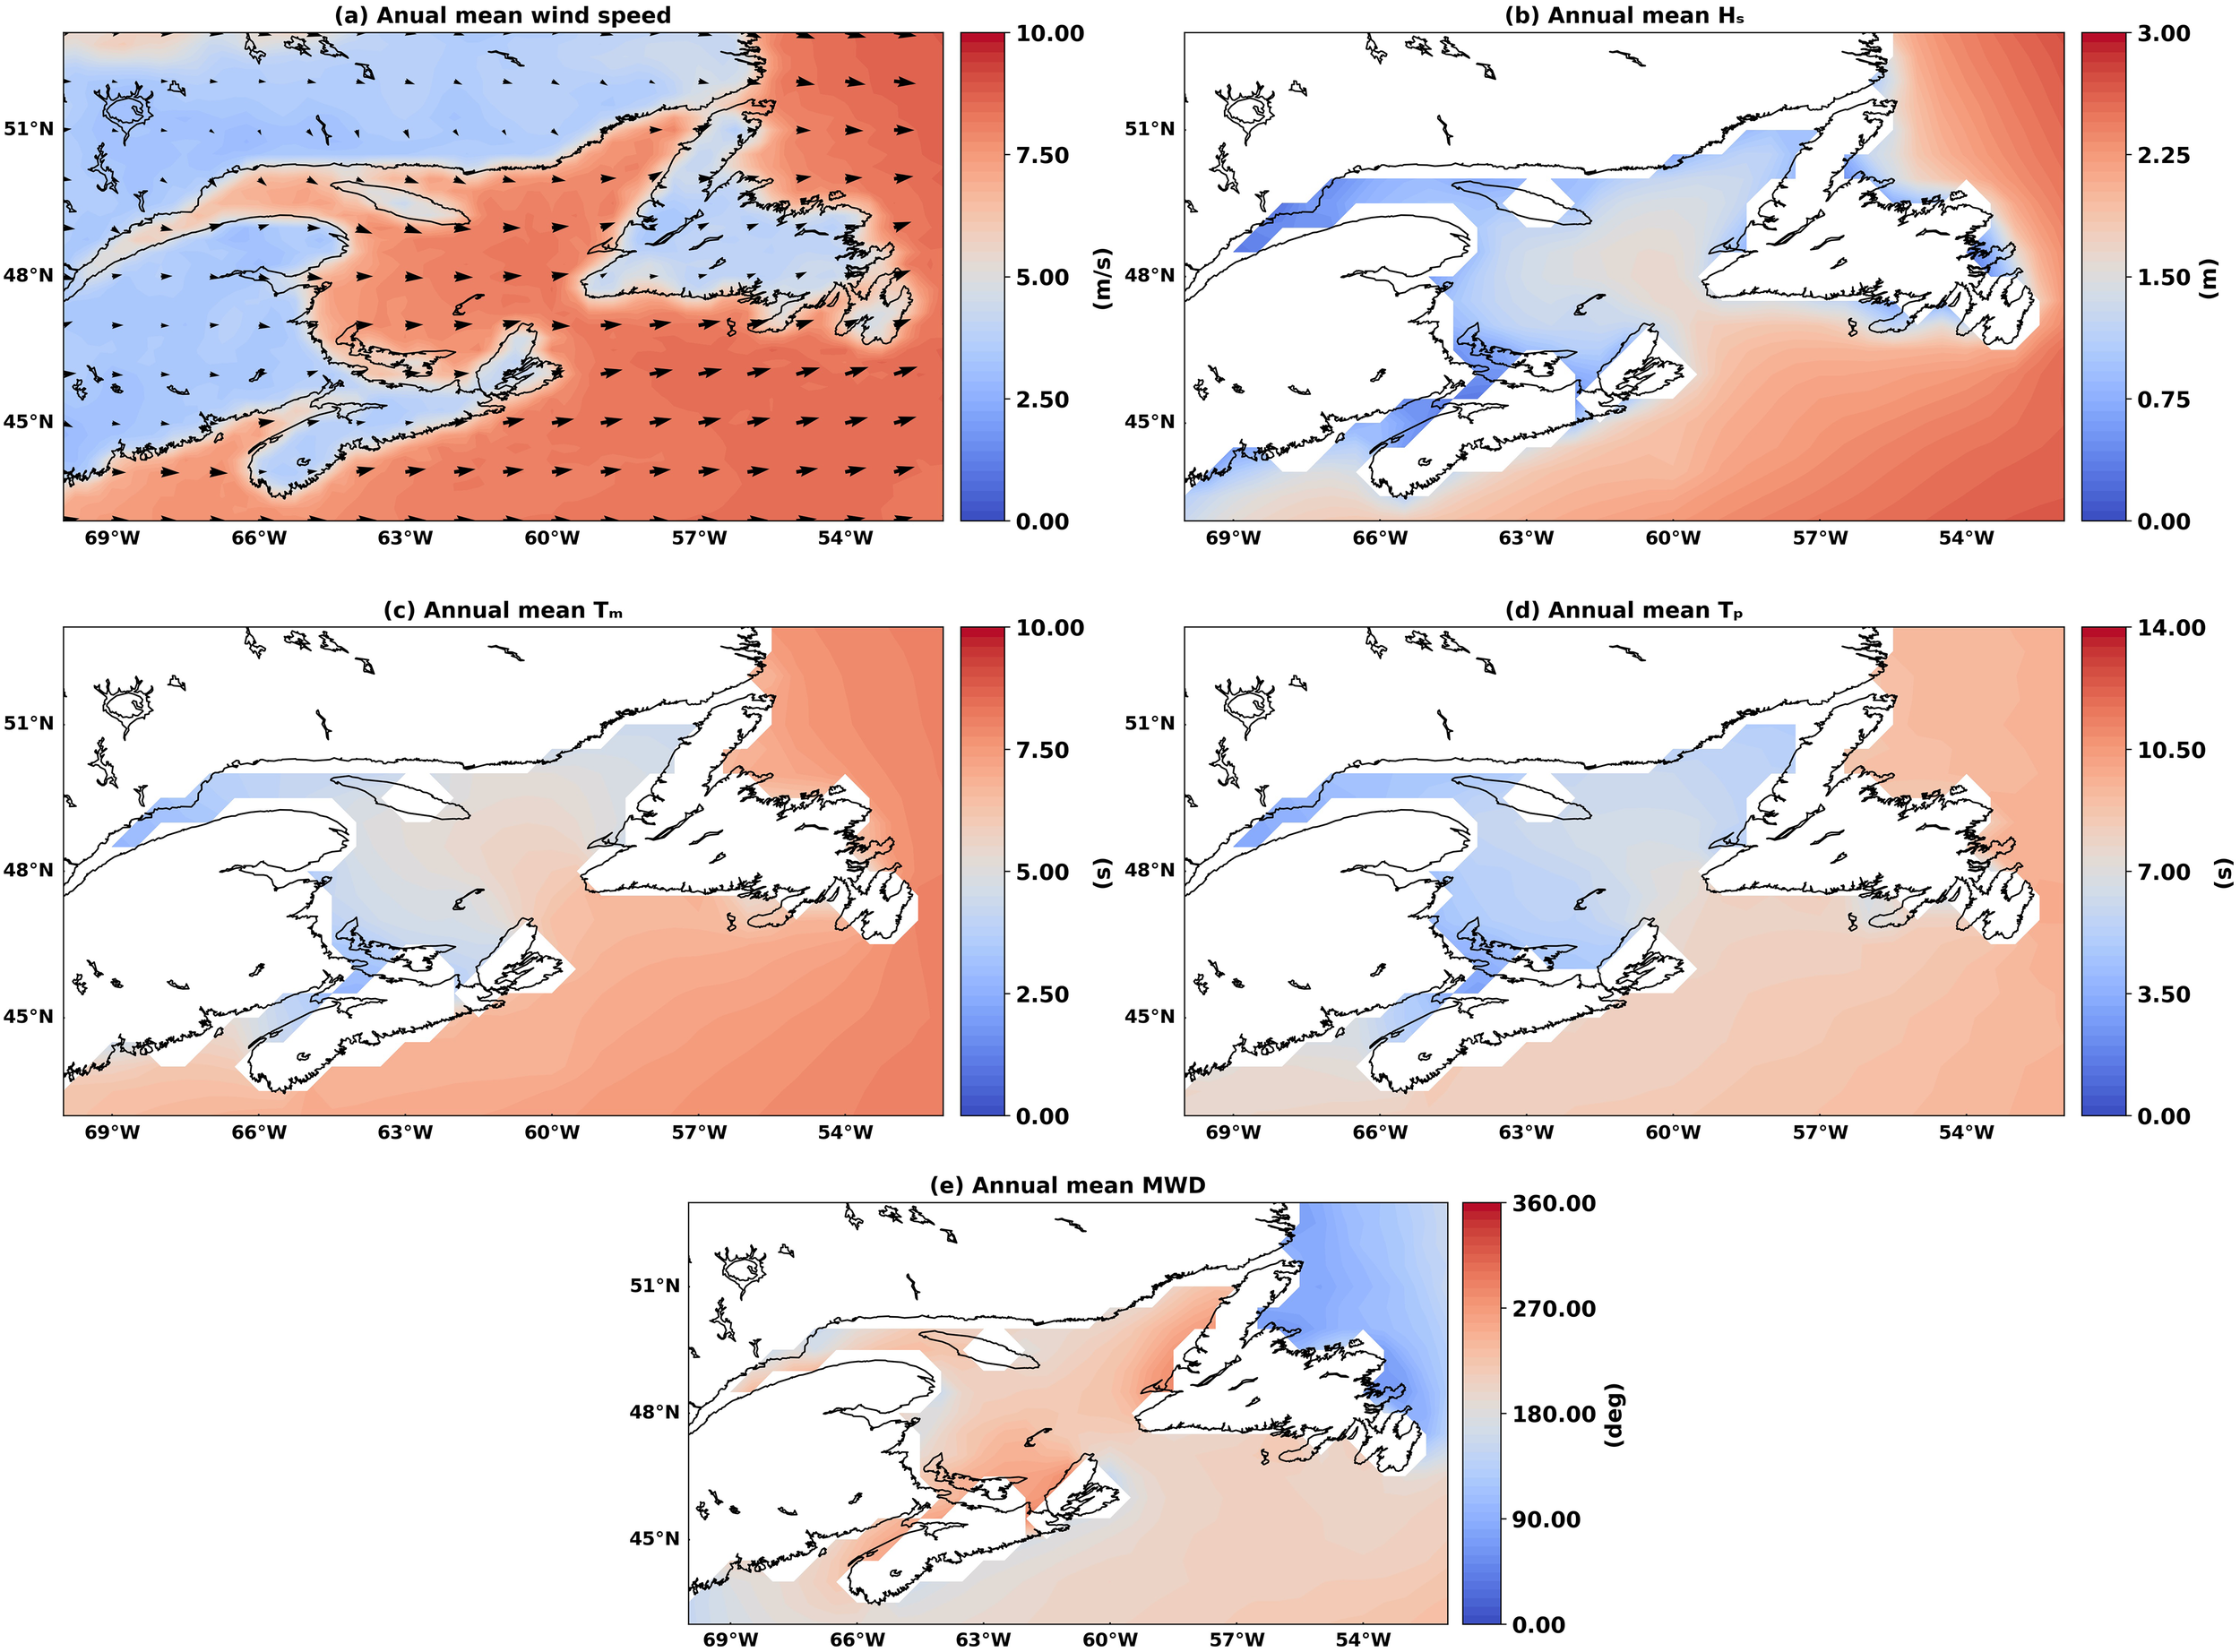
Annual mean of (a) wind speed, (b) significant wave height (Hs), (c) mean wave period (Tm), (d) peak wave period (Tp) and (e) mean wave direction (MWD) extracted from ERA5 reanalysis data (1992-2023) extending across the GSL and the northwest Atlantic Ocean (Source: Hersbach et al., 2020).
Similarly, annual averaged Hs across the region ranges from 0.2 to 2.7 m, while across the GSL it ranges from 0.2 to 1.5 m (see Figure 2b). The higher Hs values are observed in the Cabot Strait (southeastern mouth of the Gulf; see Figure 1a), ranging from 1.4 to 2.1 m. The annual average Tm across the GSL varies between 1 s and 8 s, while the annual average Tp ranges from 1 s to 9 s. The longest wave periods are typically observed in the southeastern entrance of the Gulf, particularly in the Cabot Strait, where waves generated by North Atlantic storms propagate into the region. Wave direction in the GSL also exhibits significant variability, with annual values ranging between 180° and 340°, indicating the influence of multiple wave-generating systems, including local wind-driven waves and swell originating from the Atlantic Ocean. Closer to the Acadian Peninsula, the mwd is more constrained, with annual averages ranging from 90° to 160°, reflecting the predominance of regionally generated waves and the influence of the complex coastal geometry on wave propagation patterns. This phenomenon is primarily attributed to the westerly winds, which generate waves over a large fetch, and the influence of Atlantic swells entering the GSL through its mouth. However, these swell waves originating from the Atlantic have less impact on other parts of the GSL, mainly due to the geographical configuration of the Gulf. The GSL is surrounded by landmasses and has a narrow opening to the ocean, which limits the fetch area and hinders the sustainment of long-period waves within the Gulf. Consequently, waves inside the GSL are primarily locally generated by the influence of local winds rather than originating from the Atlantic Ocean.
4.2 Nearshore wave characteristics
4.2.1 In situ observations
Time series and distribution plots of wave characteristics (Hs, Tm, Tp, and mwd), obtained from a one-month deployment of a Spotter buoy in the shallow region off Shippagan, are shown in Figures 3 and 4a–c to illustrate short-term wave variability. Throughout the observation period, the average Hs, Tm and Tp were 0.5 m, 3.5 s and 4 s respectively, and are predominantly from the southeast (130°). The Hs ranged from 0.2 m to 2.8 m, while Tm and Tp ranged from 1.0 s to 6.0 s and 1.0 s to 7.0 s respectively. The maximum Hs observed during this period in the was 2.7 m, accompanied by a Tm of 6.5 s and a Tp of 8.1 s. The second highest Hs recorded during the measurement period was 1.8 m, with a Tm of 6.0 s and a Tp of 6.5 s (Figure 3). Interestingly, 90% of the Hs was in the range 0-1.0 m, predominantly from southeast (120° -160°) (Figure 4a). For the remaining 10% of the observation period, Hs was in the range 1.0-2.8 m. Mean wave periods were between 3–4 s for 44% of the time, between 2.0-3.0 s for 37% of the time, and between 4.0-7.0 seconds for 19% of the time (Figure 4b). The distribution of peak wave periods indicates that 16.5% fall within the range of 0–3 s, 64% within 3–6 s, and 19.5% within 6–9 s (Figure 4c).
Figure 3
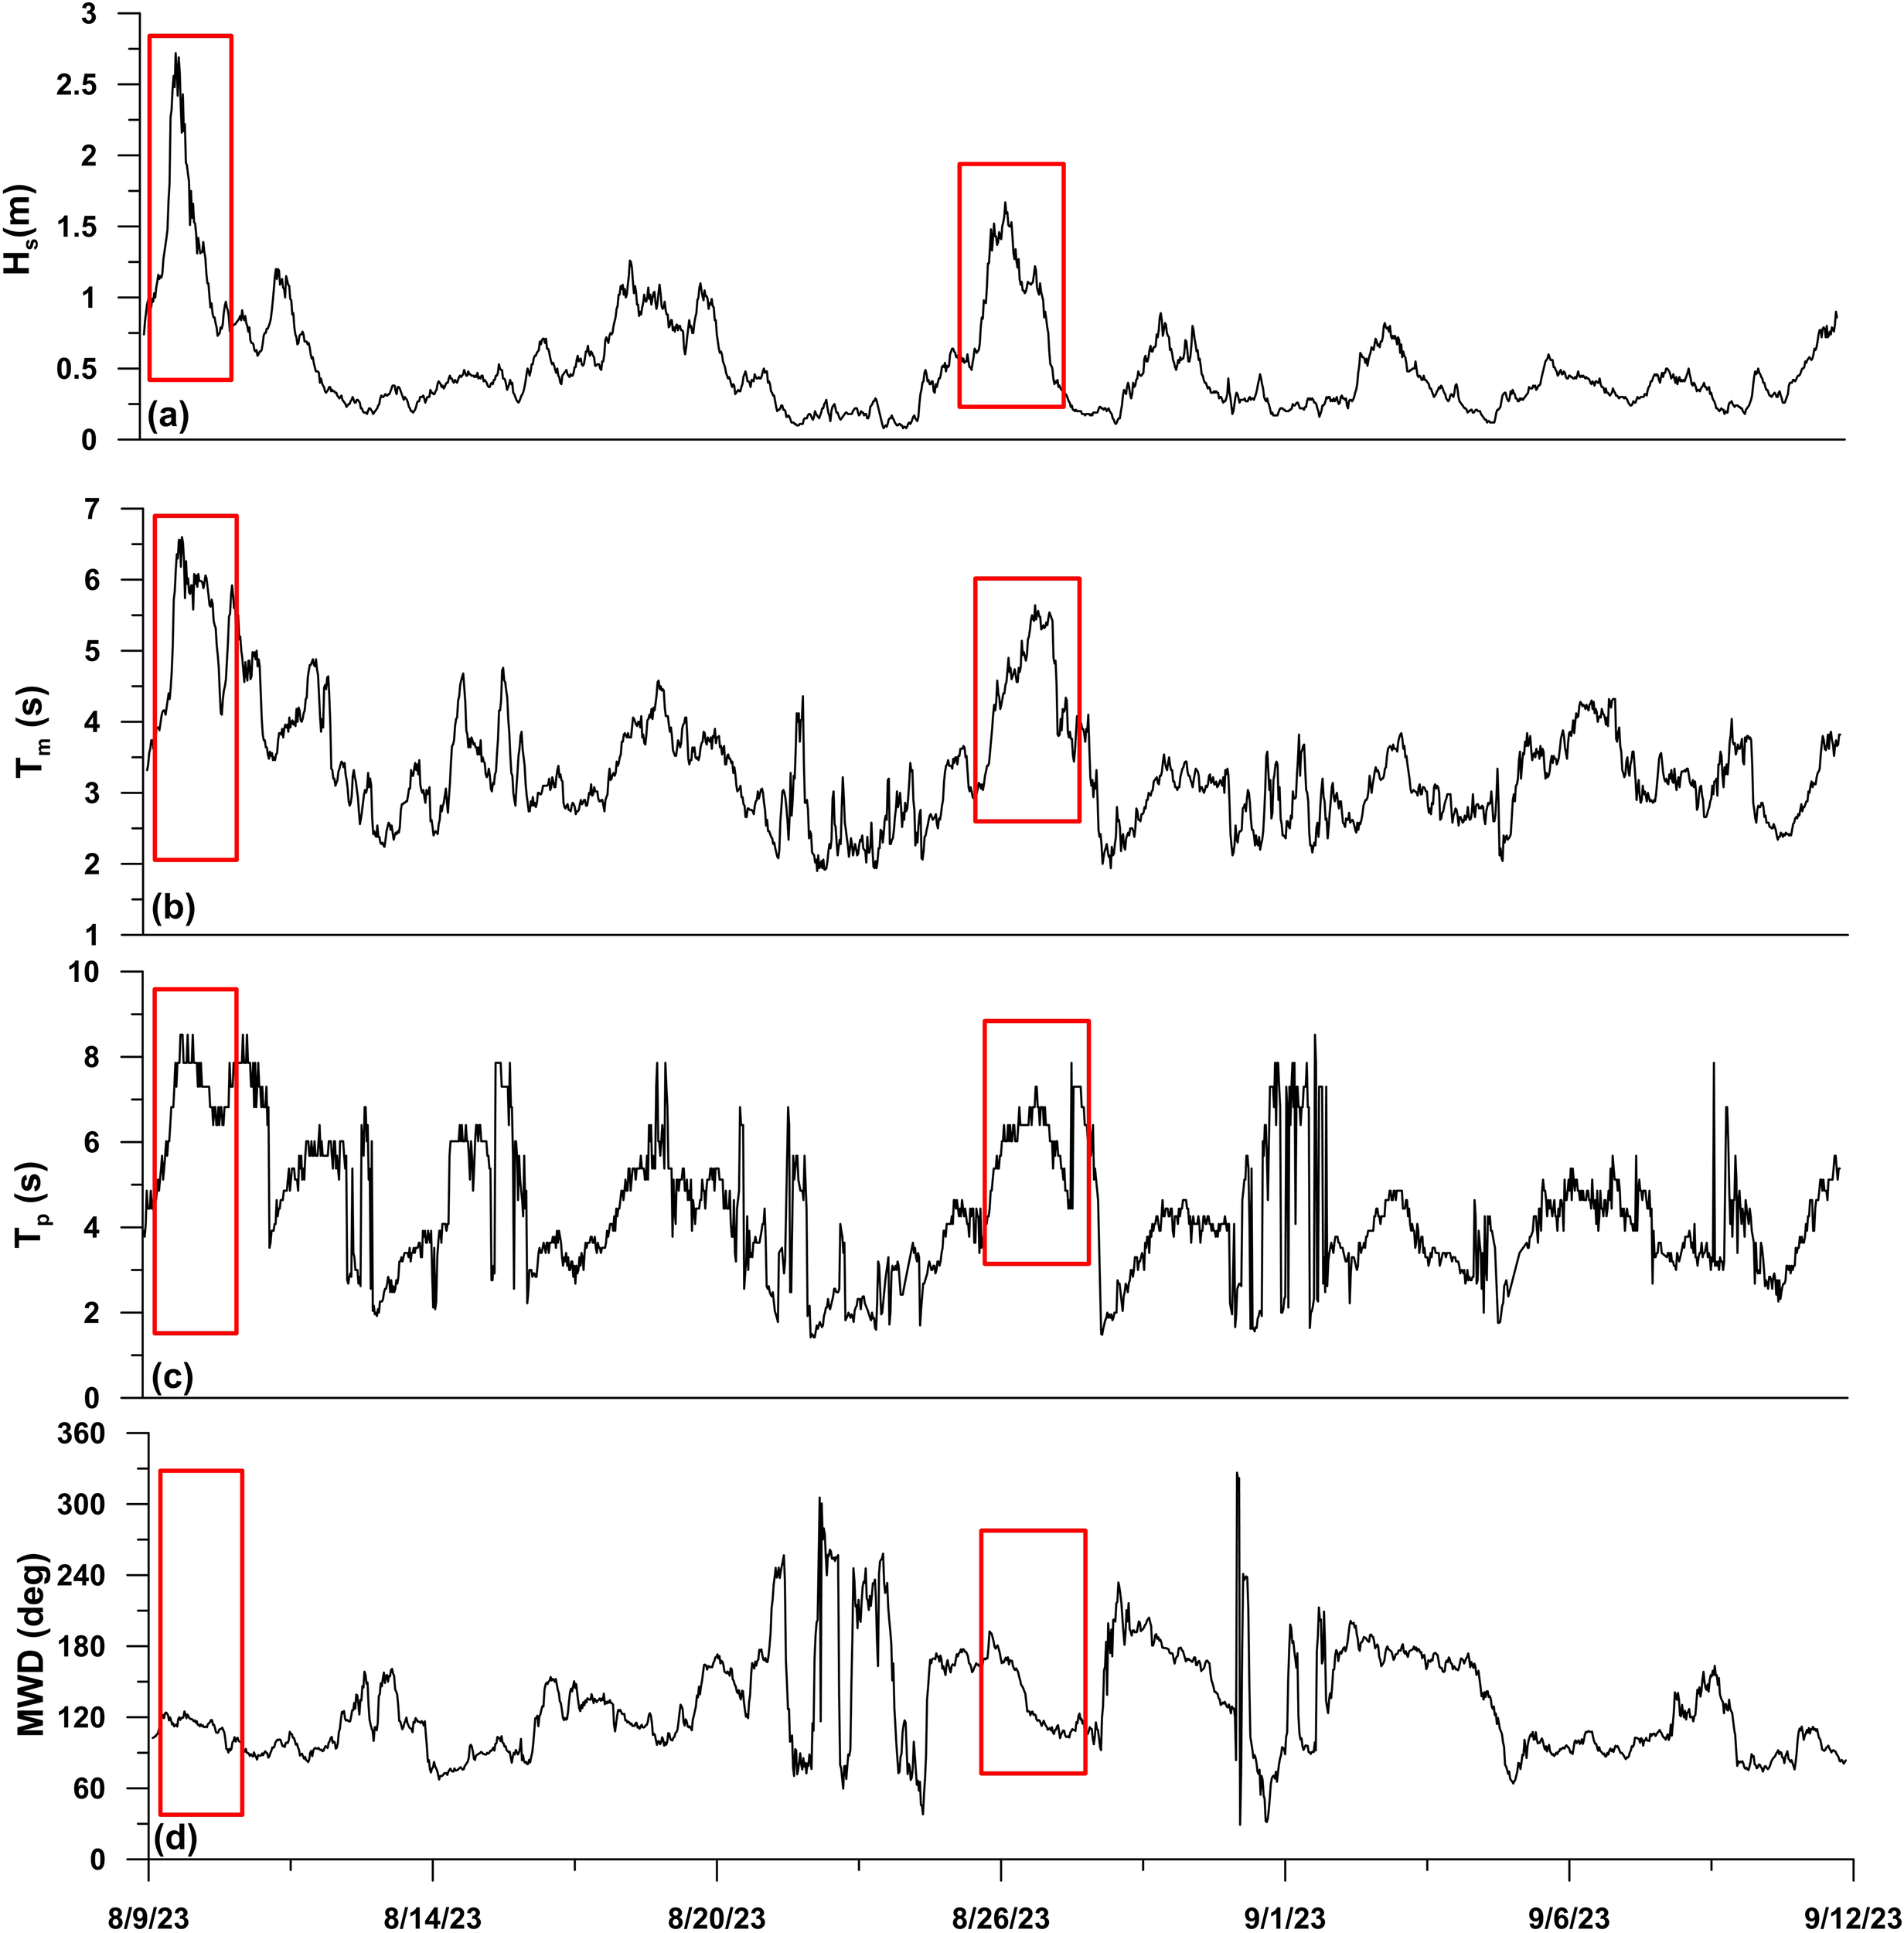
Time series of measured wave parameters (a) significant wave height (Hs) (b) mean wave period (Tm), (c) peak wave period (Tp) and (d) mean wave direction (MWD) from the study region at 10 m water depth. Red box represents the high wave conditions observed during the time of observation from the study domain.
Figure 4
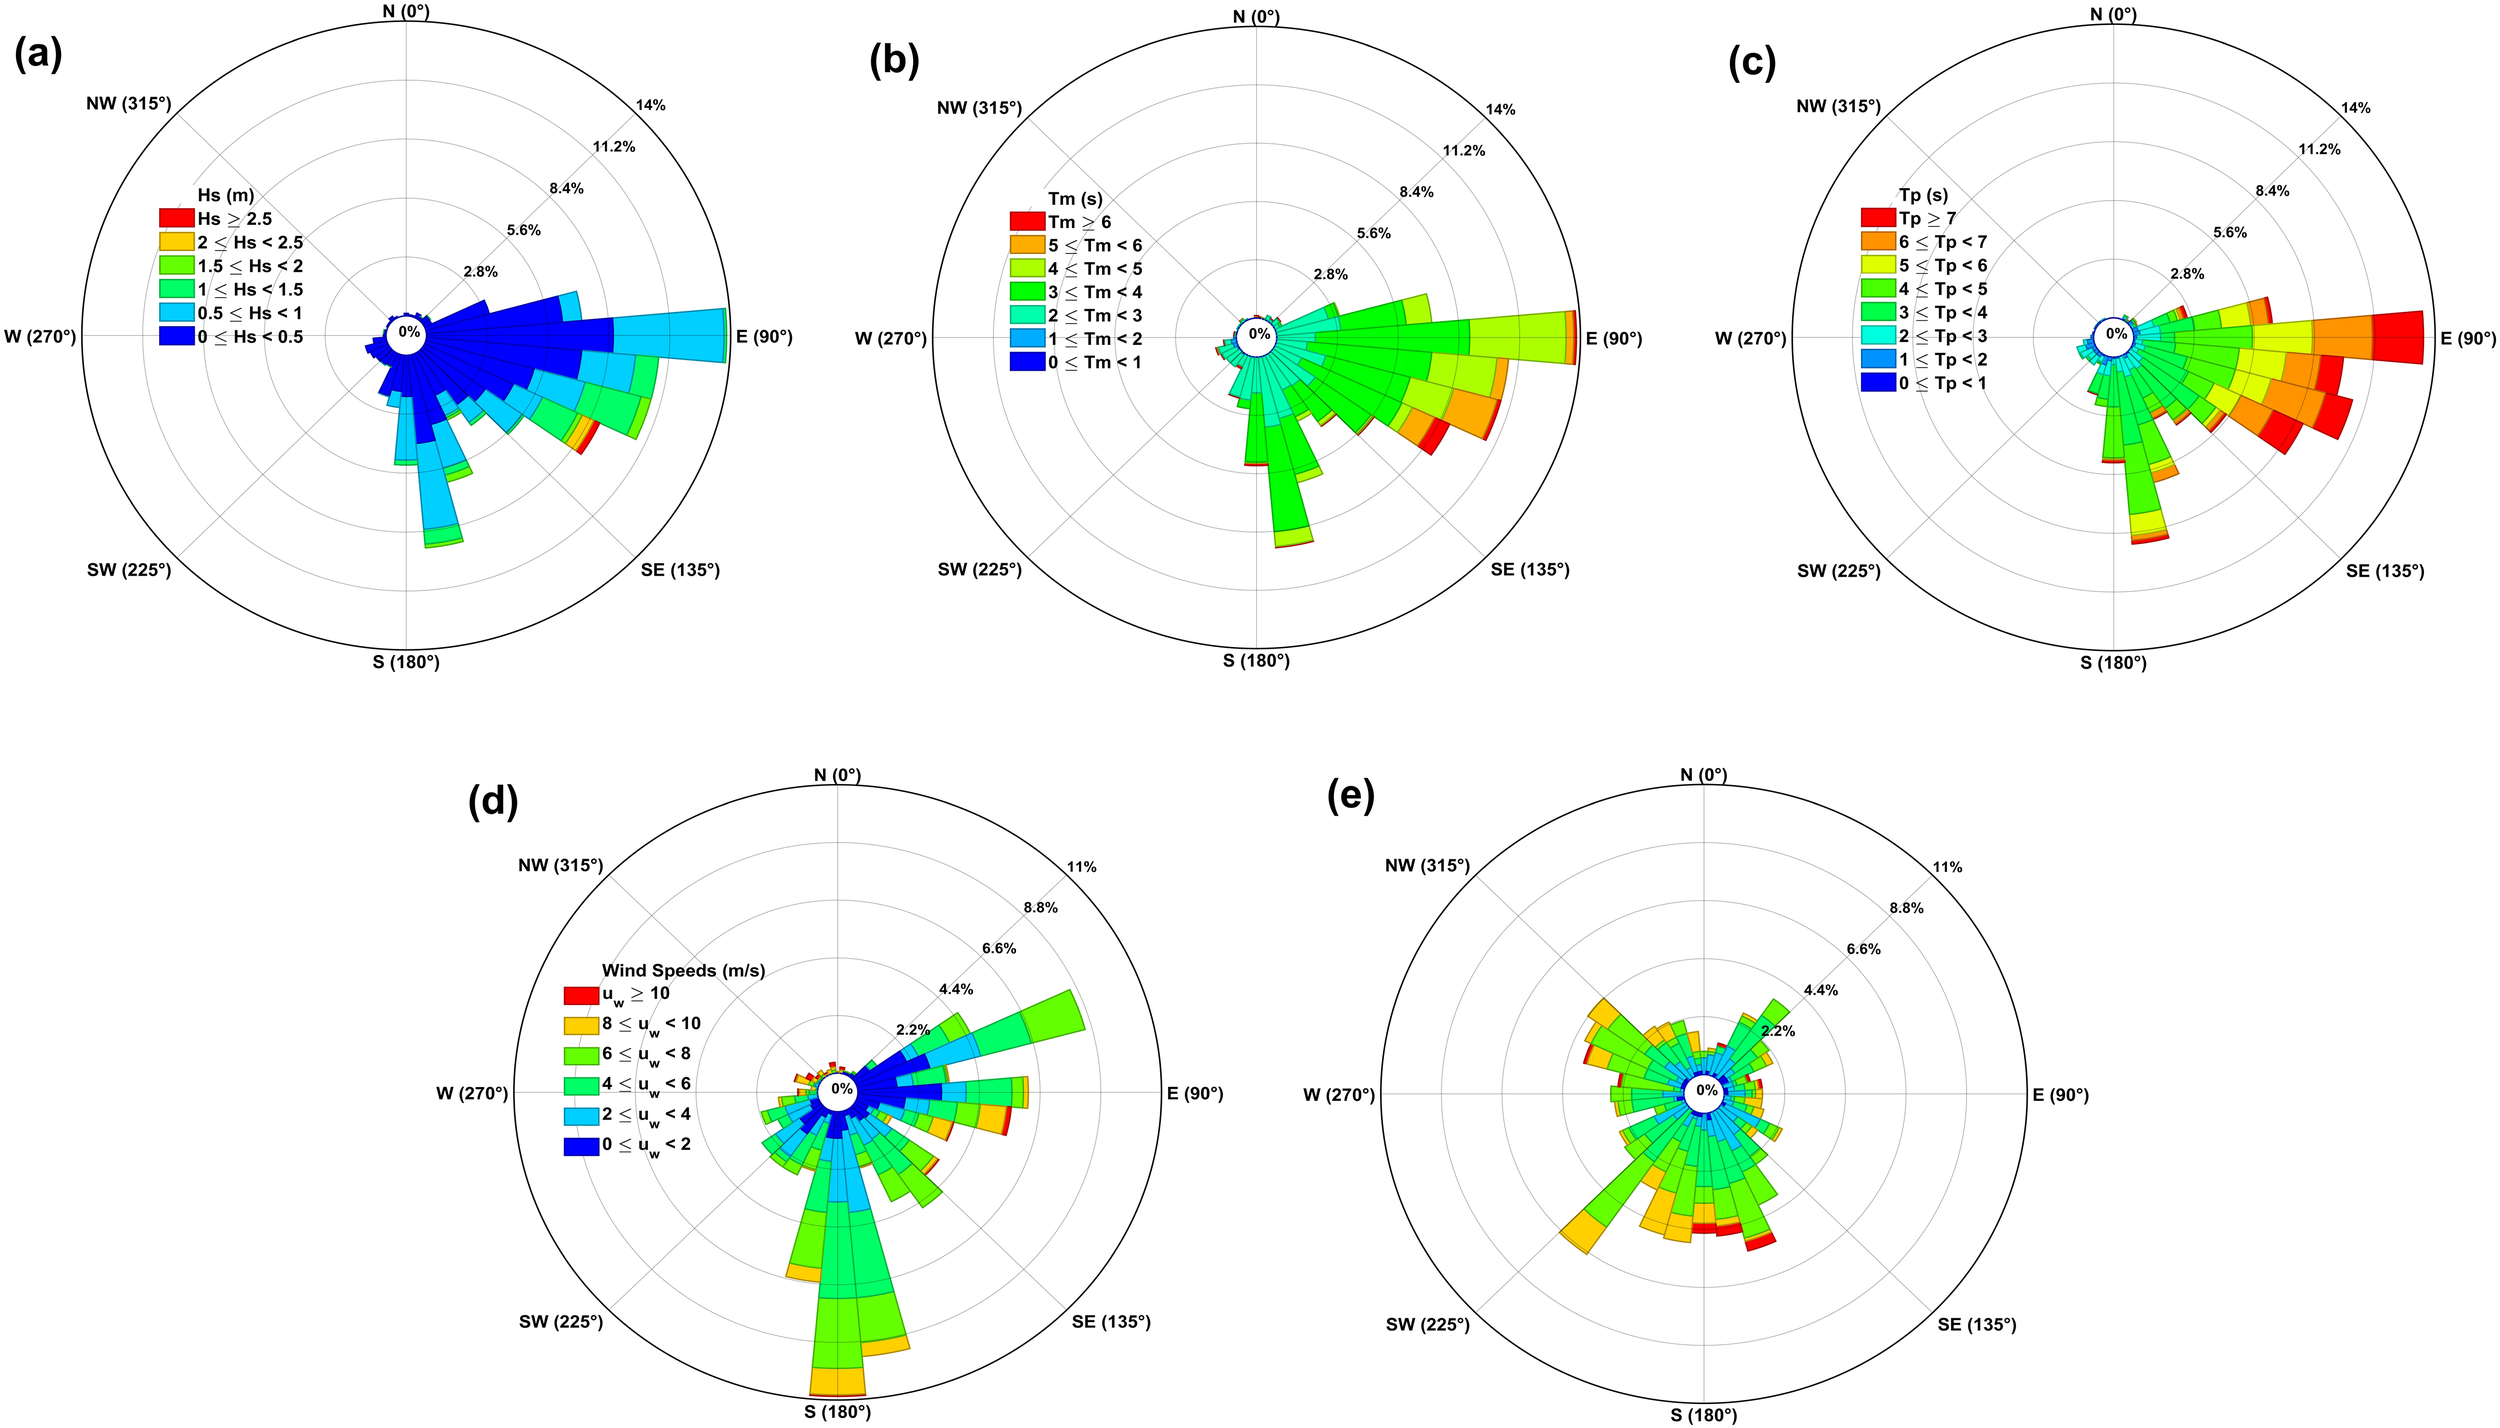
Rose diagram representing the frequency distribution of measured wave parameters (a) significant wave height (Hs) (b) mean wave period (Tm) (c) peak wave period (Tp) by mean wave direction (d) measured wind speed and (e) ERA5 wind speed at nearest grid location by wind direction.
To examine the relationship between wind and wave, near-surface wind speed and direction were compared directly with wave parameters. In-situ reveals a moderate positive correlation of R = 0.6 between observed Hs and wind speed (Figure 5a). Additionally, ERA5 wind data from the nearest offshore grid point were compared with in-situ Hs, revealing a correlation of R = 0.5. Wind direction data from both the Spotter buoy and ERA5 also showed a correlation of R = 0.5 with observed wave directions, reinforcing the consistency between local wind fields and wave patterns (Figure 5b). Rose diagrams (Figures 4d, e) show that although stronger winds are often associated with higher Hs, exceptions exist. Some instances of high wind speed resulted in low Hs, likely due to unfavorable wind direction relative to available fetch. Most wind events (60%) were directed southwest, with 30% from the north-northwest. ERA5 wind directions were more evenly distributed but still showed southwest dominance. This further supports the influence of fetch-limited conditions, where even high wind speeds may not lead to large wave development (Holthuijsen, 2010; Young, 1999).
Figure 5
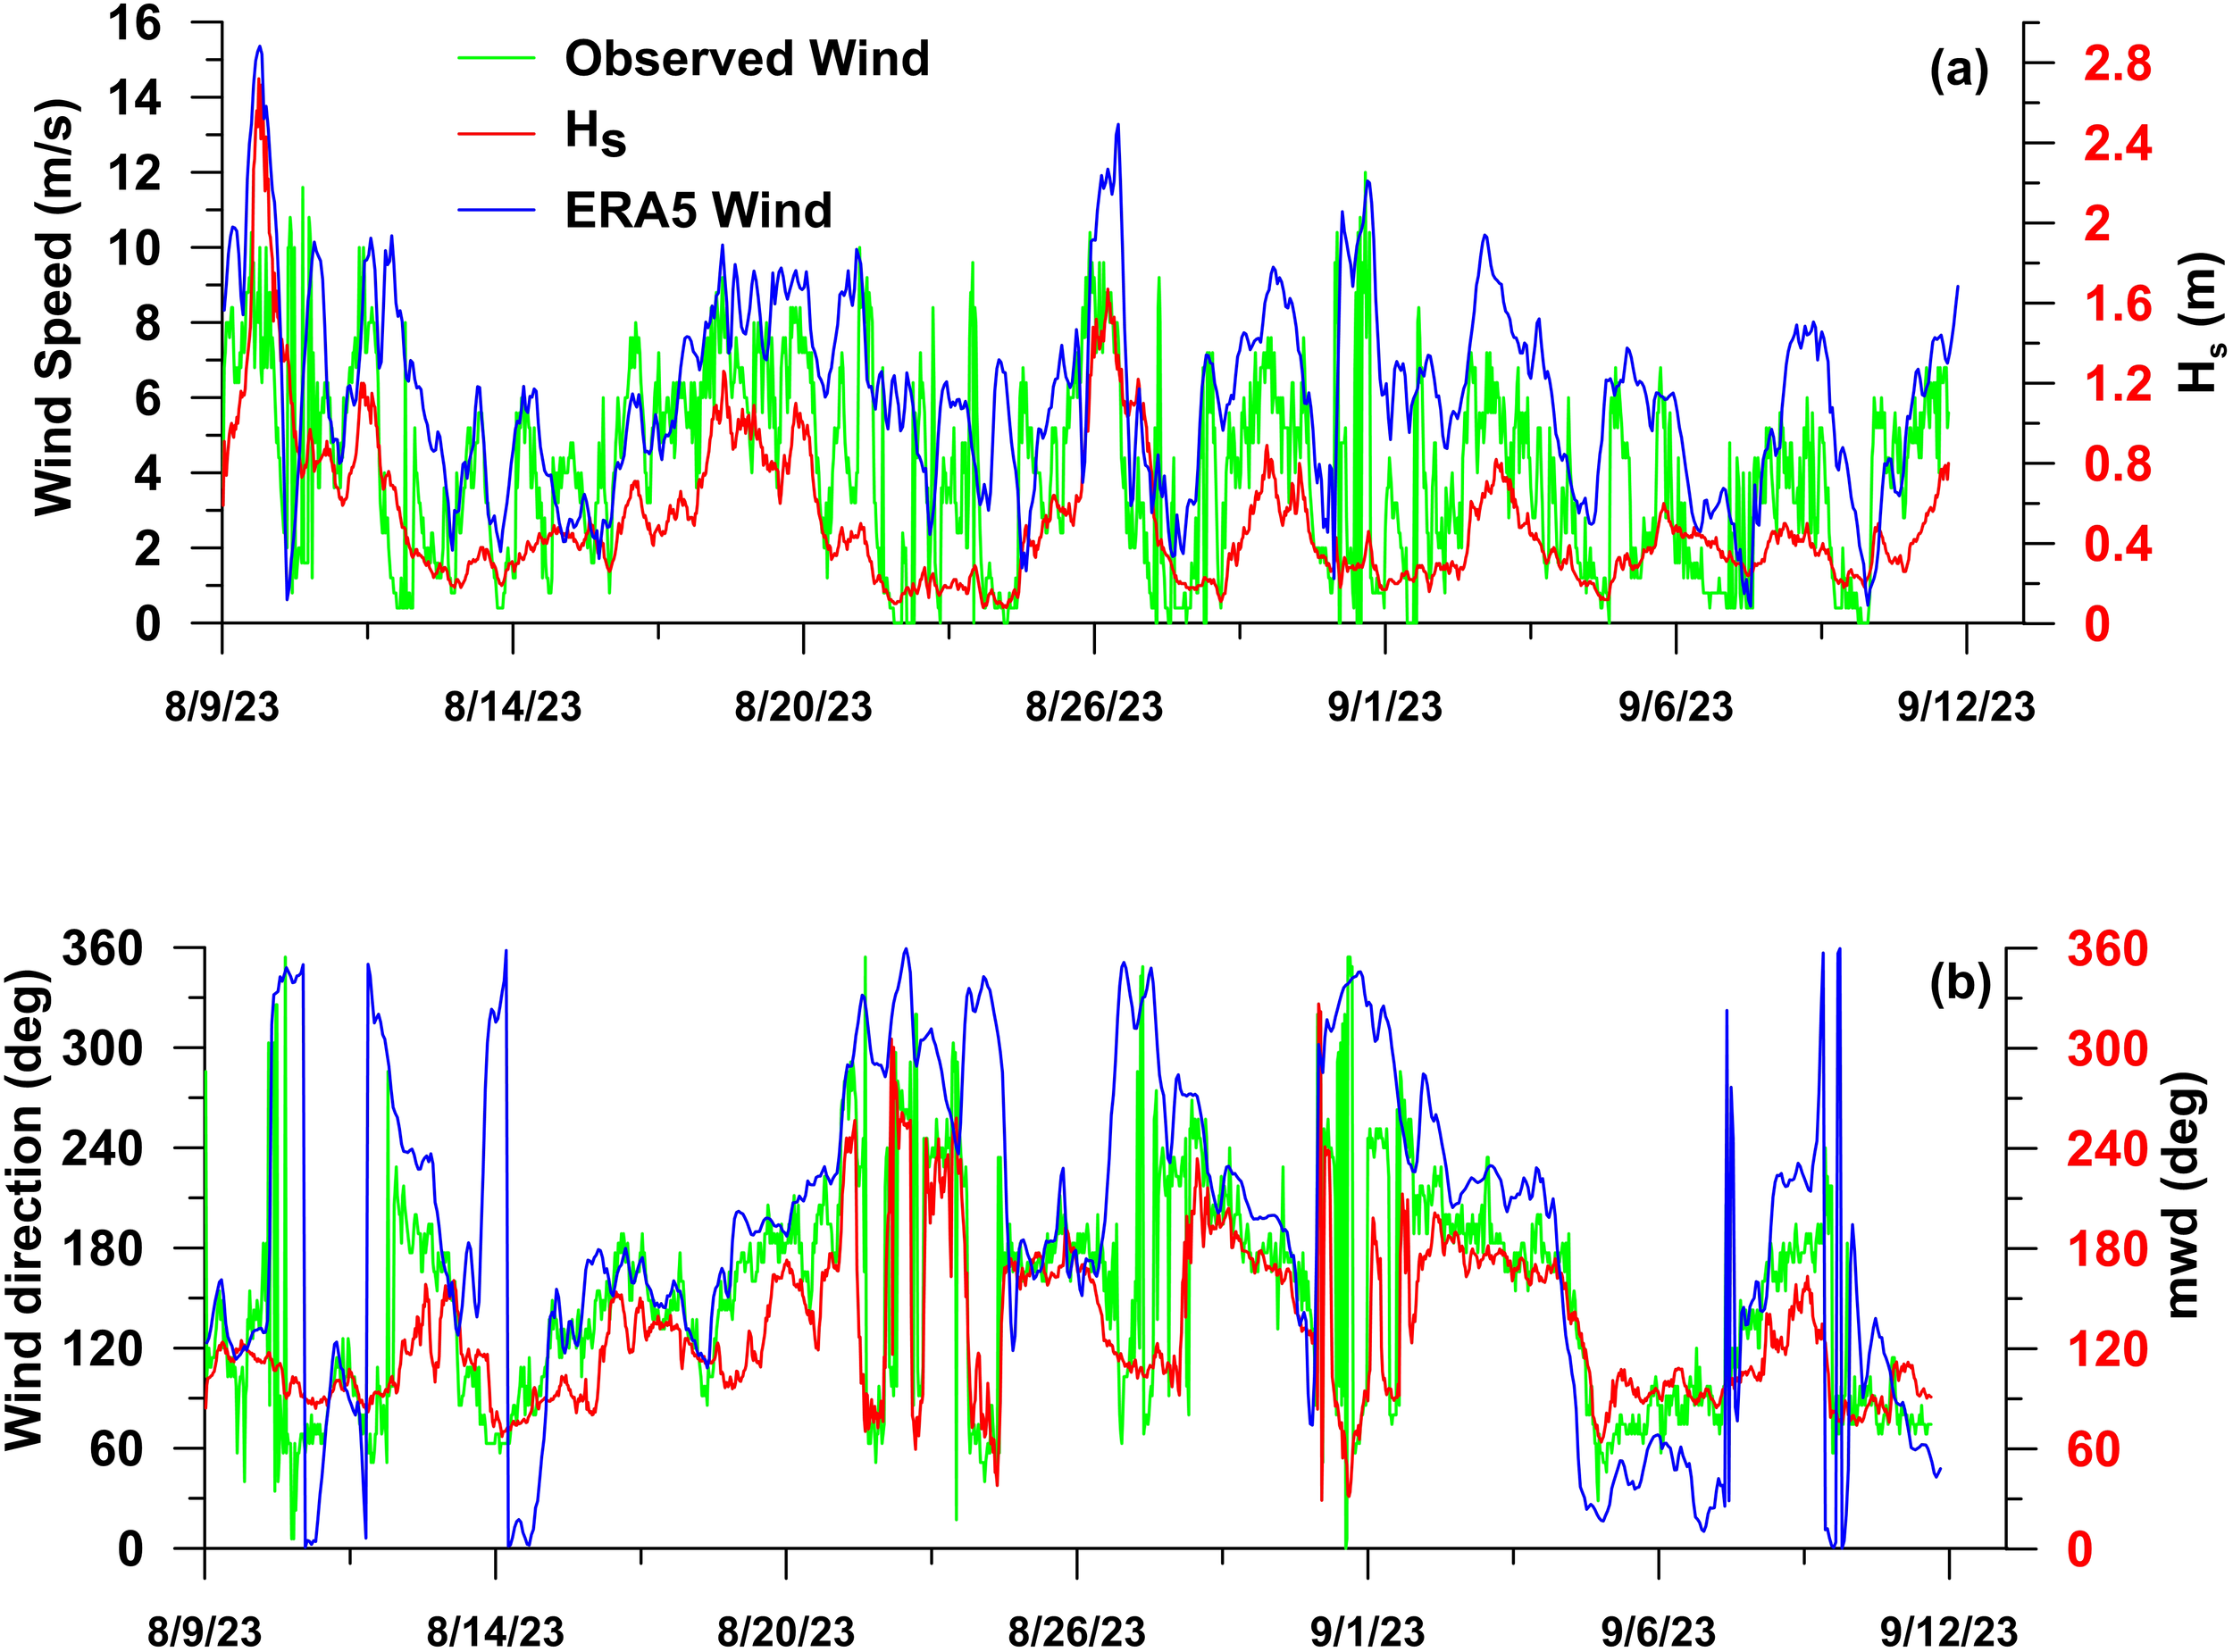
Time series comparison of (a) measured significant wave height (Hs),wind speed and ERA5 wind speed (b) measured mean wave direction, wind direction and ERA5 wind direction in the study region.
It is acknowledged that the limited temporal scope of the in-situ observations may not fully capture longer-term or seasonal variability. Despite its short duration, the buoy dataset helped confirm the dominance of locally generated wind-seas in the region and the minimal influence of Atlantic swell, consistent with previous studies (Ardhuin et al., 2010; Ruest et al., 2013). To address the limitations of the short in situ deployment, three years of ERA5 reanalysis data were analyzed to provide a more comprehensive understanding of the regional wave climate and its implications for potential LST across the study domain. The Spotter buoy observations were used to validate the ERA5-derived wave parameters, and this validated ERA5 dataset will be further utilized to investigate wave dynamics at multiple temporal scales, supporting a more robust assessment of wave-driven processes along the Shippagan coast. These aspects are further explored in the following sections, where the spatial and temporal variability of wave climate and associated LST patterns are discussed in greater detail.
4.2.2 In-situ vs ERA5 comparison
Continuous data collection throughout the year in the GSL region is challenging due to extreme weather and ice formation during winter, which can damage or result in the loss of instruments. To extend the dataset for long-term wave climate analysis, in-situ summer wave observations were compared with ERA5 reanalysis data extracted from the nearest offshore grid point (~60 m water depth), located approximately 50 km from the Spotter buoy site. This comparison aims to provide a comprehensive understanding of the wave climate despite the difficulties in maintaining year-round data collection. The measured wave parameters were compared to ERA5 wave parameters and are presented in Figure 6. Hs from the ERA5 dataset were in reasonable agreement with the nearshore observations during the period of measurement, with R = 0.92, BIAS = -0.16 m, and RMSE = 0.2 m. Additionally, we applied the wave transformation equation proposed by Larson et al. (2010) to convert deep water wave characteristics to nearshore conditions. This approach allowed us to estimate wave parameters within the breaking zone and subsequently compute LST, following a widely accepted methodology (Almar et al., 2015; Chowdhury and Behera, 2017). The transformed breaker wave heights were then compared with in-situ observations, as shown in Figure 6A. Results indicate strong agreement between the transformed Hs and observed values, with a correlation coefficient, R=0.91, BIAS = –0.12 m, and RMSE = 0.25 m, supporting the reliability of this method for LST computations. For mean wave periods, R = 0.88, BIAS = -0.63 s, and RMSE = 0.8 s. Waves in the study region predominantly originate from the southeast (90° &180°), driven by geological factors that allow for an extensive fetch in this direction. In contrast, waves from the west (180° & 360°) are minimal due to the presence of land, which limits the fetch and wave development. However, ERA5 wave direction underpredicts/overpredicts are widely acknowledged by several researchers (Anusree and Kumar, 2024), resulting in a low correlation (R = 0.57), high bias and RMSE values (-23 deg and 70 deg).
Figure 6
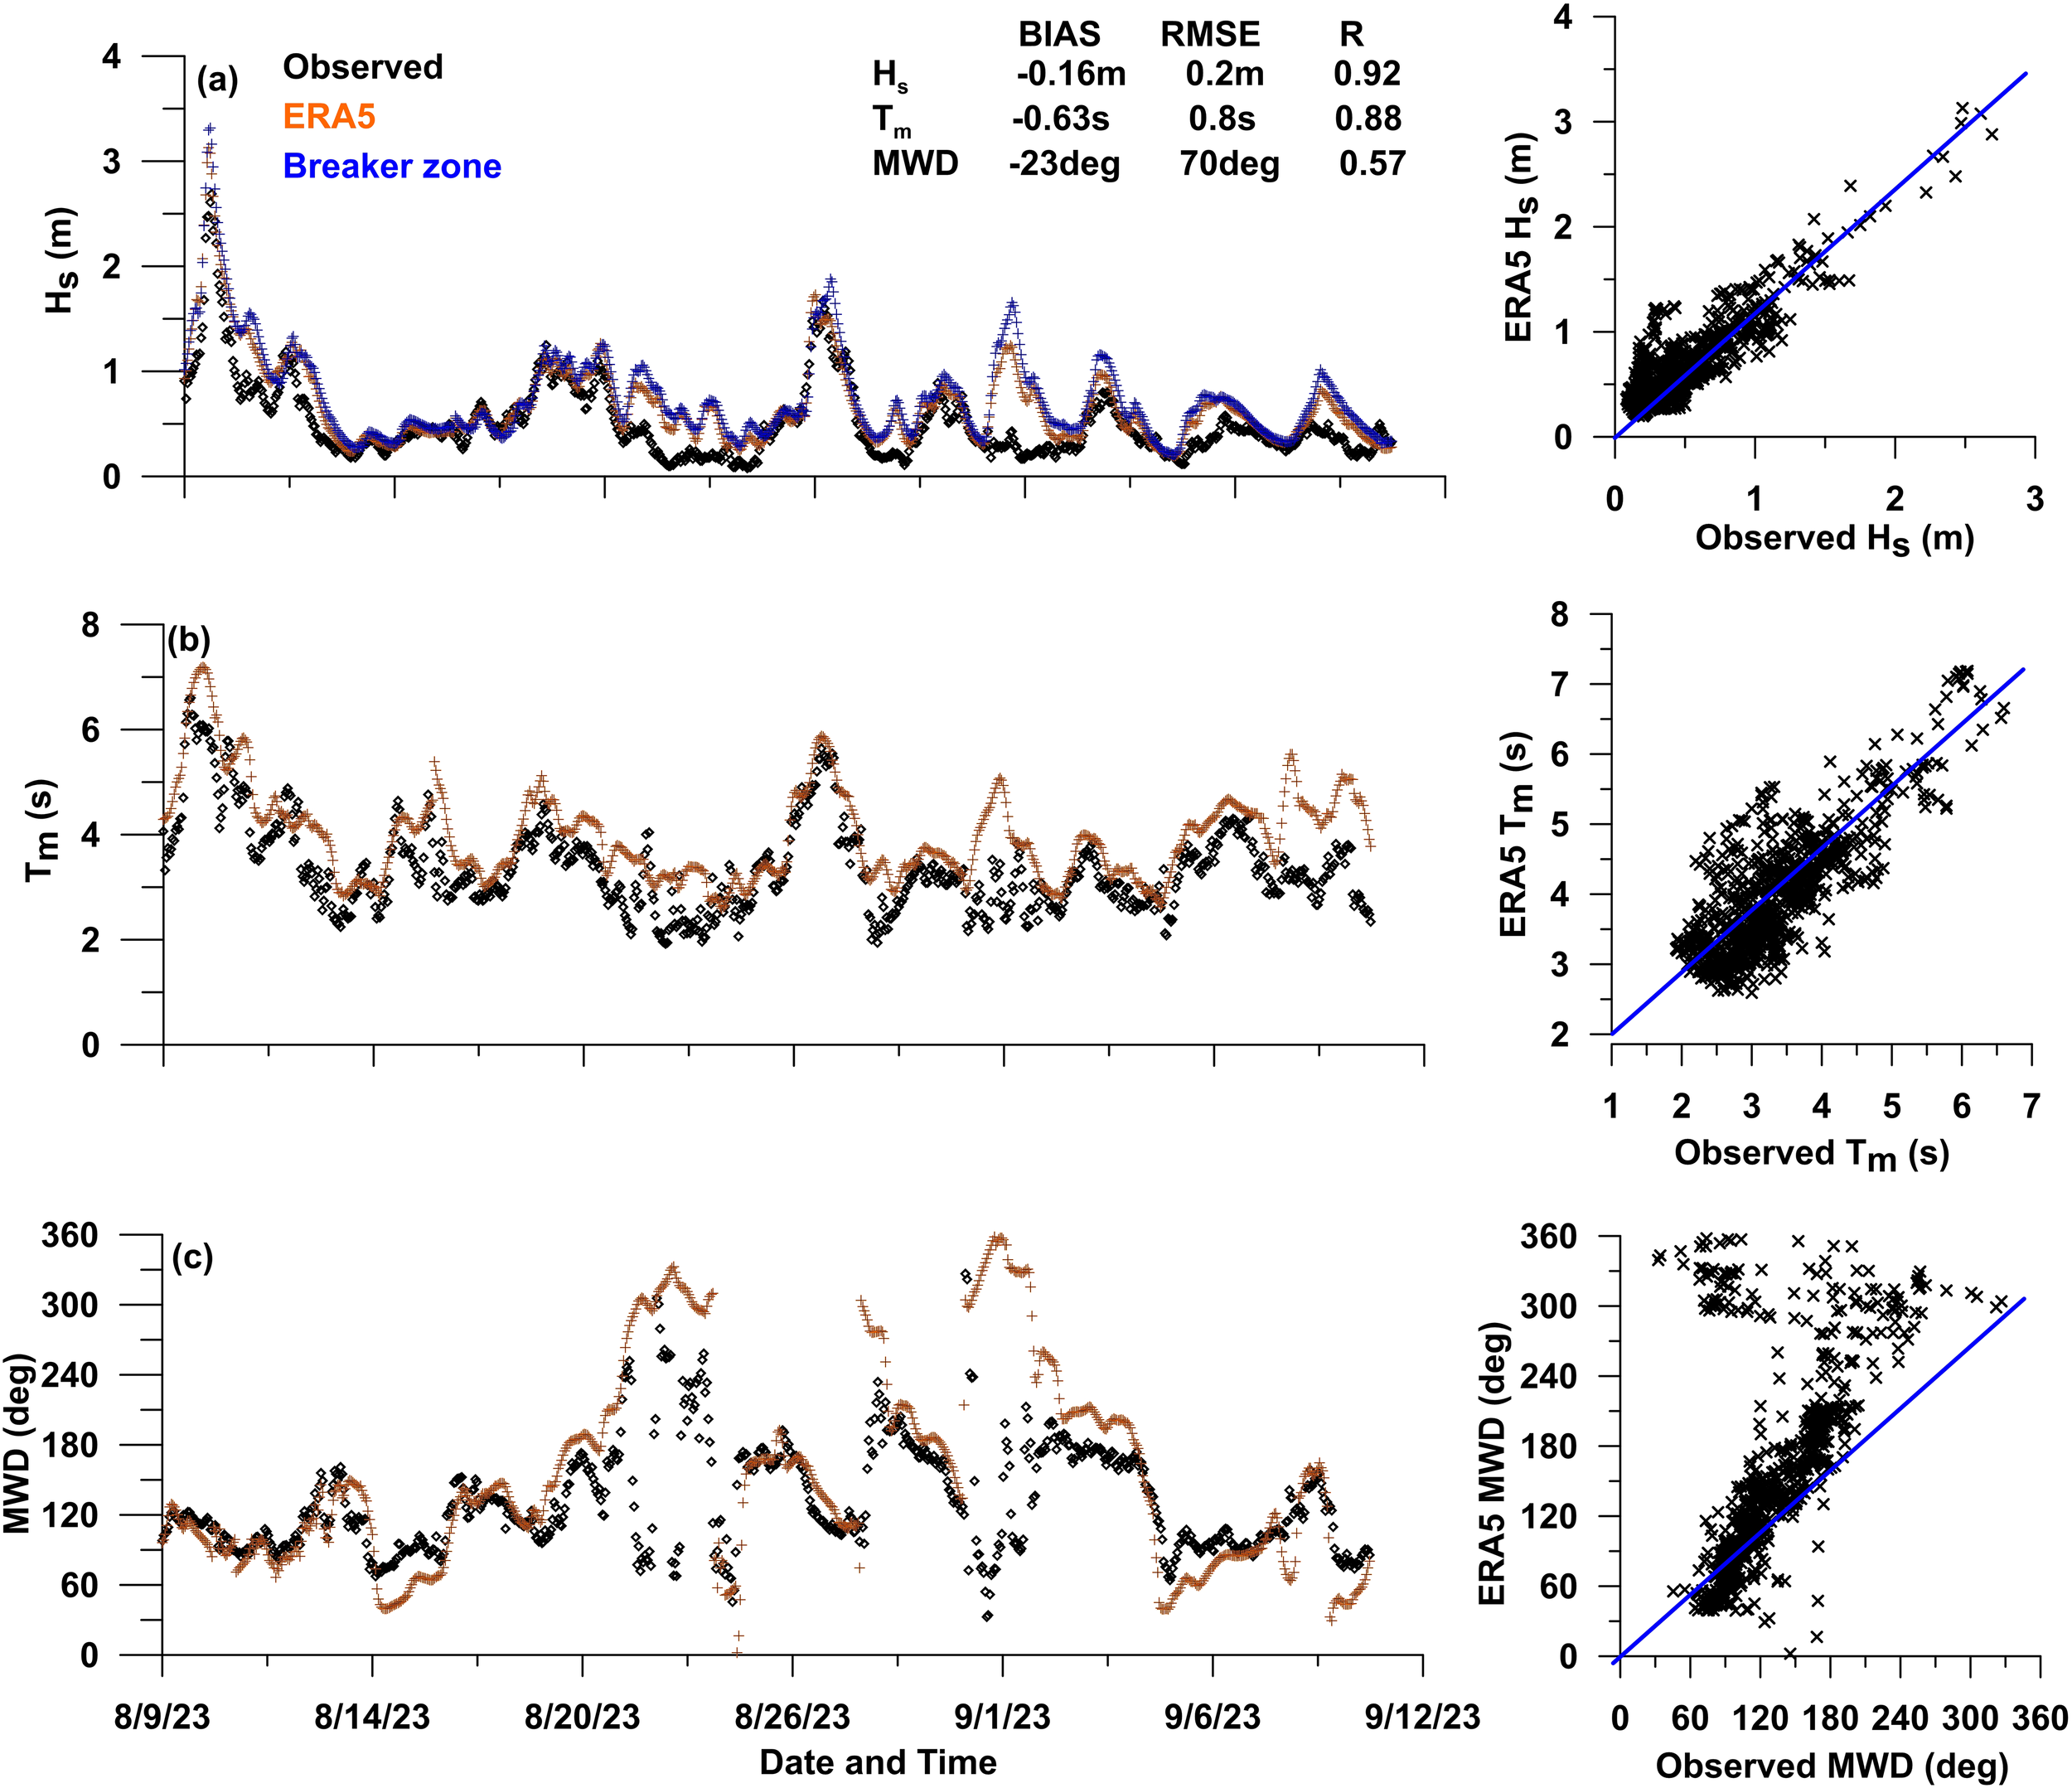
Comparison between (a) measured Hs, ERA5 Hs and Breaker zone Hs(b) measured and ERA5 mean wave period (Tm) and (c) measured and ERA5 mean wave direction (mwd) from the study region.
4.2.3 Wave characteristics from ERA5
The wave parameters over three years (2021-2023), obtained from the nearest available grid point to the study region (Figure 7). The analysis of wave characteristics in the study area, based on ERA5 wave data from 2021 to 2023, reveals significant seasonal fluctuations and notable extreme wave events (Figure 7). The Shippagan coast of the Gulf of St. Lawrence experiences seasonal sea-ice formation, which is evident from gaps in the wave data (Figure 7) and is explicitly accounted for in the ERA5 reanalysis. During ice-covered periods, wave energy is dissipated through interactions with the ice cover. As a result, no wave activity in the surf zone. The annual mean Hs for 2021, 2022, and 2023 was 1.2 m, 1.2 m, and 1.1 m, respectively, with a maximum inter-annual variation of less than 4%. During the study period, Hs reaches a maximum of 7.6 m (September 2022) in response to the post-tropical storm Fiona followed by a maximum of 7.3 m (December 2022) due to winter storms (Figure 7). Interestingly, the maximum Hs did not exceed 6.0 m in other two years. The Hs values of 4.0 m or higher occurred 1% of the time in 2021 and 2023, but this increased to 2% in 2022 due to extreme post-tropical storm. Comparing post-tropical storm Ida and Lee with Fiona, the increase in the Hs is due to the track of the storm along with wind speed and the pressure variations (Figure 8). This interannual variability underscores the significant influence of extreme weather events on the study region.
Figure 7
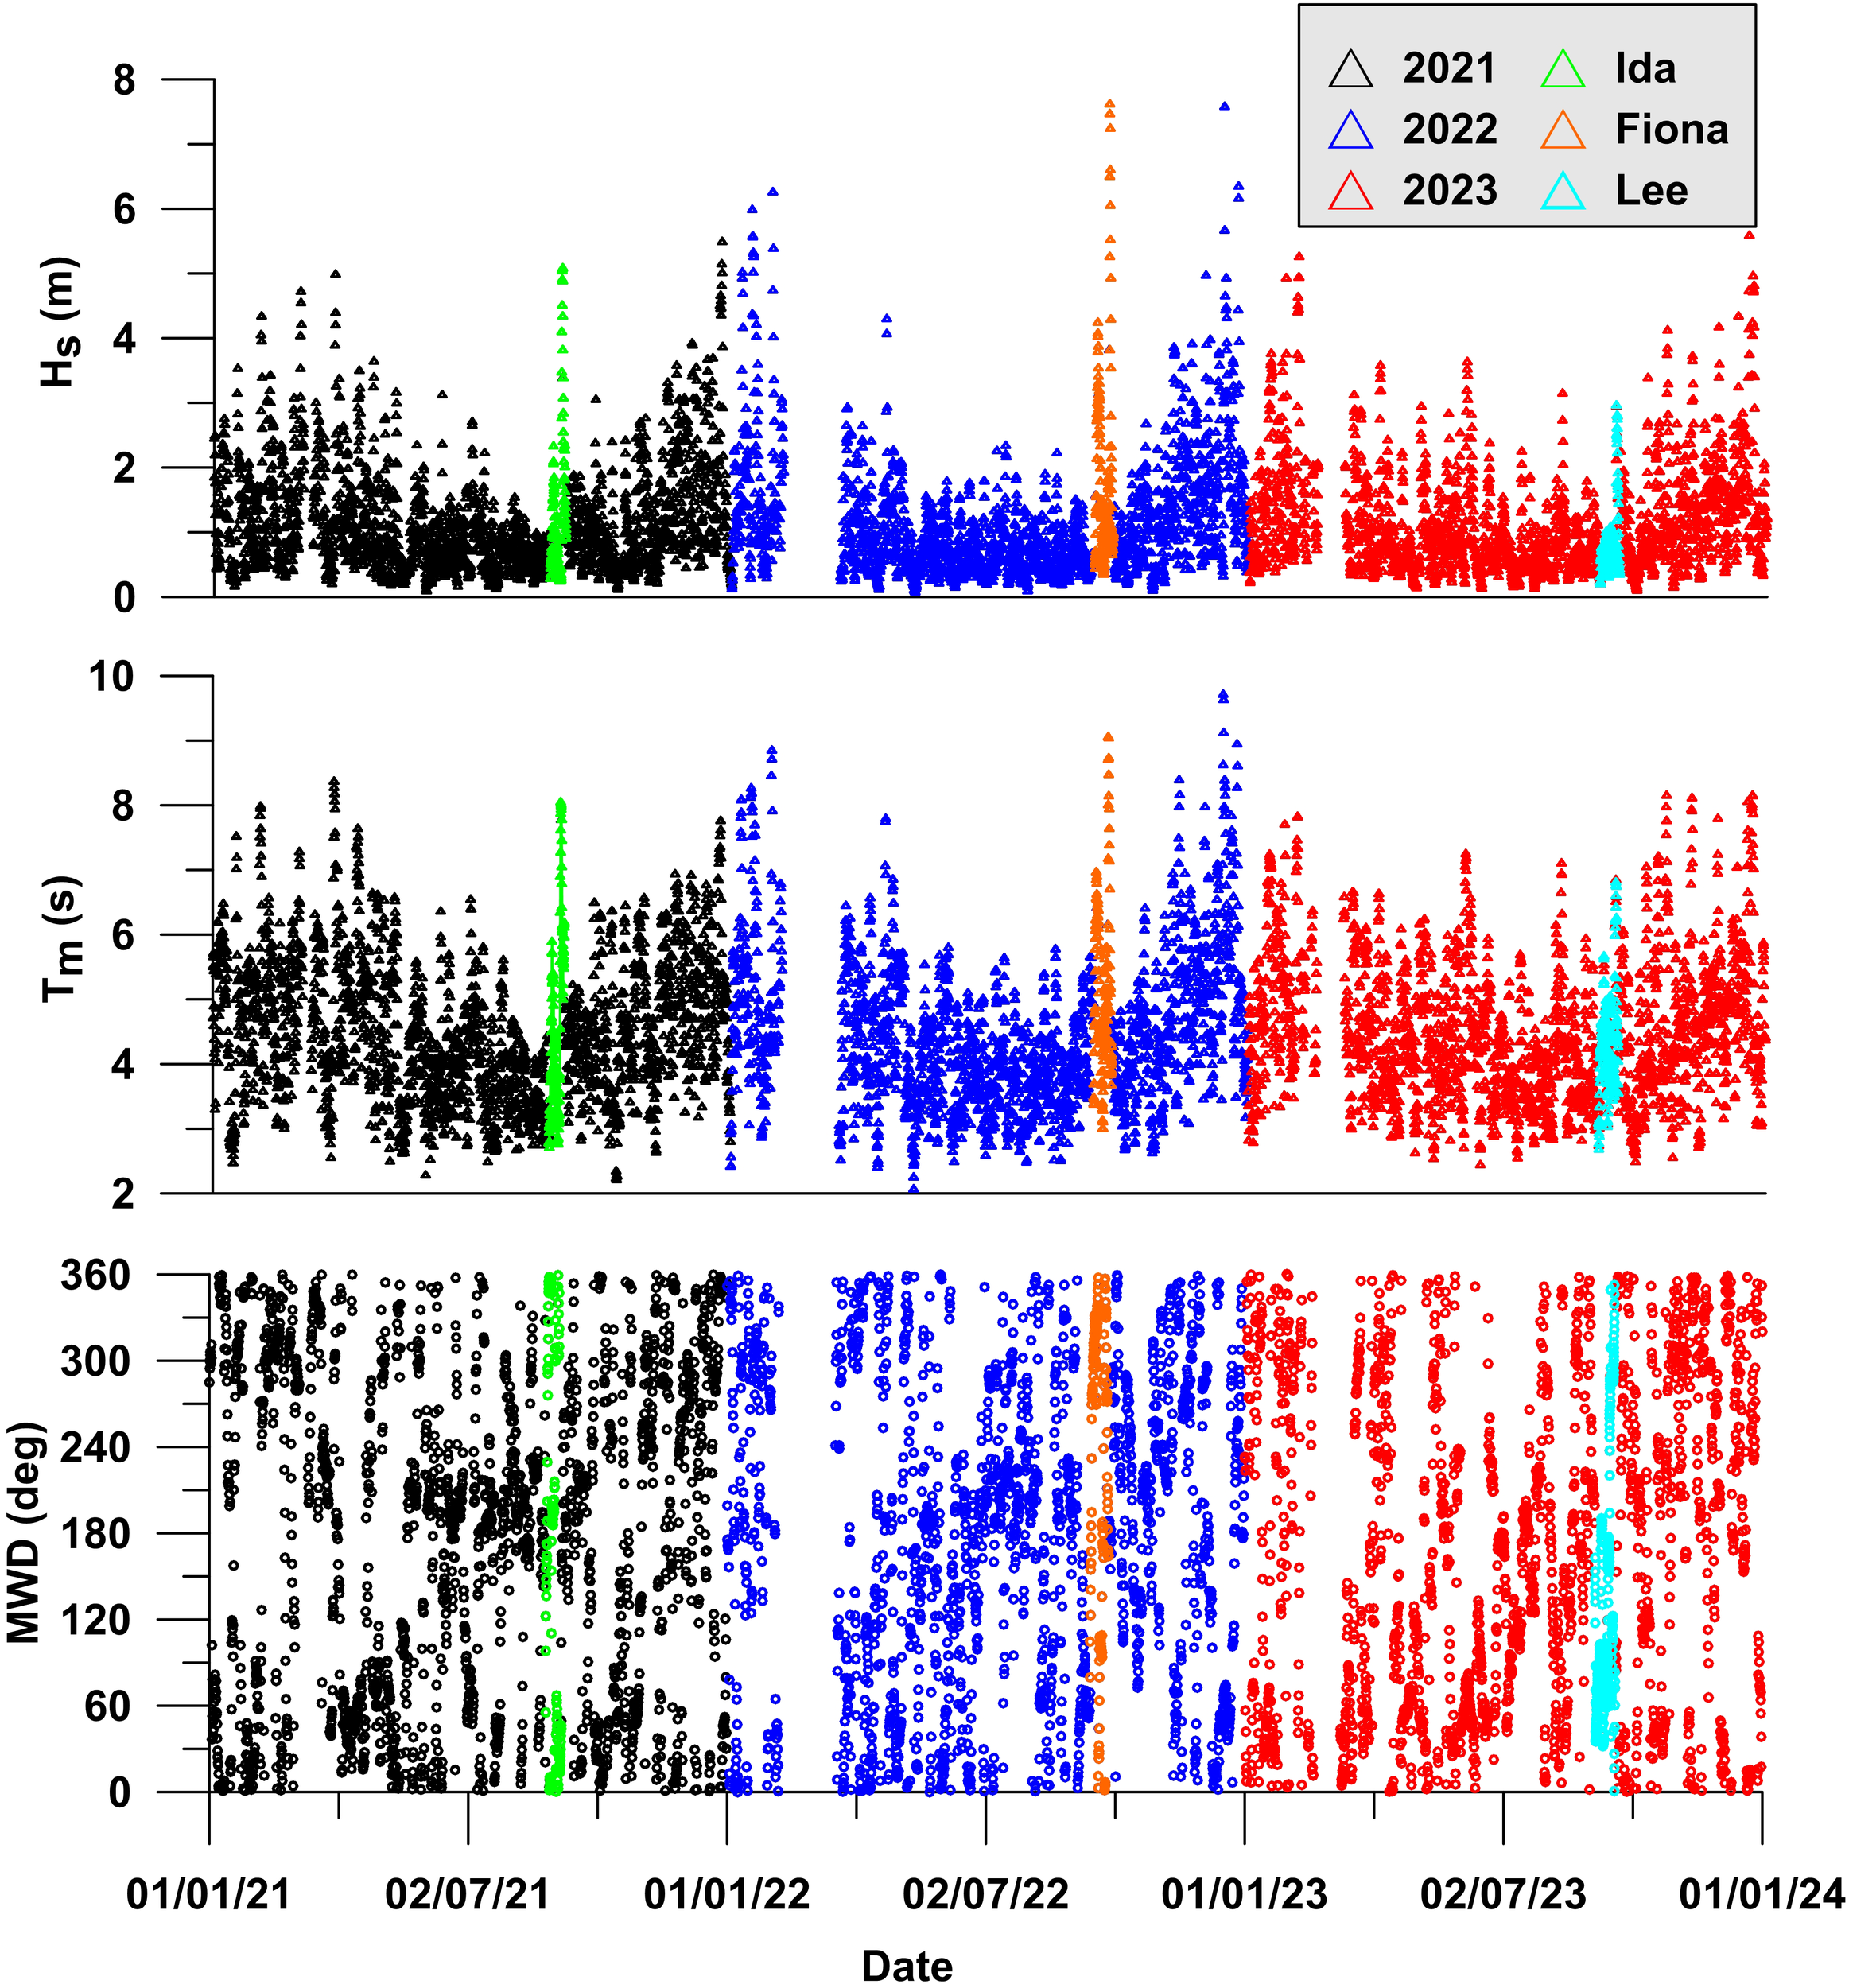
Time series plot of significant wave height (Hs), mean wave period (Tm) and mean wave direction (mwd) for 2021, 2022 and 2023 with three major hurricanes(Ida, Fiona and Lee) highlighted.
Figure 8
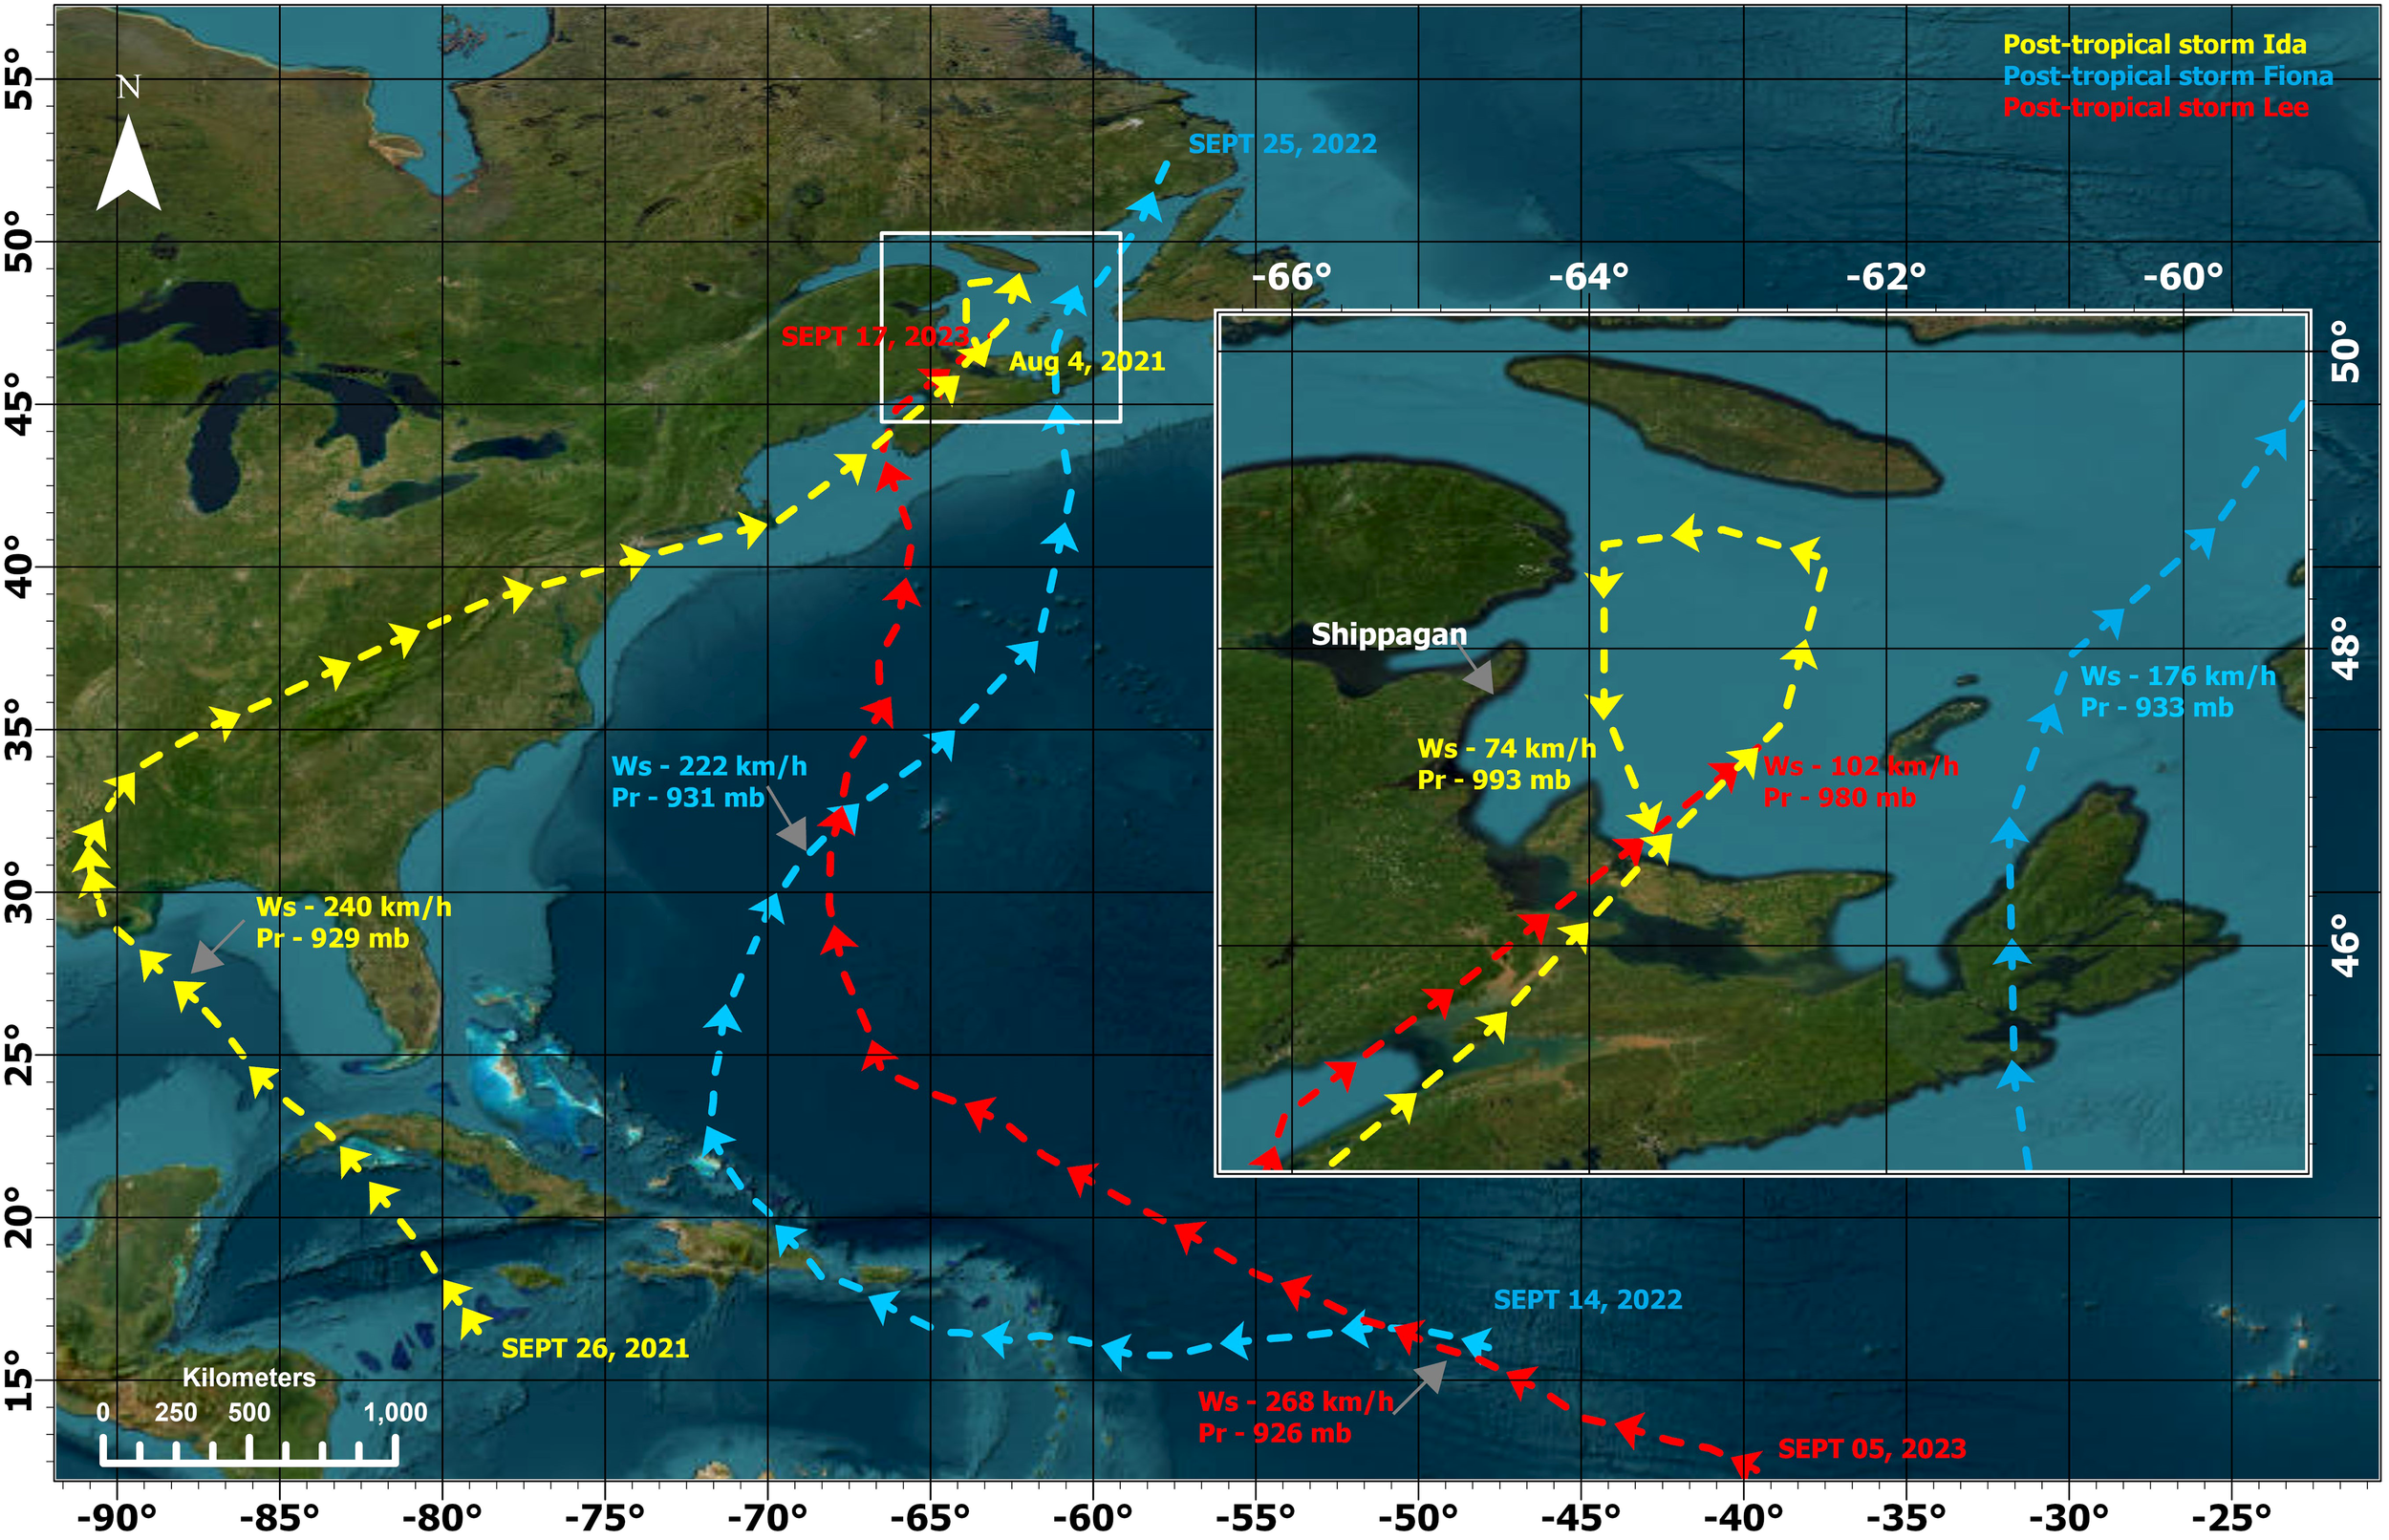
Tracks of all the three post-tropical storms along the Atlantic Ocean. Zoomed box shows the track of each storm passing through the study region. Wind speed (Ws) and Pressure (Pr) of each storm is mentioned in the figure (Source: NOAA Hurricane center).
Seasonal analysis reveals that the highest Hs was observed during the fall (September-November) and winter (December-February) seasons, coinciding with the hurricane season. During this period, Hs reached peaks of 5.7 m in winter 2021, 7.6 m in fall 2022 and 5.6 m in winter 2023. Spring exhibited the smallest Hs values due to calmer winds, while summer Hs ranged from 0.1 to 3.5 m, averaging 1 m across the three years. In 2022, the average Hs and Tm showed notable variations compared to 2021. Winter in 2022 experienced a 22.3% increase in Hs and a 7.6% increase in Tm. Spring in 2022 saw a 21.1% decrease in Hs and a 7.6% decrease in Tm. Fall showed a 5.9% increase in Hs but a slight 1.1% decrease in Tm. Summer recorded a 5.3% decrease in Hs and a 2.4% decrease in Tm (Figure 9). In 2023, the trends varied when compared to 2022. Winter in 2023 observed a 15.6% in Hs and a 6.3% decrease in Tm. Spring saw a 4.1% increase in Hs and a 1.6% increase in Tm. Fall recorded an Hs decrease of 8.8% and a Tm decrease of 1.7%. Summer showed a 12.5% increase in Hs and a 7.6% increase in Tm (Figure 9). The findings reveal that in 2022, the winter season experienced the most pronounced high wave conditions. However, in 2023, this pattern shifted, with the summer season exhibiting notably higher wave conditions. This analysis highlights clear seasonal variations in wave parameters across all three years. Annually, waves with Hs less than 2 m dominate, accounting for 85-87% of the time, while waves between 2 and 4 m occur 11-13% of the time, and those exceeding 4 m are rare, occurring 1-2% of the time. Wave direction also varied seasonally, with winter waves predominantly from the south-southwest (180-200°), shifting slightly in spring and summer to east-southeast (148-170°), and returning to south-southwest (168-200°) in the fall due to seasonal storms.
Figure 9
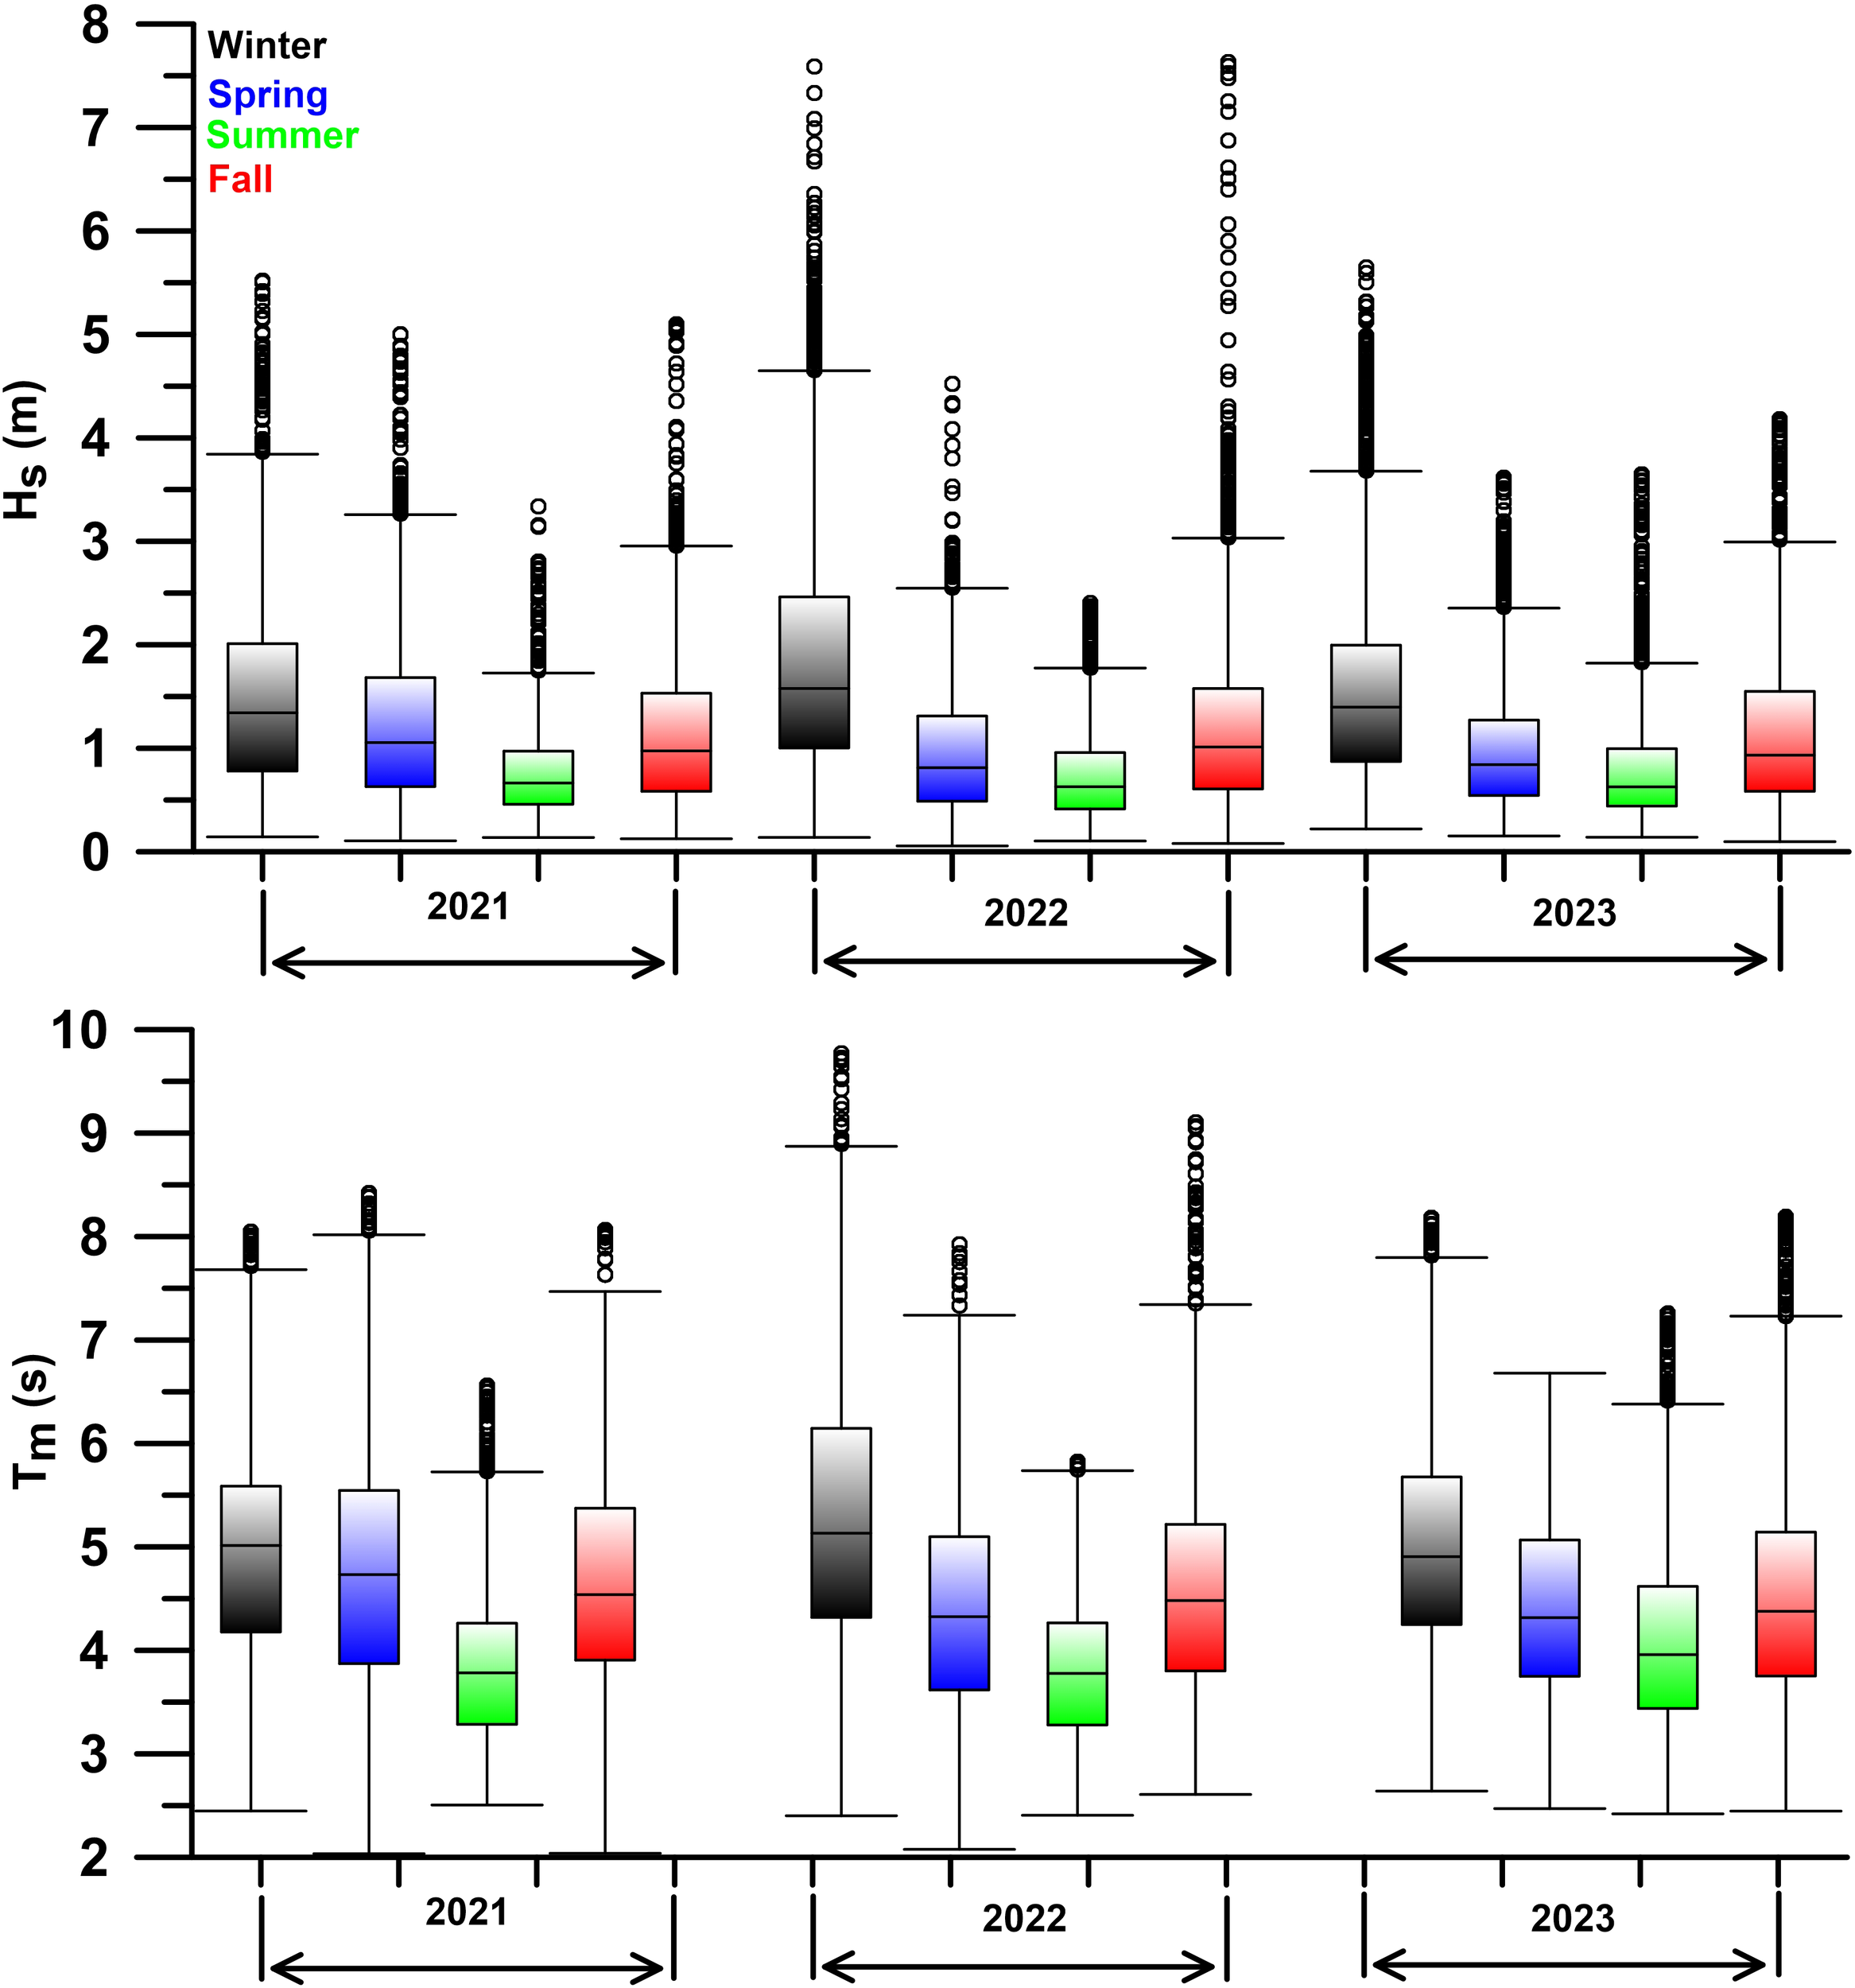
Box plot of significant wave height (Hs) and mean wave period (Tm) derived from ERA5 data for the years 2021, 2022 and 2023.
Compared to the seasonal variability, the interannual variability in Hs is relatively small, ranging from 10% to 30% depending on the season. The lowest Tm was observed in summer 2022, at around 5.8 s, while the highest Tm occurred during winter of the same year, reaching approximately 9.7 s (Figure 9). Across all years, the average Tm ranged from 8 to 9.7 s during winter, with a seasonal average Tm of 5 s. In spring, Tm ranged from 6.6-8.4 s, with an average of 4.5 s. In summer the Tm ranges from 5.8 to 7.3 s, with an average Tm of 3.8 s and in fall, Tm ranges from 8 to 9.1 s, averaging 4.5 s (Figure 9). Irrespective of seasons or years, mean wave periods are generally in the range Tm = 6.0-9.7 s. This observation aligns with previous research highlighting that the GSL’s semi-enclosed nature and frequent storm activity contribute to a wave climate primarily influenced by short to intermediate-period waves (Thomson and Emery, 2014). The above results indicate that wave activity in the GSL is predominantly driven by regional wind systems, which aligns closely with the in-situ observations described in section 4.2.
4.3 Potential longshore sediment transport rates
Potential LST rates were estimated using the widely-used bulk empirical formulae, i.e., CERC, Komar and Kaczmarek formulae, for the years 2021, 2022 and 2023 which rely primary on breaker wave characteristics. Although several other LST formulations exist (e.g., Kamphuis, 1991; Bayram et al., 2007; Van Rijn, 2014), their application requires site-specific inputs such as beach face slope and median sediment grain size (D₅₀), which are currently unavailable for our current analysis. According to CERC formula, the estimated rates were 1.7x10⁵ m3, -6.0 x10⁵ m3 and 6.4 x10⁵ m3, respectively. In contrast, Kaczmarek provided estimates of -3.2 x10⁵ m3, -6.1 x10⁵ m3 and -1.8 x10⁵ m3 for the same years (Table 1). Gross potential LST rates vary from 21.8 to 24.7 x 10⁵ m³ using the CERC method and from 7.6 to 9.5 x 10⁵ m³ using the Kaczmarek equation. Estimates from Komar formula, the net potential LST rates were 1.8x10⁵ m3, -6.2 x10⁵ m3 and 6.5 x10⁵ m3 and gross transport rates ranging from 22.3 to 25.6 x 10⁵ m³. These values were generally consistent with the CERC estimates, as both methods rely on similar wave breaking parameters. A positive sign indicates sediment transport towards the northwest, while a negative sign represents transport towards the southeast, relative to the shoreline alignment in the Shippagan region. This directional discrepancy is primarily due to differences in the sensitivity of each formula to wave energy, and their respective parameterizations such as the power of breaker height (Hb) used combined with the influence of seasonal and event-scale variability in wave conditions. Hourly potential LST rates (Figure 10) were estimated using three different formulas, and the results indicate that winter is the dominant season for major transport, followed by fall and spring, with summer being the period of least transport during the time of calculation. Additionally, three post-tropical storms and their associated potential LST rates were analyzed. Among these storms, the highest transport occurred in 2022 due to Fiona, followed by IDA in 2021, and the lowest transport was associated with Lee in 2021 (Figure 10). Notably, the potential LST rates estimated using the CERC and Komar formulas were four times higher compared to those calculated with the Kaczmarek formula, primarily due to differences in the equation parameters. These potential LST estimation rates align with the previous study in the GSL by Armon and McCann (1977) and the results showed that the net potential LST is directed southeastwards. However, this does not provide a direct one-to-one comparison, as the range of values is derived from a previous study where shoreline alignment and wave characteristics differ from those in the current study area. Nonetheless, it remains the closest available study relevant to the present study region. The different methods resulted in significant variations in the gross and net potential LST rates. The CERC, Kaczmarek and Komar equations offer insights into the potential ranges of potential LST along the study area. Due to the site-specific coefficients inherent in each equation, direct comparisons of potential LST estimates from CERC, Kaczmarek and Komar formulas are not feasible. For example, the CERC method is sensitive to wave breaking parameters and best suited for uniform sandy beaches (Van Rijn, 2014), while Kaczmarek incorporates energy flux and sediment response, and Komar relies on simplified wave power formulations. Additionally, critical factors such as sea ice which suppresses wave activity and halts sediment transport during ice-covered periods and spatial variations in sediment size and beach slope are not accounted for in these formulas, further limiting their accuracy in complex environments like the Shippagan coast. Numerous researchers have reported the potential ranges of LST rates at various locations globally, highlighting the variability and site dependency of these estimates (Kamphuis (1991), Bayram et al. (2001), and Mil-Homens et al. (2013)).
Table 1
| LST (105 m3) | 2021 | 2022 | 2023 | |||||||
|---|---|---|---|---|---|---|---|---|---|---|
| Kaczmarek | CERC | Komar | Kaczmarek | CERC | Komar | Kaczmarek | CERC | Komar | ||
| Annual | Net | -3.2 | 1.7 | 1.8 | -6.1 | -6.0 | -6.2 | -1.8 | 6.4 | 6.5 |
| Gross | 8.5 | 22.6 | 23.3 | 9.5 | 21.8 | 22.3 | 7.6 | 24.7 | 25.6 | |
| Winter | Net | -1.6 | -0.8 | -0.8 | -3.1 | -2.9 | -2.9 | -0.5 | 7.6 | 7.8 |
| Gross | 3.2 | 7.8 | 8.1 | 4.7 | 10.9 | 11.2 | 3.7 | 13.4 | 14.0 | |
| Spring | Net | -0.9 | 1.1 | 1.1 | -0.3 | 0.5 | 0.5 | -0.3 | 0.5 | 0.5 |
| Gross | 2.7 | 7.4 | 7.6 | 1.0 | 2.8 | 2.9 | 1.2 | 3.2 | 3.2 | |
| Summer | Net | -0.3 | 0.8 | 0.8 | -1.2 | -1.7 | -1.8 | -0.4 | -2.4 | -2.5 |
| Gross | 1.3 | 3.5 | 3.6 | 1.7 | 3.4 | 3.5 | 0.9 | 3.2 | 3.3 | |
| Fall | Net | -0.4 | 0.7 | 0.7 | -1.5 | -1.9 | -2.0 | -0.6 | 0.7 | 0.7 |
| Gross | 1.4 | 3.9 | 4.0 | 2.1 | 4.6 | 4.7 | 1.8 | 5.0 | 5.1 | |
Net and gross potential LST rates by season during 2021 to 2023.
Figure 10
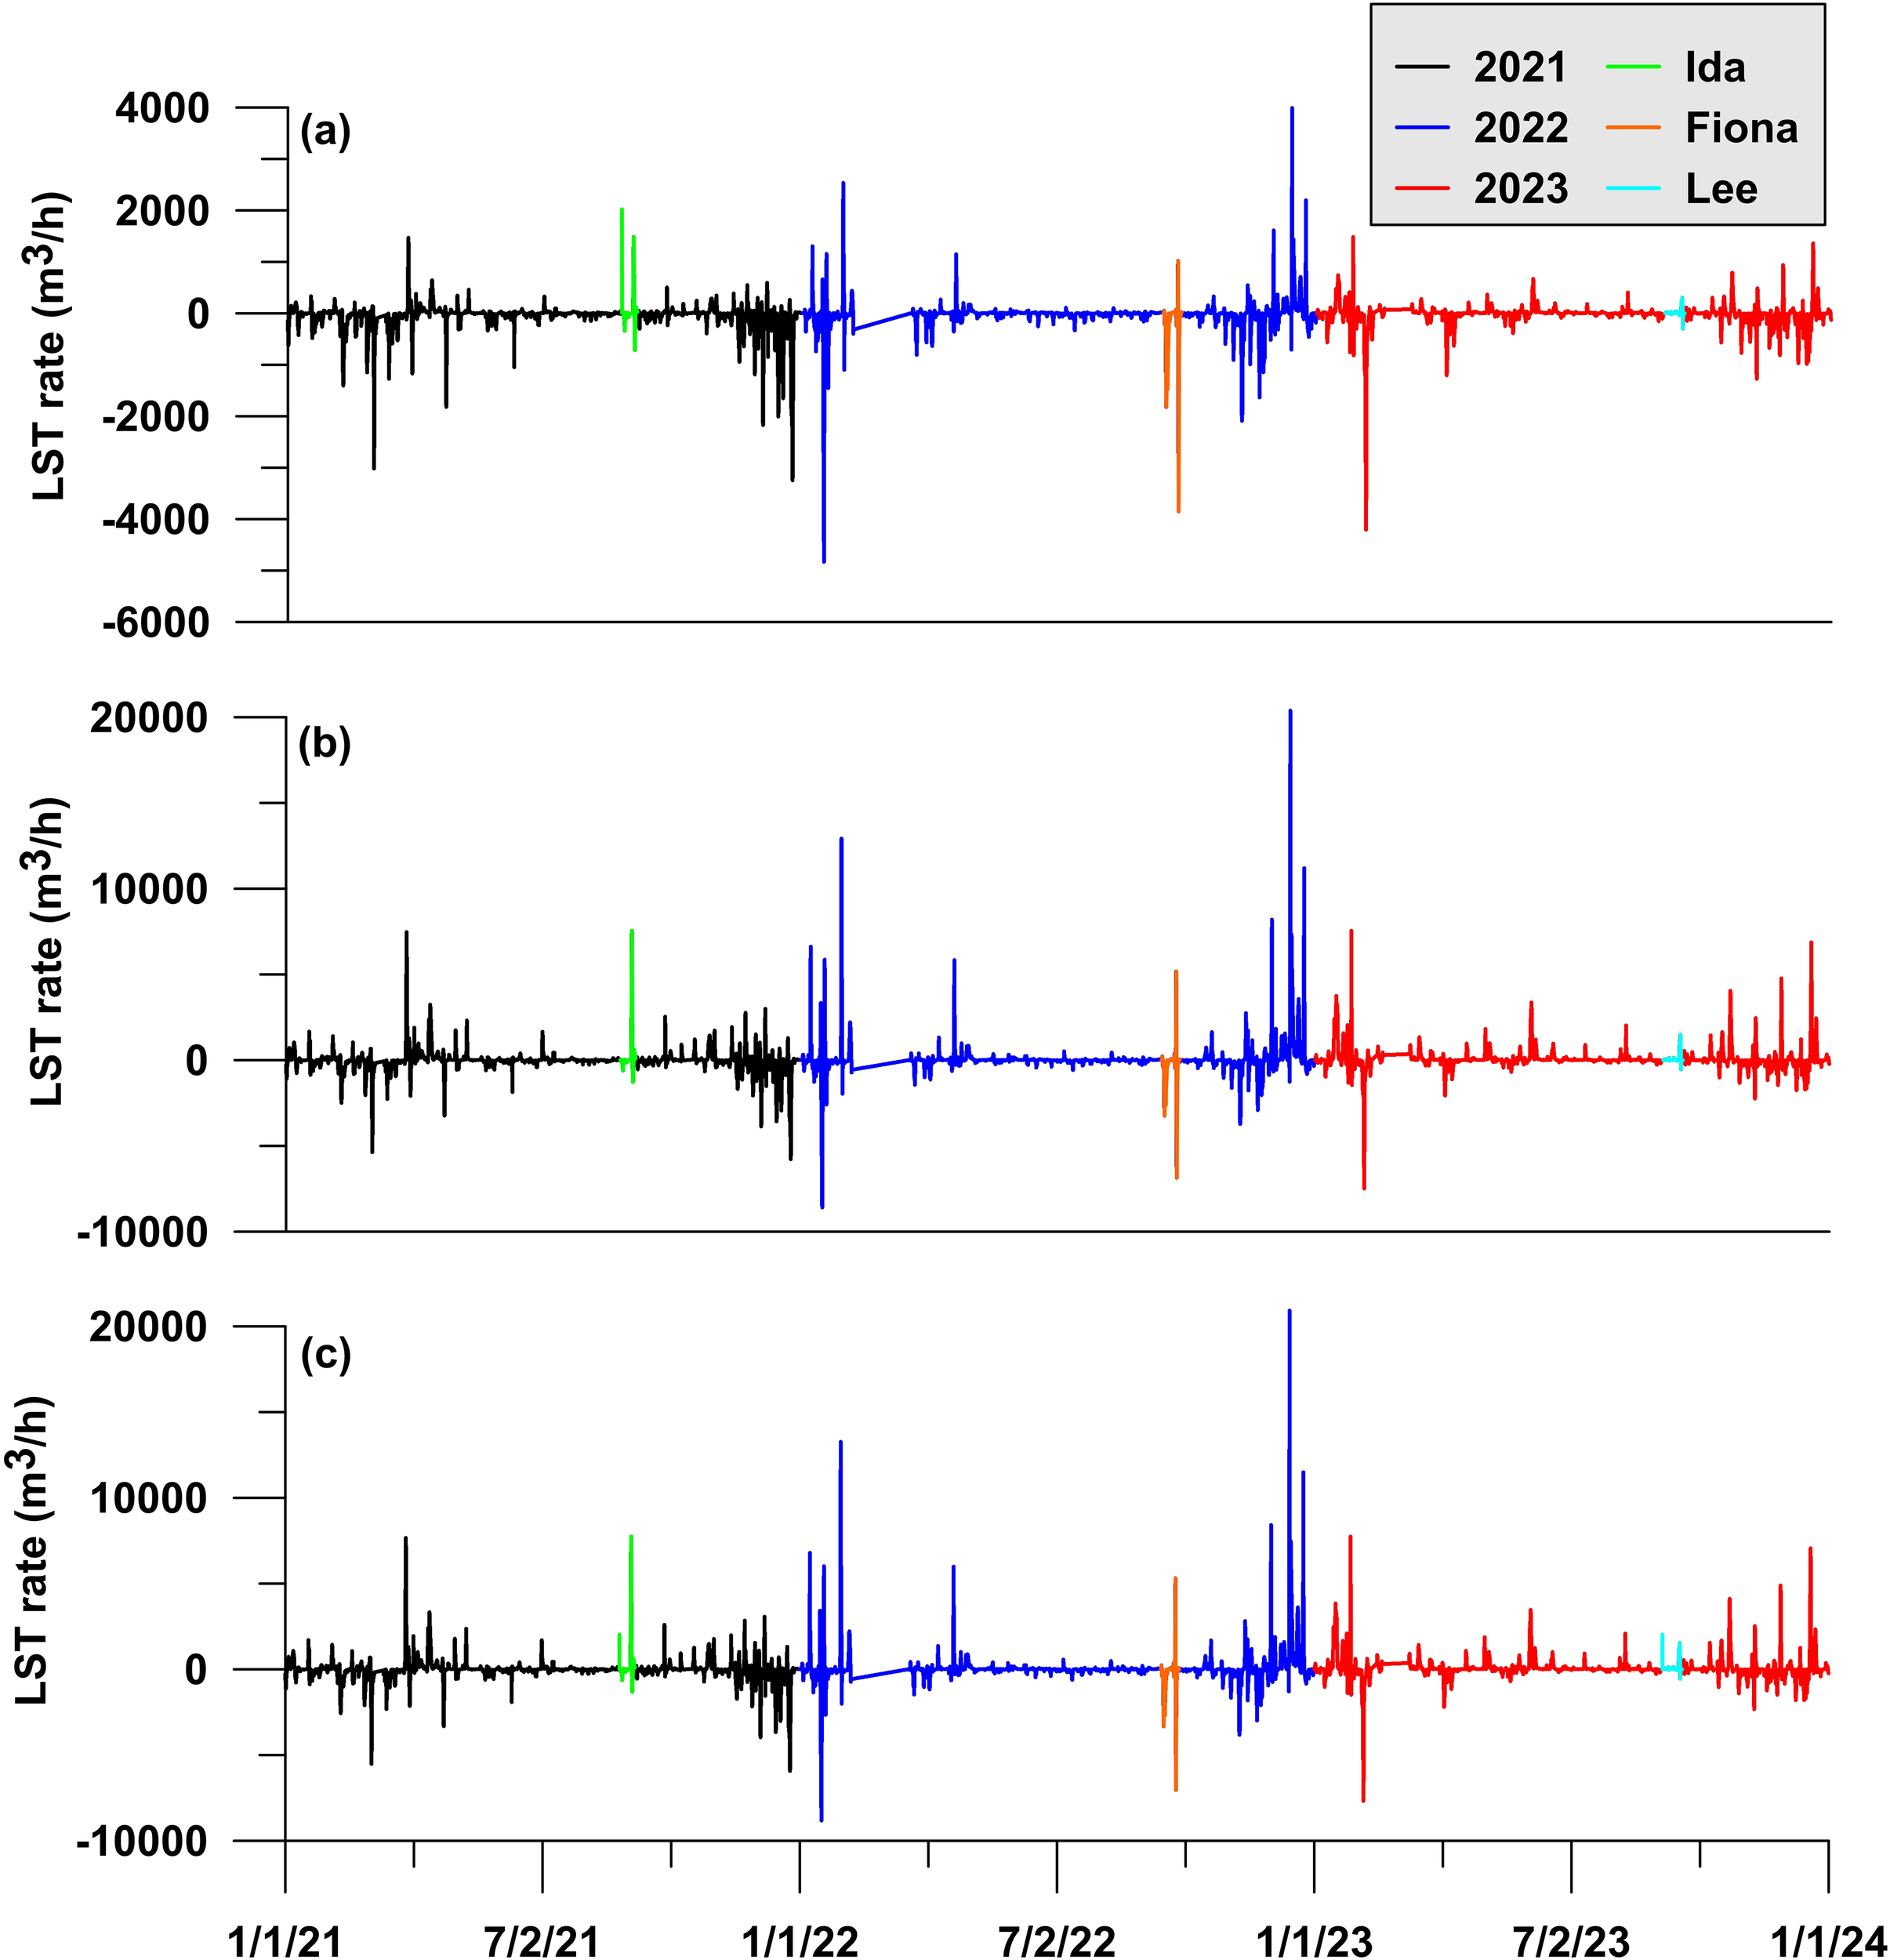
Time series of hourly averaged potential LST rates for 2021, 2022 and 2023 using empirical formulae (a) Kaczmarek (b) CERC and (c) Komar. Hurricane-induced potential LST rates are also highlighted.
A seasonal analysis of potential LST offers valuable insights into the variation in sediment movement across different seasons and highlights the potential LST rates during extreme weather events. Figure 11 illustrates a time series plot that compares the potential LST rates over several years, categorized by seasons, using both the Kaczmarek, CERC and Komar formulas. This analysis helps in understanding how seasonal changes and extreme events influence sediment transport dynamics, offering a comprehensive view of how these formulae perform under varying environmental conditions. Seasonal analysis revealed that in 2021, winter and spring accounted for 66% of the total sediment transport, with significantly lower transport observed during summer. Similarly, in 2022 and 2023, winter contributed 52% of the total transport, followed by 23% in fall, with the remaining transport occurring in spring and summer. These variations clearly reflect the significant intra-seasonal and inter-annual changes in wave characteristics within the study region, which are key drivers of the variability in potential LST rates. Understanding these fluctuations is crucial for coastal management and predicting future sediment transport under different wave climate conditions.
Figure 11
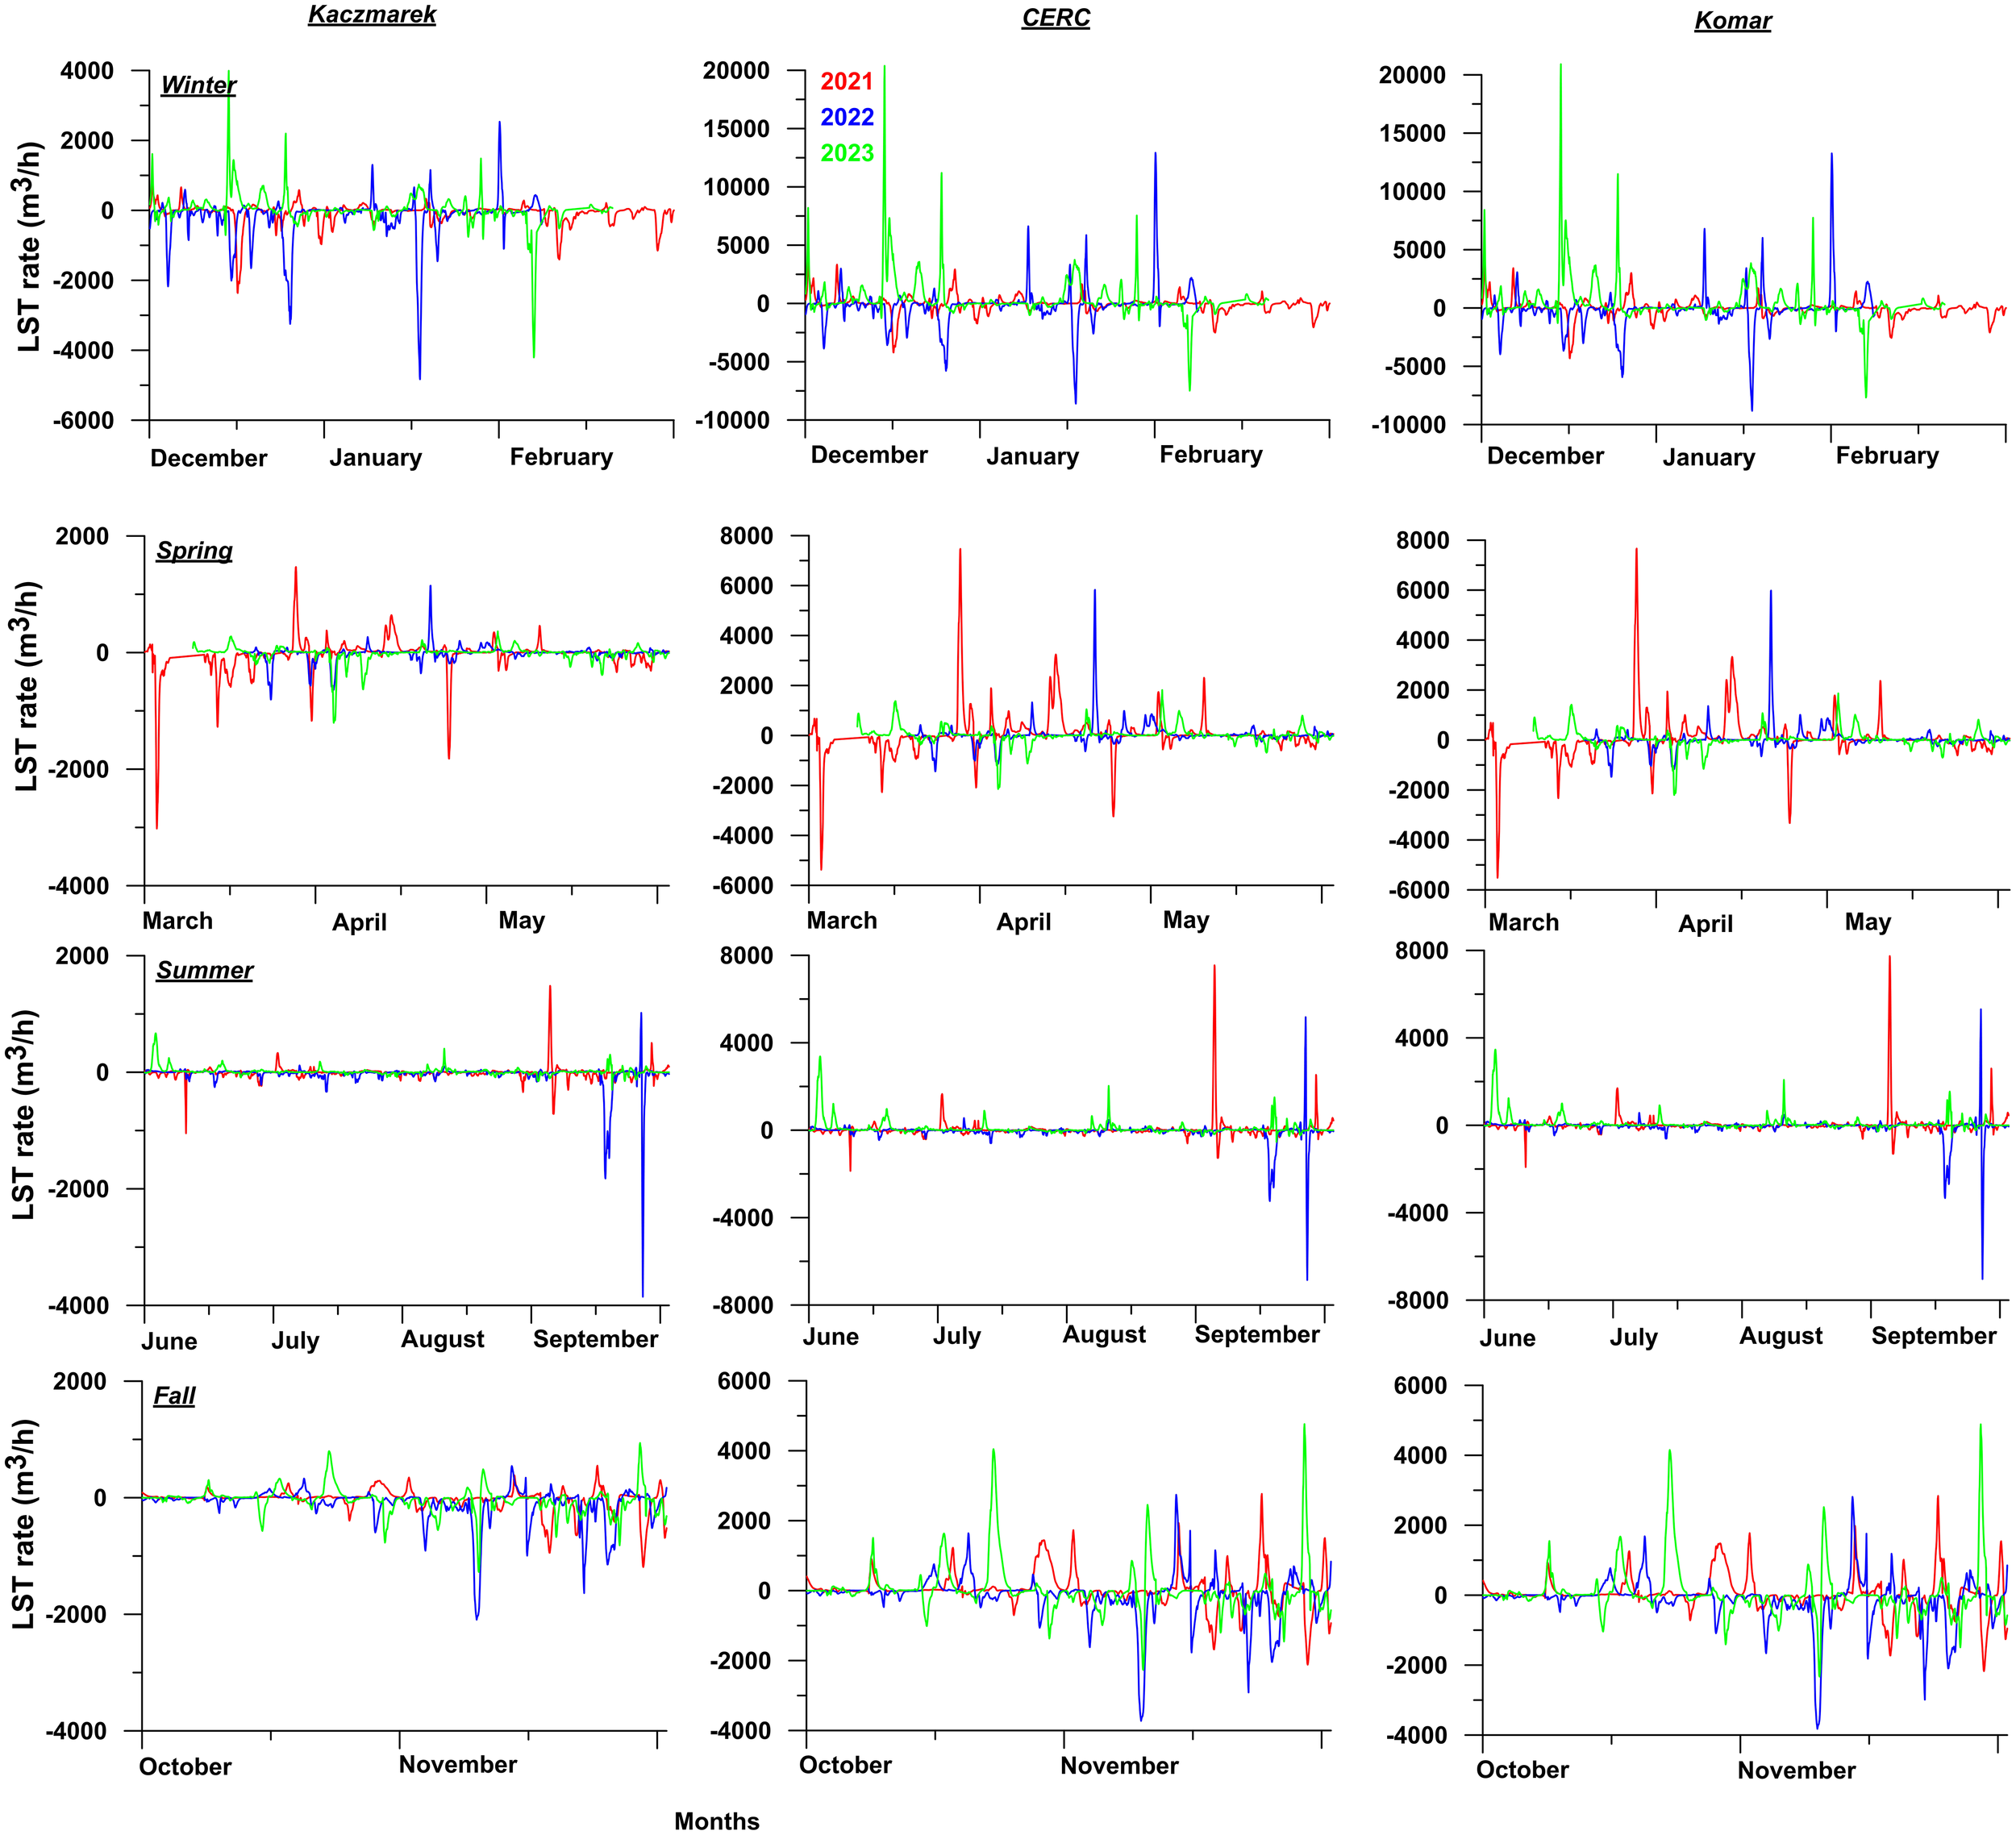
Time series plot of potential LST rates for Kaczmarek, CERC and Komar for different seasons.
However, these typical patterns can be altered by the occurrence of storms or extreme events, which significantly impact potential LST rates, as evidenced in our study. To understand the impact of storm events, particularly hurricanes, on potential LST rates, we selected three significant post-tropical storms, one in each year, which provided a valuable opportunity for comparison. Remarkably, each of these post-tropical storms occurred during the same month in consecutive years, offering a unique context to examine their effects on sediment transport dynamics. The storms analyzed in this study are Ida (2021), Fiona (2022), and Lee (2023), as outlined in Figure 8. By focusing on these specific high-energy events, our aim is to quantify the potential LST rates during each storm and evaluate how the intensity and trajectory of each hurricane influenced sediment movement and shoreline changes. This comparison allows us to gain insights into the role of extreme weather in shaping coastal sediment transport processes over time.
As Hurricane Ida passed through the GSL in 2021, a Hs of 5 m and a Tm of 8 s were recorded near the Shippagan coast (Figure 12). The net potential LST rates during this event were estimated to be 0.9x10³ m³·h-1 using the Kaczmarek formula, 7.5x10³ m³·h-1 using the CERC formula and 7. 6x10³ m³·h-1 using the Komar formula. In 2022, Fiona generated even higher waves, with significant wave heights of around 8 m and wave periods of 9 s. The net potential LST rates for this event were estimated at -4.0x10³ m³·h-1 using Kaczmarek, -7.0x10³ m3·h-1 using CERC formula and -7.3x10³ m3·h-1 using Komar. In 2023, Lee, though less intense, generated significant wave heights of 3 m and a wave period of 7 s. Despite its lower intensity, it still caused notable sediment transport, with net potential LST rates estimated at 0.03x10³ m³·h-1 using Kaczmarek, 2.0x10³ m³·h-1 using CERC and 1.8x10³ m³·h-1 for Komar. This indicates a potentially substantial sediment transport in response to the intense wave energy associated with the hurricane, supporting previous findings that highlight the critical role of extreme wave conditions in driving coastal sediment dynamics (Freeman et al., 2015). Notably, the highest rate of transport of all three storms occurred during Fiona, with a dominant northeast-ward sediment movement. Interestingly, Fiona resulted in a net potential sediment transport towards the northeast, whereas Ida and Lee both resulted in net potential LST towards the southwest. Figure 8 demonstrates that the intensity of hurricanes decreases once they reach the Gulf of St. Lawrence (GSL). However, in comparison to other hurricanes, Fiona maintained higher wind speeds and lower pressure, which could generate significant wave conditions in the GSL. Conversely, Ida and Lee experienced a more substantial decrease in intensity by the time they reached the GSL yet still had sufficient wind speed and low pressure to generate notable waves within the Gulf. These findings underscore that large storms can cause rapid coastal erosion, and the recovery from such events depends partly on the local sand supply (Forbes et al., 2004). In this context, sand engine techniques can help stabilize beaches by counteracting the substantial sediment transport induced by storms.
Figure 12
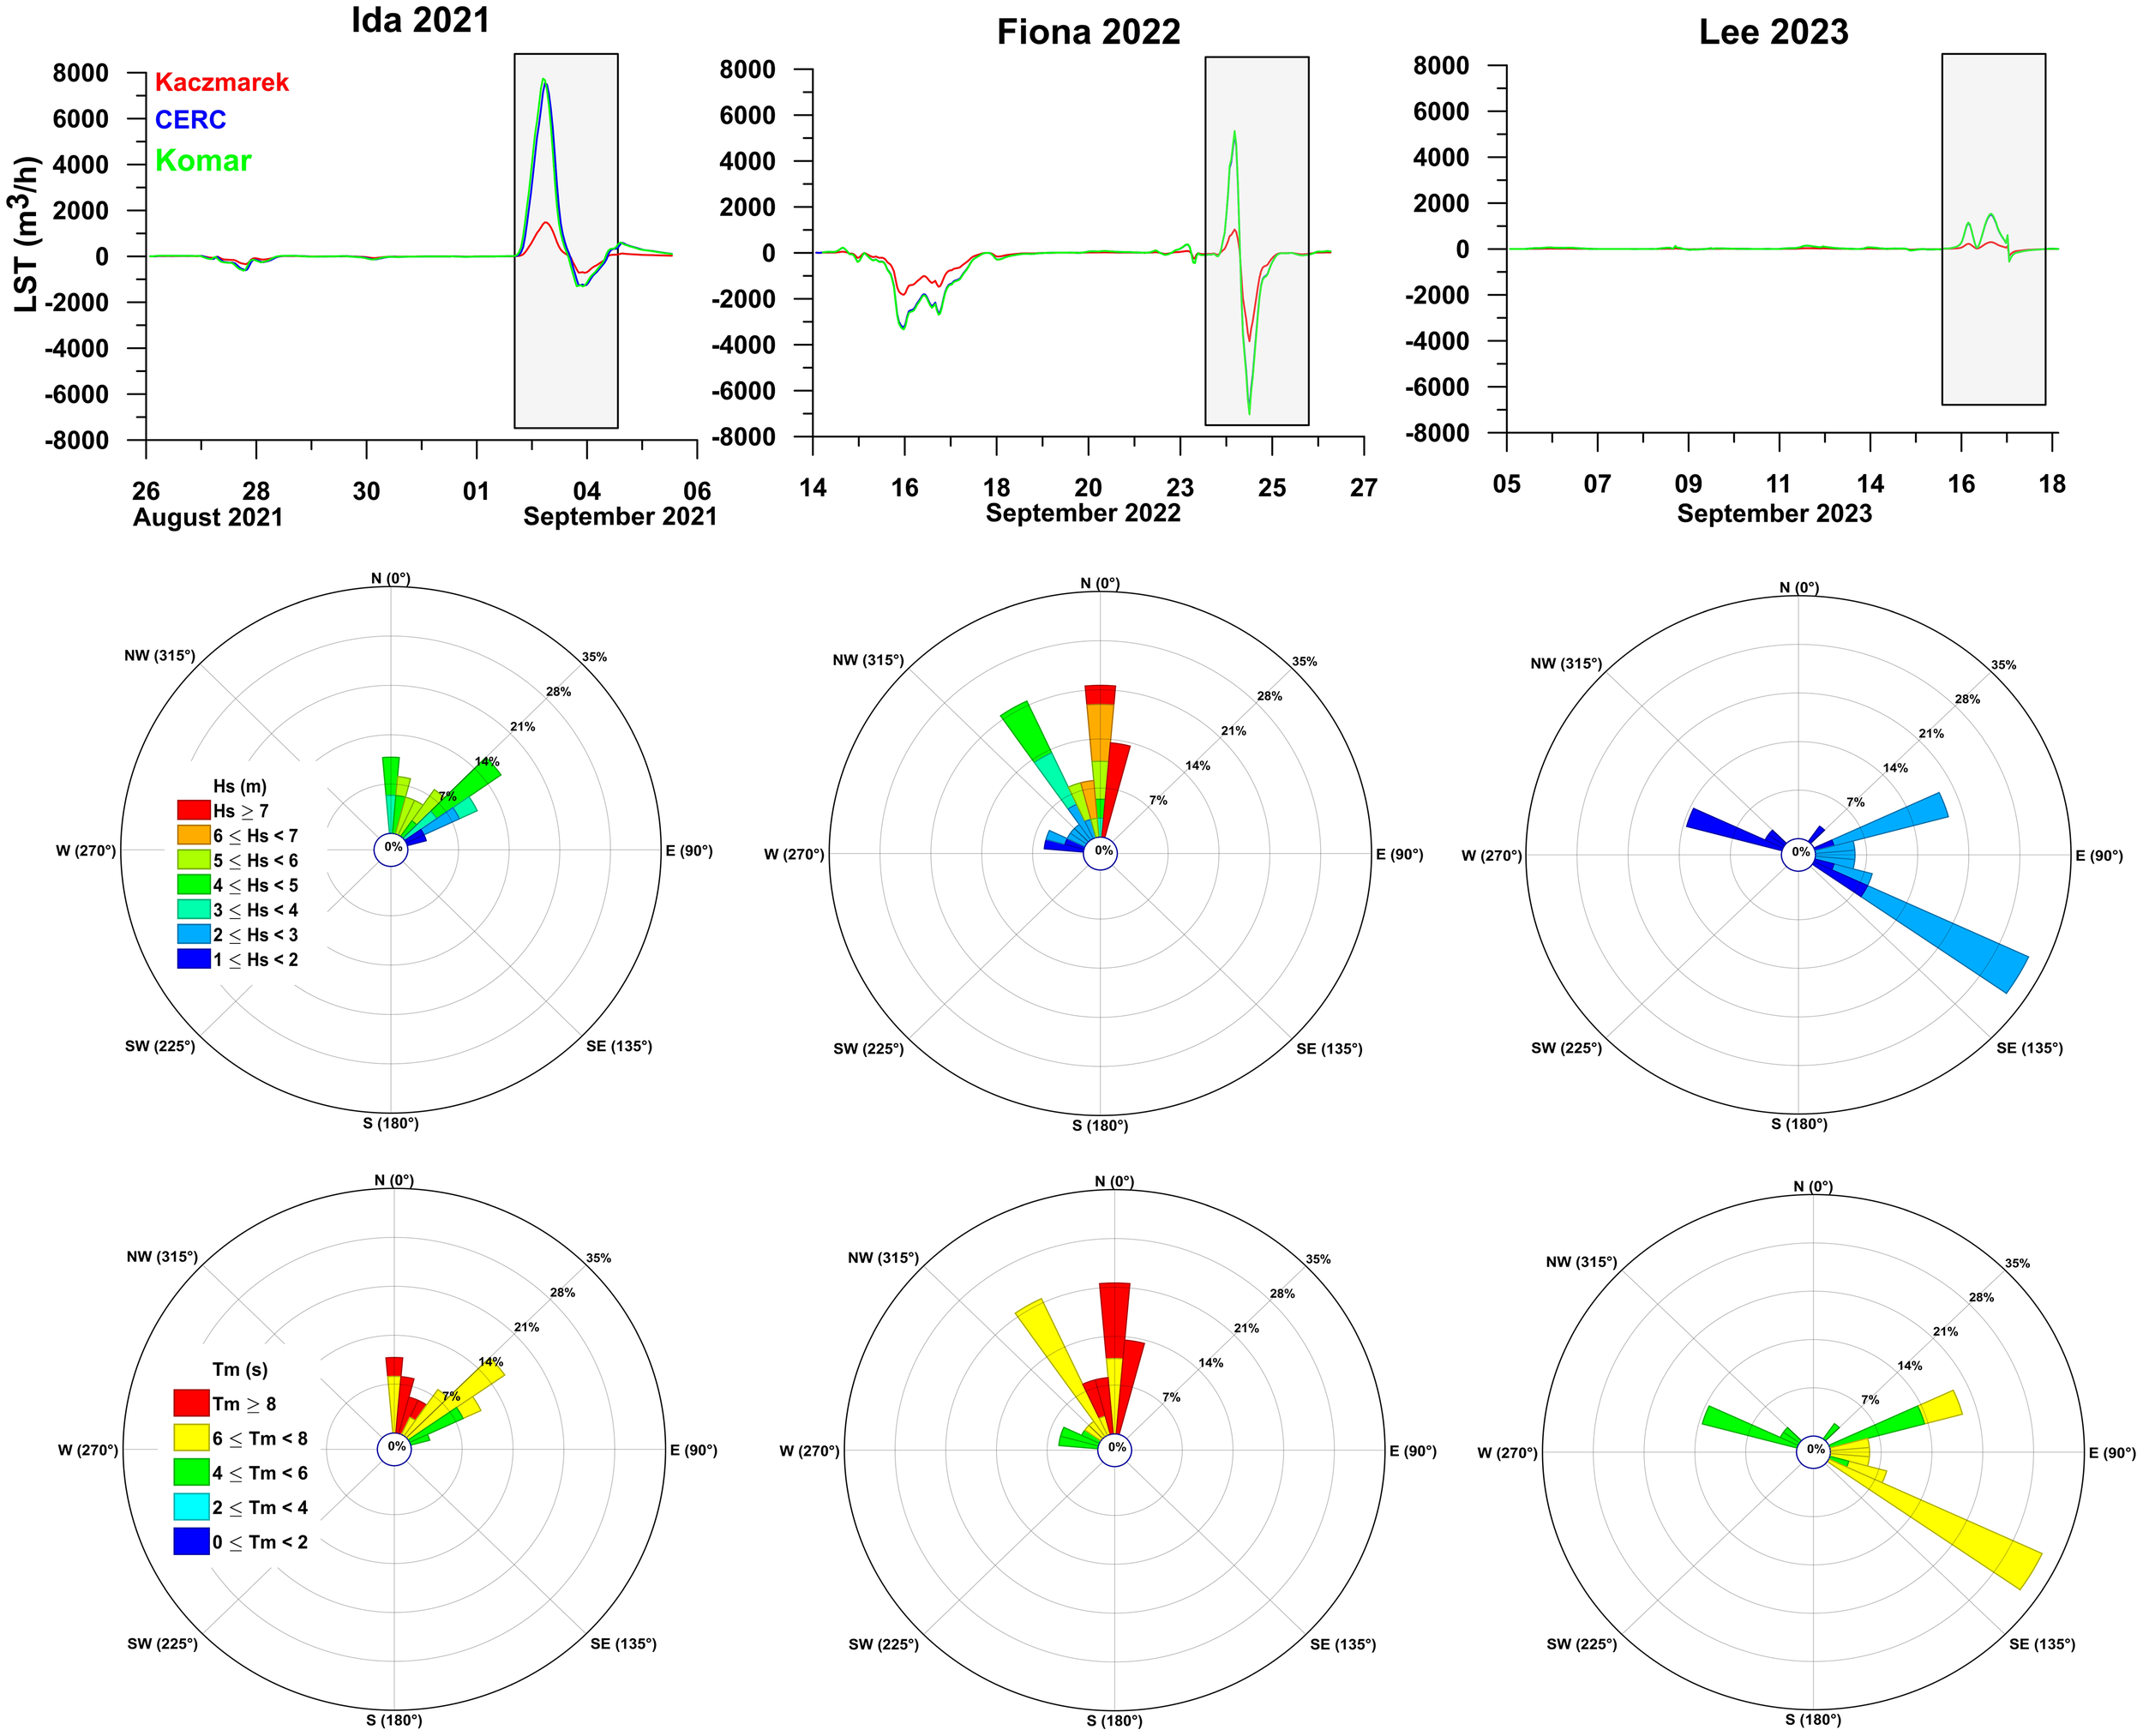
Time series plot represents the potential LST rates during the different hurricane periods, comparing three empirical formulas and the rose diagram represents the wave characteristics during the time of Ida, Fiona and Lee events.
When comparing these storm-induced potential LST rates to those observed during the calmer summer months, it was found that post-tropical storms contributed to approximately 5% of the total sediment transport for the entire season. Notably, Fiona accounted for 25% of the transport during the calm season, with the dominant transport direction towards the northeast. In contrast, Ida contributed 30%, and Lee contributed 6% of the net transport during the same season, both with dominant transport towards the southwest. Hurricanes and storms during calm season can contribute 40-50% of the total sediment transport (George et al., 2021). This undergoes the significant role of extreme weather events in sediment dynamics, even under typically calm conditions.
Although 25% - 30% sediment transport contribution from post-tropical storms is substantial, it is particularly notable given the short duration of these events, especially in the case of Fiona, relative to the entire season. This aligns with research showing that hurricanes and other extreme weather events are major drivers of coastal change, necessitating their consideration in coastal management and mitigation strategies (Birchler et al., 2014). The result from this study suggests that potential LST rates at Shippagan on the GSL coast are significantly influenced by post-tropical storms, even though these events last only a few days. The study underscores the importance of understanding wave characteristics and its impact on sediment transport, allowing for a greater understanding of system behaviors, and therefore, the design of NBS (Temmerman et al., 2013) or Natural and NBS features (Bridges et al., 2022) to manage coastal erosion risk. Also, during extreme events, these results contribute to the development of appropriate NBS to enhance the resilience of coastal ecosystems (Wang et al., 2014), facilitating the identification of areas susceptible to erosion and habitat loss. As the frequency of storms is projected to increase in the coming years (Kossin et al., 2020) it becomes increasingly vital to understand the sediment budget and its response to a changing climate. This knowledge is essential for preparing effective coastal management strategies and implementing NBS that enhance resilience to these dynamic environmental conditions.
4.4 Long-term analysis
To assess long-term understanding in wave conditions and their influence on potential LST along the Shippagan coast, we extended our analysis for 30 years (1993-2023) as shown in Figure 13. Annual average Hs exhibited considerable interannual variability, ranging from 0.95 m (2001) to 1.17 m (2021). Trend analysis revealed a steady increase of approximately 0.4 cm/year (Figure 13a), indicating a gradual intensification of wave energy in the region. During the long-term analysis, the Kaczmarek’s net potential LST varies between -4.8x10⁵ m3 and 8.8 x10⁴ m3 with a general trend of southeast transport (Figure 13b). However, some years displayed short-term directional reversals, reflecting the sensitivity of transport pathways to interannual variations in wave direction and energy. In contrast, both the CERC and Komar methods revealed stronger and more persistent northwest-directed transport, with net annual values ranging from -4.7 x10⁵ m3 to 1.2 x10⁶ m3 and -4.8 x10⁵ m3 to 1.2 x10⁶ m3 (Figure 13b). These estimates suggest that CERC and Komar are more responsive to high-energy wave events, likely due to their reliance on Hb raised to the power of 2.5, compared to 2 in the Kaczmarek formulation. As a result, high-magnitude events, especially when aligned in one direction, can disproportionately influence net annual LST in CERC and Komar, sometimes reversing the direction as seen in Kaczmarek, thereby explaining the divergence in net transport direction across methods under the same wave forcing. This is clearly evident in higher gross transported years (> 2x10⁶ m3/yr) such as 2000, 2021, and 2022 (Figure 13c) where CERC and Komar yielded strong positive net transport, while Kaczmarek showed a slight negative net. In 2010, which recorded the highest annual Hs (Figure 13a), all three formulations showed elevated gross transport rates (Figure 13c), and notably, all indicated northward net transport with CERC and Komar showing substantial magnitudes, while Kaczmarek also reflected the same directional trend, though with a smaller net value (Figure 13b). Conversely, in moderate-energy years like 2007 and 2009, all three methods indicated net southward transport, with the Kaczmarek method estimating a more pronounced net magnitude compared to CERC and Komar (Figure 13b). These findings underscore the importance of accounting for how different empirical formulations respond to wave energy levels, as the choice of method can significantly influence not only the magnitude but also the interpretation of long-term sediment transport direction.
Figure 13
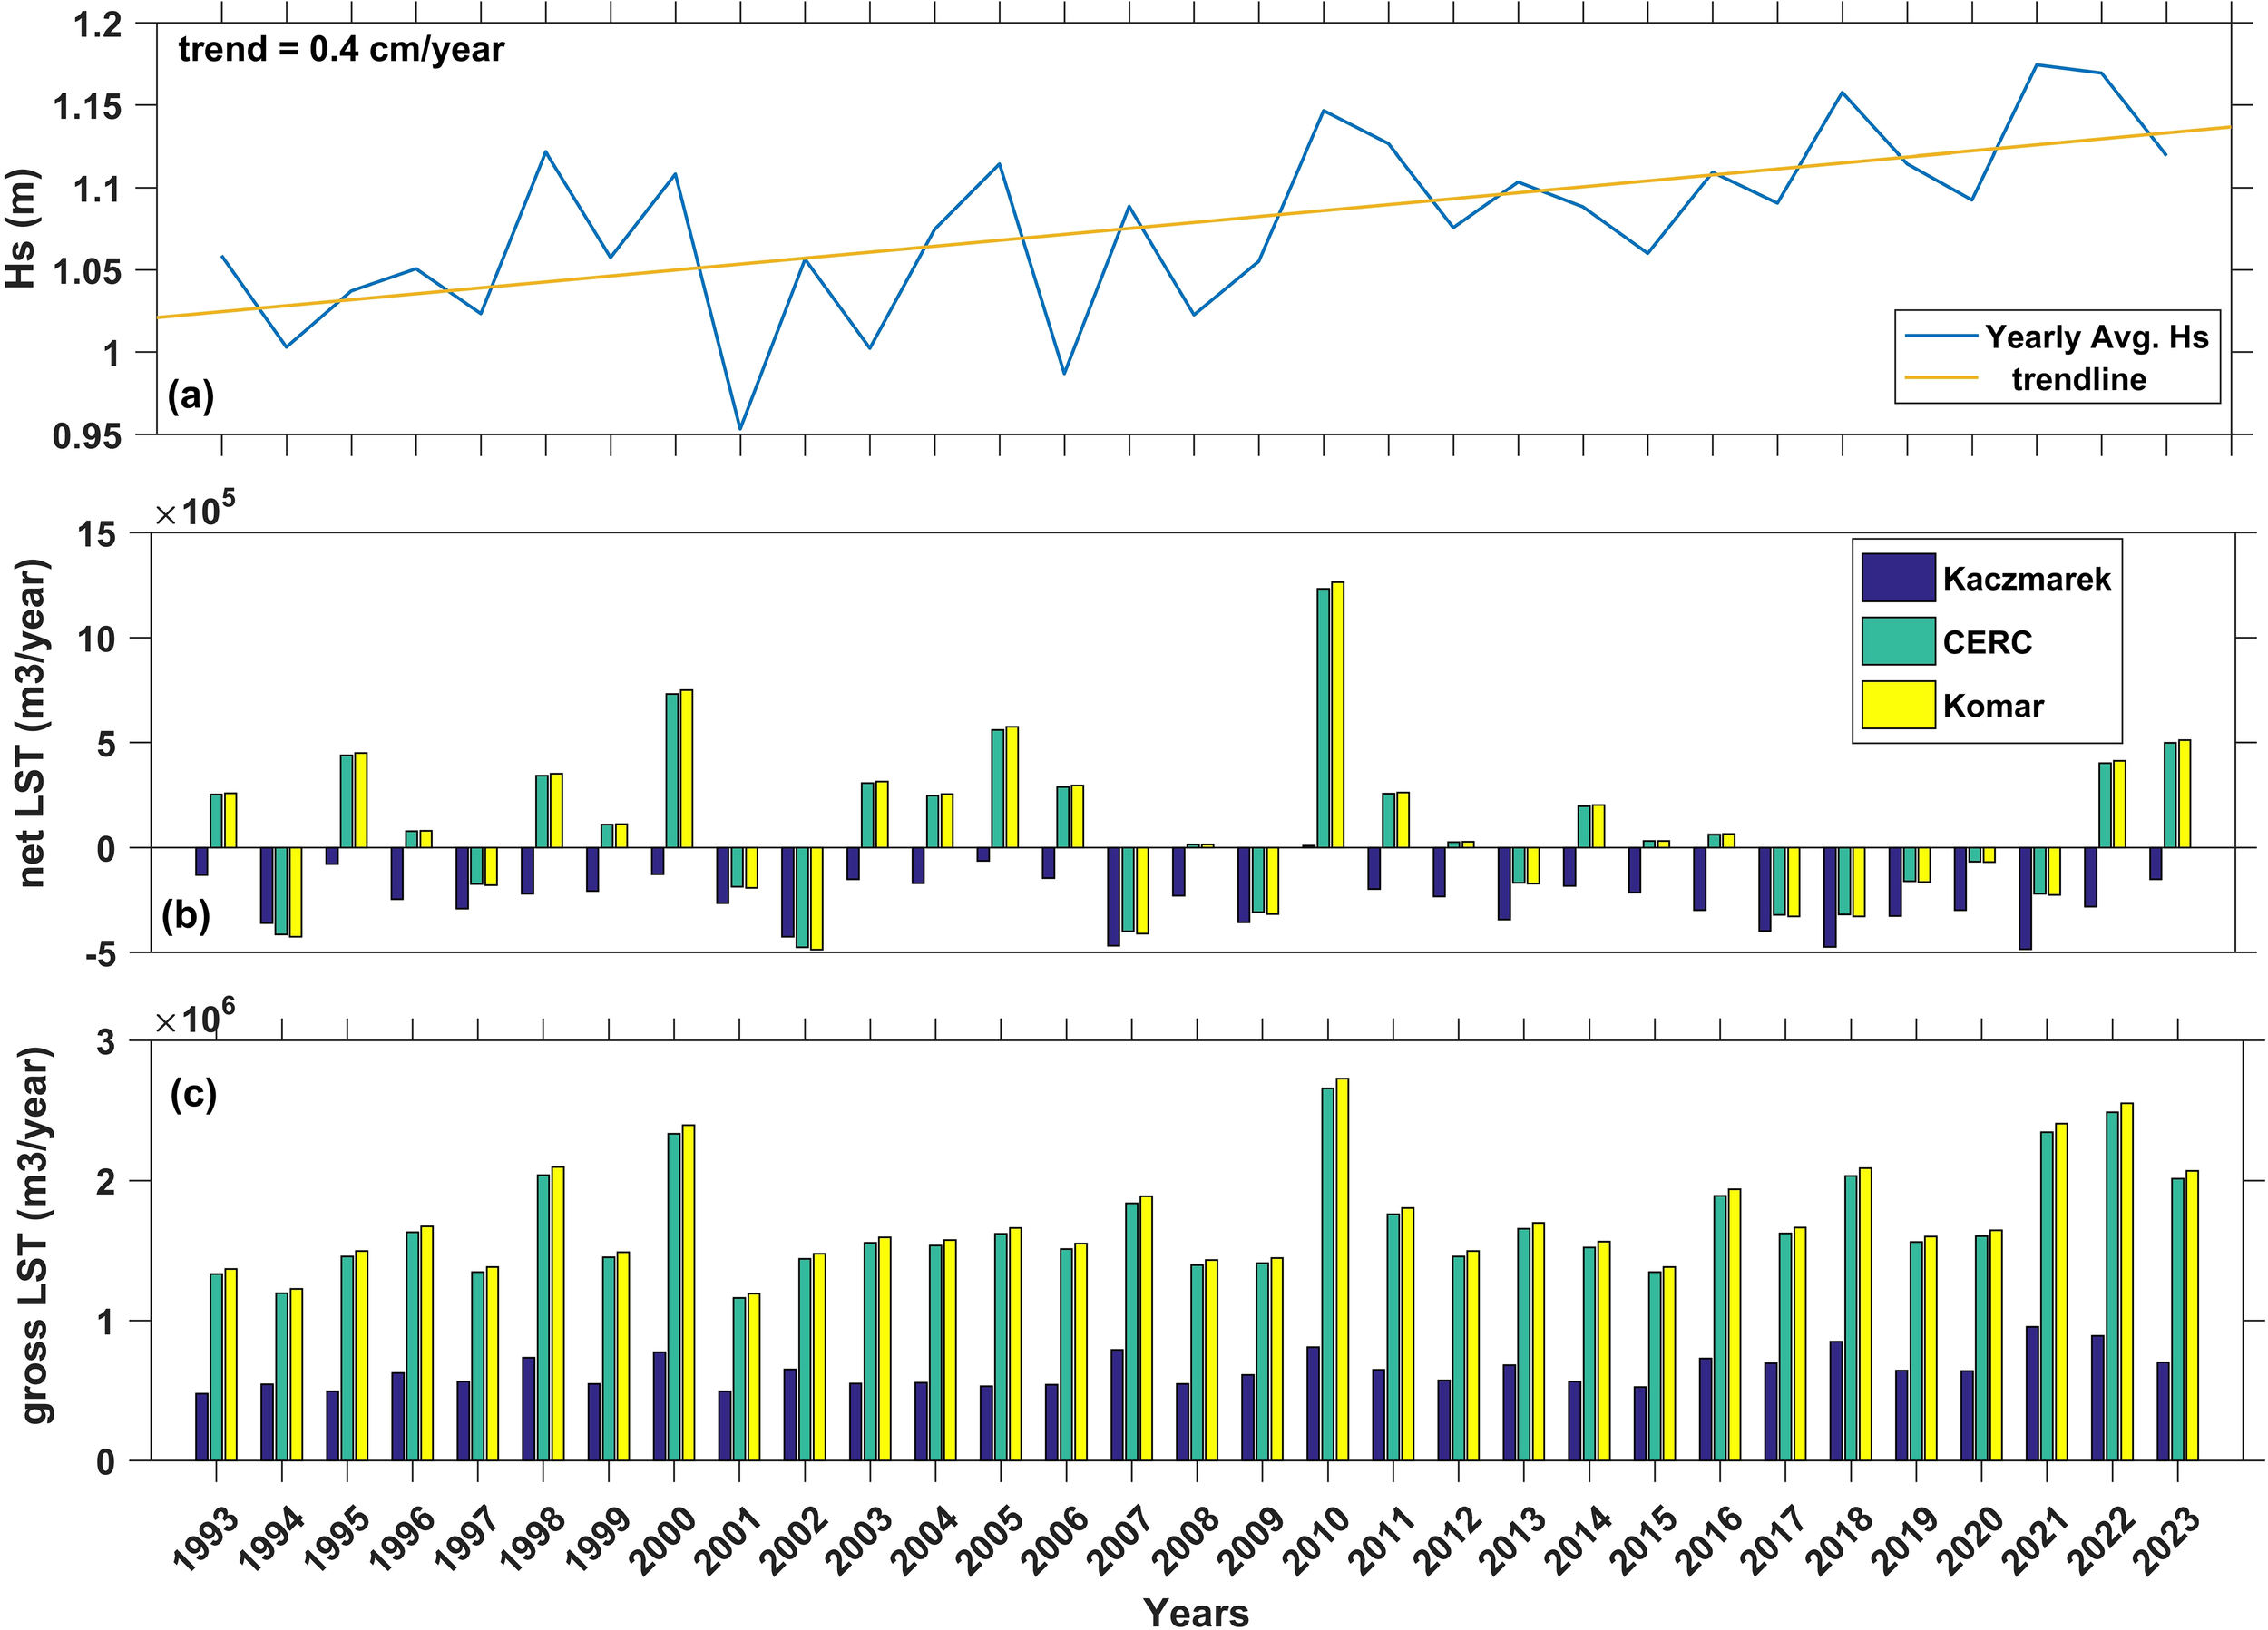
(a) Yearly average significant wave height (Hs) during 1993–2023 with liner trendline (b) Yearly net potential LST estimates during 1993–2023 for different empirical formulas (c) Yearly gross potential LST estimates during 1993–2023 for different empirical formulas.
Gross potential LST estimates further underscore the differences between these empirical models. The Kaczmarek method produced gross potential LST rates ranging from 4.7x10⁵ m³ to 9.5x10⁵ m³ annually. In comparison, the CERC and Komar formulas yielded gross potential LST rates between 1.2 × 10⁶ m³ and 2.6 × 10⁶ m³, generally two to three times higher than those from Kaczmarek (Figure 13c). The trend analysis revealed a consistent increase in LST rates, estimated at ~7,400 m³/year using the Kaczmarek formula and ~18,000 m³/year for both the CERC and Komar formulations (trendline is not shown in figure). It is important to note that under varying environmental conditions, these empirical equations may tend to over- or underestimate LST rates. Several studies have reported that the CERC formula often overpredicts transport rates, particularly in energetic wave environments, and have recommended alternative formulations for improved accuracy (e.g., Shanas and Kumar, 2014). While all three empirical models offer useful first-order insights into potential LST patterns, their outputs must be interpreted cautiously, especially in dynamic coastal environments like the Shippagan region where factors such as seasonal sea ice cover, beach slope variability, sediment grain size (D₅₀), and storm-induced wave conditions contribute to the complex nature of sediment dynamics in this region. Notably, all methods consistently showed enhanced potential LST rates during years with higher average Hs, reinforcing the role of wave energy as a dominant driver of sediment movement along this coast.
5 Conclusions
This study provides new insights into the inter-seasonal and extreme wave climate near the Shippagan region in the Gulf of St. Lawrence (GSL) using as a combination of measured and ERA5 hindcast data. This data will aid in understanding the contemporary and potential LST regimes in the study area. The average wave characteristics during the time of measurement revealed an Hs = 0.5 m, Tm = 3.5 s and Tp = 4.0 s with predominant incident waves coming from the southeast direction. Similarly, the annual mean Hs from ERA5 for 2021, 2022, and 2023 was 1.2 m, 1.2 m, and 1.1 m, respectively, with a maximum inter-annual variation of less than 4%. Based on these wave characteristics, the annual net potential LST rates were estimated using the CERC method for 2021, 2022 and 2023 were 1.7x10⁵ m3, -6.0 x10⁵ m3 and 6.4 x10⁵ m3, respectively. In contrast, Kaczmarek estimated -3.2 x10⁵ m3, -6.1 x10⁵ m3 and -1.8 x10⁵ m3 for the same years. Likewise, the gross potential LST rates vary from 21.8 to 24.7 x 10⁵ m³ using the CERC method and from Kaczmarek, it varies from 7.6 to 9.5 x 10⁵ m³. The net potential LST rates estimated using Komar formula were 1.8x10⁵ m3, -6.2 x10⁵ m3 and 6.5 x10⁵ m3, with corresponding gross transport rates ranging from 22.3 to 25.6 x 10⁵ m³. The Komar estimates closely aligned with those from the CERC method, reflecting the similarities in the wave breaking parameters. The seasonal analysis showed that winter and spring together contributed 66% of the total gross sediment transport in 2021, while summer experienced notably lower transport rates. Likewise, in 2022 and 2023, winter accounted for 52% of the total gross transport, followed by 23% in fall, with the remainder distributed between spring and summer. By the impact of post-tropical storms, the potential LST rates during these years revealed that 5% of the gross total transport in the entire season is influence by hurricanes. Notably, post-tropical storm Fiona accounted for 25% of the gross potential transport during the calm season, with the dominant transport direction towards the northeast. In contrast, Ida contributed 30%, and Lee contributed 6% of the gross transport during the same season, both with dominant transport towards the southwest. Additionally, long-term analysis of wave climate variability and its influence on potential LST along the Shippagan coast using ERA5 reanalysis data spanning from 1992 to 2023. The analysis reveals a steady increase in Hs at a rate of approximately 0.4 cm/year, suggesting an intensifying wave climate in the region. Potential LST estimation reveals that Kaczmarek formula indicates predominantly southeastward net transport, CERC and Komar suggest a more northward direction. Furthermore, gross transport estimates from CERC and Komar are significantly higher up to two to three times compared to Kaczmarek. The trend analysis revealed a consistent increase in LST rates, estimated at ~7,400 m³/year using the Kaczmarek formula and ~18,000 m³/year for both the CERC and Komar formulations.
The results of this study highlight the potential variability and significance of potential LST in the Shippagan region, influenced by both seasonal wave climates and extreme events such as hurricanes. The substantial contribution of winter storms and post-tropical storms to potential longshore sediment transport underlines the necessity of considering these factors in coastal management strategies. NBS, such as the restoration of dune systems, vegetation buffers, and strategic sediment management, could play a vital role in managing erosion-related risk to communities, infrastructure and valued assets. These solutions can help adapt to changing wave patterns and transport regimes, while supporting sustainable shoreline protection. This study provides a long-term assessment of potential LST rates along the Shippagan coast. However, certain limitations exist in the methods used to estimate potential LST rates. The next step involves incorporating a wave transformation model to calculate key parameters such as longshore currents, breaker heights in the surf zone, and beach slope. From an observational perspective, estimating D50 values specific to the study area would enhance the precision of potential LST rate estimations. Additionally, evaluating the impact of sand engine interventions on potential LST rates is essential. As this study serves as a baseline, future research should focus on the application of advanced numerical models to improve accuracy and expand the scope of these findings.
Statements
Data availability statement
The original contributions presented in the study are included in the article/supplementary material. Further inquiries can be directed to the corresponding author.
Author contributions
JT: Conceptualization, Data curation, Methodology, Visualization, Writing – original draft, Writing – review & editing. JG: Conceptualization, Data curation, Methodology, Visualization, Writing – review & editing. DVP: Supervision, Writing – review & editing. EM: Supervision, Writing – review & editing.
Funding
The author(s) declare that financial support was received for the research and/or publication of this article. Funding for this research was provided in part by NRC’s Climate Resilient Built Environment Initiative, in support of delivering the Government of Canada’s Adaptation Action Plan, and towards achieving commitments under the National Adaptation Strategy.
Acknowledgments
This research was supported by National Research Council, Canada. We sincerely thank the InCoast Lab at Saint Mary’s University for providing oceanographic instruments essential for data collection. We also extend our gratitude to mbSparc, Saint Mary’s University for providing computational facilities that contributed to the analysis. Additionally, the second author acknowledges support from the U.S. Department of Defense through the U.S. Army Engineer Research and Development Center (ERDC) under contract No. W912HZ2220005. Fourth author acknowledges funding from a University of British Columbia startup grant.
Conflict of interest
The authors declare that the research was conducted in the absence of any commercial or financial relationships that could be construed as a potential conflict of interest.
Generative AI statement
The author(s) declare that no Generative AI was used in the creation of this manuscript.
Publisher’s note
All claims expressed in this article are solely those of the authors and do not necessarily represent those of their affiliated organizations, or those of the publisher, the editors and the reviewers. Any product that may be evaluated in this article, or claim that may be made by its manufacturer, is not guaranteed or endorsed by the publisher.
References
1
Akpınar A. Bingölbali B. Van Vledder G. P. (2016). Wind and wave characteristics in the Black Sea based on the SWAN wave model forced with the CFSR winds. Ocean Eng.126, 276–298. doi: 10.1016/j.oceaneng.2016.09.026
2
Almar R. Kestenare E. Reyns J. Jouanno J. Anthony E. J. Laibi R. et al . (2015). Response of the Bight of Benin (Gulf of Guinea, West Africa) coastline to anthropogenic and natural forcing, Part1: Wave climate variability and impacts on the longshore sediment transport. Continental Shelf Res.110, 48–59. doi: 10.1016/j.csr.2015.09.020
3
Ambaum M. H. Hoskins B. J. Stephenson D. B. (2001). Arctic oscillation or North Atlantic oscillation? J. Climate14, pp.3495–3507. doi: 10.1175/1520-0442(2001)014<3495:AOONAO>2.0.CO;2
4
Anusree A. Kumar V. S. (2024). Mean wave direction and wave height in the ERA5 reanalysis dataset: Comparison with measured data in the coastal waters of India. Dynamics Atmospheres Oceans107, 101478. doi: 10.1016/j.dynatmoce.2024.101478
5
Ardhuin F. Rogers E. Babanin A. V. Filipot J. F. Magne R. Roland A. et al . (2010). Semiempirical dissipation source functions for ocean waves. Part I: Definition, calibration, and validation. J. Phys. Oceanography40, pp.1917–1941. doi: 10.1175/2010JPO4324.1
6
Armon J. W. McCann S. B. (1977). Longshore sediment transport and a sediment for the Malpeque barrier system, southern Gulf of St. Lawrence. Can. J. Earth Sci.14, pp.2429–2439. doi: 10.1139/e77-211
7
Baker E. Thomas J. van Proosdij D. Lundholm J. Graham J. Lewis S. et al . (2024). Chiasson Office Conservation Offsetting Project – 2024 environmental monitoring report. CBWES Inc., Halifax, Nova Scotia, Report prepared for Department of Fisheries and Oceans-Small Craft Harbours Branch Maritimes and Gulf Regions.
8
Başaran B. Güner H. A. A. (2021). Effect of wave climate change on longshore sediment transport in Southwestern Black Sea. Estuarine Coast. Shelf Sci.258, 107415. doi: 10.1016/j.ecss.2021.107415
9
Beckman J. N. Long J. W. (2022). Quantifying errors in wind and wave measurements from a compact, low-cost wave buoy. Front. Mar. Sci.9, 966855. doi: 10.3389/fmars.2022.966855
10
Birchler J. J. Stockdon H. F. Doran K. S. Thompson D. M. (2014). National assessment of hurricane-induced coastal erosion hazards: Northeast Atlantic Coast (No. 2014-1243) (US Geological Survey). doi: 10.3133/ofr20131130
11
Bowron T. M. Ellis K. Baker E. Graham J. Lewis S. Poirier E. et al . (2022). Chiasson Office Conservation Offsetting Project – Baseline and year 1 post-constructio/21) monitoring report (Halifax, Nova Scotia: Report prepared for Department of Fisheries and Oceans-Small Craft Harbours Branch Maritimes and Gulf Regions and GEMTEC Inc. CBWES Inc. Publication No. 72).
12
Bayram A. Larson M. Hanson H. (2007). A new formula for the total longshore sediment transport rate. Coastal Engineering54 (9), 700–710. doi: 10.1016/j.coastaleng.2007.04.001
13
Bayram A. Larson M. Miller H.C. Kraus N.C. (2001). Cross-shore distribution of longshore sediment transport: comparison between predictive formulas and field measurements. Coastal Engineering44 (2), 79–99. doi: 10.1016/S0378-3839(01)00023-0
14
Bridges T. S. Smith J. M. King J. K. Simm J. D. Dillard M. deVries J. et al . (2022). Coastal natural and nature-based features: International guidelines for flood risk management. Front. Built Environ.8, 904483. doi: 10.3389/fbuil.2022.904483
15
Cavaleri L. Abdalla S. Benetazzo A. Bertotti L. Bidlot J. R. Breivik Ø. et al . (2018). Wave modelling in coastal and inner seas. Prog. oceanography167, 164–233. doi: 10.1016/j.pocean.2018.03.010
16
Chowdhury P. Behera M. R. (2017). Effect of long-term wave climate variability on longshore sediment transport along regional coastlines. Prog. Oceanography156, 145–153. doi: 10.1016/j.pocean.2017.06.001
17
da Silva G. M. Mousavi S. M. S. Jose F. (2012). Wave-driven sediment transport and beach-dune dynamics in a headland bay beach. Mar. Geology323, 29–46. doi: 10.1016/j.margeo.2012.07.015
18
Davies M. (2011). Geomorphic shoreline classification of Prince Edward Island (Ottawa, ON: Coldwater Consulting Ltd.).
19
de Schipper M. A. de Vries S. Ruessink G. de Zeeuw R. C. Rutten J. van Gelder-Maas C. et al . (2016). Initial spreading of a mega feeder nourishment: observations of the sand engine pilot project. Coast. Eng.111, 23–38. doi: 10.1016/j.coastaleng.2015.10.011
20
Falqués A. (2006). Wave driven alongshore sediment transport and stability of the Dutch coastline. Coast. Eng.53, pp.243–pp.254. doi: 10.1016/j.coastaleng.2005.10.012
21
Feser F. Barcikowska M. Krueger O. Schenk F. Weisse R. Xia L. (2015). Storminess over the North Atlantic and northwestern Europe—A review. Q. J. R. Meteorological Soc.141, pp.350–pp.382. doi: 10.1002/qj.2015.141.issue-687
22
Forbes D. L. Parkes G. S. Manson G. K. Ketch L. A. (2004). Storms and shoreline retreat in the southern Gulf of St. Lawrence. Mar. Geology210, 169–204. doi: 10.1016/j.margeo.2004.05.009
23
Freeman A. M. Jose F. Roberts H. H. Stone G. W. (2015). Storm induced hydrodynamics and sediment transport in a coastal Louisiana lake. Estuarine Coast. Shelf Sci.161, 65–75. doi: 10.1016/j.ecss.2015.04.011
24
Freitas A. Bernardino M. Soares C. G. (2022). The influence of the Arctic Oscillation on North Atlantic wind and wave climate by the end of the 21st century. Ocean Eng.246, 110634. doi: 10.1016/j.oceaneng.2022.110634
25
Frey A. E. Connell K. J. Hanson H. Larson M. Thomas R. C. Munger S. et al . (2012). GenCade version 1 model theory and user’s guide. ERDC/CHL TR-12-25.
26
George J. Kumar V. S. (2019). Long-Term Variations in Nearshore Wave Climate and Littoral Drift at Ganpatipule Coast, Eastern Arabian Sea and its Link to Pacific Climate Variability. J. Geophysical Research: Oceans124, 7307–7327. doi: 10.1029/2018JC014900
27
George J. Kumar V. S. Gowthaman R. Singh J. (2020). Nearshore waves and littoral drift along a micro-tidal wave-dominated coast having comparable wind-sea and swell energy. J. Mar. Sci. Eng.8, p.55. doi: 10.3390/jmse8010055
28
George J. Kumar V. S. Joseph D. (2021). Spatial distribution of waves and wave-induced littoral drift along the nearshore regions of the central west coast of India. Ocean Eng.242, 110161. doi: 10.1016/j.oceaneng.2021.110161
29
Greenan B. J. Shackell N. L. Ferguson K. Greyson P. Cogswell A. Brickman D. et al . (2019). Climate change vulnerability of American lobster fishing communities in Atlantic Canada. Front. Mar. Sci.6, 579. doi: 10.3389/fmars.2019.00579
30
Gronewold A. D. Stow C. A. (2014). Water loss from the great lakes. Science343, pp.1084–1085. doi: 10.1126/science.1249978
31
Group T. W. (1988). The WAM model—A third generation ocean wave prediction model. J. Phys. oceanography18, pp.1775–1810. doi: 10.1175/1520-0485(1988)018<1775:TWMTGO>2.0.CO;2
32
Guo L. Sheng J. (2015). Statistical estimation of extreme ocean waves over the eastern Canadian shelf from 30-year numerical wave simulation. Ocean Dynamics65, pp.1489–1507. doi: 10.1007/s10236-015-0878-y
33
Hersbach H. Bell B. Berrisford P. Hirahara S. Horányi A. Muñoz-Sabater J. et al . (2020). The ERA5 global reanalysis. Q. J. R. Meteorological Soc.146, pp. 1999–2049. doi: 10.1002/qj.v146.730
34
Holthuijsen L. H. (2010). Waves in oceanic and coastal waters (Cambridge university press).
35
Kaczmarek L. M. Ostrowski R. Pruszak Z. Rozynski G. (2005). Selected problems of sediment transport and morphodynamics of a multi-bar nearshore zone. Estuarine Coast. Shelf Sci.62, pp.415–pp.425. doi: 10.1016/j.ecss.2004.09.006
36
Kamphuis J. W. (1991). Alongshore sediment transport rate. J. Waterway Port Coastal Ocean Eng.117, pp.624–pp.640. doi: 10.1061/(ASCE)0733-950X(1991)117:6(624)
37
Kamphuis J.W. (2002). Alongshore transport of sand. Proc. 28 Coastal Engineering Conference. ASCE, 2478–2490. doi: 10.1142/9789812791306_0207
38
Komar P. D. (1977). Beach processes and sedimentation. Inist-CNRS, PASCALGEODEBRGM7820162410.
39
Komar P. D. Inman D. L. (1970). Longshore sand transport on beaches. J. geophysical Res.75, 5914–5927. doi: 10.1029/JC075i030p05914
40
Kossin J. P. Knapp K. R. Olander T. L. Velden C. S. (2020). Global increase in major tropical cyclone exceedance probability over the past four decades. Proc. Natl. Acad. Sci.117, pp.11975–11980. doi: 10.1073/pnas.1920849117
41
Larson M. Hoan L. X. Hanson H. (2010). Direct formula to compute wave height and angle at incipient breaking. J. waterway port coastal ocean Eng.136, pp. 119–pp.122. doi: 10.1061/(ASCE)WW.1943-5460.0000030
42
Lavoie D. Lambert N. Starr M. Chassé J. Riche O. Le Clainche Y. et al . (2021). The gulf of st. Lawrence biogeochemical model: A modelling tool for fisheries and ocean management. Front. Mar. Sci.8, 732269. doi: 10.3389/fmars.2021.732269
43
Lesser G. R. Roelvink J. V. van Kester J. T. M. Stelling G. S. (2004). Development and validation of a three-dimensional morphological model. Coast. Eng.51, pp.883–pp.915. doi: 10.1016/j.coastaleng.2004.07.014
44
Liang B. Gao H. Shao Z. (2019). Characteristics of global waves based on the third-generation wave model SWAN. Mar. Structures64, 35–53. doi: 10.1016/j.marstruc.2018.10.011
45
Maia N. Z. Almeida L. P. Nicolodi J. L. Calliari L. Castelle B. (2023). Long-term trends and wave climate variability in the South Atlantic Ocean: The influence of climate indices. Regional Stud. Mar. Sci.66, 103131. doi: 10.1016/j.rsma.2023.103131
46
Manson G. K. Davidson-Arnott R. G. Forbes D. L. (2016). Modelled nearshore sediment transport in open-water conditions, central north shore of Prince Edward Island, Canada. Can. J. Earth Sci.53, pp.101–pp.118. doi: 10.1139/cjes-2015-0090
47
Mentaschi L. Besio G. Cassola F. Mazzino A. (2015). Performance evaluation of wavewatch III in the mediterranean sea. Ocean Model.90, 82–94. doi: 10.1016/j.ocemod.2015.04.003
48
Mil-Homens J. Ranasinghe R. de Vries J. V. T. Stive M. J. F. (2013). Re-evaluation and improvement of three commonly used bulk longshore sediment transport formulas. Coast. Eng.75, 29–39. doi: 10.1016/j.coastaleng.2013.01.004
49
O’Carroll S. (2008). Calcul de l’indice de sensibilité des côtes du Nouveau-Brunswick aux vagues de tempête. Ministère Des. Ressources naturelles du Nouveau-Brunswick Division Des. minéraux la politique la planification Frederiction Nouveau-Brunswick Dossier Public OF5, 73.
50
Provan M. Nistor I. Cornett A. Drouin A. (2014). Hydrodynamic and Morphologic Modeling of Alternative Design Scenarios for Shippagan Gully, New Brunswick Canada. Coastal Engineering Proceedings34, 30–30.
51
Provan M. Logan S. Nistor I. Cornett A. Drouin A. (2018). Field and numerical investigations of the morpho-hydrodynamic processes of the tidal inlet at Shippagan Gully, New Brunswick, Canada. Coast. Eng. J.60, 400–422. doi: 10.1080/21664250.2018.1492235
52
Rölfer L. Celliers L. Abson D. J. (2022). Resilience and coastal governance: knowledge and navigation between stability and transformation. Ecol. Soc.27 (2), 40. doi: 10.5751/ES-13244-270240
53
Ruest B. Neumeier U. Dumont D. Bismuth E. Senneville S. Caveen J. (2016). Recent wave climate and expected future changes in the seasonally ice-infested waters of the Gulf of St. Lawrence Canada. Climate dynamics46, 449–466. doi: 10.1007/s00382-015-2592-3
54
Ruest B. Neumeier U. Dumont D. Lambert A. (2013). Wave climate evaluation in the Gulf of St. Lawrence with a parametric wave model. Extended Abstracts Coast. Dynamics 2013: Coast. Dynamics Res. Emphasizing Pract. Appl.1363, 1374.
55
Saengsupavanich C. Yun L. S. Lee L. H. Sanitwong-Na-Ayutthaya S. (2022). Intertidal intercepted sediment at jetties along the Gulf of Thailand. Front. Mar. Sci.9, 970592. doi: 10.3389/fmars.2022.970592
56
Semedo A. Sušelj K. Rutgersson A. Sterl A. (2011). A global view on the wind sea and swell climate and variability from ERA-40. Journal of Climate24 (5), 1461–1479. doi: 10.1175/2010JCLI3718.1
57
Shanas P. R. Kumar V. S. (2014). Coastal processes and longshore sediment transport along Kundapura coast, central west coast of India. Geomorphology214, 436–451. doi: 10.1016/j.geomorph.2014.02.027
58
Splinter K. D. Davidson M. A. Golshani A. Tomlinson R. (2012). Climate controls on longshore sediment transport. Continental Shelf Res.48, 146–156. doi: 10.1016/j.csr.2012.07.018
59
Swail V. R. Cardone V. J. Ferguson M. Gummer D. J. Harris E. L. Orelup E. A. et al . (2006). September. The MSC50 wind and wave reanalysis. In. 9th Int. Wind Wave Workshop.
60
Temmerman S. Meire P. Bouma T. J. Herman P. M. Ysebaert T. De Vriend H. J. (2013). Ecosystem-based coastal defence in the face of global change. Nature504, pp.79–pp.83. doi: 10.1038/nature12859
61
Thomson R. E. Emery W. J. (2014). Data analysis methods in physical oceanography. Newnes.
62
Toimil A. Losada I. J. Camus P. Díaz-Simal P. (2017a). Managing coastal erosion under climate change at the regional scale. Coast. Eng.128, 106–122. doi: 10.1016/j.coastaleng.2017.08.004
63
Toimil A. Losada I. J. Camus P. Díaz-Simal P. (2017b). Managing coastal erosion under climate change at the regional scale. Coast. Eng.128, 106–122. doi: 10.1016/j.coastaleng.2017.08.004
64
Townsend K. E. Thomas R. C. Frey A. E. (2014). Shoreline change modeling using one-line models: Application and comparison of GenCade, Unibest, and Litpack. Tech. note ERDC/CHL CHETN-IV102, 1-12. doi: 10.21236/ADA611868
65
Umesh P. A. Behera M. R. (2020). Performance evaluation of input-dissipation parameterizations in WAVEWATCH III and comparison of wave hindcast with nested WAVEWATCH III-SWAN in the Indian Seas. Ocean Eng.202, 106959. doi: 10.1016/j.oceaneng.2020.106959
66
USACE (1973). Shore protection manual Vol. 1 (US Army Coastal Engineering Research Center).
67
USACE (1984). Shore protection manual Vol. 1 (Department of the Army, Waterways Experiment Station, Corps of Engineers, Coastal Engineering Research Center).
68
Van Rijn L. C. (2014). A simple general expression for longshore transport of sand, gravel and shingle. Coast. Eng.90, 23–39. doi: 10.1016/j.coastaleng.2014.04.008
69
Van Vledder G. P. Akpınar A. (2015). Wave model predictions in the Black Sea: Sensitivity to wind fields. Appl. Ocean Res.53, 161–178. doi: 10.1016/j.apor.2015.08.006
70
Walker J. Murphy E. Ciardulli F. Hamm L. (2014). On the reliance on modelled wave data in the Arabian Gulf for coastal and port engineering design. Coast. Eng. Proc.1, p.28. doi: 10.9753/icce.v34.waves.28
71
Walton T.L. Bruno R. O. (1989). Longshore transport at a detached breakwater, phase II. J. Coast. Res.5 (4), 679–691.
72
Wang X. L. Feng Y. Swail V. R. (2014). Changes in global ocean wave heights as projected using multimodel CMIP5 simulations. Geophysical Res. Lett.41, 1026–1034. doi: 10.1002/2013GL058650
73
Wang P. Kraus N. C. Davis R. A. Jr. (1998). Total longshore sediment transport rate in the surf zone: field measurements and empirical predictions. J. Coast. Res.14 (1), 269–282.
74
Wang L. Perrie W. Long Z. Blokhina M. Zhang G. Toulany B. et al . (2018). The impact of climate change on the wave climate in the Gulf of St. Lawrence. Ocean Model.128, 87–101. doi: 10.1016/j.ocemod.2018.06.003
75
Wood D. J. Muttray M. Oumeraci H. (2001). The SWAN model used to study wave evolution in a flume. Ocean Eng.28, 805–823. doi: 10.1016/S0029-8018(00)00033-0
76
Young I. R. (1999). Wind generated ocean waves (Elsevier).
77
Zhang K. Douglas B. C. Leatherman S. P. (2004). Global warming and coastal erosion. Climatic Change64, 41–58. doi: 10.1023/B:CLIM.0000024690.32682.48
78
Zheng Z. Ma X. Huang X. Ma Y. Dong G. (2022). Wave forecasting within a port using WAVEWATCH III and artificial neural networks. Ocean Eng.255, 111475. doi: 10.1016/j.oceaneng.2022.111475
Summary
Keywords
wave climate, longshore sediment transport, Gulf of St. Lawrence, ERA-5, nature based solutions
Citation
Thomas J, George J, Van Proosdij D and Murphy E (2025) Wave dynamics and potential longshore sediment transport at Shippagan, Gulf of St Lawrence: insight into seasonal variability and extreme weather events. Front. Mar. Sci. 12:1579807. doi: 10.3389/fmars.2025.1579807
Received
19 February 2025
Accepted
13 May 2025
Published
03 June 2025
Volume
12 - 2025
Edited by
Erfan Amini, Stevens Institute of Technology, United States
Reviewed by
Ya Ping Wang, East China Normal University, China
Erdinc Sogut, United States Geological Survey, United States
Updates
Copyright
© 2025 Thomas, George, Van Proosdij and Murphy.
This is an open-access article distributed under the terms of the Creative Commons Attribution License (CC BY). The use, distribution or reproduction in other forums is permitted, provided the original author(s) and the copyright owner(s) are credited and that the original publication in this journal is cited, in accordance with accepted academic practice. No use, distribution or reproduction is permitted which does not comply with these terms.
*Correspondence: Jubin Thomas, Jubin.thomas@smu.ca
Disclaimer
All claims expressed in this article are solely those of the authors and do not necessarily represent those of their affiliated organizations, or those of the publisher, the editors and the reviewers. Any product that may be evaluated in this article or claim that may be made by its manufacturer is not guaranteed or endorsed by the publisher.