Abstract
This study assesses the impact of intensified upwelling on the marine carbonate system along the Northwest African coast, from Cape Blanc (21°N) to Cape Cantin (33°N), a region where ocean acidification observations remain limited. We analyze surface water variability using data from two oceanographic surveys conducted aboard the R/V Dr. Fridtjof Nansen in spring and autumn 2022. The analysis is based on observational data of temperature, salinity, dissolved oxygen, chlorophyll a, pH, total alkalinity, and derived carbonate system variables. In spring, upwelling was widespread across the study area, while in autumn it was more localized near Cape Draa (28°30'N), between Cape Boujdour and Dakhla (25°30N–23°30N), and at Cape Blanc (21°N). Both spring and autumn were influenced by low-oxygenated South Atlantic Central Water (SACW), which is rich in DIC (2160–2250 µmol/kg), and upwelled to the surface, lowering pH (~7.85–7.95) and aragonite saturation state (ΩAr ~1.5–2.5). The strongest acidification signals were observed in autumn at Cape Draa (28°30N) and Cape Blanc (21°N), where the lowest pH (7.8) and ΩAr (1.5), along with the highest DIC (2250 µmol/kg), were recorded. The study clearly shows that the lowest pH values and highest DIC concentrations were related to the influence of SACW upwelling at Cape Blanc. It was also evident that areas with high chlorophyll a coincided with higher ΩAr and pH in spring. This suggests that primary production (PP) during spring counteracts the effect of upwelled low-pH water along the coast. Areas of high PP, such as at Cape Draa (28°30N), experienced increased DIC levels and enhanced acidification after the bloom season, potentially influenced by organic matter remineralization. Our findings highlight the influence of upwelling and biological processes on surface carbonate chemistry along the Northwest African coast. This study emphasizes the necessity of long-term monitoring to assess ocean acidification trends and their ecological implications in this vulnerable region.
1 Introduction
Carbon dioxide (CO2) emissions into the atmosphere have increased dramatically over recent decades, mainly due to human activities (Somova et al., 2003; Keeling and Whorf, 2004; Sabine et al., 2004; Royal Society, 2005; Siegenthaler et al., 2005; IPCC, 2013; Friedlingstein et al., 2022). This is a major contributor to global warming and climate change (Bindoff et al., 2019; Forster et al., 2024). Ocean acidification (OA) mainly results from the increased uptake of this anthropogenic CO2 by the oceans, thereby disrupting the chemical balance of the marine carbonate system (Zeebe and Wolf-Gladrow, 2001; Le Quéré et al., 2010). In addition, natural processes such as coastal upwelling, biological respiration, or river inputs, can locally accentuate this phenomenon (Feely et al., 2008; Chen et al., 2022). The superposition of these anthropogenic and natural effects results in marked spatio-temporal variability in acidification conditions, particularly in dynamic coastal ecosystems.
According to the World Meteorological Organization (WMO/GCOS, 2018), OA is now one of the key indicators of global climate change. Monitoring this phenomenon is therefore crucial, due to its potentially harmful effects on biological processes (Kroeker et al., 2010; Collins et al., 2014) as well as on the physicochemical balances of marine systems that are sensitive to pH (Feely et al., 2004; Millero et al., 2009; Millero and DiTrolio, 2010; Woosley et al., 2012).
The marine carbon biogeochemical cycle relies on a complex interaction between physical, chemical, and biological processes that regulate the distribution and transformation of different forms of carbon in the ocean. The carbonate system, in particular, is governed by equilibria between dissolved carbon dioxide (CO2), bicarbonate (HCO3-), and carbonate (CO3²-) ions (Doney et al., 2009b; Dore et al., 2009; Goyet et al., 2016).
Disruption of this balance, especially the decrease in carbonate ion (CO3²-) concentrations, has significant consequences for calcifying marine organisms, by reducing the saturation state of calcium carbonate (CaCO3) and increasing its solubility (Caldeira and Wickett, 2003, Caldeira and Wickett, 2005; Feely et al., 2004; Sabine et al., 2004; Orr et al., 2005). In addition, the loss of CO3²- reduces the buffering capacity of seawater, as total alkalinity (AT) decreases twice as fast as dissolved inorganic carbon (DIC). The repercussions may include disruptions in food chains, reduced biodiversity, and the compromise of vital ecosystem services, such as fisheries and coastal protection, which support many human communities (Fabry et al., 2008; Doney et al., 2009a, Doney et al., 2020; Kroeker et al., 2013; Gattuso et al., 2015).
Coastal upwelling systems play a key role in the biogeochemical dynamics of marine ecosystems. By bringing deep, cold, nutrient- and DIC-rich waters to the surface, they enhance biological productivity but can also locally intensify acidification by lowering pH and the saturation states of carbonate and aragonite. These effects are particularly pronounced in regions subject to intense and persistent upwelling.
Northwest (NW) Africa benefits from one of the two major upwelling systems in the Atlantic Ocean and one of the four largest upwelling systems worldwide. This system, part of the Canary Current System (CCS), is driven by trade winds and is characterized by seasonal activity in the north (above 28°) and permanent activity in the south (21°N) (Makaoui et al., 2005; Benazzouz et al., 2014; Hilmi et al., 2020; Jamal et al., 2025), with intensity variations across latitudes (Bakun, 1990). It ensures a regular nutrient supply, thereby supporting high biological productivity essential to marine food chains and the development of fishery resources (Pauly and Christensen, 1995; Buhl-Mortensen et al., 2024). Approximately 80% of the national pelagic fish catches come from these upwelling areas (Kamili et al., 2019), which play a key role in the local and regional economy, particularly through commercial fishing and the marine biodiversity they sustain (Berraho, 2007).
Studies conducted in other upwelling regions, such as the west coast of the United States (Feely et al., 2008; Gruber et al., 2012), shows that upwelling activity strongly affects the spatial distribution of carbonate system parameters, as well as other biogeochemical variables such as dissolved oxygen and chlorophyll a, which are indicators of primary production. However, knowledge about acidification and the dynamics of the carbonate system in the NW African region remain very limited. Lachkar (2014) examined the effect of upwelling intensity on OA in the CCS. Flecha et al., 2019 and Huertas et al. (2009) focused on studying biogeochemical exchanges between Mediterranean and Atlantic water masses through the Strait of Gibraltar, highlighting the impact of the Mediterranean basin on carbon stocks in the North Atlantic. Loucaides et al. (2012) studied the carbonate chemistry system at the upwelling filament off Cape Blanc (north of Mauritania) and its evolution with biological, physical, and chemical processes. In this context, the present study aims to analyze the influence of upwelling seasonality on the surface distribution of carbonate system parameters along the NW African coast, based on data collected in spring and autumn 2022. The study aims to:
-
Characterize the spatial distribution of carbonate system parameters on the NW African coast;
-
Assess the effect of upwelling dynamics on the biogeochemical properties of coastal waters;
-
Provide a short-term reference state (two seasons) for the biogeochemical functioning of this region.
By highlighting the factors that influence the distribution of the observed parameters, as well as the possible relationships between hydrological and biogeochemical variables, this study contributes to a better understanding of acidification processes in a region that is still poorly documented. It therefore provides an essential basis for future observations and research in the context of climate change.
2 Study area
Our study focused on the NW African upwelling region located between Cape Cantin (33°N) and Cape Blanc (21°N) (Figure 1). This area is influenced by the Canary Current upwelling system, characterized by intense coastal upwelling primarily driven by northeast trade winds associated with the Azores High. These winds generate offshore Ekman transport, promoting the upwelling of cold, nutrient-rich waters (Mittelstaedt, 1991).
Figure 1
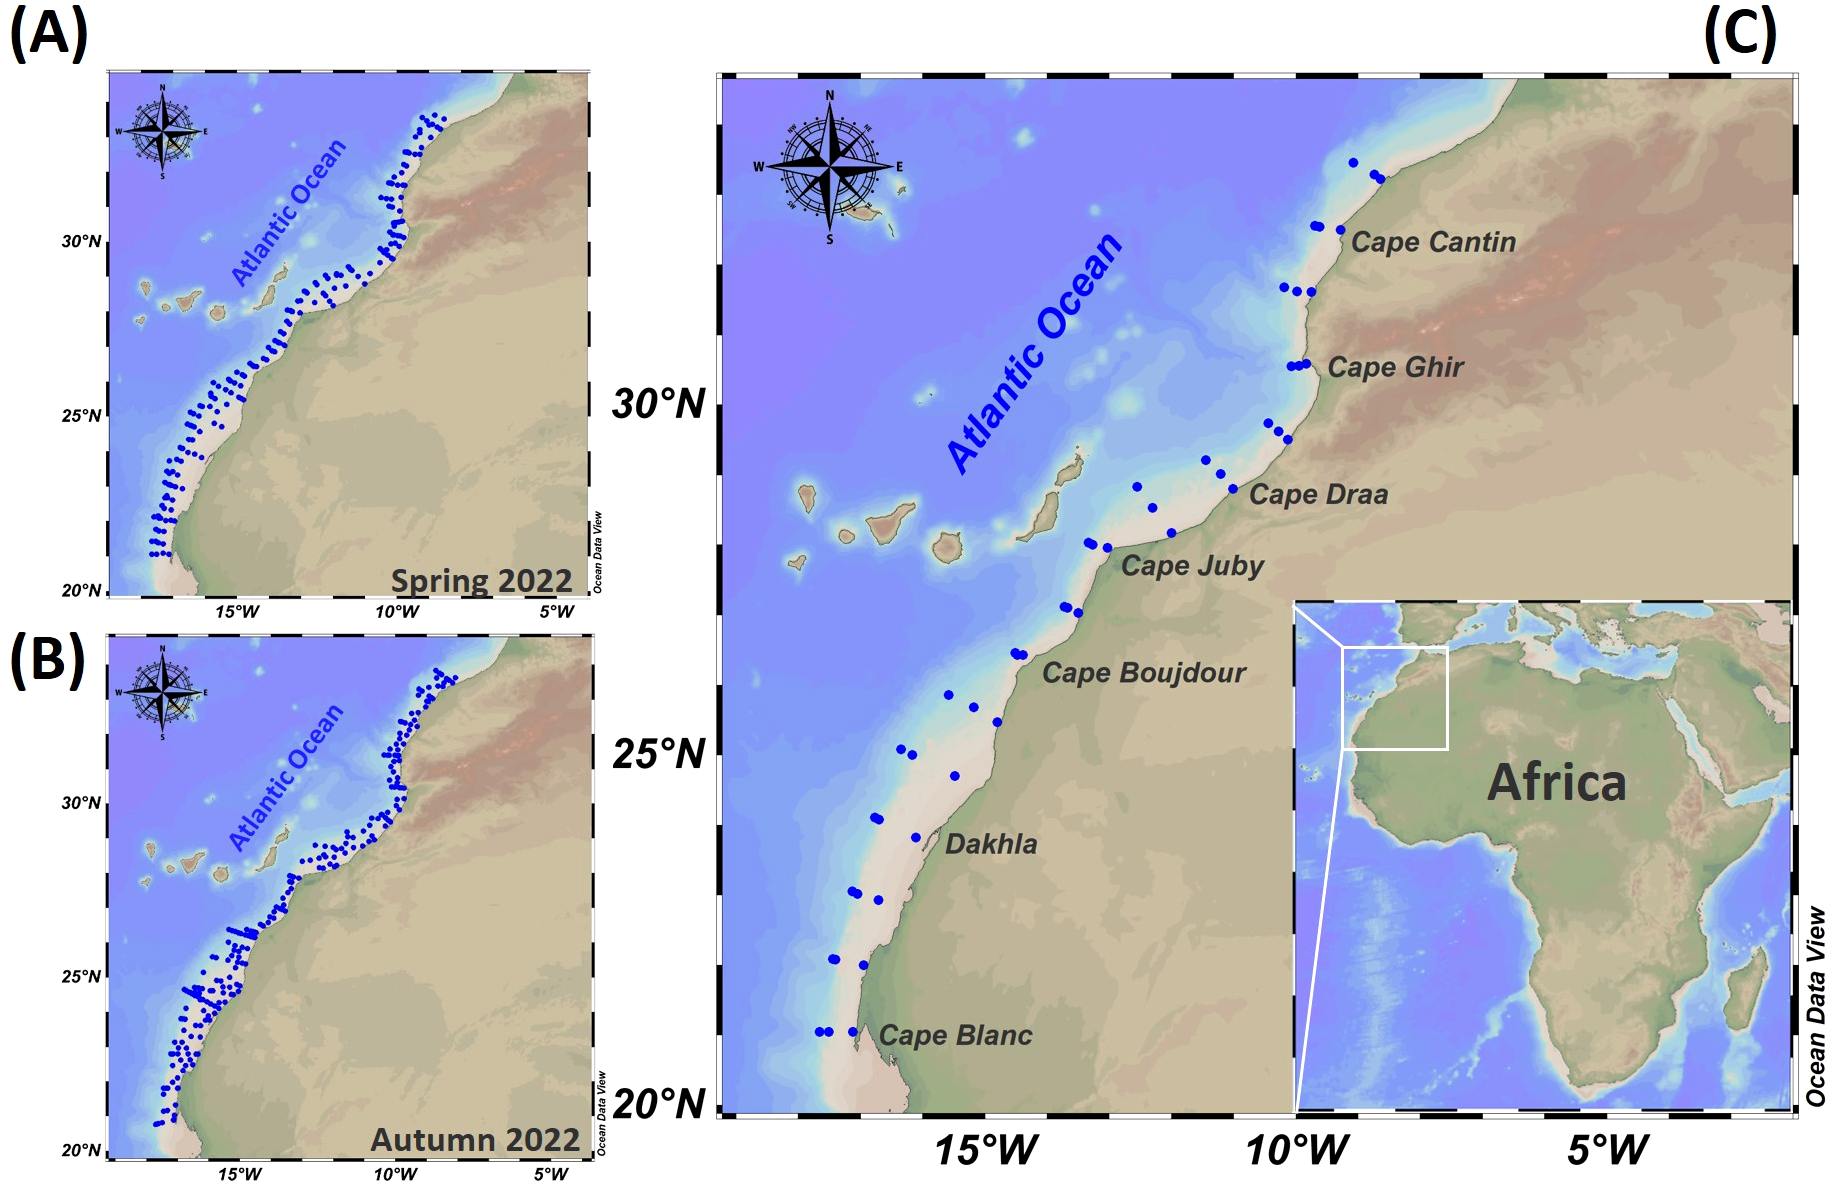
Study area station mapping (A, B), and details of sample transects for spring and autumn surveys ((C)Table 1).
The upwelling exhibits strong seasonal variability with distinct phases. During winter, upwelling is generally weaker due to reduced wind intensity. In spring, upwelling gradually intensifies as trade winds strengthen, triggering phytoplankton blooms and increased biological productivity. Summer marks the peak upwelling intensity: strong winds cause significant sea surface temperature drops, often falling below 16°C near the coast, supporting intense biological activity. In autumn, upwelling gradually weakens as winds diminish, marking a transition to warmer surface conditions (Pelegrí and Peña-Izquierdo, 2015; Hilmi et al., 2020; El Aouni et al., 2024).
The system also shows notable latitudinal contrasts. The northern sector between Cape Cantin and approximately 26°N experiences seasonal upwelling, with maximum activity during summer. In contrast, the southern sector (~26°N to Cape Blanc) features quasi-permanent upwelling year-round, where cold waters and high productivity sustain important fisheries (Cropper et al., 2014; Nait-Hammou et al., 2025).
This region thus represents one of the world’s most productive marine ecosystems, while remaining particularly vulnerable to climate change impacts that may alter wind patterns and amplify ocean warming.
3 Materials and methods
This study is based on data collected during two scientific surveys conducted aboard the Norwegian research vessel (R/V) Dr. Fridtjof Nansen (DFN), as part of a collaboration between the EAF-Nansen Program and the National Institute of Fisheries Research (INRH) of Morocco. The EAF-Nansen Program is a joint initiative between the Food and Agriculture Organization of the United Nations (FAO) and Norway, with the scientific support of the Norwegian Institute of Marine Research (IMR). This initiative aims to promote sustainable fisheries management in partner countries.
Two oceanographic campaigns were carried out in 2022, one in spring (from April 2 to May 3, 2022, Cruise number: 2022403) and the other in autumn (from October 22 to November 15, 2022, Cruise number: 2022411) aboard the R/V DFN, to study the physical and chemical environment for the pelagic ecosystem along the NW African coast.
During the spring survey, 192 CTD (Conductivity-Temperature and Depth) profiles were conducted, which increased to 241 CTD profiles in autumn (Figures 1A, B, Table 1). During both campaigns, water samples were collected at 48 stations located along specific transects ranging from shallow coastal areas to deeper offshore regions (Figure 1C, Table 1), allowing spatial coverage for analyzing environmental gradients, physical and biogeochemical processes.
Table 1
| Station/Samples | Spring | Autumn |
|---|---|---|
| CTD Station | 192 | 241 |
| Water sampling stations | 48 | 48 |
| pH samples | 346 | 392 |
| AT samples | 346 | 392 |
| Chl a samples | 317 | 417 |
| Salinity samples | 156 | 75 |
| DO samples | 156 | 103 |
Number of stations and samples collected per survey.
3.1 Sampling and analytical procedures
Vertical profiles of temperature (T, °C) and salinity (S) were collected using a Conductivity-Temperature and Depth (CTD; SBE 911plus, SBE 3plus, SBE 4C). An additional sensor (SBE-43) was used to measure dissolved oxygen concentration (DO, ml/l). The maximum depth at offshore stations reached 1000 m in spring and 1500 m in autumn.
A seawater intake at 6 meters depth pumped seawater for continuous measurements of sea surface temperature (SST) and sea surface salinity (SSS) using a thermosalinograph (TSG, SBE-21, Seabird Electronics Inc.). The accuracy and precision for SST and SSS were ±0.01°C and ±0.001, respectively. In addition to the TSG, the surface water underway system was equipped with a factory-calibrated sensor for in-situ Chlorophyll a fluorescence, Chla_fluo, (WET Labs WetStar fluorometer).
Water samples were collected using a CTD-Rosette system with 12 Niskin bottles at 48 stations (Figure 1C, Table 1). Samples for DO analysis were collected first, followed by samples for carbonate system analysis [pH and total alkalinity (AT)], in 250 ml borosilicate glass bottles. Chlorophyll a (Chla_meas) samples were collected next, followed by samples for salinity analysis. Sampling adhered to standard protocols to prevent contamination, such as gas exchange with the atmosphere for DO, pH, and AT samples (Dickson et al., 2007).
Water samples for salinity and DO analysis were collected at offshore stations to validate and calibrate conductivity and DO sensors. Salinity was measured onboard using a Guildline Portasal 8410A salinometer for conductivity (salinity) and DO was determined by Winkler titrations on a Metrohm 916 Ti-Touch potentiometric titrator.
AT and pH analyses were conducted onboard within 24 hrs following the general procedures outlined by Dickson et al., 2007. AT was determined by open-cell potentiometric titration using a Titroprocessor (Metrohm model 888 Titrando) with 0.1 N hydrochloric acid. The precision of AT was between ±3 and ±5 μmol/kg, based on triplicate analyses of each sample. Accuracy was validated using Certified Reference Materials (CRM) (CRM, lot 187 for both seasons) provided by the A.G. Dickson laboratory (Scripps Institution of Oceanography, La Jolla, CA, USA). pH was measured spectrophotometrically (Agilent Cary 8454 UV-visible spectrophotometer) on the total scale at 25°C (pHT25) using 2 mM m-cresol purple (m-CP) dye as indicator (Clayton and Byrne, 1993) in a 1 cm quartz cuvette (Clayton and Byrne, 1993). The precision of triplicate measurements ranged from ±0.001 to ±0.003. The adjustment for the influence of mCP on seawater pH was performed according to the methods described by Chierici et al., 1999. Chla_meas was measured using a fluorometer (Turner Designs 10-AU) following methods by Linder, 1974 and Strickland and Parsons, 1972.
3.2 Data calculations
3.2.1 Carbonate chemistry
Seawater carbonate chemistry parameters, including in situ pH (pHT-in situ, defined on the total scale of H+), aragonite saturation state (ΩAr), calcite saturation state (ΩCa), total dissolved inorganic carbon (DIC) and the partial pressure of CO2 (pCO2) were calculated based on temperature, salinity, and pressure obtained from CTD data and the measured pH and total alkalinity (AT) values, using the CO2SYS carbonate system calculation program configured for Excel by Pierrot et al., 2006. These calculations were carried out on the total hydrogen ion scale, using the carbonic acid dissociation constants (pK1 and pK2) from Lueker et al., 2000, the hydrogen sulfate (HSO4-) dissociation constants defined by Dickson, 1990, and the borate constants from Uppström, 1974.
The cartography, surface distribution, and maps of the stations and study areas were generated using the graphical software Ocean Data View (ODV Version: ODV 5.7.1) (Schlitzer, 2024).
3.2.2 Corrected in-situ chlorophyll a value
The data from the Chla_fluo were corrected using measurements of Chl a concentrations, Chla_meas from filtered water samples from the upper 10 m of the water column (upper 10 m) to develop linear regressions. Since there is considerable seasonal variability in the fluorescence signal caused by physiological and regional differences in phytoplankton composition (Roesler et al., 2017) we performed separate regressions for spring (Equation 1), and autumn (Equation 2), respectively. The Equations were applied to all Chla_fluo to obtain corrected in-situ Chl a values (Chla_insitu). Values below the root mean square error (RMSE) (Table 2) should be taken with caution and is considered to be the detection limit for this conversion. Generally, the Chla_fluo were lower than Chla_meas, which suggests that the fluorescence sensor underestimates the actual Chl a in the water column in both spring and autumn.
Table 2
| Season | R2 | p-value | RMSE (mg/m3) |
|---|---|---|---|
| Spring | 0.837 | < 0.01 | 0.620 |
| Autumn | 0.782 | < 0.01 | 0.351 |
Statistical parameters of the linear regressions between chlorophyll a fluorescence (Chla_fluo) and measured chlorophyll a concentrations (Chla_meas) for spring and autumn.
(R², coefficient of determination; p-value, significance level; RMSE, root mean square error in mg/m³).
3.3 Statistical analysis
The analysis of the distribution patterns of environmental variables and the identification of key environmental gradients in the study area was conducted using principal component analysis (PCA). This method allows for dimensionality reduction of the data while retaining most of the total variability, thus facilitating the interpretation of complex relationships between variables. This information is helpful for interpreting the latitudinal and seasonal variations of oceanic conditions and their impacts on marine ecosystems.
The PCA was performed using the statistical software R (version R-4.4.1) (Équipe RStudio, 2020). The results of the PCA were visualized using biplots, which illustrate the relationships between variables and sampling stations in the principal component space. This allows a better understanding of the interactions between hydrological and biogeochemical parameters.
The environmental variables were normalized and logarithmically transformed before the analysis to reduce the influence of extreme values and stabilize the variance. The environmental variables used for the PCA include Sea Surface Temperature (T), Sea Surface Salinity (S), Dissolved Oxygen (DO), Surface Chlorophyll-a Concentration (Chla_meas), pHT-in situ, Total Alkalinity (AT), Dissolved Inorganic Carbon (DIC), Aragonite Saturation (ΩAr), Calcite Saturation (ΩCa), and Partial Pressure of CO2 (pCO2).
4 Results
4.1 Water mass distributions in the full water column
Two distinct water masses were identified in the study area within the upper 500 m of the water column (Figures 2A–D): the South Atlantic Central Water (SACW) and the Eastern North Atlantic Central Water (ENACW).SACW is characterized by lower salinity and reduced dissolved oxygen (DO) concentrations, While ENACW is relatively warm and oxygen-rich. According to Emery (2003), these two water masses (SACW and ENACW) are distinguished by their maximum salinity, reaching 35.8 for SACW and 36.7 for ENACW. DO levels are generally lower in the SACW, especially evident in autumn (Figure 2D).
Figure 2
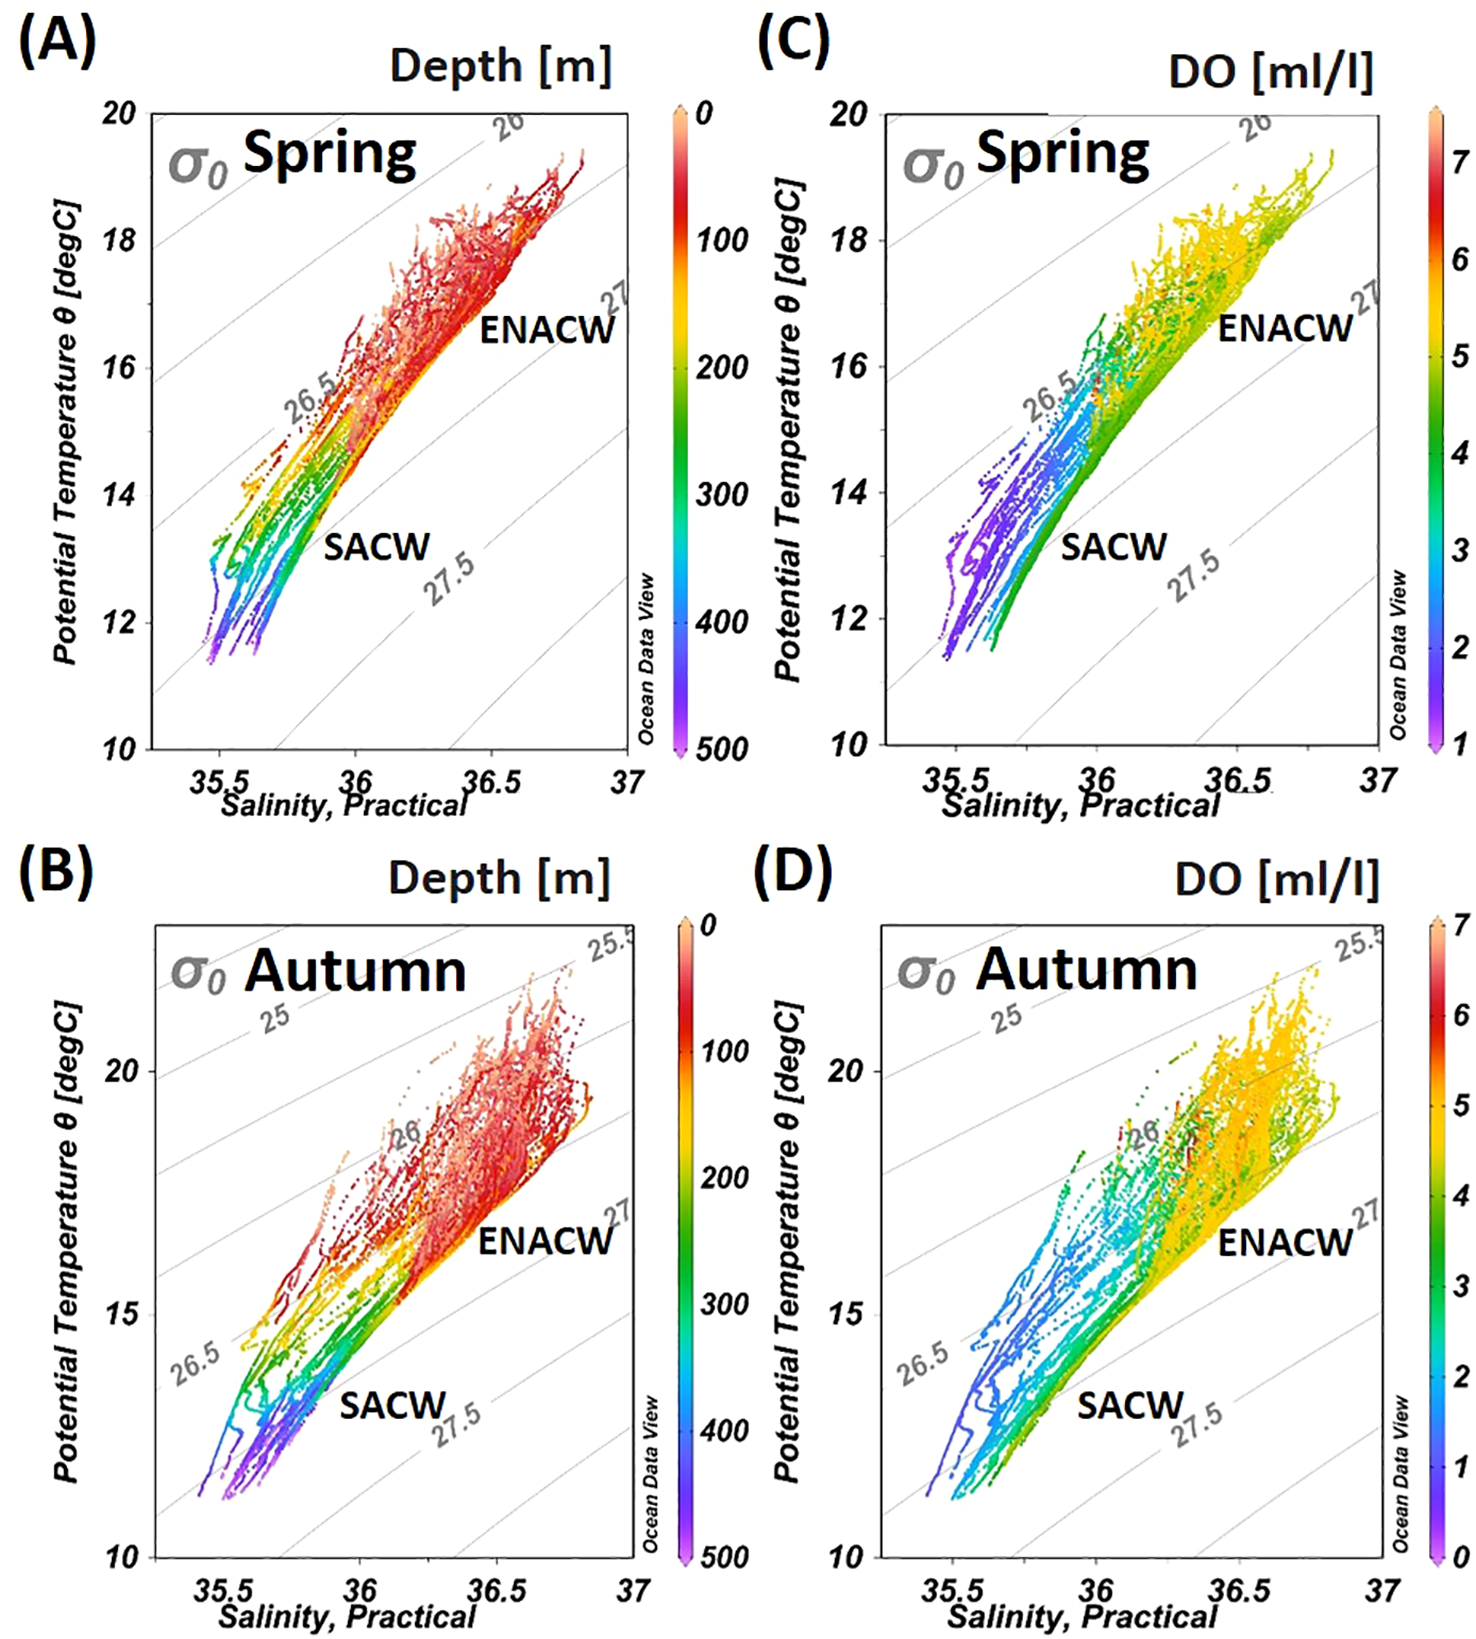
Properties of the main water masses off the NW African coast in spring and autumn in the upper water layer (0–500 m). Panels (A, B) show data based on depth (m), indicated by the color scale to the right. Panels (C, D) show data based on dissolved oxygen concentration (ml/l), marked by the color scale to the right. The identified water masses are South Atlantic Central Water (SACW) and Eastern North Atlantic Central Water (ENACW).
4.2 Wind-induced ocean circulation
The influence of wind on ocean circulation was investigated using surface wind data for spring (from April 2 to May 3) and autumn (from October 22 to November 15) of 2022 (Figure 3) obtained from IFREMER CERSAT global ocean surface wind climatology. These data include both meridional and zonal wind components and are provided as seasonal averages with a spatial resolution of 0.25° × 0.25° in latitude and longitude. Wind stress is derived from ASCAT data.
Figure 3
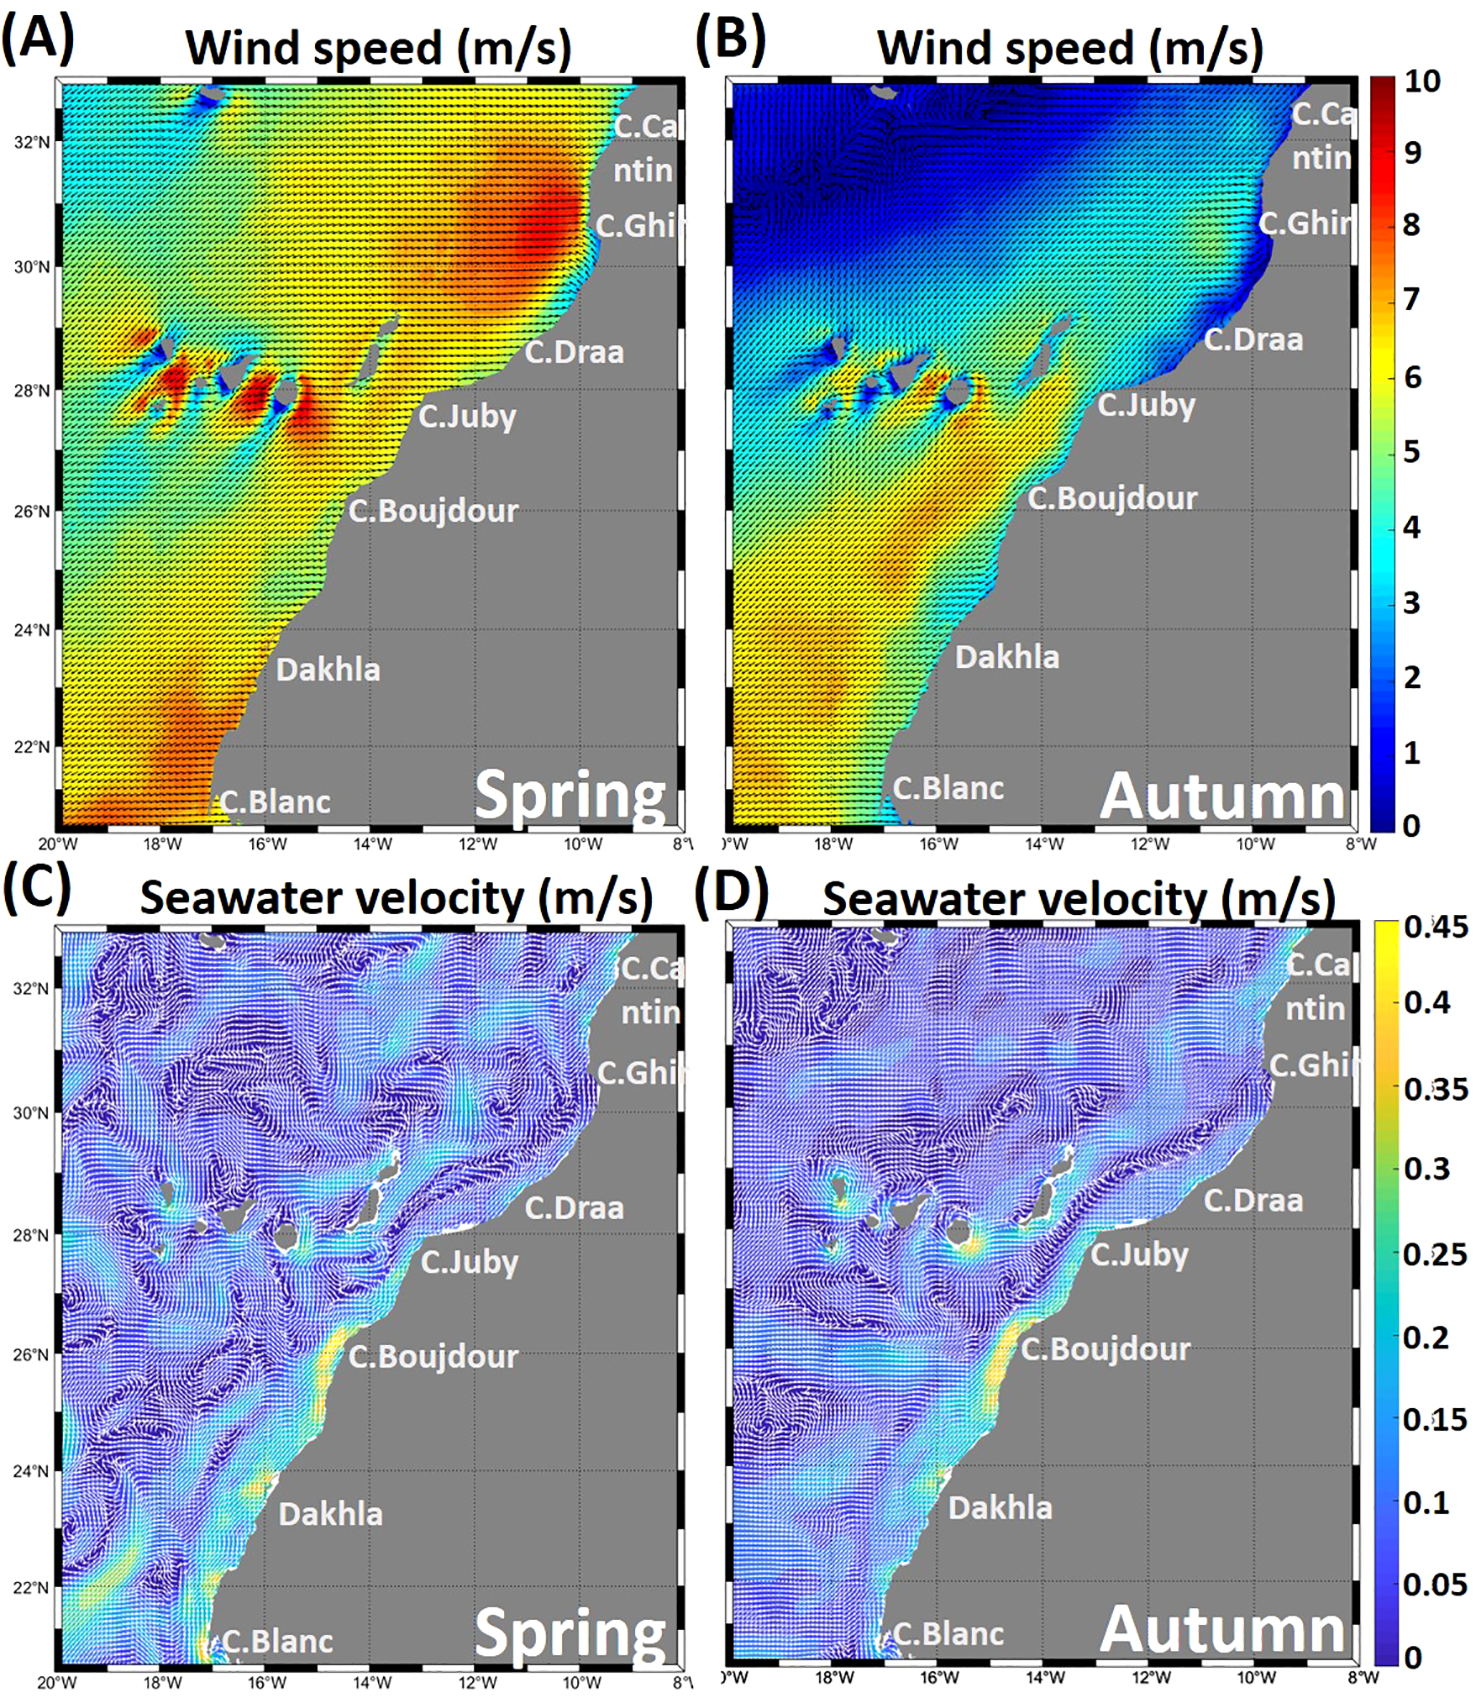
Mean surface wind speed and direction (m/s) (A, B) and seawater surface velocity (m/s) (C, D) for the study period in spring and autumn 2022.
The NW African region is constantly subject to north-easterly winds (parallel to the coast) with latitudinal fluctuations, the intensity of which varies with the seasons. Wind speeds reach maximum values of over 8 m/s in spring (Figure 3A), particularly in the area between Cape Cantin and Cape Juby (6°from the coast to offshore), as well as in the region between Dakhla and Cape Blanc (1-2°from the coast to offshore). In autumn (Figure 3B), wind speeds are lower in the north, between Cape Cantin and Cape Juby, with relatively moderate intensity in the Cape Ghir region, around 5 m/s. The area between Cape Juby and Cape Blanc is subject to moderate winds of around 6.5 m/s. The northern zone is subject to seasonal winds, while the southern zone is characterized by a higher wind intensity, particularly in spring.
The northern zone is characterized by weak surface currents in both the spring and autumn seasons, except in the coastal area of Cape Cantin, where it reaches 0.35 m/s with a predominant direction towards the southeast in spring and autumn (Figures 3C, D). However, the southern zone exhibits maximum values in spring, particularly in the coastal areas around Cape Boujdour, Dakhla, and Cape Blanc, reaching 0.45 m/s (Figure 3C). In autumn, the strong currents are primarily limited to the Cape Boujdour region and north of Dakhla (Figure 3D). In this area, coastal currents are generally strongly influenced by the prevailing winds. These currents often follow the same direction as the winds, resulting in significant movements of surface water masses.
4.3 Surface distributions of environmental parameters
The distributions of surface environmental parameters for the two seasons, spring and autumn, are shown in Figure 4. Surface temperature and salinity show clear seasonal variations, with higher values in autumn than in spring (Figures 4A, B, A’, B’). In spring, coastal waters are colder and less salty, with temperatures around 16°C and salinity near 36. Offshore, both temperature and salinity increase gradually between Cape Cantin and Dakhla, reaching 18–20°C and 36.3–36.8. Further south, values decrease again, with temperatures around 17.5°C and salinity below 36.1. In autumn, coastal waters are warmer and saltier, with temperatures between 17 and 19°C and salinity between 36.2 and 36.5 from Cape Cantin to Dakhla, and a minimum of 36 near Cape Blanc. Offshore waters show the highest values, with temperatures above 22°C and salinity up to 36.8 (Figures 4A, B, A’, B’). DO concentrations were relatively higher in spring than in autumn (Figures 4C, C’), with significant differences observed in the Cape Blanc (21°N) region, where lowest DO concentrations are observed in spring (~1 ml/l) (Figure 4C). This is also where we observed the lowest salinity (Figures 4B, B’).
Figure 4
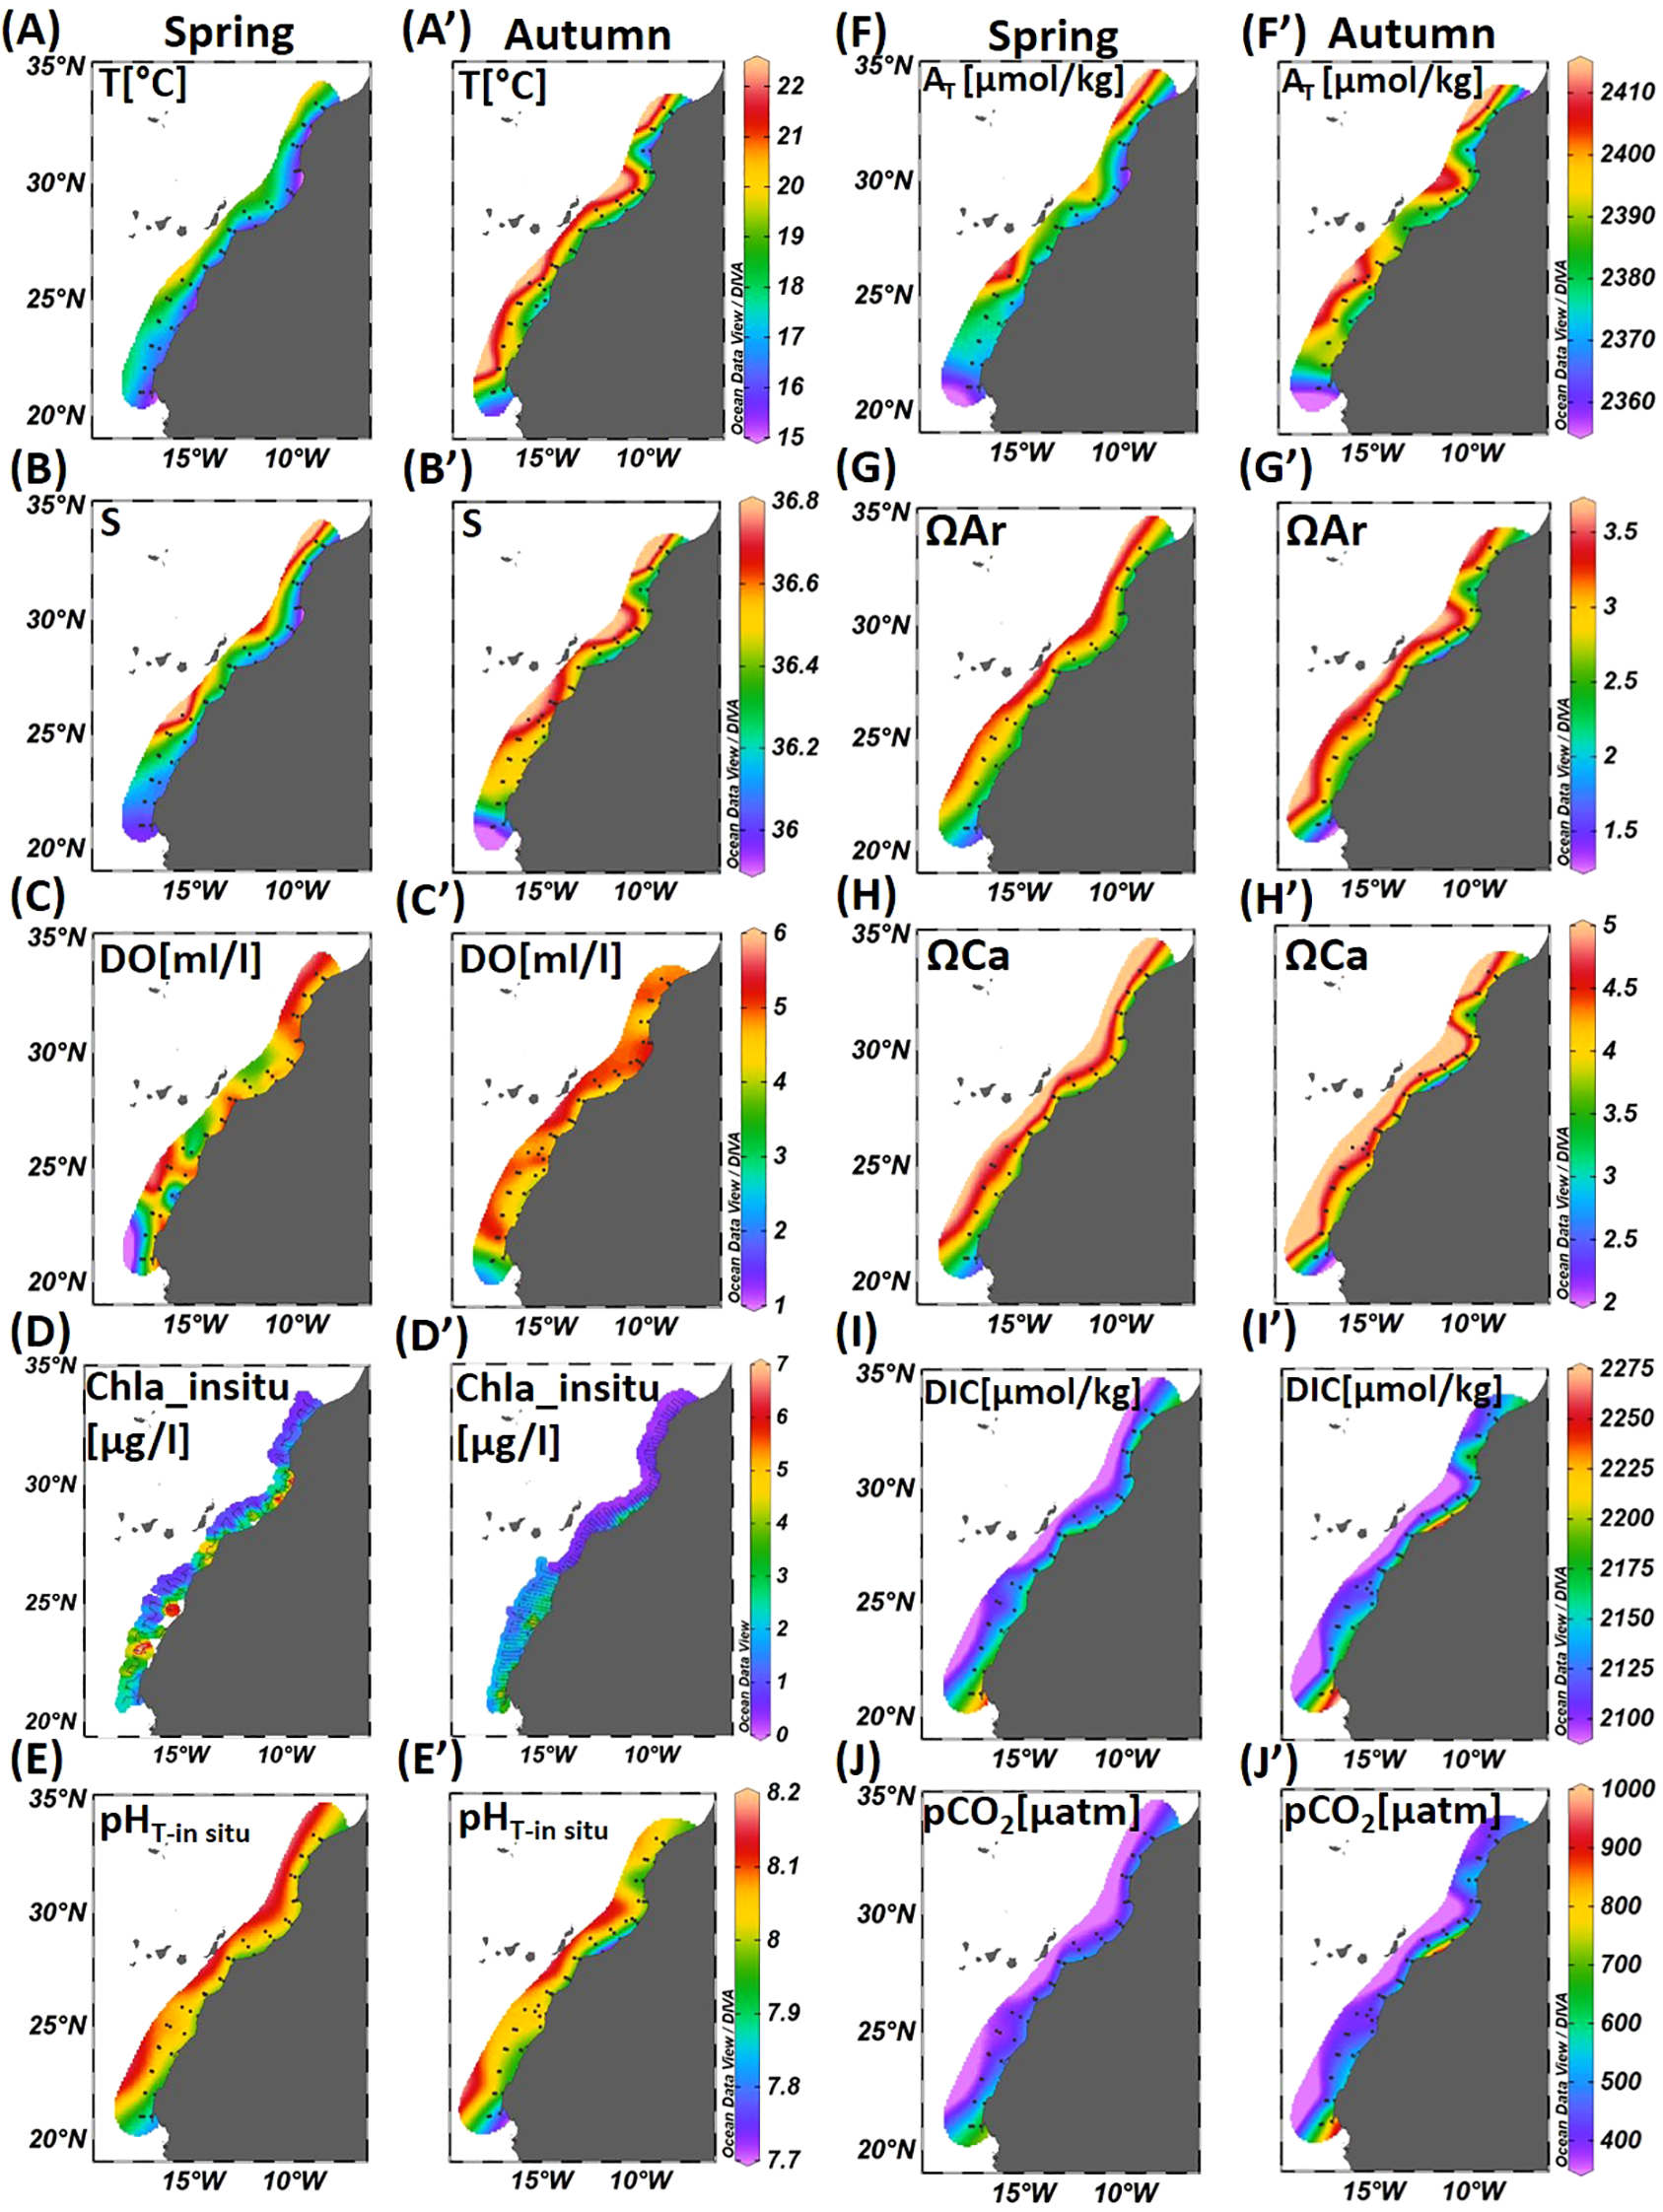
Surface distribution of: (A, A’) Temperature (T, °C); (B, B’) Salinity (S); (C, C’) Dissolved Oxygen (DO, ml/l); (D, D’)In-situ Chlorophyll a (Chla_in situ, µg/l); (E, E’)in-situ pH (pHT-in situ); (F, F’) Total Alkalinity (AT, µmol/kg); (G, G’) Aragonite saturation state (ΩAr); (H, H’) Calcite saturation state (ΩCa); (I, I’) Dissolved Inorganic Carbon (DIC, µmol/kg); and (J, J’) Partial Pressure of CO2 (pCO2, µatm) in spring and autumn seasons.
Chl a concentration exhibited significant latitudinal and seasonal fluctuations. Chl a concentration (Figures 4D, D’) was higher in spring, particularly between Cape Ghir (30°30N) and Cape Draa (28°30N), Cape Juby (27°30N), south of Cape Boujdour (25°30N), south of Dakhla (23°30N) and Cape Blanc (21°N), reaching 6 µg/l. In autumn, relatively high Chl a concentrations characterized the Cape Draa (28°30N) region and the southern region, between Cape Boujdour (25°30N) and Cape Blanc (21°N).
Carbonate system parameters show significant seasonal and latitudinal variations (Figure 4). pHT-in situ, AT, ΩAr, and ΩCa (Figures 4E, E’, F, F’, G, G’, H, H) increase from the coast to offshore areas, while DIC and pCO2 (Figures 4I, I’, J, J’) decrease. The minimum values of pHT-in situ, AT, ΩAr, and ΩCa, as well as the maximum values of DIC and pCO2, were observed in the coastal regions of Cape Ghir (30°30N), Cape Draa (28°30N), Cape Boujdour (25°30N), Dakhla (23°30N), and Cape Blanc(21°N). These areas are also characterized by cold, less saline waters, deficient in DO, and rich in Chl a (Figures 4A, A’, B, B’, C, C’, D, D’). In autumn, the Cape Draa (28°30N) and Cape Blanc (21°N) regions recorded the lowest values of pHT-in situ, ΩAr, and ΩCa, reaching 7.85, 1.5, and 2.5, respectively (Figures 4E, E’, G, G’, H, H’), along with the highest values of DIC and pCO2, reaching 2250 µmol/kg and 1000 µatm, respectively (Figures 4I, I’, J, J’). Moreover, the surface distributions revealed a distinct filament at Cape Ghir (30°30N), particularly pronounced in autumn, with low values of temperature (16°C), salinity (36.3), and pHT-in situ(7.9), an AT of 2370 µmol/kg, an ΩAr of 2.5, and an ΩCa of 3.5. The pCO2 and DIC values were relatively high, reaching 500 µatm and 2175 µmol/kg, respectively.
4.4 Correlations between surface parameters
The scree plot indicates that the first principal component (Dim1) captures the majority of the variance of the environmental parameters. The second principal component (Dim2) explains a moderate portion of the variance. In contrast, the third principal component (Dim3) captures a minimal fraction, as illustrated in (Figure 5A). The PCA revealed the correlations and the seasonal variations in the surface distribution of environmental parameters in the study area. The correlation circle (Figure 5B) represents the projection of environmental variables onto the first two principal dimensions of the PCA. The first dimension explains 59.8% of the total variance of the data, while the second dimension explains 20.9%.
Figure 5
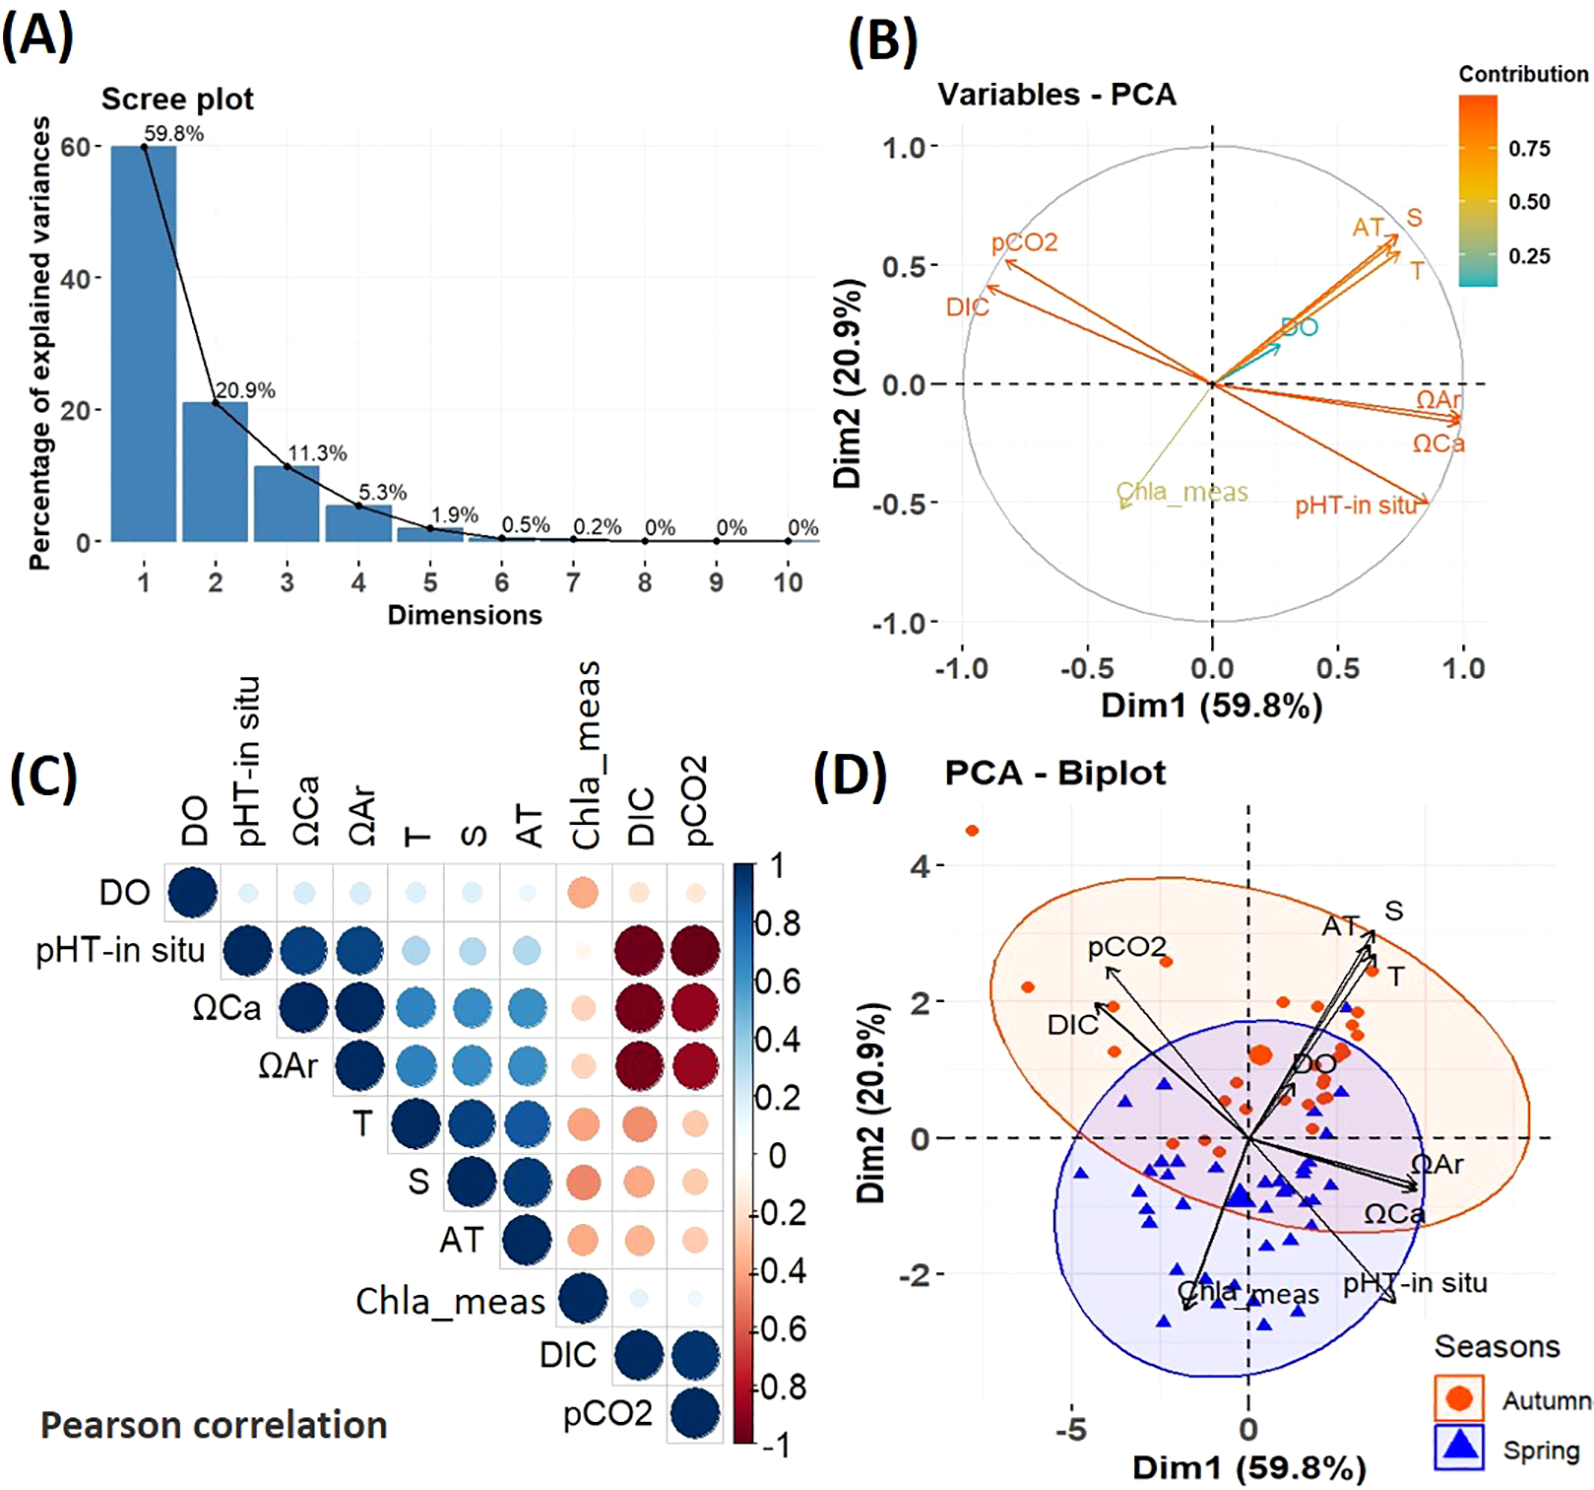
Principal Component Analysis (PCA) of environmental parameters collected at the surface (5m). PCA scree plot (A), PCA Variables (B), Pearson Correlation (C). Positive and negative correlations are displayed in blue and red, respectively, while the size and intensity of the circles in the matrix are proportional to the correlation coefficient between the variables. PCA Biplot of the Principal Component Analysis (PCA) by season (D). The groups of stations corresponding to different seasons are highlighted by ellipses of the same color (spring blue and autumn in red).
The PCA’s first principal component (Dim1) was strongly positively correlated with ΩAr, ΩCa, and pHT-in situ, and negatively correlated with the DIC and pCO2. This indicates that the parameters included in Dim1 were primarily related to the carbonate system characteristics. The second principal component (Dim2) showed is positively correlated with salinity, temperature, and AT but negatively correlated with Chl a. According to the Pearson correlation (Figure 5C), excluding the carbonate system parameters, temperature, salinity, and DO are negative correlation with Chl a. The PCA indicates that the seasonal variability in the distribution of surface environmental parameters is very pronounced. The autumn season is characterized by warm, more saline, with higher AT, high DIC and pCO2 at certain stations and low biological activity (Figure 5D). In contrast, the spring season is distinguished by waters more saturated with aragonite and calcite (ΩAr, ΩCa), high pH, and strong biological activity, reflected by elevated Chl a concentrations. Furthermore, spring waters are cooler, less saline, and with lower AT (Figure 5D).
5 Discussion
The distribution of environmental parameters between Cape Cantin (33°N) and Cape Blanc (21°N), in spring and autumn, highlights seasonal variability in upwelling activity, confirming previous studies (Makaoui, 2008; Hilmi et al., 2020; El Aouni et al., 2024).
In spring, coastal surface temperatures drop to an average of ~16°C compared to autumn ~18°C (a difference of 2°C along) with lower salinity (35.8 compared to 36.3 in autumn). This seasonal cooling, combined with a relative dilution of coastal surface waters, is a direct indicator of increased upwelling activity during spring.
This seasonal dynamic of upwelling activity is closely linked to the strengthening of the trade winds. Two distinct zones were identified based on the variability of wind intensity:
-
The first, located between latitudes 32°30N and 28°N, is characterized by strong winds in spring, exceeding 8 m/s, promoting significant upwelling activity.
-
The second, located between 27°30N and 21°N, experiences strong winds in both seasons, though they are slightly less intense in autumn.
These observations confirm the findings of Stramma et al., 2005 and Bessa et al., 2021, who also highlighted the spatial and seasonal variability of upwelling activity along the NW African coast, closely linked to the spatial and seasonal trade winds. Previous studies (Makaoui et al., 2005; Berrada et al., 2017) also showed that upwelling intensifies in spring, while autumn represents a relaxation phase.
Upwelling intensity plays a key role in shaping the properties of the coastal carbonate system, although its effects vary spatially from one region to another. In spring, active upwelling across the entire study area leads to the emergence of cold, less saline and chlorophyll a-rich waters, except in the southern zone (Cape Blanc (21°N). These conditions are accompanied by a typical biogeochemical signature of acidification: a coastal pH about 0.25 units lower than offshore, an increase in DIC of approximately 50 µmol/kg, and a decrease in aragonite saturation (ΩAr ~2.1), indicating an enrichment in deep-origin CO2.
In autumn, although upwelling is generally less intense, localized upwelling persists at strategic points such as Cape Draa (28°30N), between Cape Boujdour and Dakhla (25°N-23°30N), and at Cape Blanc (21°N). These “upwelling centers” are favored by specific geographical configurations (presence and variety of capes, width of the continental shelf) and favorable atmospheric conditions (Moujane et al., 2011; Demarcq and Somoue, 2015; Nait-Hammou et al., 2025). These results are consistent with those of Makaoui et al., 2005 and Berrada et al., 2017, confirming both the seasonality and spatial distribution of upwelling intensity along the Canary Current upwelling system.
Regional Analysis
• Cape Draa (28°30N):
In spring, pH is higher (~8.0) and DIC is lower (~2150 µmol/kg) than in autumn (pH ~7.8; DIC ~2250 µmol/kg), reflecting an increase of 0.2 pH units and a decrease of ~100 µmol/kg in DIC. Aragonite saturation is also higher (ΩAr ~2.5 compared to ~1.8 in autumn). These differences suggest a seasonal shift toward more acidic conditions in autumn, potentially driven by increased remineralization of organic matter. This area is mainly influenced by NACW, particularly in autumn, which contributes to higher levels of oxygenation.
• Cape Boujdour–Dakhla (25°30N–23°30N):
Mean pH values are similar between spring and autumn (8.00 to 8.05), with a slight increase in DIC in spring (~2160 µmol/kg) compared to autumn (~2150 µmol/kg). However, ΩAr is lower in spring (~2.5) than in autumn (~3.0), a decrease of ~0.5 units, which may indicate relatively more acidic conditions. In autumn, high chlorophyll activity is recorded, due to the drift of upwelled water from Cape Boujdour to the south of Dakhla via the Cape Boujdour filament, as confirmed by Makaoui et al. (2021). This drift is associated with intense PP, increasing ΩAr and reducing DIC and pCO2.
• Cape Blanc (21°N):
In spring, pH is slightly higher (~7.85) and DIC lower (~2225 µmol/kg) than in autumn (~7.8 and ~2250 µmol/kg, respectively). ΩAr is also more favorable (ΩAr ~2.0 vs. ~1.5 in autumn). The relatively more acidic conditions observed in autumn may be enhanced by the presence of oxygen-poor, nutrient-rich SACW waters, as well as by the influence of oxygen minimum zones (OMZs) identified in this region (Stramma et al., 2008). These conditions make this area particularly vulnerable to acidification year-round.
Overall, the Cape Draa and Cape Blanc areas show the lowest pH values (~7.8) and a high DIC (~2250 µmol/kg) in autumn. This confirms that acidification signals are modulated by both seasonal upwelling dynamics and regional hydrographic characteristics. Thus, although spring is marked by an increased input of CO2 of deep-sea origin, it is not necessarily the most acidified season. Local biogeochemical conditions and the origin of water masses (NACW/SACW) play a crucial role in shaping the spatial pattern of acidification.
Principal component analysis (PCA) revealed significant correlations between hydrological and biogeochemical parameters. Cold, less saline waters, characterized by low pH, AT, ΩAr, and ΩCa values, display elevated DIC and pCO2 concentrations, confirming the link between upwelling activity and coastal acidification processes.
Previous studies (Barton et al., 2012; Turley and Findlay, 2016) have shown that upwelling can amplify coastal acidification, with CO2-rich deep waters reaching the surface and inducing aragonite undersaturation (<1). However, in this study, ΩAr values remain above 1 in both seasons, indicating an absence of undersaturated conditions despite the intensity of upwelling.
Studies conducted in other upwelling systems, such as the California Upwelling System (Feely et al., 2008; Gruber et al., 2012), have shown that upwelling intensifies acidification conditions by bringing to the surface naturally more acidic, CO2-rich, and oxygen-depleted deep waters. Our results are consistent with this dynamic, particularly in areas influenced by SACW such as Cape Blanc where pH and ΩAr values are among the lowest observed. However, in contrast to these systems, the Canary Current upwelling system exhibits marked latitudinal heterogeneity and a complex interaction between different water masses (SACW/NACW), which modulates both the intensity and seasonality of acidification. These findings highlight the importance of adopting a regional approach to assess the impact of upwelling on the coastal carbonate system.
Furthermore, Burger et al., 2020; Di Lorenzo, 2015, and Doney et al., 2009b have confirmed that global warming intensifies upwelling and brings corrosive waters to the surface, impacting marine ecosystems and organisms that depend on calcium carbonate to form their shell and skeletal structures. High pCO2 levels (>1000 µatm) can also induce hypercapnia, and the increased frequency of upwelling events with high pCO2 could impact marine ecosystem (Arroyo et al., 2022).
This study highlights the complexity of the seasonal dynamics of coastal upwelling activity and its impact on the distribution of hydrological and biogeochemical parameters along the NW African coast in the Canary Current System. Continued observations along repeat sections and a thorough understanding of these interactions are essential to anticipate the future effects of OA, particularly in the context of global climate change. Potential changes in upwelling dynamics (including changes in wind forcing) could transform these regions, altering their role as CO2 sinks or sources, with important consequences for marine ecosystems and fishery resources.
6 Conclusion
This seasonal study highlighted the complex interactions between hydrological and biogeochemical parameters and upwelling activity in the NW African marine ecosystem. The findings confirm that upwelling is a major driver of local acidification, influencing the spatial and seasonal distribution of pH and aragonite saturation (ΩAr). Upwelling is more pronounced in spring, bringing cold, DIC- and pCO2-rich deep waters to the surface, leading to a notable decrease in pH and CaCO3 saturation. This biogeochemical signature reflects an influx of CO2-enriched waters, underscoring the role of upwelling in shaping carbonate chemistry dynamics. Regions experiencing strong upwelling, such as Cape Draa (28°30N), the area between Cape Boujdour and Dakhla (25°30N-23°30N), and Cape Blanc (21°N) are particularly affected. In autumn, the Cape Draa and Cape Blanc regions remain especially vulnerable due to organic matter remineralization and the combined effects of upwelling and the presence of low-oxygen, nutrient-rich SACW, respectively. These processes contribute to increased dissolved CO2 concentrations, further reducing pH and disrupting the regional biogeochemical balance. These findings highlight the need for continuous monitoring and further research to assess the long-term impacts of upwelling-driven acidification. Understanding these processes is crucial for developing effective conservation and management strategies to mitigate the effects of climate change on marine biodiversity and ecosystem resilience.
Statements
Data availability statement
Data can be made available upon request from the EAF Nansen Programme.
Author contributions
CJ: Conceptualization, Data curation, Formal analysis, Investigation, Methodology, Software, Validation, Visualization, Writing – original draft, Writing – review & editing. AM: Conceptualization, Methodology, Supervision, Validation, Writing – review & editing. MC: Conceptualization, Data curation, Funding acquisition, Methodology, Supervision, Validation, Writing – review & editing. DC: Data curation, Investigation, Resources, Writing – review & editing. AC: Data curation, Investigation, Writing – review & editing. HN: Investigation, Writing – review & editing. MI: Investigation, Writing – review & editing. FZ: Conceptualization, Writing – review & editing. OE: Funding acquisition, Resources, Writing – review & editing. SY: Conceptualization, Methodology, Supervision, Validation, Writing – review & editing. MB: Conceptualization, Methodology, Supervision, Validation, Writing – review & editing.
Funding
The author(s) declare that financial support was received for the research and/or publication of this article. Open access funding was provided by the EAF-Nansen Programme.
Acknowledgments
This paper uses data generated through the activities under the EAF-Nansen Program as part of the collaboration between the Food and Agriculture Organization of the United Nations (FAO) on behalf of the EAF-Nansen Program and Morocco. The EAF-Nansen Program is a partnership between the FAO, the Norwegian Agency for Development Cooperation (Norad), and the Institute of Marine Research (IMR) in Norway for sustainable management of the fisheries in partner countries and regions. The authors thank the captains and crews of the R/V Dr Fridtjof Nansen who assisted in the surveys as well as all the participants.
Conflict of interest
The authors declare that the research was conducted in the absence of any commercial or financial relationships that could be construed as a potential conflict of interest.
Generative AI statement
The author(s) declare that no Generative AI was used in the creation of this manuscript.
Publisher’s note
All claims expressed in this article are solely those of the authors and do not necessarily represent those of their affiliated organizations, or those of the publisher, the editors and the reviewers. Any product that may be evaluated in this article, or claim that may be made by its manufacturer, is not guaranteed or endorsed by the publisher.
Glossary
- OA
ocean acidification
- CO2
carbon dioxide
- CO2atm
atmospheric carbon dioxide
- HCO3
bicarbonate
- CO3²
ion concentration
- CaCO3
calcium carbonate
- NW
Northwest
- CCS
Canary Current System
- CC
Canary Current
- R/V DFN
research vessel Dr. Fridtjof Nansen
- CTD
Conductivity-Temperature and Depth
- SACW
South Atlantic Central Water
- ENACW
Eastern North Atlantic Central Water
- MIW
Mediterranean Intermediate Water
- EASIW
Eastern South Atlantic Intermediate Water
- OMZs
oxygen minimum zone
- T
temperature
- S
salinity
- DO
dissolved oxygen
- SST
sea surface temperature
- SSS
sea surface salinity
- TSG
thermosalinograph
- pHT25
, pH total scale at 25°C
- pHT-in situ
in situ pH
- AT
total alkalinity
- pCO2
partial pressure of CO2
- DIC
total dissolved inorganic carbon
- ΩAr
aragonite saturation state
- ΩCa
calcite saturation state
- Chl a
Chlorophyll a
- Chla_meas
measured Chlorophyll a
- Chla_insitu
in-situ Chlorophyll a values
- Chla_fluo
in-situ Chlorophyll a fluorescence
- PP
primary production
- CRM
Certified Reference Materials
- m-CP
m-cresol purple
- RMSE
root mean square error
- PCA
principal component analysis
- HSO4
hydrogen sulfate
- ODV
Ocean Data View
- ESA
European Space Agency
- CMEMS
Copernicus Marine Environment Monitoring Service
- MERIS
Medium Resolution Imaging Spectrometer
- MODIS
Moderate-resolution Imaging Spectroradiometer
- VIIRS
Visible Infrared Imaging Radiometer Suite
- INRH
National Institute of Fisheries Research
- FAO
Food and Agriculture Organization of the United Nations
- Norad
Norwegian Agency for Development Cooperation
- IMR
Institute of Marine Research
References
1
Arroyo M. C. Fassbender A. J. Carter B. R. Edwards C. A. Fiechter J. Norgaard A. et al . (2022). Dissimilar sensitivities of ocean acidification metrics to anthropogenic carbon accumulation in the central north pacific ocean and california current large marine ecosystem. Geophys. Res. Lett.49, e2022GL097835. doi: 10.1029/2022GL097835
2
Bakun A. (1990). Global climate change and intensification of coastal ocean upwelling. Science.247, 198–201. doi: 10.1126/science.247.4939.198
3
Barton A. Hales B. Waldbusser G. G. Langdon C. Feely R. A. (2012). ). The Pacific oyster, Crassostrea gigas, shows negative correlation to naturally elevated carbon dioxide levels: Implications for near-term ocean acidification effects. Limnol. Oceanogr.57, 698–710. doi: 10.4319/lo.2012.57.3.0698
4
Benazzouz A. Mordane S. Orbi A. Chagdali M. Hilmi K. Atillah A. et al . (2014). An improved coastal upwelling index from sea surface temperature using satellite-based approach – The case of the Canary Current upwelling system. Cont. Shelf. Res.81, 38–54. doi: 10.1016/j.csr.2014.03.012
5
Berrada A. Benazzouz A. Demarcq H. Lamrini A. Berrahou A. Hilmi K. (2017). Caractérisation spatio-temporelle de la production primaire dans la côte Nord-Ouest Africaine par imagerie satellitaire MODISA. Rev. Mar. Sci. Agron. Vét.5, 269–286.
6
Berraho A. (2007). Relations spatialisées entre milieu et ichtyoplancton des petits pélagiques de la côte Atlantique Marocaine (Zones centrale et sud) (Rabat, Morocco: Université Mohammed V - Agdal, Faculté des Sciences).
7
Bessa I. Makaoui A. Hilmi K. Idrissi M. Agouzouk A. Ettahiri O. et al . (2021). Marine circulation along the moroccan atlantic coast. Front. Sci. Eng.11, 29–42. doi: 10.34874/IMIST.PRSM/fsejournal-v11i1.28864
8
Bindoff N. L. Cheung W. W. L. Khairo J. G. Arístegui J. Guinder V. A. Hallberg R. et al . (2019). Changing ocean, marine ecosystems, and dependent communities (Cambridge, UK and New York, NY, USA: Cambridge University Press). doi: 10.1017/9781009157964.007
9
Buhl-Mortensen L. Houssa R. M’bengue B. Nyadjro E. S. Cervantes D. Idrissi M. et al . (2024). Lophelia reefs off North and West Africa–Comparing environment and health. Mar. Biol.171, 29. doi: 10.1007/s00227-023-04344-8
10
Burger F. A. Burger F. A. John J. G. Frölicher T. L. Frölicher T. L. (2020). Increase in ocean acidity variability and extremes under increasing atmospheric CO 2. Biogeosciences.17, 4633–4662. doi: 10.5194/bg-17-4633-2020
11
Caldeira K. Wickett M. E. (2003). Anthropogenic carbon and ocean pH. Nature.425, 365–365. doi: 10.1038/425365a
12
Caldeira K. Wickett M. E. (2005). Ocean model predictions of chemistry changes from carbon dioxide emissions to the atmosphere and ocean. J. Geophys. Res.110, C09S04. doi: 10.1029/2004JC002671
13
Chen H. Haumann F. A. Talley L. D. Johnson K. S. Sarmiento J. L. (2022). The deep ocean’s carbon exhaust. Global. Biogeochem. Cy.36, e2021GB007156. doi: 10.1029/2021GB007156
14
Chierici M. Fransson A. Anderson L. G. (1999). Influence of m-cresol purple indicator additions on the pH of seawater samples: correction factors evaluated from a chemical speciation model. Mar. Chem.65, 281–290. doi: 10.1016/S0304-4203(99)00020-1
15
Clayton T. Byrne R. (1993). Spectrophotometric Seawater pH Measurements: Total Hydrogen Ion Concentration Scale Calibration of m-cresol Purple and At-sea Results. Deep-Sea Res. I: Oceanogr. Res. Pap.40, 2115–2129. doi: 10.1016/0967-0637(93)90048-8
16
Collins S. Rost B. Rynearson T. A. (2014). Evolutionary potential of marine phytoplankton under ocean acidification. Evol. Appl.7, 140–155. doi: 10.1111/eva.12120
17
Cropper T. E. Hanna E. Bigg G. R. (2014). Spatial and temporal seasonal trends in coastal upwelling off Northwest Africa–2012. Deep Sea Res. Part I: Oceanographic Res. Papers86, 94–111. doi: 10.1016/j.dsr.2014.01.007
18
Demarcq H. Somoue L. (2015). “Phytoplankton and primary productivity off Northwest Africa - UNESCO Bibliothèque Numérique,” in Oceanographic and biological features in the Canary Current Large Marine Ecosystem (IOC-UNESCO, Paris), 161–174. Available online at: http://hdl.handle.net/1834/9186.
19
Dickson A. G. (1990). Standard potential of the (AgCl(s)11/2H2 (g) 5Ag(s)1HCl(aq)) cell and the dissociation constant of bisulfate ion in synthetic sea water from 273.15 to 318.15 K. J. Chem. Thermodyn.22, 113–127. doi: 10.1016/0021-9614(90)90074-Z
20
Dickson A. G. Sabine C. L. Christian J. R. (2007). Guide to best practices for ocean CO2 measurements (Sidney, British Columbia, Canada: PICES Special Publication).
21
Di Lorenzo E. (2015). Climate science: The future of coastal ocean upwelling. Nature.518, 310–311. doi: 10.1038/518310a
22
Doney S. C. Busch D. S. Cooley S. R. Kroeker K. J. (2020). The impacts of ocean acidification on marine ecosystems and reliant human communities. Annu. Rev. Environ. Resour.45, 83–112. doi: 10.1146/annurev-environ-012320-083019
23
Doney S. C. Fabry V. J. Feely R. A. Kleypas J. A. (2009a). Ocean acidification: the other CO 2 problem. Annu. Rev. Mar. Sci.1, 169–192. doi: 10.1146/annurev.marine.010908.163834
24
Doney S. C. Fabry V. J. Feely R. A. Kleypas J. A. (2009b). Ocean acidification: the other CO2 problem. Annu. Rev. Mar. Sci.1, 169–192. doi: 10.1146/annurev.marine.010908.163834
25
Dore J. E. Lukas R. Sadler D. W. Church M. J. Karl D. M. (2009). Physical and biogeochemical modulation of ocean acidification in the central North Pacific. Proc. Natl. Acad. Sci. U. S. A.106, 12235–12240. doi: 10.1073/pnas.0906044106
26
El Aouni A. Bessa I. Hilmi K. Moustahfid H. Gangopadhyay A. (2024). Enhanced coastal upwelling indices for Moroccan Atlantic Coast, their force–response variability and sensitivity to extreme events between 1993 and 2021. Reg. Stud. Mar. Sci.77, 103611. doi: 10.1016/j.rsma.2024.103611
27
Emery W. J. (2003). “OCEAN CIRCULATION | Water types and water masses,” in Encyclopedia of atmospheric sciences (London, UK: Elsevier), 1556–1567. doi: 10.1016/B0-12-227090-8/00279-7
28
Équipe RStudio (2020). RStudio : Développement intégré pour R (Boston, MA, USA: RStudio). Available online at: http://www.rstudio.com/ (Accessed July 2, 2024).
29
Fabry V. J. Seibel B. A. Feely R. A. Orr J. C. (2008). Impacts of ocean acidification on marine fauna and ecosystem processes. ICES J. Mar. Sci.65, 414–432. doi: 10.1093/icesjms/fsn048
30
Feely R. A. Sabine C. L. Hernandez-Ayon J. M. Ianson D. Hales B. (2008). Evidence for upwelling of corrosive “Acidified” Water onto the continental shelf. Science320, 1490–1492. doi: 10.1126/science.1155676
31
Feely R. A. Sabine C. L. Lee K. Berelson W. Kleypas J. Fabry V. J. et al . (2004). Impact of anthropogenic CO2 on the caCO3 system in the oceans. Science.305, 362–366. doi: 10.1126/science.1097329
32
Flecha S. Pérez F. F. Murata A. Makaoui A. Huertas I. E. (2019). Decadal acidification in Atlantic and Mediterranean water masses exchanging at the Strait of Gibraltar. Sci. Rep.9, 15533. doi: 10.1038/s41598-019-52084-x
33
Forster P. M. Smith C. Walsh T. Lamb W. F. Lamboll R. Hall B. et al . (2024). Indicators of Global Climate Change 2023: annual update of key indicators of the state of the climate system and human influence. Earth Syst. Sci. Data.16, 2625–2658. doi: 10.5194/essd-16-2625-2024
34
Friedlingstein P. O’Sullivan M. Jones M. W. Andrew R. M. Gregor L. Hauck J. et al . (2022). Global carbon budget 2022. Earth Syst. Sci. Data.14, 4811–4900. doi: 10.5194/essd-14-4811-2022
35
Gattuso J.-P. Magnan A. Billé R. Cheung W. W. L. Howes E. L. Joos F. et al . (2015). Contrasting futures for ocean and society from different anthropogenic CO2 emissions scenarios. Science.349, aac4722. doi: 10.1126/science.aac4722
36
Goyet C. Hassoun A. Gemayel E. Touratier F. Abboud-Abi Saab M. Guglielmi V. (2016). Thermodynamic forecasts of the mediterranean sea acidification. Medit. Mar. Sci.17, 508. doi: 10.12681/mms.1487
37
Gruber N. Hauri C. Lachkar Z. Loher D. Frölicher T. L. Plattner G.-K. (2012). Rapid progression of ocean acidification in the california current system. Science.337, 220–223. doi: 10.1126/science.1216773
38
Hilmi K. Bessa I. Aouni A. E. Makaoui A. Ettahiri O. (2020). Un Demi Siècle D’évaluation De L’activité De L’upwelling de la Côte Atlantique Marocaine. Eur. Sci. J.16, 89–100. doi: 10.19044/esj.2020.v16n21p89
39
Huertas I. E. Ríos A. F. García-Lafuente J. Makaoui A. Rodríguez-Gálvez S. Sánchez-Román A. et al . (2009). Anthropogenic and natural CO2 exchange through the Strait of Gibraltar. Biogeosci. Discuss6, 647–662. doi: 10.5194/bg-6-647-2009
40
IPCC (2013). “Climate change 2013: the physical science basis,” in Contribution of working group I to the fifth assessment report of the intergovernmental panel on climate change. Eds. StockerT. F.QinD.PlattnerG.-K.TignorM.AllenS. K.BoschungJ.NauelsA.XiaY.BexV.MidgleyP. M. (Cambridge University Press, Cambridge, United Kingdom and New York, NY, USA). Available online at: https://www.ipcc.ch/report/ar5/wg1/ (Accessed June 5, 2024).
41
Jamal C. Makaoui A. Chierici M. Agouzouk A. Nait Hammou H. Chair A. et al . (2025). Spatial and Temporal Variability of Coastal Upwelling Activity in Northwest Africa (1994–2022). Scientific African29, e02831. doi: 10.1016/j.sciaf.2025.e02831
42
Kamili A. Doukkali M. R. Laabdi A. (2019). Economic performances indicators of coastal purse seiners: Case of Atlantic Center of Morocco. Rev. Mar. Sci. Agron. Vét.7, 18–25.
43
Keeling C. D. Whorf T. P. (2004). Monthly atmospheric CO2 records from sites in the SIO air sampling network. (United States). Available online at: https://www.osti.gov/servlets/purl/1389346.
44
Kroeker K. J. Kordas R. L. Crim R. Hendriks I. E. Ramajo L. Singh G. S. et al . (2013). Impacts of ocean acidification on marine organisms: quantifying sensitivities and interaction with warming. Glob. Change. Biol.19, 1884–1896. doi: 10.1111/gcb.12179
45
Kroeker K. J. Kordas R. L. Crim R. N. Singh G. G. (2010). Meta-analysis reveals negative yet variable effects of ocean acidification on marine organisms. Ecol. Lett.13, 1419–1434. doi: 10.1111/j.1461-0248.2010.01518.x
46
Lachkar Z. (2014). Effects of upwelling increase on ocean acidification in the California and Canary Current systems. Geophys. Res. Lett.41, 90–95. doi: 10.1002/2013GL058726
47
Le Quéré C. Takahashi T. Buitenhuis E. T. Rödenbeck C. Sutherland S. C. (2010). Impact of climate change and variability on the global oceanic sink of CO2. Global. Biogeochem. Cy.24, GB4007. doi: 10.1029/2009GB003599
48
Linder S. (1974). A proposal for the use of standardized methods for chlorophyll determinations in ecological and eco-physiological investigations. Physiol. Plant32, 154–156. doi: 10.1111/j.1399-3054.1974.tb03743.x
49
Loucaides S. Tyrrell T. Achterberg E. P. Torres R. Nightingale P. D. Kitidis V. et al . (2012). Biological and physical forcing of carbonate chemistry in an upwelling filament off northwest Africa: Results from a Lagrangian study. Glob. Biogeochem. Cy.26, GB004216. doi: 10.1029/2011GB004216
50
Lueker T. J. Dickson A. G. Keeling C. D. (2000). Ocean pCO2 calculated from dissolved inorganic carbon, alkalinity, and equations for K1 and K2: validation based on laboratory measurements of CO2 in gas and seawater at equilibrium. Mar. Chem.70, 105–119. doi: 10.1016/S0304-4203(00)00022-0
51
Makaoui A. (2008). Étude de l’upwelling côtier de la côte atlantique marocaine et sa contribution à la sédimentologie du plateau continental (Casablanca, Maroc: Universite Hassan II de Casablanca, Faculté des Sciences Ben M’sik).
52
Makaoui A. Bessa I. Agouzouk A. Idrissi M. Belabchir Y. Hilmi K. et al . (2021). The variability of the Cape Boujdor upwelling and its relationship with the Cape Blanc frontal zone (Morocco). Front. Sci. Eng.11, 19–27. doi: 10.34874/IMIST.PRSM/FSEJOURNAL-V11I1.28809
53
Makaoui A. Orbi A. Hilmi K. Zizah S. Larissi J. Talbi M. (2005). L’upwelling de la côte atlantique du Maroc entre 1994 et 1998. C. R. Geosci.337, 1518–1524. doi: 10.1016/j.crte.2005.08.013
54
Millero F. J. DiTrolio B. R. (2010). Use of thermodynamics in examining the effects of ocean acidification. Elements.6, 299–303. doi: 10.2113/gselements.6.5.299
55
Millero F. J. Woosley R. DiTrolio B. Waters J. (2009). Effect of ocean acidification on the speciation of metals in seawater. Oceanography.22, 72–85. doi: 10.5670/oceanog.2009.98
56
Mittelstaedt E. (1991). The ocean boundary along the northwest African coast: Circulation and oceanographic properties at the sea surface. Prog. Oceanog26, 307–355. doi: 10.1016/0079-6611(91)90011-A
57
Moujane A. Chagdali M. Blanke B. Mordane S. (2011). “Impact des vents sur l’upwelling au sud du Maroc ; apport du modèle ROMS forcé par les données ALADIN et QuikSCAT,” in Bulletin de l’Institut Scientifique, Rabat, section Sciences de la Terre, (Rabat, Morocco: Bulletin de l’Institut Scientifique), 53–64.
58
Nait-Hammou H. Khalidi K. E. Khalfaoui O. Makaoui A. Chierici M. Jamal C. et al . (2025). Sediment provenance and distribution on the northwest african continental shelf. J. Mar. Sci. Eng.13. doi: 10.3390/jmse13030537
59
Orr J. C. Fabry V. J. Aumont O. Bopp L. Doney S. C. Feely R. A. et al . (2005). Anthropogenic ocean acidification over the twenty-first century and its impact on calcifying organisms. Nature.437, 681–686. doi: 10.1038/nature04095
60
Pauly D. Christensen V. (1995). Primary production required to sustain global fisheries. Nature.374, 255–257. doi: 10.1038/374255a0
61
Pelegrí J. L. Peña-Izquierdo J. (2015). “Eastern boundary currents off North-West Africa,” in Oceanographic and biological features in the Canary Current Large Marine Ecosystem. Eds. ValdésL.Déniz-GonzálezI. (IOC UNESCO, Paris), 81–92. Available online at: http://hdl.handle.net/1834/9179 (Accessed May 10, 2024).
62
Pierrot D. E. Lewis E. Wallace D. W. R. Wallace D. W. R. (2006). MS excel program developed for CO<sub<2</sub< System calculations. (Oak Ridge, Tennessee, USA: Carbon Dioxide Information Analysis Center (CDIAC), Oak Ridge National Laboratory, U.S. Department of Energy. doi: 10.3334/CDIAC/otg.CO2SYS_XLS_CDIAC105a
63
Roesler C. Uitz J. Claustre H. Boss E. Xing X. Organelli E. et al . (2017). Recommendations for obtaining unbiased chlorophyll estimates from in situ chlorophyll fluorometers: A global analysis of WET Labs ECO sensors. Limnol. Oceanogr.: Methods15, 572–585. doi: 10.1002/lom3.10185
64
Royal Society (2005). Ocean acidification due to increasing atmospheric carbon dioxide. London: The Royal Society. Available online at: https://royalsociety.org/news-resources/publications/2005/ocean-acidification/ (Accessed July 24, 2024).
65
Sabine C. L. Feely R. A. Gruber N. Key R. M. Lee K. Bullister J. L. et al . (2004). The oceanic sink for anthropogenic CO2. Science.305, 367–371. doi: 10.1126/science.1097403
66
Schlitzer R. (2024). Ocean data view. Available online at: https://odv.awi.de (Accessed March 25, 2024).
67
Siegenthaler U. Stocker T. F. Monnin E. Lüthi D. Schwander J. Stauffer B. et al . (2005). Sta ble carbon cycle climate relationship during the late pleistocene. Science.310, 1313–1317. doi: 10.1126/science.1120130
68
Somova L. A. Pechurkin N. S. Pisman T. I. (2003). Increase of atmospheric CO2: Response patterns of a simple terrestrial man-made ecosystem. Adv. Space. Res.31, 1731–1735. doi: 10.1016/S0273-1177(03)80019-4
69
Stramma L. Huttl S. Schafstall J. (2005). Water masses and currents in the upper tropical northeast Atlantic off northwest Africa. J. Geophys. Res.110. doi: 10.1029/2005JC002939
70
Strickland J. D. H. Parsons T. R. (1972). A practical handbook of seawater analysis. 2nd edition (Ottawa, Canada: Fisheries Research Board of Canada). doi: 10.25607/OBP-1791
71
Turley C. Findlay H. S. (2016). “Chapter 18 - ocean acidification,” in Climate change, 2nd ed.Ed. LetcherT. M. (Elsevier, Boston), 271–293. doi: 10.1016/B978-0-444-63524-2.00018-X
72
Uppström L. R. (1974). The boron/chlorinity ratio of deep-sea water from the Pacific Ocean. Deep-Sea Res. Oceanogr. Abstr.21, 161–162. doi: 10.1016/0011-7471(74)90074-6
73
WMO/GCOS (2018). ArcGIS storyMaps. Available online at: https://gcos.wmo.int/en/global-climate-indicators (Accessed July 24, 2024).
74
Woosley R. J. Millero F. J. Grosell M. (2012). The solubility of fish-produced high magnesium calcite in seawater. J. Geophys. Res.117, C04018. doi: 10.1029/2011JC007599
75
Zeebe R. E. Wolf-Gladrow D. (2001). CO2 in seawater: equilibrium, kinetics, isotopes (Amsterdam, The Netherlands: Gulf Professional Publishing).
Summary
Keywords
Canary Current System, Atlantic Ocean, carbonate system, ocean acidification, oxygen minimum zone, seasonal variability, primary production
Citation
Jamal C, Makaoui A, Chierici M, Cervantes D, Chair A, Hammou HN, Idrissi M, Bouthir FZ, Ettahiri O, Yousfi S and Bouamrani ML (2025) Seasonal upwelling drives surface water biogeochemistry with implication for ocean acidification along the Northwest African coast. Front. Mar. Sci. 12:1579941. doi: 10.3389/fmars.2025.1579941
Received
19 February 2025
Accepted
01 July 2025
Published
22 July 2025
Volume
12 - 2025
Edited by
Selvaraj Kandasamy, Central University of Tamil Nadu, India
Reviewed by
Wei-dong Zhai, Southern Marine Science and Engineering Guangdong Laboratory (Zhuhai), China
Moturi Krishna, Council of Scientific and Industrial Research (CSIR), India
Updates
Copyright
© 2025 Jamal, Makaoui, Chierici, Cervantes, Chair, Hammou, Idrissi, Bouthir, Ettahiri, Yousfi and Bouamrani.
This is an open-access article distributed under the terms of the Creative Commons Attribution License (CC BY). The use, distribution or reproduction in other forums is permitted, provided the original author(s) and the copyright owner(s) are credited and that the original publication in this journal is cited, in accordance with accepted academic practice. No use, distribution or reproduction is permitted which does not comply with these terms.
*Correspondence: Chaimaa Jamal, chaimaa.jamal-etu@etu.univh2c.ma; Melissa Chierici, melissa.chierici@hi.no
Disclaimer
All claims expressed in this article are solely those of the authors and do not necessarily represent those of their affiliated organizations, or those of the publisher, the editors and the reviewers. Any product that may be evaluated in this article or claim that may be made by its manufacturer is not guaranteed or endorsed by the publisher.