 Amy Frey
 Erin L. LaCasella
 Michael P. Jensen
 Peter H. Dutton
- 1Marine Mammal and Turtle Division, Southwest Fisheries Science Center, National Marine Fisheries Service, National Oceanic and Atmospheric Administration, La Jolla, CA, United States
- 2Department of Chemistry and Bioscience, Aalborg University, Aalborg, Denmark
- 3World Wide Fund for Nature, Healthy Land and Seascapes, Brisbane, QLD, Australia
Mitochondrial DNA (mtDNA) analysis is a key tool for defining population structure in marine turtles, due to their strong natal homing behavior, which leads to genetic differentiation among rookeries. However, the widespread occurrence of common haplotypes across large geographic areas, has limited the ability to resolve fine-scale population structure, particularly in the western Pacific. Understanding these population dynamics is crucial for effective conservation and management, as distinct nesting populations may face different threats. This study evaluates the use of whole mitochondrial genome sequencing to improve genetic resolution of population structure and enhance the accuracy of mixed stock analysis (MSA). We analyzed 197 nesting green turtles from six Pacific rookeries, representing two common mtDNA haplotypes (CmP20.1 and CmP22.1). Using mitochondrial capture enrichment and MSA simulations, we detected significant genetic differentiation between the rookeries in Guam and the Commonwealth of the Northern Mariana Islands (CNMI), which were previously considered a single genetic stock based on traditional control region sequencing. Our findings demonstrate that whole mitochondrial genome sequencing enhances stock resolution, improves the accuracy of MSA, and strengthens the ability to determine connectivity between nesting and foraging populations throughout the region. Refining genetics baselines using whole mitogenome sequencing will support more precise conservation strategies, allowing for targeted protection of genetically distinct populations, improved assessments of bycatch impacts, and better-informed management of critical foraging and nesting habitats.
Introduction
The conservation of highly migratory marine species is challenging due to their wide-ranging movements and complex life histories. Marine turtles spend most of their lives in oceanic habitats, migrating long distances across developmental habitats during various life stages. Hatchlings are initially dispersed by ocean currents (Bolten et al., 2003), spending several years (5-10) in a pelagic phase before they settle into neritic foraging habitats. These foraging grounds often support mixed aggregations of juvenile and adult turtles often originating from multiple nesting populations. Upon reaching sexual maturity, both males and females migrate to their natal rookery for mating and nesting (FitzSimmons et al., 1997; López-Castro et al., 2010). This strong natal homing behavior results in demographic isolation and genetic structuring among nesting populations (Jensen et al., 2013). Population boundaries are typically defined by female philopatry to their natal rookery (Bowen et al., 1992, 1993; Norman et al., 1994), a process commonly studied using genetic techniques. Accurately characterizing population structure is essential to ensure that demographically isolated rookeries are appropriately protected and managed, as it provides critical insights into genetic diversity, connectivity and the specific needs of each population, and informs targeted conservation efforts.
Green sea turtles (Chelonia mydas) are distributed globally across tropical and subtropical waters (Hirth, 1997) and are listed as threatened or endangered globally due to various anthropogenic threats, including incidental bycatch in fisheries, entanglement, illegal harvest and loss of habitat. Under the U.S. Endangered Species Act (ESA), 11 Distinct Population Segments (DPS) have been recognized to aid conservation efforts (Seminoff et al., 2015). The DPS designations are based on genetic and morphological evidence, as well as ecological, behavioral, and oceanographic factors.
Genetic tools have been invaluable for defining stock structure and understanding the connectivity between marine turtle rookeries and their foraging habitats (Bowen and Karl, 2007; Jensen et al., 2013). Due to their strong site fidelity, maternally inherited mitochondrial DNA (mtDNA), specifically the hypervariable control region (CR), has been the most informative genetic marker for assessing population structure and connectivity in marine turtles (Komoroske et al., 2017). Mixed stock analysis (MSA) is commonly used to estimate the stock composition of foraging populations, and determine connectivity between nesting and foraging sites (Jensen et al., 2013). The MSA method involves analyzing genetic markers, such as mtDNA, in samples from mixed foraging populations, and comparing those genetic profiles to known genetic baselines from potential source nesting populations. MSA can estimate the proportional contribution of different source nesting populations to the mixed foraging populations, which is helpful for evaluating population connectivity and identifying migratory patterns.
However, the accuracy of stock structure assessment, and subsequently of MSA studies, can be undermined by lack of detectable genetic variation and the widespread occurrence of shared mtDNA haplotypes. Three key factors influence MSA accuracy: (1) a comprehensive baseline of potential source populations, (2) significant detectable genetic structure, and (3) a sufficient sample size for both foraging and source populations. Limited resolution in the mtCR sequences introduces uncertainty, making precise MSA assignments difficult, even when demographic separation is evident based on haplotype frequencies (Okuyama and Bolker, 2005). For example, early mtDNA studies of marine turtles relied on a 400-500 bp fragment of the control region (Dethmers et al., 2006), but these often result in substantial marker overlap. More recent studies have expanded these sequences to ~800 bp, revealing additional variation that is geographically informative (Leroux et al., 2012; Dutton et al., 2014a, b; Shamblin et al., 2014).
Further improvements in MSA accuracy have been made by expanding the sampling of potential source populations and increasing the length of mtDNA fragments analyzed. Shamblin et al. (2017) reassessed the origin of a juvenile green turtle foraging population along the Texas coast by incorporating a previously unsampled rookery and identifying novel mitogenomic variation outside the CR. Additionally, MSA has been used extensively to determine stock composition of sea turtles incidentally caught in fisheries. For example, stock composition estimates of loggerhead turtles (Caretta caretta) captured by the U.S. pelagic longline fishery in the north Atlantic distant (NED) improved when longer mtCR sequences were analyzed (LaCasella et al., 2013). Additionally, mixed-marker approaches, combining nDNA (microsatellites) and mtDNA data have improved the power of stock assignments, particularly when haplotype diversity is low, such as in leatherback turtles (Dermochelys coriacea) caught in the North Atlantic pelagic longline fishery (Stewart et al., 2016), and green turtles caught in the Hawaii and American Samoa-based longline fisheries operating in the central Pacific (Horne et al., 2023).
While whole mitochondrial genome (mitogenome) sequencing has been applied to sea turtle phylogenetic studies (Duchene et al., 2012), it has yet to be applied extensively to stock structure studies. Previous research (Shamblin et al., 2012a, b, 2017; Frandsen et al., 2020) has demonstrated that sequencing beyond the mtCR can reveal additional informative single nucleotide polymorphisms (SNPs), significantly improving stock resolution. For example, Shamblin et al. (2012b) showed that expanded mitogenome sequencing reduced marker overlap between rookeries, thereby increasing the precision of stock assignments in Atlantic green turtles.
Several mtDNA studies have characterized the genetic structure of green turtle rookeries across the Pacific (Dethmers et al., 2006; Dutton et al., 2008; Frey et al., 2013; Dutton et al., 2014a, 2014b; Jensen et al., 2018). However, a study based on 384 base pairs (bp) of the mtCR found no genetic structuring among three rookeries within the central western Pacific, despite being separated by more than 1,000 km due to common and widespread haplotypes (Dethmers et al., 2006). The central western Pacific region supports relatively small numbers of nesting green turtle population spread across more than 50 nesting sites, many with limited or unknown nesting numbers. Conservation challenges in the region include harvest of eggs and nesting females, targeted capture in marine habitats, and fisheries bycatch from longline, pole-and-line, and purse seine fisheries (Seminoff et al., 2015).
Dutton et al. (2014b), identified seven genetically distinct Management Units (MUs) in the western Pacific DPS based on 770 bp of the mtCR haplotype frequency distributions. Their findings indicated shallow genetic structure among rookeries in Micronesia, with significant differentiation occurring only between sites separated by more than 500 km. However, four MUs within Micronesia were dominated by a common haplotype (CmP20.1), shared by 59% of the 750 individuals sampled (see Jensen et al., 2025).
The objective of this study was to examine the whole mitogenome sequences of common and widespread western Pacific CR haplotypes to identify informative variation beyond the mtCR, allowing for more precise assessment of fine-scale stock structure and MSA. We demonstrate that whole mitochondrial genome sequences improve the resolution of population structure in western Pacific green turtles. Furthermore, while mtCR remains a powerful tool for assigning individuals to their natal beach using MSA, incorporating whole mitogenome data may increase confidence in assignments, particularly when common and widespread haplotypes are present across multiple sites.
Materials and methods
Sample collection
The samples sequenced in this study had previously been analyzed for a 770 bp fragment of the mtCR by Dutton et al. (2014b). These samples were collected from green turtle nesting locations across six rookeries, representing five of the MUs in the Pacific islands: the Republic of Marshall Islands (RMI), Yap in the Federated States of Micronesia (FSM), Palau, Guam, the Commonwealth of the Northern Mariana Islands (CNMI), and American Samoa (Figure 1). Guam and CNMI are currently considered to belong to one MU, based on Dutton et al. (2014b).
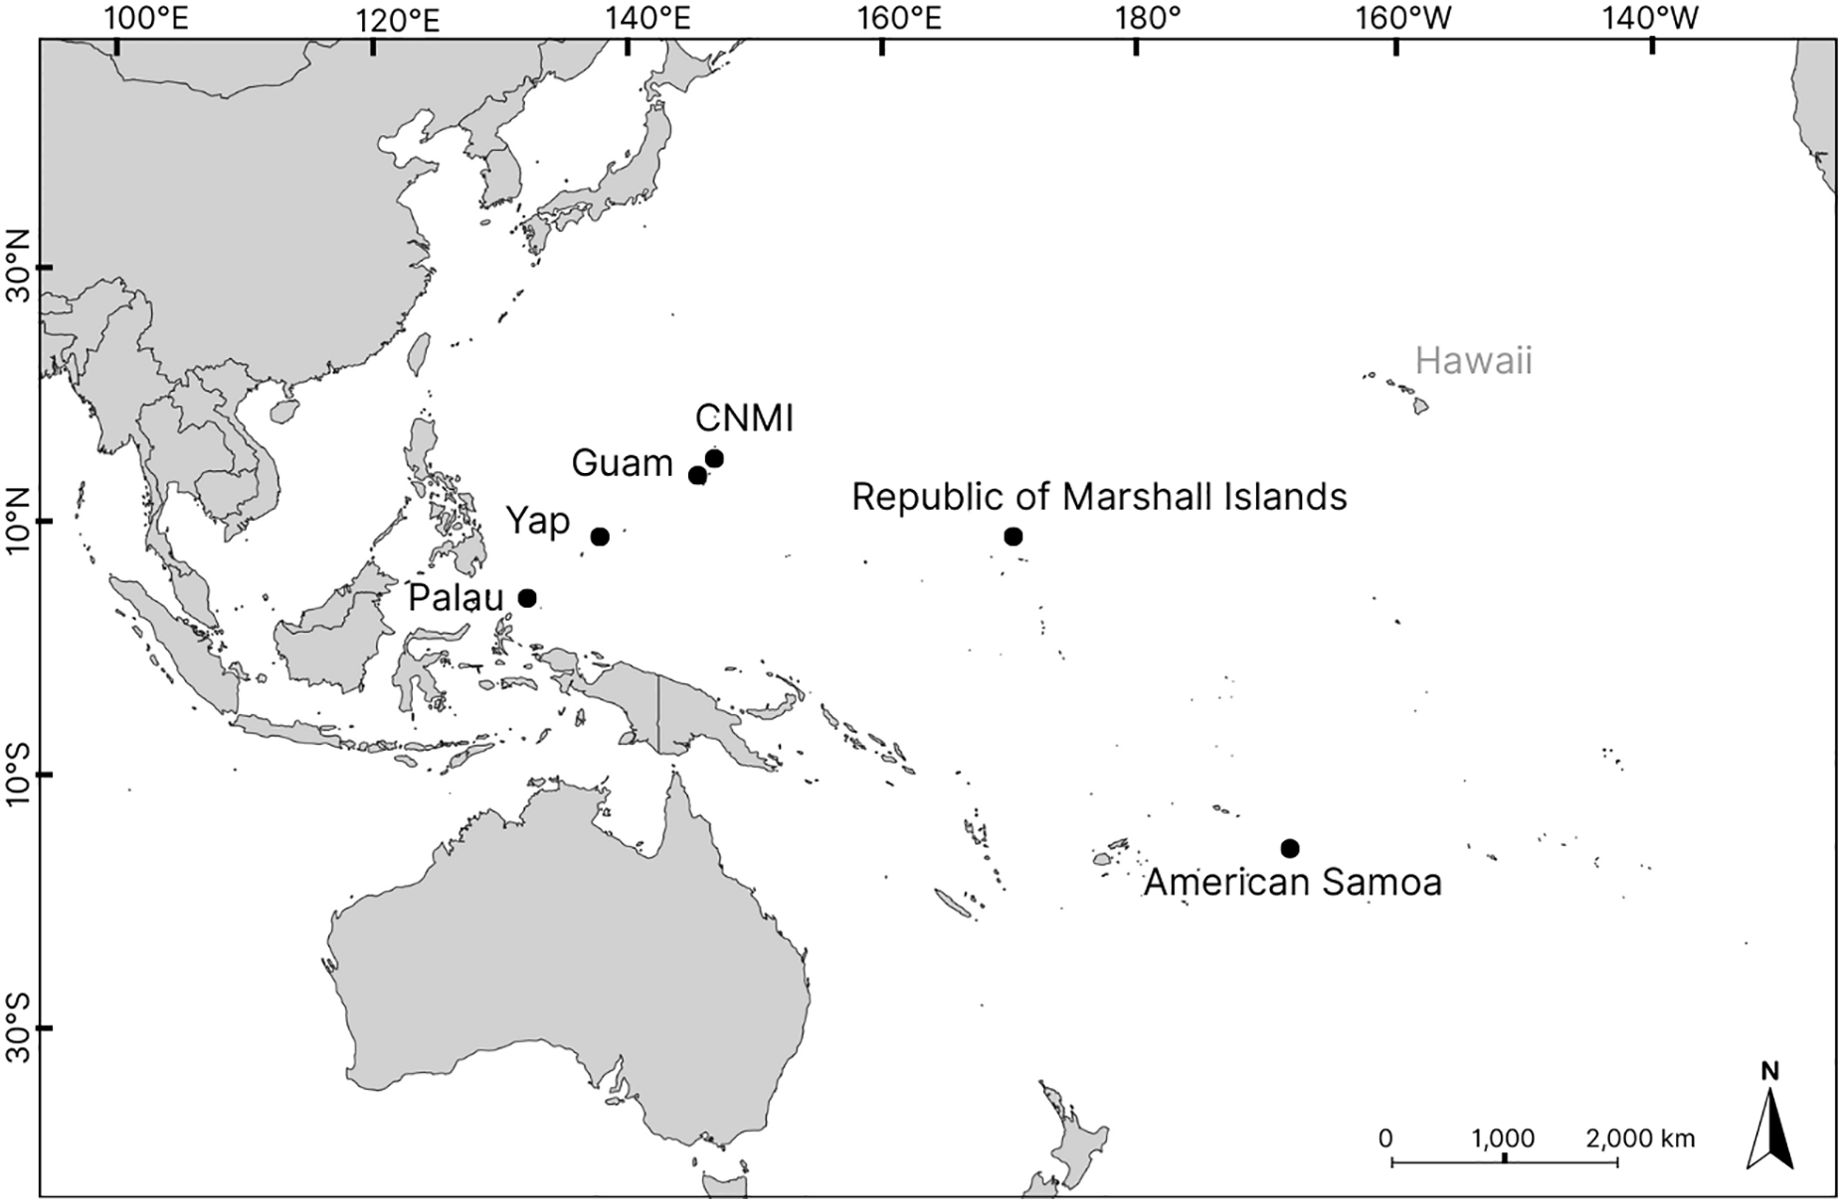
Figure 1. Map of the western Pacific region illustrating the locations of six rookeries in the Pacific islands: the Republic of Marshall Islands (RMI), Yap in the Federated States of Micronesia (FSM), Palau, Guam, the Commonwealth of the Northern Mariana Islands(CNMI) and American Samoa.
Samples consisted of skin biopsies from nesting turtles and tissue from dead hatchlings. All samples were preserved in saturated salt and frozen as part of the Marine Mammal and Sea Turtle Research (MMSTR) collection at NOAA’s Southwest Fisheries Science Center (La Jolla, California USA). For mitogenome analysis, we selected all individuals with a CmP20.1 haplotype from Palau (n = 28), Guam (n = 24), CNMI (n = 19). Additionally, we included randomly selected subset (~23%) of individuals from RMI (n = 30) and FSM (n = 64). All individuals with a CmP22.1 haplotype from American Samoa (n = 12) and RMI (n = 21) were also included. These two haplotypes, CmP20.1 and CmP22.1 represent the two most common and widespread haplotypes found in the central and south western Pacific region (Dutton et al., 2014b).
Laboratory preparation
To ensure accurate measurement of double-stranded DNA from various extraction methods, DNA concentrations were quantified using the Quant-iT™ PicoGreen® ds DNA assay Kit (Invitrogen) with a fluorospectrometer. The minimum target quantity of DNA was 200 ng. Samples with <200 ng DNA were re-extracted using a sodium chloride protein precipitation protocol (Miller et al., 1988). Genomic libraries were prepared and pooled for capture enrichment following the methods described in Hancock-Hanser et al. (2013). Capture enrichment was done using two SureSelect DNA capture arrays, each containing 244 K 60 bp probes on a 1-inch by 3-inch glass slide (Agilent Technologies Inc.). Capture array design was done using the Agilent eArray software (https://earray.chem.agilent.com/earray/; design data files available in the Dryad data repository, doi:10.5061/dryad.cv35b). The mtDNA genome used in the design was obtained from GenBank® (NCBI/NIH; accession number JX454985.1) and 40 bp from each end of the mitogenome were copied and added to the opposite end of the sequence to improve depth of the circular nature of the mitochondrial genome. On the array, the probes were spaced every 15 bp and 221 copies of the mitogenome were included. Pooled libraries were sequenced on an Illumina NextSeq500 (Illumina, Inc).
Data analysis
Mitogenome assemblies were performed using custom scripts (Dryad data repository doi:10.5061/dryad.cv35b) in the R computing environment (R Development Core Team, 2021). These scripts automated the application of publicly available analysis packages for quality filtering (FASTX toolkit; http://hannonlab.cshl.edu/fastx_toolkit/), assembly (BWA; Li and Durbin, 2009), multiple alignment (MAFFT; Katoh et al., 2005) and SNP detection (GATK; DePristo et al., 2011; Nielsen et al., 2012). The same reference sequence was used to assemble the mitogenome sequences (NCBI/NIH; accession number JX454985.1).
Using custom R scripts, additional quality control steps were incorporated to address “index hopping” which has been reported to occur both during library amplification and by Illumina sequencers (Kircher et al., 2012). The first nucleotides were called based on a frequency threshold of >80% of reads at each site. If the threshold was not met, common alleles, defined as an allele that is found in >50% of the pooled sample allele frequency, were called if the proportion of the reads at that site in the sample was greater than the proportion at the site across the entire pool of samples. A rare allele was called when two criteria were met, the proportion of reads at that locus in the sample (rp) was greater that the pooled proportion (pp) by a ratio of at least rp = (pp+ 0.25)/1.25, and the binomial probability of a specific base at each site was greater than 95%, given the sample-wide frequency of that base at that site. Additionally, unique variants were inspected in Geneious (V. 7.1.5, Biomatters, Auckland, New Zealand), by aligning sequences and visually comparing the BAM files.
Variable sites were identified and haplotype labels were assigned to the unique mitogenome sequences using the strataG package (Archer et al., 2017) carried out in the R computing environment (R Development Core Team, 2021). Additionally, in strataG, frequencies for each haplotype were calculated. For the RMI and FSM rookeries, where a subset of the individuals with a CmP20.1 haplotype were sequenced, haplotype frequencies were adjusted in order to preserve the original relative frequencies for each population. Adjustments were done by multiplying the number of individuals assigned a CmP20.1.x haplotype by the total number of individuals at that rookery that were assigned a CmP20.1 haplotype then dividing that by the number of individuals sequenced in this study from that rookery with a CmP20.1 haplotype. For example, FSM was reported to have 276 individuals with haplotype CmP20.1. We sequenced 64 and found 3 that assigned to CmP20.1.1. The adjusted frequency was 13.
To estimate population differentiation among rookeries, pairwise FST values were calculated for each of the five previously described MUs, except Guam/CNMI, which were analyzed as separate populations. Significance values were acquired from 10,000 permutations, and a minimum significance threshold of p<0.05 was applied. Exact tests of population differentiation were also performed with 100,000 permutations and 10,000 dememorization steps (Raymond and Rousset, 1995) using Arlequin V. 3.5.1.2 (Excoffier and Lischer, 2010).
To evaluate the degree to which a haplotype was informative for stock structure analysis, rare haplotypes (those occurring in < 5% of sequences), were excluded by ignoring their variable sites and grouping those haplotypes with the next most similar haplotype. We then reran the Arlequin analysis to verify the pairwise comparisons of FST and exact tests results remained significant. This process was repeated iteratively, using haplotype frequency data based on “collapsed” haplotypes, until the most informative variants were identified.
MSA simulations
To evaluate the utility of the new genetic marker, we conducted a mixed stock analysis (MSA) using three simulated population scenarios. Equal prior probabilities were assigned to each parameter. The haplotype frequencies for each population varied according to the rookery contribution. (1) equal contribution from all rookeries (20%), (2) unequal contributions with 20% from RMI, 5% from FSM, 5% from Palau, 60% from Guam, and 10% from CNMI, and (3) a skewed contribution scenario with 80% from RMI, 10% from FSM, 5% from Palau, 4% from Guam, and 1% from CNMI.
To evaluate the effect of sample size on MSA accuracy, we tested three different sample sizes (n = 20, 50, and 100) for each simulation. These reflect the range of sample sizes of green turtle foraging population studies in this region. Three baseline datasets were compared: (1) haplotype frequencies from a 770 bp control region (Dutton et al., 2014b), (2) mitogenome haplotypes, and (3) collapsed mitogenome haplotypes. The American Samoa rookery was excluded from these simulations because it did not share the CmP20.1 haplotype.
Bayesian MSA was conducted using the software BAYES (Pella and Masuda, 2001), which estimates the proportional contributions of each rookery to the simulated populations. Each MSA was run using five independent chains with different starting points, performing 10,000 Monte Carlo Markov Chain (MCMC) steps, including 5,000 steps for burn-in followed by 5,000 steps for sampling. To ensure the results were reliable, convergence was checked for by calculating the Gelman and Rubin shrink factor, aiming for a value below 1.2 (Pella and Masuda, 2001).
Results
DNA concentrations for the 198 samples ranged from 1.1 ng/μl to 500 ng/μl. Sixty-four individuals were re-extracted, 23 of which were still below 200 ng but were included anyway. A total of 197 mitogenomes were successfully sequenced with an average coverage of 139 reads per base. Subsequently, eight samples were removed as a result of unresolved base calls due to index hopping. Analysis of the sequenced mitogenomes identified 28 variable sites, defining 27 unique haplotypes (Supplementary Table 1). The previously described 770 bp control region haplotype CmP20.1 was further resolved into 23 distinct haplotypes, 18 of which occurred in fewer than 5% of individuals. These rare haplotypes were collapsed into six mitogenome haplotypes (Table 1). Similarly, the 770 bp haplotype CmP22.1 was split into four haplotypes, three of which were only observed once and were subsequently collapsed into one mitogenome haplotype.
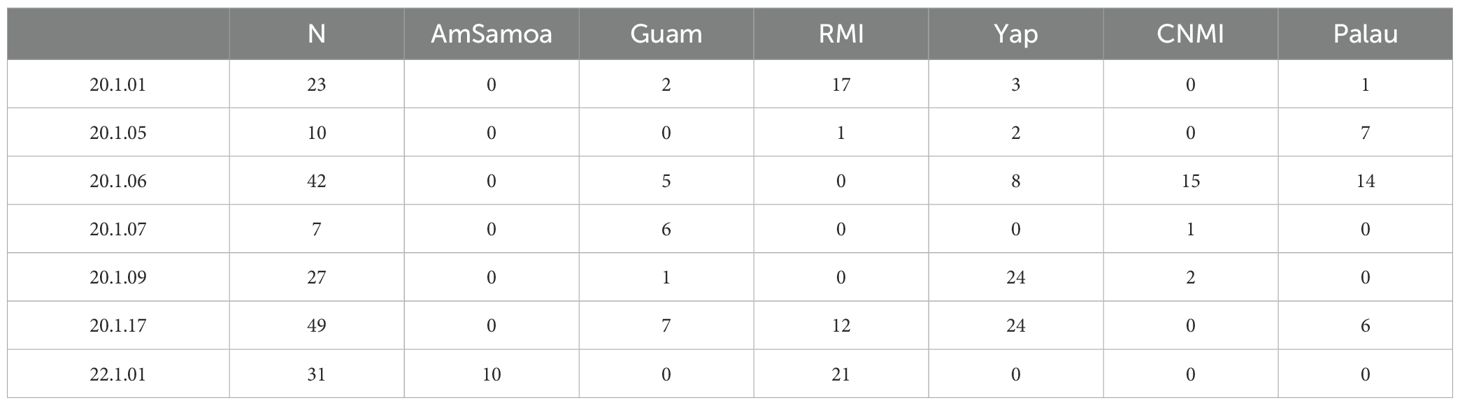
Table 1. Haplotype frequencies across six rookeries for collapsed mitogenome haplotypes.
Pairwise comparisons of the four previously described MU rookeries (American Samoa, Marshall Islands, Yap, Palau), and the additional Guam and CNMI rookeries, (previously undifferentiated and combined into one MU), all showed highly significant genetic differentiation (p<0.005) in both conventional FST and exact tests (Table 2).
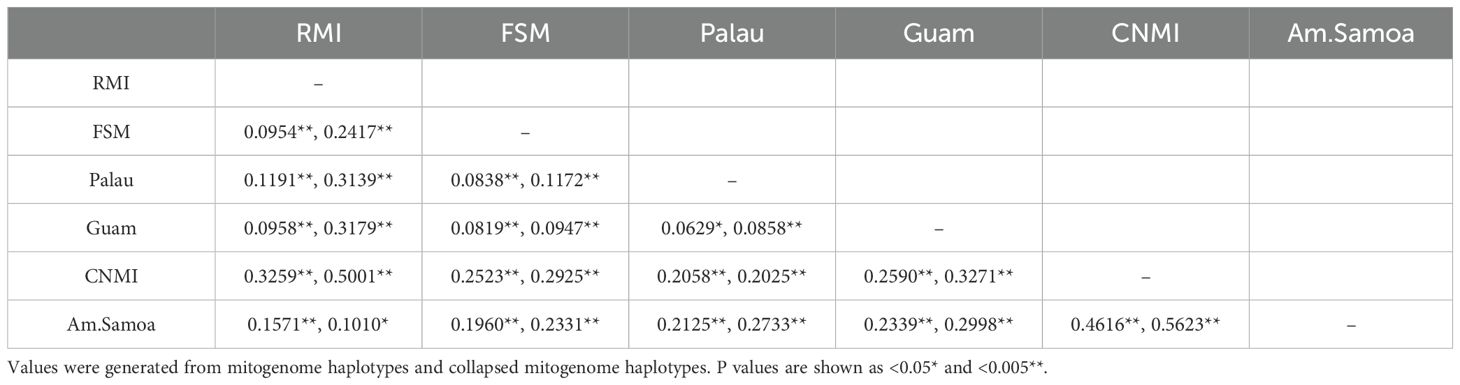
Table 2. Pairwise Fst values and results for the exact test between six rookeries in the western Pacific region.
For the MSA simulations, we evaluated the difference between the estimated mean assigned and the expected “true” contribution for each MU, referred to as %diff, as well as the range of the 95% credible interval (CI) across different sample sizes. The collapsed mitogenome baseline consistently produced the most accurate estimates, aligning most closely to the “true” contributions (Table 3). The average range of the 95% CI was 0.52 for the control region (CR) baseline, 0.28 for the collapsed mitogenome (CM) baseline and 0.27 for the mitochondrial genomes (MG). The %diff values were highest for the smallest sample size (n=20), whereas sample sizes of 50 and 100 performed similarly across all baseline datasets and rookery contributions.
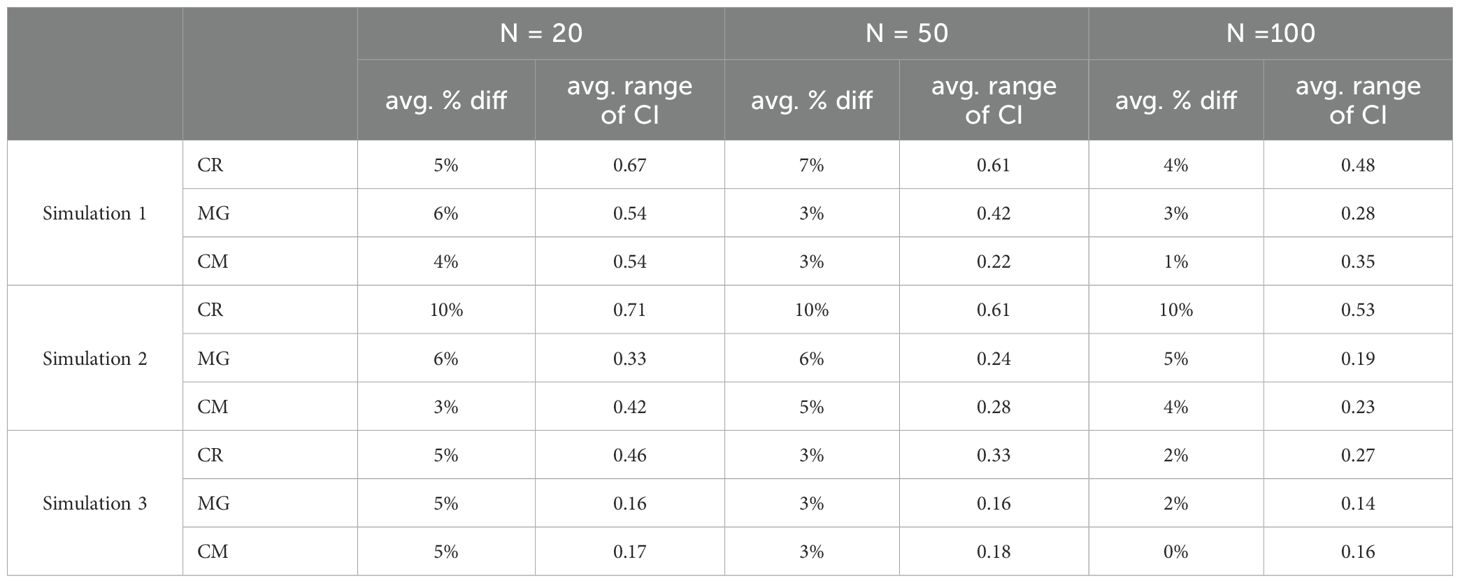
Table 3. Comparing baseline datasets, control region (CR), mitogenome haplotypes (MG), and collapsed mitogenome haplotypes (CM) of the average difference between the mean assigned and the “true” contribution from each population and the average range of the CI from each population for each simulation.
Simulation 2, which had a large difference in contributions between the CNMI and Guam rookeries, had the highest %diff for baselines and sample sizes, 10% for CR, 5.6% for MG and 4% for CM (Figure 2, and supplementary material). Simulation 3, which represents a real foraging population (Jensen et al., 2025), yielded similar %diff for both the control region and the mitogenome baselines. However, the collapsed mitogenome baseline provided the most accurate estimates to the true population contributions.
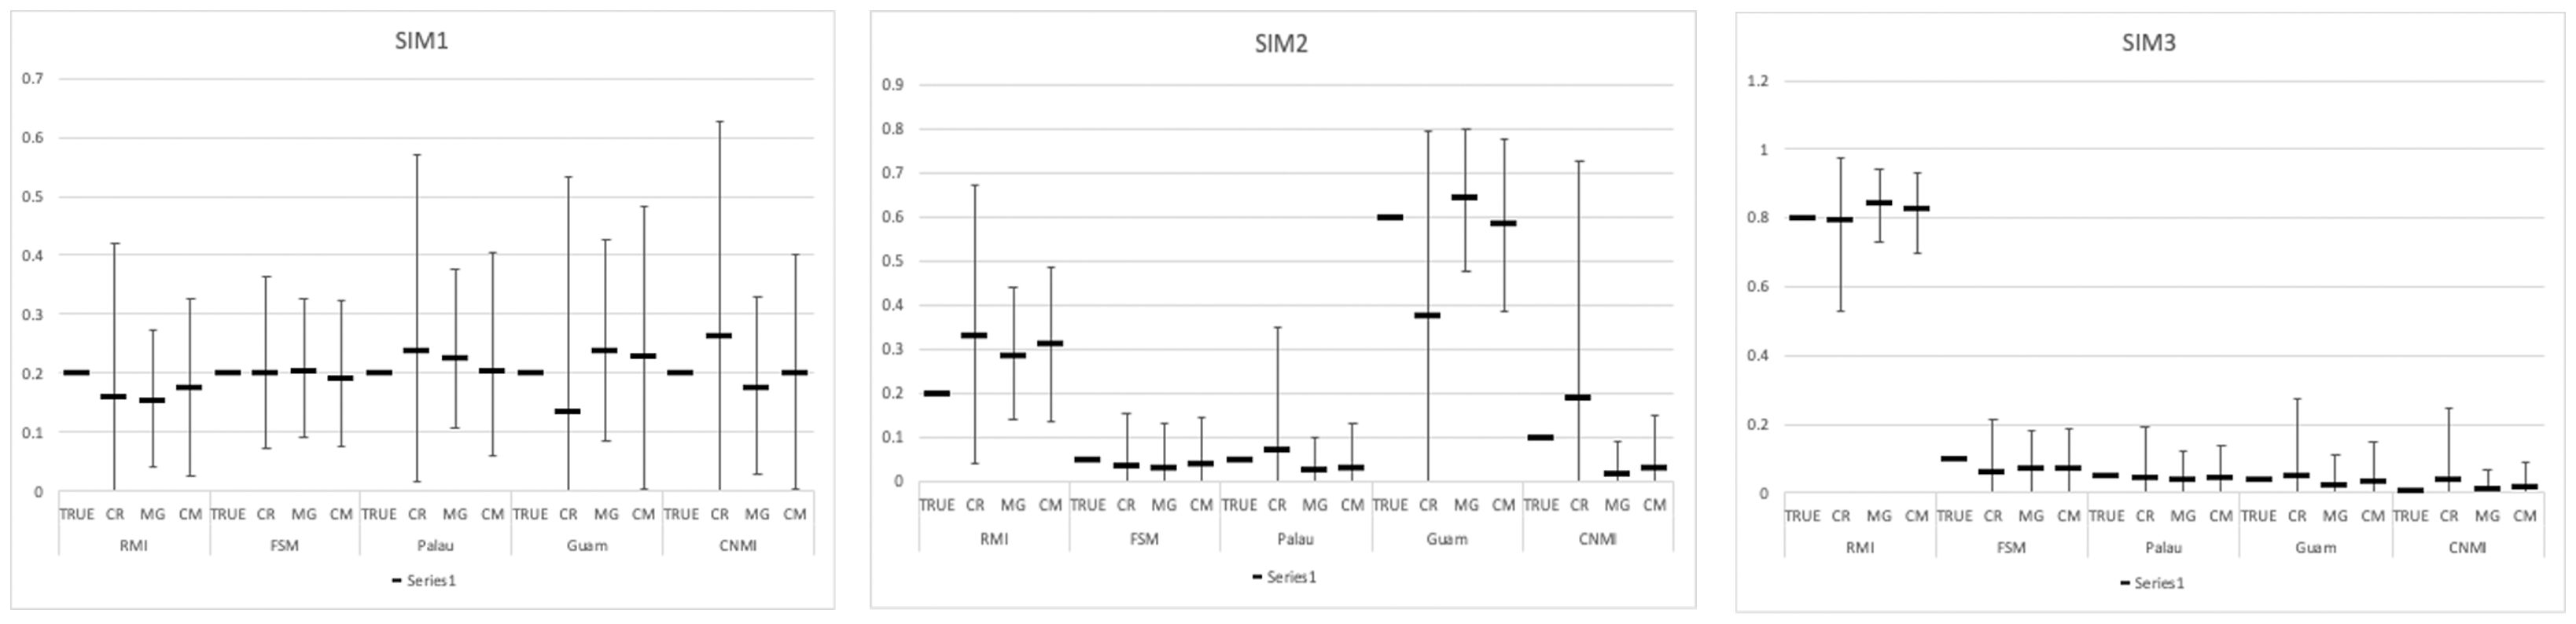
Figure 2. Comparison of baseline datasets, control region (CR), mitogenome haplotypes (MG), and collapsed mitogenome haplotypes (CM) for each simulation with 100 individuals.
Discussion
Population structure
Whole mitogenome sequencing revealed previously undetected fine-scale population structure, distinguishing green turtle rookeries separated by approximately 220 km between Guam and the CNMI. These findings provide strong genetic support for demographic isolation between these rookeries, which had not been identified in earlier studies using CR haplotypes. While previous genetic studies using mtCR suggested that green turtle population differentiation occurred at distances greater than 400 km (Dutton et al., 2014b; Bowen and Karl, 2007; Meylan et al., 2011), our results highlight how whole mitogenome sequencing offers a more refined resolution. This approach enables detection of genetic differentiation at smaller spatial scales, such as between neighboring rookeries just 220 km apart. Recent studies have shown that significant genetic differentiation can occur between neighboring rookeries as close as 300 km apart, as observed around south of the Taiwan Island (Cheng et al., 2008).
This unexpected differentiation between Guam and CNMI may be influenced by genetic drift in small populations or a founder effect, similar to the patterns observed in Hawaiian green turtle populations, and would be driven by natal homing (Frey et al., 2013). Both Guam and CNMI host very small nesting populations, with fewer than 50 females estimated in each (Seminoff et al., 2015). Additionally, the foraging populations around Guam and CNMI consist primarily of juveniles, with adults mostly observed during the nesting season (Martin et al., 2016; Summers et al., 2017; Gaos et al., 2020).
Our results, combined with findings from Roden et al. (2023), who reported significant differentiation between Guam and CNMI using nDNA (microsatellites), supports the recognition of Guam and CNMI as distinct MUs. Treating them as separate populations will contribute new baseline data for MSA and enable more precise management strategies. However, this approach will only be effective if future studies continue using whole mitogenome sequencing to identify and incorporate informative variations. Without these additional genetic markers, traditional CR based MSA may fail to distinguish between the two populations, limiting the accuracy of stock assignments. Given that both populations are significantly depleted and face ongoing conservation challenges, recognizing them as independent MUs will help preserve local adaptation and genetic diversity. This distinction is particularly important for tailoring conservation efforts to the unique threats and recovery needs of each population. Future work should focus on refining the regional genetic baseline using whole mitogenomes to ensure long-term effectiveness of MSA in distinguishing the Guam and CNMI stocks as well as other neighboring rookeries.
Mixed stock analysis
The MSA simulations confirm the value of the mitogenome sequences in accurately assigning individuals to their natal rookeries. The improved resolution, particularly for the CmP20.1 haplotype, demonstrates the importance of incorporating mitogenome data into MSA (Dutton et al., 2014b). With the collapsed mitogenome variants, the CR haplotype CmP20.1 was expanded into six separate haplotypes. This reduction in haplotype overlap among rookeries significantly enhanced the estimated rookery contributions to mixed foraging aggregations, addressing concerns previously raised by Bolker et al. (2007).
The findings also illustrate the effect of sample size on the reliability of stock assessments. Across all three simulations, the largest sample size (n = 100) produced the most accurate estimates, with the lowest %diff and the smallest 95% CI range across all baseline datasets. In simulation 2 where Guam and CNMI contributions differed significantly, the CR dataset performed poorly (10%diff), failing to distinguish between the two MUs. In contrast, both mitogenome datasets (MG and CM) showed lower %diff and narrower 95% CI, particularly in smaller sample sizes, emphasizing that the mitogenome allows for more precise MSA with small sample sizes.
Collapsing MG haplotypes further improved stock assignments and brought into focus the most informative variants. This highlights the potential for targeted sequencing assays, eliminating the need for full mitogenome sequencing. Shamblin et al. (2012b, 2017) previously demonstrated this approach using Sanger sequencing; however, our study leverages Next Generation Sequencing (NGS), which offers greater efficiency. While costs for NGS are still not trivial, the ability to sequence targeted regions at scale (i.e., reanalyzing large rookery datasets, as well as foraging and bycatch individuals) makes it a cost-effective alternative to traditional Sanger sequencing methods (Legati et al., 2021).
Future work should include designing targeted assays for the most informative variants identified in this study and sequencing additional individuals and haplotypes (CmP32, CmP61, and CmP77) from both Yap in the Federated States of Micronesia, and the Republic of Marshall Islands, as well as any foraging or bycatch individuals with CmP20.1 haplotype (Jensen et al., 2025; Horne et al., 2023). Additionally, haplotype CmP65 found in both American Samoa and French Polynesia, could help to further improve MSA studies if the mitogenomes were included.
Interestingly, while CmP20.1 showed increased resolution, the CmP22.1 haplotype exhibited minimal variation. Nearly 90% of individuals from American Samoa and the Marshall Islands shared the same MG haplotype, despite being separated by over 2,800 km. This lack of variation suggests either a recent colonization event, or shared common ancestry (Jensen et al., 2013; Shamblin et al., 2014). Future work should include assessing the distribution of this haplotype at more distant rookeries, perhaps as an informative variant for broader scale studies.
Conservation benefits
Our findings have direct conservation implications, reinforcing the need for targeted protection efforts that consider both large and small nesting populations. Smaller rookeries, despite their lower nesting numbers, may contain unique genetic diversity that is essential for species resilience.
Incorporating mitogenome data into MSA is particularly relevant for fisheries management and bycatch mitigation. The collapsed MG baseline consistently outperformed both the CR baseline and the CM baseline, providing the most reliable estimates for mixed foraging grounds. This improved accuracy allows for more effective management strategies, including enhanced genetic monitoring to refine stock identification, bycatch reduction initiatives informed by improved stock distribution data, special protection measures that safeguard critical habitats, adaptive management strategies tailored to region-specific threats and community engagement efforts in foraging areas where multiple stocks intermingle.
Previous studies using MSA with mtDNA, such as those by Dethmers et al. (2006) and Piovano et al. (2019), have highlighted the significant contributions of various nesting populations to foraging sites in the western Pacific. However, Jensen et al. (2025), caution that weak genetic differentiation between MUs may skew MSA results. Re-analyzing existing MSA datasets with mitogenomic markers that include CR haplotypes like CmP20.1, could enhance our understanding of stock composition and individual movements, ultimately leading to better informed conservation strategies to mitigate threats like incidental capture and habitat loss in these critical areas.
Distinguishing between the small rookeries of Guam and CNMI will significantly improve conservation efforts, especially regarding foraging behaviors and habitat protection. Understanding whether turtles foraging around Guam are local residents or migrating from other areas is crucial. This can inform MU scale risk assessments and subsequent prioritization of conservation strategies directed at these foraging habitats (Seminoff et al., 2015; Wallace et al., 2023). Additionally, long term monitoring of movements and foraging patterns with refined genetic tools that we describe can help assess the impacts of environmental changes, human activities, or climate change on these populations.
Data availability statement
The datasets presented in this study can be found in online repositories. The names of the repository/repositories and accession number(s) can be found in the article/Supplementary Material.
Ethics statement
Ethical review and approval was not required for the animal study because all research in this study complied with all applicable animal welfare laws. Samples are archived in the US National Marine Fisheries Service (NMFS) Marine Turtle Molecular Research Sample Collection at the Southwest Fisheries Science Center and were collected under the respective national authorizations and CITES permit conditions and imported under CITES permits.
Author contributions
AF: Writing – original draft, Writing – review & editing. EL: Writing – review & editing. MJ: Writing – review & editing. PD: Writing – review & editing.
Funding
The author(s) declare that financial support was received for the research and/or publication of this article. Funding provided by National Oceanic and Atmospheric Administration’s National Marine Fisheries Service through Southwest Fisheries Science Center Sea Turtle ESA Base Allocation and a Marie Skłodowska-Curie grant (Grant agreement number 898363 - SeaTGen) to MPJ from the European Union’s Horizon 2020 research and innovation programme.
Acknowledgments
We thank SPREP, the late Lui Bell, George Balazs, Irene Kelly, Kyle Van Houtan, Karen Frutchey for their help in coordinating the original sample collections. The authors would also like to thank Dr. Kelly Stewart and Suzanne Roden for valuable comments on the manuscript. A. Lanci, V. Pease, and A. Konopacki helped with the laboratory analysis. The following people, communities, and organisations helped with original field collections: Alden Tagarino, Ruth Utzurrum, Katerine Schletz-Saili (American Samoa). Vicente Camacho, Roque Santos, Joseph Ruak, Sylvan Igisomar (Northern Marianas). Julie Barr and William Andrew (Palau); Jennifer Cruce, Shawn Wusstig (Guam). The Falalop, the FSM Ulithi Community, the Marine Resources Office, the Department of Resources and Development, and Yap State Marine Resources Management Division; the field crew in Ulithi included X. Maigul, M. Lingelmar, A. Sau, J. Mangirechog, J. P. Malisou, L. Mal, B. Malpuluw, V. Thawalmara, A. Suwel, A. Yangolug, E. Yatch, E. Rusumal, J. Mangirechog, M. Fasong, N. Malifang, J. Waithog, J. Maremog, J. J. Hasog, G. Hacheglyeg, M. Dohwel, Q. Yefalgoi, H. Remaatiul, R. J. Lutwog, K. Dothwel, R. Yurus, M. Tabungmai; the data collectors of Women United Together in the Marshall Islands (WUTMI), including K. Boktok, M. Langidrik, H. Jacob, E. Senight, R. Jidok, A. Bunglick, R. Jelke, R. Jidok, R. and A. deBrum, L. Mejbon; C. Bigler, H. Heine (Project Coordinators); N. Vander Velde (Biologist), the Marshall Islands Marine Resources Authority (MIMRA), and E. Kabua. The CNMI DLNR/DFW Sea Turtle Program (Department of Lands and Natural Resources/Division of Fish and Wildlife); the Palau Bureau of Marine Resources; for American Samoa: U. R. Tulafono (former DMWR director) R. Matagi-Tofiga (current DMWR director); Guam Division of Aquatic and Wildlife Resources (DAWR). The Commonwealth of the Northern Mariana Islands Department of Lands & Natural Resources, Division of Fish & Wildlife. All research in this study complied with all applicable animal welfare laws. Samples are archived in the US National Marine Fisheries Service (NMFS) Marine Turtle Molecular Research Sample Collection at the Southwest Fisheries Science Center and were collected under the respective national authorizations and CITES permit conditions and imported under CITES permit, including USFWS permit # TE-72088A-3, NMFS permit # 21260.
Conflict of interest
The authors declare that the research was conducted in the absence of any commercial or financial relationships that could be construed as a potential conflict of interest.
Publisher’s note
All claims expressed in this article are solely those of the authors and do not necessarily represent those of their affiliated organizations, or those of the publisher, the editors and the reviewers. Any product that may be evaluated in this article, or claim that may be made by its manufacturer, is not guaranteed or endorsed by the publisher.
Supplementary material
The Supplementary Material for this article can be found online at: https://www.frontiersin.org/articles/10.3389/fmars.2025.1581306/full#supplementary-material
References
Archer F. I., Adams P. E., Schneiders B. B. (2017). STRATAG: An R package for manipulating, summarizing and analysing population genetic data. Mol. Ecol. Resour. 17, 5–11. doi: 10.1111/1755-0998.12559
Bolker B. M., Okuyama T., Bjorndal K. A., Bolten A. B. (2007). Incorporationg multiple mixed stocks in mixed stock analysis: ‘many-to-many’ analyses. Mol. Ecol. 16, 685–695. doi: 10.1111/j.1365-294X.2006.03161.x
Bolten A. B., Lutz P. L., Musick J. A., Wyneken J. (2003). “Variation in sea turtle life history patterns: neritic vs. oceanic developmental stages,” in The biology of sea turtles, vol. 2 . Eds. Lutz P., Musick J. a., Wyneken J. (CRC Press, Boca Raton, FL), 243–257.
Bowen B. W., Karl S. A. (2007). Population genetics and phylogeography of sea turtles. Mol. Ecol. 16, 4886–4907. doi: 10.1111/j.1365-294X.2007.03542.x
Bowen B. W., Meylan A. B., Ross J. P., Limpus C. J., Balazs G. H., Avise J. C. (1992). Global population structure and natural history of the green turtle (Chelonia mydas) in terms of matriarchal phylogeny. Evol 46, 865–881. doi: 10.1111/j.1558-5646.1992.tb00605.x
Bowen B. W., Nelson W. S., Avise J. C. (1993). A molecular phylogeny for marine turtles: trait mapping, rate assessment, and conservation relevance. Proc. Natl. Acad. Sci. 90, 5574–5577. doi: 10.1073/pnas.90.12.5574
Cheng I. J., Dutton P. H., Chen C. L., Chen H. C., Chen Y. H., Shea J. W. (2008). Comparison of the genetics and nesting ecology of two green turtle rookeries. J. Zool. 276, 375–384. doi: 10.1111/j.1469-7998.2008.00501.x
DePristo M. A., Banks E., Poplin R., Garimella K. V., Maguire J. R., Hartl C., et al. (2011). A framework for variation discovery and genotyping using next-generation DNA sequencing data. Nat. Genet. 43, 491–498. doi: 10.1038/ng.806
Dethmers K. E., Broderick D., Moritz C., Fitzsimmons N. N., Limpus C. J., Lavery S., et al. (2006). The genetic structure of Australasian green turtles (Chelonia mydas): exploring the geographical scale of genetic exchange. Mol. Ecol. 15, 3931–3946. doi: 10.1111/j.1365-294X.2006.03070.x
Duchene S., Frey A., Alfaro-Núñez A., Dutton P. H., Gilbert M. T. P., Morin P. A. (2012). Marine turtle mitogenome phylogenetics and evolution. Mol. Phylogenet. Evol. 65, 241–250. doi: 10.1016/j.ympev.2012.06.010
Dutton P. H., Balazs G. H., LeRoux R. A., Murakawa S. K., Zarate P., Martínez L. S. (2008). Composition of Hawaiian green turtle foraging aggregations: mtDNA evidence for a distinct regional population. Endang. Species. Res. 5, 37–44. doi: 10.3354/esr00101
Dutton P. H., Jensen M. P., Frey A., LaCasella E., Balazs G. H., Zárate P., et al. (2014a). Population structure and phylogeography reveal pathways of colonization by a migratory marine reptile (Chelonia mydas) in the central and eastern Pacific. Ecol. Evol. 4, 4317–4331. doi: 10.1002/ece3.1269
Dutton P. H., Jensen M. P., Frutchey K., Frey A., LaCasella E., Balazs G. H., et al. (2014b). Genetic stock structure of green turtle (Chelonia mydas) nesting populations across the Pacific islands. Pac. Sci. 68, 451–464. doi: 10.2984/68.4.1
Excoffier L., Lischer H. E. (2010). Arlequin suite ver 3.5: a new series of programs to perform population genetics analyses under Linux and Windows. Mol. Ecol. Res. 10, 564–567. doi: 10.1111/j.1755-0998.2010.02847.x
FitzSimmons N. N., Limpus C. J., Norman J. A., Goldizen A. R., Miller J. D., Moritz C. (1997). Philopatry of male marine turtles inferred from mitochondrial DNA markers. Proc. Natl. Acad. Sci. 94, 8912–8917. doi: 10.1073/pnas.94.16.8912
Frandsen H. R., Figueroa D. F., George J. A. (2020). Mitochondrial genomes and genetic structure of the Kemp’s ridley sea turtle (Lepidochelys kempii). Ecol. Evol. 10, 249–262. doi: 10.1002/ece3.5891
Frey A., Dutton P. H., Balazs G. H. (2013). Insights on the demography of cryptic nesting by green turtles (Chelonia mydas) in the main Hawaiian Islands from genetic relatedness analysis. J. Exp. Mar. Biol. Ecol. 442, 80–87. doi: 10.1016/j.jembe.2013.01.030
Gaos A. R., Martin S. L., Jones T. T. (2020). Sea turtle tagging in the Mariana Islands Training and Testing (MITT) study area. Annual Report prepared for the U.S. Pacific Fleet Environmental Readiness Office, Pearl Harbor, Hawaii by NOAS Fishers, Marine Turtle Biology and Assessment Group, Protected Species Division, Pacific Islands Fisheries Science Center, Honolulu, Hawaii under Interagency Agreement. DR-20-003. doi: 10.25923/qq2e-e198
Hancock-Hanser B. L., Frey A., Leslie M. S., Dutton P. H., Archer F. I., Morin P. A. (2013). Targeted multiplex next-generation sequencing: advances in techniques of mitochondrial and nuclear DNA sequencing for population genomics. Mol. Ecol. Res. 13, 254–268. doi: 10.1111/1755-0998.12059
Hirth H. F. (1997). Synopsis of the biological data on the green turtle Chelonia mydas (Linnaeus 1758). U.S. Fish and Wildlife Service biological report, Vol. 97. (Washington D.C.: Fish and Wildlife Service, Department of the Interior).
Horne J. B., Roden S. E., LaCasella E. L., Frey A., Martin S. L., Jones T. T., et al. (2023). Origins of green turtle fishery bycatch in the central pacific revealed by mixed genetic markers. Front. Mar. Sci. 10. doi: 10.3389/fmars.2023.1112842
Jensen M. P., Allen C. D., Eguchi T., Bell I. P., LaCasella E. L., Hilton W. A., et al. (2018). Environmental warming and feminization of one of the largest sea turtle populations in the world. Curr. Biol. 28, 154–159. doi: 10.1016/j.cub.2017.11.057
Jensen M. P., FitzSimmons N. N., Dutton P. H. (2013). Molecular genetics of sea turtles. Biol. Sea. Turtles. 3, 135–161. doi: 10.1201/b13895
Jensen M. P., LaCasella E. L., Kobayashi D. R., Frey A., Summers T. M., Hapdei J. R., et al. (2025). Expanding the Boundaries: Regional Connectivity in Green Turtle (Chelonia mydas) Populations across Micronesia. Front. Mar. Sci. in review.
Katoh K., Kuma K. I., Toh H., Miyata T. (2005). MAFFT version 5: improvement in accuracy of multiple sequence alignment. Nucleic Acids Res. 33, 511–518. doi: 10.1093/nar/gki198
Kircher M., Sawyer S., Meyer M. (2012). Double indexing overcomes inaccuracies in multiplex sequencing on the Illumina platform. Nucleic Acids Res. 40, e3–e3. doi: 10.1093/nar/gkr771
Komoroske L. M., Jensen M. P., Stewart K. R., Shamblin B. M., Dutton P. H. (2017). Advances in the application of genetics in marine turtle biology and conservation. Front. Mar. Sci. 4. doi: 10.3389/fmars.2017.00156
LaCasella E. L., Epperly S. P., Jensen M. P., Stokes L., Dutton P. H. (2013). Genetic stock composition of loggerhead turtles Caretta bycaught in the pelagic waters of the North Atlantic. Endang. Species. Res. 22, 73–84. doi: 10.3354/esr00535
Legati A., Zanetti N., Nasca A., Peron C., Lamperti C., Lamantea E., et al. (2021). Current and new Next-Generation Sequencing approaches to study mitochondrial DNA. J. Mol. Diagn. 23, 732–741. doi: 10.1016/j.jmoldx.2021.03.002
Leroux R. A., Dutton P. H., Abreu-Grobois F. A., Lagueux C. J., Campbell C. L., Delcroix E., et al. (2012). Re-examination of population structure and phylogeography of hawksbill turtles in the wider Caribbean using longer mtDNA sequences. J. Hered. 103, 806–820. doi: 10.1093/jhered/ess055
Li H., Durbin R. (2009). Fast and accurate short read alignment with Burrows–Wheeler transform. Bioinformatics 25, 1754–1760. doi: 10.1093/bioinformatics/btp324
López-Castro M. C., Koch V., Mariscal-Loza A., Nichols W. J. (2010). Long-term monitoring of black turtles Chelonia mydas at coastal foraging areas off the Baja California Peninsula. Endang. Species. Res. 11, 35–45. doi: 10.3354/esr00264
Martin S. L., Van Houtan K. S., Jones T. T., Aguon C. F., Gutierrez J. T., Tibbatts R. B., et al. (2016). Five decades of marine megafauna surveys from Micronesia. Front. Mar. Sci. 2. doi: 10.3389/fmars.2015.00116
Meylan P. A., Meylan A. B., Gray J. A. (2011). The ecology and migrations of sea turtles 8. Tests of the developmental habitat hypothesis. Bull. Am. Mus. Nat. Hist. 2011, 1–70. doi: 10.1206/357.1
Miller S., Dykes D., Polesky H. (1988). A simple salting out procedure for extracting DNA from human nucleated cells. Nucleic Acids Res. 16, 1215. doi: 10.1093/nar/16.3.1215
Nielsen R., Korneliussen T., Albrechtsen A., Li Y., Wang J. (2012). SNP calling, genotype calling, and sample allele frequency estimation from new-generation sequencing data. PloS One 7 (7), e37558. doi: 10.1371/journal.pone.0037558
Norman J. A., Moritz C., Limpus C. J. (1994). Mitochondrial DNA control region polymorphisms: genetic markers for ecological studies of marine turtles. Mol. Ecol. 3, 363–373. doi: 10.1111/j.1365-294X.1994.tb00076.x
Okuyama T., Bolker B. M. (2005). Combining genetic and ecological data to estimate sea turtle origins. Ecol. Appl. 15, 315–325. doi: 10.1890/03-5063
Pella J., Masuda M. (2001). Bayesian methods for analysis of stock mixtures from genetic characters. Fish. Bull. 99, 151–167.
Piovano S., Batibasaga A., Ciriyawa A., LaCasella E. L., Dutton P. H. (2019). Mixed stock analysis of juvenile green turtles aggregating at two foraging grounds in Fiji reveals major contribution from the American Samoa Management Unit. Sci. Rep. 9, 3150. doi: 10.1038/s41598-019-39475-w
Raymond M., Rousset F. (1995). An exact test for population differentiation. Evol 49, 1280–1283. Available at: https://www.jstor.org/stable/2410454 (Accessed April 7, 2025).
R Development Core Team (2021). R: A language and environment for statistical computing (Vienna, Austria: Foundation for Statistical Computing). Available at: https://www.R-project.org/ (Accessed April 7, 2025).
Roden S. E., Horne J. B., Jensen M. P., FitzSimmons N. N., Balazs G. H., Farman R., et al. (2023). Population structure of Pacific green turtles: a new perspective from microsatellite DNA variation. Front. Mar. Sci. 10. doi: 10.3389/fmars.2023.1116941
Seminoff J. A., Allen C. D., Balazs G. H., Dutton P. H., Eguchi T., Haas H., et al. (2015). Status review of the green turtle (Chelonia mydas) under the Endangered Species Act. NOAA-TM-NMFS-SWFSC. Available online at: https://repository.library.noaa.gov/view/noaa/4922/noaa_4922_DS1.pdf (Accessed April 7, 2025).
Shamblin B. M., Bjorndal K. A., Bolten A. B., Hillis-Starr Z. M., Lundgren I. A. N., Naro-Maciel E., et al. (2012b). Mitogenomic sequences better resolve stock structure of southern Greater Caribbean green turtle rookeries. Mol. Ecol. 21, 2330–2340. doi: 10.1111/j.1365-294X.2012.05530.x
Shamblin B. M., Bolten A. B., Abreu-Grobois F. A., Bjorndal K. A., Cardona L., Carreras C., et al. (2014). Geographic patterns of genetic variation in a broadly distributed marine vertebrate: new insights into loggerhead turtle stock structures from expanded mitochondrial DNA sequences. PloS One 9 (1), e85956. doi: 10.1371/journal.pone.0085956
Shamblin B. M., Bolten A. B., Bjorndal K. A., Dutton P. H., Nielsen J. T., Abreu-Grobois F. A., et al. (2012a). Expanded mitochondrial control region sequences increase resolution of stock structure among North Atlantic loggerhead turtle rookeries. Mar. Ecol. Prog. Ser. 469, 145–160. doi: 10.3354/meps09980
Shamblin B. M., Dutton P. H., Shaver D. J., Bagley D. A., Putman N. F., Mansfield K. L., et al. (2017). Mexican origins for the Texas green turtle foraging aggregation: a cautionary tale of incomplete baselines and poor marker resolution. J. Exp. Mar. Biol. Ecol. 488, 111–120. doi: 10.1016/j.jembe.2016.11.009
Stewart K. R., LaCasella E. L., Roden S. E., Jensen M. P., Stokes L. W., Epperly S. P., et al. (2016). Nesting population origins of leatherback turtles caught as bycatch in the US pelagic longline fishery. Ecosphere 7 (3), e01272. doi: 10.1002/ecs2.1272
Summers T. M., Jones T. T., Martin S. L., Hapdei J. R., Ruak J. K., Lepczyk C. A. (2017). Demography of marine turtles in the nearshore environments of the Northern Mariana Islands. Pac. Sci. 71, 269–286. doi: 10.2984/71.3.3
Keywords: sea turtles, mixed stock analysis, conservation, mitochondrial genome sequencing, population structure
Citation: Frey A, LaCasella EL, Jensen MP and Dutton PH (2025) Whole mitochondrial DNA sequencing improves resolution of population structure for Pacific green turtles (Chelonia mydas). Front. Mar. Sci. 12:1581306. doi: 10.3389/fmars.2025.1581306
Received: 21 February 2025; Accepted: 26 March 2025;
Published: 02 May 2025.
Edited by:
Xuelei Zhang, Ministry of Natural Resources, ChinaReviewed by:
Wesley Colombo, Federal University of Espirito Santo, BrazilSonia Isabel Quijano Scheggia, Universidad de Colima, Mexico
Copyright © 2025 Frey, LaCasella, Jensen and Dutton. This is an open-access article distributed under the terms of the Creative Commons Attribution License (CC BY). The use, distribution or reproduction in other forums is permitted, provided the original author(s) and the copyright owner(s) are credited and that the original publication in this journal is cited, in accordance with accepted academic practice. No use, distribution or reproduction is permitted which does not comply with these terms.
*Correspondence: Amy Frey, QW15LkZyZXlAbm9hYS5nb3Y=