Abstract
The global seagrass decline has prompted numerous restoration efforts to reverse current trends. Yet, restoration efforts are challenged by ecological feedbacks and prevalent stressors. Identifying these stressors and the thresholds where seagrass shoot production becomes negative is vital to improve site-selection procedures and increase restoration success. In this study, we investigated the ecological compensation irradiance (ECI) and depth limit of eelgrass (Zostera marina L) transplants along a eutrophication gradient. This was accomplished by establishing eelgrass transplants along eutrophication and depth gradients while continuously measuring benthic Photosynthetically Active Radiation (PAR). High-temporal monitoring of shoot count allowed precise estimates of shoot production, which was applied to modified photosynthesis-irradiance curves, thereby estimating the ECI. The ECI fell within the interval 2.6 – 9.8 E m-2 d-1 and responded distinctly along the eutrophication gradient, decreasing as eutrophication and nutrient-derived stressors were alleviated. The depth limits were concurrently controlled by irradiance and ECI and similarly responded along the eutrophication gradient, increasing from 1.1 m at the innermost station to 4.7 – 5.6 m at the two outermost least eutrophic stations. The results demonstrate that the ECI of eelgrass varies according to the local environment, with implications for habitat suitability assessment and site selection procedures in restoration efforts.
1 Introduction
Globally, seagrass coverage has declined due to the impact of anthropogenic stressors (Waycott et al., 2009; Flindt et al., 2024). Seagrasses are a foundation species providing multiple ecosystem functions (Mcglathery et al., 2007; Orth et al., 2020; Steinfurth et al., 2022), and reestablishment is essential to ensure good ecological conditions. Restoration of seagrasses can either be passive by reducing stressors (Cardoso et al., 2010) or active via transplantation or seeding, and numerous restoration efforts have been carried out globally to reverse the decline (Orth et al., 2020; Govers et al., 2022; Lange et al., 2022; Gagnon et al., 2023). Yet, restoration efforts prove challenging due to prevalent stressors and ecological feedbacks, even if the initial stressor (e.g. nutrient inputs) has been removed or diminished (Oncken et al., 2022; Flindt et al., 2024; Unsworth et al., 2024). Identification of these stressors and their associated thresholds that are limiting habitat recovery is essential to improve site-selection procedures and increase restoration success (Flindt et al., 2016, Flindt et al., 2024).
Light limitation is the primary stressor limiting seagrass reestablishment (Burkholder et al., 2007), especially as light is the main factor regulating the depth limits of seagrass populations (Nielsen et al., 2002a; Thom et al., 2008; Krause-Jensen et al., 2011). Multiple factors impact the light regime, but eutrophication is the main factor in urbanized and agriculturally developed regions (Nielsen et al., 2002b; Hauxwell et al., 2003; Burkholder et al., 2007). Eutrophication negatively affects the amount of light that reaches the leaves through increased biomass of phytoplankton, epiphytes, and opportunistic macroalgae (Nielsen et al., 2002b; Hauxwell et al., 2003; Burkholder et al., 2007) and degradation of sediment conditions resulting in increased sediment resuspension frequencies (Burkholder et al., 2007; Flindt et al., 2022). In Denmark, eutrophication has severely diminished eelgrass depth limits (Zostera marina), drastically limiting the area that can sustain sufficient growth for reestablishment. Consequently, today’s eelgrass populations grow in a narrow band at shallow depths close to the coastline, and it has been estimated that the eelgrass coverage is reduced to 1/3 of the 1900s reference conditions (Staehr et al., 2019). Therefore, improving benthic light conditions is a prerequisite for recovering deeper populations and regaining essential ecosystem functions provided by eelgrass.
Eelgrass reestablishment in Denmark seems slow or lacking despite substantial efforts to reduce anthropogenic nutrient input (Carstensen et al., 2012; Riemann et al., 2016) due to ecological feedbacks retaining the ecosystem in a degraded state (Valdemarsen et al., 2010, Valdemarsen et al., 2011; Carstensen et al., 2012; Infantes et al., 2016; Riemann et al., 2016; Unsworth et al., 2024). Additionally, natural eelgrass recolonization through seed dispersal is hampered by multiple factors. Firstly, eelgrass seeds in Denmark remain dormant through the winter, during which storms sweep out a large portion of the seeds to unsuitable environments (Kuusemäe et al., 2018). Further, seed mortality is increased with a high level of herbivory from meso-grazers like the Green Crab, Carcinus maenas (Infantes et al., 2016; Unsworth et al., 2024). Secondly, seeds that manage to germinate generally exhibit high mortality with little success in maturing and developing stable beds (Valdemarsen et al., 2010, Valdemarsen et al., 2011). Consequently, eelgrass transplantation has been utilized to assist eelgrass recovery at suitable sites (Lange et al., 2022; Flindt et al., 2024; Banke et al., 2025). Proper site selection and habitat suitability assessment are essential to this process to ensure successful restoration. With light limitation being the primary stressor in most areas, reliable identification of the irradiance requirements of eelgrass is necessary to support coming restoration efforts.
Irradiance requirements of eelgrass have been investigated in numerous studies (Olesen and Sand-Jensen, 1993; Thom et al., 2008; Staehr and Borum, 2011; Benson et al., 2013; Leger-Daigle et al., 2022). Many of these were conducted within controlled ex-situ conditions (Olesen and Sand-Jensen, 1993; Staehr and Borum, 2011; Leger-Daigle et al., 2022) and reflect the physiological irradiance requirements for eelgrass to achieve net growth or the “compensation irradiance”. However, in-situ conditions contain multiple stressors that directly affect loss rates or energy demand (Flindt et al., 2016; Moreno-Marín et al., 2018). Thus, the irradiance needed to achieve net growth is expected to be relatively higher. In this study, we measure the in-situ compensation irradiance and define it as the ecological compensation irradiance (ECI). This definition resembles the definition of ecological compensation depth (ECD) introduced by Gallegos and Kenworthy (1996), but it reflects the irradiance requirement for eelgrass growth, where net gains in shoot density are equal to net losses.
Estimating the ECI is challenging as the compensation irradiance can display a high seasonality (Olesen and Sand-Jensen, 1993; Staehr and Borum, 2011). This seasonality results from plant physiological responses to changing temperatures that affect respiration rates and enzymatic processes (Olesen and Sand-Jensen, 1993; Staehr and Borum, 2011), from seasonal differences in the morphology of the seagrass itself (Olesen and Sand-Jensen, 1993; Staehr and Borum, 2011) or temporal variability in environmental stressors like epiphytic growth, macroalgae blooms or hypoxia (Tyler et al., 2009; Rasmussen et al., 2013). The ECI has previously been estimated by measuring the irradiance at the depth limits of eelgrass (Ralph et al., 2007 and references within). This method assumes that the depth limit displays a fast response to environmental changes and acts as an integral of the ECI. However, this assumption is invalid in systems that have been subject to substantial decreases in depth limit and subsequently display slow recovery trajectories (Greve and Krause-Jensen, 2005b). In such instances, a different in-situ methodology is needed, preferably covering the entire growth season, thereby accounting for seasonal variability.
Environmental stressors have a profound impact on the ECI. Previous studies suggest that the ECI is increased by eutrophication (Kenworthy et al., 2014) and seagrasses growing in turbid waters have higher irradiance requirements (Kenworthy and Fonseca, 1996; Duarte et al., 2007). Similarly, studies have shown that the ECI increased in areas having organic-rich sediment (Krause-Jensen et al., 2011; Kenworthy et al., 2014). Therefore, studies identifying the ECI should include variations of environmental stressors, yielding a more precise representation of the ECI along stressor gradients.
To our knowledge, the study by Benson et al. (2013) is the only in-situ study investigating the light requirements of eelgrass transplants. While Benson et al. (2013) did not identify a specific irradiance threshold to sustain transplant growth, their results indicated a light requirement of >100 µE m-2 s-1 as a growth season average for transplantations to be successful. Identification of this threshold can support the identification of functional depth limits and has implications for habitat suitability models used in site-selection procedures for eelgrass restoration (Flindt et al., 2016; Kuusemäe et al., 2016; Preston et al., 2021; Flindt et al., 2024). In this study, we aimed to quantify the ECI and depth limits of eelgrass transplants along a eutrophication gradient. We examined how the ECI was altered by nutrient-derived stressors within the same system, thereby supporting the development of robust site selection procedures and identifying functional depth limits. The ECI and depth limits were quantified using a novel in-situ approach by establishing eelgrass transplants along eutrophication and depth gradients while continuously measuring benthic PAR irradiance. High-temporal monitoring of transplant development allowed precise quantification of shoot production, which was correlated with available PAR irradiance.
2 Materials and methods
2.1 Study site
The study was conducted in the West-East facing Danish estuary, Vejle Fjord. The estuary has a mean depth of 8.3 m, a length of 22 km, a surface area of 109 km2, and a catchment of 727 km2 (Miljoeministeriet, 2011). The system is micro tidal (± 0.5 m at mean sea level) with a predominantly anticlockwise marine current entering the estuary along the northern coastline and exiting along the southern (Christiansen et al., 1991). As a result, the northern coastline displays less eutrophic conditions than the southern coastline, which receives more nutrient input from the main freshwater inlet, Vejle Stream, positioned in the innermost part of the system. The residence time of the estuary has been estimated to be 35–45 days (Miljoeministeriet, 2011).
Like most Danish estuaries, Vejle Fjord is heavily affected by eutrophication. According to the European Water Frame Directive, the ecological state is classified as bad in the inner part and poor in the outer part of the estuary (Miljoegis Danish Environmental Protection Agency). Consequently, the depth distribution of eelgrass (Zostera marina) has been drastically reduced throughout the estuary, but most severely in the outer parts where depth limits historically were deeper (Timmermann et al., 2020). In the outer estuary, depth limits have been reduced from 9.9 m to 1.7-3.0 m, depending on the location (Danish EPA), and the potential growth area is now restricted to a narrow section along the coastline. Considerable efforts have been made to reduce nutrient loading to the system, resulting in a decrease from a mean annual load in 1989–1995 of 2303 t N/year (Skop and Sorensen, 1998) to a present load of 930 t N/year (Miljoeministeriet, 2023). Further reductions are needed to ensure a good ecological status (Miljoeministeriet, 2023). Still, concurrent habitat restoration can now successfully be implemented (Flindt et al., 2024) using site selection procedures to identify areas as they are gradually relieved from nutrient-derived stressors.
2.2 Experimental design
The experiment was designed with 5 stations that covered the eutrophication gradient in Vejle Fjord (Figure 1). Each station had eelgrass transplanted along a depth gradient. The transplantation depth intervals for each station (Table 1) were chosen based on the depth limits of nearby natural meadows. Eelgrass was transplanted a few meters deeper than the natural meadows at each station to ensure that the transplantations exceeded the depth limit and irradiance threshold. Eelgrass was transplanted for two consecutive years: 2022 and 2023. In 2022, two stations were established; One was established in June in a eutrophic embayment, “Andkær Vig”, and one in July at the outer less eutrophic northern coastline at the station Træskohage (Figure 1). In 2023, the experimental setup was expanded with 3 stations along the eutrophication gradient at the stations Bybæk, Sellerup, Trelde, and a new depth gradient was transplanted at the existing station Træskohage (Figure 1; Table 1). All stations were transplanted within the first 4 days of May 2023. The depth gradient at Træskohage was replanted in 2023 because the gradient from 2022 achieved net growth at all depths down to an unexpected depth of 4 m. Therefore, it was not planted sufficiently deep to estimate the depth limit and ECI. Consequently, the stations in the outer part of the estuary were expanded to a depth of 6 m in 2023 (Table 1). The upper depth limit at each station was chosen to cover the depth at which light limitation, according to the literature and pilot studies within the same estuary, was not the limiting factor for transplant growth.
Figure 1
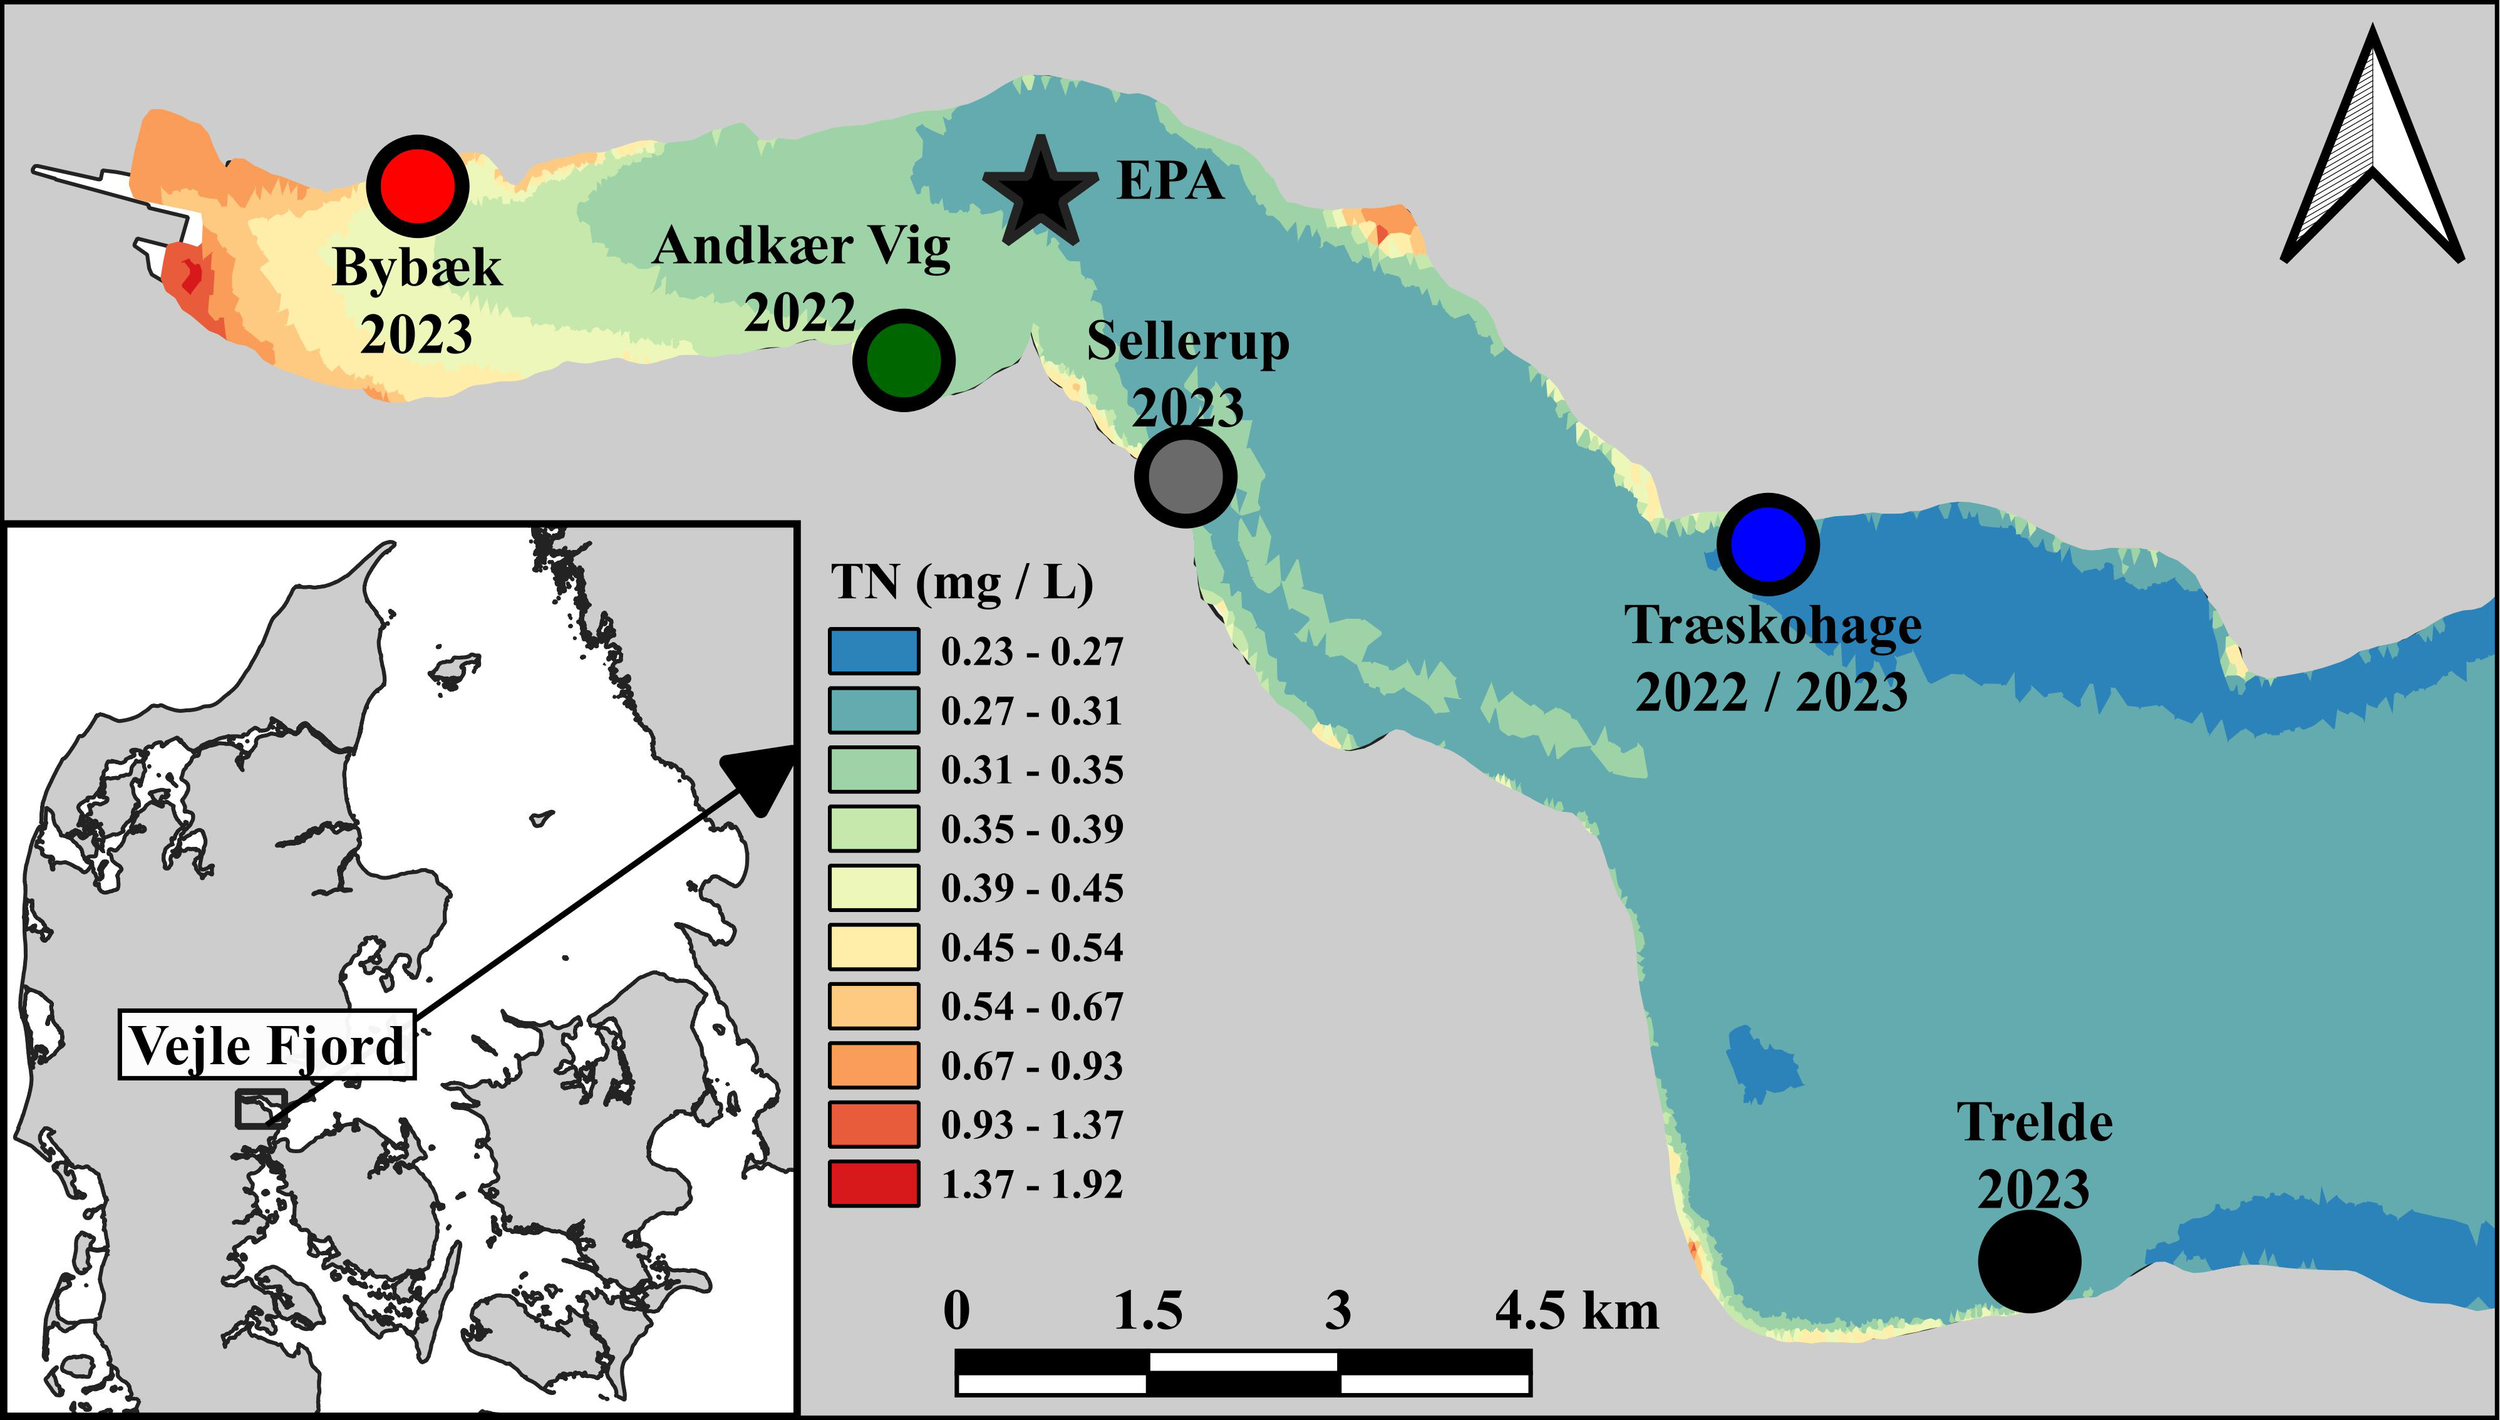
Stations with transplanted depth gradients and EPA-station in Vejle Fjord, Denmark. Station names and year of transplantation are highlighted. The eutrophication gradient displayed as the growth season average Total-Nitrogen (TN, mg L-1), data from a mechanistic Mike3D model calibrated and validated using EPA data.
Table 1
| Station | Year | Distance from primary N-source (km) | Transplant depths (m) |
|---|---|---|---|
| Andkær Vig | 2022 | 5.6 | 2.0 – 4.0 |
| Træskohage | 13.1 | 2.0 – 4.0 | |
| Bybæk | 2023 | 1.9 | 1.5 – 3.0 |
| Sellerup | 8.7 | 2.0 – 4.0 | |
| Trelde | 16.4 | 3.5 – 6.0 | |
| Træskohage | 13.1 | 3.5 – 6.0 |
Stations with transplanted depth gradients.
Year of establishment, distance from the primary N-source (Vejle Stream), and depths (at mean sea level) of transplants are shown. Transplantations were made in 0.5 m increments within the shown depth intervals.
2.3 Transplantation
Transplantation was done by a team of freedivers using a variation of the horizontal rhizome method (Davis and Short, 1997), which has been successfully employed in several large-scale transplantation campaigns in Denmark (Lange et al., 2022; Flindt et al., 2024; Banke et al., 2025). At each station, shoots were harvested from nearby (500 – 1.500 m), shallow (~1.5 m deep) donor meadows, using a garden rake to remove 30x30 cm sections of interconnected rhizomes and shoots. Shallow beds were used as donor meadows as these have the highest shoot density, making sustainable harvest easily achievable. Furthermore, the same harvest depth was utilized across sites to minimize the likelihood that growth patterns were affected by variable phenotypic adaptations to depth amongst donor beds.
Individual apical shoots with small lateral shoots attached (0–2 lateral shoots) were separated into individual planting units (PU, 1.06 shoots pu-1 on average) and attached to iron nails (5 g, 80 x 31 mm) as anchorage using iron wire (0.5 mm thick). Shoots with rhizomes < 4 cm were discarded. PUs were transplanted within the same day of harvest to limit the associated stress (Van Katwijk et al., 2016).
PUs were transplanted in groups of 25 inside a circular frame (⌀ = 100 cm) with 20 PUs evenly distributed along the inner edge and 5 PUs placed in the middle (Figure 2). Previous experience using this type of grouping (Flindt et al., 2024) has shown several advantages: 1) Shoots are evenly distributed at a distance that allows shoot densities to reach densities similar to natural meadows within two growth seasons, 2) the circular structure mimics the radial growth pattern of naturally occurring meadows and 3) it allows accurate monitoring of defined groups of shoots and calculation of shoot production.
Figure 2
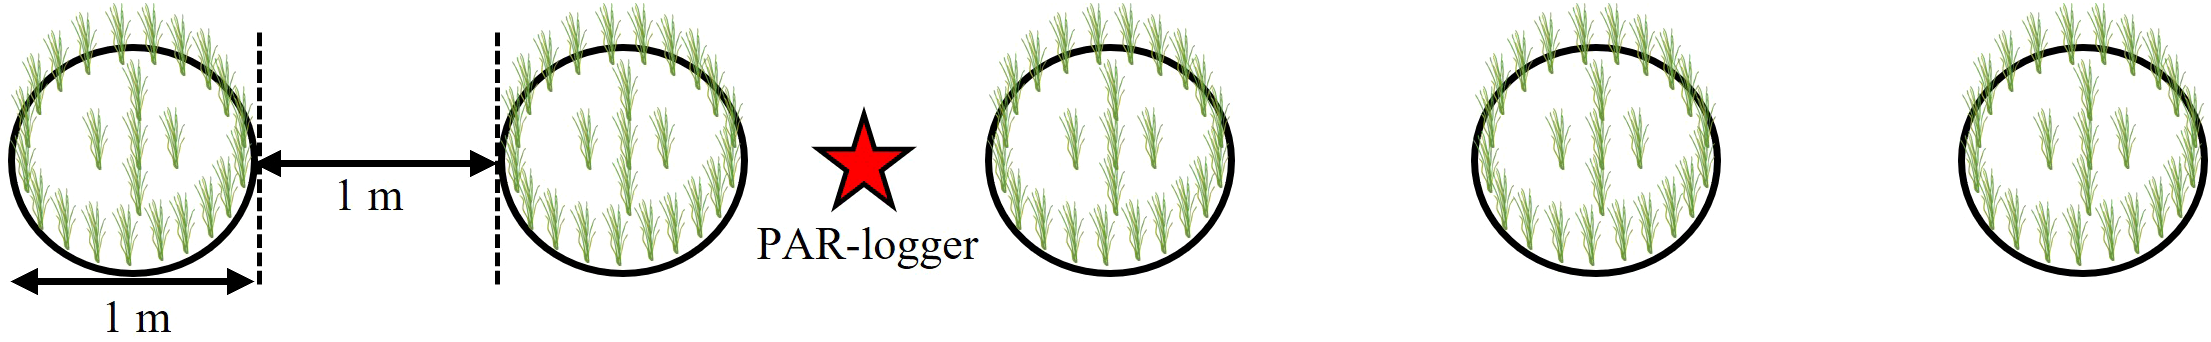
Experimental setup at each depth interval. The setup consisted of five transplantation groups of 25 PU’s (⌀ = 100 cm) with an interspacing of 1 m parallel to the coast. A benthic PAR-logger was centrally placed between transplantation groups at most depths. At depths without loggers, PAR data were interpolated.
2.4 Design of depth gradients and monitoring
Each depth gradient was established in 0.5 m depth intervals to ensure small increments in available irradiance. Depths were adjusted to represent the depth at mean sea level. At each depth interval, five transplant groups of 25 PUs were established in a line parallel to the coast, ensuring equal depth and irradiance. The five transplant groups were interspaced by 1 m and were treated as individual replicates (Figure 2). Transplant groups were marked using brightly colored cable ties, ensuring the area could be identified even if all shoots had perished.
Monitoring of the stations was performed by freediving. At each monitoring date, the number of shoots in each replicate (transplant group) was counted, and transplant areas were checked for bioturbating lugworms, as these are known to decrease transplant performance drastically (Banke et al., 2025). However, negligible densities of lugworms were present at the study sites throughout the monitoring period. The first monitoring started immediately after the transplantation. Monitoring in 2022 was carried out in 3–5 weeks intervals, dependent on weather conditions and visibility, allowing precise shoot production estimates. In 2023, the monitoring was made in shorter intervals of 2–4 weeks to increase the temporal resolution of the data acquisition further. Monitoring continued throughout the growth season (May – October) and was revisited the following growth season to check for post-winter survival.
2.5 PAR measurements and data treatment
Benthic irradiance was measured directly at most depths, except for a few depths where irradiance was instead interpolated due to insufficient quantities of loggers to cover all depths (Table 2). Irradiance was measured using true integrating PAR-loggers (Photosynthetic Active Radiation) of the type “Odyssey Xtreem” with a cosine-corrected irradiance sensor (400–700 nm) that concurrently measured water temperature. The Odyssey sensors were calibrated as recommended by Odyssey guidelines using a LI-COR Quantum PAR sensor. The calibration was made outside on a clear day from dusk till dawn to account for any effect of solar angle and variable light intensities. The Odyssey loggers measured continuously throughout the growth season with a 15-minute integration period in 2022 and a 10-minute integration period in 2023, yielding a precise measurement of available growth season irradiance. To prevent biofouling and ensure high-quality data, a mechanical wiper (15 min - 30 min wiping interval) was mounted to each PAR-logger. Loggers were placed centrally between transplant groups (Figure 2) at a sensor height of 24 cm above the sediment constrained by the height of the wiper motor. Sensors were placed south-facing relative to the wiper unit to prevent self-shading. At each monitoring, the sensors were cleaned by removing biofilms and particles, and the integrity of the wipers were checked.
Table 2
| Station | |||||
|---|---|---|---|---|---|
| Depth (m) | Bybæk | Andkær Vig | Sellerup | Trelde | Træskohage |
| 1.5 | Measured | ||||
| 2.0 | Measured | Measured | Measured | ||
| 2.5 | Measured | Measured | Measured | ||
| 3.0 | Measured | Measured | Measured | ||
| 3.5 | Interpolated | Interpolated | Measured | Measured | |
| 4.0 | Measured | Measured | Measured | Measured | |
| 4.5 | Interpolated | Interpolated | |||
| 5.0 | Measured | Measured | |||
| 5.5 | Interpolated | Interpolated | |||
| 6.0 | Measured | Measured | |||
Matrix showing the origin of PAR data within the study.
PAR was either directly measured using PAR-loggers (Measured) or interpolated from data within the same station (Interpolated).
At depths without available PAR-loggers, the PAR irradiance was interpolated (Table 2) using data from all PAR-loggers within the same gradient. No loggers were deployed at the station Træskohage in 2022 due to a lack of loggers. Interpolation of PAR irradiance at depths without loggers (Table 2) assumed an exponential decay as shown by Lambert-Beers law (Equation 1, Kirk, 1985).
Where Iz is the irradiance at the depth (z), I0 is the light intensity at the surface, and Kd is the light attenuation coefficient. Using Eq. 1, the attenuation coefficient was simultaneously estimated throughout the monitoring period.
For each depth, the PAR irradiance was calculated using two different methods to allow comparison with existing literature:
-
The integrated daily PAR irradiance (E m-2 d-1) (presented as main results)
-
The average PAR irradiance (µE m-2 s-1) during the ecological day length (Presented in Supplementary Figure 2)
The two methodologies deviate in the integration period used for each day with method 1) using the entire day length and integrated PAR dose regardless of the photoperiod, and method 2) using the average irradiance during the ecological day length. Here, the ecological day length is defined as the daylight period with a solar elevation >10° relative to the horizon, equivalent to a reflection at the air-water interface of 1/3 of sunlight irradiance (Weinberg, 1976). This definition was used to prevent periods with low solar inclination and high reflections at the water surface from drastically skewing measurements. The ecological day length was calculated using the mathematical formulas in the CBM model presented in Forsythe et al. (1995) using the latitude 55.701496 (Vejle Fjord) in calculations.
To relate findings from this paper to a more extended temporal period, long-term trends of the light attenuation (Kd) within the estuary were extracted from the Danish Environmental Agency’s (EPA) monitoring program (available at kemidata.miljoeportal.dk). The EPA regularly measures light attenuation at a centrally placed station within the estuary (Figure 1), which was assumed to represent the relative temporal trends across all stations. Light attenuation was calculated as a growth season mean (n = 5 - 18) for each year in the period 1999 - 2023.
2.6 Estimation of net shoot production
The ECI was estimated using a modification of photosynthesis-irradiance (P-I) curves (Drew, 1979). Net shoot production was used as a proxy for net primary production and correlated with direct irradiance measurements. Shoot production (% d-1) was calculated between each monitoring date for each transplant group and treated as individual samples using Equation 2:
With shootinitial being the shoot count in the previous monitoring, Shootn being the shoot count in the following monitoring, and Time(ndays) being the number of days between the initial and following monitoring. To prevent excessive hysteresis in the dataset, shoot densities with an Shootinitial< 5 were omitted from production estimates. Throughout the growth season, this procedure yielded a high sample size for each station (n = 21 – 140), which was combined with average PAR measurements within the same monitoring intervals and used to model the PAR-shoot production relationship and calculate growth season ECI.
Shoot mortality and stunted growth are common initially following transplantation due to the associated stress of handling PUs (Lange et al., 2022; Flindt et al., 2024). Consequently, data from before the 27th of June 2023 was excluded, as shoot mortality and stunted growth were artifacts of handling stress, irrespective of planting depth and irradiance. Similarly, data after the 20th of October 2023 was excluded due to a 100-year storm surge, resulting in high shoot losses, predominantly in shallow transplants.
2.7 Modelling of the PAR-shoot production relationship
To estimate the ECI and how shoot production responded to PAR and whether this response varied across sites, we applied Bayesian hierarchical regression models fitted with the brms package in R. A linear relationship between shoot production and irradiance was assumed, as the experiment was conducted in the light-limited region (Drew, 1979; Lee et al., 2007). If treatments with higher light availability had been present, a hyperbolic function with saturation kinetics would have been expected (Olesen and Sand-Jensen, 1993; Flindt et al., 2024).
In the model, we assumed Gaussian-distributed errors and ran the models using four chains with 4,000 iterations (1,000 warm-up). The model included a nested random effects structure, with replicate measurements grouped within sites. This accounted for the non-independence of observations within sites and allowed the model to partition variation between site-level and replicate-level effects correctly. The hierarchical framework enabled partial pooling of site-level parameters, such as intercepts and slopes, by estimating their variation across sites. This approach improved inference as sample sizes varied, allowing information to be shared across sites to stabilize parameter estimates.
Two variations of the model were set up and tested using model comparison methods to assess performance and identify the simplest model according to the principle of parsimony. In model 1, both the intercept (baseline shoot production) and slope (shoot production response to PAR) were allowed to vary by site:
Model 2 was simpler and assumed the shoot production-PAR relationship was equal across all sites while allowing the intercepts to vary, thereby reducing the number of site-specific parameters:
For both models, to determine whether the timing of measurements influenced shoot production, we included the midpoint of the measurement period (expressed as Julian day) as an additional covariate. We evaluated whether it improved model performance and whether the estimated effect was biologically meaningful (i.e. non-zero with credible support). As an additional check, leave-one-out cross-validation (LOO) was used to assess whether including timing of measurements improved predictive accuracy. This approach revealed that including the timing of measurements in the model reduced model quality. Consequently, this covariate was not included in the final models to obtain the study results.
The two models were compared using LOO. The LOO method revealed that the difference in expected log predictive density (ELPD) between the two models was minimal (ΔELPD = –0.7, SE = 2.0), indicating that the simpler shared-slope model 2 performed just as well as the more complex model 1. Given the lack of a meaningful difference in predictive accuracy, along with clearly similar slopes (Supplementary Figure 1), model 2 was chosen on the grounds of parsimony. Model 2 was fitted using both PAR measured as integrated daily irradiance (E m-2 d-1) (presented as main results) and average PAR irradiance (µE m-2 s-1) during the ecological day length (presented in Supplementary Figure 3-Supplementary Figure 4).
2.8 Calculation of site-specific ECI
The ECI was calculated for each site using the x-intercept of model 2 (Shared slope, varying intercepts), which defines the level of PAR at which net shoot production crosses zero. The intercept was calculated by first computing each site’s total intercept by adding the global fixed intercept to that site’s random intercept. The x-intercept (ECI) was then calculated using the shared slope. Intercepts and slope are shown in Table 3:
Table 3
| Slope (95% CI) | 0.43 (0.33; 0.52) | |
| Fixed Intercept (95% CI) | -2.21 (-3.84; -0.66) | |
| Station | Random Intercept (95% CI) | Total Intercept |
|---|---|---|
| Bybæk | -2.00 (-3.75; -0.45) | -4.21 |
| Andkær Vig | 0.39 (-1.12; 1.97) | -1.82 |
| Sellerup | -0.46 (-2.03; 1.12) | -2.67 |
| Trelde | 0.91 (-0.61; 2.48) | -1.30 |
| Træskohage | 1.10 (-0.42; 2.68) | -1.11 |
Results of Model 2 (shared-slope), including estimates of slope (95% Credible Interval), global fixed intercept (95% Credible Interval), and station-specific Random Intercepts (95% Credible Interval) with associated Total Intercept.
The ECIs were used for cross-site comparisons. Furthermore, the functional depth limits for each station were estimated by applying the estimated ECI to the averaged growth season PAR.
2.9 ECI as a function of environmental parameters
To investigate how ECI is affected by environmental parameters, in this instance, eutrophication, we extracted environmental information using a High-definition mechanistic Mike3D model (Erichsen et al., 2017) developed for Vejle Fjord. As nutrient-derived stressors are the main limitation for eelgrass growth in Vejle Fjord, environmental parameters related to eutrophication level were extracted. Growth season average concentrations of Dissolved Inorganic Nitrogen (DIN), Total-Nitrogen (TN), and maximal growth season biomass of opportunistic macroalgae (g C m-2) were extracted. These parameters were extracted from calculation cells with depths similar to the depth gradient at each station. The model is calibrated against EPA data and validated through field measurement from Vejle Fjord. The model run spans the period from 2007 to 2016, with data extracted from the final year, 2016.
The relationship between ECI and each of the eutrophication parameters was assumed to follow an exponential relationship, as nutrients exponentially decrease with increasing distance to the nutrient source. Furthermore, using a “best-fit” approach, an exponential relationship overall proved to be most suitable. It should be noted that as only five distinct values of ECI were estimated, no meaningful statistics could be performed on the relationships. Nevertheless, these were included to highlight how stressors likely altered the ECI.
3 Results
3.1 Environmental conditions
Continuous measurements of PAR revealed high temporal variability in benthic PAR and Kd (Figure 3; Supplementary Figure 5). Unsurprisingly, the available PAR was contingent on the ecological day length and was drastically reduced through the fall until the end of the monitoring period in October. At each station, the temporal variability of PAR was similar across depths and displayed an exponential decay as depth increased. Relative to depth, the benthic PAR increased as the distance to the primary nutrient source increased, with the innermost station Bybæk, having the lowest PAR relative to depth (Figure 3). In contrast, the northern outermost station, Træskohage, had the lowest Kd value throughout the monitoring period with the highest PAR relative to depth (Figure 3; Supplementary Figure 5). Light attenuation extracted from the EPA revealed that Kd within the estuary was relatively stable in the period 2011-2022, with average Kd values in the range of 0.38-0.49. In 2023, the last year of the experiment, a sharp increase in Kd to 0.55 was measured, the highest Kd since 2002 (Supplementary Figure 6).
Figure 3
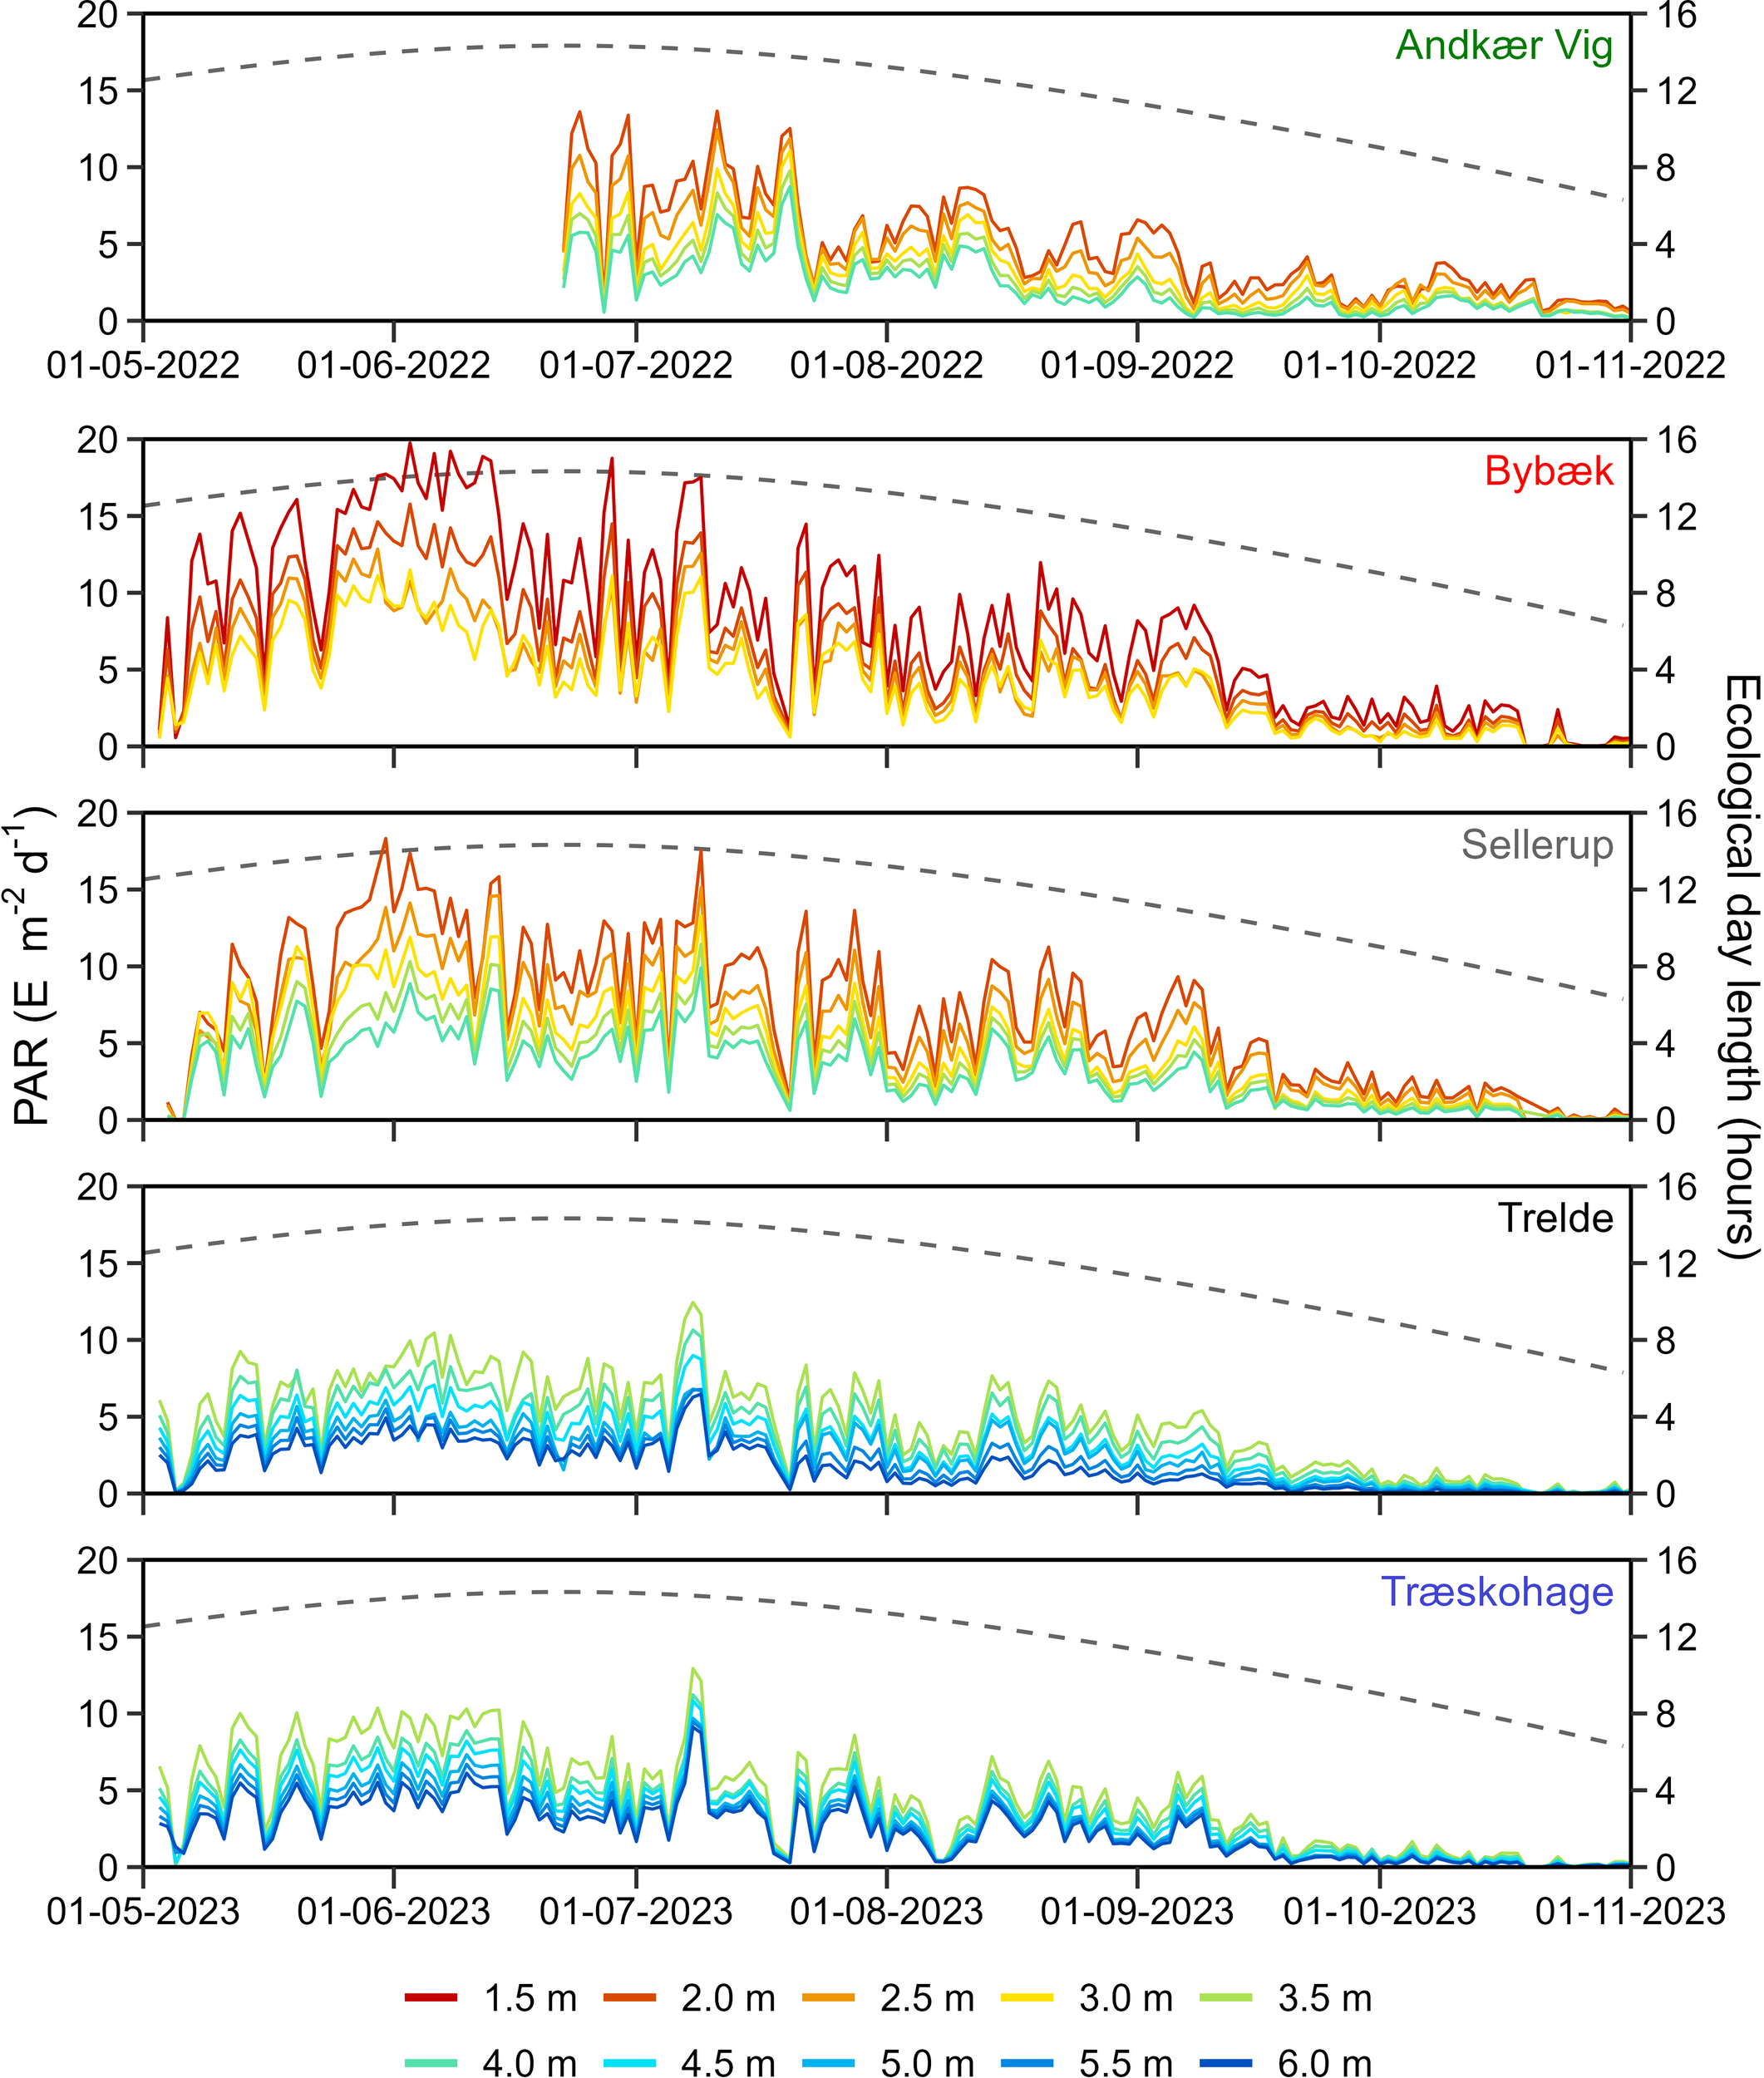
Temporal development in daily integrated PAR (E m-2 d-1) at each depth and station (Left y-axis). The ecological day length (hours) is shown as a dashed line (right y-axis).
Temperatures during the monitoring period ranged from 7.2 to 21.0°C in 2023 and 12.2 to 22.1°C in 2022, as the colder late spring and early summer period was not included in the 2022 measurements. Temperatures were similar across stations, with mean daily temperature differences of less than 2°C at 84% of the measured days. Similarly, temperature differences across depths within each station were also similar, with variations of less than 2°C being measured during 85-99% of the monitoring period, depending on the station (Supplementary Figure 7).
3.2 Transplant development
All transplants in 2023 displayed a decline in shoot numbers until the end of June, irrespective of depth, after which clear distinctions in growth patterns emerged. This initial decline was not observed in transplants established in 2022. Furthermore, in 2023, at the end of the growth season, a large decline in shoot numbers was observed at all stations, especially at the outermost stations, Trelde and Træskohage (Figure 4). This decline was caused by a 100-year storm surge affecting the estuary from the east with the longest possible fetch.
Figure 4
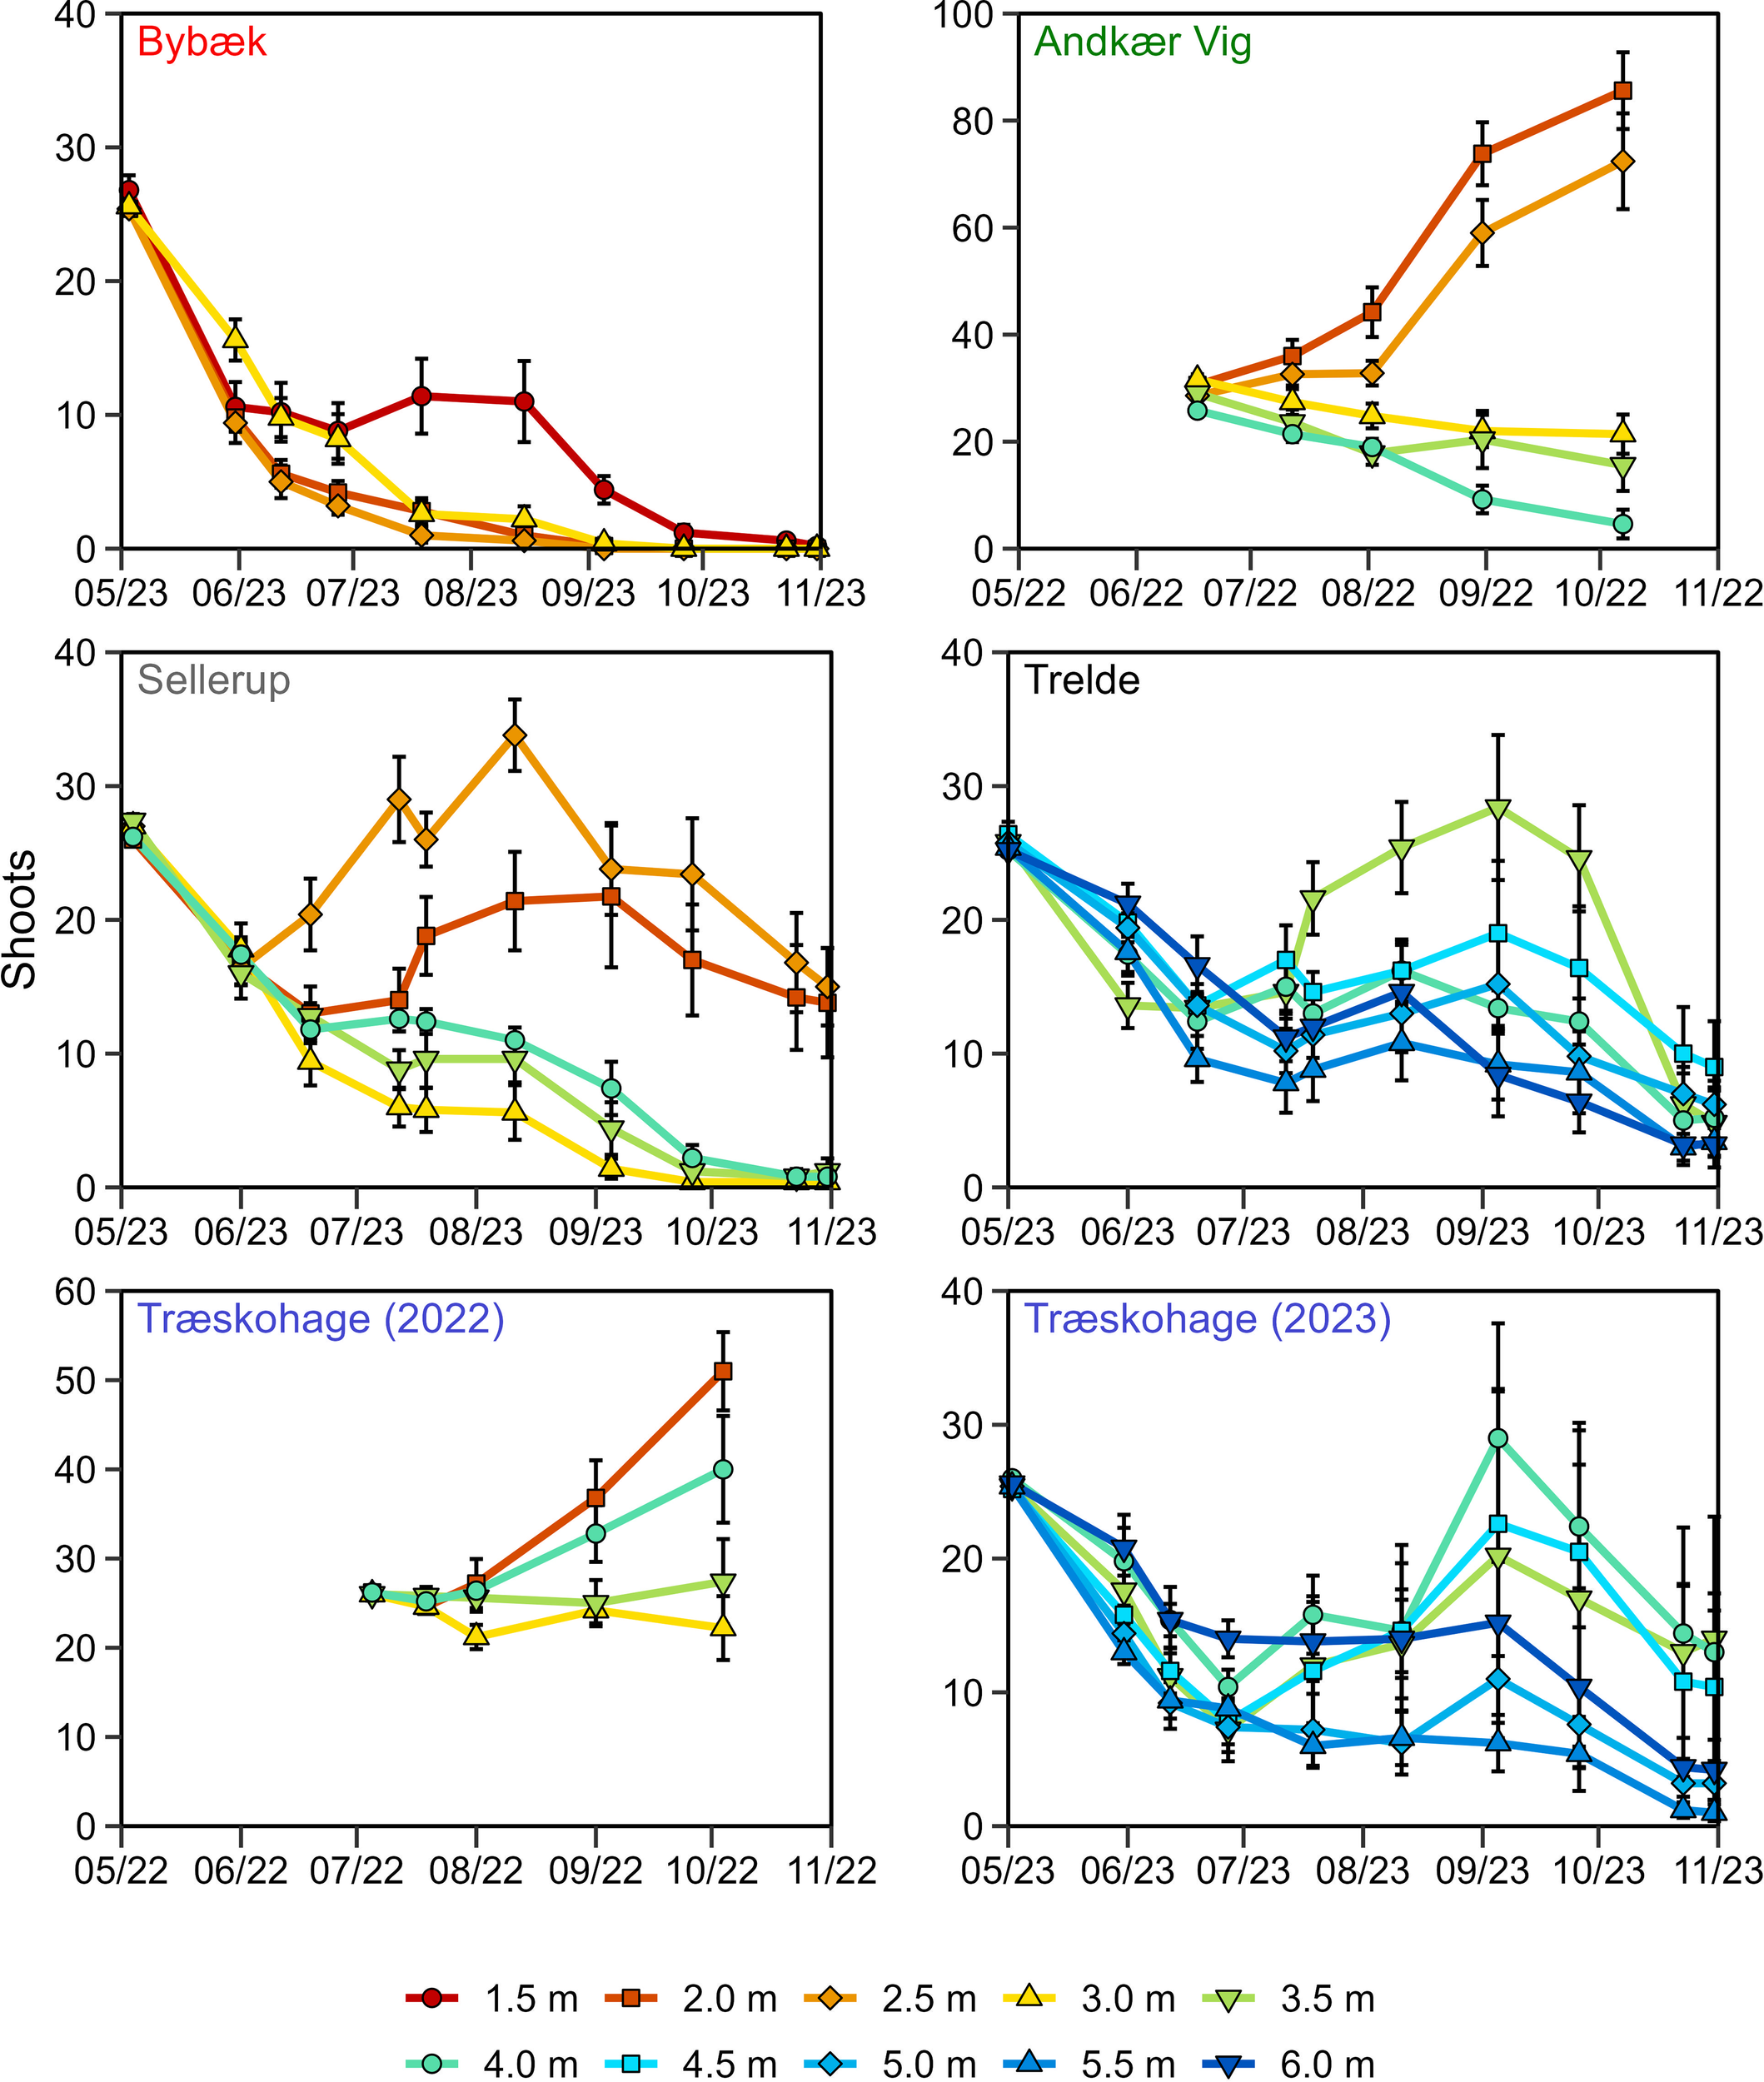
Temporal development of average shoot numbers within transplant groups (± SE) at each depth and station.
Transplants achieved shoot production at deeper depths in the outer parts of the estuary than in the inner, more eutrophic stations. The innermost station, Bybæk, could not support shoot production except at the shallowest depth, 1.5 m, during the peak growth season. Both Andkær Vig and Sellerup displayed a clear distinction in depth limit, with transplants deeper than 2.5 m unable to sustain net shoot production (Figure 4).
The outermost least eutrophic stations displayed a higher variation in shoot production across depths. At the southern station Trelde, most depths displayed shoot production during the peak growth season in July – September, with the most marked increase in shoots at the shallowest 3.5 m depth. The remaining depths displayed variations in shoot production patterns, as 4.5 m displayed a higher production than 4.0 m. Likewise, shoot production was higher at 6.0 m compared to 5.5 m. Transplants from 2022 at the northern station Træskohage displayed high shoot production at 2.0 m and 4.0 m, while intermediate depths displayed no production during the same period. Similar patterns of shoot production were observed at the same station in 2023, with the highest production recorded at 4.0 m and 4.5 m, while 3.5 m displayed shoot production albeit at a lower rate. Shoot production was also observed at 6.0 m depth, while 5.0 and 5.5 m displayed little or no shoot production (Figure 4).
3.3 Estimated ECIs and depth limits
The highest ECI of 9.8 E m-2 d-1 was found at the most eutrophic station, Bybæk, followed by Sellerup, with an ECI of 6.2 E m-2 d-1 (Figure 5). The ECI at Andkær Vig in 2022 was intermediate at 4.2 E m-2 d-1, which was lower than Sellerup but higher than the outer least eutrophic stations. The two outermost stations, Trelde and Træskohage, had the lowest ECIs of 3.0 and 2.6 E m-2 d-1, respectively. Similar patterns were observed when the ECI was determined based on the average PAR during the Ecological day length (Table 4, Supplementary Figure 3).
Figure 5
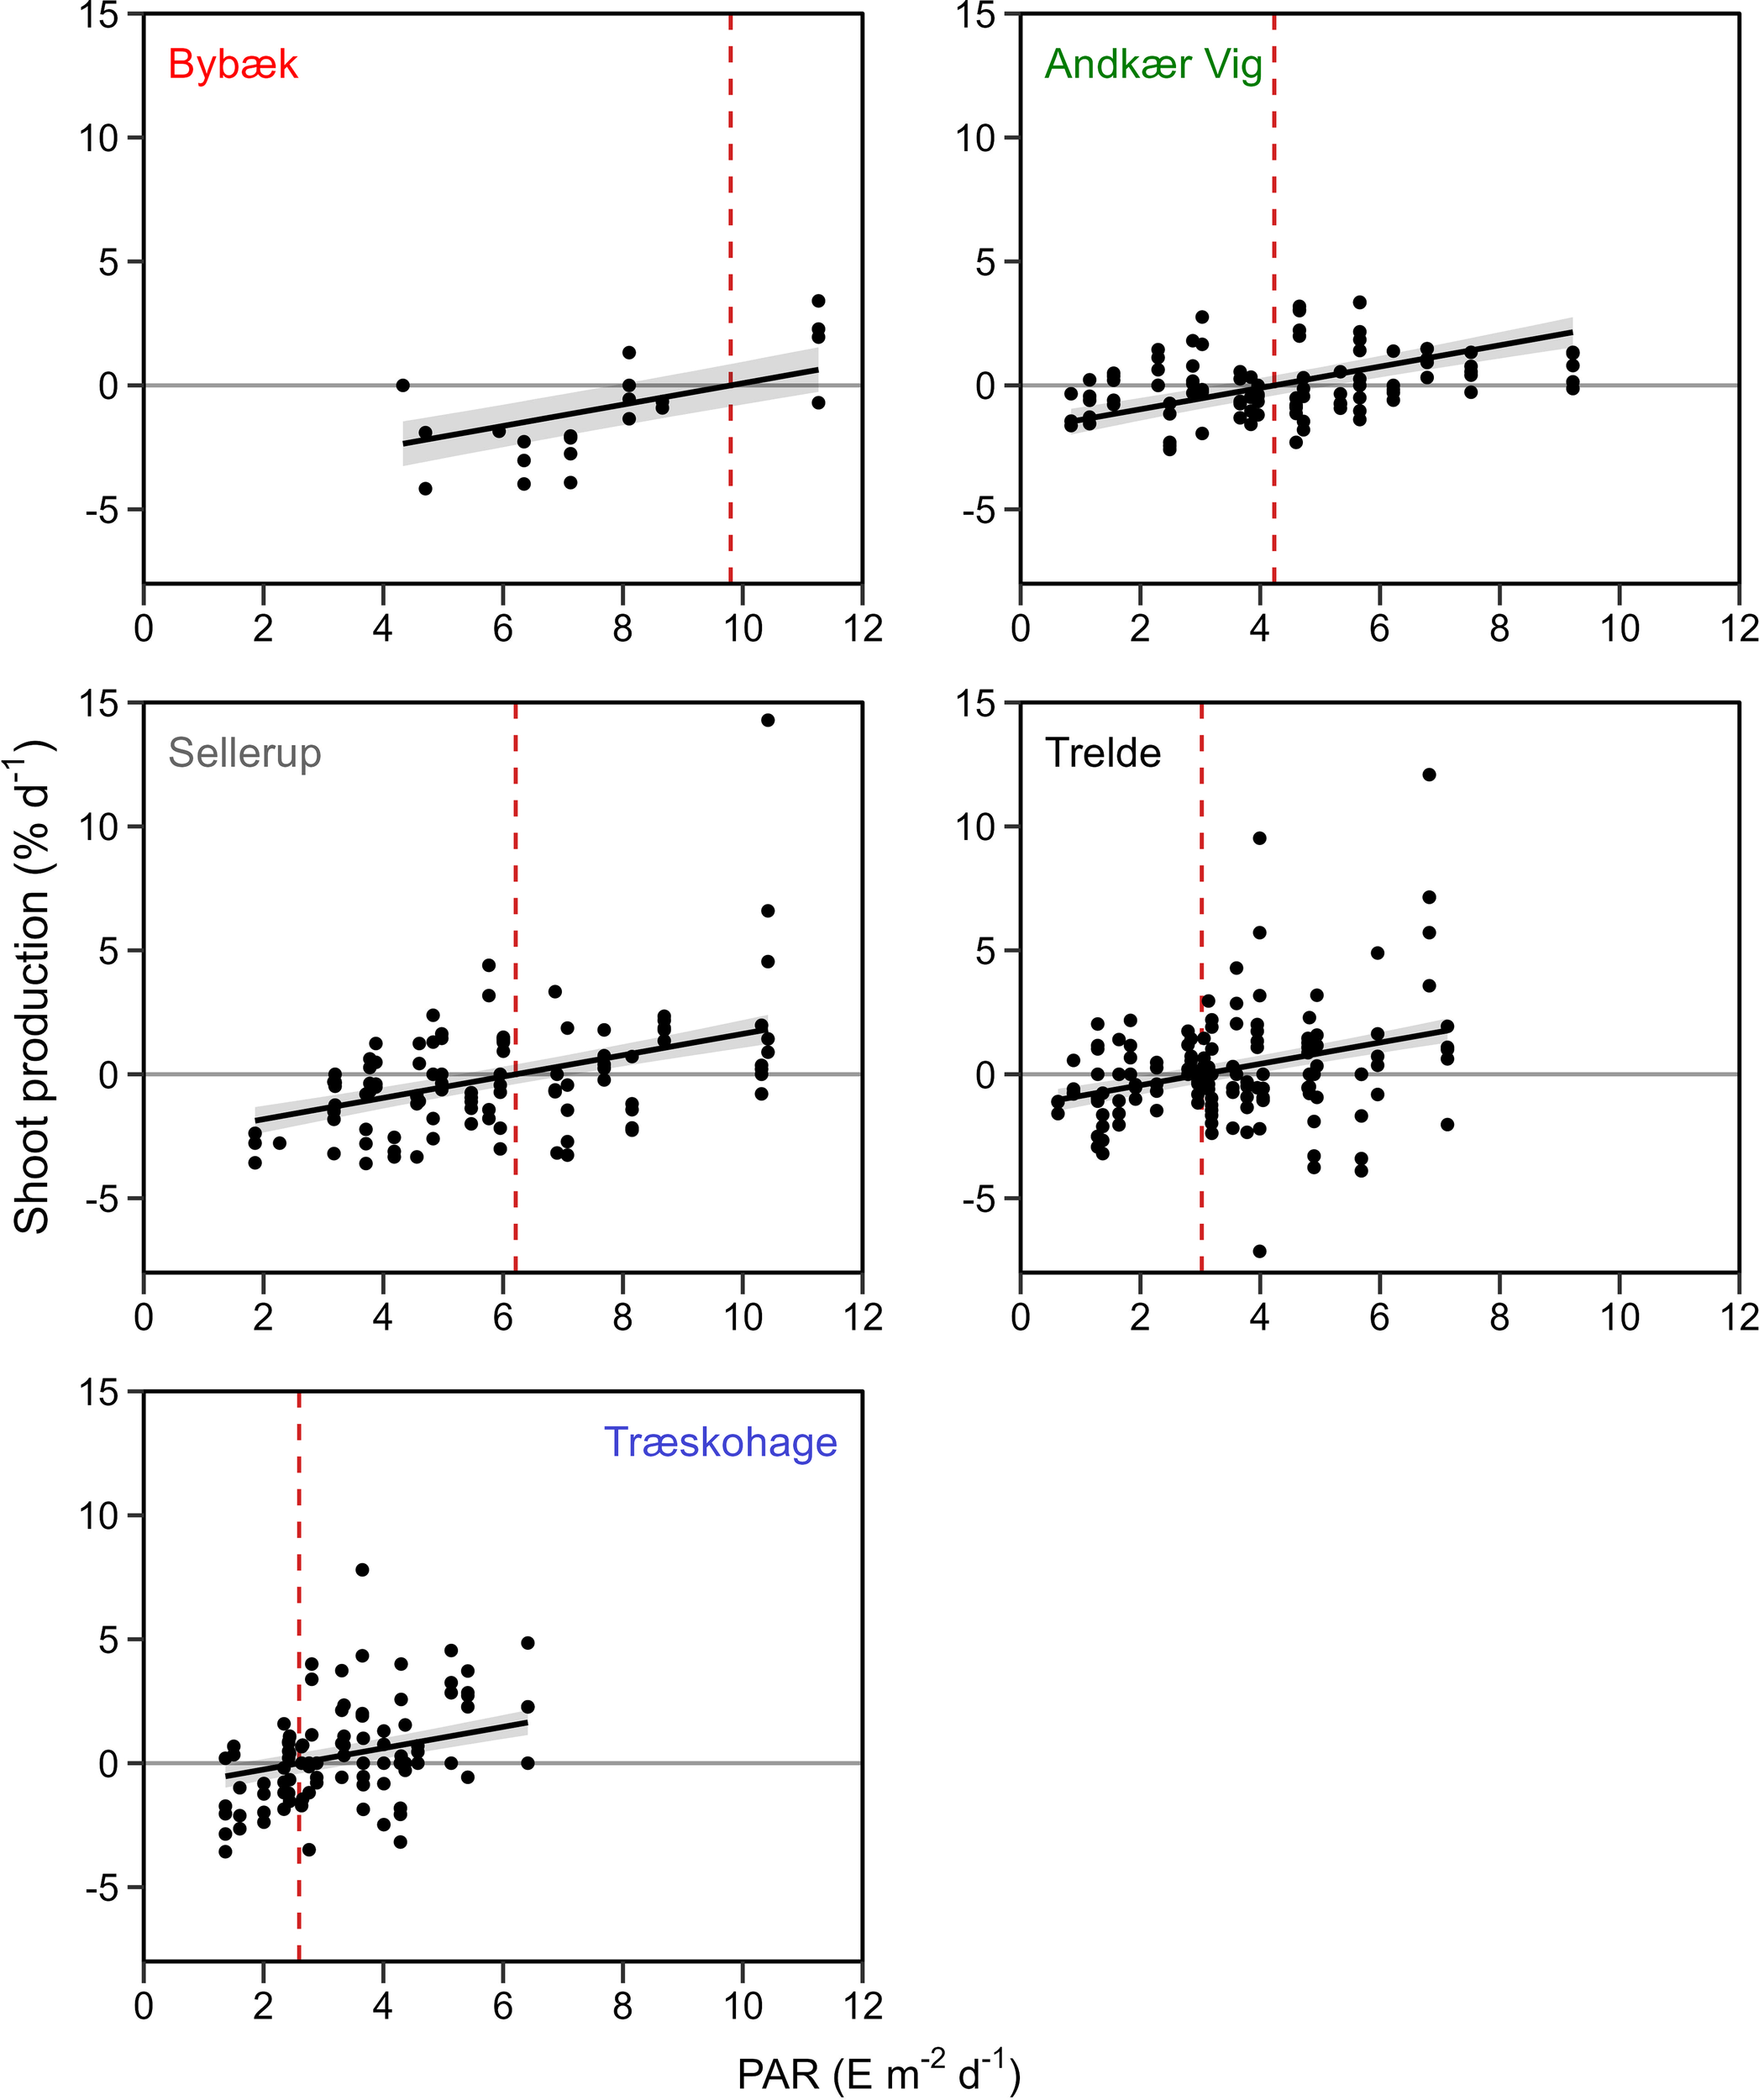
Shoot production-irradiance curves displaying shoot production (% d-1) as a function of PAR (E m-2 d-1) at the five stations. ECI is calculated as the regression x-intercept (dashed line). 95% Credible Interval displayed as shaded area.
Table 4
| Station | Distance from Nutrient source (km) | ECI | |
|---|---|---|---|
| Daily integrated (E m-2 d-1) | Ecological day length (µE m-2 s-1) | ||
| Bybæk | 1.9 | 9.8 | 199 |
| Andkær Vig | 5.6 | 4.2 | 88 |
| Sellerup | 8.7 | 6.2 | 127 |
| Trelde | 16.4 | 3.0 | 64 |
| Træskohage | 13.1 | 2.6 | 58 |
Distance from the primary nutrient source (Vejle Stream) to estuarine stations and estimated growth-season ECI at the investigated stations.
The ECI was estimated using both the Daily Integrated PAR (E m-2 d-1) and average PAR during the ecological day length (µE m-2 s-1).
The ECI and growth season average PAR was used to estimate the functional depth limits (Figure 6). The depth limits were concurrently affected by an increase in available PAR and a decrease in the ECI as the distance to the nutrient source increased. Combined, this resulted in a steep gradient of the depth limit along the eutrophication gradient, with the lowest depth limit of 1.1 m at Bybæk, followed by 2.3 m at both Andkær Vig and Sellerup. In contrast, the outermost southern station, Trelde, had an estimated depth limit of 4.7 m, while the northernmost and least eutrophic station, Træskohage, had a depth limit of 5.6 m.
Figure 6
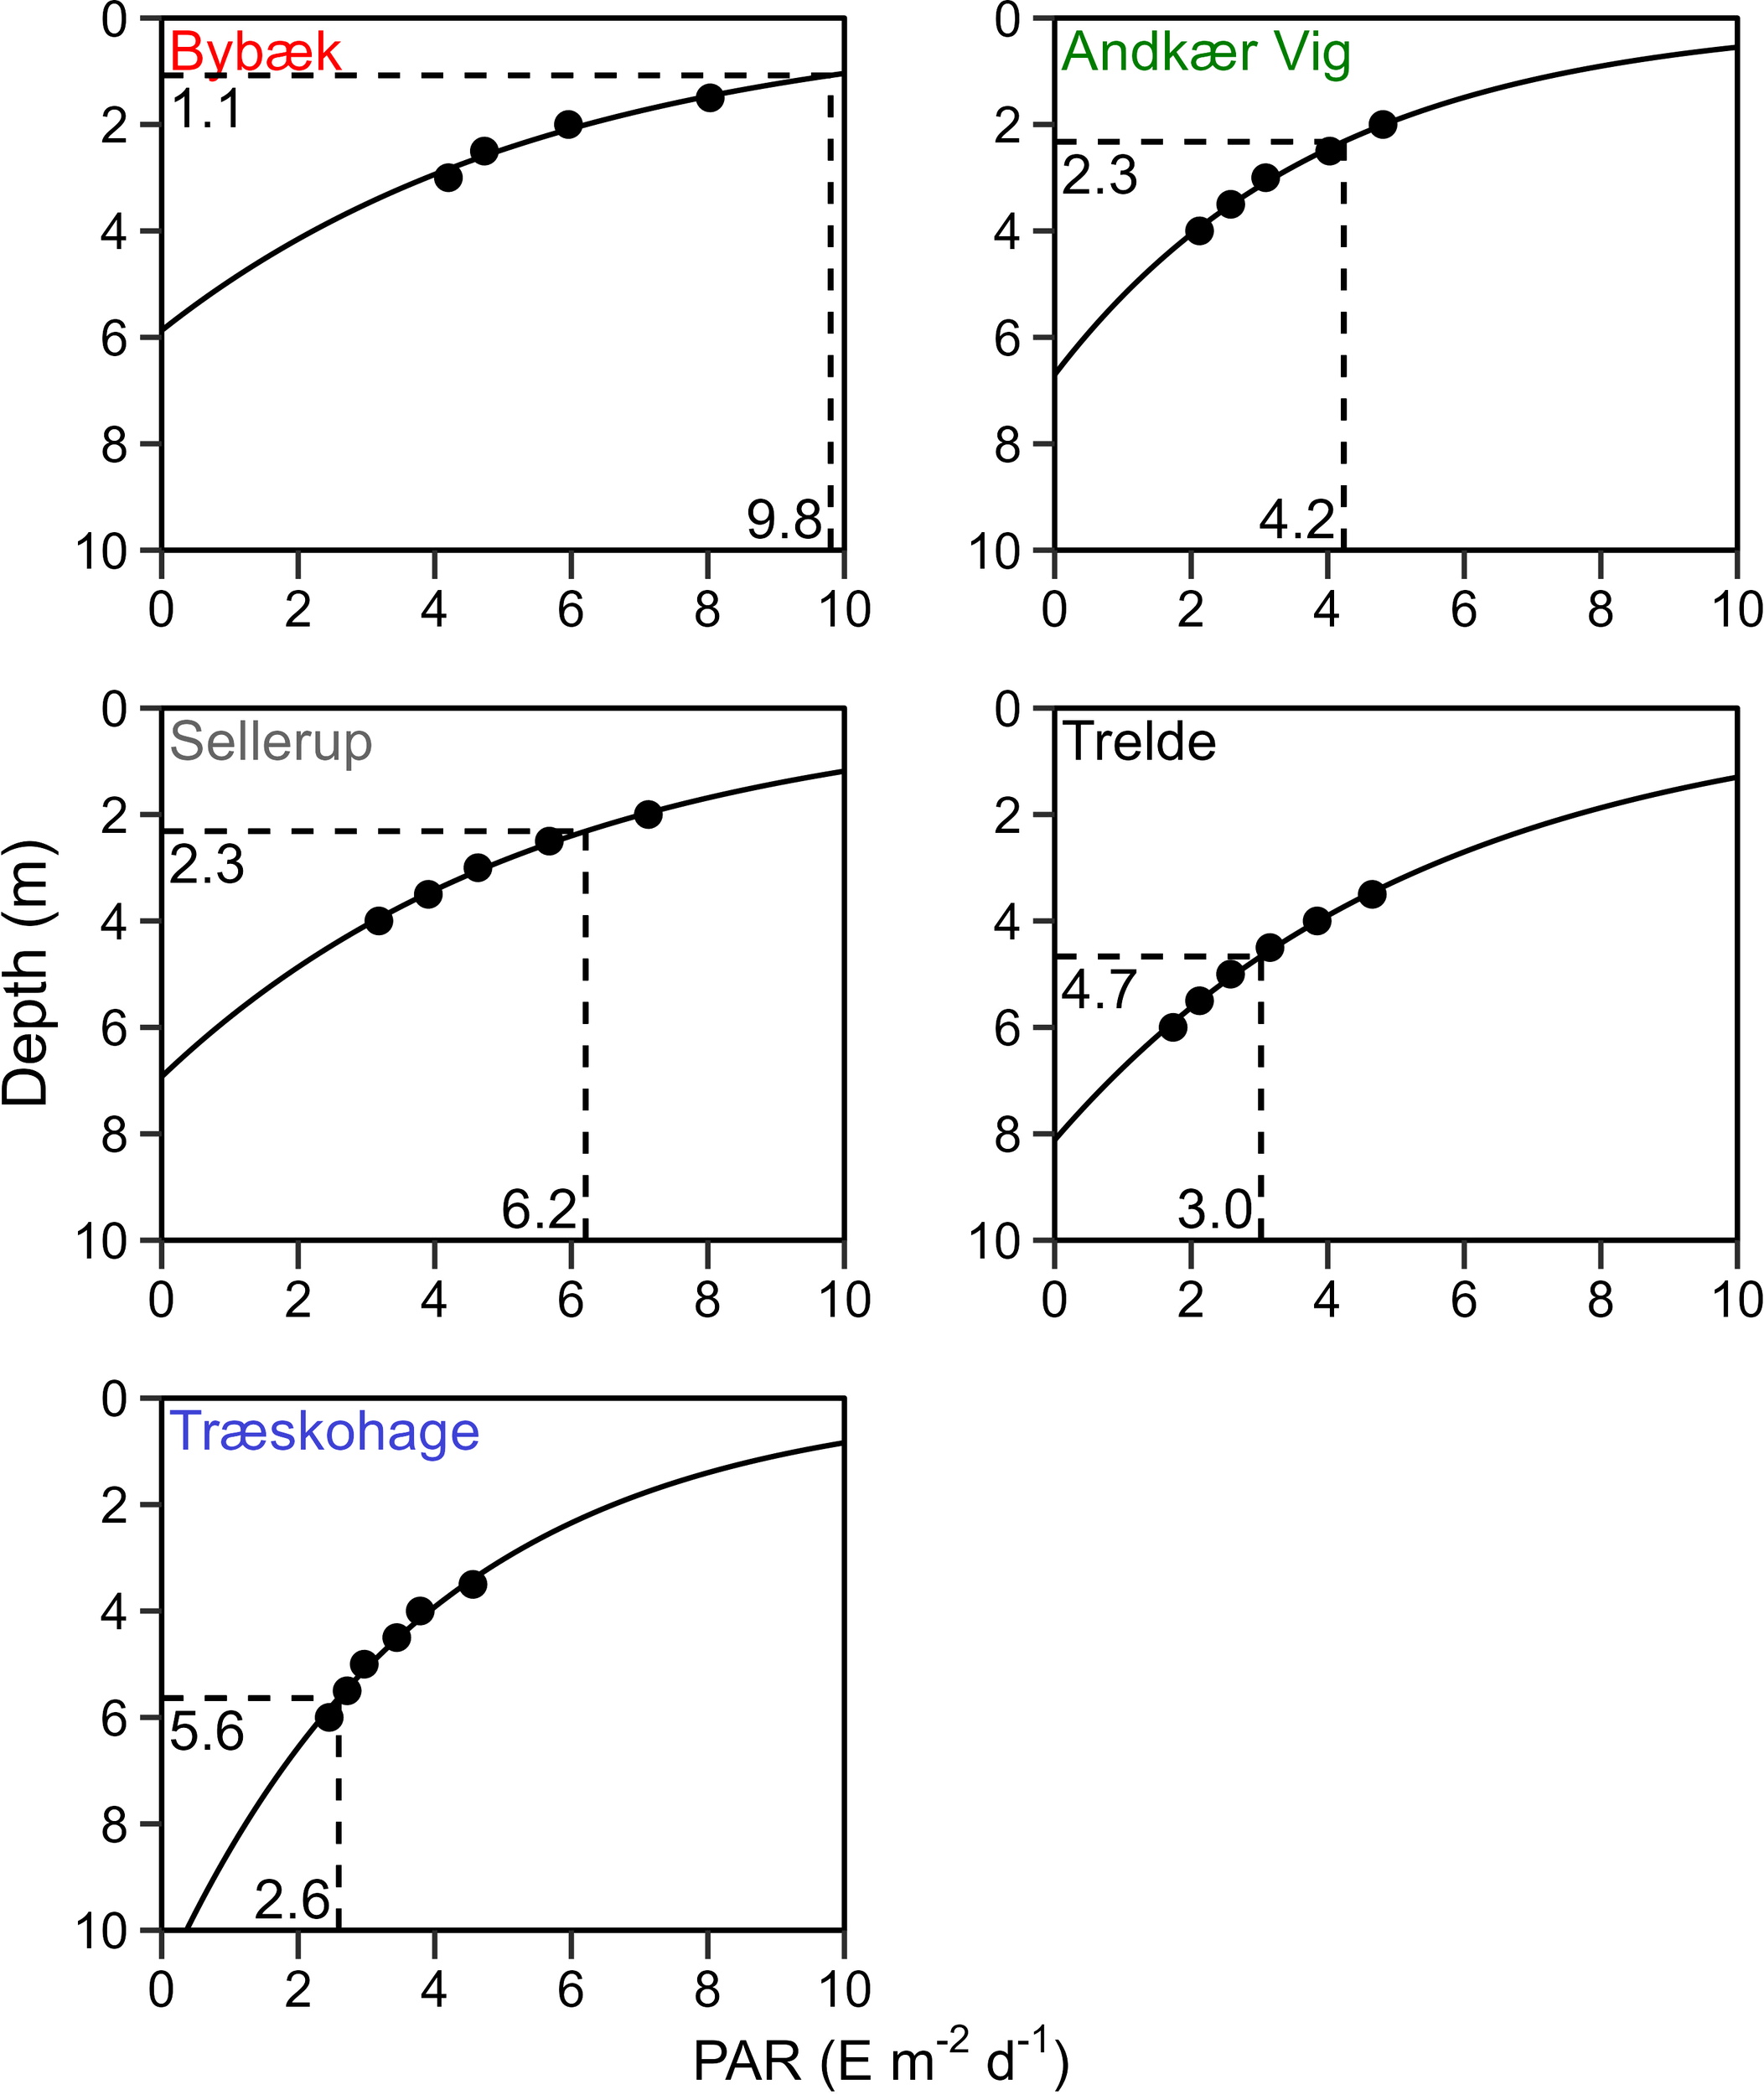
Depth (m) as a function of growth season average PAR (E m-2 d-1) at each station. Estimated ECI and corresponding depth limit are highlighted.
The ECI responded distinctly along the eutrophication gradient and decreased as the distance to the primary nutrient source increased (Figure 7A). The ECI increased as the growth season average biomass of opportunistic macroalgae, water column TN, and DIN increased (Figure 7B–D). The relationship between ECI and growth season average DIN (Figure 7D) had a clustering of datapoints at low DIN concentrations resulting from DIN uptake in phytoplankton (TN) and opportunistic macroalgae during the growth season, which effectively reduced DIN at all stations except for the innermost station Bybæk.
Figure 7
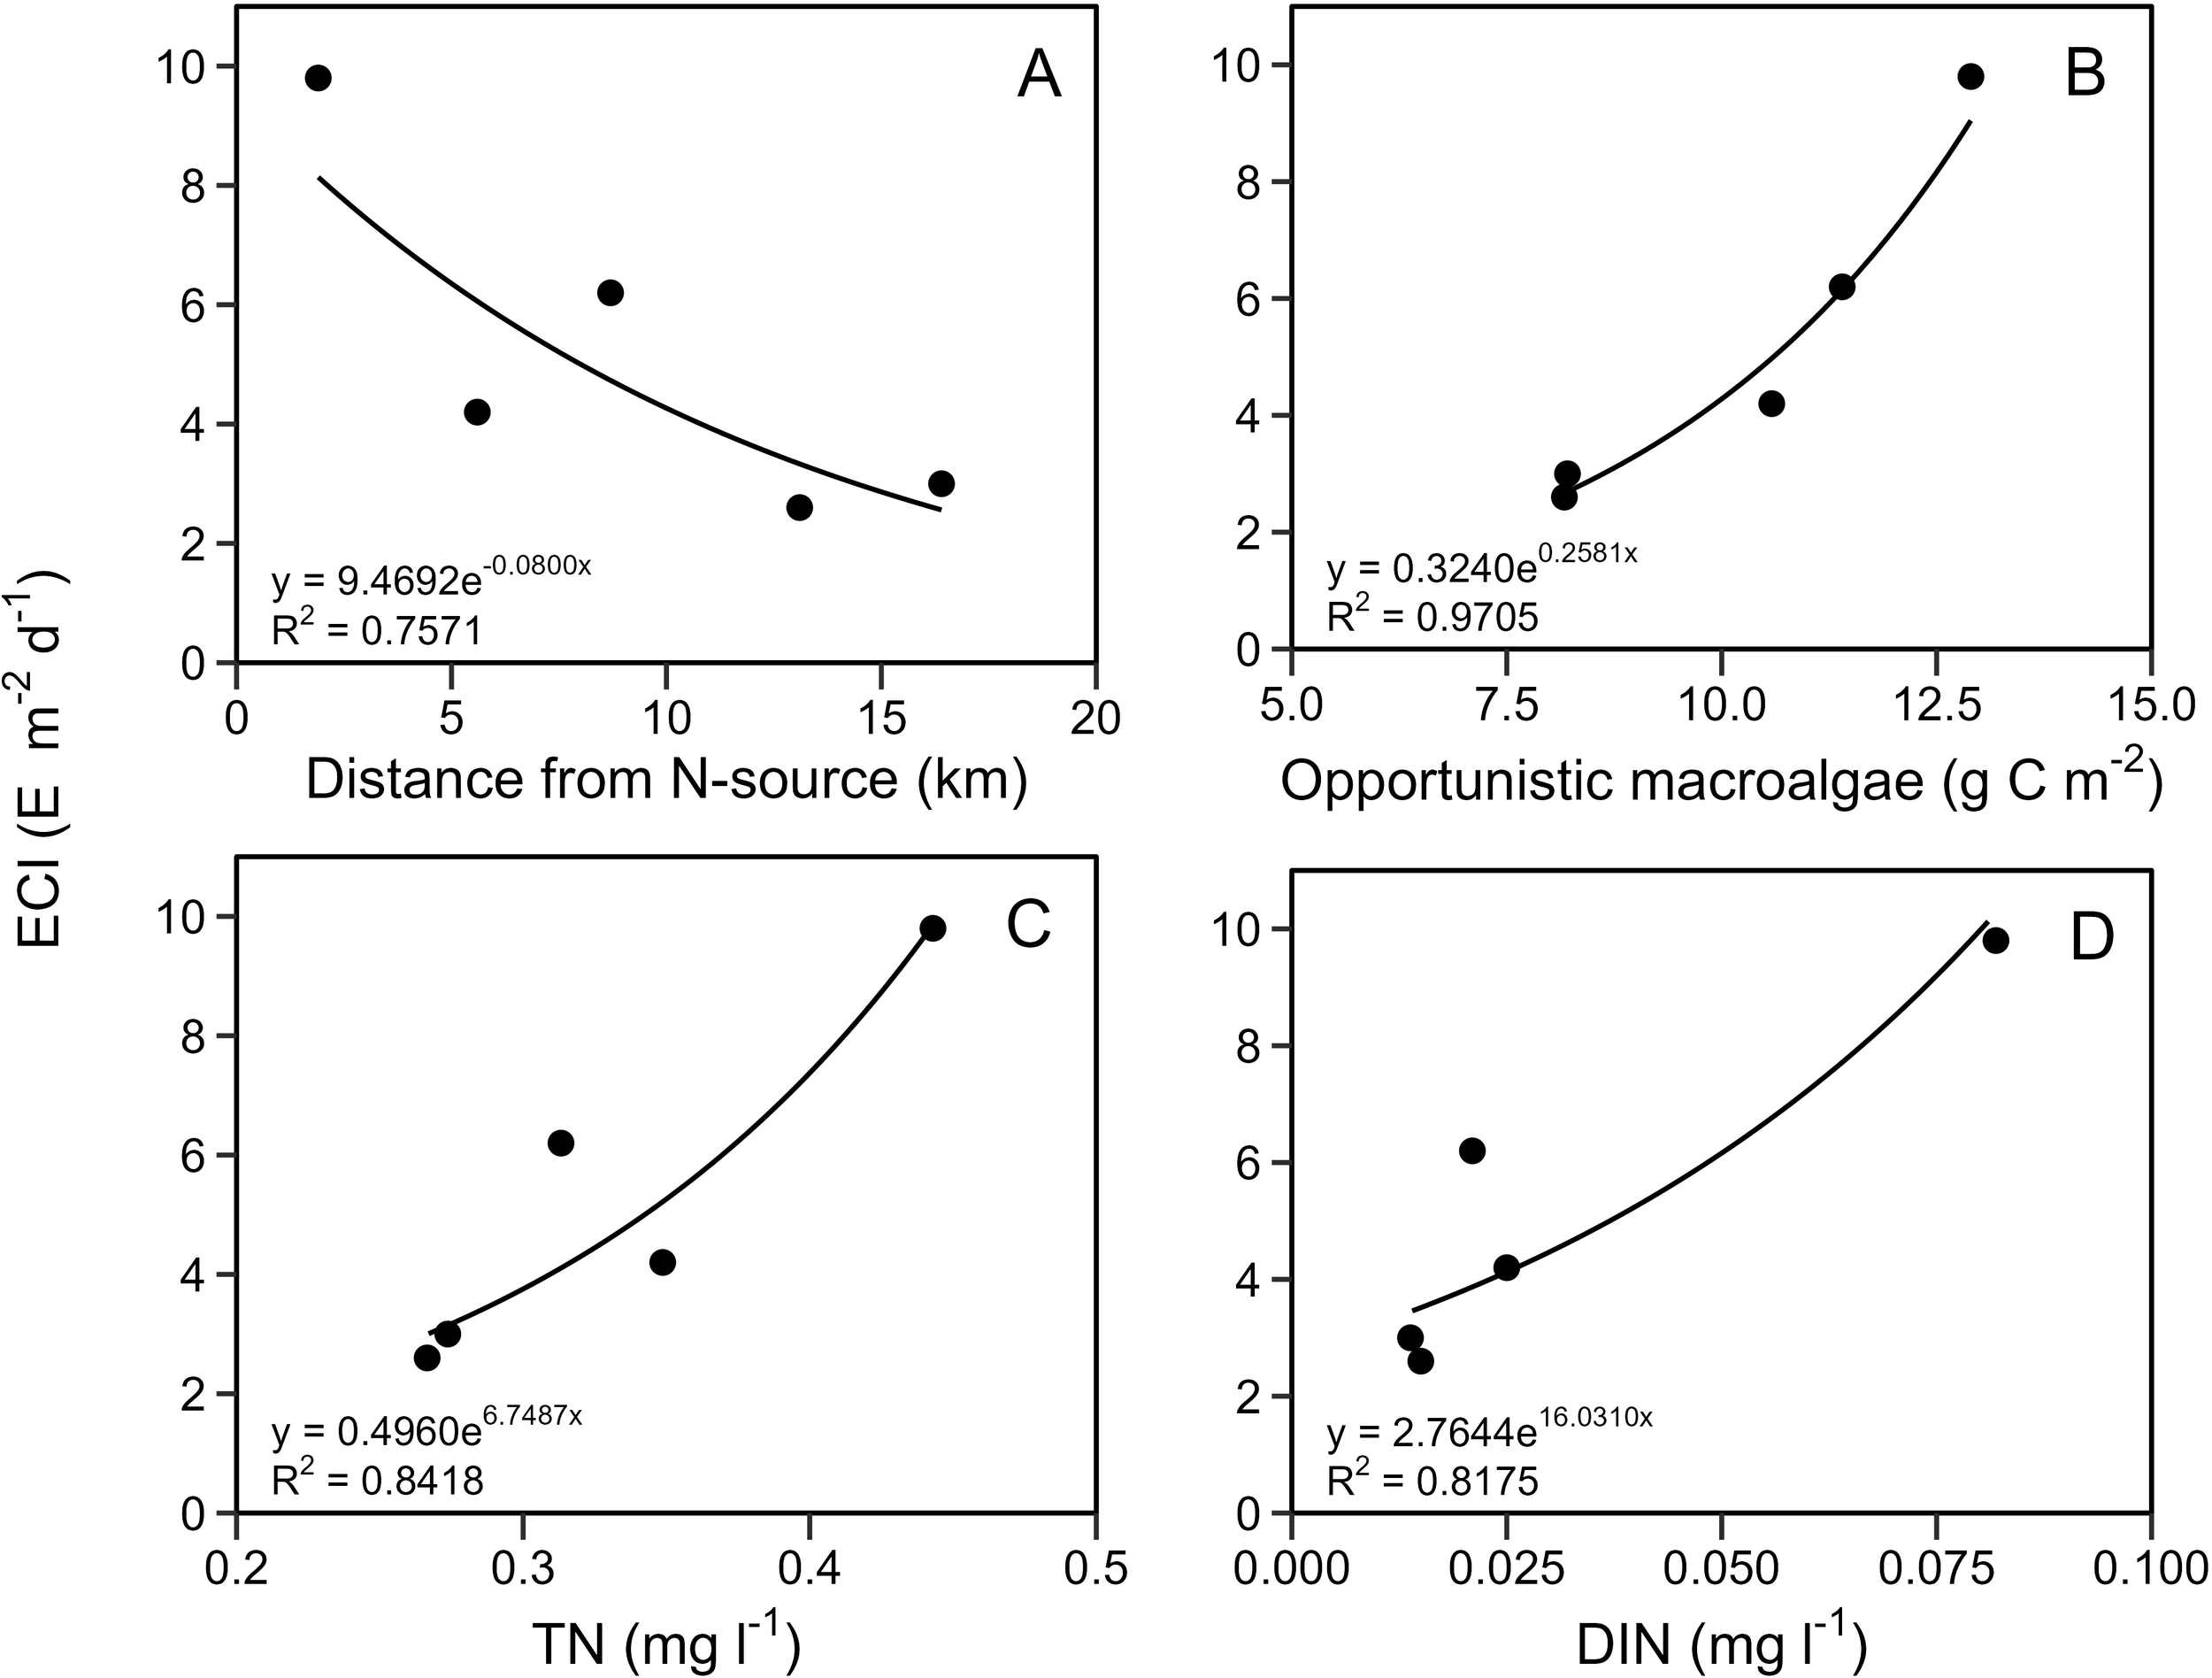
ECI (E m-2 d-1) as a function of (A) Distance from the primary N-source (km), Vejle Stream, (B) Max growth season biomass of opportunistic macroalgae (g C m-2), (C) Growth season average TN (mg l-1) and (D) Growth season average DIN (mg l-1).
4 Discussion
Using a novel in-situ approach, we identified variable ECIs for eelgrass transplants along a eutrophication gradient. The ECIs of the investigated stations ranged from 2.6 to 9.8 E m-2 d-1, decreasing as the distance to the primary nutrient source increased and eutrophication was alleviated. This confirms the findings of previous studies that the ECI varies according to the local environment (Kenworthy and Fonseca, 1996; Krause-Jensen et al., 2011; Kenworthy et al., 2014). Furthermore, the results highlight that eutrophication reduces the depth limits of rooted macrophytes by reducing benthic irradiance availability while simultaneously increasing demand, likely to compensate for nutrient-derived stressors. The identification of the ECI allowed estimates of functional depth limits with implications for habitat suitability assessment before undertaking restoration efforts.
The identified ECIs resemble previous estimates of the compensation points (Olesen and Sand-Jensen, 1993; Thom et al., 2008; Staehr and Borum, 2011; Benson et al., 2013; Leger-Daigle et al., 2022), though at the high end of most estimates. In comparison, another study conducted in Denmark (Olesen and Sand-Jensen, 1993) found comparably low compensation points for eelgrass in the interval 1.07 – 2.72 E m-2 d-1, depending on the season. As with many previous studies (Olesen and Sand-Jensen, 1993; Staehr and Borum, 2011; Leger-Daigle et al., 2022), these estimates were determined ex-situ, focusing on physiological irradiance requirements. Consequently, the compensation points in these studies reflect close-to-ideal conditions without the interference of environmental stressors. In contrast, the findings in this study reflect the compensation irradiance in situ under the influence of environmental stressors at which net shoot production can be achieved.
4.1 Variable ECI
Environmental stressors in Vejle Fjord are primarily nutrient-derived. Increased growth of phytoplankton (Nielsen et al., 2002b; Hauxwell et al., 2003; Burkholder et al., 2007), combined with increased turbidity from elevated resuspension frequencies (Burkholder et al., 2007; Flindt et al., 2022) have resulted in diminished benthic irradiance, especially as the distance to the nutrient source is reduced, as shown within this study. Additionally, eutrophication has led to numerous other stressors, including a higher prevalence of shading by opportunistic macroalgae and epiphytes in the inner parts of the estuary.
The apparent relationship between ECI and opportunistic macroalgae and TN found within this study supports that nutrient-derived stressors control the ECI. It must be emphasized that opportunistic macroalgae and TN here assumably act as proxies for the multiple stressors that negatively affect the transplants during eutrophication (Flindt et al., 2024). The direct shading effect of epiphytes and opportunistic macroalgae results in a higher ECI as the irradiance availability for photosynthesis is drastically reduced (Brush and Nixon, 2002; Rasmussen et al., 2012; Brodersen et al., 2015). Additionally, opportunistic macroalgae and epiphytes might also induce more indirect effects through the impedance of mass transfer and thermal stress within the phyllosphere (Brodersen and Kuhl, 2022). In Vejle Fjord, eutrophication has further resulted in a higher prevalence of hypoxia in the inner parts of the estuary (Supplementary Figure 8), likely resulting in increased energy demand of the eelgrass to compensate for such stress (Hasler-Sheetal et al., 2015). Further, degraded sediment conditions along the same gradient might affect the energy demand and ECI of the eelgrass (Krause-Jensen et al., 2011; Kenworthy et al., 2014). Degraded sediment conditions can affect net growth through multiple processes, including higher resuspension frequency, creating more frequent settlement of particles on the leaves, thereby limiting light and mass transfer (Brodersen et al., 2017), the low anchoring capacity of the sediment (Flindt et al., 2024), or increased concentration and intrusion of toxic compounds like sulfide (Pedersen et al., 2004; Krause-Jensen et al., 2011). As environmental stressors display a high temporal variability and often act concurrently, it was impossible to isolate the individual stressor’s effect on the ECI. Nevertheless, the distinct gradient in the ECI implies that it acts as an integral of the stressor prevalence during the growth season.
The station Andkær Vig interestingly displayed a lower ECI than Sellerup despite being closer to the nutrient source and more eutrophic. This might be an effect of annual variation, as Andkær Vig was established in 2022, compared to Sellerup, which was established in 2023. It might also be an effect of reduced hydrodynamic stress, as Andkær Vig is situated within a semi-enclosed embayment, drastically limiting the fetch and wave exposure compared to Sellerup. However, this cannot be confirmed by the data presented here, and it is a subject for further study.
4.2 Depth limits
The depth limits of eelgrass were controlled concurrently by PAR availability and ECI and substantially increased along the eutrophication gradient from 1.1 m in the innermost station to 4.7-5.6 m in the two outermost stations. This was expected as depth limits generally increase towards open coastal waters, with the higher exchange of marine waters lowering the turbidity (Greve and Krause-Jensen, 2005a). The PAR availability increased relative to depth as the distance to the primary nutrient source increased. The station Træskohage almost consistently displayed the highest PAR availability and lowest Kd-values throughout the experimental period. However, while Træskohage is not the outermost station in terms of direct distance (Figure 1; Table 1), it is in correspondence with Træskohage being the least eutrophic station as most of the marine water enters the estuary along the northern coastline, resulting in less eutrophic conditions.
Shoot production mostly corresponded with the estimated depth limits using ECI and growth season PAR availability. Interestingly, the estimated depth limit at the station Andkær Vig suggests that net shoot production cannot be sustained deeper than 2.3 m; however, shoot production within the first season was observed at 2.5 m. Subsequent visits to the study site two years later revealed a complete shoot loss at 2.5 m, suggesting that the estimated depth limit was accurate. In comparison, subsequent visits to the eelgrass transplanted at the outer station Træskohage, established in 2022, revealed increased shoot densities at a 4.0 m depth within the same time interval.
According to the Danish EPA’s monitoring program, the depth limit of naturally occurring eelgrass beds within the study area is 1.7 – 3.0 m. Therefore, the deeper depth limits found in this study imply that natural recolonization at these depths is lacking or extremely slow, even though mature plants can achieve net shoot production. The long-term development in the light regime revealed that 2023 had the highest Kd in 10 years. This suggests that the prerequisites for benthic light in the last 10 years should have allowed eelgrass growth at deeper depths. Even so, no natural recolonization has occurred in deeper waters. Further, this implies that the conventional methodology to estimate the ECI by measuring irradiance at the depth limit of the eelgrass meadow (Ralph et al., 2007 and references within) is invalid in this system, as the depth limit does not represent the irradiance threshold. In such instances, an approach like the one presented in this study can be used to provide more accurate ECIs to estimate habitat suitability and restoration potential.
Natural recolonization of eelgrass is hampered within Danish waters, even at locations without light limitation, due to persistent stressors and ecological feedbacks (Valdemarsen et al., 2010, Valdemarsen et al., 2011; Flindt et al., 2024). Recolonization into deeper waters might be further limited by decreased irradiance availability as an additional stressor (Bintz and Nixon, 2001; Ochieng et al., 2010) further reducing seedling growth potential. Few studies have quantitatively estimated the irradiance requirements of seedlings (Bintz and Nixon, 2001; Ochieng et al., 2010), and no studies have, to our knowledge, comparably estimated irradiance requirements to sustain growth in mature plants. Seedlings may have an elevated irradiance requirement for growth compared to mature plants. Bintz and Nixon (2001) found retardation of vegetative production by seedlings at an irradiance of 8 E m-2 d-1 and similar results in Ochieng et al. (2010) suggest an irradiance requirement of 8.5-11.2 E m-2 d-1 for seedlings to achieve net growth. In this study, the estimated ECIs of mature plants are lower at most stations. As a result, the growth and development of seedlings into mature plants might pose a boundary limiting the recolonization potential of deeper populations.
4.3 Relevance to restoration
Identifying local seagrass ECIs can be a valuable tool for assessing habitat suitability and depth limits. Depth limits in the outer parts of the estuary were much higher than those of natural populations. As a result, large unvegetated areas are potentially suitable for restoration, even though they are not yet recolonized naturally 20–25 years after the first ~50% reduction in nitrogen runoff (Riemann et al., 2016). Deeper eelgrass beds display a higher level of stability than shallow populations (Greve and Krause-Jensen, 2005a), probably due to reduced shear stress during storm events. Consequently, restoration of deeper populations could prove beneficial, as eelgrass meadows provide multiple ecosystem functions essential to the resilience of the ecosystem (Mcglathery et al., 2007; Orth et al., 2020; Steinfurth et al., 2022) that can ensure long-term stability, helping to reduce system hysteresis.
Restoration potential is estimated through site selection procedures (Preston et al., 2021; Flindt et al., 2024), which benefit greatly from using reliable habitat suitability models (Flindt et al., 2016; Preston et al., 2021; Flindt et al., 2024). In Denmark, the model presented in Flindt et al. (2016) has been gradually improved as stressor thresholds get more accurately defined (Flindt et al., 2024). Similarly, the ECIs estimated in this study will be implemented to improve the model and allow for more accurate site selection. The identified ECIs should be applicable across locations with similar stressor prevalence and can easily be applied if irradiance measurements are available. Alternatively, benthic irradiance can readily be estimated using light attenuation and surface irradiance measurements.
The ECIs were estimated based on the transplant’s ability to produce new shoots through vegetative growth over the course of the growth season. As such, the ECIs should reflect depths at which transplants can propagate and establish. However, some locations might be subject to high rates of mortality during winter (Eriander et al., 2016) due to ice souring or prevalent storms and hydrodynamic stress. Therefore, at such locations, high rates of shoot production are needed during the first growth season to compensate for winter losses. In these instances, the ECI may provide an overestimation of the suitable restoration depth, and shallower sites with higher irradiance and, therefore, higher shoot production should be utilized. This fact emphasizes that site selection should not only rely on habitat suitability modeling but should preferably also employ small-scale restoration trials before large-scale implementation to identify potential site-specific bottlenecks (Flindt et al., 2024).
The high ECI combined with low irradiance in the inner parts of the estuary drastically limited the depth distribution and area suitable for eelgrass restoration. Reducing anthropogenic nutrient runoff is of utmost importance to increase suitable restoration areas (Flindt et al., 2016, Flindt et al., 2024). A reduction in nutrient runoff would reduce phytoplankton concentrations (Nielsen et al., 2002b; Riemann et al., 2016; Flindt et al., 2024), epiphytes, and opportunistic macroalgae biomass (Rasmussen et al., 2015), thereby increasing irradiance and the depth limit of eelgrass. However, poor conditions can persist due to degraded sediment conditions (Olesen, 1996; Valdemarsen et al., 2014; Flindt et al., 2022) and ecological feedback loops that retain stressors within the system even after reductions in nutrient runoff have been implemented (Duarte et al., 2009; Valdemarsen et al., 2010, Valdemarsen et al., 2011; Unsworth et al., 2024). This leaves the question of whether the high ECI would persist due to the continued presence of stressors and degraded ecosystem state (Kenworthy et al., 2014), thereby limiting reestablishment potential. To increase the reestablishment potential in degraded systems, concurrent implementation of other restoration measures like sand-capping could prove beneficial and has been suggested to alleviate the effects of degraded sediment conditions (Flindt et al., 2022; Oncken et al., 2022).
4.4 Limitations and future research
The approach of using net shoot production as a proxy for growth proved useful in estimating the ECI and was chosen due to the constraints of an in-situ approach, as well as facilitating frequent monitoring. However, many growth studies focus on leaf elongation, biomass measurement, or O2 exchange rates (Olesen and Sand-Jensen, 1993; Thom et al., 2008; Staehr and Borum, 2011), which provides a more precise measure of the growth achieved by individual leaves and shoots. Nonetheless, net shoot production is a highly applicable parameter for estimating the ECI, as bed stability can only be achieved if net shoot production can compensate for shoot losses. Additionally, net shoot production is essential in transplantation efforts to ensure bed density increase and expansion following restoration efforts.
Correlating growth or shoot production to irradiance is inherently limited in low-light conditions, as stored carbohydrates can sustain growth even in light-limited periods (Alcoverro et al., 1999; Silva et al., 2013; Salo et al., 2015). Consequently, sustained growth from reserves during light limitation likely added dispersal to the dataset within this study. Nevertheless, by monitoring throughout the entire growth season, the estimated ECI should reflect the average compensation irradiance encompassing light-limited periods where carbohydrates are utilized.
This experiment indicated a distinct change in ECI along the eutrophication gradient as nutrient-derived stressors were alleviated. Nevertheless, it is worth noting that only five ECIs were identified along the eutrophication gradient, and additional replicates along similar gradients would be beneficial to strengthen the correlation and predictive value of the dataset. However, given the constraints of an in-situ setup, it was not possible to achieve more replicates within the scope of this study. The distinct change in ECI suggests it acts as an integral measure of the cumulative effects of environmental stressors. However, it was impossible to elucidate the effects of the individual stressors on the ECI. Furthermore, while the stressors were primarily nutrient-derived, a hydrodynamic stressor gradient with increasing intensity towards the outer boundary of the estuary was also present, potentially affecting the ECI simultaneously. Quantification of the specific relationship between individual stressors and the ECI would aid in improving habitat suitability assessment and site selection procedures in restoration projects.
Transplanting close to the depth- and irradiance limit likely imposes increased requirements on the quality of the donor plants. Following decreases in irradiance, eelgrass photo-acclimatize through adaptations in the photosynthetic apparatus and morphology of the eelgrass itself (Ochieng et al., 2010; Eriander, 2017; Leger-Daigle et al., 2022). During photo-acclimation, carbohydrate reserves can potentially sustain growth until net-positive photosynthesis is achieved (Eriander, 2017). Consequently, donor plants with large carbohydrate reserves or low-light adaptations like increased shoot length (Krause-Jensen et al., 2000; Eriander, 2017) might prove essential to limit initial transplantation stress and increase the viability of deep transplantations. Quantifying these processes further, along with their impact on restoration success, could assist in improving restoration procedures and is a topic for future research.
Statements
Data availability statement
The original contributions presented in the study are included in the article/Supplementary Material. Further inquiries can be directed to the corresponding author.
Author contributions
TB: Conceptualization, Data curation, Formal analysis, Investigation, Methodology, Project administration, Supervision, Validation, Visualization, Writing – original draft. RS: Conceptualization, Investigation, Methodology, Project administration, Writing – review & editing. AB: Data curation, Formal analysis, Methodology, Validation, Visualization, Writing – review & editing. BN: Conceptualization, Investigation, Methodology, Writing – review & editing, Project administration. OJ: Data curation, Formal analysis, Methodology, Visualization, Writing – review & editing. MF: Conceptualization, Funding acquisition, Methodology, Supervision, Writing – review & editing.
Funding
The author(s) declare that financial support was received for the research and/or publication of this article. The research was funded partly by the Velux Foundations in association with the Danish marine restoration project “Sund Vejle Fjord” (Grant number 29719) and partly by the Danish government in relation to the project “Development of marine measures” (Grant number 18503).
Acknowledgments
We thank the scientific assistants employed in the ecology group at SDU, especially Rasmus Ambus Kjær and Anders Høker Petersen, for their tremendous help in establishing and continuously monitoring the eelgrass transplants. We also thank academic assistant Mia Gommesen for helping maintain and extract data from all the loggers and PhD student Mikkel Keller Less for help extracting data from the Mike3d model.
Conflict of interest
The authors declare that the research was conducted in the absence of any commercial or financial relationships that could be construed as a potential conflict of interest.
Generative AI statement
The author(s) declare that no Generative AI was used in the creation of this manuscript.
Publisher’s note
All claims expressed in this article are solely those of the authors and do not necessarily represent those of their affiliated organizations, or those of the publisher, the editors and the reviewers. Any product that may be evaluated in this article, or claim that may be made by its manufacturer, is not guaranteed or endorsed by the publisher.
Supplementary material
The Supplementary Material for this article can be found online at: https://www.frontiersin.org/articles/10.3389/fmars.2025.1581612/full#supplementary-material
References
1
Alcoverro T. Zimmerman R. C. Kohrs D. G. Alberte R. S. (1999). Resource allocation and sucrose mobilization in light-limited eelgrass Zostera marina. Mar. Ecol. Prog. Ser.187, 121–131. doi: 10.3354/meps187121
2
Banke T. L. Steinfurth R. C. Canal-Vergés P. Lange T. Flindt M. R. (2025). Threshold of lugworm (Arenicola marina) densities for successful transplantation of eelgrass (Zostera marina). Restor. Ecology. doi: 10.1111/rec.70058
3
Benson J. L. Schlezinger D. Howes B. L. (2013). Relationship between nitrogen concentration, light, and Zostera marina habitat quality and survival in southeastern Massachusetts estuaries. J. Environ. Manage.131, 129–137. doi: 10.1016/j.jenvman.2013.09.033
4
Bintz J. C. Nixon S. W. (2001). Responses of eelgrass Zostera marina seedlings to reduced light. Mar. Ecol. Prog. Ser.223, 133–141. doi: 10.3354/meps223133
5
Brodersen K. E. Hammer K. J. Schrameyer V. Floytrup A. Rasheed M. A. Ralph P. J. et al . (2017). Sediment resuspension and deposition on seagrass leaves impedes internal plant aeration and promotes phytotoxic H2S intrusion. Front. Plant Sci.8. doi: 10.3389/fpls.2017.00657
6
Brodersen K. E. Kuhl M. (2022). Effects of epiphytes on the seagrass phyllosphere. Front. Mar. Sci.9. doi: 10.3389/fmars.2022.821614
7
Brodersen K. E. Lichtenberg M. Paz L. C. Kühl M. (2015). Epiphyte-cover on seagrass (Zostera marina L.) leaves impedes plant performance and radial O2 loss from the below-ground tissue. Front. Mar. Sci.2. doi: 10.3389/fmars.2015.00058
8
Brush M. J. Nixon S. W. (2002). Direct measurements of light attenuation by epiphytes on eelgrass Zostera marina. Mar. Ecol. Prog. Ser.238, 73–79. doi: 10.3354/meps238073
9
Burkholder J. M. Tomasko D. A. Touchette B. W. (2007). Seagrasses and eutrophication. J. Exp. Mar. Biol. Ecol.350, 46–72. doi: 10.1016/j.jembe.2007.06.024
10
Cardoso P. G. Leston S. Grilo T. F. Bordalo M. D. Crespo D. Raffaelli D. et al . (2010). Implications of nutrient decline in the seagrass ecosystem success. Mar. pollut. Bull.60, 601–608. doi: 10.1016/j.marpolbul.2009.11.004
11
Carstensen J. Krause-Jensen D. Markager S. Timmermann K. Windolf J. (2012). Water clarity and eelgrass responses to nitrogen reductions in the eutrophic Skive Fjord, Denmark. Hydrobiologia704, 293–309. doi: 10.1007/s10750-012-1266-y
12
Christiansen C. Andersen P. Schwærter S. Laursen J. S. (1991). Kystnær omfordeling af sediment og næringssalte - Havforskning fra Miljøstyrelsen Nr. 4 (In Danish).
13
Davis R. C. Short F. T. (1997). Restoring eelgrass, Zostera marina L., habitat using a new transplanting technique: The horizontal rhizome method. Aquat. Bot.59, 1–15. doi: 10.1016/S0304-3770(97)00034-X
14
Drew E. A. (1979). Physiological aspects of primary production in seagrasses. Aquat. Bot.7, 139–150. doi: 10.1016/0304-3770(79)90018-4
15
Duarte C. M. Conley D. J. Carstensen J. Sánchez-Camacho M. (2009). Return to neverland: shifting baselines affect eutrophication restoration targets. Estuaries coasts32, 29–36. doi: 10.1007/s12237-008-9111-2
16
Duarte C. M. Marbà N. Krause-Jensen D. Sánchez-Camacho M. (2007). Testing the predictive power of seagrass depth limit models. Estuaries Coasts30, 652–656. doi: 10.1007/BF02841962
17
Eriander L. (2017). Light requirements for successful restoration of eelgrass (Zostera marina L.) in a high latitude environment - Acclimatization, growth and carbohydrate storage. J. Exp. Mar. Biol. Ecol.496, 37–48. doi: 10.1016/j.jembe.2017.07.010
18
Eriander L. Infantes E. Olofsson M. Olsen J. L. Moksnes P. O. (2016). Assessing methods for restoration of eelgrass (Zostera marina L.) in a cold temperate region. J. Exp. Mar. Biol. Ecol.479, 76–88. doi: 10.1016/j.jembe.2016.03.005
19
Erichsen A. C. Timmermann K. Christensen J. P. A. Kaas H. Markager S. Møhlenberg F. (2017). Development of models and methods to support the Danish River Basin Management Plans. Eds. ErichsenA.TimmermannK. (Aarhus University, Department of Bioscience and DHI), 191.
20
Flindt M. R. Oncken N. S. Kuusemäe K. Lange T. Aaskoven N. Winter S. et al . (2022). Sand-capping stabilizes muddy sediment and improves benthic light conditions in eutrophic estuaries: Laboratory verification and the potential for recovery of eelgrass (Zostera marina). J. sea Res.181, 1. doi: 10.1016/j.seares.2022.102177
21
Flindt M. R. Rasmussen E. K. Valdemarsen T. Erichsen A. Kaas H. Canal-Vergés P. (2016). Using a GIS-tool to evaluate potential eelgrass reestablishment in estuaries. Ecol. Model.338, 122–134. doi: 10.1016/j.ecolmodel.2016.07.005
22
Flindt M. R. Steinfurth R. C. Banke T. L. Lees M. K. Svane N. Canal-Vergés P. (2024). “6.15 - human impacts, environmental disturbances, and restoration of seagrasses,” in Treatise on estuarine and coastal science, 2nd ed.Eds. BairdD.ElliottM. (Academic Press, Oxford), 512–548.
23
Forsythe W. C. Rykiel E. J. Stahl R. S. Wu H. I. Schoolfield R. M. (1995). A model comparison for daylenght as a function of latitude and day of year. Ecol. Model.80, 87–95. doi: 10.1016/0304-3800(94)00034-F
24
Gagnon K. Bocoum E. H. Chen C. Y. Baden S. P. Moksnes P. O. Infantes E. (2023). Rapid faunal colonization and recovery of biodiversity and functional diversity following eelgrass restoration. Restor. Ecol.31, e13887. doi: 10.1111/rec.13887
25
Gallegos C. L. Kenworthy W. J. (1996). Seagrass depth limits in the Indian River Lagoon (Florida, USA): Application of an optical water quality model. Estuar. Coast. Shelf Sci.42, 267–288. doi: 10.1006/ecss.1996.0020
26
Govers L. L. Heusinkveld J. H. T. Gräfnings M. L. E. Smeele Q. van der Heide T. (2022). Adaptive intertidal seed-based seagrass restoration in the Dutch Wadden Sea. PloS One17, e0262845. doi: 10.1371/journal.pone.0262845
27
Greve T. Krause-Jensen D. (2005a). Stability of eelgrass (Zostera marina L.) depth limits: influence of habitat type. Mar. Biol.147, 803–812. doi: 10.1007/s00227-005-1600-2
28
Greve T. M. Krause-Jensen D. (2005b). Predictive modelling of eelgrass (Zostera marina) depth limits. Mar. Biol.146, 849–858. doi: 10.1007/s00227-004-1498-0
29
Hasler-Sheetal H. Fragner L. Holmer M. Weckwerth W. (2015). Diurnal effects of anoxia on the metabolome of the seagrass Zostera marina. Metabolomics11, 1208–1218. doi: 10.1007/s11306-015-0776-9
30
Hauxwell J. Cebrian J. Valiela I. (2003). Eelgrass Zostera marina loss in temperate estuaries: relationship to land-derived nitrogen loads and effect of light limitation imposed by algae. Mar. ecology. Prog. Ser. (Halstenbek)247, 59–73. doi: 10.3354/meps247059
31
Infantes E. Crouzy C. Moksnes P.-O. (2016). Seed predation by the shore crab carcinus maenas: A positive feedback preventing eelgrass recovery? PloS One11, e0168128. doi: 10.1371/journal.pone.0168128
32
Kenworthy W. J. Fonseca M. S. (1996). Light requirements of seagrasses Halodule wrightii and Syringodium filiforme derived from the relationship between diffuse light attenuation and maximum depth distribution. Estuaries19, 740–750. doi: 10.2307/1352533
33
Kenworthy W. J. Gallegos C. L. Costello C. Field D. Di Carlo G. (2014). Dependence of eelgrass (Zostera marina) light requirements on sediment organic matter in Massachusetts coastal bays: Implications for remediation and restoration. Mar. pollut. Bull.83, 446–457. doi: 10.1016/j.marpolbul.2013.11.006
34
Kirk J. T. O. (1985). Effects of suspensoids (turbidity) on penetration of solar radiation in aquatic ecosystems. Hydrobiologia125, 195–208. doi: 10.1007/BF00045935
35
Krause-Jensen D. Carstensen J. Nielsen S. L. Dalsgaard T. Christensen P. B. Fossing H. et al . (2011). Sea bottom characteristics affect depth limits of eelgrass Zostera marina. Mar. ecology. Prog. Ser. (Halstenbek)425, 91–102. doi: 10.3354/meps09026
36
Krause-Jensen D. Middelboe A. L. Sand-Jensen K. Christensen P. B. (2000). Eelgrass, Zostera marina, growth along depth gradients: upper boundaries of the variation as a powerful predictive tool. Oikos91, 233–244. doi: 10.1034/j.1600-0706.2001.910204.x
37
Kuusemäe K. Rasmussen E. K. Canal-Vergés P. Flindt M. R. (2016). Modelling stressors on the eelgrass recovery process in two Danish estuaries. Ecol. Model.333, 11–42. doi: 10.1016/j.ecolmodel.2016.04.008
38
Kuusemäe K. Von Thenen M. Lange T. Rasmussen E. K. Pothoff M. Sousa A. I. et al . (2018). Agent Based Modelling (ABM) of eelgrass (Zostera marina) seedbank dynamics in a shallow Danish estuary. Ecol. Model.371, 60–75. doi: 10.1016/j.ecolmodel.2018.01.001
39
Lange T. Oncken N. S. Svane N. Steinfurth R. C. Kristensen E. Flindt M. R. (2022). Large-scale eelgrass transplantation: a measure for carbon and nutrient sequestration in estuaries. Mar. ecology. Prog. Ser. (Halstenbek)685, 97–109. doi: 10.3354/meps13975
40
Lee K.-S. Park S. R. Kim Y. K. (2007). Effects of irradiance, temperature, and nutrients on growth dynamics of seagrasses: A review. J. Exp. Mar. Biol. Ecol.350, 144–175. doi: 10.1016/j.jembe.2007.06.016
41
Leger-Daigle R. Noisette F. Belanger S. Cusson M. Nozais C. (2022). Photoacclimation and light thresholds for cold temperate seagrasses. Front. Plant Sci.13. doi: 10.3389/fpls.2022.805065
42
Mcglathery K. J. Sundback K. Anderson I. C. (2007). Eutrophication in shallow coastal bays and lagoons: the role of plants in the coastal filter. Mar. Ecol. Prog. Ser.348, 1–18. doi: 10.3354/meps07132
43
Miljoegis Danish Environmental Protection Agency . “Miljoeministeriet,” in MiljoeGIS for genbesøg af gensøg af vandområdeplaner 2021–2027. GIS-based website. Available at: https://miljoegis.mim.dk/spatialmap?profile=vandrammedirektiv3genbesoeg2024.
44
Miljoeministeriet (2011). “Vandplan 2009-2015,” in Lillebaelt/jylland. Hovedvandopland 1.11 vanddistrikt jylland og fyn (In danish). (Accessed April 12, 2024).
45
Miljoeministeriet (2023). Vandområdeplanerne 2021-2027 (in danish). Available online at: https://mim.dk/media/njvlvhax/vandomraadeplanerne-2021-2027-22-9-2023.pdf (Accessed April 12, 2024).
46
Moreno-Marín F. Brun F. G. Pedersen M. F. (2018). Additive response to multiple environmental stressors in the seagrass Zostera marina L. Limnology oceanography63, 1528–1544. doi: 10.1002/lno.10789
47
Nielsen S. L. Sand-Jensen K. Borum J. Geertz-Hansen O. (2002a). Depth colonization of eelgrass (Zostera marina) and macroalgae as determined by water transparency in danish coastal waters. Estuaries25, 1025–1032. doi: 10.1007/BF02691349
48
Nielsen S. L. Sand-Jensen K. Borum J. Geertz-Hansen O. (2002b). Phytoplankton, nutrients, and transparency in danish coastal waters. Estuaries25, 930–937. doi: 10.1007/BF02691341
49
Ochieng C. A. Short F. T. Walker D. I. (2010). Photosynthetic and morphological responses of eelgrass (Zostera marina L.) to a gradient of light conditions. J. Exp. Mar. Biol. Ecol.382, 117–124. doi: 10.1016/j.jembe.2009.11.007
50
Olesen B. (1996). Regulation of light attenuation and eelgrass Zostera marina depth distribution in a Danish embayment. Mar. Ecol. Prog. Ser.134, 187–194. doi: 10.3354/meps134187
51
Olesen B. Sand-Jensen K. (1993). Seasonal acclimatization of eelgrass Zostera marina growth to light. Mar. Ecol. Prog. Ser.94, 91–99. doi: 10.3354/meps094091
52
Oncken N. S. Lange T. Kristensen E. Quintana C. O. Steinfurth R. C. Flindt M. R. (2022). Sand-capping – A large-scale approach to restore organic-enriched estuarine sediments. Mar. Environ. Res.173, 105534–105534. doi: 10.1016/j.marenvres.2021.105534
53
Orth R. J. Lefcheck J. S. Mcglathery K. S. Aoki L. Luckenbach M. W. Moore K. A. et al . (2020). Restoration of seagrass habitat leads to rapid recovery of coastal ecosystem services. Sci. Adv.6, 9. doi: 10.1126/sciadv.abc6434
54
Pedersen O. Binzer T. Borum J. (2004). Sulphide intrusion in eelgrass (Zostera marina L.). Plant Cell Environ.27, 595–602. doi: 10.1111/j.1365-3040.2004.01173.x
55
Preston J. Debney A. Bertelli C. Bull J. Finger A. Glover A. et al . (2021). “Chapter 2 getting started: restoration project desing, planning, permitting, licensing and funding,” in Seagrass restoration handbook. Eds. GambleC.DebneyA.GloverA.BertelliC.GreenB.HendyI.LilleyR.NuuttilaH.PotouroglouM.RagazzolaF.ReesS.UnsworthR.PrestonJ. (Zoological Society of London, UK., London, UK).
56
Ralph P. J. Durako M. J. Enríquez S. Collier C. J. Doblin M. A. (2007). Impact of light limitation on seagrasses. J. Exp. Mar. Biol. Ecol.350, 176–193. doi: 10.1016/j.jembe.2007.06.017
57
Rasmussen J. R. Dromph K. M. Göke C. Krause-Jensen D. (2015). Reduced cover of drifting macroalgae following nutrient reduction in danish coastal waters. Estuaries Coasts38, 1664–1677. doi: 10.1007/s12237-014-9904-4
58
Rasmussen J. R. Olesen B. Krause-Jensen D. (2012). Effects of filamentous macroalgae mats on growth and survival of eelgrass, Zostera marina, seedlings. Aquat. Bot.99, 41–48. doi: 10.1016/j.aquabot.2012.01.005
59
Rasmussen J. R. Pedersen M. F. Olesen B. Nielsen S. L. Pedersen T. M. (2013). Temporal and spatial dynamics of ephemeral drift-algae in eelgrass, Zostera marina, beds. Estuar. Coast. Shelf Sci.119, 167–175. doi: 10.1016/j.ecss.2013.01.006
60
Riemann B. Carstensen J. Dahl K. Fossing H. Hansen J. W. Jakobsen H. H. et al . (2016). Recovery of danish coastal ecosystems after reductions in nutrient loading: A holistic ecosystem approach. Estuaries coasts39, 82–97. doi: 10.1007/s12237-015-9980-0
61
Salo T. Reusch T. B. H. Boström C. (2015). Genotype-specific responses to light stress in eelgrass Zostera marina, a marine foundation plant. Mar. Ecol. Prog. Ser.519, 129–140. doi: 10.3354/meps11083
62
Silva J. Barrote I. Costa M. M. Albano S. Santos R. (2013). Physiological Responses of Zostera marina and Cymodocea nodosa to Light-Limitation Stress. PloS One8, e81058. doi: 10.1371/journal.pone.0081058
63
Skop E. Sorensen P. B. (1998). GIS-based modelling of solute fluxes at the catchment scale: a case study of the agricultural contribution to the riverine nitrogen loading in the Vejle Fjord catchment, Denmark. Ecol. Model.106, 291–310. doi: 10.1016/S0304-3800(97)00205-6
64
Staehr P. A. Borum J. (2011). Seasonal acclimation in metabolism reduces light requirements of eelgrass (Zostera marina). J. Exp. Mar. Biol. Ecol.407, 139–146. doi: 10.1016/j.jembe.2011.05.031
65
Staehr P. A. Göke C. Halbach A. M. Krause-Jensen D. Timmermann K. Upadhyay S. et al . (2019). Habitat model of eelgrass in danish coastal waters: development, validation and management perspectives. Front. Mar. Sci.6. doi: 10.3389/fmars.2019.00175
66
Steinfurth R. C. Lange T. Oncken N. S. Kristensen E. Quintana C. O. Flindt M. R. (2022). Improved benthic fauna community parameters after large-scale eelgrass (Zostera marina) restoration in Horsens Fjord, Denmark. Mar. Ecol. Prog. Ser.687, 65–6+. doi: 10.3354/meps14007
67
Thom R. M. Southard S. L. Borde A. B. Stoltz P. (2008). Light requirements for growth and survival of eelgrass (Zostera marina L.) in pacific northwest (USA) estuaries. Estuaries coasts31, 969–980. doi: 10.1007/s12237-008-9082-3
68
Timmermann K. Christensen J. P. A. Erichsen A. (2020). “Referenceværdier og grænseværdier for ålegræsdybdegrænser til brug for vandområdeplanerne,” in Videnskabelig rapport nr. 390. (In Danish) (Aarhus Universitet, DCE - Nationalt Center for Miljø og Energi), 28. Available online at: http://dce2.au.dk/pub/SR390.pdf
69
Tyler R. M. Brady D. C. Targett T. E. (2009). Temporal and spatial dynamics of diel-cycling hypoxia in estuarine tributaries. Estuaries Coasts32, 123–145. doi: 10.1007/s12237-008-9108-x
70
Unsworth R. K. F. Jones B. L. H. Coals L. Furness E. Inman I. Rees S. C. et al . (2024). Overcoming ecological feedbacks in seagrass restoration. Restor. Ecol.32, e14101. doi: 10.1111/rec.14101
71
Valdemarsen T. Canal-Vergés P. Kristensen E. Holmer M. Kristiansen M. D. Flindt M. R. (2010). Vulnerability of Zostera marina seedlings to physical stress. Mar. ecology. Prog. Ser. (Halstenbek)418, 119–130. doi: 10.3354/meps08828
72
Valdemarsen T. Quintana C. O. Kristensen E. Flindt M. R. (2014). Recovery of organic-enriched sediments through microbial degradation: implications for eutrophic estuaries. Mar. Ecol. Prog. Ser.503, 41–58. doi: 10.3354/meps10747
73
Valdemarsen T. Wendelboe K. Egelund J. T. Kristensen E. Flindt M. R. (2011). Burial of seeds and seedlings by the lugworm Arenicola marina hampers eelgrass (Zostera marina) recovery. J. Exp. Mar. Biol. Ecol.410, 45–52. doi: 10.1016/j.jembe.2011.10.006
74
Van Katwijk M. M. Thorhaug A. Marba N. Orth R. J. Duarte C. M. Kenick G. A. et al . (2016). Global analysis of seagrass restoration: the importance of large-scale planting. J. Appl. Ecol.53, 567–578. doi: 10.1111/jpe.2016.53.issue-2
75
Waycott M. Duarte C. M. Tim J. B. C. Orth R. J. Dennison W. C. Olyarnik S. et al . (2009). Accelerating loss of seagrasses across the globe threatens coastal ecosystems. Proc. Natl. Acad. Sci. - PNAS106, 12377–12381. doi: 10.1073/pnas.0905620106
76
Weinberg S. (1976). Submarine daylight and ecology. Mar. Biol.37, 291–304. doi: 10.1007/BF00387485
Summary
Keywords
transplantation, light threshold, light requirements, eutrophication, stressors, restoration
Citation
Banke TL, Steinfurth RC, Barnewitz A, Nielsen B, Jones OR and Flindt MR (2025) Compensation irradiance and depth limits of transplanted eelgrass (Zostera marina) along a eutrophication gradient. Front. Mar. Sci. 12:1581612. doi: 10.3389/fmars.2025.1581612
Received
22 February 2025
Accepted
04 June 2025
Published
02 July 2025
Volume
12 - 2025
Edited by
Luca Rindi, University of Pisa, Italy
Reviewed by
W. Judson Kenworthy, Independent Researcher, Beaufort, North Carolina, United States
Caterina Mintrone, University of Pisa, Italy
Updates
Copyright
© 2025 Banke, Steinfurth, Barnewitz, Nielsen, Jones and Flindt.
This is an open-access article distributed under the terms of the Creative Commons Attribution License (CC BY). The use, distribution or reproduction in other forums is permitted, provided the original author(s) and the copyright owner(s) are credited and that the original publication in this journal is cited, in accordance with accepted academic practice. No use, distribution or reproduction is permitted which does not comply with these terms.
*Correspondence: Timi L. Banke, timi@biology.sdu.dk
Disclaimer
All claims expressed in this article are solely those of the authors and do not necessarily represent those of their affiliated organizations, or those of the publisher, the editors and the reviewers. Any product that may be evaluated in this article or claim that may be made by its manufacturer is not guaranteed or endorsed by the publisher.