Abstract
Agents of global change, such as climate disruptions, habitat loss, and biological invasions, affect nearshore and intertidal ecological communities in acute and chronic ways. Biological monitoring aims to track the changes in ecological communities over time, yet temporal mismatches between sampling regimes, environmental stressors, and corresponding ecological responses of interest often limit the utility of monitoring data for testing hypotheses related to these changes. Participatory science, alternatively “citizen science”, can increase the geographic and temporal scale of monitoring and can be a tool to address this limitation. By improving statistical power through higher resolution and a larger scale of data, participatory science programs can detect how global change alters highly dynamic ecological communities. In this study, we evaluate insights from a participatory science dataset (Washington Sea Grant Crab Team) on nearshore mobile epifaunal communities in the Salish Sea, how they differ across habitat types and over time and how they responded to an atmospheric heatwave. Nearshore communities varied across channel, lagoon, and tideflat habitat types, with community metrics and species identities aligning with the environmental characteristics of each habitat type. Though these communities experience high seasonal variability, habitat type differences were consistent over the seven years of data collected. While some sites did experience extreme excursions of water temperature as a result of the 2021 atmospheric heatwave, neither short- nor long-term impacts were detected in the ecological communities monitored at the regional scale. Two factors are likely important in this conclusion: 1. We monitored mobile epifauna, which may be able to migrate to mitigate extreme events and 2. Water temperatures during the heatwave rarely exceeded those experienced at the sites during other times of year. The seasonal variability of the ecological communities observed in these dynamic environments suggests avoiding snapshot sampling in favor of an approach that offers high temporal resolution, as some participatory science programs can, to be able to accurately disentangle effects of acute stressors from the noise of natural variability.
Introduction
Agents of global change, such as climate disruption, ocean acidification, habitat loss, pollution, and the spread of invasive species, have profound effects on nearshore and intertidal ecological communities (Harley et al., 2006). Rising temperatures and altered oceanographic conditions disrupt species distributions, leading to shifts in community composition and potential local extinctions (Pinsky et al., 2020). Additionally, invasive species can outcompete native organisms, alter predator-prey relationships, modify habitats, and reduce biodiversity (Molnar et al., 2008). Together, these and various other agents of change challenge the resilience of nearshore and intertidal ecosystems, with cascading impacts on ecosystem services such as shoreline protection, nutrient cycling, and fisheries productivity.
Both the effects of global change agents on the physical environment and the response of nearshore intertidal ecological communities vary significantly across temporal and spatial scales. Chronic stressors (i.e., press disturbances), such as ocean acidification and rising temperatures, operate over relatively long timescales, gradually altering ecosystems in ways that may only become apparent after abrupt state shifts once tipping points have been exceeded (Duarte, 2014). By contrast, acute events (i.e., pulse disturbances) such as marine heatwaves, atmospheric heatwaves, and other extreme weather events (Ummenhofer and Meehl, 2017) can cause immediate impacts, with recovery potentially taking years to decades depending on the resilience characteristics of the ecosystem. Spatially, the effects of global change can range from local, such as habitat loss caused by coastal development, to regional phenomena like hypoxic zones driven by nutrient runoff (Gooday et al., 2009; Rabalais et al., 2009). The response of species and communities to agents of global change also varies across scales, with the variability in impacts shaping their resilience and adaptability. Ecological communities can be highly variable in both space and time, particularly those living in intrinsically dynamic environmental conditions (Sousa, 1984). Intertidal shorelines are incredibly variable in physical factors over short time scales; temperature, salinity, inundation/exposure, physical energy, dissolved oxygen, and solar radiation all change with semi-regularity on time scales of hours, days, weeks, months, years and decades. Moreover, communities in these environments tend to consist of organisms with short generation times, which can fluctuate in response to environmental variability (Paine and Levin, 1981). Yet predicting responses can be challenging because responses are frequently non-linear (Kunze et al., 2021). Understanding the interplay of these scales for both impacts and responses is critical for developing effective management and conservation strategies that account for both localized and widespread drivers of ecological change.
Monitoring aims to understand changes in ecological communities at different geographic- and time-scales, and the approach to sampling can influence the types and amount of information gained. Short-term sampling efforts have particularly limited value in highly dynamic environments because temporal turnover and intrinsic ecological variability can mask relevant changes reflective of long-term patterns (Huttunen et al., 2018). Consistent, long-term monitoring (i.e., a trajectory approach sensuHuttunen et al., 2018) allows for better resolution and statistical power to detect temporal changes, but securing financial resources to maintain programs long enough to detect ecological changes is a perennial challenge in resource management (Lindenmayer and Likens, 2018). Moreover, ecological inferences of change at a single site, even when made through long-term monitoring are generally constrained in their generalizability. Short-term monitoring on a large geographic scale (i.e. synoptic or snapshot approaches) can produce more generalizable inferences, but it can be extremely demanding to implement snapshot sampling within a relevant timeframe, due to limited personnel resources, travel time, and logistical access. Though monitoring that is conducted on both long term and large geographic scales is undoubtedly most ecologically informative, resource limitations and logistical challenges are compounded to the extent that such datasets are exceedingly rare. Participatory science (formerly, “citizen science”) is one monitoring approach that can generate a scalable and sustainable effort. Effective participatory science monitoring programs can provide high quality data and the opportunity for discovery of non-target goals, even while involving participants who may not have any formal scientific education. The tradeoff of involving more participants, however, is the need for robust training and quality assurance/quality control measures to ensure consistency and protocol adherence across space and over time (Brown and Williams, 2019). This means that participatory science approaches are not necessarily less costly than those that rely on scientifically trained personnel to collect data, but that the allocation of costs might differ. In particular, one common capacity shortcoming for even large-scale and long-term participatory science programs is in support for data analysis, an essential step in converting participant effort into scientific- and policy-relevant understanding (Conrad and Hilchey, 2011).
Here we capitalize on the large-scale, long-term monitoring efforts of one participatory science program, Washington Sea Grant Crab Team, focused on early detection of invasive European green crab, Carcinus maenas, in the southern portion of the Salish Sea (the Strait of Juan de Fuca and Puget Sound) to answer the following questions: 1) How do mobile epifaunal communities differ across habitat types in this system and how variable are they over time? 2) What was the effect of a major environmental stressor, the 2021 heatwave, on these communities and did the impact vary across habitat types?
Methods
Study system
The Salish Sea is a large inland sea of the northeast Pacific Ocean, spanning the border between the United States and Canada. Protected from large ocean fetch by the narrow opening of the Strait of Juan de Fuca, and influenced by input from large glacier-fed river systems, the Salish Sea is characterized by low wave energy, and brackish waters (26–29 PSU, Walker et al., 2022) relative to adjacent Pacific coastal shorelines. From 25 June – 2 July, 2021, the Pacific Northwest (Oregon and Washington, USA and British Columbia, Canada), including the Salish Sea, experienced an atmospheric heatwave, with air temperatures soaring 10° to 20 °C above average for several consecutive days (White et al., 2023). The severity of the heatwave was subsequently attributed to climate change (Philip et al., 2022) and further analysis by Heeter et al. (2023) has demonstrated it was unprecedented over the past millennium. This extreme event coincided with some of the lowest daytime tides of the year, exposing intertidal organisms to prolonged, anomalously high air temperatures during peak solar radiation. Reports of widespread mortality among intertidal marine organisms followed the heatwave, with significant impacts documented for bivalves such as butter clams, cockles, native littleneck clams, Manila clams, and Olympia and Pacific oysters. A qualitative assessment revealed severe and geographically variable impacts on shellfish populations, emphasizing the vulnerability of intertidal ecosystems to climate-induced thermal stress (Raymond et al., 2022).
Species responses to the heatwave were influenced by their natural histories and local environmental conditions (Raymond et al., 2022; Miner et al., 2025). On rocky shores of British Columbia, shading and other topography-dependent features influenced survival of barnacles and community structure (Hesketh and Harley, 2023). On rocky shores in Washington, the most severe impacts to sessile organisms (i.e. rockweed, barnacles, and mussels) occurred in the Salish Sea where low tide occurred during the hottest part of the day. However, these impacts were only detected in the short term (a matter of weeks) and did not last beyond one year (Miner et al., 2025). In soft-bottom habitats, Raymond et al. (2022) observed that butter clams (Saxidomus gigantea), which burrow deeply in sediment, were less affected than surface-dwelling species like cockles. Similarly, Olympia oysters (Ostrea lurida), found in lower intertidal zones, fared better than Pacific oysters (Magallana gigas), which showed poorer conditions in warmer southern Puget Sound areas. Throughout the region, heatwave-induced snow and glacier melt led to increased river flows (White et al., 2023); high flows, observed near some estuaries, may have provided thermal refuges for certain populations (Raymond et al., 2022). Follow-up analyses revealed variable effects on bivalve density and size, though sampling approach and high variability in the dataset limited strong conclusions (Raymond et al., 2024). These findings highlight the complexity of species responses to acute climate events and underscore the importance of developing monitoring approaches to better understand and manage the short and long-term impacts of intensifying climate change on intertidal ecosystems.
Crab team network trapping
Washington Sea Grant Crab Team is a regional nearshore monitoring network that uses a participatory science model. Launched in 2015 to detect and track the early stages of invasion by European green crab, Carcinus maenas (hereafter green crab), Crab Team monitoring has documented shoreline health and change for the last decade through three protocols: baited trapping (the data source for this study), an effort-delimited molt search, and a shoreline habitat delineation, each conducted once per month from April through September, annually. Assigned sites are sampled by local teams of registered participants, who participate as volunteer community members or as technical staff from partnering tribes, agencies, or stewardship groups. All participants receive a minimum of six hours of classroom-based, hands-on training on background, protocols, and identification, as well as continuing and refresher education for returning participants each year. The median and mean age of participants during the years used in this study (2017-2023) were 67 and 62 years old, respectively.
Monitoring sites within the network were selected by Crab Team staff to target habitats with the highest level of suitability for survival of green crabs at the early stages of invasion (Grason et al., 2018). In alignment with the observation that, on the west coast of North America, green crabs are found primarily in protected soft-sediment shorelines (Grosholz and Ruiz, 1996), early detection monitoring sites targeted low energy “pocket estuaries” and tideflats. Since the program launched in 2015, a total of 62 sites within the Salish Sea have been sampled at least once, with the current Salish Sea portion of the network comprising 57 active sites.
Network sites are demarcated with a semi-permanent rebar stake, installed by Crab Team staff, which ensures that protocols are implemented at the same location each time. The sites are characterized based on habitat features as falling into three broad categories, lagoons, salt marsh channels, or tide flats. Lagoons are shallow impounded water bodies, connected to open marine waters only on high tides through a shallow sill or culvert, and may or may not have streams draining upland watersheds feeding into them. Salt marsh channels are shallow, linear features bordered on both sides by vertical banks and opening to marine waters. Channels may be blind (opening only to marine waters) or may have stream inflow. Tide flats are shallow-grade shorelines where the sediment is composed primarily of a combination of sand, mud, and/or silt. Consistent with the goal to target habitats suitable for green crab, tide flat sites were located in areas with three dimensional structure, such as pilings or pedestal marsh, that green crab use as protection from predators. Notably, all three types of habitat have variable freshwater input across the network, and range widely in their salinity regimes.
We explored data collected under the Crab Team baited trapping protocol at network monitoring sites within the Salish Sea to evaluate community composition and change. Full details of the protocol are described in the Monitor Handbook, which can be found on the program website (https://wsg.uw.edu/crabteam), but are described here in brief. Six baited traps were set for a single overnight high tide per month, from April through September each year. Two trap types were used: galvanized steel minnow traps (Gee - 40, ca. 6.35mm mesh size, 25mm opening), and folding, rectangular multi-species marine traps (Fukui FT-100, 13mm mesh and 40cm expandable slit openings, Bergshoeff et al., 2019). Fukui traps were slightly modified to reduce entry by very large organisms, which do not survive well in traps, by zip-tying the top and bottom of the entry ramp together at the middle, reducing the opening width by half (20cm). Traps were set adjacent to the site marker and arranged in a transect parallel either to shore (for tide flats and lagoons) or the channel axis (for channels), alternating between the two trap types with 10m distance between each trap. Timing of deployment aimed to capture an overnight high tide, when crabs are most actively foraging. On retrieval, all organisms were placed into a bin with a scale bar and photographed for data verification. Participants recorded the number of all species in the traps at the level of taxonomic resolution prescribed by Crab Team protocols. All organisms except green crabs were released on site. In accordance with permits, any green crabs were retained and conveyed to Crab Team staff for cataloguing. Crab Team staff reviewed participant data submissions monthly, matching recorded trap totals with photographs and knowledge of the sites.
Statistical analyses
Community characterization and change
To better understand how shallow subtidal communities differ across these habitat types, we conducted a multivariate generalized linear model on the abundance of all species found at a site within a given month. Traditional distanced-based approaches, such as nMDS and PERMANOVA, do not properly account for the positive relationship between mean and variance commonly found in ecological data (Warton et al., 2012). Alternatively, using a multivariate generalized linear model approach, such as through the R package ‘mvabund’ (Wang et al., 2012), can enhance detection of multivariate changes as well as identification of taxa in which an effect is expressed (Warton et al., 2012). In this analysis, we focused on sites that were monitored every year from 2017 to 2023, resulting in 49 total sites in the Salish Sea (Figure 1, n = 26 lagoon, 14 channel, and 9 tideflat sites). The model was fit using a negative binomial distribution, as it often best reflects count data (O’Hara and Kotze, 2010), and a log-link function on the abundances of all species summed across the six deployed traps in a given month at each site as the response, and habitat type, year, and their interaction served as predictors. We fit the model using the ‘ManyGLM’ function in R from the ‘mvabund’ package (Wang et al., 2021) using the pairwise comparison “p.uni = adjusted” argument, which simultaneously fits and compares univariate models, adjusted to account for multiple tests, for each taxa to determine which taxa contribute most to significant differences across predictors. Model fit was evaluated by examining a plot of the residuals vs. fitted values, and given that the fit was appropriate, the test of the model was completed using an analysis of variance with a log-likelihood ratio (LR) test statistic (Wang et al., 2012; Warton et al., 2012). After running this model, we also visualized average abundance for the taxa for which abundances differed significantly (p<0.05) across habitat types using ‘ggplot2’ (Wickham et al., 2020).
Figure 1

Map of Crab Team monitoring locations included in this study, with color representing the habitat type of each site.
For a deeper understanding of community differences across habitat types and their temporal variability, we derived several univariate community metrics based on each site type (mean +/- 95% confidence interval) at the monthly time scale over the study window (from 2017-2023). First, we calculated mean total abundance per habitat type by summing the abundance of all taxa combined across the six deployed traps in a given month per site. Then, we calculated mean species richness and Shannon diversity index using the R package ‘vegan’ (Oksanen et al., 2018). To explore community change over time across habitat types, we calculated total turnover, species appearances, species disappearances, and mean rank shift, a measure of species abundance reordering, using the R package ‘codyn’ (Hallett et al., 2016).
Community impact of atmospheric heatwave
To better understand the effects of the June heatwave and whether they differed across habitat types, we explored site temperature data, and community changes in 2021 relative to patterns of change in non-heatwave years. The heatwave occurred from June 26-29, 2021 with daytime high air temperatures 10˚ to 20˚C above average for three to four consecutive days (Raymond et al., 2024). To explore whether this atmospheric heatwave caused fauna at sampling sites to experience unusually elevated water temperatures, we explored temperature data from a subset of monitoring sites from 2018 through 2023, excluding any sites with more than 1 month of data missing or where the data were missing for 2021. Temperature loggers (either iButton DS1921G, Maxim or HOBO MX-2201, Onset) were deployed within the Crab Team network from April 1 through September 30 annually, starting in 2018. Devices were deployed only at lagoon and channel sites, in locations that retained enough water on low tides to keep the loggers submerged. This enabled us to ensure that only water temperature was recorded, regardless of tide-related water level changes, but precluded inclusion of tideflat sites which become fully exposed at low tides. Devices were programmed to log temperature to the device precision (0.5°C and 0.1°C, respectively) every 128 (iButton) or 30 (HOBO) minutes.
To evaluate the effects of this extreme climate event on shallow subtidal communities across the Salish Sea, we compared site-level changes in total abundances of all taxa captured, between May and July by sample year. To compare changes in communities and individual taxa, we used a multivariate measure of community composition calculated via ‘ManyGLM’ and univariate measures for individual taxa with Cohen’s D Effect Size (Raymond et al., 2024). This allowed us to distinguish heatwave effects from background seasonal changes and natural variation occurring in other years. Not all sites had sampling in both months in a given year, so the total number of sites included annually from 2017 to 2023 were 43, 49, 47, 45, 47, 48, and 49, respectively. We fit separate multivariate GLMs for each year using a negative binomial distribution on a matrix of taxa abundance with habitat type, month, and their interaction. We did not include the “p.uni = adjusted” argument in this model since we ran a separate univariate analysis for each taxa with Cohen’s D. We ran an analysis of variance for each year’s model using the LR test statistic. Mean Cohen’s D (+/- 95% CI) was calculated for each taxon across the three habitat types using the “cohens_d” function in the R package ‘rstatix’ (Kassambara, 2023). We removed taxa from this analysis that were not present during the 2021 heatwave or were only present in 2021 and no other years to be confident in identifying heatwave effects.
Results
Community differences across habitat types
We found that shallow subtidal communities differed across habitat types in the Salish Sea (Table 1). Average total abundance was highest in lagoons (315.8 individual organisms per site +/- 10.14 SE), intermediate in channels (272.3 +/- 11.88), and lowest at tideflats (221.5 +/- 12.86). Species richness was highest in lagoons (4.1 +/- 0.06), similarly high at tideflats (3.9 +/- 0.09) and lowest in channels (3.2 +/- 0.05). Shannon diversity index was highest in tideflats (0.6 +/- 0.02), intermediate in lagoons (0.5 +/- 0.01), and lowest in channels (0.4 +/- 0.01).
Table 1
| Community Metric | Channel | Lagoon | Tideflat |
|---|---|---|---|
| Total Abundance | 272.3 11.88 | 315.8 10.14 | 221.5 12.86 |
| Taxa Richness | 3.2 0.05 | 4.1 0.06 | 3.9 0.09 |
| Diversity | 0.4 0.01 | 0.5 0.01 | 0.6 0.02 |
| Monthly Turnover | 0.35 0.01 | 0.4 0.01 | 0.41 0.01 |
| Rank Shift | 0.17 0.01 | 0.31 0.01 | 0.36 0.03 |
Summary of community metrics across habitat types as mean standard error.
The multivariate analysis also revealed that community composition differs across these habitat types (Supplementary Table S1, ANOVA; LR2,32 = 612.9, p=0.001). This difference in communities was driven by 20 (of 56 total) taxa (Supplementary Table S1, Figure 2); the species with the greatest contribution to community differences (p=0.001) were Batillaria attramentaria, Cancer productus, Metacarcinus gracilis, Pagurus granosimanus, Pagurus hirsutiusculus, and crabs in the family Majidae. Channel habitats were characterized by a greater abundance of Crangonid shrimp and the sculpin Cottus asper than other habitat types (Figure 2). Channel and lagoon sites had more stickleback, Gasterosteus aculeatus, and purple shore crab, Hemigrapsus nudus, than tideflats. Lagoons had a larger abundance of Majidae, Caprellidae, Pagurus hirsutiusculus, Pagurus granosimanus, Nassarius spp., and Cancer productus than channels or tideflats. Tideflats were dominated by Batillaria attramentaria, but also had a higher average abundance of Haminoea spp., Metacarcinus gracilis, Palaemon macrodactylus, and Telmessus cheiragonus than the other habitat types (Figure 2).
Figure 2
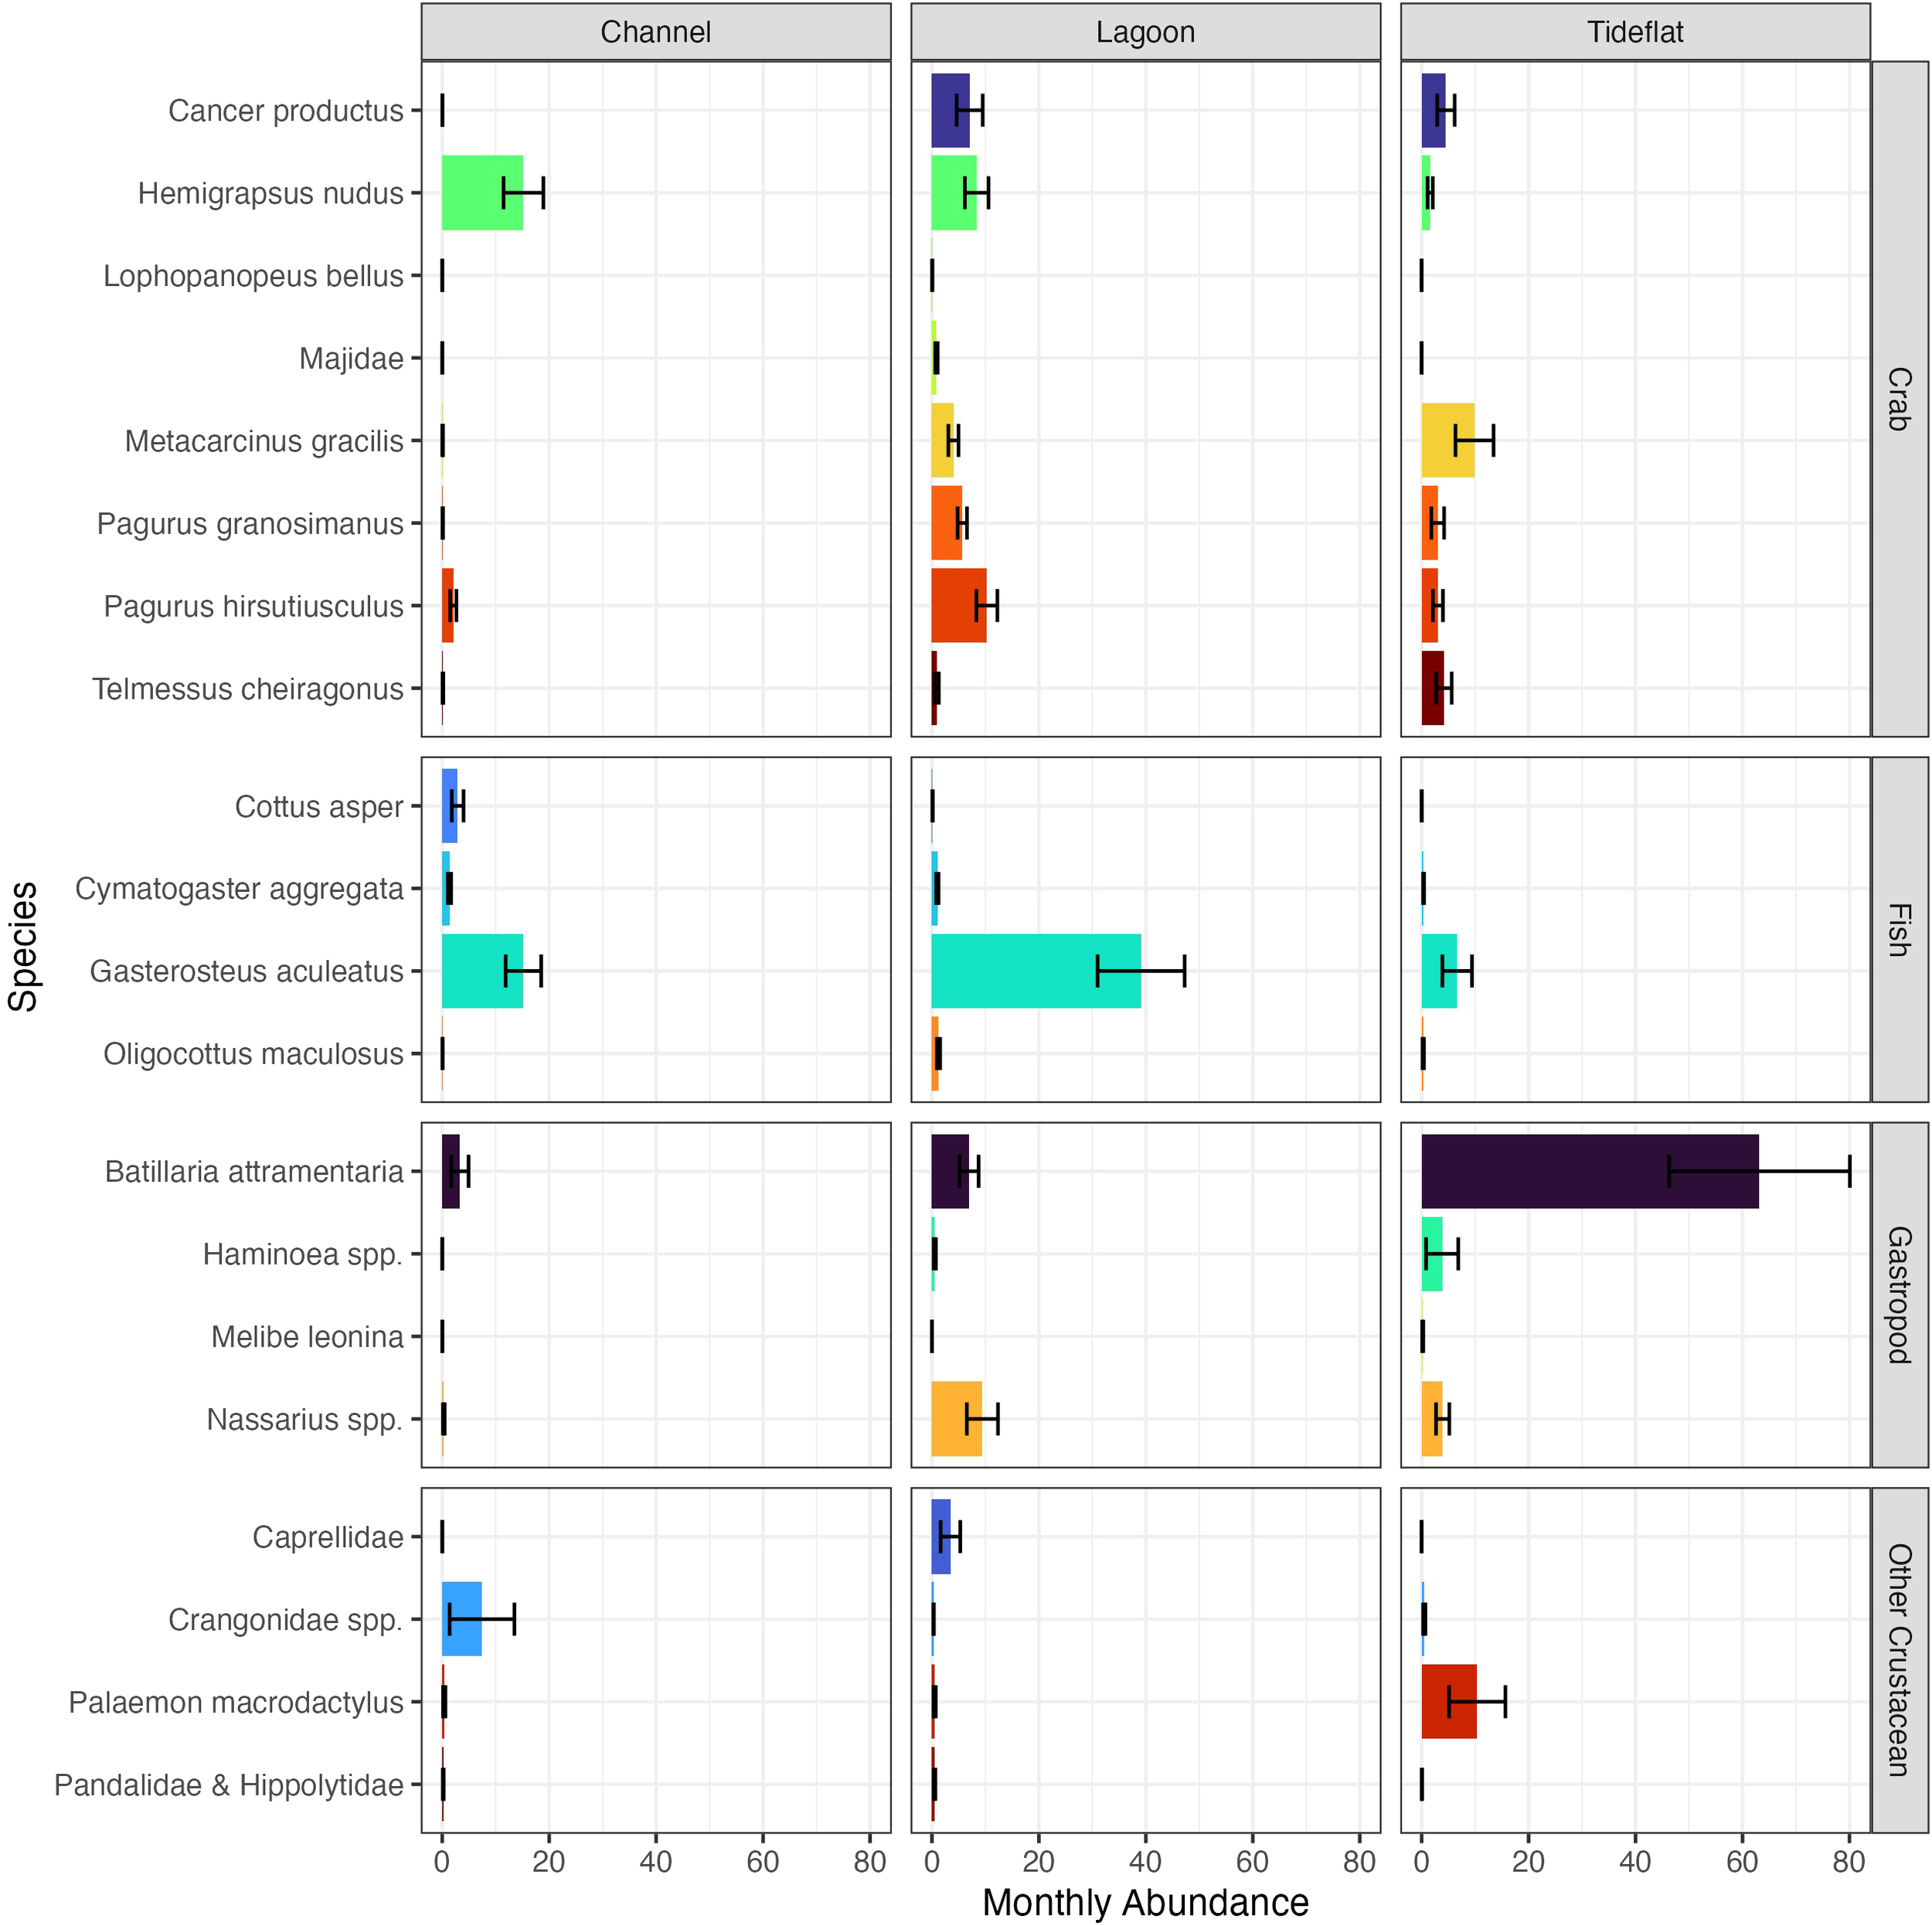
Average monthly abundances of species that contributed to community differences across habitat types (p<0.05 in univariate GLMs, Supplementary Table S1). Values represent the mean monthly site-level abundance of each species across habitat types over all years of sampling within each habitat type. Error bars represent standard error.
Through qualitative analysis of temporal patterns shown in Figure 3, we observed that community metrics varied across the sampling season (April to September) and between years, and this variability differed across the habitat types (Figure 3). Total abundance increased over the sampling season for channel and lagoon habitats; however, abundance peaked mid-season in tideflats and often declined toward the end of the season (Figure 3a). Lagoons appeared to have the largest change in total abundance across the season in addition to the highest average abundance overall (Table 1). Patterns of seasonal change in abundance appeared to be consistent across years for channel and lagoon habitats, but tideflats appeared to experience an increase in seasonal changes in abundance from 2017 to 2023. Species richness was variable within seasons across all habitat types with no discernible pattern, and this variability was consistent over time (Figure 3b). Tideflats appeared to have the largest variability in species richness within the sampling season and across years. Shannon diversity index usually declined over the course of the sampling season in channel and lagoon habitats, and it was much more variable with no obvious seasonal trend in tideflat habitats.
Figure 3
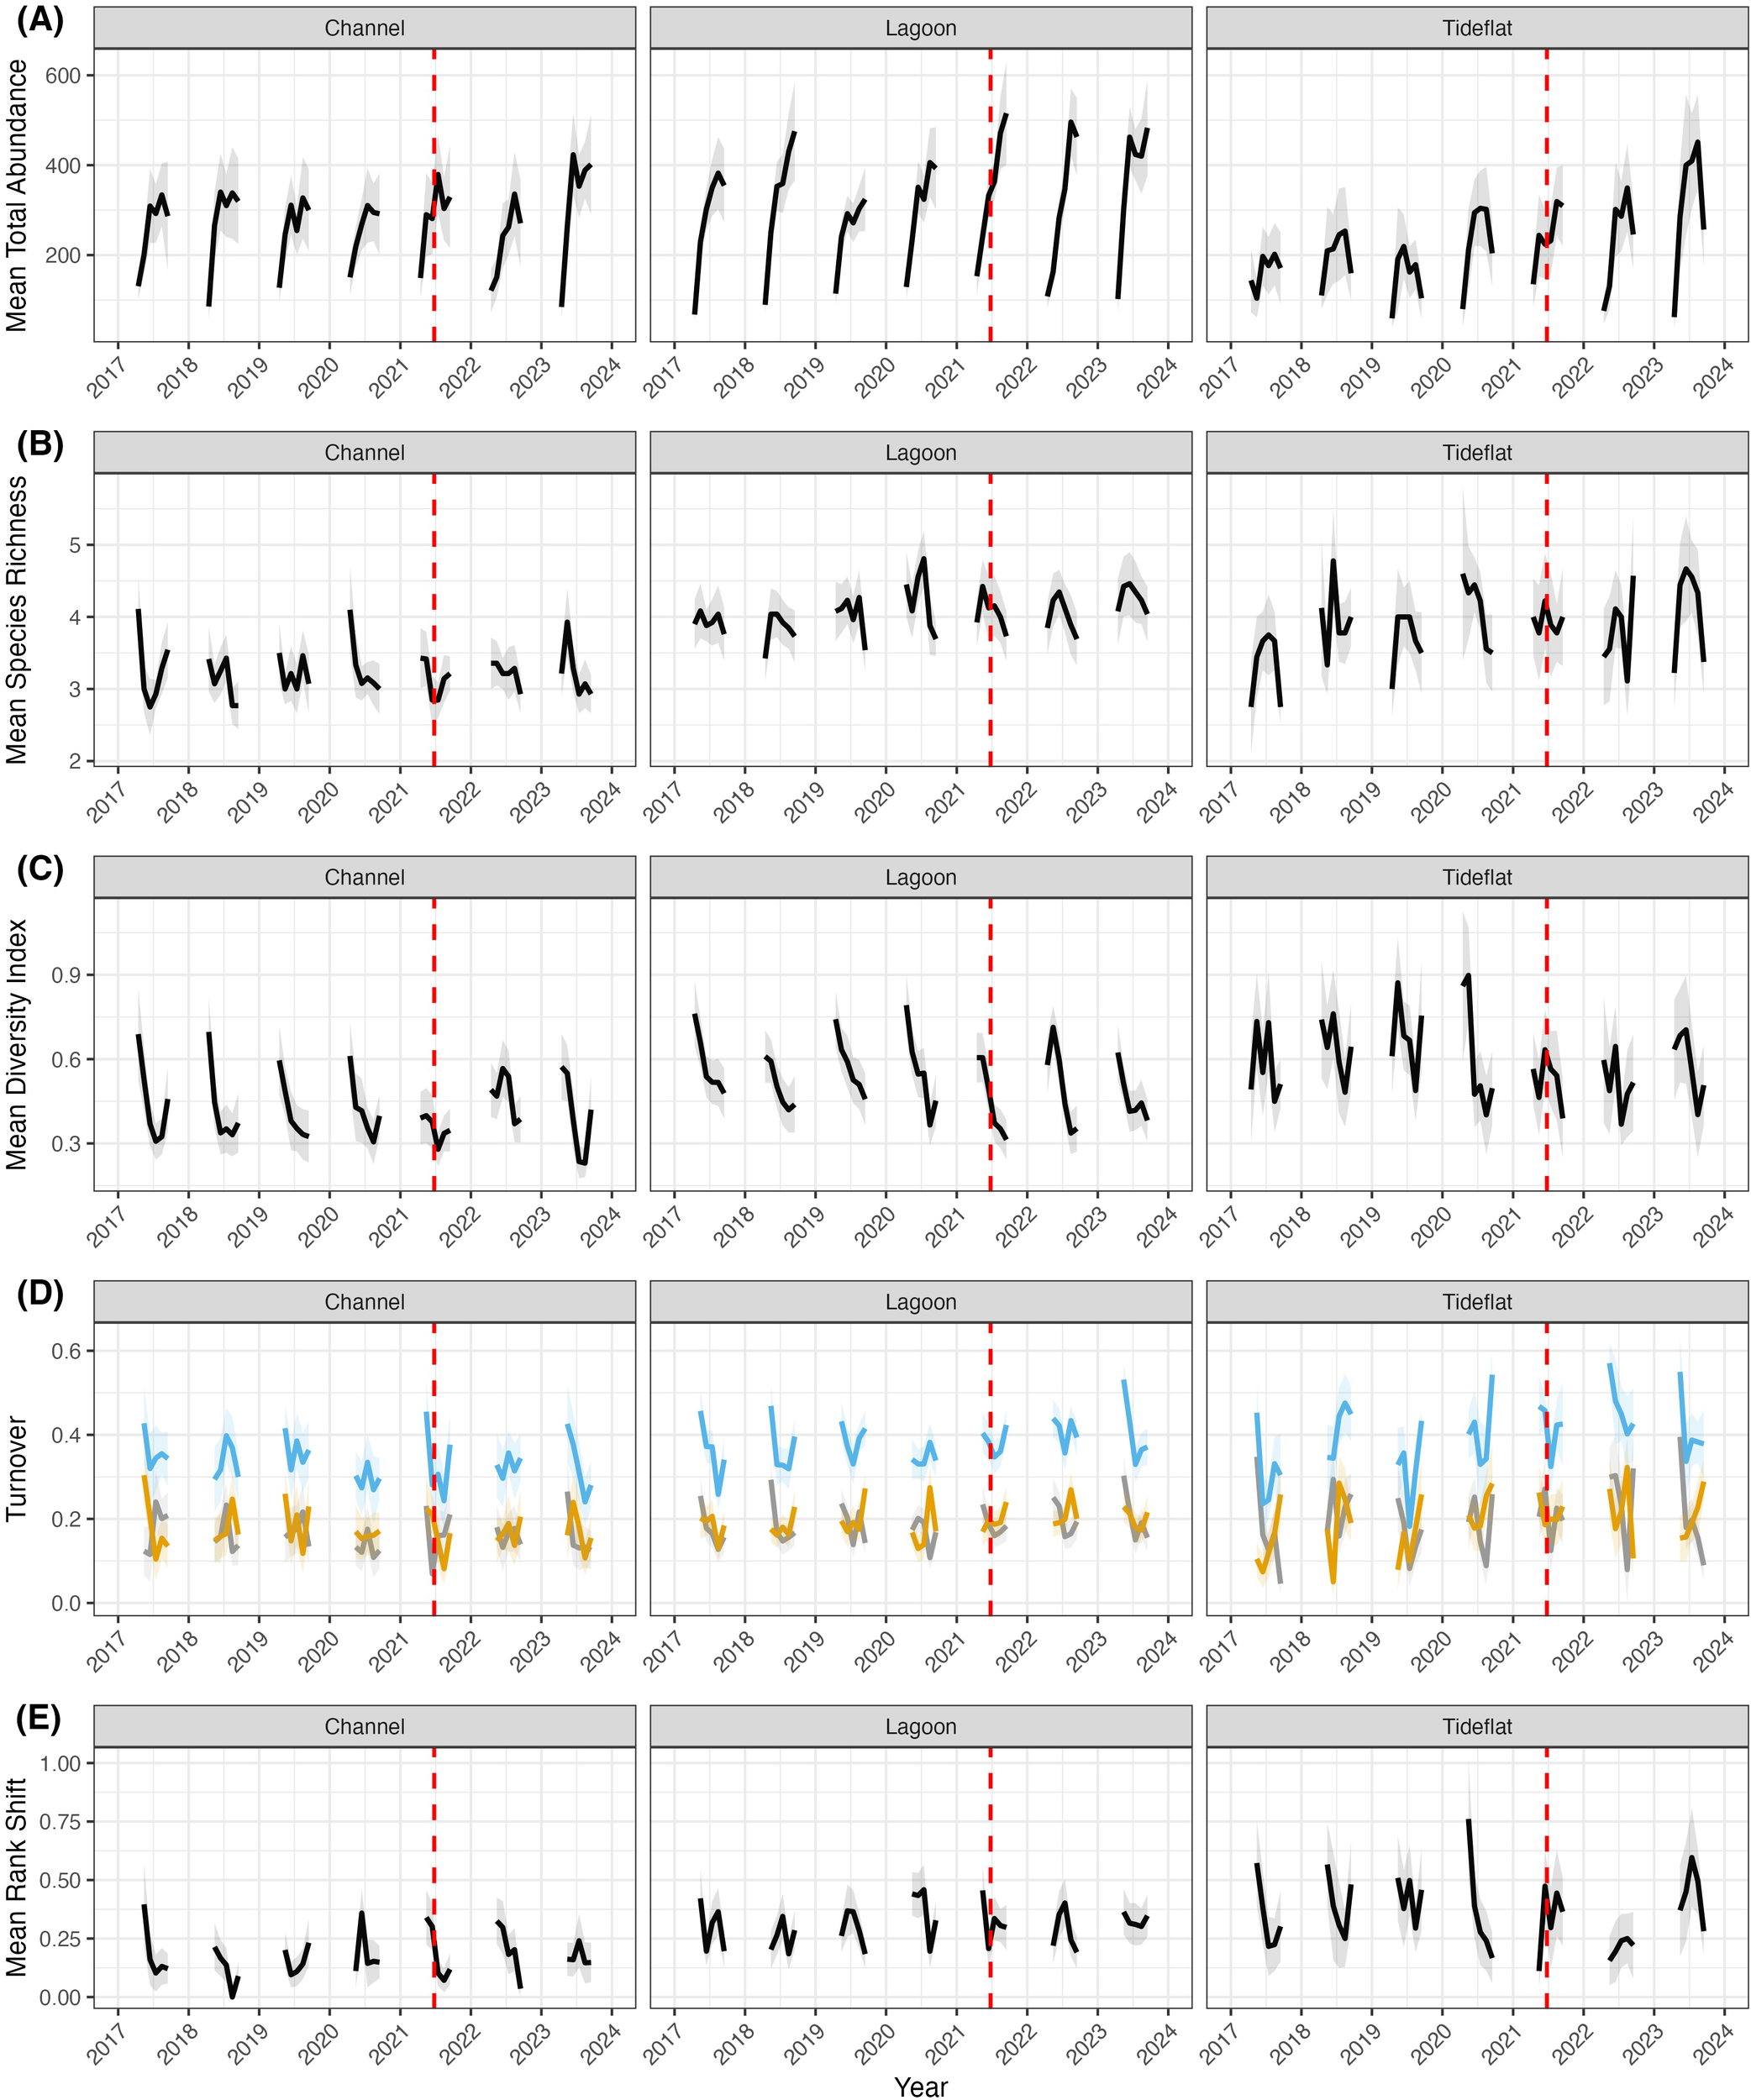
Temporal patterns in community metrics across channel, lagoon, and tideflat habitats from April to September. Univariate community metrics include (A) total abundance of all organisms, (B) species richness, (C) Shannon diversity index, (D) total species turnover (blue), species appearances (gray), species disappearances (yellow), and (E) rank shift. Values plotted are mean values (+/- SE) at the habitat scale per month averaged across multiple sites. The dashed red line indicates the start of the heatwave (June 25, 2021).
Community stability, as measured by species turnover, varied across habitat types (Table 1). Overall, mean monthly total turnover of species was highest at tideflats (0.41 +/- 0.01), intermediate in lagoons (0.40 +/- 0.01), and lowest in channels (0.35 +/- 0.01). Total turnover appeared to vary unpredictably across seasons for all years and habitat types, but tideflats had the greatest within-season variability in total turnover (Figure 3c). Species appearances and disappearances were similar in their variability and lack of pattern, and tideflats seemed to have the greatest variability in appearances and disappearances. Mean rank shift, a metric of a change in abundance ordering of species, followed a similar pattern to total turnover (Table 1), with tideflats having the highest overall mean rank shift (0.36 +/- 0.03), lagoons having an intermediate mean rank shift (0.31 +/- 0.01), and channels having the lowest mean rank shift (0.17 +/- 0.01). The variability in mean rank shift within seasons and over years did not appear to follow any obvious patterns, and tideflats had the highest variability in mean rank shift within seasons and across years (Figure 3e).
Despite qualitative differences in univariate metrics across years and habitat types, there was no statistical difference in multivariate community composition across years or the interaction between habitat type and year (Supplementary Table S1). We also did not detect a significant influence of year or the interaction between year x habitat type on individual species (Supplementary Table S1).
Effects of the 2021 heatwave
The impact of the atmospheric heatwave of June 2021 on water temperature varied across sites within the Crab Team monitoring network (Supplementary Figure S1). Daily maximum water temperature during the heatwave window exceeded water temperatures during the same timeframe of other years at only a few sites, and there was a trend toward a disproportionate impact on channel sites compared to lagoons (Figure 4).
Figure 4
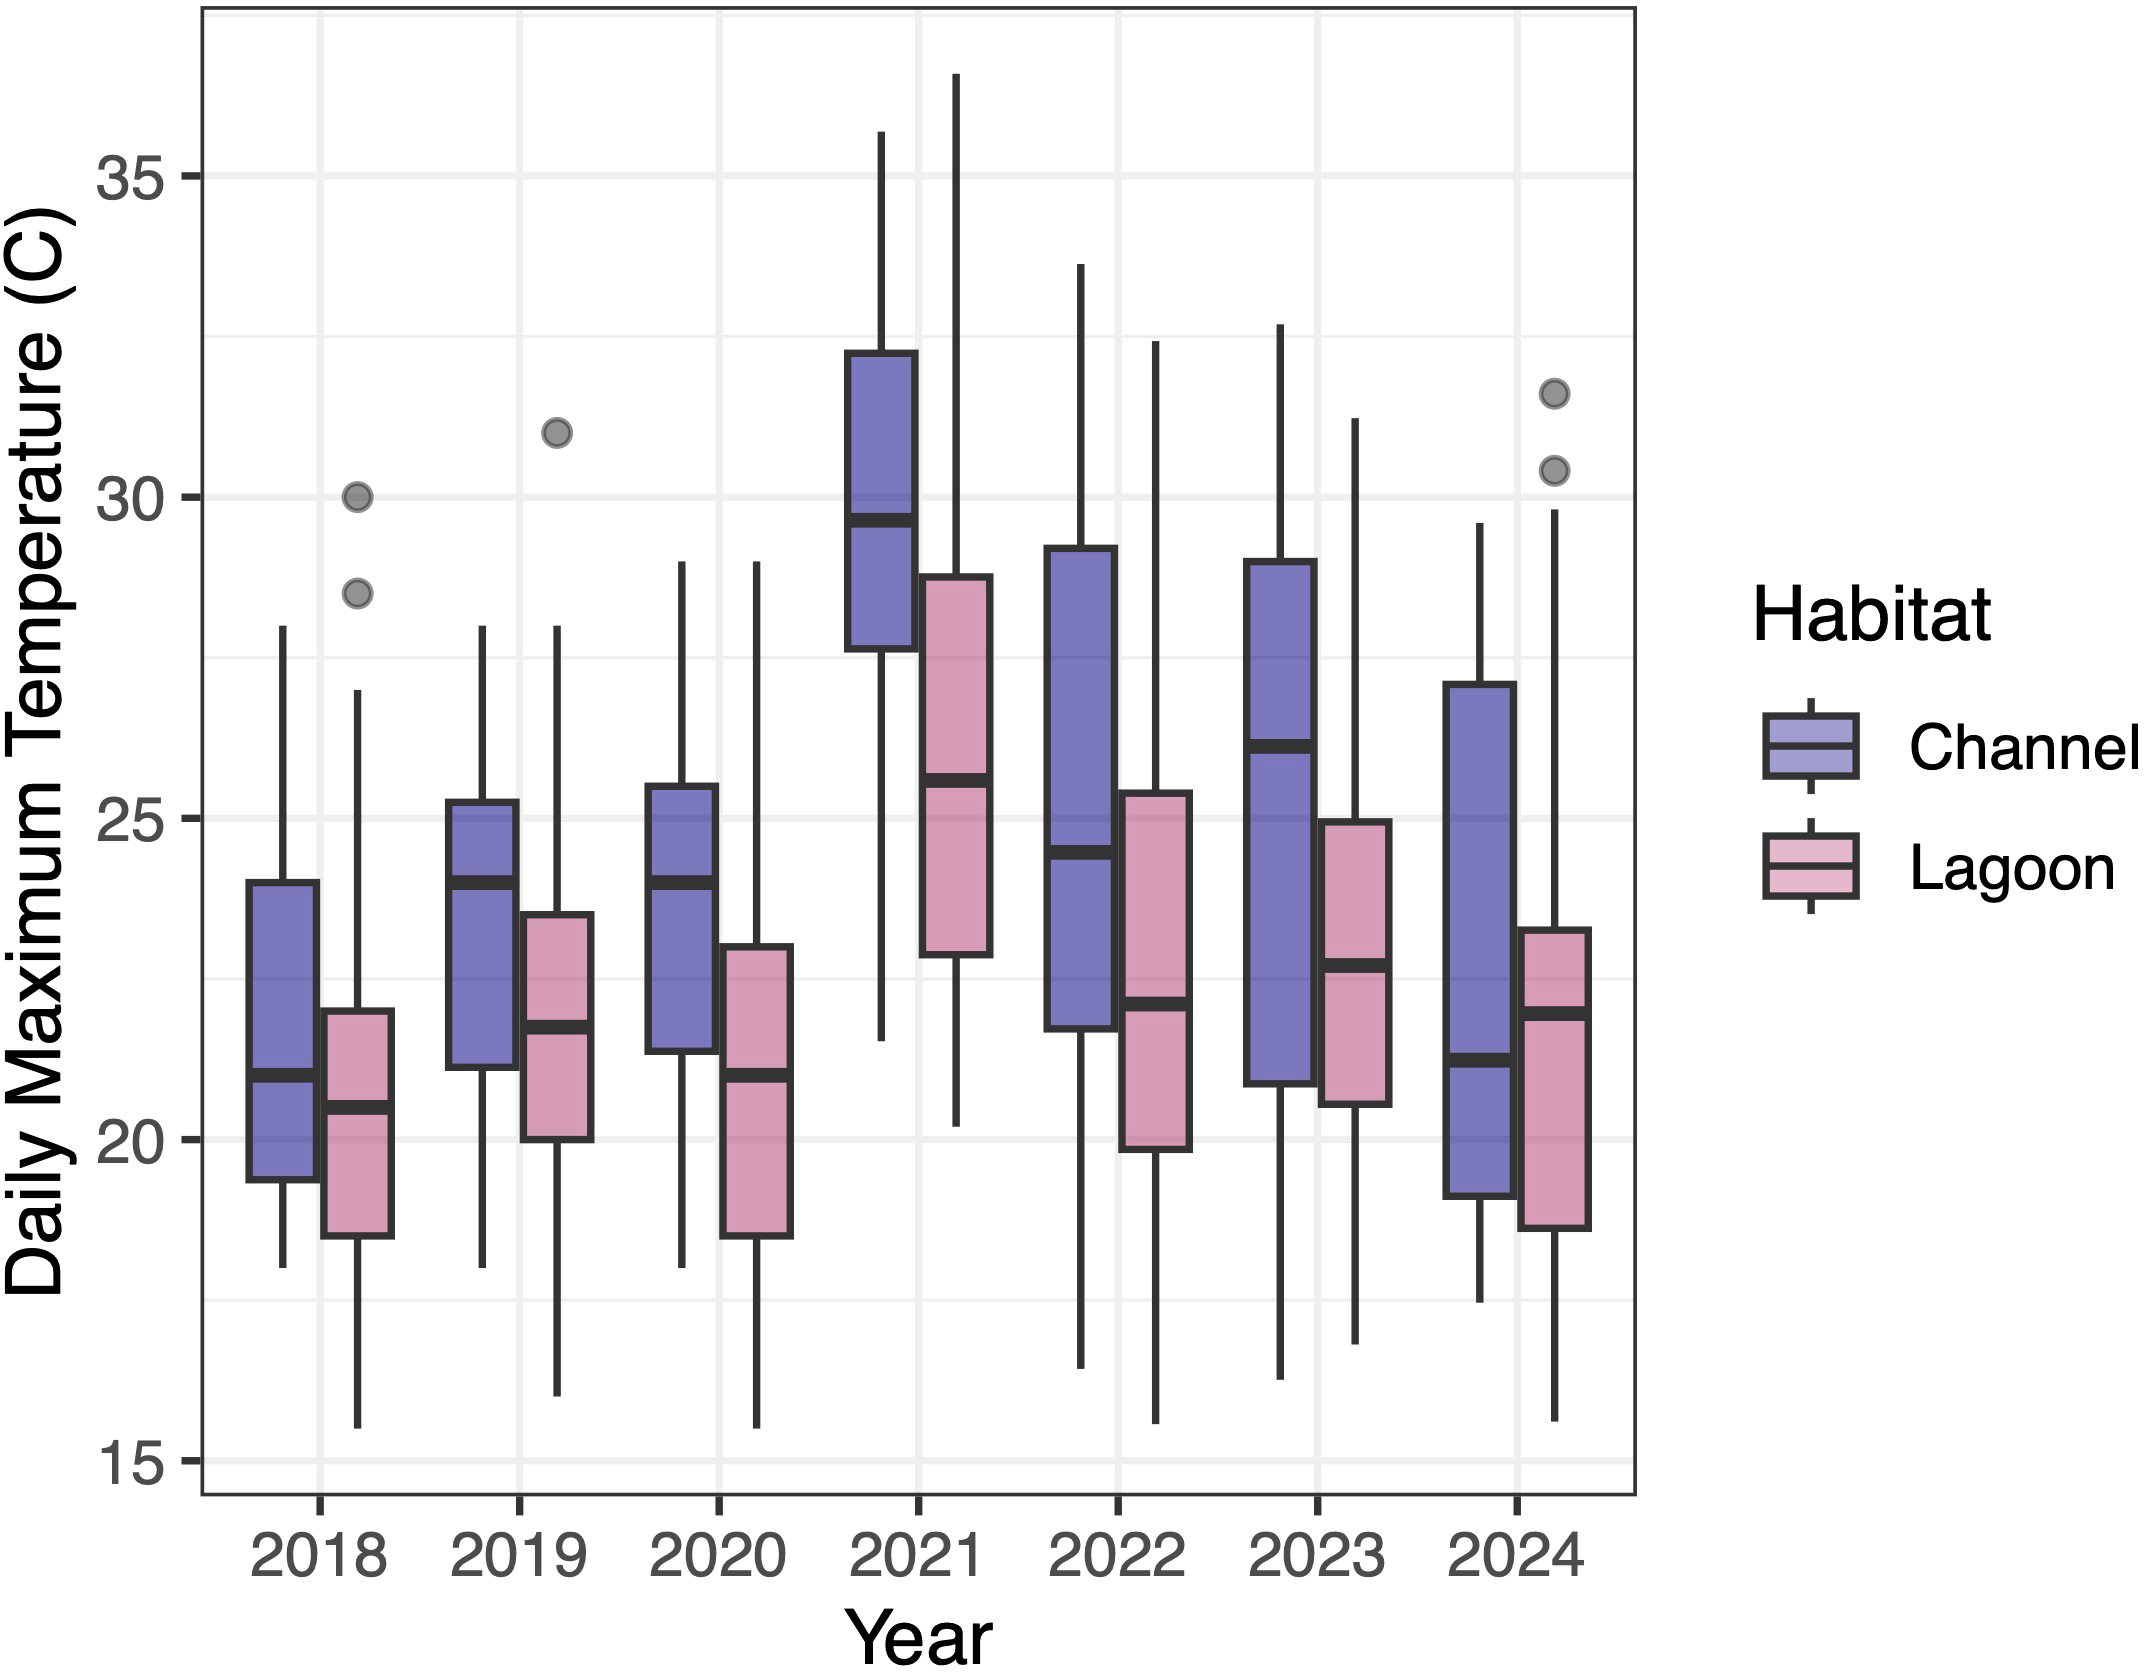
Box plot (thick horizontal line is median) of daily maximum water temperature (°C) by habitat type of a subset of Crab Team monitoring network sites (n =22, 15 lagoon and 7 channel sites) by year during the four days of the year (day 177 through day 180) over which the atmospheric heat dome was recorded in 2021. The line in the middle of each box represents the median value for daily maximum water temperature. Temperature loggers were not deployed in tideflat habitats due to intermittent exposure concerns.
As reported above, communities did not differ significantly across years (Supplementary Table S1, ANOVA; LR8,334 = 367.1, p=0.559), including the year of the heatwave (2021). There did not appear to be any noticeable acute (within season) or interannual effects of the heatwave on univariate community metrics (Figure 3), and community metrics followed similar patterns to those in each habitat type across other years. We did not find any significant change in community composition between May and July in 2021 (Supplementary Table S2, ANOVA; LR1,91 = 38.0, p=0.227), and while there was a significant change in community structure between months in 2017 (Supplementary Table S2, ANOVA; LR1,88 = 53.3, p =0.018), this was not the case in other years. When looking at the change in abundance from May to July for individual taxa in 2021, Hemigrapsus oregonensis and Cymatogaster aggregata increased in abundance in lagoons, but all other 95% confidence intervals for Cohen’s D effect size crossed zero (Figure 5), suggesting there was no measurable net increase or decrease during this portion of the season. The increase in abundance for H. oregonensis and C. aggregata in lagoons in 2021 appears to be a potentially significant seasonal trend, as similar increases were seen in other years. Further, there are no taxonomic groups for which the effect size during 2021 didn’t overlap with the 95% confidence interval in other years. There is potentially a trend for Metacarcinus magister to have decreased in abundance during the heatwave in channel habitats; however, despite a possible deviation from other years, the 95% confidence overlaps with 0 and thus is non-significant.
Figure 5
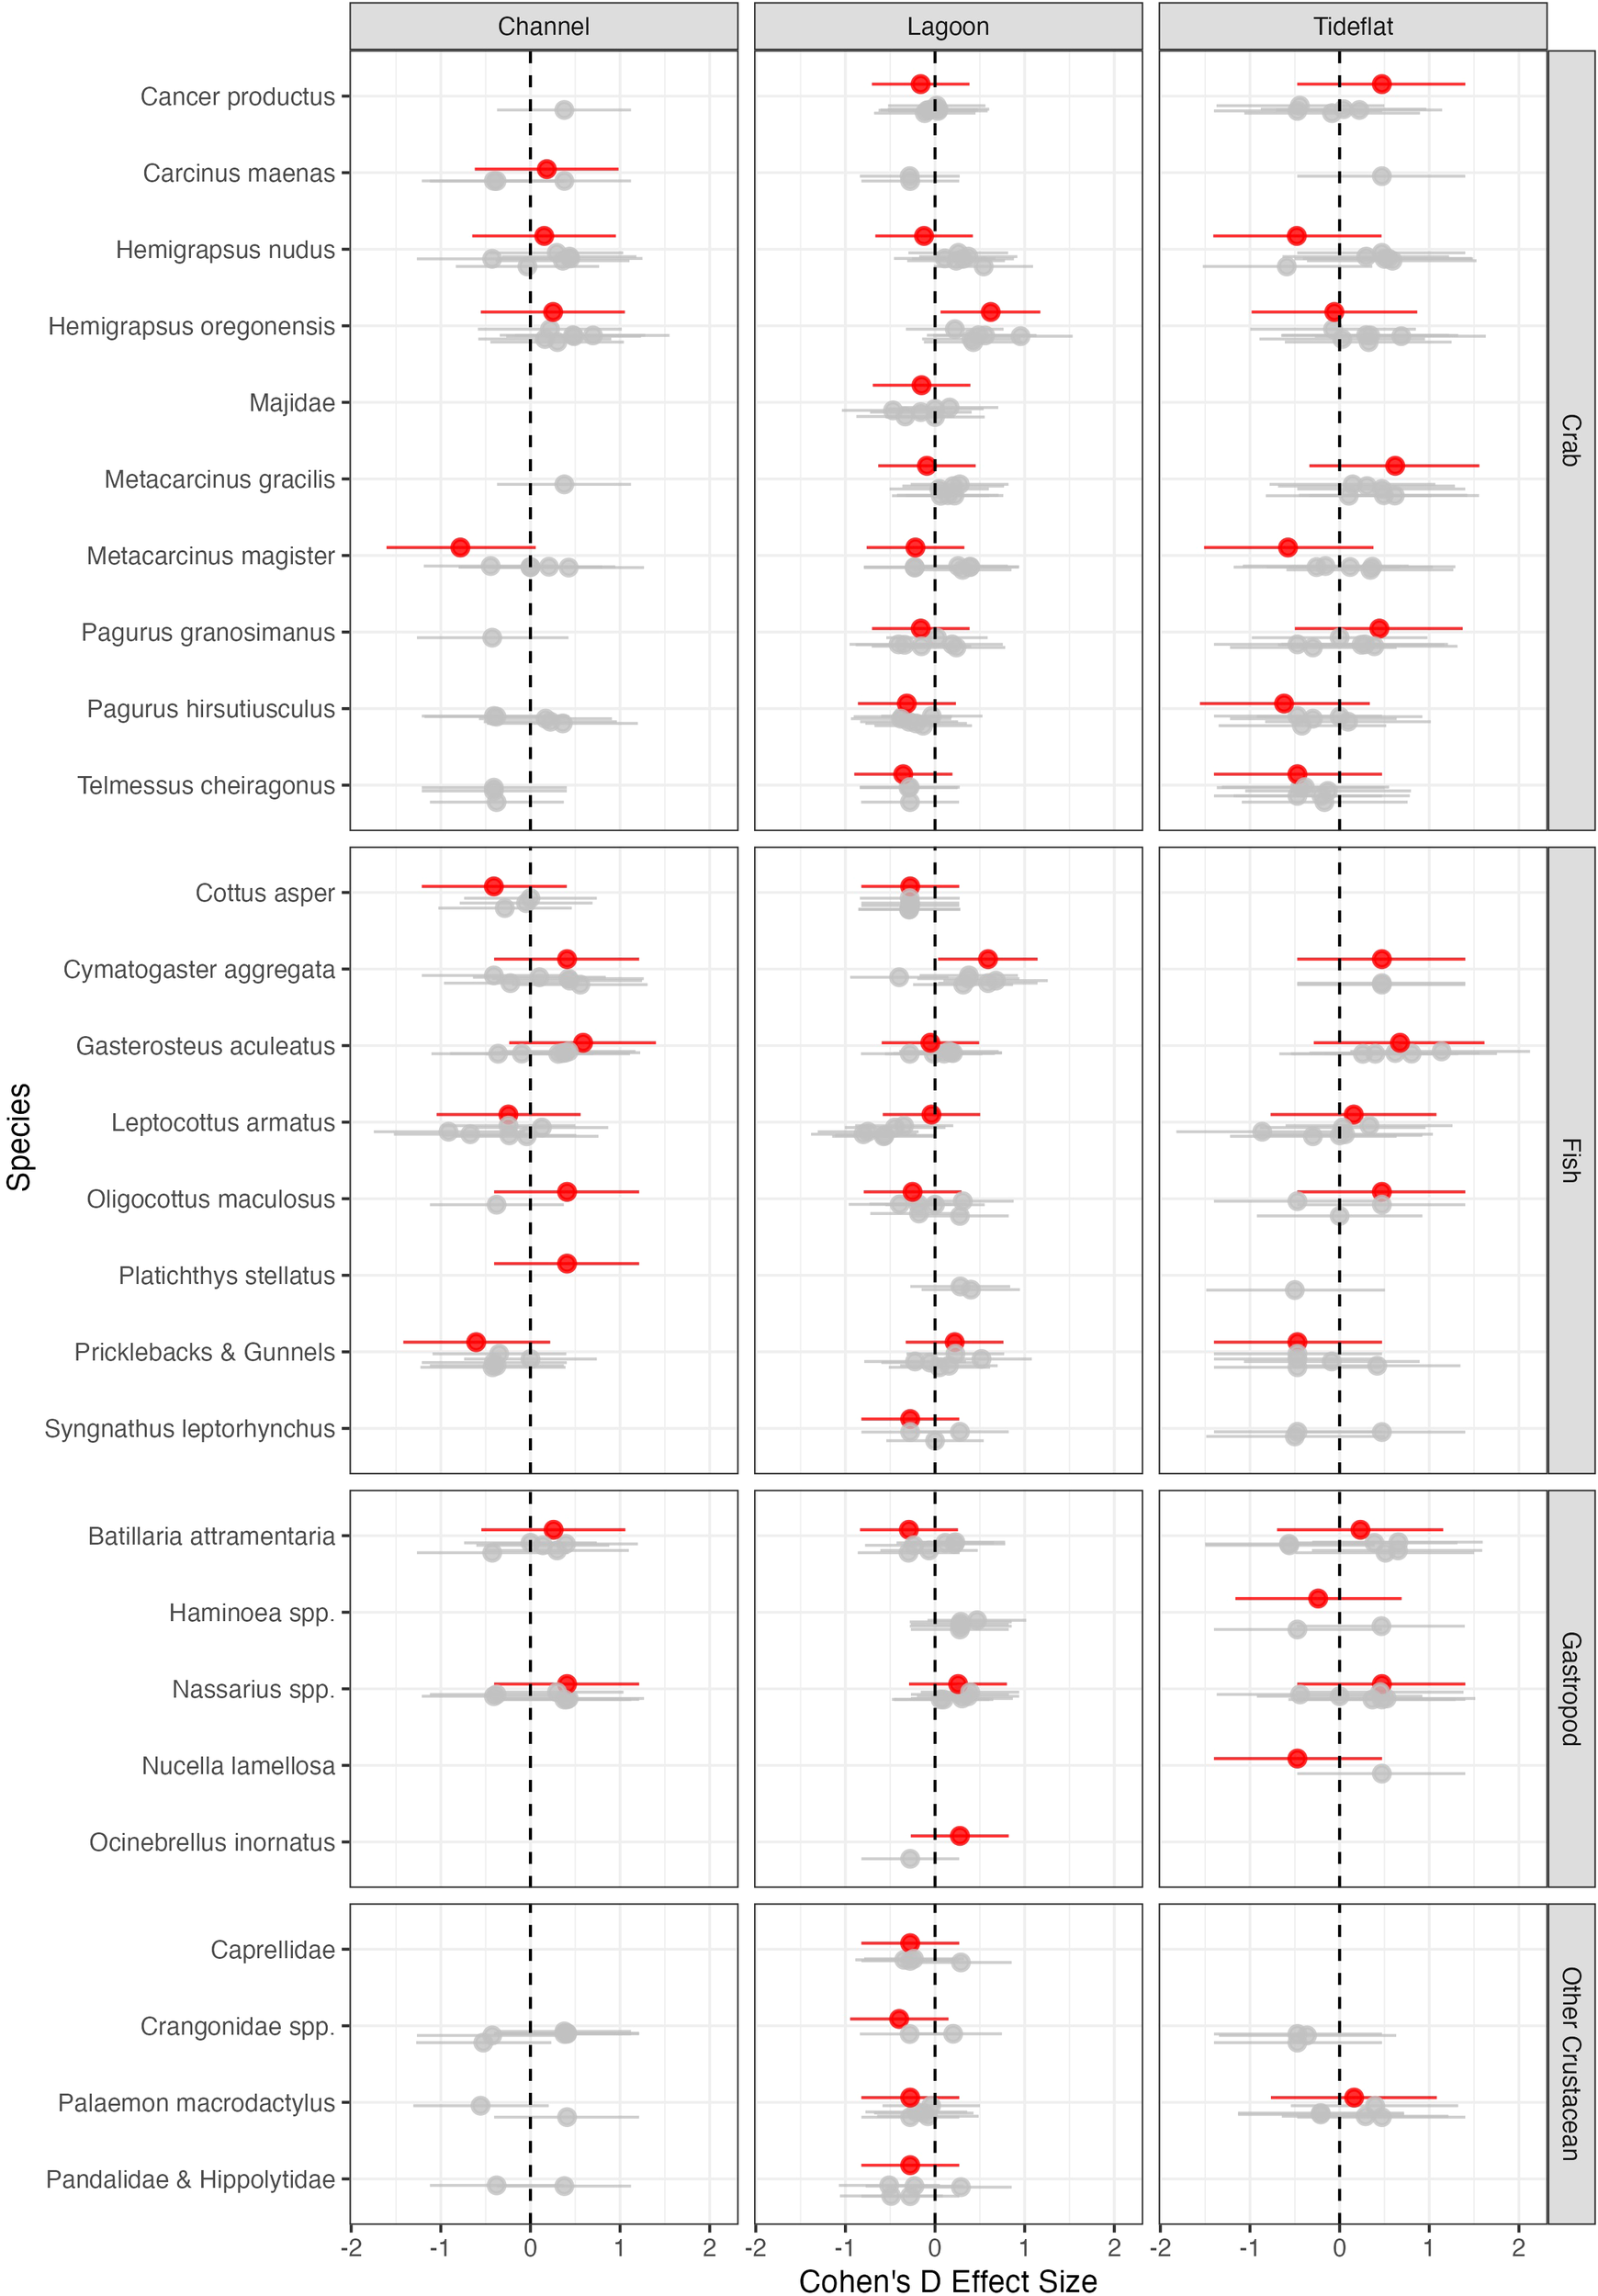
Change in abundance from May to July during 2021 (red) and in other years (gray) as measured by Cohen’s D effect size. Values represent the mean (+/- 95% CI) for each taxa separated by taxonomic group in each habitat type averaged across all sites in that habitat type.
Discussion
This work demonstrates how participatory science can be an effective tool in gathering high resolution and high-quality data. We presented data collected by 527 individual participants across 49 sites over the course of seven years, encompassing 28,232 hours of effort. Through this sampling, participating monitors captured a total of 568,281 individual organisms representing at least 56 different species. The high temporal and taxonomic resolution of monitoring efforts enabled improved understanding and characterization of shallow subtidal communities across the Salish Sea. Additionally, the decadal time scale of monitoring accomplished to date provides an ecological baseline for communities against which we were able to evaluate the effect of an acute climate stressor in the context of typical seasonal and interannual community variability.
Community composition and scales of community change
We found that communities differed across habitat types in consistent ways over time (Summarized in Table 1). Channels tended to be intermediate in abundance, fairly low in richness and diversity, and had the highest stability, as measured through species turnover and mean rank shift, of all habitat types (Table 1, Figure 3). In our network of sites, channel habitats may be the most variable in terms of environmental factors such as temperature and salinity, due to the low water volume relative to surface area. Indeed, temperature data from these sites demonstrates greater daily, weekly, and monthly, variability in channels relative to lagoons (Crab Team, unpublished data). It is likely that higher environmental variability resulted in consistent communities here that are intermediate in abundance but low in diversity, characterized by stress-tolerant species. Lagoon habitats had the highest total abundance and species richness, intermediate levels of diversity, and intermediate community stability (Table 1, Figure 3). The semi-enclosed and protected nature of lagoon habitats, with only periodic tidal exchange, allows for the lowest amount of disturbance and change in water temperature, potentially resulting in a favorable environment for many taxa (de Wit, 2011). These lagoon features align with the communities we documented– lagoons had the highest abundance and had a high richness of species with a preference for low-flow environments such as Gasterosteus aculeatus, Pagurus hirsutiusculus, Pagurus granosimanus, Nassarius spp., Majidae, and Caprellidae. Tideflats had the lowest abundance, intermediate but high species richness, the highest diversity, and the lowest community stability as measured through the highest species turnover and mean rank shift values (Table 1, Figure 3). Tideflats experience the greatest immersion stressors, with frequent changes in depth and exposure to air and solar radiation. Many intertidal species have adapted to these conditions and can tolerate high levels of environmental stress, such as Batillaria attramentaria and Haminoea spp., and highly mobile species, such as Metacarcinus gracilis, Palaemon macrodactylus, and Telmessus cheiragonus, are able to navigate these environments and move to more stable ones when needed.
While we found that communities varied across habitat types, we did not find any significant changes in community composition across years. Given seasonal variability in communities is already high, it may be difficult to detect interannual changes or long-term trends in community composition. Nearshore marine organisms at temperate latitudes experience strong seasonal changes in environmental conditions and resources. For example, benthic communities in San Francisco Bay fluctuate drastically across seasons due to changes in freshwater input and the corresponding influence on salinity, sediment movement, and nutrient deposition (Nichols and Thompson, 1985). The nearshore subtidal communities across the Salish Sea are influenced by numerous sources of freshwater input that can vary in flow drastically within a given year. Rivers feeding into the Salish Sea deposit nutrients into the local environment, and seasonal variability in flow results in greater freshwater inputs from distant rivers (i.e. the Fraser and Skagit) in the spring and summer (Banas et al., 2015). Given the seasonal changes in temperature, freshwater input, and other environmental conditions, properties of ecological communities can vary markedly within a trapping season (Figure 3), but tend to be similarly variable across years with few long-term (interannual) trends. Seasonal variation can be best understood via decomposition of a time series (Verbesselt et al., 2010), and while we did not do this with the data presented here, we were still able to document some seasonal variability across habitat types. This was only possible through the monthly sampling we achieved with a participatory science program. This seasonal variation highlights the risk of making comparisons across multiple years based on single sampling events, as is often the case with large scale monitoring programs.
Heatwave impacts
Ecological communities within the Crab Team monitoring network did not demonstrate significant short- or long-term changes as a result of the 2021 atmospheric heatwave. Community metrics were similar during 2021 to other years and, there were no discernable mid-season changes in community metrics in 2021 which we would have expected as a response to the June heatwave. Multivariate community composition did not significantly differ between May and July the year of the heatwave and in the majority of other years (Supplementary Table S2). When looking at individual taxa, we found that H. oregonensis and C. aggregata experienced an increase from May to July in lagoons during the heatwave year; however, this is likely seasonal as this same increase was seen in other years (Figure 5). If we had sampled only in 2021, we might falsely infer that H. oregonensis and C. aggregata experienced increases in abundance in lagoons as a result of the heatwave. The change in abundance of other taxa between May and July in the heatwave year had overlapping 95% confidence intervals with other years, suggesting this year did not have anomalous changes in abundance.
Thus far, there has been little evidence of substantial change of intertidal communities as a result of the 2021 atmospheric heat dome (Raymond et al., 2022, 2024; Miner et al., 2025). At Crab Team network sites, the atmospheric heat dome only resulted in elevated water temperature at some sites. This occurred despite the observation that pocket estuary habitats, typically shallow with substantial periods of aerial exposure and only intermittent connection to open marine waters, might be expected to be the marine habitats most susceptible to extreme water temperatures. The variability of impact of the atmospheric heatwave on water temperatures across sites highlights that site morphology and connectivity, rather than habitat type, per se, is an important factor in determining the temperatures experienced by fauna. We note that the analysis of community responses to the atmospheric heatwave included tideflat habitats, yet we lack water temperature data from any sites of this habitat type for comparison to channel and lagoon habitats. Thus, the question of how tideflat water temperatures compare to those observed in lagoon or channel sites remains unresolved but potentially informative to mechanisms of stressor mitigation.
Through the combination of large scale long-term monitoring and small scale site-level reports from participants, we show that the effects of the heatwave were minimal, either undetectable, or resolved rapidly, for shallow subtidal mobile estuarine epifauna, which is in line with the results of other studies in the Salish Sea (Raymond et al., 2024; Miner et al., 2025). Intertidal, infaunal bivalves changed in mean size, yet there was little statistical evidence of effects of the heatwave on bivalves (Raymond et al., 2024). Raymond et al. (2024) acknowledged that their sampling was opportunistic and unstandardized, calling for alternative survey and monitoring approaches that constrain variability. In rocky intertidal habitats of the Salish Sea, the heatwave resulted in short term impacts on three sessile intertidal organisms, rockweed, barnacles, and mussels, but evidence of a long- term (i.e. one year) impact on mussels at only a single site (Miner et al., 2025). In that study, the MaRINE monitoring network used a standardized monitoring sampling approach, which allowed for more nuanced site-level information, but short-term monitoring was only feasible at a small subset of network sites, limiting ability to generalize, or detect rare mechanisms for impact. While the information we present here is mostly focused at a regional scale on a greater diversity of taxa, we also were able to gather site-level information by speaking with participants. Follow up communication with Crab Team participants after the June 2021 heatwave yielded only one report of barnacle mortality as part of a shoreline survey (data not presented here).
Through consistent monthly sampling over seven years, the Crab Team dataset captured high variability in communities in line with previous findings (Raymond et al., 2024). This variability suggests that the lack of ability to detect an effect of acute climate stressors may not be inherent to the methodology, but rather an indication of stress-tolerance and adaptation in ecological communities. Indeed, while the water temperatures experienced during the atmospheric heatwave may have been unusually warm for that time of year for a subset of sites, the multi-year temperature records show that organisms at most sites experience temperature in that range later in the summer. Thus, though the timing of the water temperatures may have been unusual, they may have been within the limits of thermal tolerance for the species in pocket estuary habitats. On one hand, organisms living in these environments have evolved physiological or behavioral adaptations to these changes that can obscure or quickly recover from the impact of extreme perturbations, or long-term baseline shifts. On the other hand, many intertidal organisms may already be experiencing, at least periodically, the extremes of their tolerances, and may therefore yet be vulnerable to change in frequency or intensity of extreme events, or shifts in baseline conditions.
Application of participatory Science
The work described herein highlights one application of participatory science data for evaluating the impact of agents of global change. More broadly, participatory science has emerged as a transformative approach for addressing global environmental challenges by expanding the scale and scope of data collection. It enables researchers to access data from remote or under-studied areas that are often difficult or cost-prohibitive to survey systematically and/or consistently (Dickinson et al., 2012). Additionally, the participation of community members over extended periods allows for the tracking of temporal trends, such as seasonal shifts in phenology or long-term climate impacts, providing critical insights into environmental change (Bonney et al., 2014), as demonstrated in large-scale monitoring programs like the National Phenology Network; CoCoRaHS Community, Collaborative Rain, Hail, Snow Network; and COASST Coastal Observatory and Seabird Survey Team (Cifelli et al., 2005; Litle et al., 2007; Schwartz et al., 2012). The diverse and widespread contributions of participants also enhance data resolution and facilitate the detection of fine-scale variability in dynamic systems, which is especially important in heterogeneous landscapes or highly variable ecosystems (Theobald et al., 2015). Together, these attributes position participatory science as a vital tool for addressing data gaps and improving the capacity to study and respond to global environmental change, despite the important, but significant investments of time, cost, and care that are required to involve large numbers of non-professional participants in a robust, large-scale monitoring program.
Participatory science data was able to support our analysis because of three key components of the program design. One, data submission from the participating monitors consisted of datasheet-photograph pairs, where trap contents were available for review both as enumerated measurements and as images by trap such that organism identification could be validated. This style of submission enabled an expert staff to confirm observations, building reliability into the resulting dataset. Two, program staff maintain full characterizations of each monitoring site through initial assessments and regular onsite visits to monitor for changes. Being able to describe and group similar sites provides additional features that aid in interpretation of trends, which supports analyses of ecological patterns as we demonstrate through this study. Three, the data collection protocols intentionally included measurements beyond green crab, our target organism. Observations of additional organisms, as well as the seasonally deployed temperature loggers, provide complementary datasets that allow us to better understand findings related to our target species while also generating a peripheral dataset useful for exploring other important ecological topics. We recommend future ecological monitoring programs that intend to engage volunteers in data collection place a high value on the design of protocols, including quality assurance measures, that will produce highly used data. Additionally, designing programs with intentional enrichment, data sharing, and educational opportunities offered to participants can provide them with educational and social benefits (Price and Lee, 2013; Lewandowski and Oberhauser, 2017). Participatory science programs designed and managed with data use in mind from the start can enrich participant experience by further leveraging their efforts for effective science (Parrish et al., 2018).
Statements
Data availability statement
The original contributions presented in the study are included in the article/Supplementary Material. The datasets are available in online repositories and can be accessed at the following DOI: https://doi.org/10.5061/dryad.0rxwdbsdt. Further inquiries can be directed to the corresponding author.
Ethics statement
Ethical approval was not required for the study involving animals in accordance with the local legislation and institutional requirements because This research was permitted through Washington Department of Fish & Wildlife AIS Permit No. EGC.001-24, AIS Permit No. EGC.001-23, AIS Permit No. EGC.2022.001, and NOAA Section 10(a1A) Endangered Species Act Scientific Research Permit 26359. All vertebrates captured in traps were immediately released upon identification and enumeration. None were removed from the field or altered in any way.
Author contributions
BR: Conceptualization, Formal analysis, Methodology, Visualization, Writing – original draft, Writing – review & editing. EG: Conceptualization, Data curation, Funding acquisition, Investigation, Methodology, Project administration, Resources, Software, Supervision, Visualization, Writing – original draft, Writing – review & editing. PM: Conceptualization, Funding acquisition, Investigation, Methodology, Supervision, Writing – original draft, Writing – review & editing. LW: Investigation, Project administration, Writing – original draft, Writing – review & editing.
Funding
The author(s) declare financial support was received for the research and/or publication of this article. United States Environmental Protection Agency assistance agreements PC 00J29801, PC-00J90701, PC-01J22301. The Washington Department of Fish and Wildlife contracts 17-09728, 19-13737, 20-15421, 23-24088. The National Science Foundation Division of Ocean Sciences award #1850945. The contents of this document do not necessarily reflect the views and policies of the Environmental Protection Agency, the Washington Department of Fish and Wildlife, or the National Science Foundation, nor does mention of trade names or commercial products constitute endorsement or recommendation for use.
Acknowledgments
The collaborative work described in this paper would not be possible without the hundreds of community science volunteers, agency partners, tribal partners, and students who have contributed to data collection across Washington’s shorelines since 2015. We are especially grateful to the Crab Team site hosts, who provide local expertise and logistical support, and the volunteers, who monitor these pocket estuaries and shoreline habitats, rain or shine, April-September. We thank Crab Team staff J. Adams, K. Litle, and A. Stote for providing insightful feedback in the conceptualization of this manuscript, securing funding, and keeping Crab Team running. We are grateful for Crab Team staff and student assistants, including Z. Bengtsson, A. Hori, E. Kelsey, K. Martin, S. McMahon, and A. Stote, who assisted with participant trainings, data collection/management, communications, and logistical support of participants. We acknowledge the significant role and partnership of tribes in the monitoring work included in this study, including the Samish, Swinomish, Stillaguamish, Lower Elwha Klallam, Jamestown S’Klallam, and Port Gamble S’Klallam. The monitoring data for this work was collected on traditional and unceded territories of the Coast Salish, Washkan, and Chimakuan people who have cared for and tended this land since time immemorial. We pay our respect to elders past and present and include this acknowledgment as one part of our commitment to working to create inclusive and respectful partnerships that honor Indigenous cultures, histories, identities, knowledges, and sociopolitical realities, that dismantle ongoing legacies of settler colonialism, and that recognize the hundreds of indigenous Nations who continue to resist, live, and uphold their sacred relations across their lands.
Conflict of interest
The authors declare that the research was conducted in the absence of any commercial or financial relationships that could be construed as a potential conflict of interest.
Generative AI statement
The author(s) declare that no Generative AI was used in the creation of this manuscript.
Any alternative text (alt text) provided alongside figures in this article has been generated by Frontiers with the support of artificial intelligence and reasonable efforts have been made to ensure accuracy, including review by the authors wherever possible. If you identify any issues, please contact us.
Publisher’s note
All claims expressed in this article are solely those of the authors and do not necessarily represent those of their affiliated organizations, or those of the publisher, the editors and the reviewers. Any product that may be evaluated in this article, or claim that may be made by its manufacturer, is not guaranteed or endorsed by the publisher.
Supplementary material
The Supplementary Material for this article can be found online at: https://www.frontiersin.org/articles/10.3389/fmars.2025.1584193/full#supplementary-material
References
1
Banas N. S. Conway-Cranos L. Sutherland D. A. MacCready P. Kiffney P. Plummer M. (2015). Patterns of river influence and connectivity among subbasins of Puget sound, with application to bacterial and nutrient loading. Estuaries Coasts38, 735–753. doi: 10.1007/s12237-014-9853-y
2
Bergshoeff J. A. McKenzie C. H. Favaro B. (2019). Improving the efficiency of the Fukui trap as a capture tool for the invasive European green crab (Carcinus maenas) in Newfoundland, Canada. PeerJ7, e6308. doi: 10.7717/peerj.6308
3
Bonney R. Shirk J. L. Phillips T. B. Wiggins A. Ballard H. L. Miller-Rushing A. J. et al . (2014). Next steps for citizen science. Science343, 1436–1437. doi: 10.1126/science.1251554
4
Brown E. D. Williams B. K. (2019). The potential for citizen science to produce reliable and useful information in ecology. Conserv. Biol.33, 561–569. doi: 10.1111/cobi.13223
5
Cifelli R. Doesken N. Kennedy P. Carey L. D. Rutledge S. A. Gimmestad C. et al . (2005). The Community Collaborative Rain, Hail, and Snow Network: Informal Education for Scientists and Citizens. Bulletin of the American Meteorological Society86, 1069–1077. doi: 10.1175/BAMS-86-8-1069
6
Conrad C. C. Hilchey K. G. (2011). A review of citizen science and community-based environmental monitoring: issues and opportunities. Environ. Monit. Assess.176, 273–291. doi: 10.1007/s10661-010-1582-5
7
de Wit R. (2011). “ Biodiversity of coastal lagoon ecosystems and their vulnerability to global change,” in Ecosystems Biodiversity ( IntechOpen). doi: 10.5772/24995
8
Dickinson J. L. Shirk J. Bonter D. Bonney R. Crain R. L. Martin J. et al . (2012). The current state of citizen science as a tool for ecological research and public engagement. Front. Ecol. Environ.10, 291–297. doi: 10.1890/110236
9
Duarte C. M. (2014). Global change and the future ocean: a grand challenge for marine sciences. Front. Mar. Sci.1. doi: 10.3389/fmars.2014.00063
10
Gooday A. J. Jorissen F. Levin L. A. Middelburg J. J. Naqvi S. W. A. Rabalais N. N. et al . (2009). Historical records of coastal eutrophication-induced hypoxia. Biogeosciences6, 1707–1745. doi: 10.5194/bg-6-1707-2009
11
Grason E. McDonald S. Adams J. Litle K. Apple J. Pleus A. (2018). Citizen science program detects range expansion of the globally invasive European green crab in Washington State (USA). Manage. Biol. Invasions9, 39–47. doi: 10.3391/mbi.2018.9.1.04
12
Grosholz E. D. Ruiz G. M. (1996). Predicting the impact of introduced marine species: Lessons from the multiple invasions of the European green crab Carcinus maenas. Biol. Conserv.78, 59–66. doi: 10.1016/0006-3207(94)00018-2
13
Hallett L. M. Jones S. K. MacDonald A. A. M. Jones M. B. Flynn D. F. B. Ripplinger J. et al . (2016). codyn: An r package of community dynamics metrics. Methods Ecol. Evol.7, 1146–1151. doi: 10.1111/2041-210X.12569
14
Harley C. D. G. Hughes A. R. Hultgren K. M. Miner B. G. Sorte C. J. B. Thornber C. S. et al . (2006). The impacts of climate change in coastal marine systems. Ecol. Lett.9, 228–241. doi: 10.1111/j.1461-0248.2005.00871.x
15
Heeter K. J. Harley G. L. Abatzoglou J. T. Anchukaitis K. J. Cook E. R. Coulthard B. L. et al . (2023). Unprecedented 21st century heat across the Pacific Northwest of North America. NPJ Clim. Atmospheric Sci.6, 1–9. doi: 10.1038/s41612-023-00340-3
16
Hesketh A. V. Harley C. D. G. (2023). Extreme heatwave drives topography-dependent patterns of mortality in a bed-forming intertidal barnacle, with implications for associated community structure. Glob. Change Biol.29, 165–178. doi: 10.1111/gcb.16390
17
Huttunen K.-L. Mykrä H. Paavola R. Muotka T. (2018). Estimates of benthic invertebrate community variability and its environmental determinants differ between snapshot and trajectory designs. Freshw. Sci.37, 769–779. doi: 10.1086/700402
18
Kassambara A. (2023). rstatix: Pipe-friendly framework for basic statistical tests. Available online at: https://cran.r-project.org/web/packages/rstatix/index.html (Accessed October 21, 2024).
19
Kunze C. Wölfelschneider M. Rölfer L. (2021). Multiple driver impacts on rocky intertidal systems: the need for an integrated approach. Front. Mar. Sci.8. doi: 10.3389/fmars.2021.667168
20
Lewandowski E. J. Oberhauser K. S. (2017). Butterfly citizen scientists in the United States increase their engagement in conservation. Biol. Conserv.208, 106–112. doi: 10.1016/j.biocon.2015.07.029
21
Lindenmayer D. Likens G. (2018). Effective Ecological Monitoring ( Australia: Csiro Publishing).
22
Litle K. Parrish J. Dolliver J. (2007). “ The coastal observation and seabird survey team— Citizens monitoring coastal environmental health in Alaska,” in Community-Based Coastal Observing in Alaska: Aleutian Life Forum 2006. Ed. BrewerR. ( Alaska Sea Grant College Program, University of Alaska Fairbanks). doi: 10.4027/cbcoa.2007
23
Miner C. M. Berry H. D. Bohlmann H. Dethier M. N. Fradkin S. C. Gaddam R. et al . (2025). Location and natural history are key to determining impact of the 2021 atmospheric heatwave on Pacific Northwest rocky intertidal communities. Front. Mar. Sci.12. doi: 10.3389/fmars.2025.1503019
24
Molnar J. L. Gamboa R. L. Revenga C. Spalding M. D. (2008). Assessing the global threat of invasive species to marine biodiversity. Front. Ecol. Environ.6, 485–492. doi: 10.1890/070064
25
Nichols F. H. Thompson J. K. (1985). “ Time scales of change in the San Francisco Bay benthos,” in Temporal Dynamics of an Estuary: San Francisco Bay. Eds. CloernJ. E.NicholsF. H. ( Springer Netherlands, Dordrecht). doi: 10.1007/978-94-009-5528-8_8
26
O’Hara R. B. Kotze D. J. (2010). Do not log-transform count data. Methods Ecol. Evol.1, 118–122. doi: 10.1111/j.2041-210X.2010.00021.x
27
Oksanen J. Blanchet F. Friendly M. Kindt R. Legendre P. McGlinn D. et al . (2018). vegan: Community Ecology Package. R Package version 2.5-3. Available online at: http://CRAN.R-project.org/package=vegan.
28
Paine R. T. Levin S. A. (1981). Intertidal landscapes: disturbance and the dynamics of pattern. Ecol. Monogr.51, 145–178. doi: 10.2307/2937261
29
Parrish J. K. Burgess H. Weltzin J. F. Fortson L. Wiggins A. Simmons B. (2018). Exposing the science in citizen science: fitness to purpose and intentional design. Integr. Comp. Biol.58, 150–160. doi: 10.1093/icb/icy032
30
Philip S. Y. Kew S. F. van Oldenborgh G. J. Anslow F. S. Seneviratne S. I. Vautard R. et al . (2022). Rapid attribution analysis of the extraordinary heat wave on the Pacific coast of the US and Canada in June 2021. Earth Syst. Dyn.13, 1689–1713. doi: 10.5194/esd-13-1689-2022
31
Pinsky M. L. Selden R. L. Kitchel Z. J. (2020). Climate-driven shifts in marine species ranges: scaling from organisms to communities. Annu. Rev. Mar. Sci.12, 153–179. doi: 10.1146/annurev-marine-010419-010916
32
Price C. A. Lee H.-S. (2013). Changes in participants’ scientific attitudes and epistemological beliefs during an astronomical citizen science project. J. Res. Sci. Teach.50, 773–801. doi: 10.1002/tea.21090
33
Rabalais N. N. Turner R. E. Díaz R. J. Justić D. (2009). Global change and eutrophication of coastal waters. ICES J. Mar. Sci.66, 1528–1537. doi: 10.1093/icesjms/fsp047
34
Raymond W. W. Barber J. S. Dethier M. N. Hayford H. A. Harley C. D. G. King T. L. et al . (2022). Assessment of the impacts of an unprecedented heatwave on intertidal shellfish of the Salish Sea. Ecology103, e3798. doi: 10.1002/ecy.3798
35
Raymond W. W. Tobin E. D. Barber J. S. Hayford H. A. Raymond A. E. T. Speck C. A. et al . (2024). Short-term effects of an unprecedented heatwave on intertidal bivalve populations: fisheries management surveys provide an incomplete picture. Front. Mar. Sci.11. doi: 10.3389/fmars.2024.1390763
36
Schwartz M. D. Betancourt J. L. Weltzin J. F. (2012). From Caprio’s lilacs to the USA national phenology network. Front. Ecol. Environ.10, 324–327. doi: 10.1890/110281
37
Sousa W. P. (1984). The role of disturbance in natural communities. Annu. Rev. Ecol. Syst.15, 353–391. doi: 10.1146/annurev.es.15.110184.002033
38
Theobald E. J. Ettinger A. K. Burgess H. K. DeBey L. B. Schmidt N. R. Froehlich H. E. et al . (2015). Global change and local solutions: Tapping the unrealized potential of citizen science for biodiversity research. Biol. Conserv.181, 236–244. doi: 10.1016/j.biocon.2014.10.021
39
Ummenhofer C. C. Meehl G. A. (2017). Extreme weather and climate events with ecological relevance: a review. Philos. Trans. R. Soc B Biol. Sci.372, 20160135. doi: 10.1098/rstb.2016.0135
40
Verbesselt J. Hyndman R. Newnham G. Culvenor D. (2010). Detecting trend and seasonal changes in satellite image time series. Remote Sens. Environ.114, 106–115. doi: 10.1016/j.rse.2009.08.014
41
Walker S. Mozaria-Luna H. N. Kaplan I. Petatán-Ramírez D. (2022). Future temperature and salinity in Puget Sound, Washington State, under CMIP6 climate change scenarios. J. Water Climate Change13, 4255–4272. doi: 10.2166/wcc.2022.282
42
Wang Y. Naumann U. Wright S. T. Warton D. I . (2012). Mvabund– an R Package for Model-Based Analysis of Multivariate Abundance Data. Methods in Ecology and Evolution, no. 3: 471–74. doi: 10.1111/j.2041-210X.2012.00190.x
43
Wang Y. Naumann U. Eddelbuettel D. Wilshire J. Warton D. Byrnes J. et al . (2021). mvabund: Statistical methods for analysing multivariate abundance data. Available online at: https://CRAN.R-project.org/package=mvabund (Accessed March 2, 2021).
44
Warton D. I. Wright S. T. Wang Y. (2012). Distance-based multivariate analyses confound location and dispersion effects. Methods Ecol. Evol.3, 89–101. doi: 10.1111/j.2041-210X.2011.00127.x
45
White R. H. Anderson S. Booth J. F. Braich G. Draeger C. Fei C. et al . (2023). The unprecedented Pacific Northwest heatwave of June 2021. Nat. Commun.14, 727. doi: 10.1038/s41467-023-36289-3
46
Wickham H. Chang W. Henry L. Pedersen T. L. Takahashi K. Wilke C. et al . (2020). ggplot2: Create elegant data visualisations using the grammar of graphics. Available online at: https://CRAN.R-project.org/package=ggplot2 (Accessed March 2, 2021).
Summary
Keywords
Salish Sea, nearshore, global change, participatory science, biodiversity, heatwaves
Citation
Rubinoff BG, Grason EW, McDonald PS and Watkins L (2025) High-resolution monitoring of Salish Sea estuarine communities through participatory science. Front. Mar. Sci. 12:1584193. doi: 10.3389/fmars.2025.1584193
Received
27 February 2025
Accepted
30 September 2025
Published
17 October 2025
Volume
12 - 2025
Edited by
Kathryn Sobocinski, Western Washington University, United States
Reviewed by
John A. Cigliano, Cedar Crest College, United States; Kieran Cox, Simon Fraser University, Canada; Brittnie Spriel, Victoria College, Canada, in collaboration with reviewer KC
Updates
Copyright
© 2025 Rubinoff, Grason, McDonald and Watkins.
This is an open-access article distributed under the terms of the Creative Commons Attribution License (CC BY). The use, distribution or reproduction in other forums is permitted, provided the original author(s) and the copyright owner(s) are credited and that the original publication in this journal is cited, in accordance with accepted academic practice. No use, distribution or reproduction is permitted which does not comply with these terms.
*Correspondence: Benjamin G. Rubinoff, benjamin.rubinoff@dfw.wa.gov
† Present address: Benjamin G. Rubinoff, Washington Department of Fish and Wildlife, Fish Program, Aquatic Invasive Species Division, Ballast Water and Biofouling Unit, Olympia, WA, United States
Disclaimer
All claims expressed in this article are solely those of the authors and do not necessarily represent those of their affiliated organizations, or those of the publisher, the editors and the reviewers. Any product that may be evaluated in this article or claim that may be made by its manufacturer is not guaranteed or endorsed by the publisher.