 Zhiyu Zou
 Wei Fan
 Yonggang Zhao2
 Ying Chen
- 1Hainan Institute, Zhejiang University, Sanya, China
- 2Ocean College, Zhejiang University, Zhoushan, China
Coastal aquaculture faces dual challenges of eutrophication and carbon sequestration inefficiency, particularly in stratified environments where limited water exchange hinders nutrient redistribution. This study investigates air-lift artificial upwelling (AU) as a sustainable solution to enhance water exchange in coastal aquaculture zones, integrating hydrodynamic optimization with ecological benefits. Through theoretical modeling and laboratory experiments, we establish a framework to predict intrusion layer dynamics (trap height hT, thickness L, and flow rate Qi) of AU plumes, validated by controlled flume trials. Field applications in mussel aquaculture demonstrate that optimized AU operation elevates chlorophyll-a (Chl-a) concentrations by 40.2% in the farming layer while reducing energy consumption by 65% compared to AU in crossflow-dominated (CD) environments. By aligning air injection rate with stratification intensity and current velocity, AU amplifies nutrient delivery precision and carbon sequestration through shellfish calcification. These findings highlight AU’s potential to mitigate coastal pollution, support sustainable aquaculture, and advance ocean-based climate solutions.
1 Introduction
In recent decades, coastal marine ecosystems have been increasingly threatened by anthropogenic pressures, including nutrient over-enrichment, hypoxia, and habitat degradation, which collectively exacerbate eutrophication and undermine the ocean’s capacity to act as a carbon sink (Cloern et al., 2016; Breitburg et al., 2018). In stratified coastal environments, where vertical mixing is suppressed, nutrient limitation in surface waters and the accumulation of pollutants in deeper layers further aggravate ecological imbalances, fostering harmful algal blooms (HABs) and reducing biodiversity (Rabalais et al., 2010; Glibert and Burkholder, 2011).
To address these challenges, integrated multi-trophic aquaculture (IMTA) systems—combining filter-feeding shellfish (e.g., mussels), macroalgae, and benthic organisms—have gained traction as nature-based solutions. These systems leverage synergistic interactions: shellfish remove particulate organic matter, macroalgae absorb dissolved nutrients and fix carbon via photosynthesis, and benthic species enhance sediment biogeochemical cycling, collectively mitigating eutrophication and promoting carbon storage (Troell et al., 2003; Filgueira et al., 2016; Khanjani et al., 2022). However, the efficacy of IMTA is often constrained by the farming structures and the stratified water column, which significantly limit the water exchange and reduce nutrient replenishment and waste dispersal, ultimately hampering productivity and carbon removal efficiency (Lin et al., 2016; Ma et al., 2024).
Artificial upwelling (AU), powered by renewable energy (e.g., solar or wave energy), offers a transformative strategy to overcome these limitations. By vertically transporting nutrient-rich deep water to the surface, AU enhances water exchange within aquaculture systems, ensuring continuous nutrient supply for macroalgae growth while flushing out metabolic waste (Pan et al., 2016; Fan et al., 2020). This process not only amplifies the carbon sequestration potential of IMTA through intensified algal photosynthesis and shellfish calcification but also accelerates the removal of excess nutrients, thereby suppressing harmful algal blooms and improving ecosystem resilience (McClimans et al., 2010; Jürchott et al., 2023).
Among various types of AU, the air-lift AU stands as one of the most efficient ways to fertilize oceans (Pan et al., 2016), which involves the utilization of air pumps to inject air bubbles into underwater nozzles. Through this process, the air bubbles entrain the ambient nutrient-rich water and transport the entrained nutrient-rich water to the surface layer (Liang and Peng, 2005). McClimans et al. (2010) constructed the first air-lifted AU system in Arna Fjord, which effectively stimulated the growth of phytoplankton and eliminated toxic algae in the bay. Fan et al. (2020) implemented the air-lift AU for kelp cultivation in shallow sea areas. The results indicated that the upwelling of nutrients significantly increased the yield of the kelp and consequently increased nutrient removal and carbon sequestration.
However, environmental factors can influence or even determine the operational performance of AU systems. Currently, research on air-lift AU has primarily focused on systems in crossflow-dominated (CD) environments (Figure 1B) (Qiang et al., 2018; Yao et al., 2019). This refers to an aquatic environment characterized by strong horizontal crossflows or weak stratification intensity. In such scenarios, AU plumes in operation undergo premature separation between bubble swarms and entrained ambient water due to high horizontal crossflow velocities (Socolofsky and Adams, 2002). Consequently, the utilization efficiency of the buoyancy flux generated by bubbles is low, requiring additional energy input to transport nutrients entrained by the upwelling to the target height.

Figure 1. Schematic of air-lift AU plumes: (a) SD plume with intrusion layer thickness , intrusion trap height and intrusion flow rate versus CD plume with separation height , the target layer with target height and effective range . (b) Depressed SD plume; (c) Excessively elevated SD plume; (d) SD Plume with thick intrusion layer.
Indeed, when stratification intensity is high or horizontal crossflow velocity is low—i.e., in stratification-dominated (SD) environments—the hydrodynamic characteristics of AU plumes undergo a qualitative change: bubble-entrained plumes rise to a certain height, peel off, and spread radially, forming an intrusion layer (Figure 1A). By utilizing the buoyancy generated by bubbles over a longer duration, the energy consumption required to transport nutrients from deep water to the target height is significantly reduced. However, few studies have been conducted on the hydrodynamic characteristics and applications of AU plumes in SD environments to date.
In this study, a theoretical model was developed to describe the height, thickness, and flow rate of the intrusion layer generated by the airlift artificial upwelling (AU) plume in stratification-dominated (SD) environments. Through theoretical analysis, the transport efficiency of AU plumes at the target height was evaluated, which in turn facilitated the determination of optimal system parameters for AU. Subsequently, flume experiments were conducted to validate this theoretical model. Furthermore, a case study on AU application in a mussel farm on Gouqi Island was carried out, elaborating on the optimal air injection rate and implementation strategies for a representative AU device. Based on sampling results obtained during AU operation, the effectiveness of AU in SD environments for coastal aquaculture farms was verified. This validated approach is expected to enhance operational efficiency, subsequently boost the productivity of offshore algal and shellfish aquaculture, and thereby strengthen both carbon removal and eutrophication mitigation.
The organization of this study is as follows: In Section 2, the theoretical model of AU plumes in SD environments was presented. Setup for flume experiments was introduced, including experimental parameters and methods. In Section 3, we discussed the results obtained from the experiments, validated the theoretical model, and proposed optimization strategies to transport the maximum target entrainment to the desired height. A case study in Gouqi Island was presented. Finally, we summarized the entire text and provided conclusions based on the above work in Section 5.
2 Materials and methods
2.1 Theoretical analysis
The behaviors of air-lift AU plumes in SD environments are mainly governed by the following fundamental parameters: the effect of the dispersed phase, referred to as air bubbles in this study, is classically described by the slip velocity , which represents the terminal rise velocity of a single bubble in the stagnant water environment, and is predominantly determined by the bubble diameter; the dynamic effect of the stratification is given by the well-known buoyancy frequency , defined by (Equation 1):
Where is the ambient water density, and is the positive vertical-upward coordinate; the driving force of bubbles at the source is given by its kinematic buoyancy flux (Equation 2):
Where and are the air flow rate and density at the source; is the reference density, taken as the density of the water at the source; represents the acceleration of gravity. It should be noted that since bubble expansion, breakup, and dissolution processes exhibit no evident impact on the hydrodynamic characteristics of the plume in previous studies (Socolofsky and Adams, 2005), these processes are not considered in the current study. The buoyancy flux in the initial state is adopted. The velocity of the entrained plumes scales with the buoyancy flux and the vertical-upward coordinate (Equation 3) (Fischer et al., 1979):
The characteristic length scale of stratified plumes is given by (Equation 4):
By taking the velocity of entrained plumes at the characteristic length scale , the characteristic velocity of the bubble plumes is given by (Equation 5):
The characteristic volume flux scale can be stated as follows (Equation 6):
In order to clarify the issue generally, dimensionless parameters are introduced based on the aforementioned basic parameters. The flow pattern of air-lift AU plumes is primarily determined by the dimensionless slip velocity (Equation 7) (Socolofsky and Adams, 2005), which represents the influence of stratified water environment on the ascent of bubbles, given by:
The flow pattern of the bubble plume can be distinguished into three distinct forms by the dimensionless slip velocity (Figure 2): when , the bubble plume belongs to Type 1; when , it belongs to Type 2; when , it is considered as Type 3, and the Type 3 plumes have unsteady, irregular subsurface intrusions. This study mainly focuses on the behaviors and characteristic parameters of Type 2 plumes that are more applicable to the application scenarios of air-lift AU.
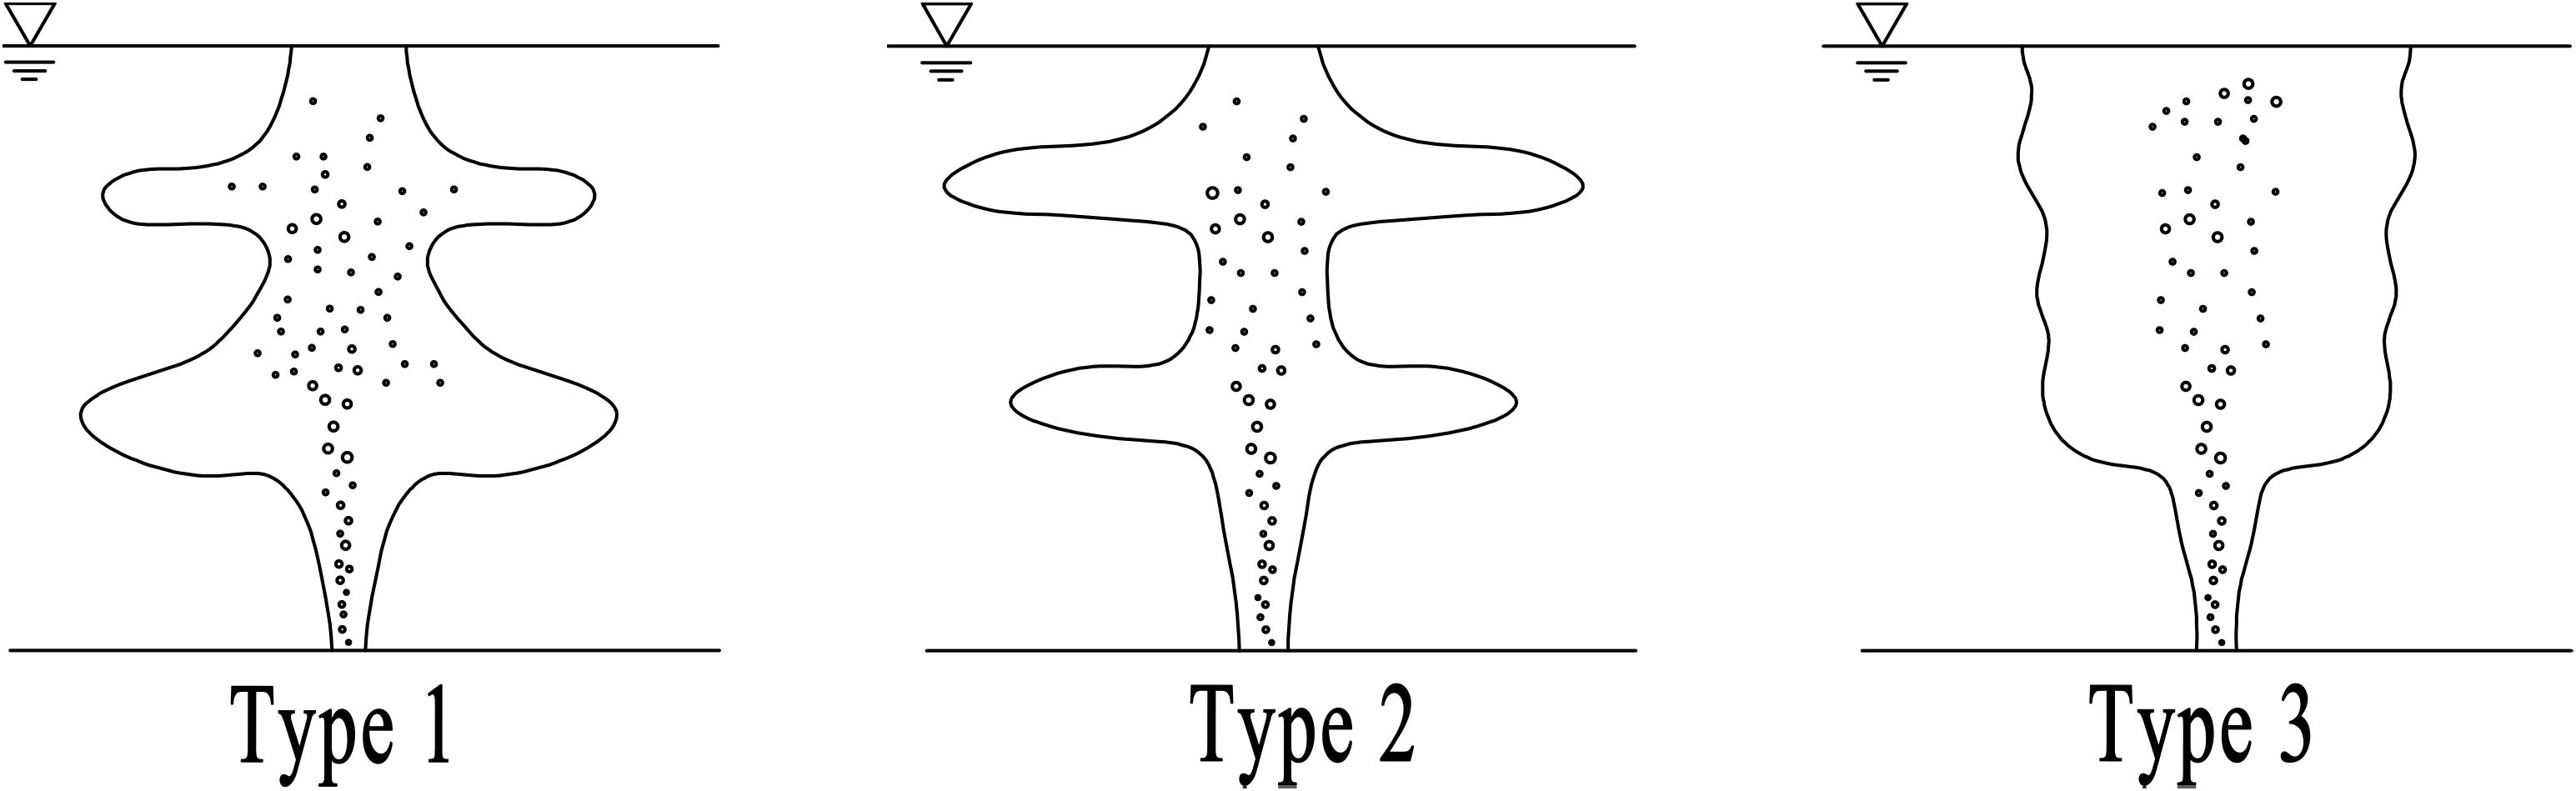
Figure 2. Three types of bubble plumes in SD environments.
When air-lift AU operates in SD environments, the plume entrained by the bubbles could create multiple intrusion layer structures. The effective intrusion layer in this study is considered the first intrusion layer, since the higher intrusion layers have been tremendously diluted, resulting in less significant entrainment of target nutrients in the context of air-lift AU application. Hence, the main objectives of this study are the trap height, thickness, and flow rate of the first layer of the intrusion.
As shown in Figure 1A), the trap height , the intrusion layer thickness and the intrusion flow rate should be determined to fully describe the air-lift AU plume. Socolofsky and Adams (2002) established the relationship between the trap height and the bubble slip velocity , buoyancy flux , and buoyancy frequency through dimensional analysis and laboratory experiments (Equation 8):
The intrusion layer thickness is generally agreed to follow the scaling (Equation 9):
Where represents the dimensionless plume thickness, which is determined by the plume velocity. The typical range for the dimensionless plume thickness is 0.7 to 4.5, increasing as the plume velocity increases (Lemckert and Imberger, 1993; Sigurðardóttir et al., 2020).
The flow rate of the intrusion layer correlates with the characteristic volume flux , which can be scaled as (Equation 10):
Where is the dimensionless volume flux, denoting the flow rate coefficient. The dimensionless volume flux can be predicted by the following Equation 11 (Socolofsky and Adams, 2005):
When , denotes the single-phase plume value taken as the dilution at the trap height for a buoyant plume in linear stratification (Fischer et al., 1979).
In air-lift AU application scenarios, the target organisms are typically located at specific depths. It is imperative to note that capturing the plume at an inadequate position, whether excessively elevated or depressed, in conjunction with a substantially thick intrusion layer, will invariably lead to a diminution in plume transport efficiency (Figures 1B–D). To assess plume transport efficiency, the effective range for plume transportation with a target height of should be clarified (Figure 1A). The actual bubble plume generated by the air injector forms an intrusion layer during the ascent, with an intrusion height of and an intrusion layer thickness of . The Gaussian assumption (Equation 12) is adopted for evaluating the efficiency of plume transport (Davidson, 1986):
Where represents the vertical concentration distribution of the plume. The efficiency of plume transportation can be calculated by (Equation 13):
The effective intrusion flow rate is the efficiency of plume transportation multiplied by the intrusion layer flow rate , which presents the capacity of air-lift AU to transport nutrients to the target heights (Equation 14):
Entrainment expansion ratio (Equation 15) is calculated to evaluate the energy utilization efficiency of the AU system, which is the ratio of effective intrusion flow rate to the air injection rate:
By maximizing the entrainment expansion ratio , the most nutrients can be transported to the target height within limited power supply.
Considering that the theoretical model is applicable to plumes in SD water bodies, a critical crossflow velocity should be defined to differentiate the water environments into SD and CD types (Figure 1A). Under strong crossflow, the plume separates with bubbles at a separation height (Equation 16), which is dominated by the crossflow effects. The empirical formula of separation height is given as follows (Socolofsky and Adams, 2002):
Where is the critical velocity. Conversely, under weak crossflow and no crossflow, the characteristics of the plume can be effectively anticipated using theory pertaining to bubble plumes in linearly stratified stagnant environments, referred to as SD environments. The critical current velocity can be calculated by solving the following Equation 17:
When the trap height is smaller than the separation height , separation will occur due to stratification effects before it occurs due to the crossflow. The theoretical model is applicable if the current velocity is lower than the critical current velocity , which corresponds to the SD environments.
2.2 Laboratory experiments
An experimental system was devised to observe the phenomenon of air-lift AU plumes in the SD water environment and verify the theory in section 2 (Zhao et al., 2025). By regulating the air injection rate, bubble diameter, and stratification intensity of water bodies, the intrusion layer of the bubble plumes, including flow patterns, trap height, intrusion layer thickness, and flow rate, was observed and recorded. The experimental setup design is depicted in Figure 3.

Figure 3. Experimental setup: (a) schematic diagram; (b) double bucket system; (c) air lift AU plume generated in tank C; (d) Comparison of bubble columns generated in two needle diameters: (a) 0.2 mm; (b) 0.06 mm. (e) Sampling results of density distribution of experiment No.6.
Three pipelines were deployed in the experiment system: the water pipeline for creating the linearly stratified water environment, the gas pipeline for air injection, and the tracer pipeline for observation of air-lift AU plumes. In the water pipeline, a double bucket system was set with two equally sized water Tank A and Tank B. The outflow velocity was controlled by valves and circulation pumps to ensure that the liquid outflow rate from Tank B was equal to twice the liquid outflow rate from Tank A. The density of the water flowing into Tank C can be described as follows (Equation 18):
Where denotes the density in Tank A; denotes the density in Tank B at any given time , and is the initial density in Tank B; denotes the initial total water volume in Tank A and B. A spreader with uniform outflow was placed at the bottom of Tank C. The gas pipeline section included a gas pump and a rotor flowmeter, which controlled the gas flow rate. In the tracer pipeline, the pre-prepared solution of tracer KMnO4 was transported using a peristaltic pump (Kamoer, DIPump550-B253). The flow rate was maintained at 5 ml/min, keeping a negligible initial momentum. The tracer was emitted using a dispensing needle, slightly staggered with the needle at the bubble outlet. The water tank utilized in the experiment measured 80×80×60 cm, which was high enough to ensure that the plume could reach the height of the intrusion layer and that there was sufficient space for the formation of the intrusion layer.
The dispensing needle served as the air injector in the experiments. By changing the diameter of the dispensing needle, the size of the generated bubbles was altered to control the slip velocity of the bubbles. The results revealed that when the needle diameter was between 0.3 mm and 1 mm, the average diameter of the generated bubbles showed no significant change, remaining at approximately 1 mm to 1.5 mm. However, when the needle diameter ranged from 0.06 mm to 0.2 mm, the bubble diameter notably decreased to 0.5 ~ 1 mm (Figure 3C).
We used a digital single-lens reflex camera (SONY Alpha 6400, resolution of 24.2 megapixels) for recording, fixed directly in front of the observation window. Additionally, to ensure clear visibility during recording, white LED light panels were positioned directly above and behind the tank, enabling clear observation of the behavior of the dye within the bubble plume.
Before each experimental run, the linearly stratified water environment produced by the system was sampled and measured using a salinometer (Smart Sensor AR8012) to verify the linearity of the water body. The R-squared of stratification in each experimental run was no less than 98%, and additionally, a validation for the variation of water density changing with depth, obtained during experiment 6, demonstrated = 99.19%, as shown in Figure 3D).
The experiment mainly focused on investigating the following parameters: 1. Plume trap height ; 2. Intrusion layer thickness ; 3. Intrusion layer flow rate . 4. Concentration distribution . The experimental setup is illustrated in Table 1.

Table 1. Experimental conditions and results for stratified experiments with standard deviations.
2.3 Field application
To verify the effectiveness of AU in stratified water bodies, we conducted field validation at mussel farms in the East China Sea near Gouqi Island (30°46’ N, 122°45’ E, Figure 4A). The offshore of Gouqi Island in the East China Sea is an important area for mussel aquaculture. The farm area has reached 16.5 km2, with a maximum wet weight yield of 78,786 tons of mussels (Ma et al., 2024). Research on shellfish farms has shown that suspended mussel farms can significantly weaken the water exchange capacity and limit bait supplementation. Zhong et al. (2022) conducted field observations and numerical simulations. The results indicate that the presence of farming structures reduce the flow by more than 79%, 55%, and 34% in the upper, middle, and bottom layers at the farm center, respectively, with the tidally-averaged velocity lower than 0.2 m/s (Lin et al., 2016), leading to reduced production of mussel aquaculture (Naddafi et al., 2007; O’Donncha et al., 2013). By enhancing vertical water exchange, AU transports algae-rich water in the lower water layer and forms an intrusion layer at the height of the culture layer, thereby providing a more abundant food source for mussels.
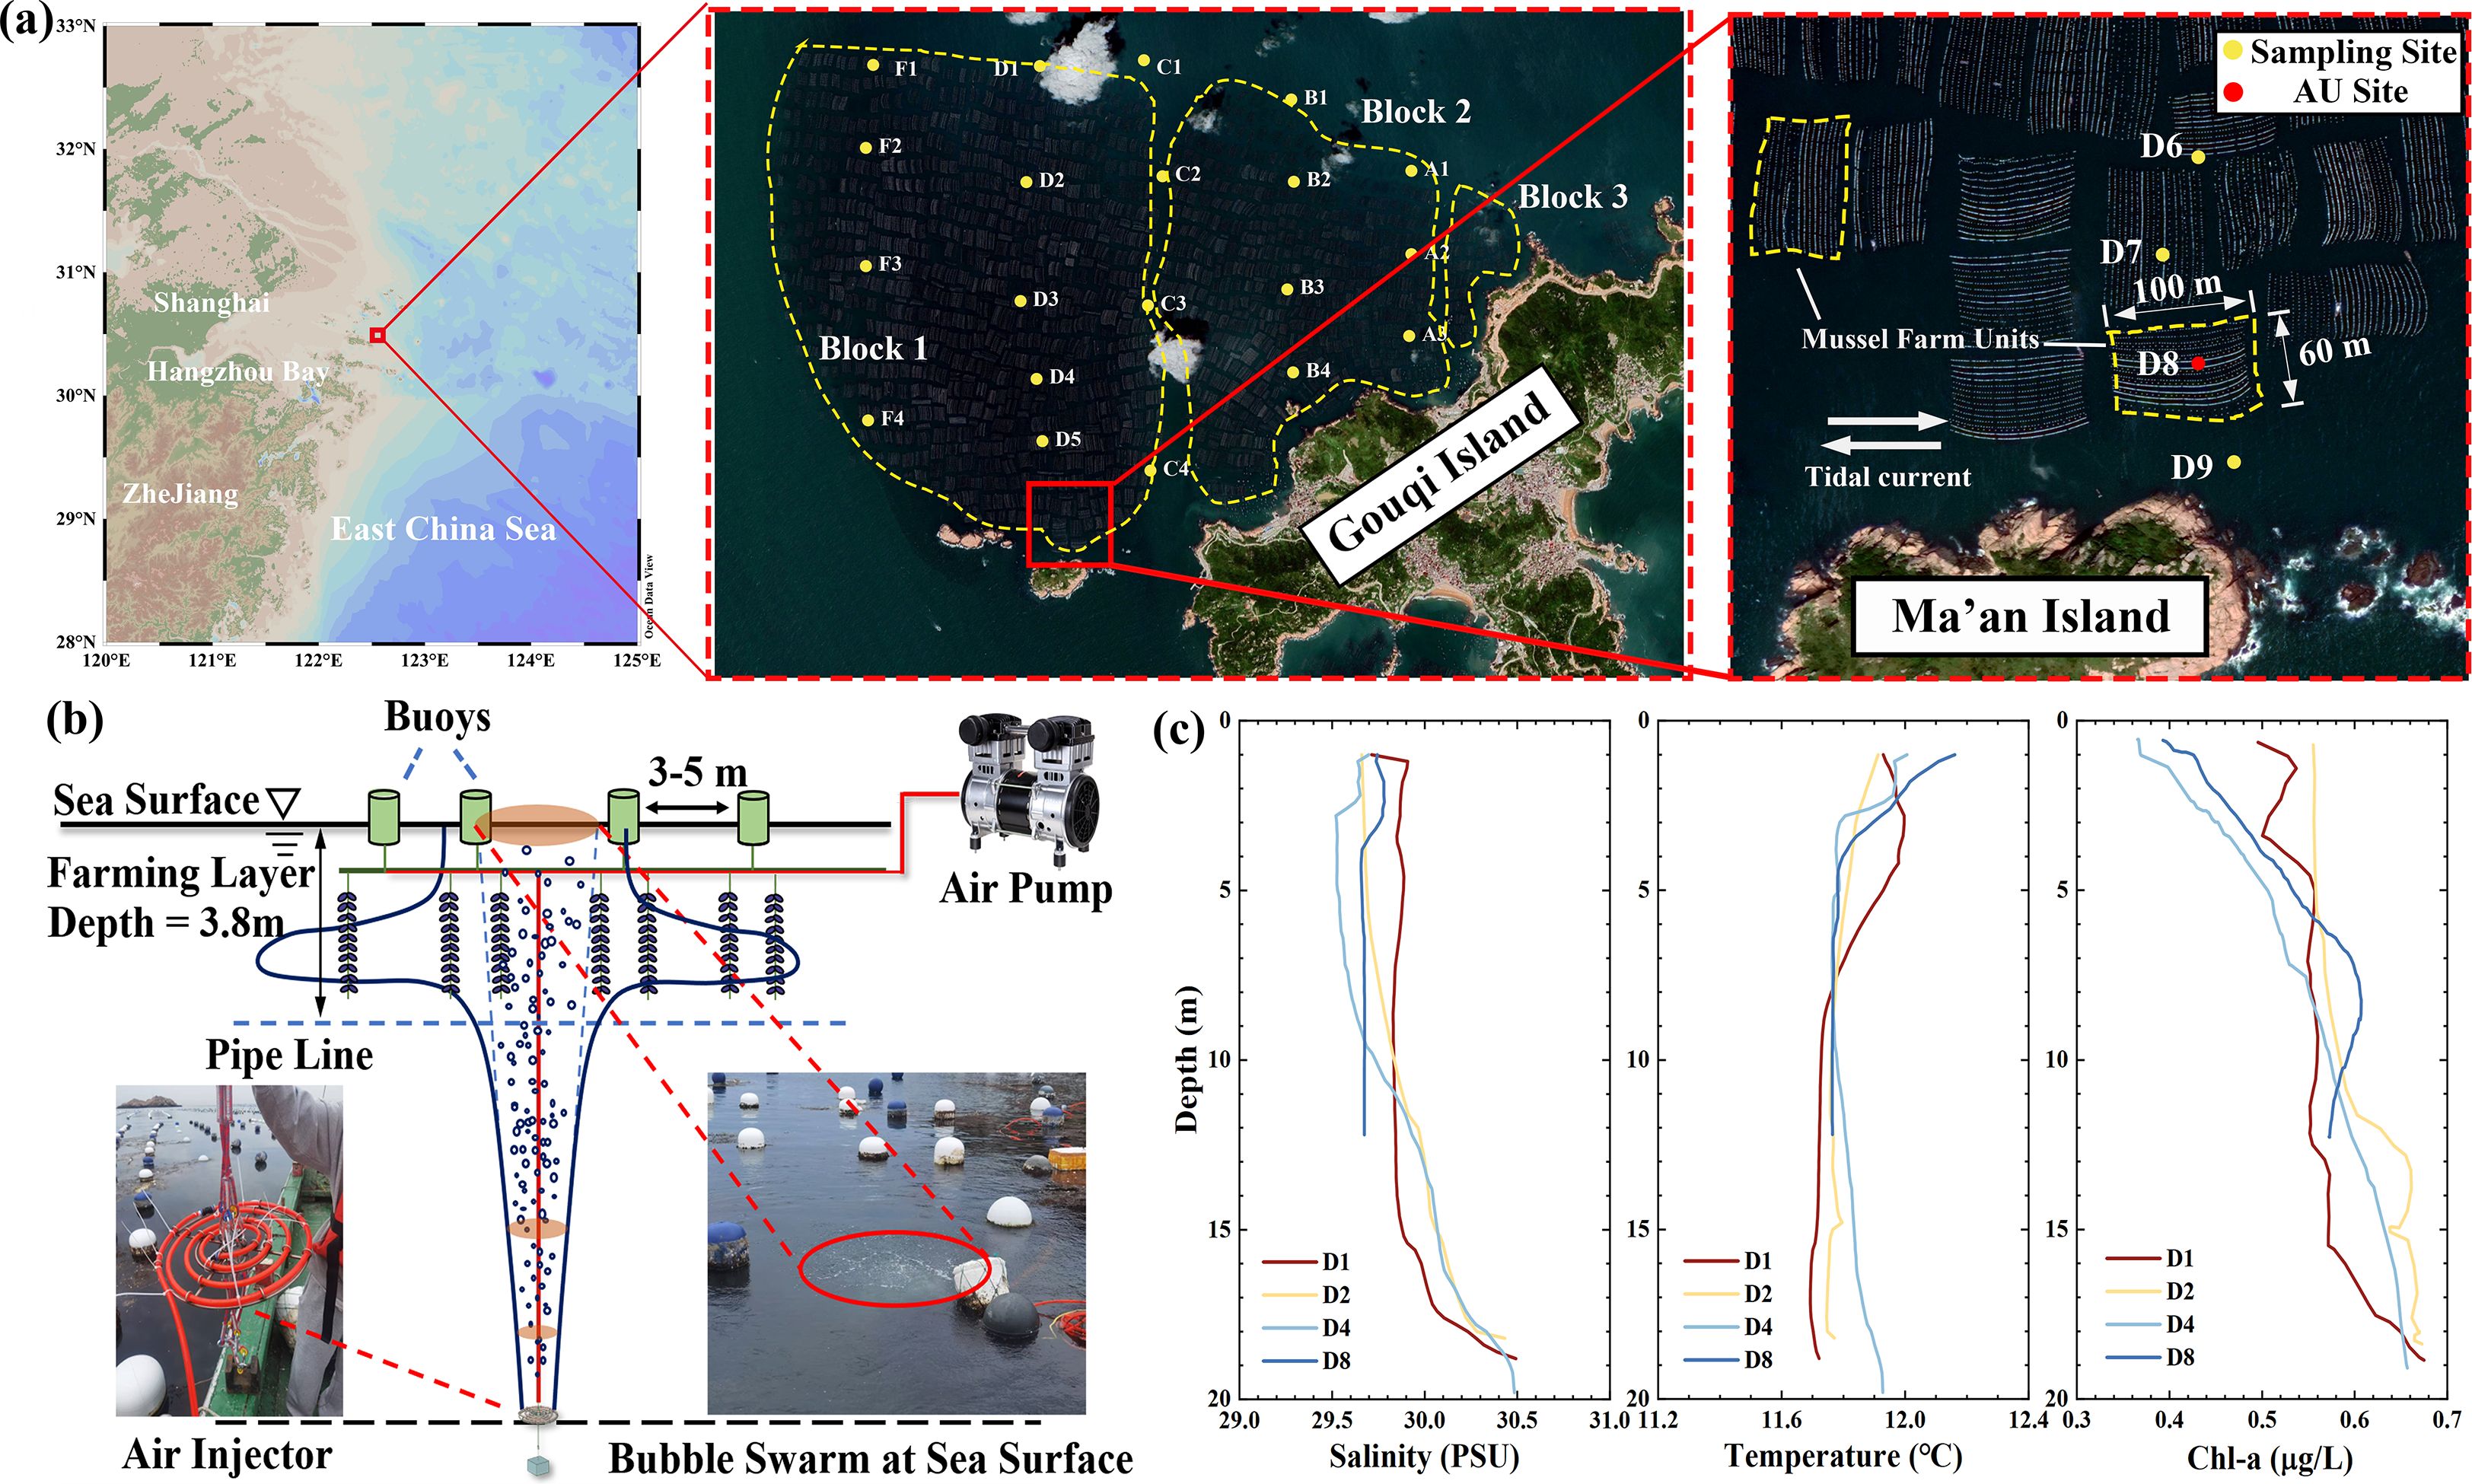
Figure 4. The mussel aquaculture in Gouqi Island: (a) The location of the mussel farming region and a Satellite view of mussel farming areas at the north of Gouqi Island from Google Earth, August 20, 2018; (b) Deployment of the air-lift AU system; (c) Observation results of Chl-a concentration in the mussel farming area.
2.3.1 Site selection
There are three main blocks for mussel aquaculture in the East China Sea near Gouqi Island, and the interval between each block is the waterway for ships to pass through (Figure 4A). Zhong et al. (2022) conducted field observations on the phytoplankton community and water environmental elements in these three main farming blocks. The concentration of chlorophyll-a (Chl-a) fluorescence was used as a food proxy for mussels. Their observation results showed that outside the farm area, the Chl-a concentration in the upper layer (water depth< 5 m) reached the maximum level. In contrast, inside the farm area, the Chl-a concentration of the lower water layer was higher than that of the upper layer. The deficiency of Chl-a concentration in the upper layer inside the farm area should be attributed to the effect of filtration of mussels. We also conducted a field observation on March 29th, 2024, to determine the Chl-a distribution inside and outside the mussel farms. The observation sites are shown in Figure 4C), where a total of five transects (A-F) are laid out across the entire aquaculture area.
Due to the differing locations of each transect and the influences of factors such as shorelines and aquaculture structures, the filtration efficiency of mussels varies significantly across stations. Transect F is located at the boundary of the entire aquaculture area, where seawater can freely exchange, resulting in relatively high overall chlorophyll concentrations. In contrast, although Transect A is also at the aquaculture boundary, it experiences severe tidal current restrictions due to the influence of the northwest shoreline of Gouqi Island, leading to lower Chl-a concentration levels. Transect C is situated in the central aquaculture area but contains a navigation channel, which moderately improves water flow conditions. Transects B and D are located at the central positions of Block 1 and Block 2, respectively, and are representative of aquaculture structure resistance characteristics. Therefore, Transect D is chosen as an example which covers the outer, middle, and inner parts of the aquaculture area and has no shipping lanes, minimizing interference with the natural distribution of Chl-a concentration.
Vertical profiles of temperature, salinity, and Chl-a observed on 29 March 2024 are presented in Figure 4C). Based on the observation results, several observation sites along the D transect exhibit similar temperature and salinity distributions; similarly, the chlorophyll-a concentrations at greater depths are comparable. However, it is evident that the chlorophyll-a concentrations in the culture layer show variations along the D transect. Specifically, the Chl-a concentrations in descending order, are as follows (integrated Chl-a in aquaculture layers, 0-3.8 m): D1 (1.98 mg/m2), D2 (1.96 mg/m2), D8 (1.67 mg/m2), and D4 (1.52 mg/m2). This indicates that the filter-feeding effect of mussels gradually intensifies from the outer to the inner parts of the culture area. D4 is located at the center of Block 1 and represents a typical area with restricted water flow and insufficient food supply. Although D8 is close to the boundary of the aquaculture area, it is blocked by Ma’an Island—food supply can only flow in from the western sea area, so it can also be classified as a food-limited area.
Thus, the air-lift AU system was deployed at station D8. This site prevents historical damage to air injection pipelines and nozzles by fishermen. Additionally, it can leverage the leeward side of Ma’an Island to effectively mitigate threats from extreme weather events (e.g., typhoons) to the floating platforms.
2.3.2 Air-lift AU system
A schematic of the structure of the mussel farming area and the AU system deployment is shown in Figure 4B). The suspended aquaculture system consists of buoys, aquaculture lines, and a long line. The mussels are attached to the aquaculture lines, and the long line is used to attach the aquaculture lines in the vertical direction, buoyed by the buoys.
An air compressor (Outstanding, 1.1kW) is fixed to the energy supply platform, with a maximum air injection rate of 100 L/min. The air compressor pumps gas through the pipeline, which is tied to the long line of the mussel farm. The energy supply platform is equipped with a solar power system to realize in-situ power supply. The air injector is suspended instead of lying on the sea floor, in case the sediment at the bottom is buoyed up with the bubble plume. The air injection rate of the AU system is controlled via a rotameter and a ball valve.
The AU system controls the air compressor via a 4G controller (HK12-4GAL6K). Due to the system’s limited power storage capacity, it is configured to operate during daytime to maximize the utilization of solar energy. Additionally, to verify the system’s operational performance in an SD environment, the AU system is primarily set to run during the slack tide period, with a cumulative daily operating time of 2 hours.
The depth range of the farming layer is 0-3.8 m, and the maximum Chl-a concentration is located at a depth greater than 5 m (Wen et al., 2022). According to the findings of this study, the trap height of the air-lift AU plume can be controlled by adjusting the injection flow rate, and, at the same time, ensuring the smallest intrusion layer thickness to guarantee the precision of transport of phytoplankton-rich water body. Therefore, the deployment depth and air injection rate of the air injector are calculated and optimally configured based on practical environmental conditions, with detailed calculation results presented in Section 3.3.1.
2.3.3 Sampling
Parameters including temperature, salinity, and Chl-a concentration (Tab. B) at the indicated stations were measured using a multi-parameter CTD sensor (SEB 19plus). Sampling for the validation experiment was conducted during the slack tide period, one hour after the AU system had operated continuously. Three supplementary stations (D6, D7, and D9) in close proximity to the AU deployment site (D8) were selected as control groups. Stations D6–D9 are aligned parallel with the tidal current direction, with an approximate inter-station spacing of 50–60 m; thus, variations in hydrological parameters among these stations are minimal. The total sampling duration across Stations D6–D9 was no more than 20 minutes to minimize temporal variability.
3 Results and discussion
3.1 Validation of the theoretical model
The experiments carried out in this research aimed to study the behavior of bubble plumes in SD environments. The behaviors under scrutiny encompassed the development of the intrusion layer, trap height, layer thickness, and the intrusion layer flow rate. To authenticate the accuracy of the developed model, the theoretical model was juxtaposed against the experimental results obtained in this study.
The expansion process of the intrusion layer is depicted in Figure 5. As the bubbles were injected into the bottom of the water tank, they entrained the ambient water, rose, and then radially spread. The mixed air-water plume experienced an increasing negative buoyancy flux due to linear stratification of the water body, until it ascended to a certain height, where the water plume peeled and continued to descend as the density of the separated water was higher than that of the ambient water at that height. When the density difference disappeared, the plume mingled with the ambient water and spread outward at the neutral buoyancy layer, forming the so-called intrusion layer. The intrusion layer gradually formed from ; from , the intrusion layer stabilized with a certain layer thickness. Subsequently, after , the thickness of the intrusion layer stabilized, continuously spreading outward, with its total volume continuously increasing. When the intrusion layer reached the tank wall , the intrusion layer further thickened due to the strong boundary effects. The objective parameters of AU plumes, including the trap height and the intrusion layer thickness were measured using time-averaged images captured from to .
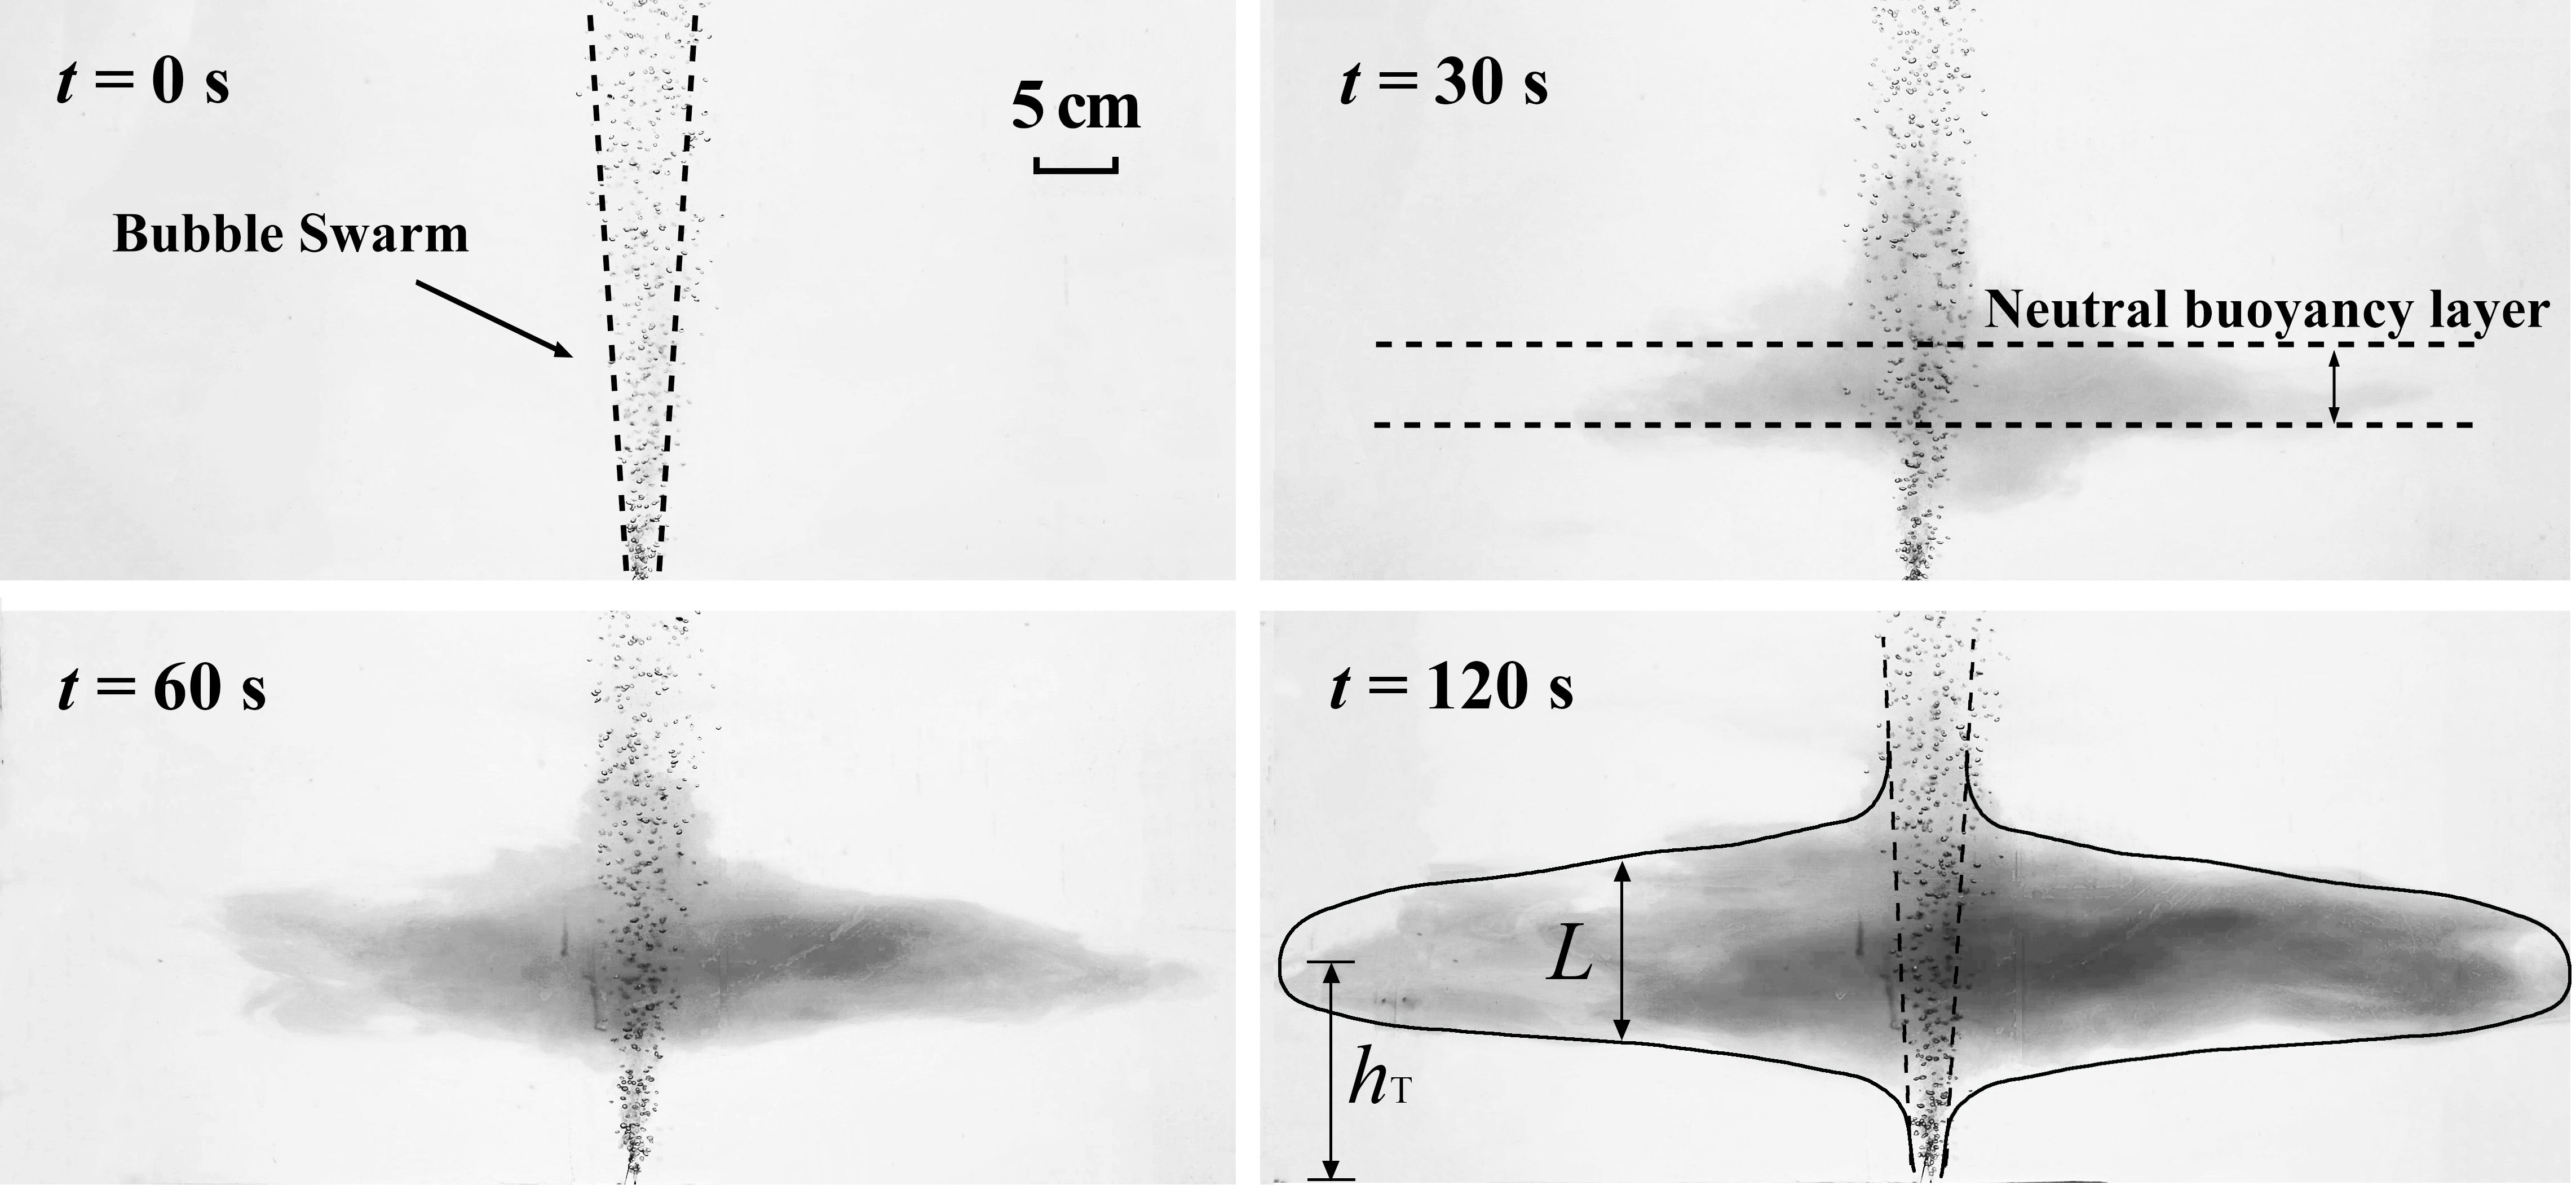
Figure 5. Expansion of intrusion layer (experiment no.7).
To further clarify the variations of characteristic parameters of the bubble plumes with changes in air injection rate , buoyancy frequency , and bubble slip velocity , we processed the experimental data and compared it with theoretical results.
3.1.1 The trap height
The relationship between the dimensionless slip velocity and the dimensionless intrusion layer height is illustrated in Figure 6. The range of the dimensionless slip velocity in our experiments was between 1.4 and 3. The water depth in the experiments was 0.50 m, and the average theoretical intrusion layer height was 0.196 m. The results of trap height measured in this study align well with Socolofsky’s theory (2005), with an average error of 8.65% and an average absolute error of 1.69 cm, which indicates that the theoretical approach can be used to predict intrusion layer heights in air-lift AU.
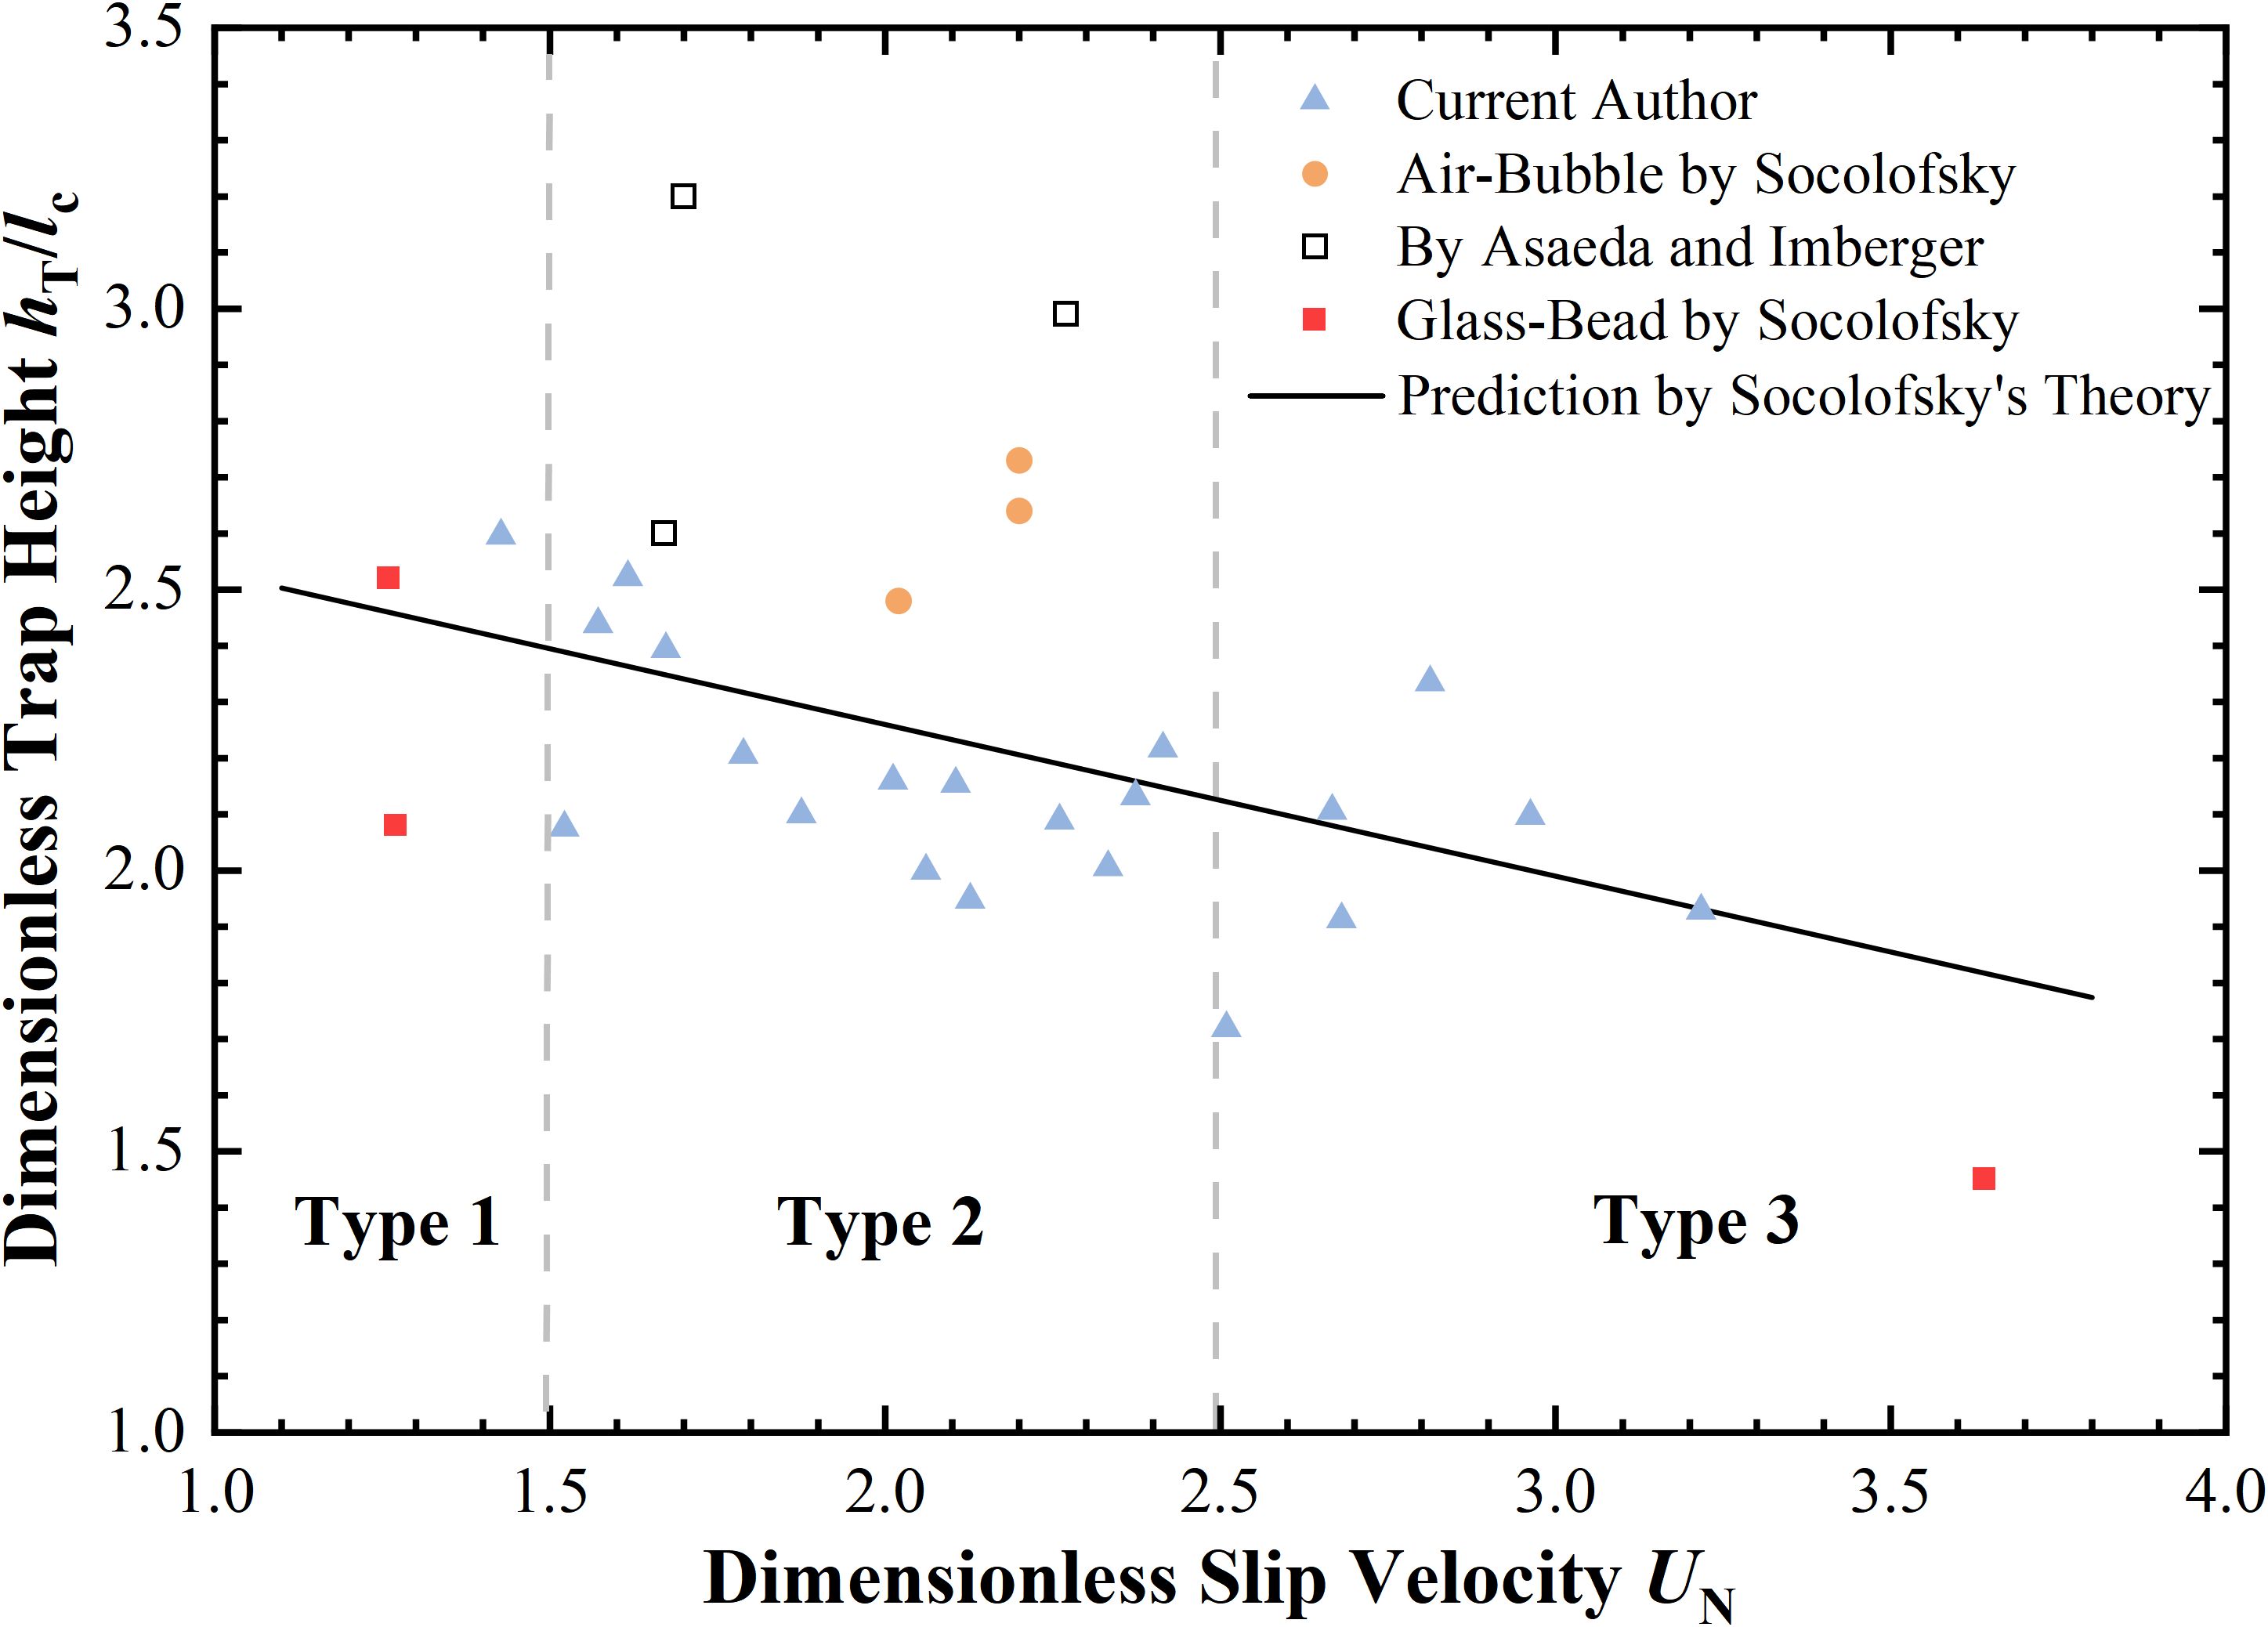
Figure 6. Correlation between dimensionless trap height and . Solid squares indicate air-bubble experiments by Socolofsky and Adams (2005), open squares indicate glass-bead experiments by Socolofsky and Adams (2005), circles indicate experiments reported by (Asaeda and Imberger, 1993), and triangles represent results by the current authors.
3.1.2 The intrusion layer thickness
The relationship between the intrusion layer thickness obtained from experiments and the characteristic length is depicted in Figure 7. A linear fitted line indicating the relationship between the intrusion layer thickness and the length scale is obtained with a slope of 1.06 with R2 = 86.5%, closely resembling the research findings of Sigurðardóttir et al. (2020). It is imperative to note that the velocity of the plume is one of the factors in determining the dimensionless plume thickness (Asaeda and Imberger, 1993). The characteristic velocity of the plume is measured to quantify the plume velocity in this study. The average plume velocity in this study is 0.068 m/s, ranging from 0.05-0.08 m/s. The average value is applicable for practical applications of air-lift AU, with the regression degree , denoting that the variation of characteristic velocity has a minor impact on the intrusion layer thickness when the characteristic velocity is weak.

Figure 7. Correlation between intrusion thickness and characteristic length , the yellow framed blue triangles represent high plume velocity.
3.1.3 The intrusion layer flow rate
The volume change of the intrusion layer after formation was calculated using an image processing technique. Real-time plume images were binarized, and the plume boundary at any given height was taken as the diameter at that height. Given that the plume is radially axisymmetric, integrating along the height direction yields the intrusion volume at the corresponding time. The curve in Figure 8A) illustrates the volume change of the intrusion layer over time for experiment No.6. It is evident that the flow rate of the intrusion layer remained relatively stable and followed a linear trend from its formation to reaching the boundary. Through linear fitting, the flow rate of the intrusion layer was calculated from 15 s to 75 s, obtaining a volume flow rate of .
The relationship between the dimensionless slip velocity and the dimensionless volume flux is illustrated in Figure 8B). Bubble plumes with higher exhibit lower dimensionless volume flux , which can be attributed to lower velocities and turbulence intensity in the downdraught plume limiting the capacity of entrainment (Socolofsky and Adams, 2005). The results obtained in this study are evaluated based on Equation 10 with an average error of 13.56%. While deviations exist between the experimental and mathematical results, the correlation between and generally corresponds with the mathematical results.

Figure 8. Experiment results of intrusion layer flow rate: (a) The volume of the intrusion layer evaluated from t = 15 s to t = 75 s (Experiment No.6); (b) Correlation between dimensionless volume flux and dimensionless slip velocity . Solid squares indicate air-bubble experiments by Socolofsky and Adams (2005), open squares indicate glass-bead experiments by Socolofsky and Adams (2005), the circle indicates experiments reported by Lemckert and Imberger (1993), triangles denote results from current authors.
3.1.4 The Gaussian assumption for concentration distribution of AU plumes
The concentration distribution of the plume was measured by the grayscale intensity depth in time-averaged images (Figure 9A). The intensity was dimensionless, scaled between 0 and 1. The dimensionless coordinate of the vertical axis is introduced for comparing plumes with different intrusion thicknesses, given by . As depicted in Figure 9B), the experimental results generally follow the Gaussian distribution, where the concentration at the centerline is maximized and reduces rapidly with development towards boundary of the intrusion layer. The average error between experiment results and theoretical prediction is 3.82%, which denotes that the theoretical approach is available for predicting the concentration distribution in the intrusion layer induced by air-lift AU.

Figure 9. Validation of Gaussian distribution of AU plumes: (a) Time-averaged grayscale image; (b) Comparison between experiment results and Gaussian prediction.
It is important to acknowledge that the disparities between the experimental measurements and theoretical predictions may arise from the assumptions and simplifications made in both the experimental setup and the theoretical models. Factors such as fluid dynamic effects, boundary conditions, and environmental disturbances can influence the actual behavior of the phenomenon in the experimental environment. Additionally, the assumptions and approximations inherent in the theoretical models can introduce deviations from real-world conditions.
3.2 Operating parameters and optimization
3.2.1 The effects of operating parameters
The effects of the air injection rate and the bubble slip velocity were discussed, which determine the characteristics of the intrusion layer, and consequently affect the efficiency of plume transport. It has been illustrated that the dimensionless slip velocity , which determines the flow pattern of the bubble plume, is governed by the slip velocity of the bubbles, gas injection rate, and buoyancy frequency. For air-lift AU, the buoyancy frequency is determined by the water environment. Thus, it is feasible to optimize air-lift AU by controlling the air injection rate and the slip velocity of the bubbles. To maximize the efficiency of the upwelling plume transport as much as possible, the occurrence of Type 3 plumes should be avoided with a lower dimensionless slip velocity . An effective method is to reduce the diameter of the bubbles, thereby decreasing the slip velocity of the bubbles, which is directly proportional to the dimensionless slip velocity .
Experiment No.10 (Figure 10B) was compared with No.8 (Figure 10A), both of which have close buoyancy frequencies and buoyancy fluxes. The primary distinction between the two experiment sets pertained to the generated bubble diameters, resulting in disparate bubble slip velocities. The variation in bubble diameter led to significant differences in bubble plume flow patterns between the two experimental sets. In experiment 8, with a larger , the flow pattern of the bubble plume closely resembled Type 3, and it is noticeable that the tracer irregularly flowed towards the upper part of the tank. Conversely, the smaller in experiment 10 resulted in good concentration in the intrusion layer, with only a minor extension to the upper portion, resulting in the formation of a weak secondary intrusion layer, aligning with our predetermined objective. It is imperative that in practical applications, air-lift AU should ensure a smaller bubble diameter to guarantee the effectiveness of the intrusion layer.

Figure 10. Comparison of air-lift AU plume: (a) N = 1.02 s-1, Q = 100 ml/min, UN = 2.81; (b) N = 1.02 s-1, Q = 100 ml/min, UN = 1.88; (c) N = 0.83 s-1, Q = 100 ml/min, UN = 2.96; (d) N = 0.82 s-1, Q = 300 ml/min, UN = 2.26.
Another controllable variable, the buoyancy flux can be changed to adjust the intrusion layer height of AU plumes. In Figures 10C, D), under close buoyancy frequencies and bubble slip velocities, the trap height of the intrusion layer got higher as the gas injection rate increased. However, an increase in buoyancy flux led to a thicker intrusion layer, which may reduce the precision of plume transport. Therefore, with the variation of the environmental parameters, the operating parameters should be designed and adjusted to maximize the transport capacity of the air-lift AU system.
3.2.2 Operating strategies
The transport efficiency of the plume is affected by multiple parameters, with inconsistent variation trends. Therefore, the influence of multiple factors must be assessed through theoretical calculations to ascertain the optimal air injection rate and bubble slip velocity, thereby maximizing the overall efficiency of the system when buoyancy frequency is determined. Specifically, as illustrated in Figure 11A), a dashed red line represents , and divides the region into two parts, referred to as the Type 2 and Type 3 parts. Low air injection rates and high slip velocities lead to the appearance of Type 3 plumes. As illustrated in Figure 11B), both the intrusion flow rate and the intrusion layer thickness demonstrate a positive correlation with the augmentation of air injection rate. The increased intrusion flow rate enhances the overall transport capacity of AU. However, an augmented thickness diminishes the efficiency of transporting the plume to the effective layer.
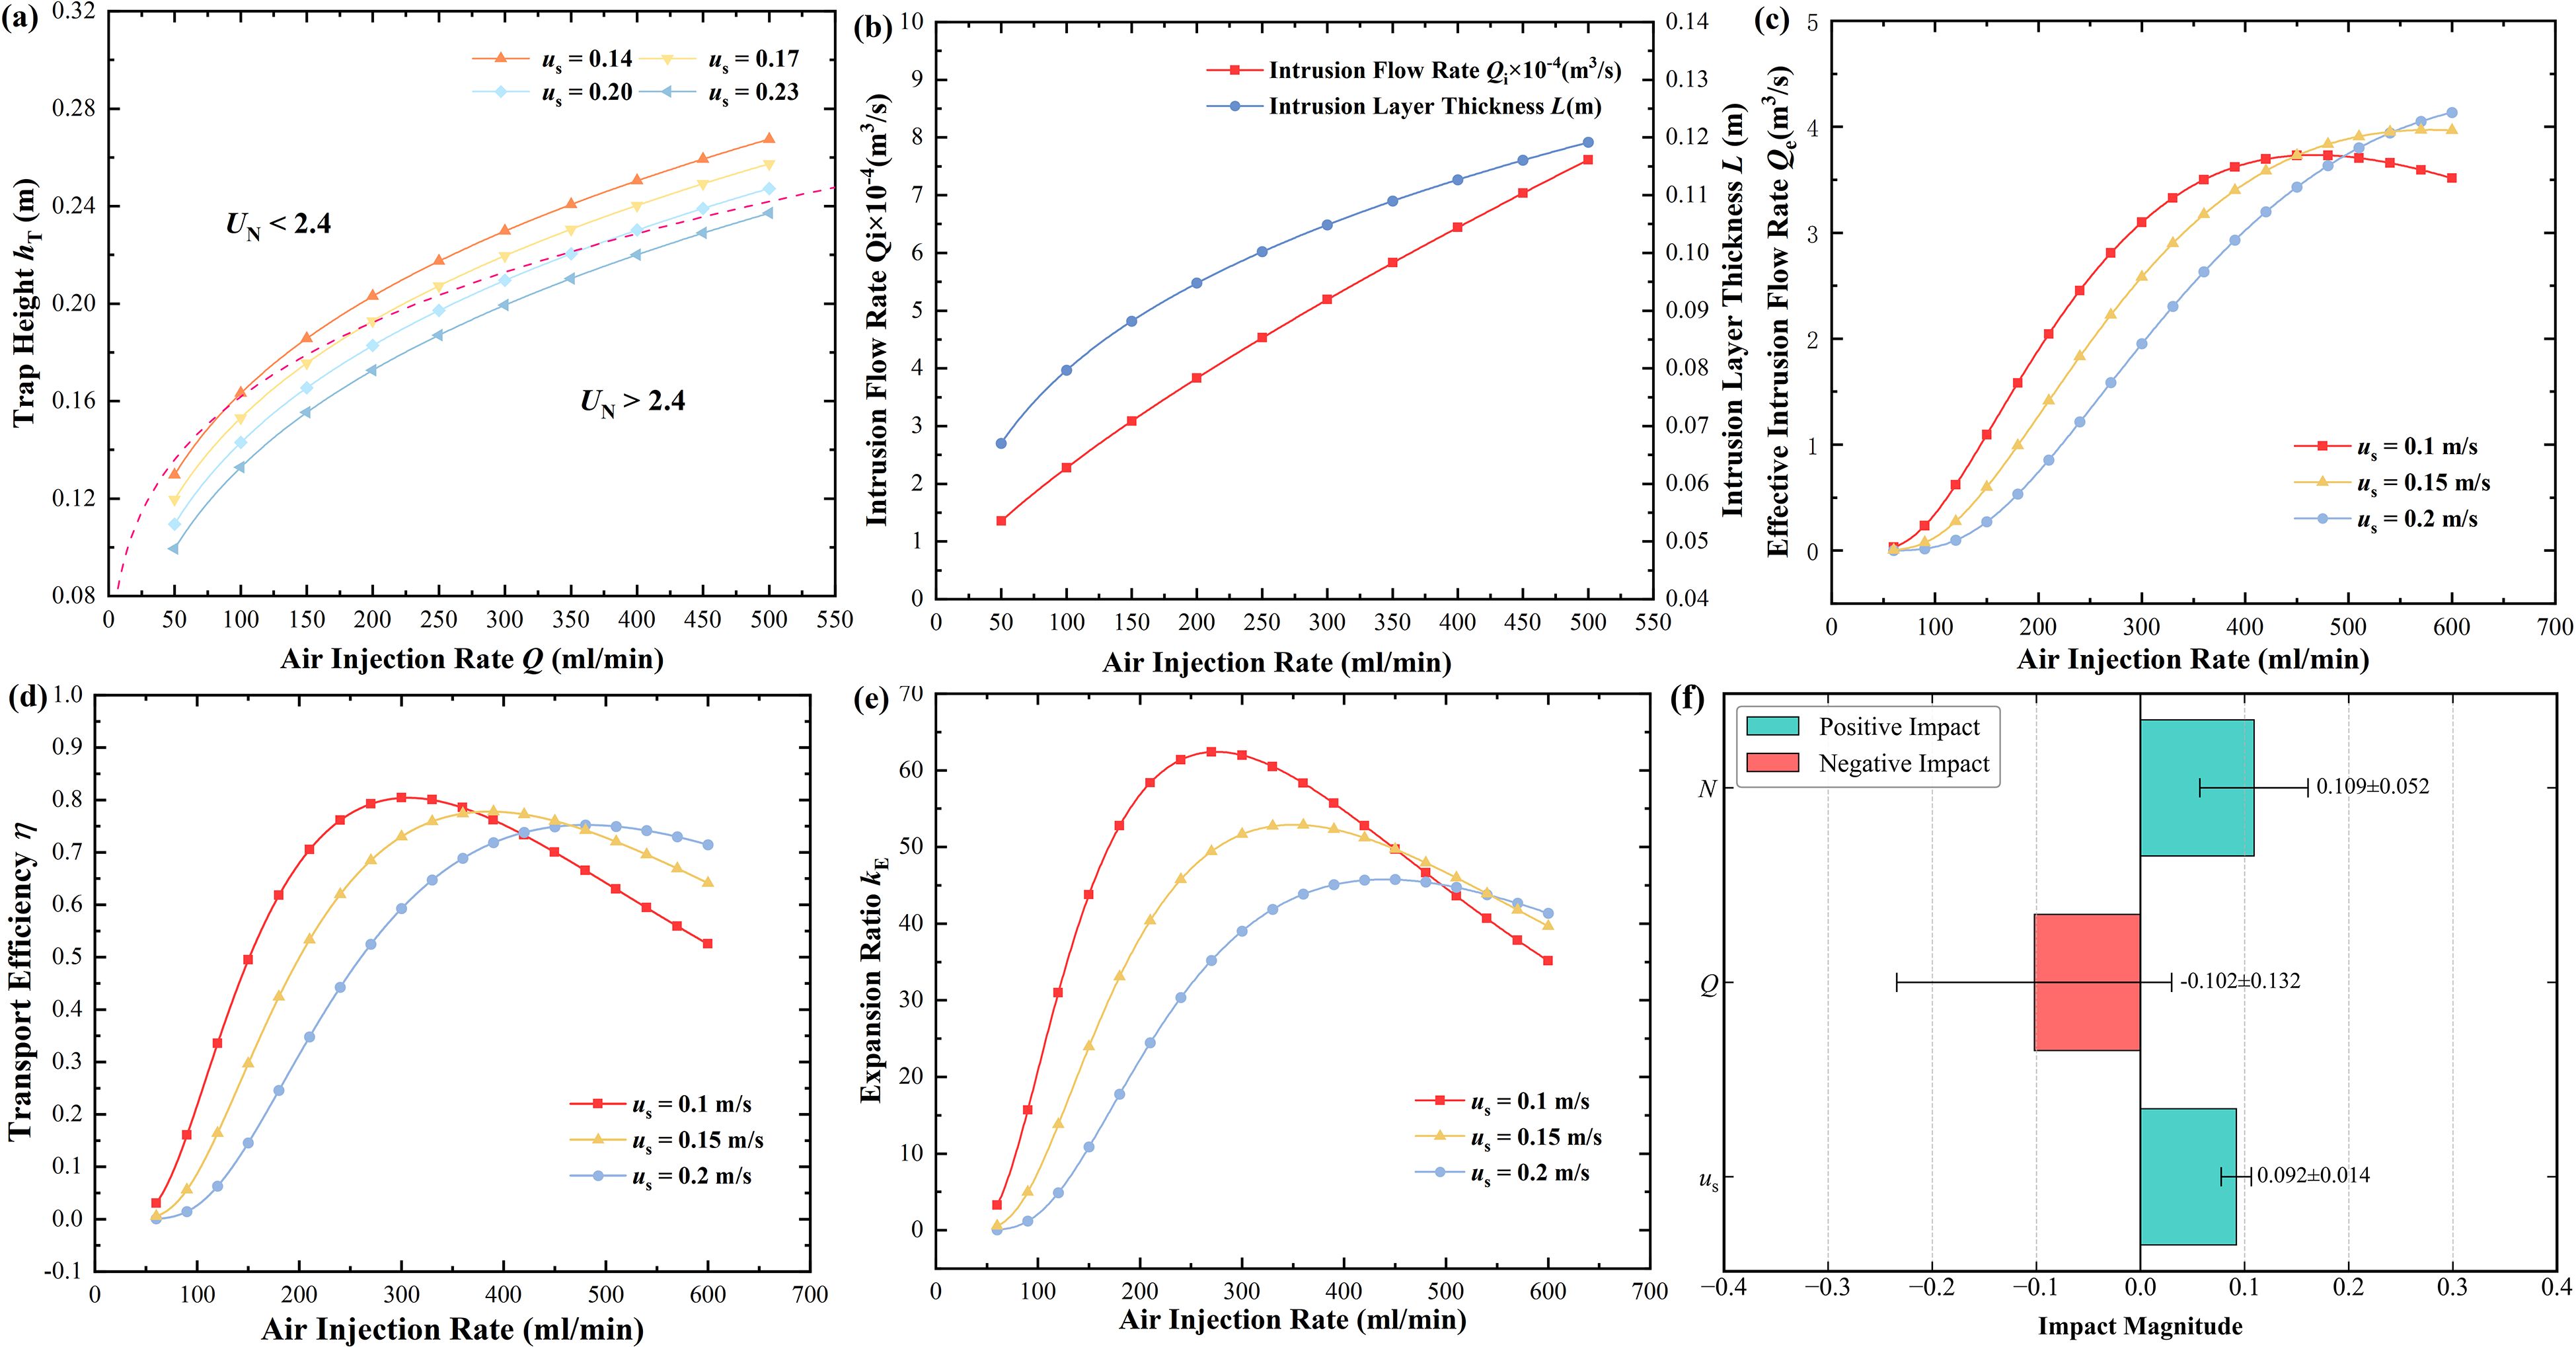
Figure 11. Characteristics of AU plumes under different air injection rates and bubble slip velocities: (a) The effects of air injection rate and slip velocity on trap height, the red dashed line denotes UN = 2.4; (b) The effects of air injection rate on intrusion layer thickness and flow rate; (c) Efficiency of Plume Transportation; (d) Effective Intrusion flow rate; (e) Entrainment expansion ratio. Dashed curves denote Type 3 plumes; (f) Sensitivity analysis for parameters in the AU system.
Further calculations for optimizing operating parameters are conducted to investigate how the characteristics of the bubble plume affect the transport efficiency of AU, in which the desired height was set as , and the effective range . The air injection rate ranged from 60–600 ml/min, the bubble slip velocity ranged from 0.1-0.2 m/s. Equation 9, 10 were adopted, with the dimensionless plume thickness , which aligned with our experiment results. The buoyancy frequency was set . The results are depicted in Figures 11C–E).
When the slip velocity is low, it takes less injected air bubbles to reach the maximum efficiency, and the corresponding maximum efficiency is higher. The intrusion flow rate exhibits a positive correlation with the air injection rate, given by: , while the effective intrusion flow rate is governed by both the efficiency and the intrusion flow rate. Therefore, air bubbles with higher slip velocities will result in higher maximum effective intrusion flow rates under high air injection rates. To take into account the energy consumption, the entrainment expansion ratio was calculated. The expansion ratio reaches its peak at a low slip velocity, which is consistent with the variation tendency of the transport efficiency, denoting the significance of keeping a high transport efficiency for the air-lift AU system. A sensitivity analysis was conducted (Figure 11F). Based on the results, we found that within the main range of the studied parameters, the impacts of various factors on the expansion ratio are comparable. However, the air injection rate and buoyancy frequency exhibit larger variances in their impacts. This is due to the presence of an optimal value within the range, which causes a significant change in the trend of their influence on efficiency.
From an engineering perspective, air-lift AU systems with larger air injection rates and higher bubble slip velocities correspond to a higher effective plume transport rate within a given time frame, disregarding energy constraints. However, it is also constrained by the dimensionless slip velocity . Excessive air injection rates and slip velocities will result in Type 3 plumes, significantly reducing transport efficiency. Generally, the applications for AU need to consider energy utilization, which usually use an in-situ power supply, and the energy is limited. Therefore, there is a preference for using lower air injection rates, corresponding to larger entrainment expansion coefficients, allowing AU to transport the most plume flow within limited energy constraints. However, this necessitates minimizing the slip velocity of the bubble plume, which poses a significant challenge to engineering practice. In actual air-lift AU applications, a larger air injection rate relative to the laboratory setups necessitates larger air injector diameters. Adjusting bubble slip velocity by reducing the air injection orifices is challenging since smaller orifices demand higher air pump pressure to counter pressure losses during aeration.
3.3 Results of field application
3.3.1 AU parameter design
AU supplements food for mussels by upwelling seawater with high Chl-a concentrations. Therefore, it is necessary to deploy the air injector in water layers with high Chl-a concentrations and maximize the entrainment expansion ratio () by adjusting the air injection rate based on the environmental parameters. Therefore, a single-station observation was conducted at D8 on 2024.8.5 before validation experiment. The observation results are shown in Figure 12A. The stratification intensity is approximately 0.05 s-¹, and the maximum Chl-a concentration is located at a water depth of 8 m, measuring 7.9 μg/L. By contrast, the integrated Chl-a concentration in the culture layer (0–3.8 m depth) is only 16.72 mg/m2 (4.4 μg/L in average). Thus, the air injector was deployed at a depth of 8 m.
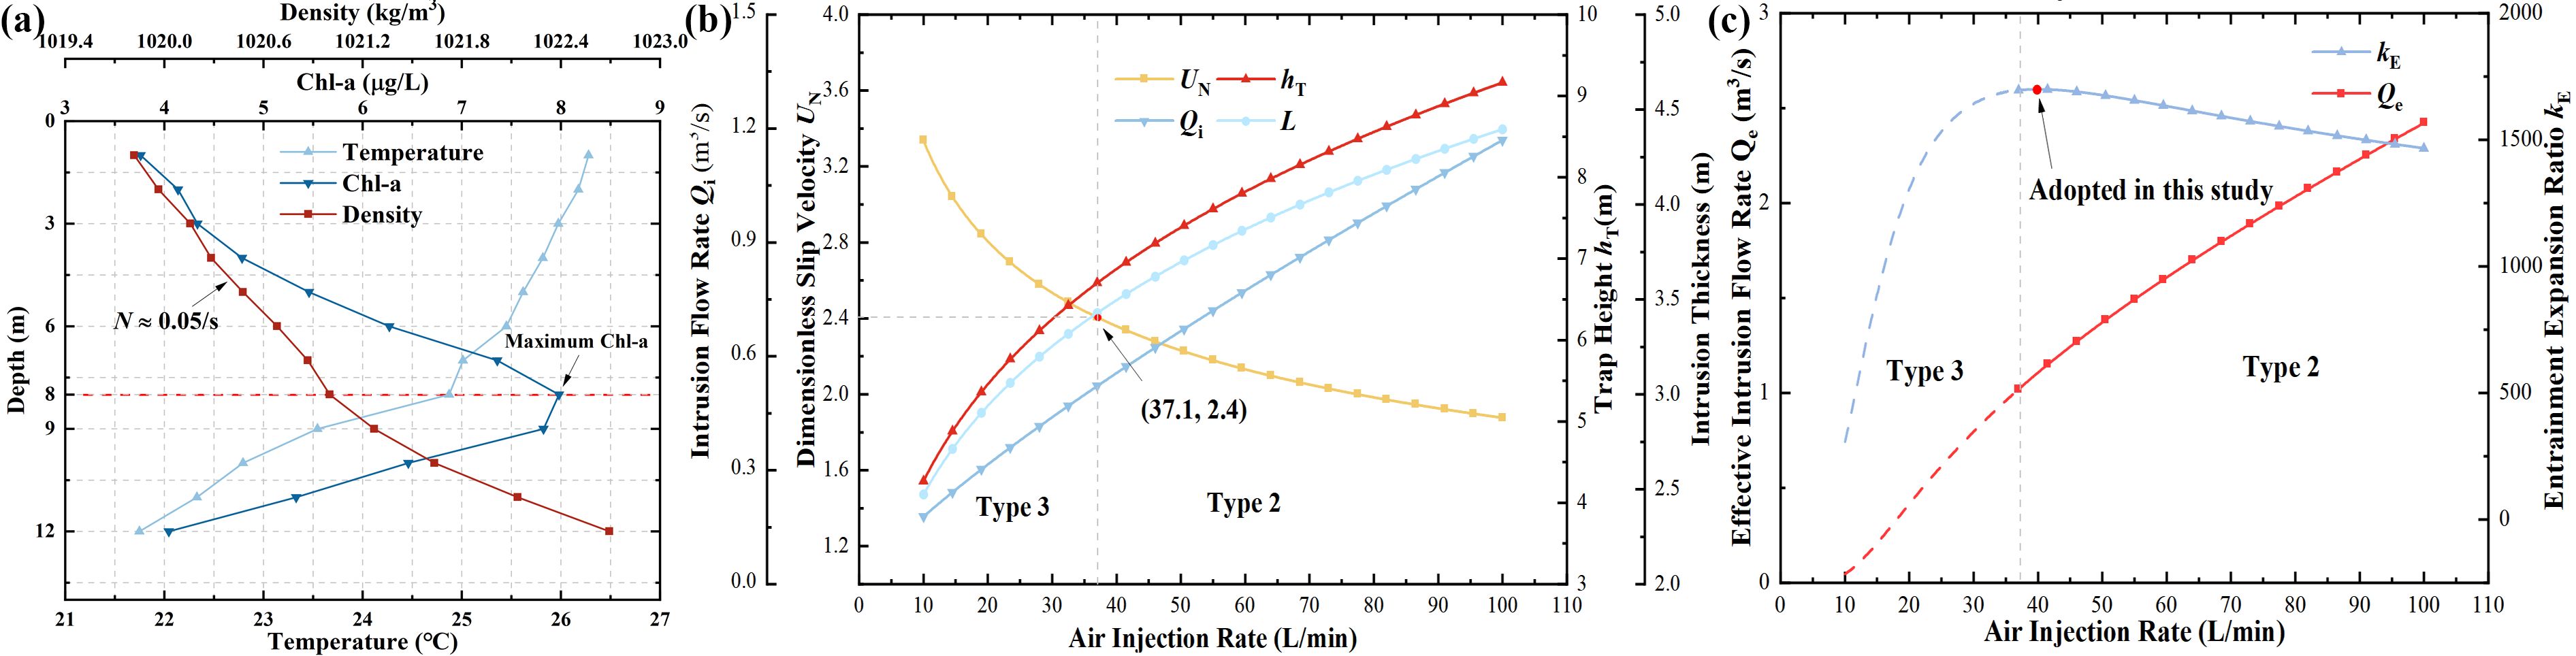
Figure 12. Calculation results of air-lift AU in mussel farming area: (a) Observation results at D8 on 2024.8.5; (b) Characteristic parameters of the bubble plume; (b) Evaluation of air-lift AU plume transport.
The upper boundary of the farming layer in mussel aquaculture is the water surface. During the actual transport of the AU plume, the portion beyond the boundary is entirely captured by the water surface. Therefore, Equation 13 is rewritten as (Equation 19):
The characteristic parameters of the bubble plume were calculated based on the air-lift AU system and environment parameters, as shown in Figure 12A, including the dimensionless slip velocity , the trap height , the intrusion layer thickness (), and the intrusion flow rate . The effective intrusion flow rate and entrainment expansion ratio are evaluated and depicted in Figure 12B). When , bubble plumes may transform into Type 3 plumes, and significantly reduce the efficiency of transport. Therefore, the air injection rate is restricted to be greater than 37.1 L/min.
The effective intrusion flow rate for air injection rate ranging from 10 L/min to 100 L/min was calculated, and it was found that when the air injection rate was 40.4 L/min, the entrainment expansion ratio was maximized, which was higher than the minimum injection rate (Figure 12C). Thus, we have controlled the air injection rate of the air-lift AU system to be 40 L/min (6.67×10⁻⁴ m3/s). The corresponding plume parameters are: . It should be noted that vertical sedimentation of transported bait was not considered here, as phytoplankton sedimentation velocities in the water column are far lower than AU-induced upwelling velocities (20–30 cm/s). Phytoplankton sinking rates typically range from<1 to tens of m/d (Smayda, 1970; Turner, 2002), so such sedimentation is deemed negligible in the model.
3.3.2 Comparison for AU plumes in SD and CD environments
As a key research content of this study, AU plumes in SD environments exhibit significant differences from those in CD environments. When horizontal crossflow exists, the plume separates from the bubble swarm. The stable height of the bubble plume is calculated following the method of Yao et al. (2019), which is the sum of the separation height of the bubble plume and the stable height of the jet after separation.
Further evaluation was conducted based on the variation of the tidal current. Gouqi Island has a semidiurnal tide, and the maximum current velocity in the mussel farm is (Zhong et al., 2022), and the current velocity can be calculated with the following simplified Equation 20, given by:
The change of the water depth was not considered as the air injector was tied to the buoys. The consumption power of the air compressor is determined by the air injection rate as follows (Equation 21) (Lin et al., 2019):
The minimum required air injection rate and the corresponding energy consumption for plume to reach the same target height (6.3 m in this study) in both SD and CD environments was calculated based on Eqn. (8), (16) and (21). The results are presented in Figure 13.
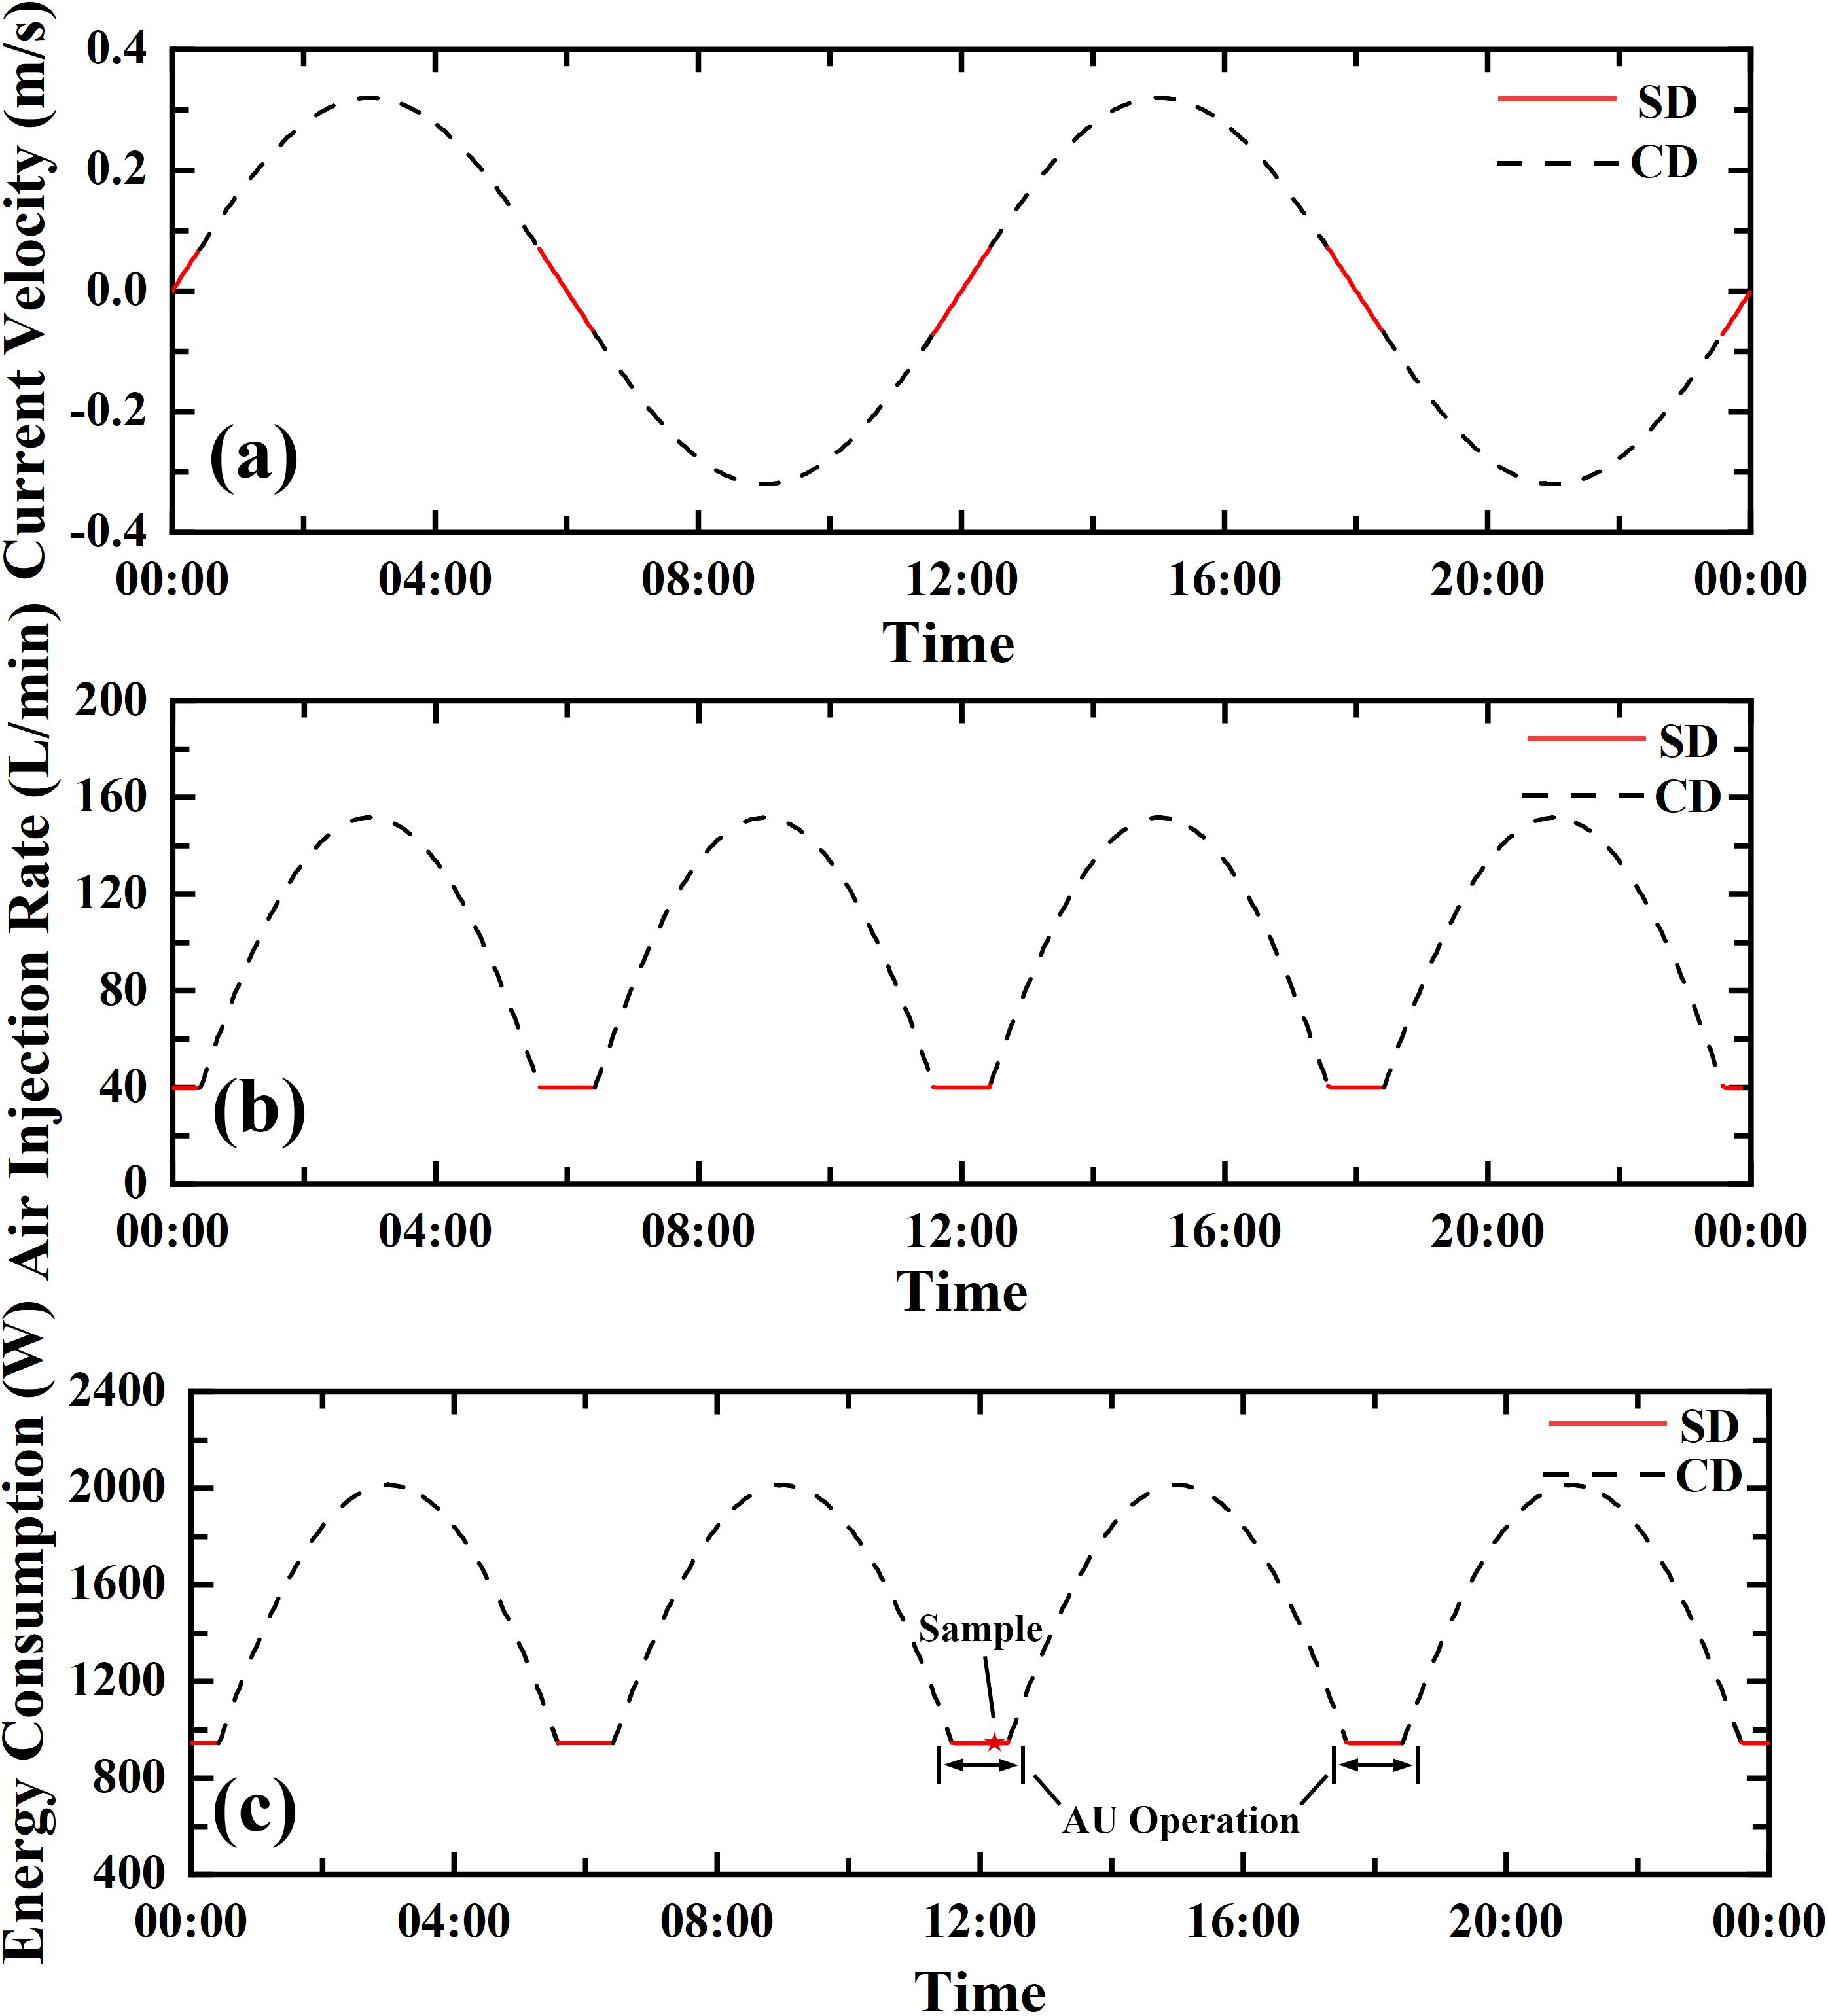
Figure 13. Comparison for AU in CD and SD environments: (a) Tidal current velocity; (b) Air-injection rate. (c) Energy consumption.
The calculated critical current velocity is 0.073 m/s. When the tidal current velocity is higher than the critical value, the required minimum air injection rate of AU system should be accordingly adjusted. As illustrated in Figure 13B, the required air injection rate grows greatly with the increase in current velocity, with a maximum injection rate of 151.7 L/min and an average injection rate of 114 L/min in CD environment.
The power consumption of the AU system is calculated based on the average air injection rate. The energy consumption of AU in the SD environment is 0.94 kW. By contrast, its average energy consumption in the CD environment is 1.65 kW, representing a 65% increase in energy consumption (Figure 13C).
Based on the above calculation results, AU exhibits greater feasibility in SD environments. On one hand, the required air injection rate for AU in SD environments is more stable, eliminating the need for frequent adjustments to the air injection rate to maintain stabilization at the target height. In contrast, the required air injection rate for AU in CD environments varies. In previous studies, the operational modes of AU systems are categorized into two types (Fan et al., 2020): variable air injection rate and fixed air injection rate. In the fixed air injection rate mode, system efficiency is reduced due to the inability to account for the effects of varying tidal current velocities. In the variable air injection rate mode, real-time adjustment of the air injection rate based on tidal current velocity is required, which significantly increases system complexity. Moreover, due to limitations in output power, when the tidal current velocity reaches a certain threshold, the AU system may fail to transport the plume to the designated height (Lin et al., 2019).
Furthermore, plumes in SD environments can better transport to the target location. Although the final positions of AU plumes are both balanced by negative buoyancy, plumes in SD environments form a compact intrusion layer, resulting in more concentrated transport. However, plumes in CD environments transport nutrients in the form of jets. During oscillation, the jet is affected by turbulence and exhibits intense entrainment behavior: on one hand, it continuously dilutes nutrients, reducing effective transport; on the other hand, the jet may develop into an irregular horseshoe shape under turbulence (Lee and Chu, 2012), making it difficult to theoretically predict such jets based on simplified assumptions.
Therefore, the air-lift AU system is regulated to operate mainly under low tidal current, under the evaluated optimal air injection rate.
3.3.3 AU effects on mussel aquaculture
The concentration distribution of Chl-a in mussel farms around Gouqi Island was sampled when the AU system was operating on August 6th, 2024 (Figure 13C). The specific sampling methodology is as described in Section 2.3.3. The sampling results are presented in Figure 14.
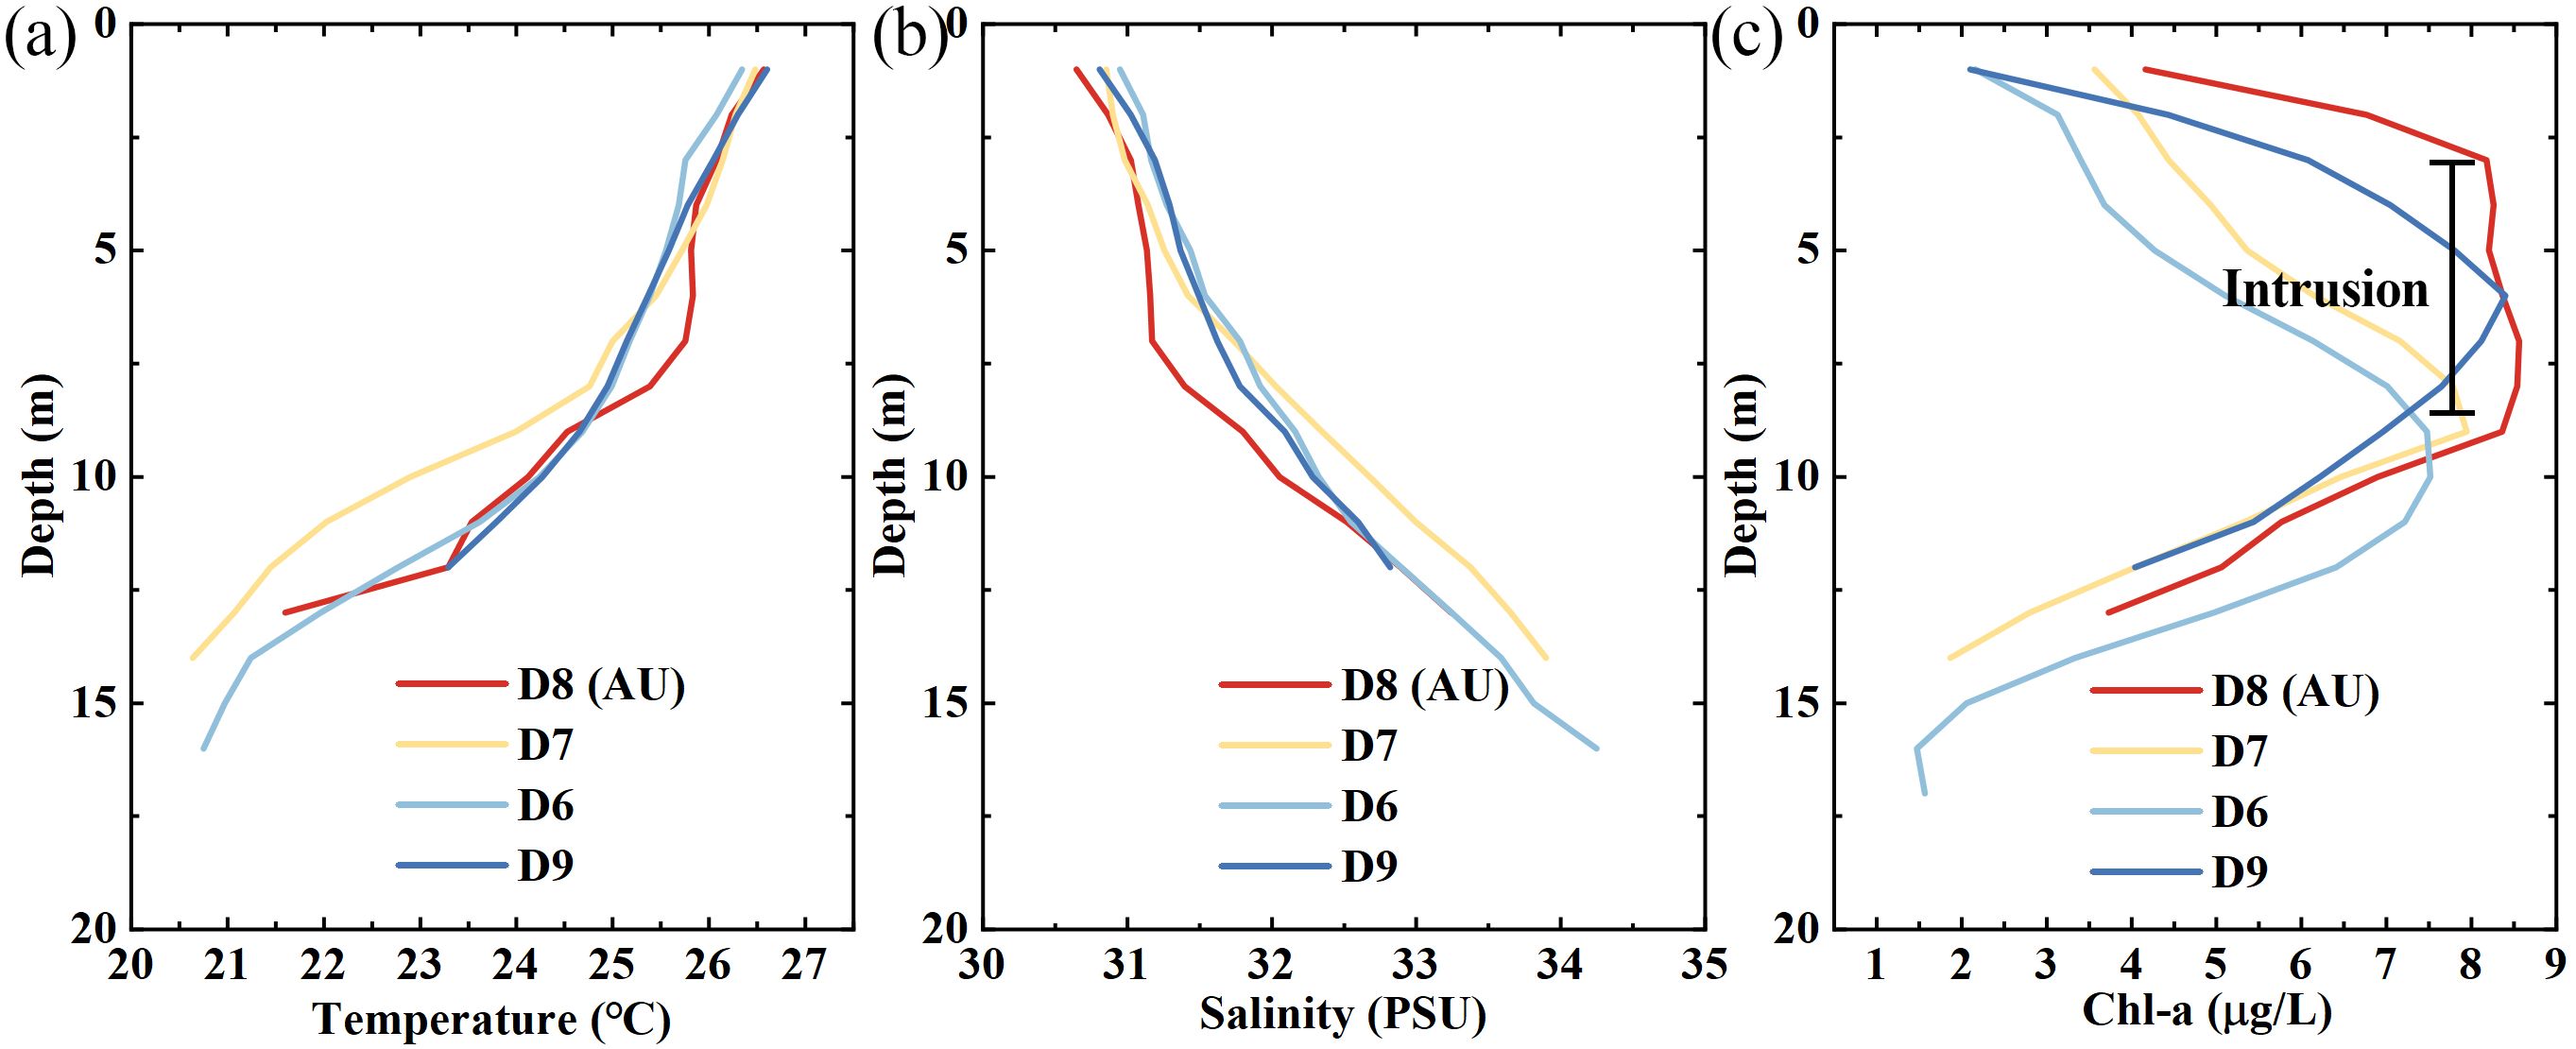
Figure 14. Field observation results on August 6th, 2024 in AU (D8) and non-AU (D6, D7 and D9) action zones: (a) temperature; (b) salinity; (c) Chl-a concentration.
The profile data from Stations D6, D7, and D9 exhibit similar vertical distributions: relatively linear stratification of temperature and salinity, with Chl-a concentrations in the culture layer being significantly lower than those in the lower layers unaffected by filter-feeding (5–10 m). As a result of the bubble plume and ambient stratification, the temperature and salinity data at Station D8 show a certain degree of perturbation in their vertical profiles, which reflects that upwelling has enhanced vertical mixing (Hung et al., 2010; Hung and Gong, 2011). Changes in Chl-a concentrations are relatively significant: the integrated Chl-a in the culture area with AU is 26.13 mg/m². Whereas the integrated Chl-a at Stations D6, D7, and D9 are 11.75, 16.15, and 18.66 mg/m², respectively, with an average value of 15.52 mg/m2 representing the food concentration level in non-AU action zone. Thus, it is evident that upwelling effectively transports the food plume and increases the food concentration in the culture area, with integrated Chl-a concentration increased by 40.2%.
According to the dynamic energy budget (DEB) model (Pouvreau et al., 2006; Rosland et al., 2009; Thomas et al., 2011), the energy required for the growth and reproduction of mussels is derived from ingestion (Equation 22). The ingestion rate of mussels can be expressed as:
Where denotes the maximum ingestion term; is the structural body volume; is the dimensionless function, which ranges from 0 to 1 and scales ingestion rate in relation to food concentration (X). is the half-saturation coefficient (μg Chl-a L−1) at which the ingestion rate is half the maximum, taken as 2.65 for fast growth phase (Thomas et al., 2011); represents the thermal effect. Based on the DEB model, it can be estimated that the chlorophyll concentration enhanced by hydrodynamic processes is expected to result in an approximate 16.4% increase in mussel productivity at D8 during the rapid growth period.
3.4 Contributions and limitations
AU enhances productivity, carbon removal and eutrophication mitigation by strengthening the vertical hydrodynamic exchange rate in aquaculture areas. In this study, the high efficiency of AU in SD environments has been verified. From the perspective of theoretical analysis, this study focused on investigating the characteristics of plumes generated by AU in SD environments. Previous studies only considered bubble plumes with separation, while neglecting low-flow conditions. However, in the application scenarios of coastal aquaculture, SD environments are common with intensive aquaculture structures blocking water exchange, and should be addressed.
To evaluate the transport efficiency of AU plumes, we established an evaluation model based on thickness, concentration, and transport height, and optimized the parameters of the AU system using this model. This is also innovative and meaningful in the field of AU. Previous studies only focused on transport height and flow rate; yet, the effective plumes actually delivered to the target layer may be diluted during the processes of ascent, oscillation, and stabilization. Therefore, while ensuring transport height and flow rate, it is necessary to confirm the accuracy of transport. By incorporating concentration and thickness into consideration, this study has improved the optimization method for AU parameters.
According to the results of sea area experiments, the methodology of this study has indeed achieved efficient transport of nutrients. We also analyzed the advantages of SD plumes over CD plumes from the perspectives of energy consumption and operation modes.
However, for specific aquaculture species, a comprehensive analysis of influencing factors is required. Taking the mussel aquaculture in this study as an example, the main limiting factors for mussel productivity in the Gouqi Island mussel farm are insufficient algal concentration and insufficient filtration rate (Ma et al., 2024). Although AU promotes phytoplankton supplementation as food, the impacts of nutrients and temperature on growth rate should also be appropriately considered. If there exist significant vertical gradients in temperature and nutrient concentration, negative effects induced by hydrodynamic changes should be avoided, such as inappropriate N(Nitrogen): P(phosphorus) ratios and excessively high or low temperatures. For algal cultivation, light availability should also be regarded as a critical factor in the operational strategies of AU systems.
In addition, the beneficial effect of AU depends not only on the upwelling flow rate, but also on the distribution of nutrients, e.g. the Chl-a concentration in mussel farms. Better performance is expected in regions where larger concentration gradient of nutrients exists, coupled with a low value of Chl-a concentration in the farming layer.
This imposes requirements for the potential evaluation of AU and its rational site selection. In aquaculture areas with favorable hydrodynamic exchange and no parameter restrictions, AU exhibits limited effectiveness. For instance, in this study, Transect E features good water exchange conditions, resulting in poor performance when AU is deployed. In contrast, Transects A, B, and D, characterized by significant vertical concentration differences, are where AU can significantly enhance the productivity of aquaculture farms. Specifically, based on sampling data estimates, deploying AU at Site A3 is expected to increase the mussel growth rate by approximately 27%. Therefore, deploying AU devices in significantly restricted areas will further improve their effectiveness.
In future work, the deployment of AU will be expanded to investigate the impact of different deployment locations on its effectiveness, and to further validate the effectiveness of AU systems in SD environments.
4 Conclusions
In this research, the behavior and characteristic parameters of air-lift AU plumes under SD water environments were studied theoretically and experimentally. In addition, an evaluation method was proposed in this study to calculate the total transport capacity and efficiency of AU plumes. Laboratory experiments were conducted to confirm the accuracy and validity of the theoretical model, and the results aligned well with the theoretical model.
The behaviors of the air-lift plumes could be described by three main characteristics, including the trap height , intrusion layer thickness , and flow rate . By controlling the gas injection rate and bubble diameters, we specified the characteristics of the air-lift plumes, leading to a trap height closer to the target height while maintaining a minimal intrusion layer thickness, thereby optimizing the transport efficiency of the air-lift AU.
To validate the effectiveness of the air-lift AU in aquaculture, we have deployed and optimized the design for an air-lift artificial upwelling system for mussel farming based on theoretical and experimental analysis. The observation results reveal that the application of the air-lift AU effectively elevated the Chl-a concentration by 40.2% in the farming layer. It denotes the potential of AU to enhance the productivity of aquaculture, consequently improving eutrophication mitigation and carbon removal. In the process of formulating AU operational strategies, in addition to basic system parameters, it is necessary to fully consider the impacts of other environmental factors, such as nutrients, temperature, and dissolved oxygen, so as to avoid side effects caused by vertical water exchange.
It should be noted that this study was conducted based on certain assumptions and simplifications. Specifically, the theoretical model for bubble plume in SD environments ignores processes such as breakup and coalescence of bubbles during their ascent. Further refinement of the theoretical model can enhance the accuracy of plume transport. In the field validation, it was restricted to a single mussel farming area near Gouqi Island, with a narrow scope of environmental conditions (e.g., semidiurnal tides, specific stratification intensity, and single aquaculture species). Additionally, Chl-a concentration was used as a proxy for mussel food, and the DBE model was applied to convert this into estimates of mussel yield increase, rather than directly measuring mussel yield. Thus, future studies should expand field sites across diverse coastal ecosystems and conduct multi-year monitoring to verify AU’s consistent performance under varying environmental contexts.
In subsequent research endeavors, it is imperative to devise air injection methodologies that facilitate the generation of bubbles characterized by minimal slip velocity and to optimize the configuration of air injectors. These investigations will contribute to the refinement and optimization of AU techniques, enhancing their effectiveness in practical applications. In addition, the potential of AU should be evaluated for site selection to improve the effectiveness. The deployment of AU will be expanded based on theoretical analysis and observation results.
Data availability statement
The original contributions presented in the study are included in the article/supplementary material. Further inquiries can be directed to the corresponding author.
Author contributions
ZZ: Data curation, Investigation, Validation, Visualization, Writing – original draft, Writing – review & editing. WF: Conceptualization, Funding acquisition, Writing – review & editing. YZ: Formal Analysis, Investigation, Methodology, Writing – original draft. LY: Data curation, Validation, Writing – review & editing. SH: Data curation, Formal analysis, Writing – review & editing. YC: Visualization, Writing – review & editing.
Funding
The author(s) declare financial support was received for the research and/or publication of this article. This research was financially funded by the National Key Research and Development Program of China (2024YFF0507004), the Project of Sanya Yazhou Bay Science and Technology City (SKJC-2022-PTDX-004), the International Science & Technology Cooperation Program of Hainan Province (GHYF2025045), the Key Research and Development Project in Hainan Province, China (ZDYF2023SHFZ173). Zhiyu Zou is supported by the PhD Scientific Research and Innovation Foundation of The Education Department of Hainan Province Joint Project of Sanya Yazhou Bay Science and Technology City (HSPHDSRF-2024-04-005).
Acknowledgments
This paper contributes to the science plan of the Ocean Negative Carbon Emissions (ONCE) Program. This paper was supported by HPC Center OF ZJU (Zhoushan Campus).
Conflict of interest
The authors declare that the research was conducted in the absence of any commercial or financial relationships that could be construed as a potential conflict of interest.
Generative AI statement
The author(s) declare that no Generative AI was used in the creation of this manuscript.
Any alternative text (alt text) provided alongside figures in this article has been generated by Frontiers with the support of artificial intelligence and reasonable efforts have been made to ensure accuracy, including review by the authors wherever possible. If you identify any issues, please contact us.
Publisher’s note
All claims expressed in this article are solely those of the authors and do not necessarily represent those of their affiliated organizations, or those of the publisher, the editors and the reviewers. Any product that may be evaluated in this article, or claim that may be made by its manufacturer, is not guaranteed or endorsed by the publisher.
References
Asaeda T. and Imberger J. (1993). Structure of bubble plumes in linearly stratified environments. J. Fluid Mech. 249, 35. doi: 10.1017/S0022112093001065
Breitburg D., Levin L. A., Oschlies A., Grégoire M., Chavez F. P., Conley D. J., et al. (2018). Declining oxygen in the global ocean and coastal waters. Science 359, eaam7240. doi: 10.1126/science.aam7240
Cloern J. E., Abreu P. C., Carstensen J., Chauvaud L., Elmgren R., Grall J., et al. (2016). Human activities and climate variability drive fast-paced change across the world’s estuarine–coastal ecosystems. Global Change Biol. 22, 513–529. doi: 10.1111/gcb.13059
Davidson G. A. (1986). Gaussian versus top-hat profile assumptions in integral plume models. Atmos. Environ. (1967) 20, 471–478. doi: 10.1016/0004-6981(86)90087-9
Fan W., Zhang Z., Yao Z., Xiao C., Zhang Y., Zhang Y., et al. (2020). A sea trial of enhancing carbon removal from Chinese coastal waters by stimulating seaweed cultivation through artificial upwelling. Appl. Ocean Res. 101, 102260. doi: 10.1016/j.apor.2020.102260
Filgueira R., Guyondet T., Comeau L. A., and Tremblay R. (2016). Bivalve aquaculture-environment interactions in the context of climate change. Global Change Biol. 22, 3901–3913. doi: 10.1111/gcb.13346
Fischer H. B., List E. G., Koh R. C. Y., Imberger J., and Brooks N. H. (1979). Mixing in inland and coastal waters (New York: Academic).
Glibert P. M. and Burkholder J. M. (2011). Harmful algal blooms and eutrophication: “strategies” for nutrient uptake and growth outside the Redfield comfort zone. Chin. J. Oceanology Limnology 29, 724–738. doi: 10.1007/s00343-011-0502-z
Hung C.-C. and Gong G.-C. (2011). Biogeochemical responses in the southern east China sea after typhoons. Oceanography 24, 42–51. doi: 10.1016/j.oceaneng.2011.10.011
Hung C.-C., Gong G.-C., Chou W.-C., Chung C.-C., Lee M.-A., Chang Y., et al. (2010). The effect of typhoon on particulate organic carbon flux in the southern East China Sea. Biogeosciences 7, 3007–3018. doi: 10.5194/bg-7-3007-2010
Jürchott M., Oschlies A., and Koeve W. (2023). Artificial upwelling—A refined narrative. Geophysical Res. Lett. 50, e2022GL101870. doi: 10.1029/2022GL101870
Khanjani M. H., Zahedi S., and Mohammadi A. (2022). Integrated multitrophic aquaculture (IMTA) as an environmentally friendly system for sustainable aquaculture: functionality, species, and application of biofloc technology (BFT). Environ. Sci. pollut. Res. 29, 67513–67531. doi: 10.1007/s11356-022-22371-8
Lee J. H. and Chu V. (2012). Turbulent jets and plumes: A lagrangian approach (Netherlands: Springer Science & Business Media).
Lemckert C. J. and Imberger J. (1993). Axisymmetric intrusive gravity currents in linearly stratified fluids. J. Hydraul. Eng. 119, 662–679. doi: 10.1061/(ASCE)0733-9429(1993)119:6(662
Liang N.-K. and Peng H.-K. (2005). A study of air-lift artificial upwelling. Ocean Eng. 32, 731–745. doi: 10.1016/j.oceaneng.2004.10.011
Lin T., Fan W., Xiao C., Yao Z., Zhang Z., Zhao R., et al. (2019). rgy management and operational planning of an ecological engineering for carbon sequestration in coastal mariculture environments in China. Sustainability 11, 3162. doi: 10.3390/su11113162
Lin J., Li C., and Zhang S. (2016). Hydrodynamic effect of a large offshore mussel suspended aquaculture farm. Aquaculture 451, 147–155. doi: 10.1016/j.aquaculture.2015.08.039
Ma Q., Liang S., Zhang R., and Sun Z. (2024). Siting and evaluation of offshore suspended mussel farms through nutritional restriction approach. Aquaculture 578, 739989. doi: 10.1016/j.aquaculture.2023.739989
McClimans T. A., Handå A., Fredheim A., Lien E., and Reitan K. I. (2010). Controlled artificial upwelling in a fjord to stimulate non-toxic algae. Aquacultural Eng. 42, 140–147. doi: 10.1016/j.aquaeng.2010.02.002
Naddafi R., Pettersson K., and Eklöv P. (2007). The effect of seasonal variation in selective feeding by zebra mussels (Dreissena polymorpha) on phytoplankton community composition. Freshw. Biol. 52, 823–842. doi: 10.1111/j.1365-2427.2007.01732.x
O’Donncha F., Hartnett M., and Nash S. (2013). Physical and numerical investigation of the hydrodynamic implications of aquaculture farms. Aquacultural Eng. 52, 14–26. doi: 10.1016/j.aquaeng.2012.07.006
Pan Y., Fan W., Zhang D., Chen J., Huang H., Liu S., et al. (2016). Research progress in artificial upwelling and its potential environmental effects. Sci. China Earth Sci. 59, 236–248. doi: 10.1007/s11430-015-5195-2
Pouvreau S., Bourles Y., Lefebvre S., Gangnery A., and Alunno-Bruscia M. (2006). Application of a dynamic energy budget model to the Pacific oyster, Crassostrea gigas, reared under various environmental conditions. J. Sea Res. 56, 156–167. doi: 10.1016/j.seares.2006.03.007
Qiang Y., Fan W., Xiao C., Rivkin R. B., Pan Y., Wu J., et al. (2018). Behaviors of bubble-entrained plumes in air-injection artificial upwelling. J. Hydraul. Eng. 144, 04018032. doi: 10.1061/(ASCE)HY.1943-7900.0001466
Rabalais N. N., Díaz R. J., Levin L. A., Turner R. E., Gilbert D., and Zhang J. (2010). Dynamics and distribution of natural and human-caused hypoxia. Biogeosciences 7, 585–619. doi: 10.5194/bg-7-585-2010
Rosland R., Strand Ø., Alunno-Bruscia M., Bacher C., and Strohmeier T. (2009). Applying Dynamic Energy Budget (DEB) theory to simulate growth and bio-energetics of blue mussels under low seston conditions. J. Sea Research Metab. organization: 30 years DEB Appl. developments 62, 49–61. doi: 10.1016/j.seares.2009.02.007
Sigurðardóttir A., Barnard J., Bullamore D., McCormick A., Cartwright J., and Cardoso S. (2020). Radial spreading of turbulent bubble plumes. Philosophical Transactions of the Royal Society A: Mathematical, Physical and Engineering Sciences. 378, 20190513. doi: 10.1098/rsta.2019.0513
Smayda T. J. (1970). The sinking and suspension of phytoplankton in the sea. Oceanogr Mar. Biol. Annu. Rev. 8, 353–414.
Socolofsky S. A. and Adams E. E. (2002). Multi-phase plumes in uniform and stratified crossflow. J. Hydraulic Res. 40, 661–672. doi: 10.1080/00221680209499913
Socolofsky S. A. and Adams E. E. (2005). Role of slip velocity in the behavior of stratified multiphase plumes. J. Hydraul. Eng. 131, 273–282. doi: 10.1061/(ASCE)0733-9429(2005)131:4(273
Thomas Y., Mazurié J., Alunno-Bruscia M., Bacher C., Bouget J.-F., Gohin F., et al. (2011). Modelling spatio-temporal variability of Mytilus edulis (L.) growth by forcing a dynamic energy budget model with satellite-derived environmental data. J. Sea Res. 66, 308–317. doi: 10.1016/j.seares.2011.04.015
Troell M., Halling C., Neori A., Chopin T., Buschmann A. H., Kautsky N., et al. (2003). Integrated mariculture: asking the right questions. Aquaculture 226, 69–90. doi: 10.1016/S0044-8486(03)00469-1
Turner J. T. (2002). Zooplankton fecal pellets, marine snow and sinking phytoplankton blooms. Aquat. Microb. Ecol. 27, 57–102. doi: 10.3354/ame027057
Wen Y., Lin J., Yang G., Yang W., and Tang J. (2022). Study on hydrodynamic effect of suspended mussel aquaculture facilities and detritus transportation of epiphytic seaweed. J. ShangHai Ocean Univ. 31, 1549–1561. doi: 10.12024/jsou.20210503455
Yao Z., Fan W., Xiao C., Qiang Y., Pan Y., Liang N.-K., et al. (2019). Theoretical and experimental study on influence factors of bubble-entrained plume in air-injection artificial upwelling. Ocean Eng. 192, 106572. doi: 10.1016/j.oceaneng.2019.106572
Zhao Y., Zou Z., Zhang Y., Wen C., Yue L., Hu S., et al. (2025). Plume discharge strategies for artificial downwelling in stagnant linear stratified environments. Ocean Eng. 315, 119678. doi: 10.1016/j.oceaneng.2024.119678
Keywords: artificial upwelling, coastal aquaculture, carbon sequestration, stratification-dominated, transport efficiency
Citation: Zou Z, Fan W, Zhao Y, Yue L, Hu S and Chen Y (2025) Enhancing artificial upwelling in stratification-dominated coastal aquaculture. Front. Mar. Sci. 12:1584453. doi: 10.3389/fmars.2025.1584453
Received: 28 February 2025; Accepted: 16 October 2025;
Published: 29 October 2025.
Edited by:
Brett W Molony, Oceans and Atmosphere (CSIRO), AustraliaReviewed by:
Chin-Chang Hung, National Sun Yat-sen University, TaiwanChunlei Shen, Shandong University, China
Copyright © 2025 Zou, Fan, Zhao, Yue, Hu and Chen. This is an open-access article distributed under the terms of the Creative Commons Attribution License (CC BY). The use, distribution or reproduction in other forums is permitted, provided the original author(s) and the copyright owner(s) are credited and that the original publication in this journal is cited, in accordance with accepted academic practice. No use, distribution or reproduction is permitted which does not comply with these terms.
*Correspondence: Wei Fan, d2F5ZmFuQHpqdS5lZHUuY24=