 Correigh M. Greene1*†
 Eric M. Beamer2
 Stuart H. Munsch1
 Joshua W. Chamberlin1
 Michael T. LeMoine2
 Joseph H. Anderson3
- 1National Marine Fisheries Service, Northwest Fisheries Science Center, Seattle, WA, United States
- 2Skagit River System Cooperative, LaConner, WA, United States
- 3Washington Department of Fish and Wildlife, Fish Program, Science Division, Olympia, WA, United States
Estuaries comprise important but often-degraded fish nursery habitat. People have invested considerable resources into restoring estuaries to rehabilitate habitats, but comparatively little work has evaluated population outcomes for target species. Here, we examined the response of a threatened population of Chinook salmon (Oncorhynchus tshawytscha) to estuary restoration in their natal tidal delta, and observed demographic changes consistent with increasing nursery habitat capacity and quality. We leveraged three decades of monitoring before, during, and after restoration in the Skagit River delta, and compared demographic patterns in restored and unrestored forks within the delta, and in locations landward and seaward of the delta. We hypothesized that restoration in tidal deltas should result in reductions in local densities, and reduced density-dependent spillover of juveniles into nearshore waters. We also examined other predictions that were more ambiguous and depended upon biological mechanisms. We found that (1) delta restoration led to lower juvenile densities overall and greater juvenile densities when conspecific abundances were high, and (2) individual juveniles were smaller overall and their lengths declined less when densities were higher. We also monitored juvenile salmon in nearshore waters seaward of the delta. Following delta restoration, (3) juvenile catches in nearshore marine waters declined relative to delta habitat change, and (4) the prevalence of nearshore fry (<~45 mm) — a phase thought to benefit more from delta nursery habitats — decreased overall. These findings suggest that greater nursery habitat capacity in the delta allowed salmon to spread out and accommodated higher salmon numbers when juvenile outmigrations were especially high. They also suggest that restoration promoted the use of delta habitats by smaller fish while alleviating competitive effects on growth. Furthermore, they suggest that greater delta habitat capacity supported more juveniles, decreasing overflow to nearshore environments, especially for the smallest, most vulnerable salmon that presumably benefit most from growth before entering nearshore waters. Thus, estuary restoration appeared to alleviate density-dependent constraints on rearing and growth. These findings provide empirical support for restoring estuaries in human-stressed landscapes to rehabilitate nursery habitat functions for Chinook salmon and, potentially, other species and life stages.
Introduction
Estuaries provide vital nursery habitat for fishes and other taxa (Beck et al., 2001). They provide early life stages with refuge from predators, opportunities for rapid growth, ontogenetically-appropriate stepping stones to subsequent habitats, and – in diadromous species – gradients for osmoregulation adaptation (Simenstad et al., 1982; Thorpe, 1994; Nagelkerken et al., 2015). Consequently, ecologists often consider estuaries as nurseries that promote the growth and survival of juvenile fish and broadly underpin the function of nearshore ecosystems (Sheaves et al., 2015).
Despite their nursery value, legacy and current human stressors limit estuarine habitat capacities. Indeed, people have channelized, hardened, eliminated, and simplified estuarine habitats worldwide (Gittman et al., 2015; Brophy et al., 2019; Murray et al., 2022), a process implicated in habitat degradation and population-level declines of various species (Magnuson and Hilborn, 2003; Lotze et al., 2006; Toft et al., 2018; Hodgson et al., 2020). Not only are declines in population abundance concerning, but resilience is being eroded by losses of both life history diversity and habitat diversity (Sturrock et al., 2020). Life history diversity spreads risk and promotes resilience (Greene et al., 2010; Schindler et al., 2010), but resilience is eroding through losses to both habitat and life histories (Munsch et al., 2022). Thus, restoring estuaries may improve the key population attributes – including abundance and diversity – of various species that depend on estuarine habitats.
Not surprisingly, estuary restoration efforts targeting threatened species are increasingly widespread (Bayraktarov et al., 2016). Despite these efforts, few studies have evaluated demographic outcomes for target populations. Long-term studies are indispensable to quantifying responses to restoration efforts because they document dynamic population changes, often at spatiotemporal resolutions that elucidate life history expression. Long-term efforts are also imperative because habitat use in estuaries can vary substantially among years (Colombano et al., 2022), necessitating long time series to attribute changes to restoration. Notably, these studies are rare because practitioners typically allocate finite resources toward restoration costs instead of monitoring and assessment. Fortunately, some long-term monitoring programs follow restoration efforts over time periods that are biologically relevant and offer a unique opportunity to assess fish responses to estuary restoration.
In the northeast Pacific including the Salish Sea, habitat restoration and monitoring efforts have focused on improving conditions for imperiled stocks of Pacific salmon. Pacific salmon are culturally, ecologically, and economically important anadromous species native to the northern Pacific Rim. Especially in their southern range, they are declining largely due to habitat loss and degradation (Nehlsen et al., 1991). Chinook salmon rely on natal river tidal deltas, non-natal “pocket estuaries” (nearshore lagoons and marshes), and other estuarine habitats as juveniles migrate from fresh to marine waters (Reimers, 1973; Healey, 1980; Beamer et al., 2003), yet people have converted many of these areas to agricultural or urban landscapes. Several studies link salmon performance to estuary status, either by examining return rates of groups of fish given access to different habitat zones (Levings et al., 1989; Beamer et al. in review) or comparing survival rates across differentially modified estuaries (Magnuson and Hilborn, 2003). These studies support the hypothesis that estuarine habitat is vital for juvenile Chinook salmon and implicate restoration as a key recovery pathway. However, research has yet to address the potential for large-scale estuarine habitat restoration to ameliorate human use impacts via improved population-scale habitat use and life history expression.
Here, we leverage decades of intensive fish and habitat monitoring to quantify demographic shifts in threatened juvenile Chinook salmon coincident with over 250 ha of estuarine wetland restoration. Our goal in this study was to examine empirical data for evidence of restoration improving the capacity of estuary nursery habitats to support juvenile salmon rearing and growth. Specifically, we tested if tidal delta restoration reduced density-dependent rearing conditions in the delta as well as spillover into the marine nearshore (see also Beamer et al. in review). We predicted that habitat restoration should increase rearing habitat in the tidal delta, thereby 1) allowing juvenile fish to spread out at lower densities, and 2) to grow faster, thereby achieving larger body size. Additionally, we predicted that tidal delta restoration should 3) reduce overflow of juveniles into the intertidal nearshore, 4) particularly for migrant fry, the size class most vulnerable to marine predators. These analyses and findings should be informative to other efforts seeking to improve habitat for the myriad species that rely on estuarine nurseries.
Methods
Study species
Chinook salmon are distributed across the Northern Pacific Rim from Kamchatka (Russia), through Alaska and British Columbia, and in all four Pacific Coast states connected by large rivers (Healey, 1991). Across much of this distribution, juvenile Chinook salmon use large river deltas and other estuarine habitats for extended periods of time (weeks to months) often as subyearling migrants (Reimers, 1973; Levings, 2019; Munsch et al., 2020; Arbeiter et al., 2023, Figure 1). Despite extensive life history variation (Reimers, 1973; Healey, 1980; Greene and Beechie, 2004), Chinook salmon are described as the most estuarine-dependent of all the Pacific salmon.
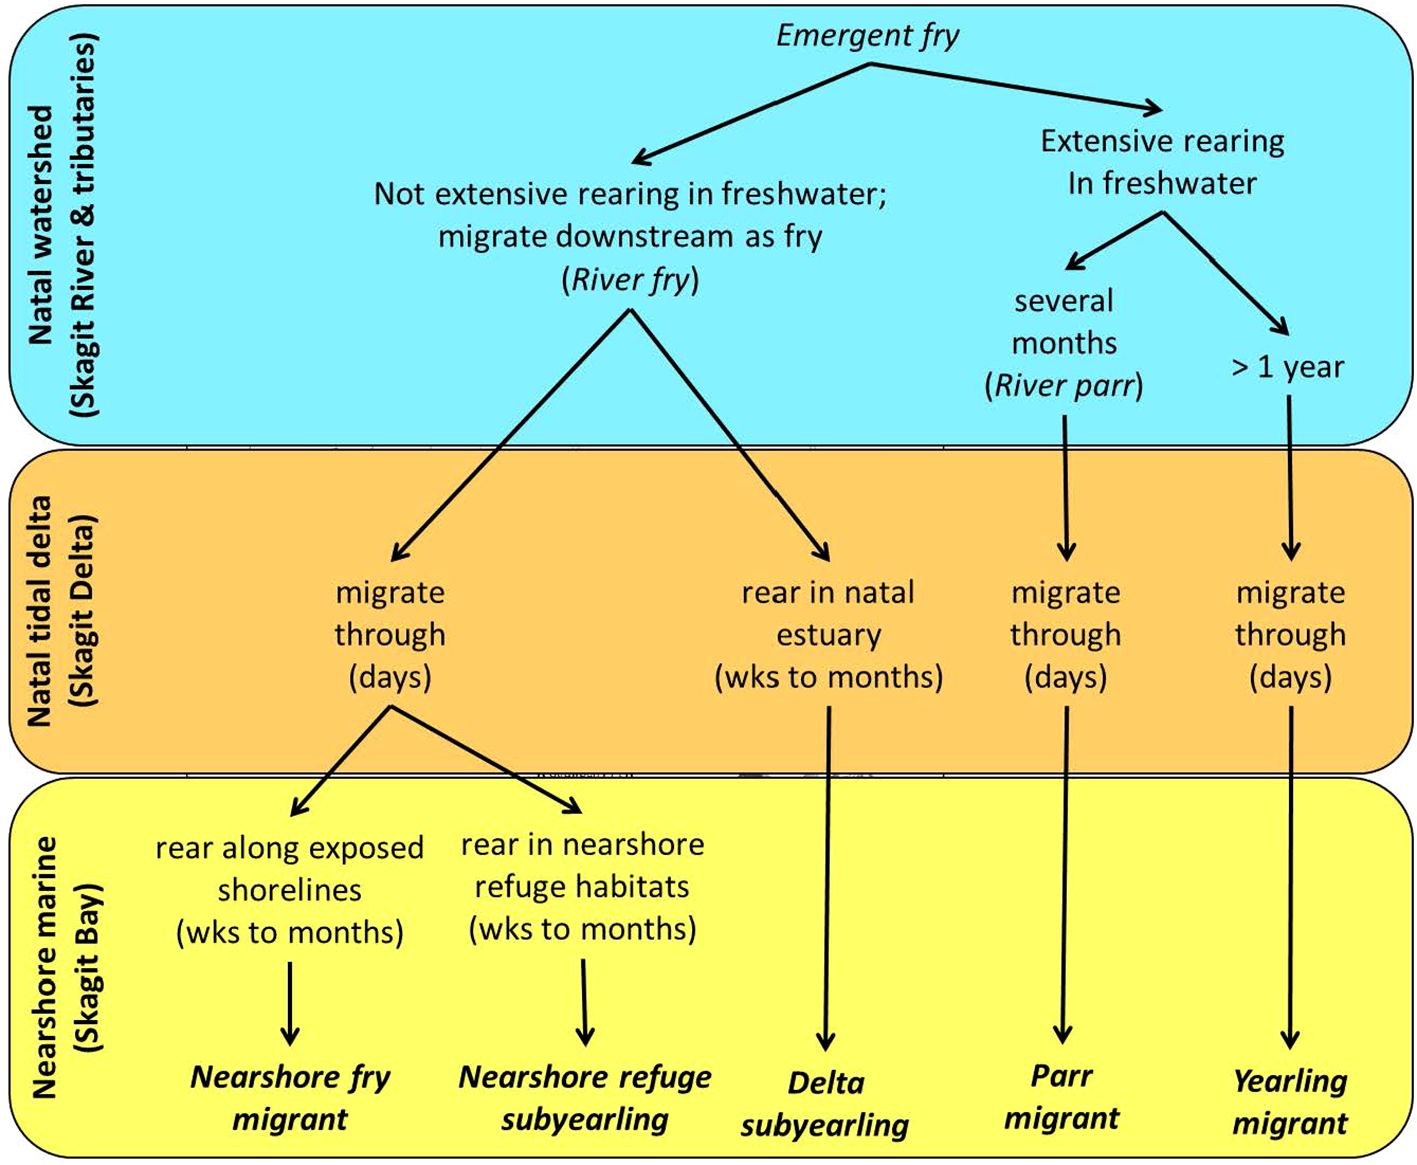
Figure 1. Conceptual model of habitat-based juvenile life history variation in Chinook Salmon. The conceptual model illustrates how life history expression could result from branching at habitat transitions for freshwater and natal estuary rearing, and habitat selection within marine shoreline areas where further life history variation may result. Phenotypic causes of life history branching may result from density-independent and density-dependent mechanisms experienced by juveniles.
The Skagit watershed of Puget Sound produces the majority of natural-origin Chinook salmon belonging to Puget Sound’s Evolutionarily Significant Unit listed as threatened under the U.S. Endangered Species Act (Skagit River System Cooperative and Washington Department of Fish and Wildlife, 2005). Existing research and long-term monitoring in the Skagit River suggests several juvenile life history types rely extensively on estuaries (Beamer et al., 2024b; Beamer et al. in review). The juvenile life history types of Skagit Chinook salmon are distinguished based on differential residence and migration through the freshwater, estuarine and nearshore habitats within three main ecological zones (freshwater, natal estuary, and marine nearshore). The ecological zones correspond to distinct geographic areas: 1) freshwater = Skagit River and its tributaries; 2) natal estuary = Skagit tidal delta; and 3) marine nearshore = Skagit Bay in the Whidbey Basin. Simply explained (see Figure 1), annual cohorts of Chinook salmon fry emerge from their gravel egg pockets in the Skagit River and its tributaries during the winter and early spring months. Some juveniles migrate downstream as fry with negligible rearing in the freshwater environment. Fry that remain in freshwater, either migrate downstream as parr after a few months, or overwinter in freshwater, leaving the following spring as yearlings. Of the fry that migrate downstream, some establish residence in the Skagit’s natal estuary for a period of time while others rapidly migrate into the more marine waters of Skagit Bay, part of the Whidbey Basin. Of the fry that end up in the Whidbey Basin, some reside in nearshore refuge habitats (Beamer et al., 2013) while others do not. According to this framework, fry life history types should be most sensitive to estuary restoration, followed by migrant parr, which may also rear in the tidal delta after downstream migration (Reimers, 1973; Bottom et al., 2005a). However, the general categories (Figure 1) represent modal endpoints on a continuum of time spent in the different habitat zones, reflecting overlap in life history forms.
This life history expression is likely in part an outcome of density dependence in multiple habitats (Reimers, 1973; Greene and Beechie, 2004; Beamer et al. in review). In recent years, several hundred thousand, to over seven million wild juvenile Chinook salmon comprising all life history types migrated from the Skagit River each year (Zimmerman et al., 2015). Annual differences in the abundance of fry and parr migrating downstream (Zimmerman et al., 2015; Hall et al., 2018) as well as life history patterns of fry in the delta and Skagit Bay (Beamer et al., 2000; Beamer and Larson, 2004; Beamer et al. in review) can be explained in part by density-dependent mechanisms. Evidence for density dependence includes smaller observed sizes and a higher proportion of fry utilizing the nearshore habitats when out-migrant abundance is higher (Beamer et al. in review). Accordingly, we predict that estuary wetland restoration should relieve competition in the tidal delta, and thereby influence size and growth, as well as estuarine densities.
Study area
Skagit watershed
The Skagit River is Puget Sound’s largest river and drains ~8,000 km2. Its estuary is part of the larger Puget Sound fjord estuary and consists of a mosaic of tidal delta habitats and adjacent, marine-dominated waters in Skagit Bay. Before entering Puget Sound, the Skagit River splits into North and South Forks of its historical tidal delta that flow westerly and southerly, respectively, through agricultural land, residences, and natural marshlands before entering the bay (Figure 2). The Skagit River tidal delta is a prograding fan with numerous distributary channels conveying freshwater, tidal channels, and estuarine wetland islands. Estuarine habitats within the tidal delta include two zones. The riverine tidal zone is the area of river channels and wetlands where freshwater is tidally influenced but not mixed with marine water. The tidal estuarine zone includes the emergent and scrub-shrub marshes where freshwater mixes with saltwater. These areas form a diversity of estuarine habitats maintained by tidal and riverine processes, creating a mosaic of wetlands and channels. Among these are blind tidal channels (i.e., landward terminus is within the tidal delta), which serve as our fish sampling units within the tidal delta.
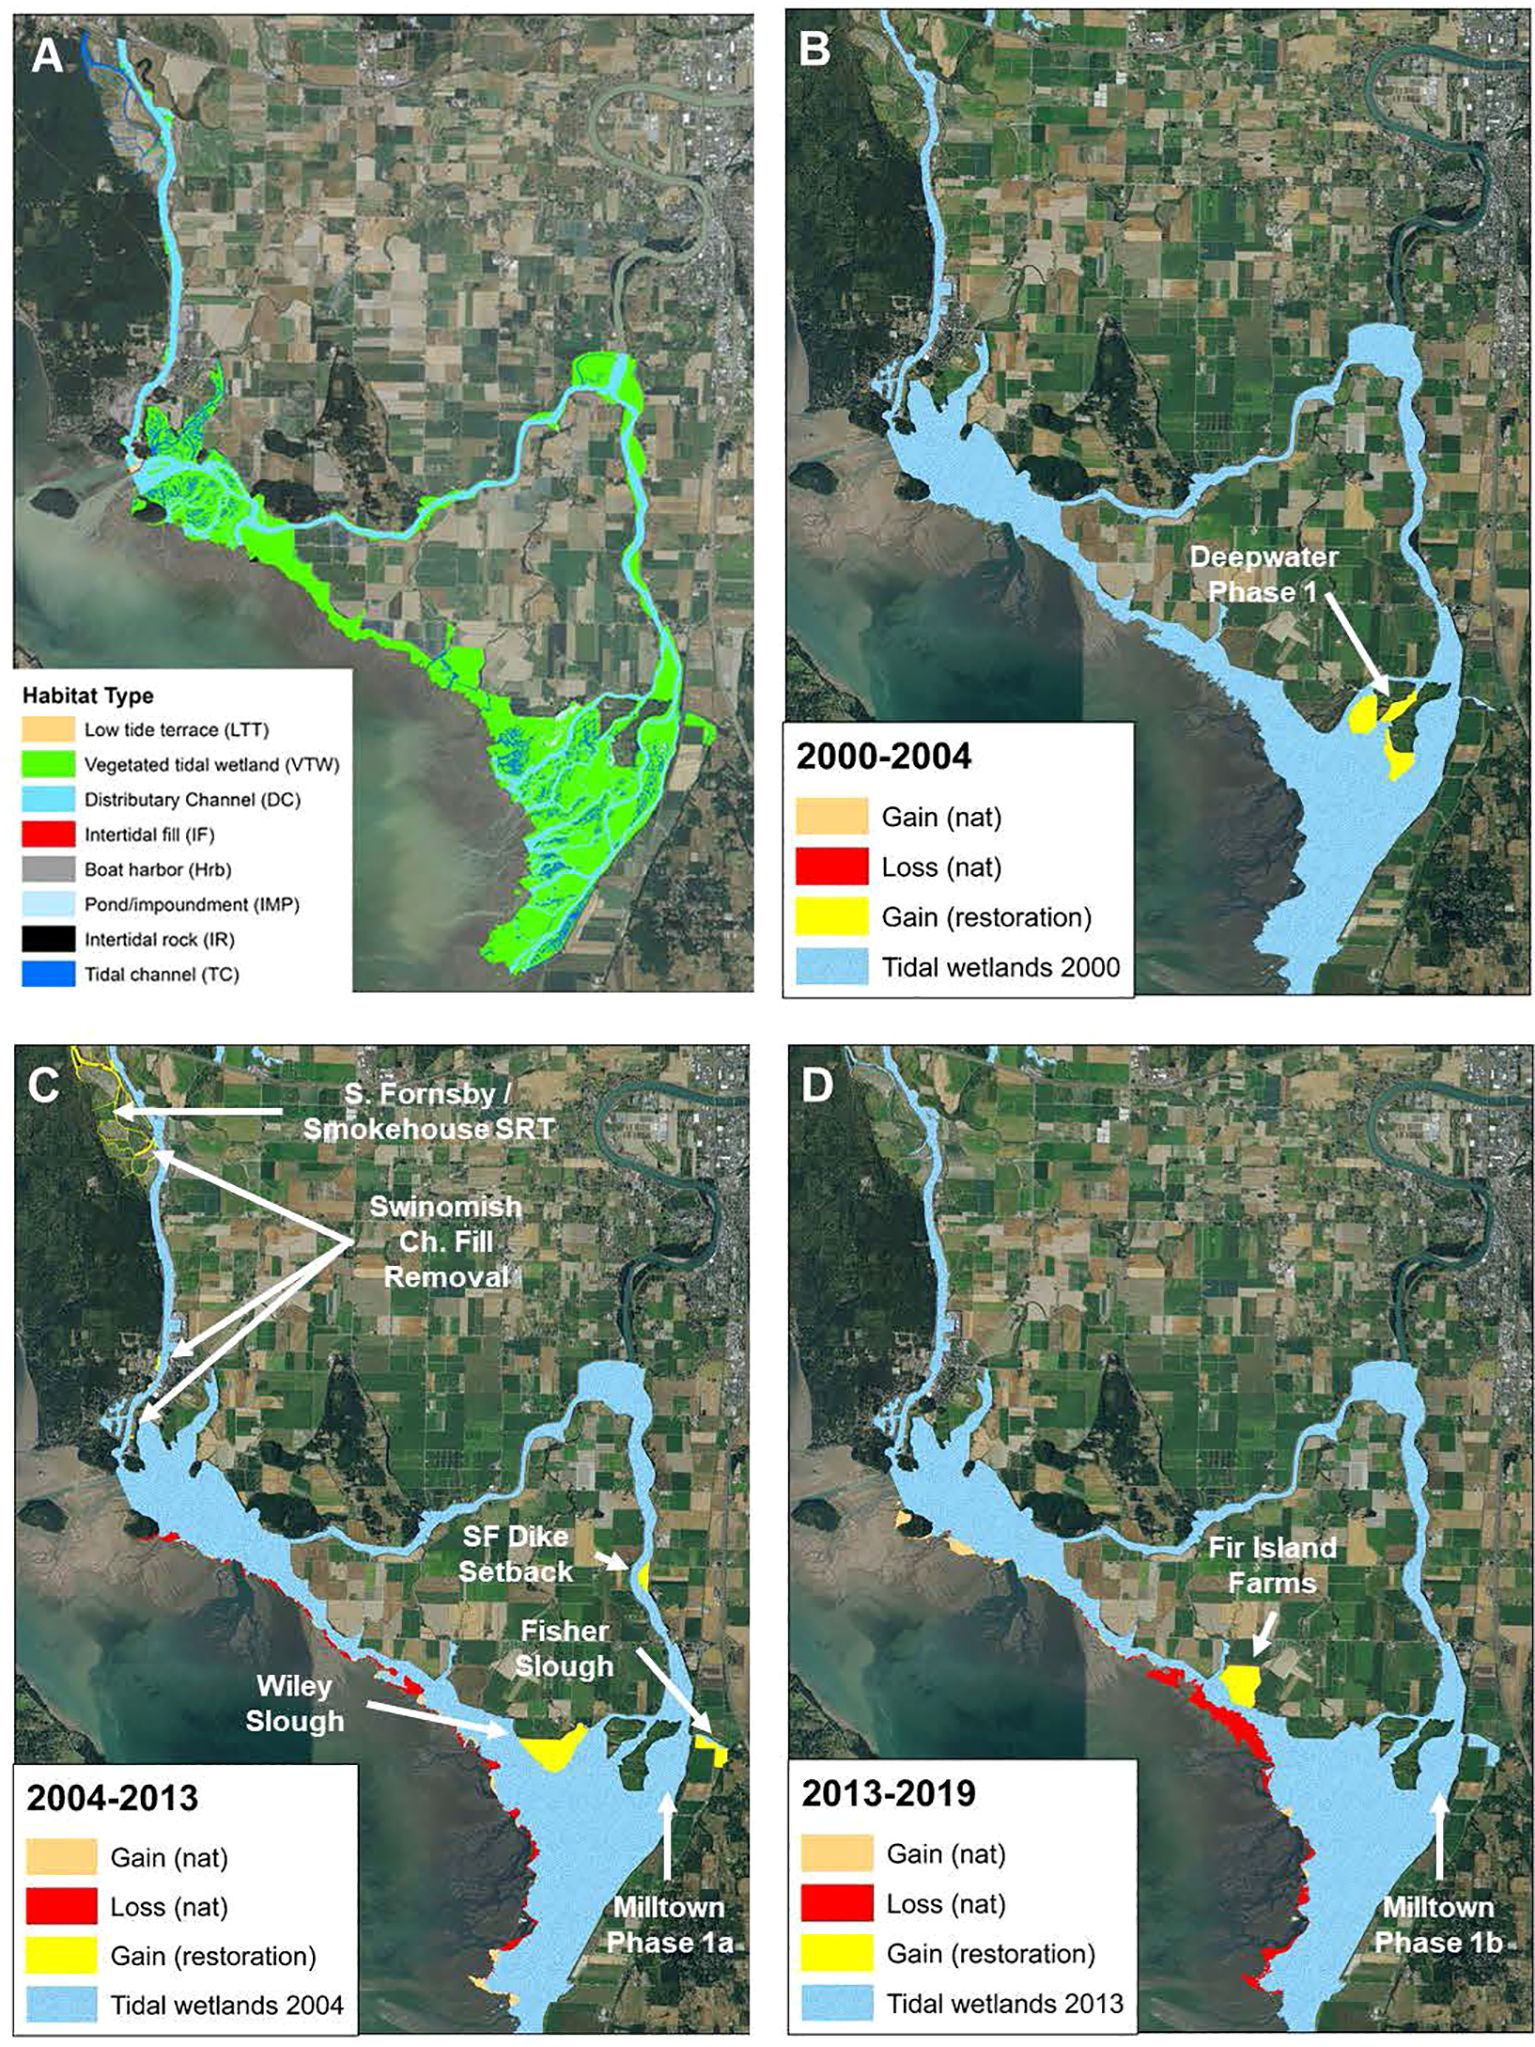
Figure 2. The Skagit River estuary, showing current extent (as of 2019) of different vegetated tidal wetlands (A); and gains (natural and through restoration) as well as natural losses in tidally influenced areas (blue) over three assessment periods (B: 2000-2004, C: 2004-2013, and D:2013-2019). Within each assessment period, restoration gains at project sites (labeled) were estimated as well as natural gains and losses using GIS (see methods).
The shoreline of Skagit Bay is ~127.4 km long and its intertidal area is 8,838 hectares. Skagit Bay shorelines include a variety of beach types based on differences in adjacent upland geologic materials (bedrock, glacial sediments, and recent coastal or river sediments), geomorphic processes within longshore drift cells, and shoreline gradient. The beaches that dominate much of Skagit Bay are the sampling units for nearshore sampling in this study.
Historical change and restoration efforts
Landscape analyses indicate that the Skagit River has lost much estuarine habitat to agricultural and residential development, despite a large amount of extant tidal delta and shoreline habitat (Collins et al., 2003). Currently, the contiguous habitat area of the Skagit tidal delta consists mostly of area in the vicinity of Fir Island, but it also includes a fringe of estuarine habitat extending from southern Padilla Bay to the north end of Camano Island. In 1991, the tidal delta footprint for this area was 3,118 hectares (Beamer et al. in review). Prior to diking, dredging, and filling in the delta (circa 1860s), 11,483 hectares of tidal delta footprint existed in the same area (Collins et al., 2003), indicating that 73% of tidal delta has been disconnected from floodplain and tidal processes. These estimates of tidal delta habitat area account for gains in delta habitat caused by progradation occurring between the 1860s and 1991 (Beamer et al., 2005) and indirect losses of habitat occurring as a result of changed tidal processes and sediment deposition (Hood, 2004). In Skagit Bay, 24% of the shoreline has been armored to protect land uses adjacent to depositional shoreforms or eroding sediment source bluffs (McBride et al., 2006).
Starting in 2000, watershed managers began to restore portions of the Skagit River delta and shoreline. In this analysis, we focus on the extensive efforts to increase the extent of estuarine wetland habitat through dike setbacks, breaches, fill removal, and other forms of restoration of tidal inundation. To date, 255 ha (~630 acres) of restoration projects have been completed in the Skagit delta. However, changes in wetland extent have been countered to some extent by impacts of sea level rise and winter storm surge (Hood et al., 2016; see Wetland Change section below).
Tidal delta wetland change
We mapped the extent of different estuary wetland types within the Skagit delta in four years (2000, 2004, 2013, and 2019) to estimate natural (including climate related) and direct anthropogenic wetland change within the delta. The intertidal habitat features tracked over time were area and perimeter of 1) distributary channels (including adjacent tidally inundated terraces), 2) ponds/impoundments, 3) tidal channels, 4) boat harbors (a minor number of anthropogenic impoundments constructed to launch, maintain, or moor vessels), and 5) vegetated tidal wetland (all vegetation types, including live wetland vegetation and intertidal wood). Of these types, juvenile Chinook salmon most consistently reside in the first four types, which are subject to regular tidal inundation where fish can swim. We refer to these types collectively as prime rearing habitat. We calculated prime rearing habitat area and total wetland area for four major regions of the Skagit delta: North Fork Delta (NF), South Fork Delta (SF), Fir Island Bayfront (BF), and Swinomish Channel Corridor (SC) (Figure 2).
We digitized tidal delta habitats as polygons in ArcGIS (v. 10x), using air-photos (30-cm pixel resolution) flown at low tide. Photo signatures for all habitat types were ground-truthed to confirm photo interpretations, i.e., presence (and species) of vegetation, sand flats, and subtidal water observed in the field were correlated with photo signatures, using obvious landmarks (channel junctions and meanders, vegetation patch patterns, large and stable logs) for orientation. The smallest tidal channels that can be resolved in the air-photos are 30 cm wide (Hood, 2007). Channel margins and shorelines were defined by the abrupt transition from vegetated to unvegetated intertidal areas coinciding with bankfull width. After ground-truthing, we applied photo interpretations to the entire vegetated Skagit tidal delta. See Hood (2007) and Chamberlin (2022) for additional detail.
We determined cumulative annual trends in prime rearing habitat and total wetland extent by calculating the sum of natural extent and wetland extent resulting from restoration. Using summaries from the four census years, we estimated natural annual wetland change, including responses to changing sea levels and storm surge, by interpolating between the four time periods. Furthermore, we applied progradation rate equations (Hood et al., 2016) to estimate extent in years before and after the four census periods. In years when wetland restoration projects were completed, we added wetland extent within restoration project polygons (Table 1) to interpolated annual wetland extent values.
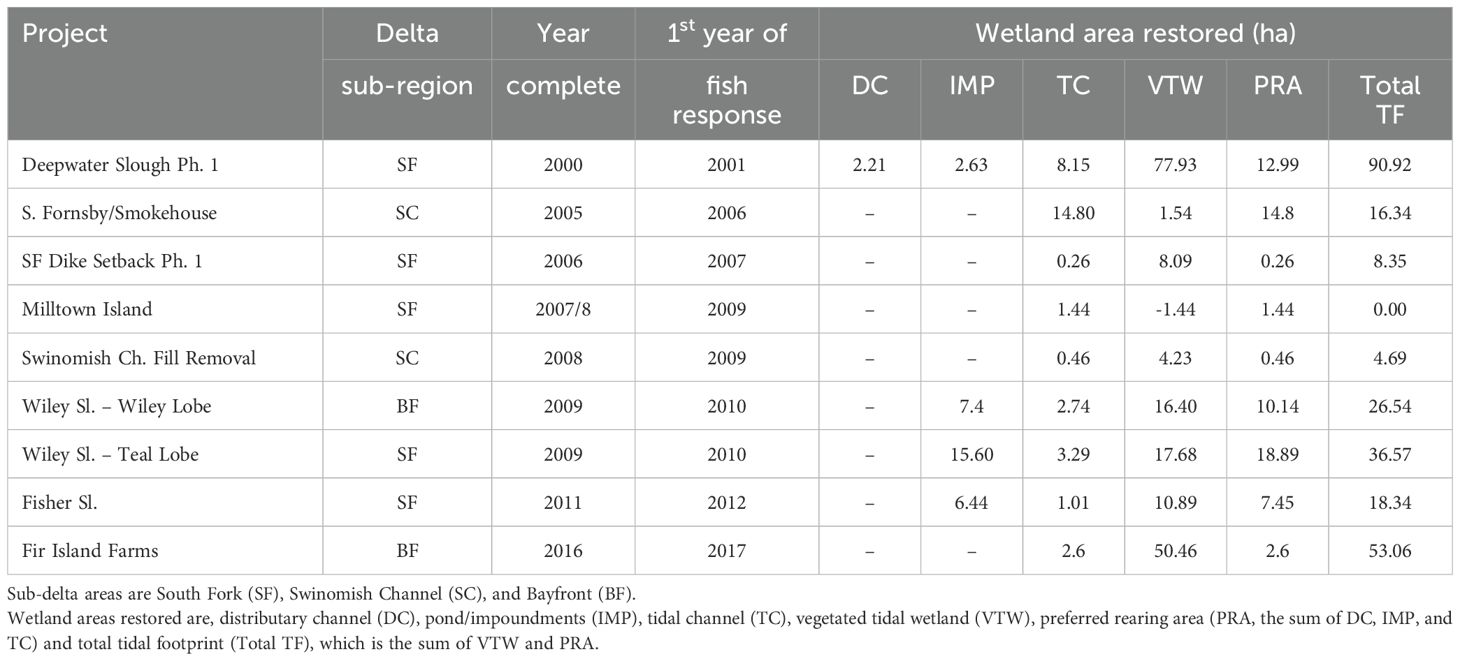
Table 1. Estuarine wetland habitat change due to restoration projects by year and sub-delta area.
Fish sampling
We monitor Skagit River Chinook salmon via long-term interagency programs involving sampling of outmigrants with inclined plane and rotary screw traps at river km 27, fyke trapping fish rearing in the tidal delta, and beach seining shoreline habitats in Skagit Bay. These three techniques bracket immigration, residence within, and emigration from the tidal delta to the Skagit Bay shoreline (Beamer et al., 2024b). Table 2 summarizes the number of sites, frequency, and duration of sampling at index sites in the Skagit River mainstem, tidal delta, and bay shoreline (see map in Supplementary Figure S1).
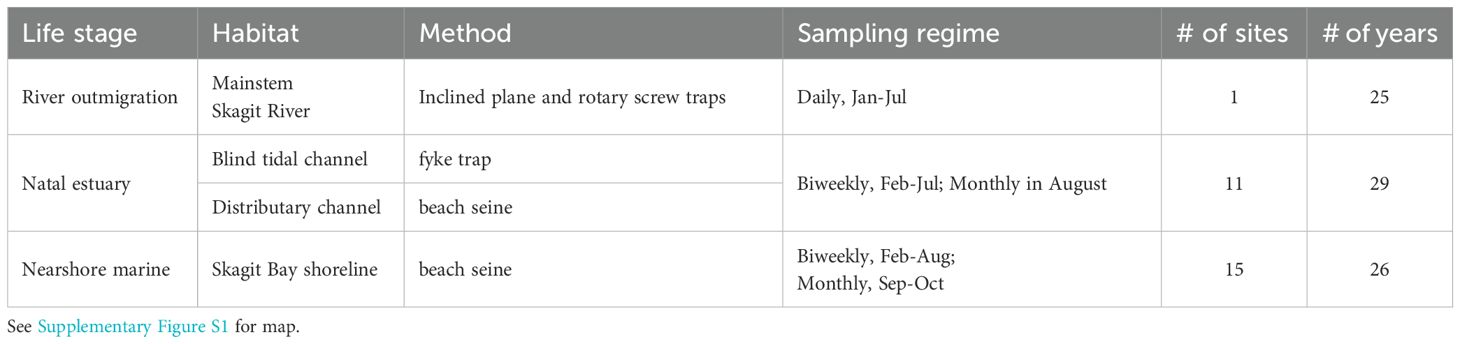
Table 2. Current monitoring programs for assessing effects of restoration in the Skagit River estuary.
River outmigrants
Washington Department of Fish and Wildlife (WDFW) operates a juvenile fish trap on the Skagit River at river km 39.1 in the city of Mount Vernon. Although WDFW began operating this trap in 1990, our time series begins in 1994, when they expanded the trapping season to encompass the juvenile natural-origin Chinook salmon migration period (Zimmerman et al., 2015). The juvenile trap is operated each year beginning in mid-January and continues through July, and is located downstream from all Chinook salmon spawning locations. The trap is actually two traps, an inclined-plane and a 2.4 m diameter rotary screw trap.
The freshwater juvenile monitoring provides both abundance and life history data and includes juvenile migrant abundance by migrant type (fry, parr, yearling), juvenile body size, and migration timing (details in Kinsel et al., 2008). Missed catch during periods the trap is not fishing (both planned and unplanned) is estimated by averaging catch rates before and after each outage. The juvenile trap catches only a portion of the total juvenile Chinook emigrating from the Skagit River. Therefore, total abundance is estimated using a mark-recapture study whereby a known number of marked fish (dye or fin-clip) are released upstream of the trap and a portion of these are subsequently recaptured in the trap (Zimmerman et al., 2015). Marked fish are released throughout the outmigration period to account for differences in trap efficiencies due to river conditions. Total abundance of natural-origin Chinook salmon subyearlings from the Skagit River Basin was estimated using a time-stratified Petersen estimator (Carlson et al., 1998; Zimmerman et al., 2015).
Tidal delta
To measure abundance of juvenile Chinook salmon rearing in the tidal delta, we sampled habitat use of unmarked (assumed natural-origin) subyearling Chinook salmon in blind channels using fyke traps (see Beamer et al., 2024b). Fyke trap methodology followed Levy and Northcote (1982) and uses nets constructed of 0.3 cm mesh knotless nylon with a 0.6 m by 2.7 m diameter cone sewn into the net to collect fish draining out of the blind channel site. Nets feature a lead line that sinks the bottom of the net to the benthos and a float line that maintains the top of the net at the water surface. Overall net dimensions (length and depth) varied depending on the blind channel’s cross-sectional dimensions, but all nets were sized to completely block fish access at high tide.
We captured fish by setting a fyke trap across the mouth of the blind channel site at high tide and “fishing” through the ebbing tide (Beamer et al., 2024a; b). Fish were captured as they moved out of the dewatering channel into a collection box. We sampled twice a month over the potential residency period (February through August) during the (more extreme) spring tide series at index sites. Index sites were in tidal channels or impoundments selected to represent the three estuarine wetland zones (estuarine emergent, estuarine scrub-shrub, and riverine tidal) present within North and South Fork sub-delta areas, and wetlands (entirely estuarine emergent) within the Fir Island Bayfront and Swinomish Channel Corridor. Sites were selected to optimize spread across the entire extant tidal wetlands, accessibility via boat, and ease of successful sampling. They were not directly associated with individual restoration projects, so changes at sampling sites represent delta-wide responses to restoration and not local use of restoration projects.
Juvenile Chinook salmon catches were adjusted by trap recovery efficiency (RE) estimates derived from multiple mark-recapture experiments using a known number of marked fish released upstream of the trap at high tide (Levy and Northcote, 1982; Beamer et al., 2024a; b). The mark-recapture experiments used juvenile Chinook salmon caught by beach seine in the vicinity of the fyke trap site the day before a planned fyke trap event. The fish to be marked were held in an anesthetic (MS-222) bath until motionless and marked by a partial (<25%) upper or lower lobe caudal fin clip or temporary dye (Bismark brown). Marked fish were revived and held overnight in a live box prior to being used in recapture experiments to not include any fish that may have been unduly stressed in the marking process. Each mark-recapture experiment consisted of releasing 50–100 marked fish 50–200 m upstream of the fyke trap at high tide immediately after the trap is set. The number of marked fish captured in the trapping process was divided by the number of marks released is the RE estimate for individual experiments. RE estimates are unique to each site and vary by tides because each channel varies in how well they tidally drain and in their extent of refuge pools available to fish at low tide stage. Through multiple mark-recapture experiments, we found RE at a site is often related to hydraulic characteristics of the site during trapping (e.g., change in water surface elevation during trapping or water surface elevation at the end of trapping - see Rice et al., 2005). Generally, tidal channels that drain well and have few refuge pools have high RE values whereas tidal channels with large areas of refuge pools or do not drain well have low RE values because many of the fish remain in the channel and are not caught in the fyke trap. Overall, we conducted nine to 34 mark-recapture tests at each site over the 29-year period to develop a regression model based on the site’s hydraulic conditions, or calculated an average RE if a regression predictor was not merited (see Beamer et al., 2024b; Supplementary Text). Average RE for mark and recapture tests at the eleven fyke trap sites ranges from 14-66%.
The site-specific RE estimates are used to convert the “raw” juvenile Chinook catch to an estimated population within the habitat upstream of the fyke trap on any sampling day:
where sampling area for the fyke trap is the topwidth channel area of the blind channel network upstream of the trap location. Topwidth channel area was measured via field surveys and represents tidal channel area upstream of the fyke trap at high tide stage when the trap is set.
Marine shoreline
To measure density of unmarked Chinook salmon rearing along shoreline habitats, we used beach seining techniques (Beamer et al., 2024a; b; Beamer et al., in review). Our beach seine was a 37 m by 3.7 m by 0.3 cm mesh knotless nylon net. The net is deployed by fixing one end of the net on the beach and the other on a boat which sets the net across the current and returns the net to the beach at a distance of approximately 60% of the net’s length. After the set is held open against the tidal current for a period of 2–5 minutes, the boat end is brought to the shoreline edge and both ends are retrieved, yielding a catch in the net’s bunt section. We make three sets per site on each sampling day. Beach seine set area varies by site and sample day because tow times, set widths, and tidal current velocities moving past the site can all varied. Tow time, set width and water surface velocity are measured for each beach seine set in order to calculate a set area for each beach seine set. The juvenile Chinook catch for each set is adjusted by set area (Equation 1) to calculate a Chinook density for each beach seine set (see Beamer et al., 2024b; Supplementary Data for additional details).
We conducted 34 mark-recapture tests to estimate RE for the beach seine method. Mark-recapture tests occurred in 2007, 2019, 2020 and 2021. Marked fish were introduced to the seined area in 2 groups: 1) just before setting the net, and 2) just prior to closing the net and retrieving it to shore. Overall, RE for the six beach seine sites across sets was consistently high, averaging 84.5% (± 10.1%, 95% confidence interval).
Demographic metrics
We examined four potential demographic responses of juvenile Chinook salmon to changes in habitat: rearing density in the delta, fork length in the delta, total density in nearshore environments, and frequency of fry life history type in nearshore environments. In these analyses, we considered juvenile responses in the context of density dependence. That is, individual salmon are potential competitors (Reimers, 1973; Greene and Beechie, 2004; Beamer et al. in review) and habitat improvements presumably raise habitat capacity and quality, thus providing more resources per capita. Salmon responses to habitat improvement may therefore manifest via alleviated competition, and demographic responses should therefore depend on cohort population size.
Rearing density in the delta
We predicted that increases in delta rearing habitat resulting from natural processes and restoration should decrease salmon density because greater habitat area can diffuse salmon across more space, and this would be most observable when outmigrations are below system capacity. This prediction might seem counterintuitive from the perspective that restoration projects should attract fish. However, in the case of this surveillance monitoring design in which sampling sites were not located directly within restoration projects, the opposite pattern (reduced densities) is expected with greater habitat change.
Change in fork length
Predicting the effects of habitat restoration on cohort-based measurements of individual length is complicated by the interaction of growth physiology in individuals with mortality, immigration, and emigration of the population. If average body length change reflects density-dependent growth physiology, increases in delta rearing habitats should result in increases in average length. However, if increases in delta rearing habitat reflect changes in abundance or distribution, average length might decline because smaller, more vulnerable fish remain in greater numbers in higher quality nursery habitat.
Nearshore densities
Like all anadromous species, Chinook salmon must migrate to marine environments, including nearshore habitats as part of their life cycle after using delta habitats. If densities of fish in the nearshore reflects recruitment, increases in tidal delta habitat should increase the density of fish entering nearshore environments due to increased survival during tidal delta residence. However, extended residence in the delta afforded by habitat restoration might shift the overall distribution of abundance between delta and nearshore shoreward, resulting in an apparent decrease in nearshore density.
Nearshore fry
In the absence of restoration, we expected competition in the delta to impose density-dependent spillover of the smallest, most vulnerable salmon individuals (fry) directly from river to nearshore without extensive delta rearing (Beamer et al. in review). Increased delta habitat capacity should particularly benefit fry, resulting in lower spillover of small individuals to less protected nearshore environments. Hence, the proportion of individuals sampled as fry should decline with increasing delta habitat change.
Prediction uncertainty
As suggested by some of the uncertainties in the above predictions, the consequences of habitat restoration on cohorts is not entirely clear. Density of fish within the delta represents the most important in situ restoration response, while the proportion of fry in the nearshore provides the strongest prediction for a population consequence. Changes in size within the delta and overall density in the nearshore provide ambiguous measurements which are nevertheless useful in the context of other metrics to understand cohort changes associated with changing habitat conditions.
Statistical analysis of salmon responses to habitat change
Overall, our approach was to relate population attributes of juvenile salmon to changing habitat state. To detect these relationships, we leveraged fish monitoring data in key locations in addition to contrasts in habitat state that unfolded differentially across years and across strata within the delta. Contrasts in habitat state across space were driven primarily by habitat restoration that happened in the South Fork but not the North Fork, and across time because restoration projects were staggered over the years. Because our habitat metrics were resolved to annual temporal changes and spatial scales (river trap, North Fork, South Fork, and nearshore), we could assign habitat state to each salmon observation based on the year and stratum where the salmon observation occurred. Based on these fish and habitat observations, we used models to quantify juvenile population attributes coincident with changes in delta habitat.
We used generalized linear mixed effects models (Zuur et al., 2009) to examine for evidence that greater delta habitat area – driven by restoration as well as natural changes (e.g., sea level rise, and a channel-rerouting avulsion) – coincided with demographic responses in juvenile salmon. The parameterizations of models and inclusion of particular components of the data were designed to isolate relationships between juveniles and habitat state from other sources of variation typical of ecosystem dynamics and monitoring regimes. We built four groups of models that corresponded to the four hypothesized population responses described above. For each group of models, we fit candidate models that included all possible combinations of the fixed effects that we considered in the full models. Then, we presented findings from the models that performed best, inferred by lowest AICc score. Analyses were written in R using the package lme4 (Bates et al., 2015).
We described the habitat state using the metric of change in prime rearing area within the tidal delta. That is, the number of hectares by which a stratum’s habitats had increased relative to the beginning of the study. This allowed us to set the habitat state for all salmon observations in the river to zero, which represented the idea that fish in the river had yet to experience any changes to the delta habitat. For salmon observations in the delta, we assigned habitat state values based on the year and strata in which observations happened. For observations in nearshore waters, which are of salmon that have migrated out of the delta, we assigned habitat state values based on the sum of changes in all delta strata. This generated a nearshore habitat state time series that represented the idea that, at the population scale, salmon experienced more delta habitat area over time, even if we could not be certain which parts of the delta that individuals experienced. Assigning habitat state values to strata in this way produced quantitative time series with contrasts in habitat state across the river, delta, and nearshore waters that was consistent in principle with habitat changes experienced by the population. Cohorts sampled within the river had not yet experienced restored habitat, cohorts sampled within the South Fork portion of the tidal delta generally experienced increasingly restored delta habitat over time, and cohorts in nearshore waters also experienced increasingly restored delta habitat over time.
We used proxies for outmigrant abundance and temperature experienced by juvenile salmon. We calculated outmigrant abundance as 30-day rolling means of juveniles counted at the river trap. Thirty days represented a reasonable time period of residence in the delta downstream of the river trap (Greene et al., 2021). For models that quantified juvenile lengths, we accounted for phenological effects of annual temperature because juveniles typically grew faster in warmer years. The index of air temperature was NOAA’s Puget Sound Lowlands Aug.-Jul. temperature index (NOAA Climate at a Glance, 2025; Supplementary Figure S2), corresponding to a time period from adult spawning (Austin et al., 2021) through juvenile use of the estuary. This metric is a good predictor of water temperature after accounting for time of year (Supplementary Figure S3).
All models also included random intercept parameters of site and year. Their purpose was to account for factors associated with particular places and times (e.g., local habitat attributes, annual recruitment) that we did not explicitly observe or include in our models and that were not of direct interest to our study. We pre-processed some data to follow statistical conventions. Prior to fitting models, we z-scored the values of all fixed effects so that their relative effect sizes and global intercepts would be easier to interpret. When appropriate, we log-transformed response variables so that their values approached a normal distribution.
Delta juvenile salmon density
The first set of models examined juvenile Chinook salmon density in the delta North and South Forks. Formally, in the full model, juvenile density μ was a function of a global intercept β0, effects β1–5 of habitat state X1, outmigrant abundance X2, the interaction between habitat state and outmigrant abundance, day of year X3, day of year squared, and random effects a ansd b of year y and site s.
Of direct interest were the effects of habitat state and its interaction with outmigrant abundance. We intended for these effects to represent outcomes of restoration that diffused juveniles across more space and that could accommodate higher juvenile densities in the delta when juveniles were more abundant throughout the landscape. This model included the effect of day of year and its quadratic form. These parameters created a dome shaped function that accounted for the seasonal rise and fall in density.
Delta juvenile salmon fork length
Analysis of juvenile Chinook salmon fork length within the delta included juvenile observations from the river trap in addition to observations from within the delta’s North and South Forks. We included river trap data to leverage more information on juvenile lengths and provide a contrast with observations of juvenile salmon in the delta. That is, data of juvenile lengths in the river (upstream of the delta) provided information about annual variation in juvenile lengths that we knew was not attributable to delta restoration, which allowed us to better isolate a relationship between delta restoration and juvenile length in the delta.
Formally, in the full model, individual fork length μ was a function of a global intercept β0, effects β1–7 of habitat state X1, outmigrant abundance X2, the interaction between habitat state and outmigrant abundance, day of year X3, the interaction of outmigrant abundance with day of year, whether observations happened in the river or delta X4, annual air temperature X5, and random effects a and b of year y and site s.
We were directly interested in the effects of habitat state and its interaction with outmigrant abundance. We intended for these effects to represent restoration outcomes of retention of smaller individuals and less competition for growth, respectively.
We included effects of day of year in this model, the interaction of day of year and outmigrant abundance, and whether observations happened in the river or delta (we name this latter parameter “region”). The effect of day of year accounted for juvenile growth across the year. The interactive effect between day of year and outmigrant abundance accounted for our expectation that the effects of competition on growth would accumulate across the outmigration window. The effect of region was a binary variable that described whether observations were in the river (0) or delta (1). It accounted for the expectation that juveniles would be smaller in the river than in the delta because juveniles grow as they migrate. Also, the effect of outmigrant abundance represented the expectation that juvenile growth would decrease with increasing conspecifics due to competition. For this analysis, we excluded observations before April because preliminary explorations indicated that effects of density on length did not emerge until April.
Nearshore juvenile salmon abundance
The full model for nearshore juvenile abundance μ was a function of a global intercept β0, effects β1–4 of habitat state X1, outmigrant abundance X2, the interaction between habitat state and outmigrant abundance, day of year X3, and random effects a and b of year y and site s.
We were interested in the effects of habitat state and its interaction with outmigrant abundance. We intended for these effects to represent restoration outcomes of greater retention of juveniles in the delta overall and due to release from competition for space, resulting in fewer individuals in nearshore waters.
Uniquely in this model, we did not include day of year in its quadratic form (as we did for juvenile densities in the delta) because preliminary model exercises indicated that, from a statistical standpoint, juvenile abundances in nearshore waters across the seasonal monitoring window were best characterized by an increasing trend rather than a dome-shaped trend. For this analysis, we excluded observations after August, when 30 day running means of outmigrant abundance typically approached zero.
Nearshore juvenile salmon fry frequency
One of the most important predictions of density-dependent habitat use is that the frequency of fry in nearshore waters should decline with greater restoration as additional habitat is opened for retention within the delta. For similar reasons as in the analysis of fork length in the delta, this analysis included juvenile salmon observations from the river trap in addition to nearshore waters. Formally, in the full model, whether a juvenile was a fry was a function of a global intercept β0, effects β1–6 of habitat state X1, outmigrant abundance X2, the interaction between habitat state and outmigrant abundance, day of year X3, whether observations happened in the river or nearshore waters X4, annual air temperature X5, and random effects a and b of year y and site s.
We were directly interested in the effects of habitat state and its interaction with outmigrant abundance. We intended for these effects to represent restoration outcomes of greater proportional retention of fry in the delta overall and due to release from competition. Uniquely in this model, the response variable was binary (juveniles were [1] or were not [0] fry) and we therefore fit the model to a binomial error distribution. Also, the effect of outmigrant abundance represented the expectation that juvenile growth would decrease with increasing conspecifics due to competition, resulting a greater frequency of fry. For this analysis, we only included observations from February through April to coincide with the annual fry outmigration window.
Note that this model is distinct from the previous model because it described a proportional phenomenon. That is, the previous model quantified the number of all juveniles in nearshore waters while this model quantified the proportion of juveniles in nearshore waters that were fry.
Presentation of results
We visualized model predictions to illustrate the trends quantified by models. In light of the multiple factors that drove juvenile salmon population attributes, we made model predictions across a range of habitat state and migrant abundance values (whose effects we were primarily interested in) and set other variables to their median values to approximate typical conditions in these other drivers. A nuance in these predictions was that migrant abundance was right skewed; therefore, for ecological reasons, it was important to recognize that most system dynamics took place in the lower range of migrant abundances and, for statistical reasons, it was important to recognize that model predictions made toward the higher range of migrant abundances must be interpreted cautiously because they were informed by less data. To show the skewness of migrant abundances relative to predictions, we overlaid their distributions onto figures that showed the data with model predictions.
Our model that described the proportion of juveniles that were fry in nearshore waters was informed by binary data and we produced visuals of summary statistics to improve visibility of modeled relationships. Raw binary data are often not conducive to visuals because the response variables can only take values of 1 and 0. In scatterplots, this often results in point superimposition and clouds of points without discernable patterns. To remedy this, analysts often bin the data and report patterns in proportions, which can range from 0 to 1 and produce a discernable pattern among data points (Zuur et al., 2009). In our case, we binned observations into three time periods to reflect two large increases in South Fork habitat in 2001 and 2010 and thus approximate low, mid, and high levels of restoration treatment, and we separated river from nearshore observations. We also binned data by month because proportions of fry decrease across seasons as juveniles grow. From these bins we calculated the proportion of juveniles that were fry and subtracted each month and time periods’ proportions of fry in the river from proportions of fry in nearshore waters.
A final nuance related to figures was that the range of change in prime rearing area in analysis of observations collected within the delta differed in comparison to examination of juvenile salmon sampled in nearshore waters. Within the tidal delta, we used the strata-specific values (North Fork vs South Fork) to represent habitat state in different areas. However, for juveniles in nearshore waters, we used the sum of prime rearing area across delta strata because the nearshore life history phase was subsequent to juvenile residence within the entire tidal delta. Hence, the range of habitat change is greater for analyses of nearshore observations (the latter two metrics) than for observations within the delta.
Results
Wetland change
Changes in tidal inundation in the Skagit delta resulting from both natural processes and habitat restoration increased wetlands over the period of our analysis. Two summary measures of wetlands – the prime channel rearing area and the total delta footprint – both increased by over 69 and 255 ha, respectively, due to restoration compared to pre-restoration values between 2000 and 2019. However, the net change in habitat varied by subregion of the delta due to natural gains and losses (Figure 3), with increases primarily in the South Fork and North Fork areas. Furthermore, losses from erosion of the delta front and channel in-fill within the delta was estimated at over 90 ha, a substantial reduction particularly in the South Fork and Bayfront subregions.
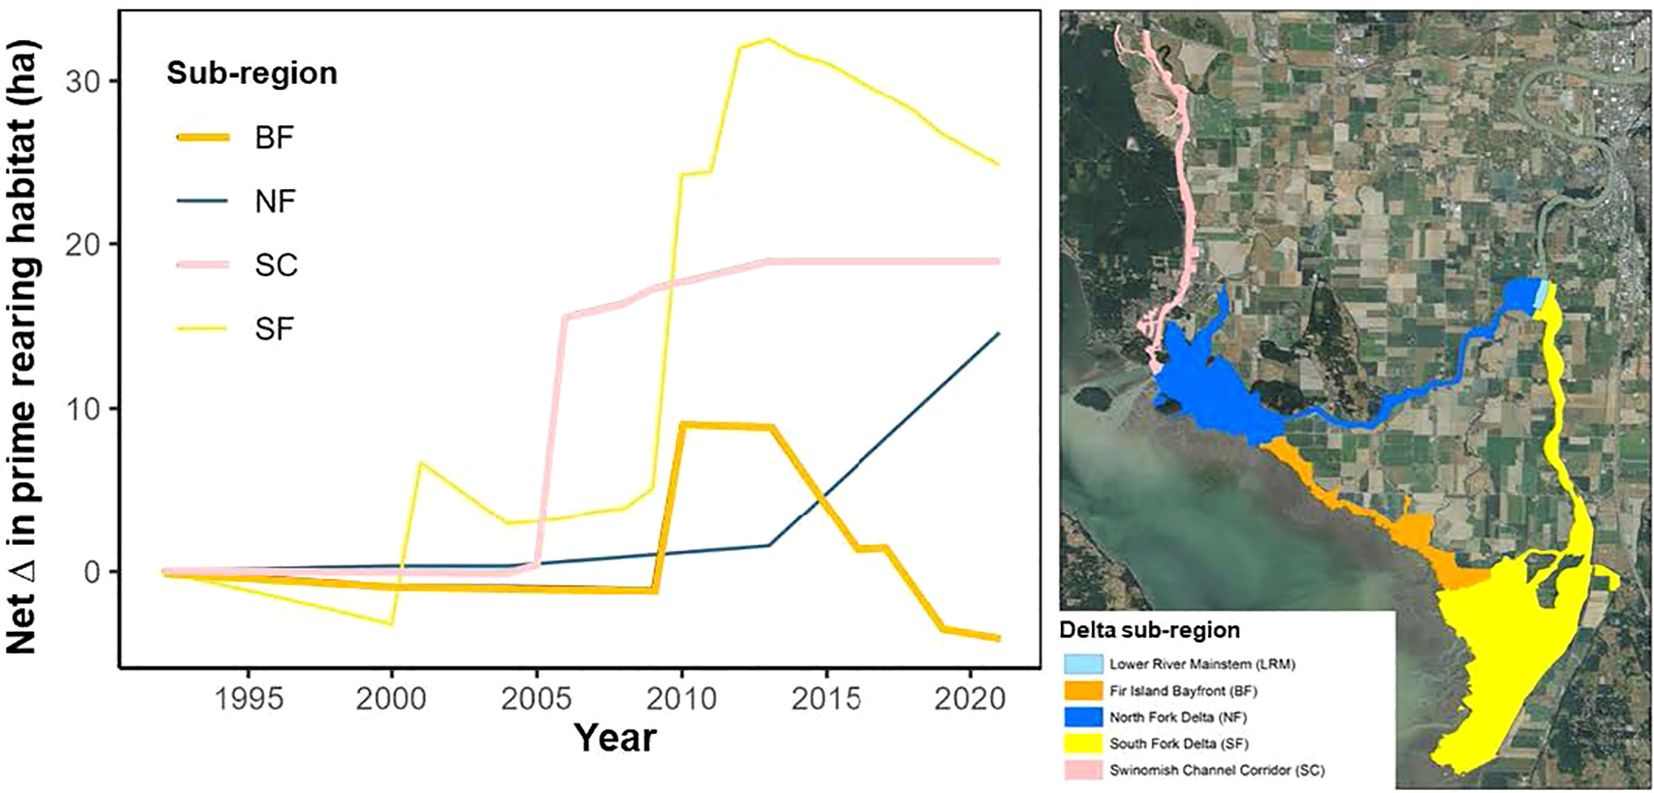
Figure 3. Trends of prime rearing habitat (ha) in four subregions (North Fork (NF), South Fork (SF), Bayfront (BF), and Swinomish Channel (SC)) of the Skagit River delta (left panel), as shown in the map in the right panel using the same color scheme.
Within-season patterns of juvenile salmon
Consistent with the annual pulse of emigration (Zimmerman et al., 2015; Beamer et al., 2024a) juvenile salmon abundances rose and fell, and fork lengths increased across each area’s seasonal monitoring windows (Supplementary Figure S4). A slight exception to this was in nearshore waters, where abundances were flat, then rose and eventually fell. These seasonal patterns underlie each of our hypotheses, and needed to be accounted for in statistical models testing for annual differences due to changing habitat.
Juvenile density in the tidal delta
Statistical models showed strong support for changes in juvenile salmon density in the delta related to prime rearing area in the tidal delta, outmigrant numbers, and interaction of these variables (Figure 4; Table 3; Supplementary Table S1). The best model indicated that juvenile salmon density in the delta 1) increased as a function of outmigrant abundance (Figures 4A, B), 2) decreased as a function of delta prime rearing habitat area (Figures 4A, B), and (3) exhibited a positive interaction between outmigrants and habitat area (Figure 4A; Table 3), although a model without the interaction term exhibited similar support (Supplementary Table S1). Models predicted that juvenile density on April 30 (i.e., the median sampled day of year) was 74% lower (718 vs. 2,782 fish per ha) in delta waters when prime rearing habitat area was at its maximum state (+32.5 ha) compared to its minimum state (-3.2 ha).
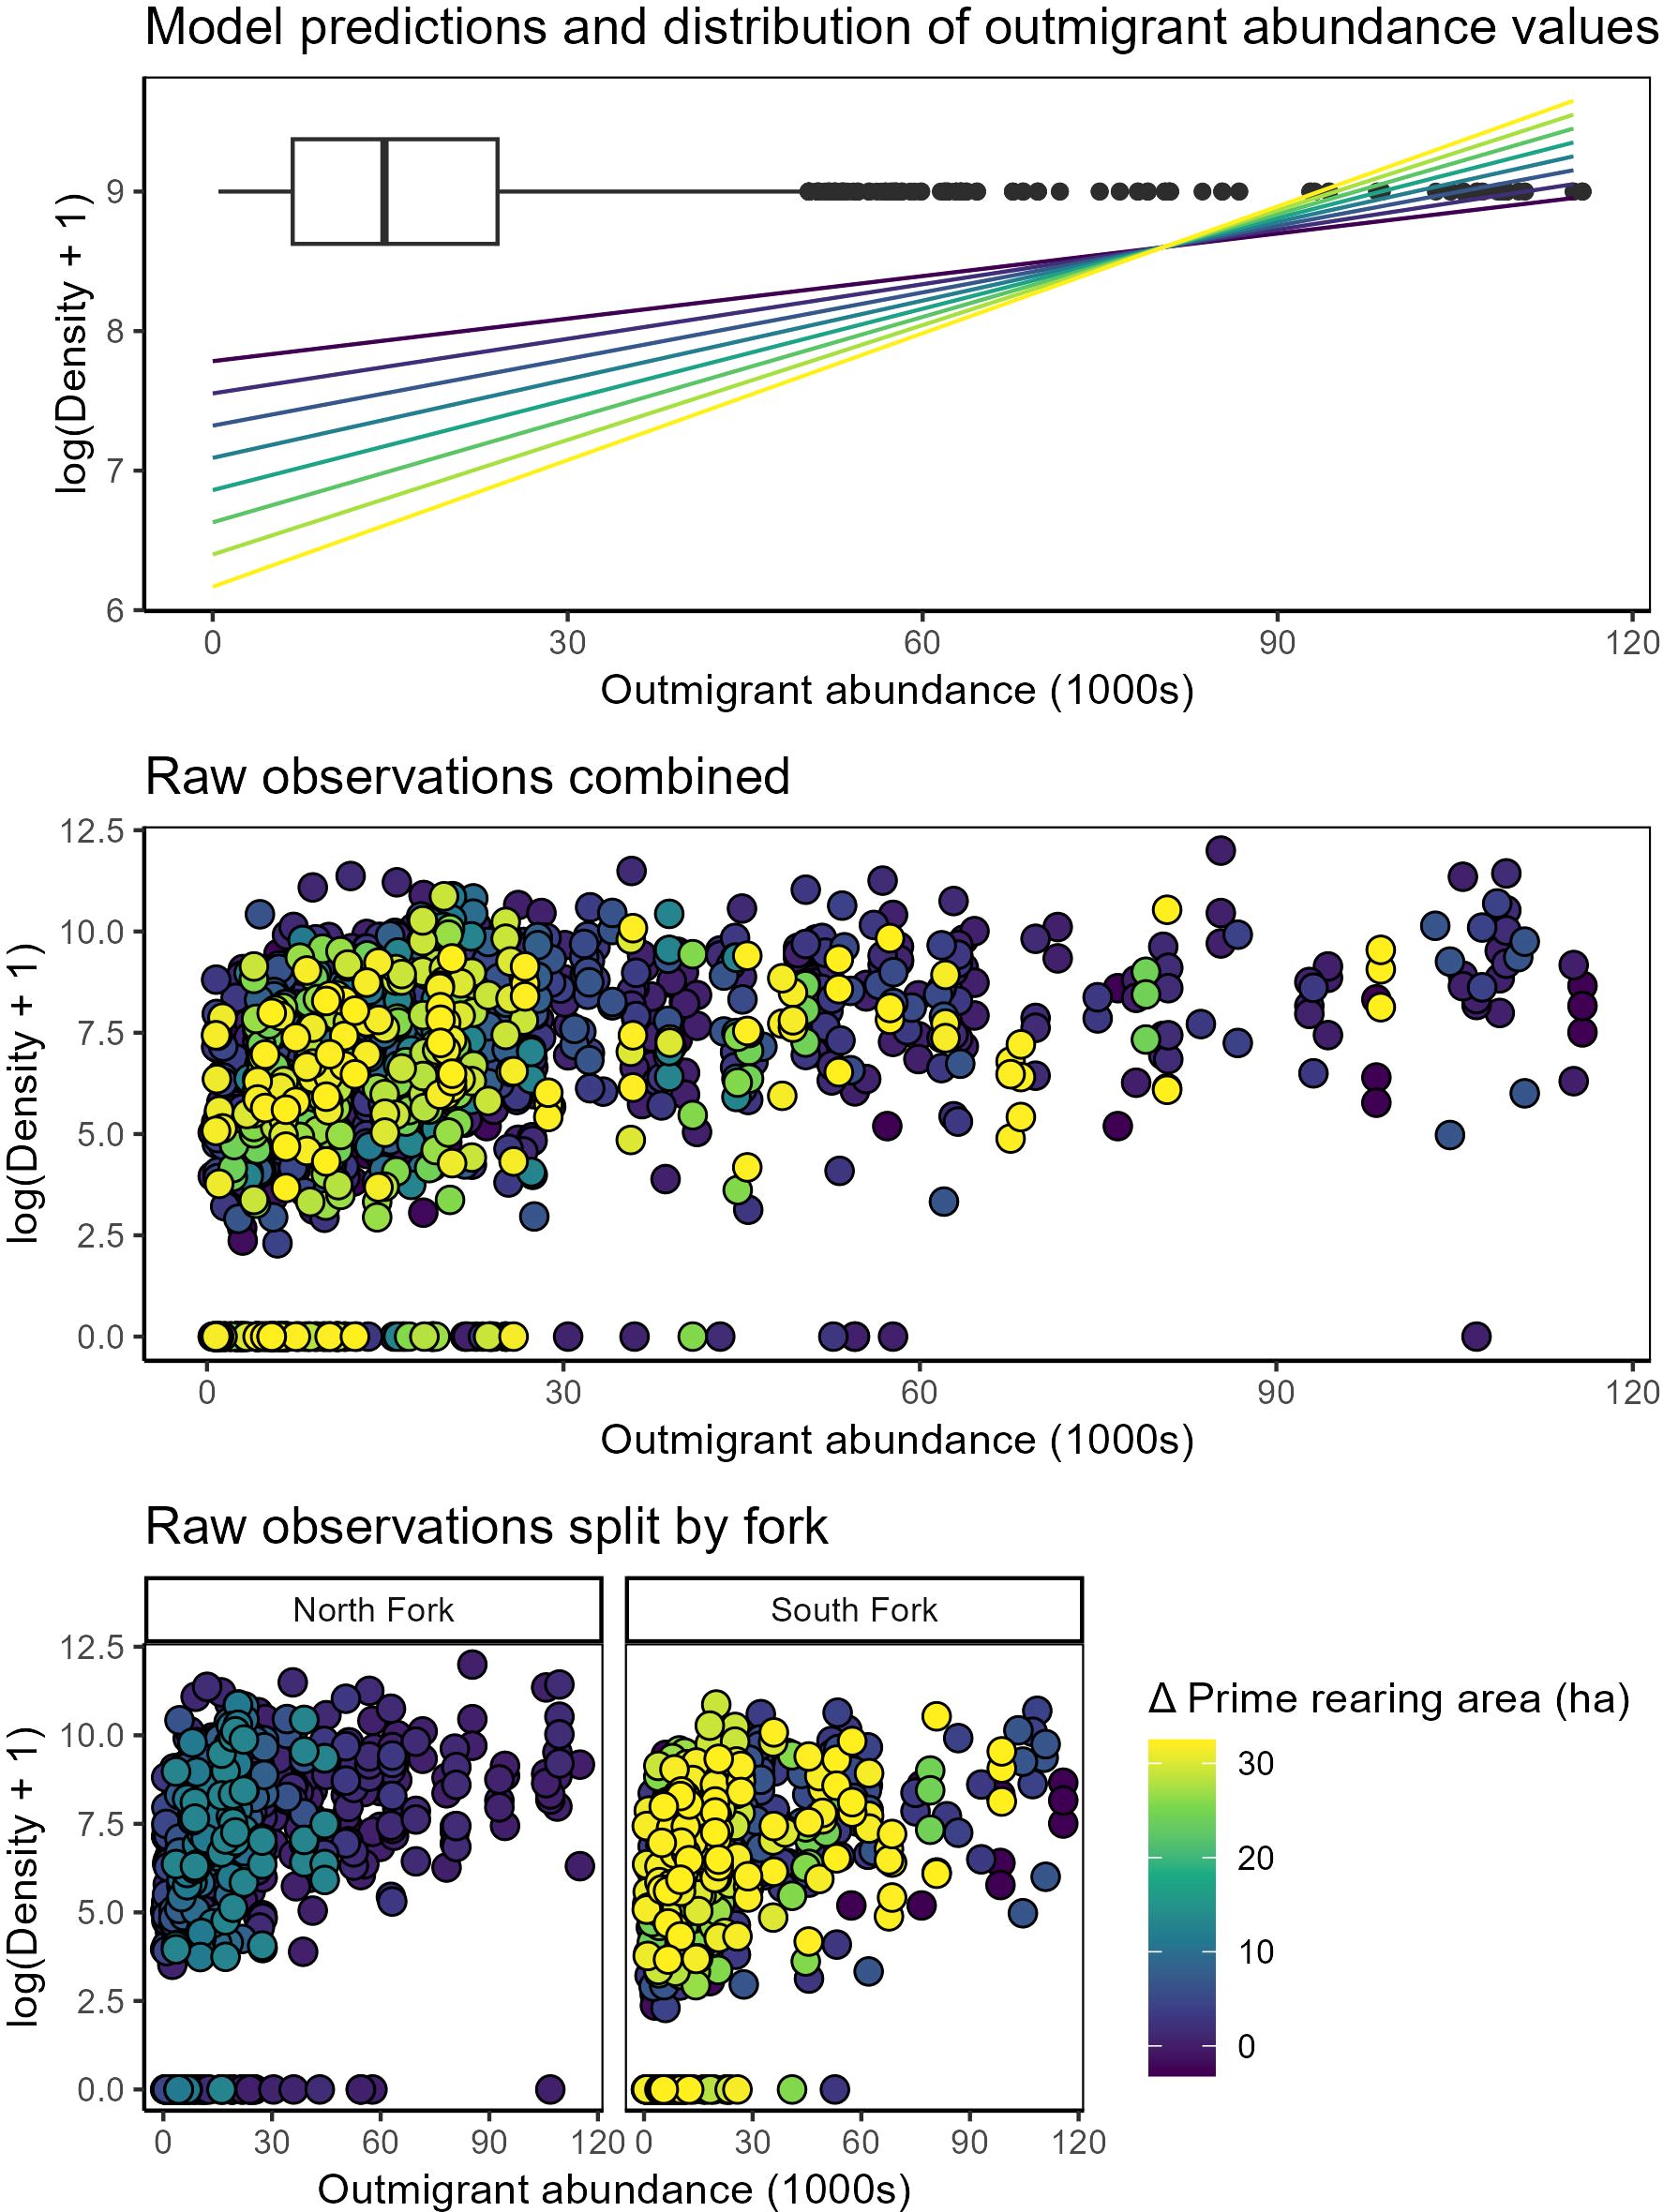
Figure 4. Juvenile Chinook salmon density in the Skagit tidal delta compared to rolling-average outmigrant abundances and habitat states (Δ prime rearing area) within North and South Forks. Top panel: model predictions of density-dependent habitat benefit shown as color-ramp lines, with dark blue – yellow denoting the total effect from change in prime rearing area). Box plot denotes distribution of observations of 30-day rolling average outmigration abundance. Middle panel: raw data (points) color-coded by Δ prime rearing area. Bottom panels: the same raw data as above, but faceted by delta fork to underscore greater increases in prime rearing area in the South Fork.
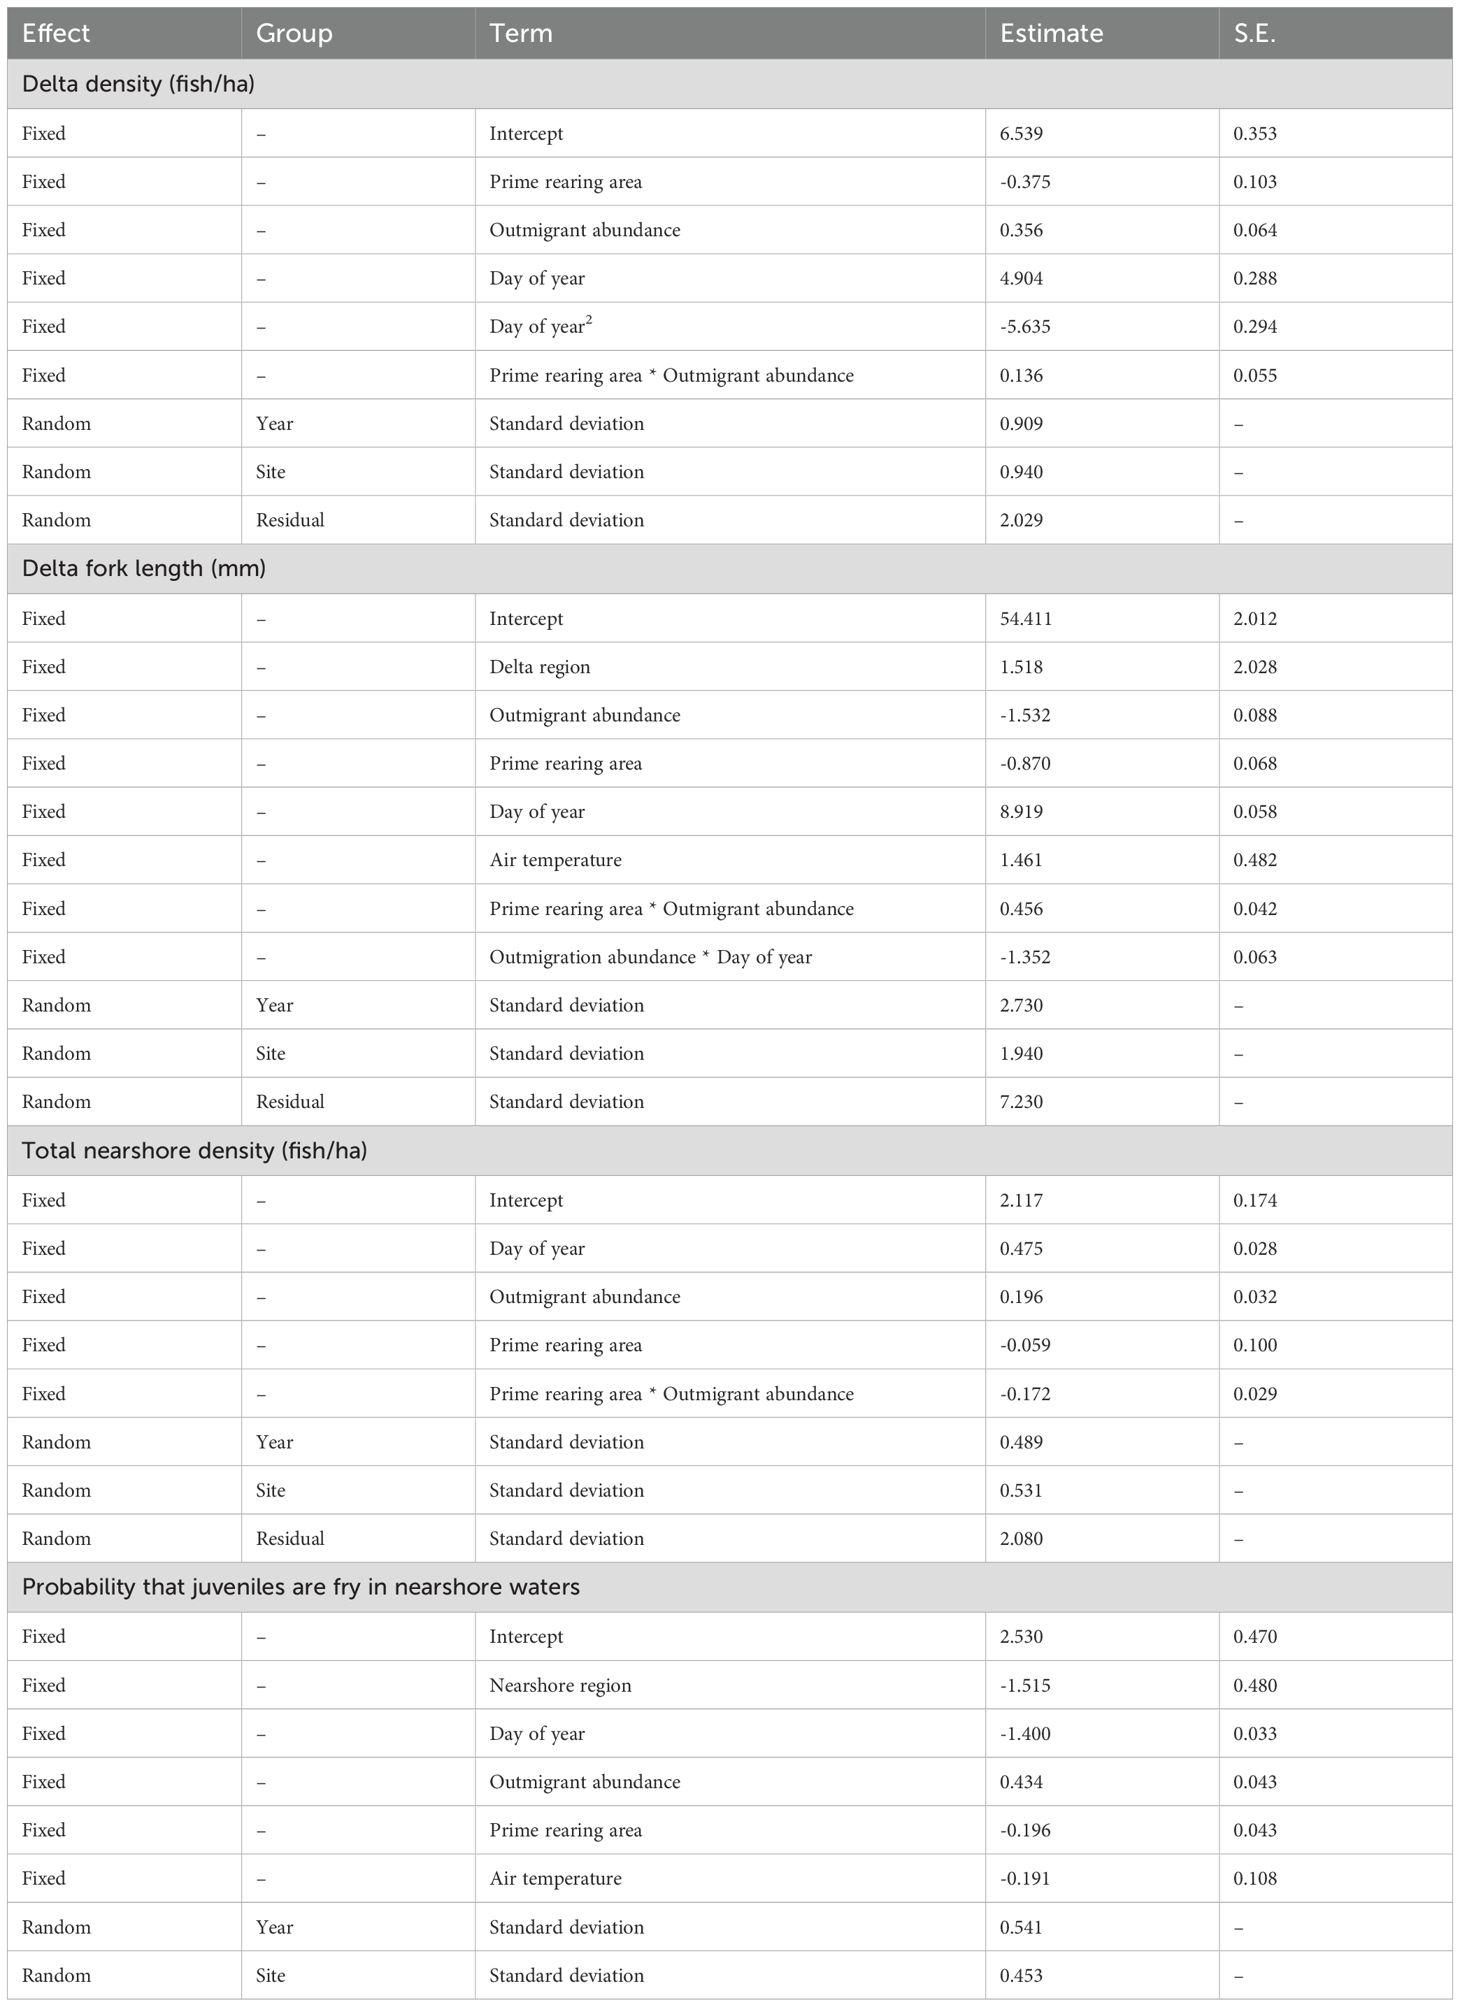
Table 3. Summary statistics of best performing full mixed effects models quantifying salmon habitat use and length relative to delta habitat change.
Juvenile length in the tidal delta
Statistical models showed strong support for changes in individual length of salmon in the delta related to prime rearing area in the tidal delta, outmigrant numbers, day of year, and interactions between outmigrants and both day of year and rearing area, as well as effects of delta subregion and air temperature (Figure 5; Table 3; Supplementary Table S2). Juvenile salmon fork length in the delta (1) decreased as a function of outmigrant abundance, (2) decreased as a function of changing prime rearing area, (3) exhibited a positive interaction between outmigration abundance and habitat area, (4) increased in warmer years, (5) increased with day of year, and (6) exhibited a negative interaction between outmigration abundance and day of year. Across most observed migrant abundances (~0-30,000 in 30-day rolling averages), juvenile lengths decreased by ~5 mm at the highest habitat state relative to the lowest. Additionally, juvenile length remained roughly constant regardless of migrant abundances at the highest habitat state, but at the lowest habitat state they declined by ~10 mm when migrants were most abundant as compared to least abundant. The only alternative models with similar statistical support were those lacking some combination of air temperature and delta subregion (Supplementary Table S2).
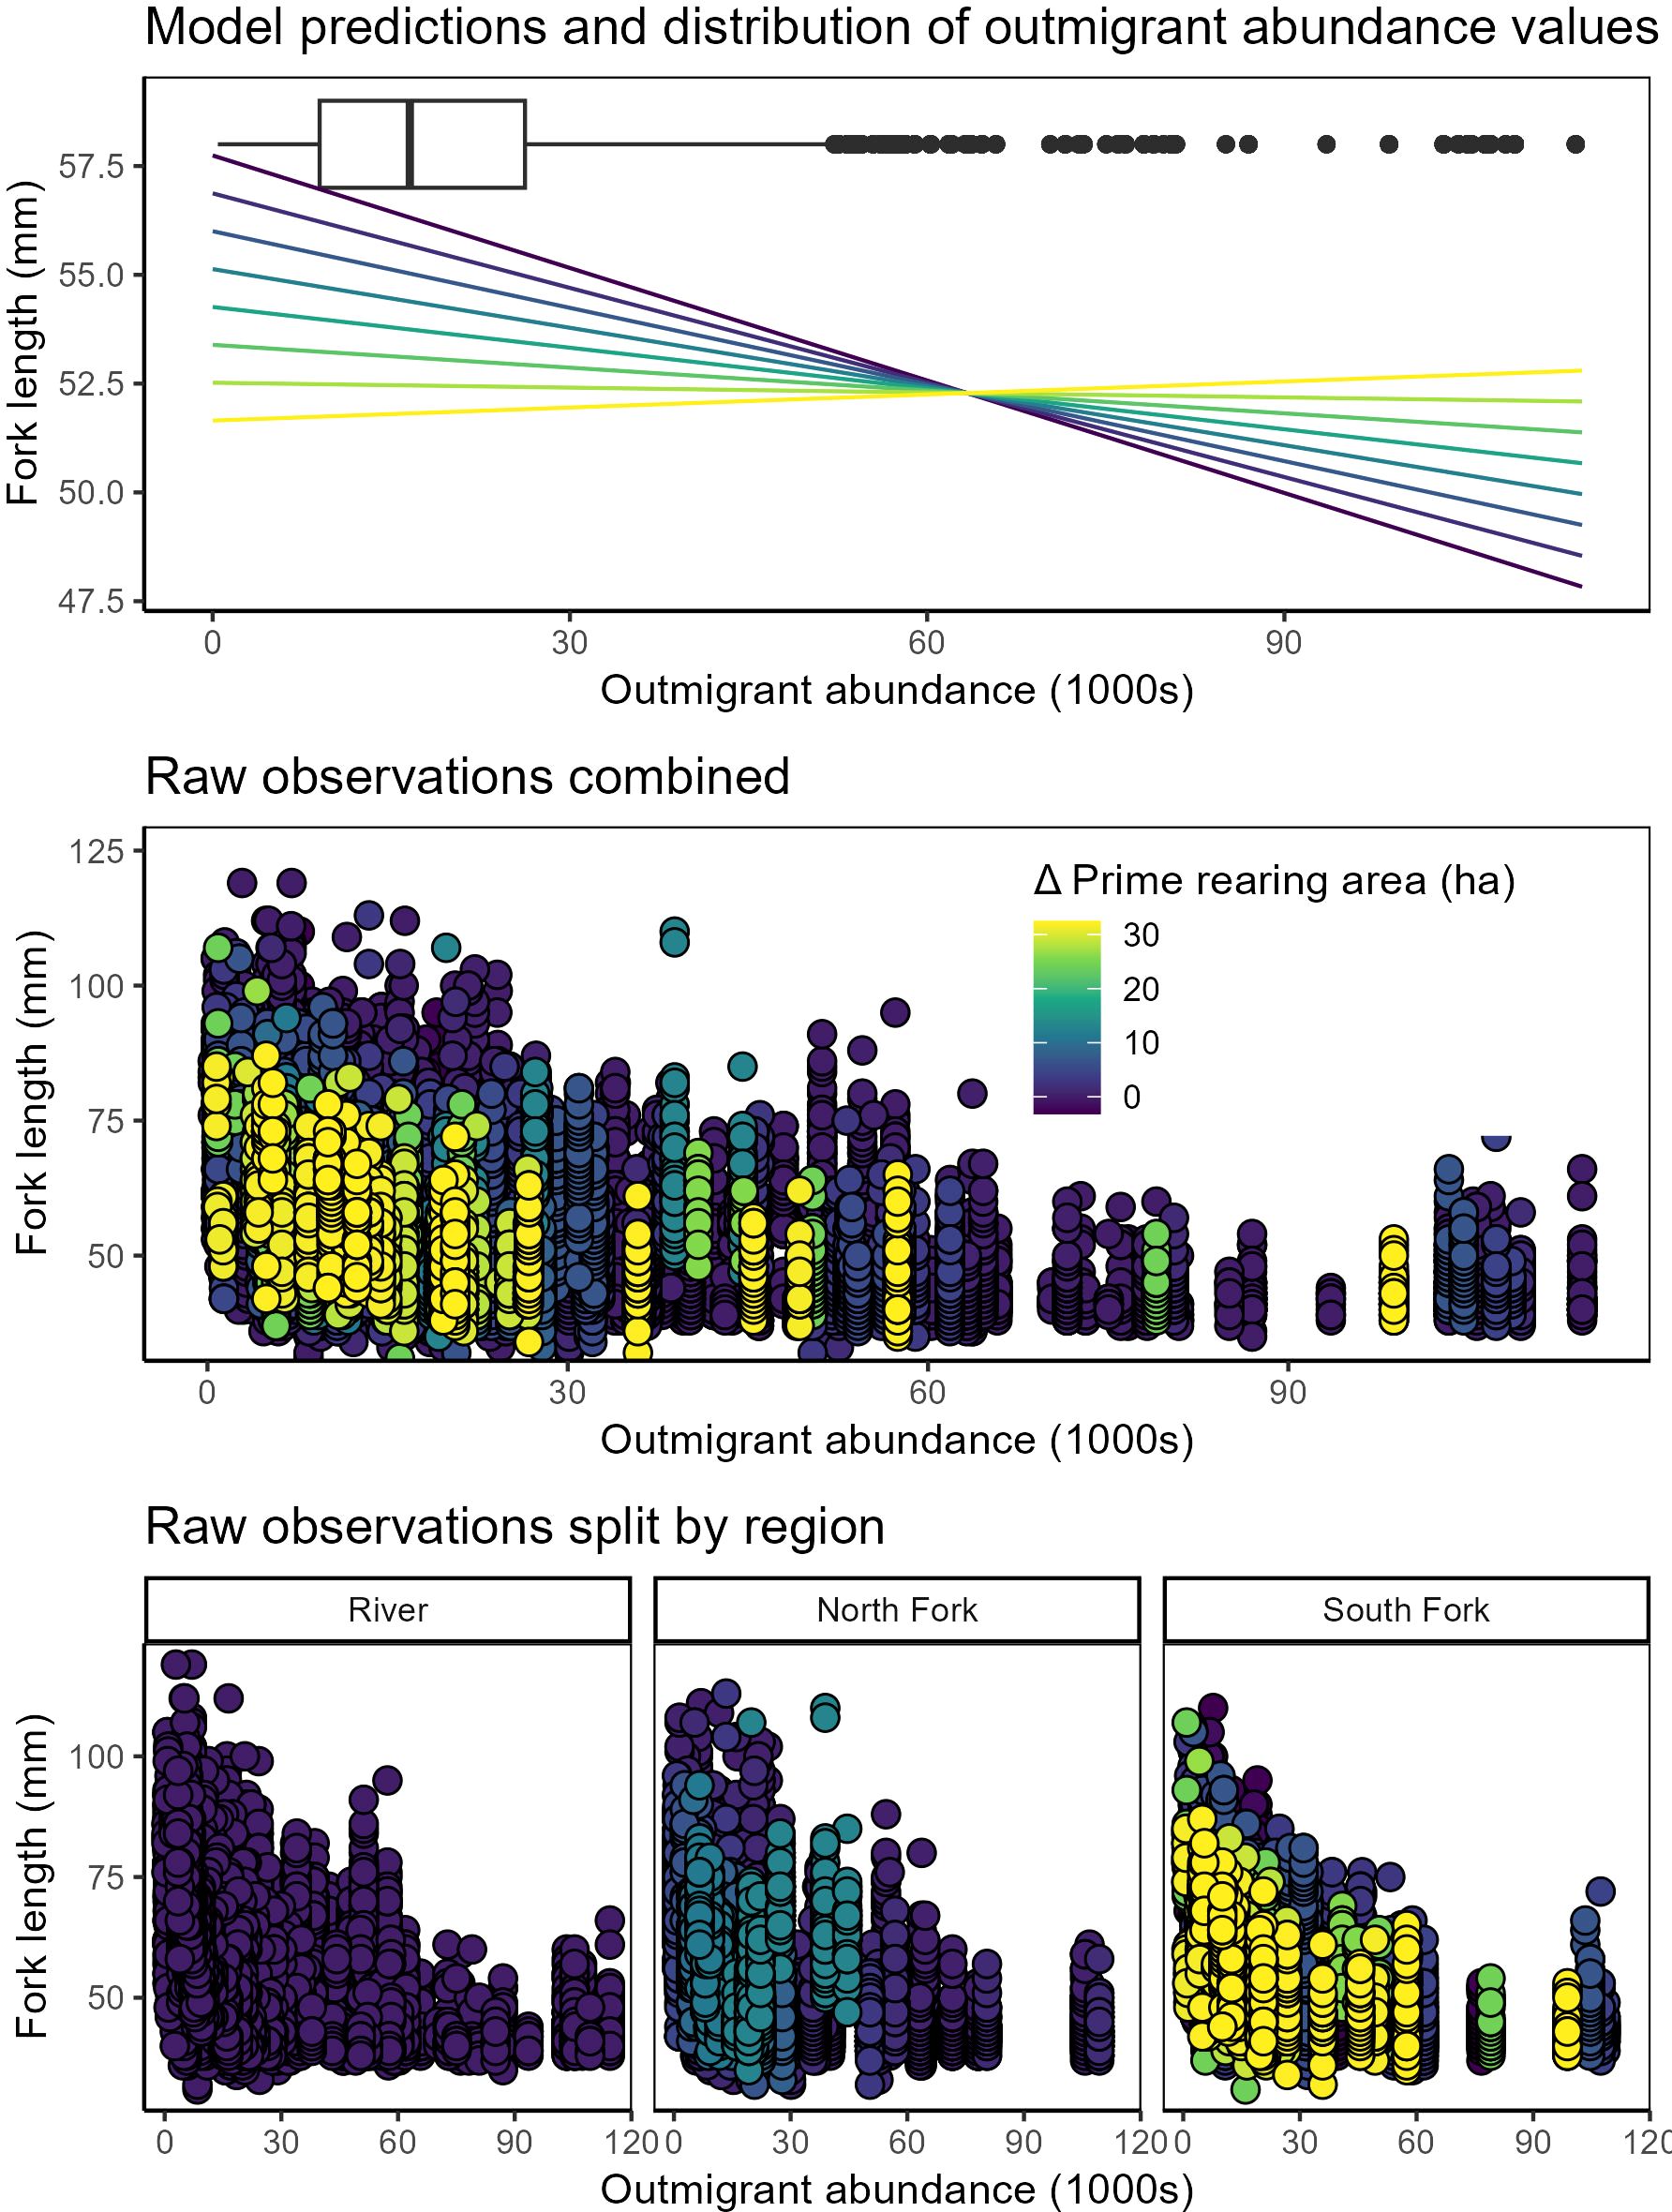
Figure 5. Juvenile Chinook salmon fork length compared to rolling-average outmigrant abundances and habitat states (Δ prime rearing area) measured within the Lower Skagit River and South and North Forks of the tidal delta. Top panel: model predictions of density-dependent habitat benefit shown as color-ramp lines, with dark blue – yellow denoting the total effect from change in prime rearing area). Box plot denotes distribution of observations of 30-day rolling average outmigration abundance. Middle panel: raw data (points) color-coded by Δ prime rearing area. Bottom panels: the same raw data as above, but faceted by region to underscore greater increases to prime rearing area in the South Fork.
Juvenile nearshore density
Comparison of statistical models showed overwhelming support for a model of nearshore density that included effects of prime rearing area in the tidal delta, outmigrant numbers, and interaction of these variables. (Figure 6; Table 3; Supplementary Table S3). In nearshore waters, juvenile salmon densities (1) increased as a function of outmigrant abundance, (2) exhibited a negative interaction between outmigrant abundance and delta habitat state, and (3) increased as the rearing season progressed. At the lowest habitat states, juvenile densities in nearshore waters increased with increasing outmigrants, but this relationship dissolved at the highest habitat states.
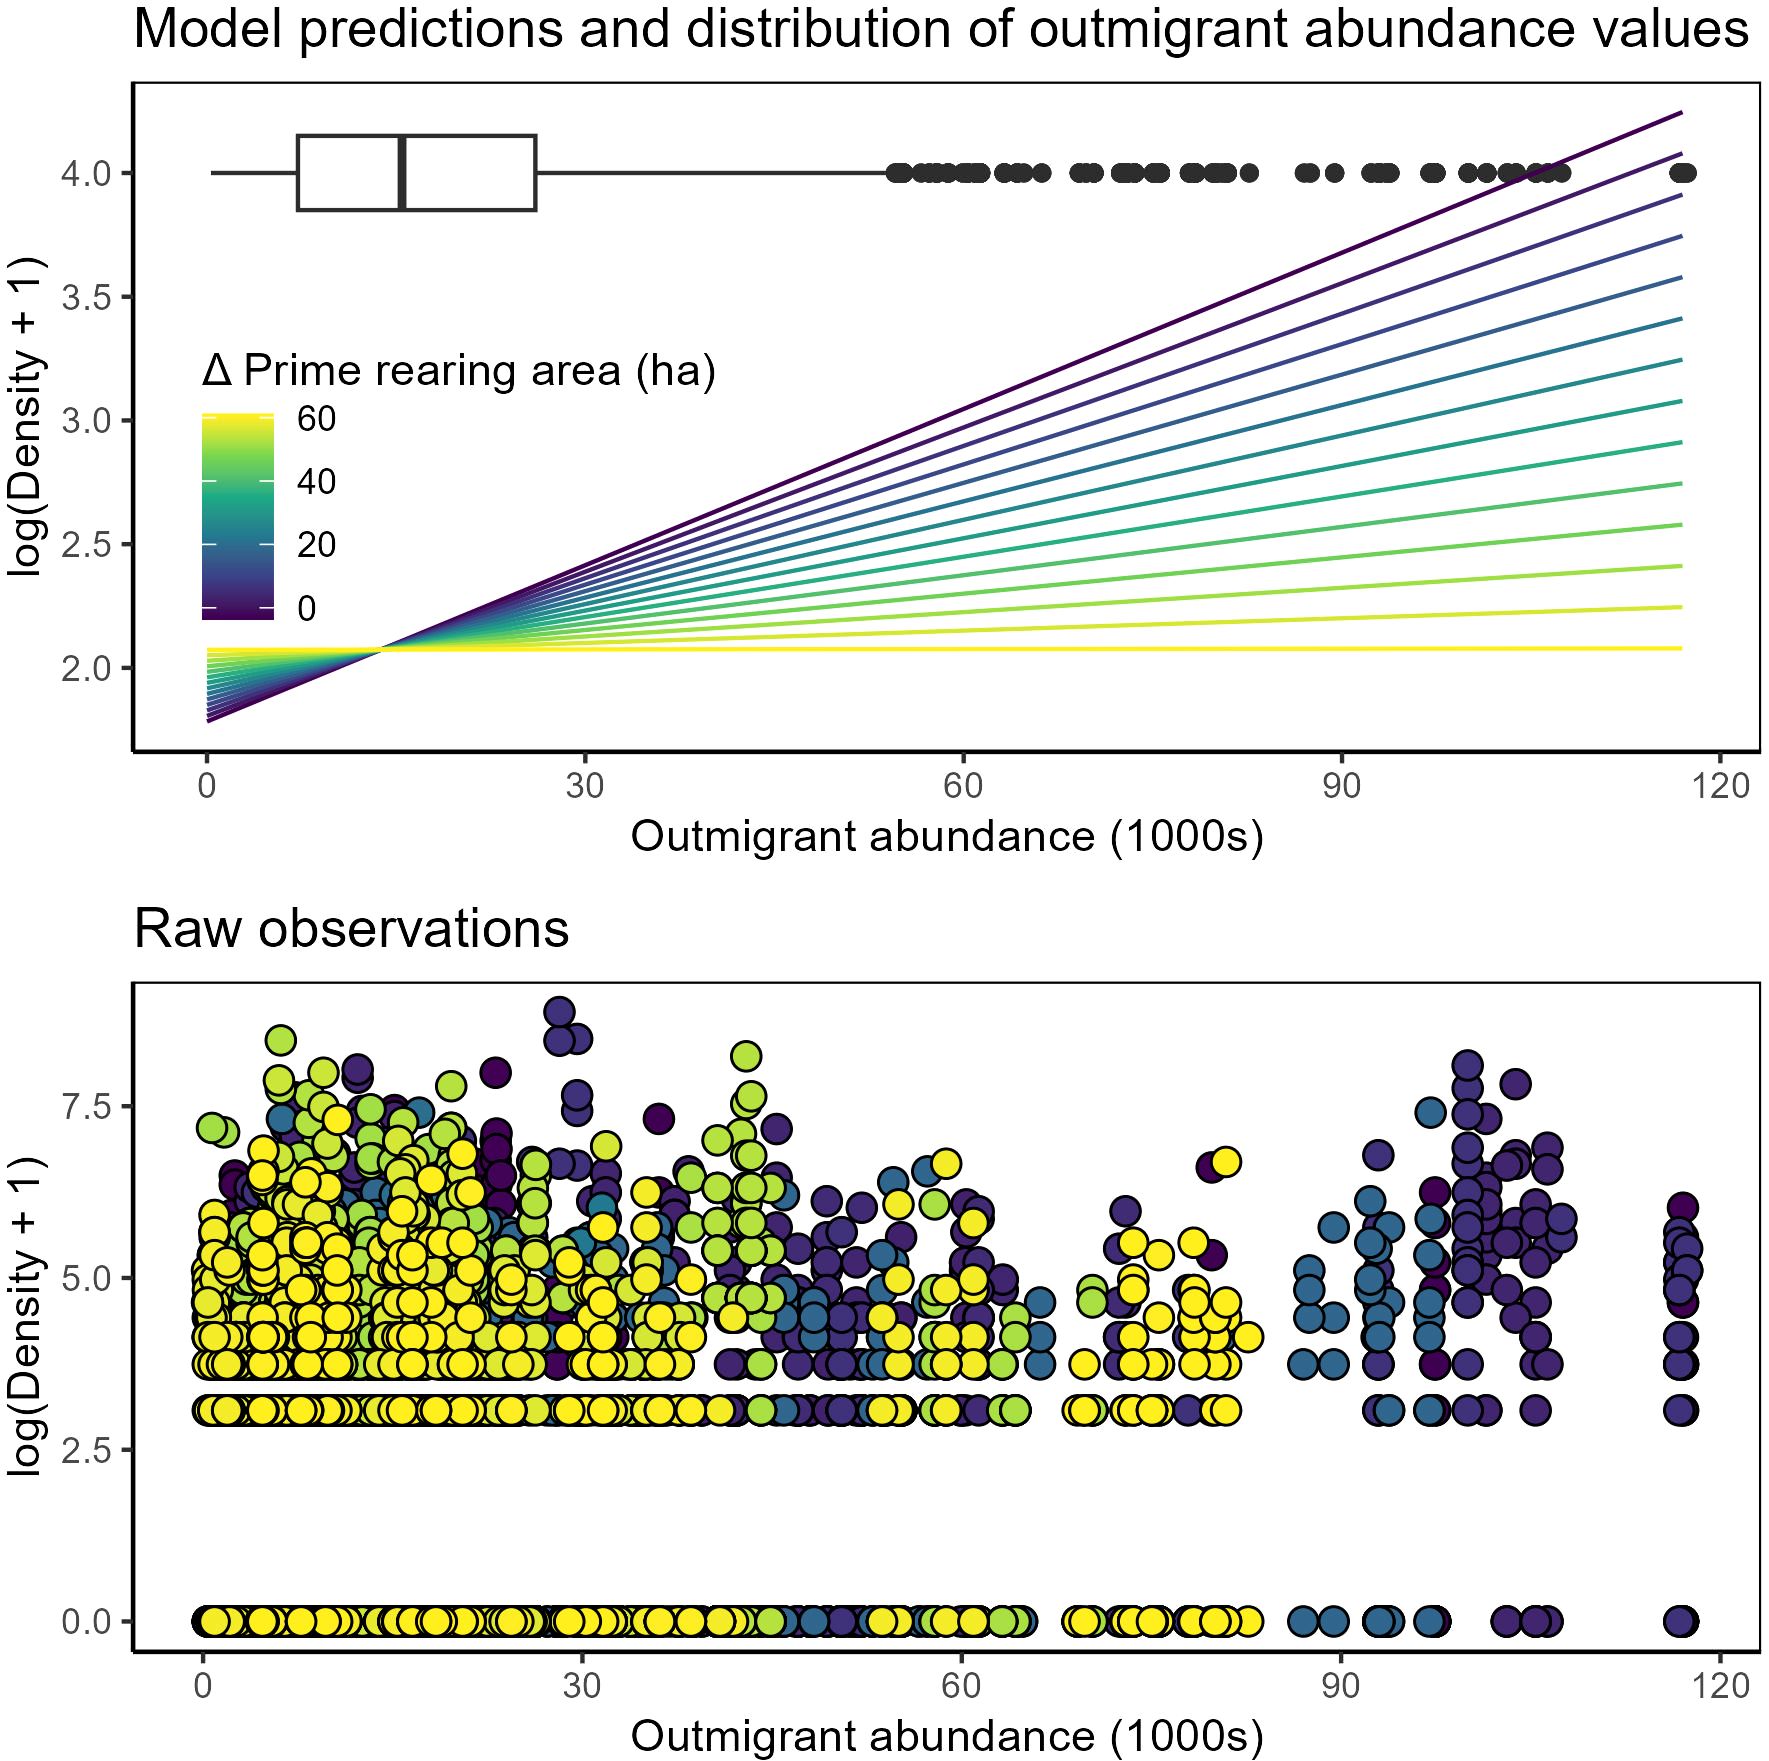
Figure 6. Juvenile salmon density in nearshore waters compared to rolling-average outmigrant abundances and habitat states representing change in prime rearing area across the entire Skagit delta. Top panel: model predictions of density-dependent habitat benefit shown as color-ramp lines, with dark blue – yellow denoting the total effect from change in prime rearing area. Box plot denotes distribution of observations of 30-day rolling average outmigration abundance. Bottom panel: raw data (points) color-coded by Δ prime rearing area.
Spillover of fry into the nearshore
Statistical models indicated strong support for changes in the frequency of fry in the nearshore related to prime rearing area in the tidal delta, outmigrant numbers, day of year, (Figure 7; Table 3; Supplementary Table S4). Salmon exiting Skagit River split into a bimodal distribution of smaller (fry) and larger (parr, smolts) juveniles (Supplementary Figure S5). The proportional expression of the fry life history type in nearshore waters (1) increased as a function of outmigrant abundance, (2) decreased as a function of delta habitat area, and (3) decreased as the rearing season progressed. Alternative models with slightly less statistical support included combinations of air temperature, delta subregion, and interaction between prime rearing area and outmigrant numbers (Supplementary Table S4).
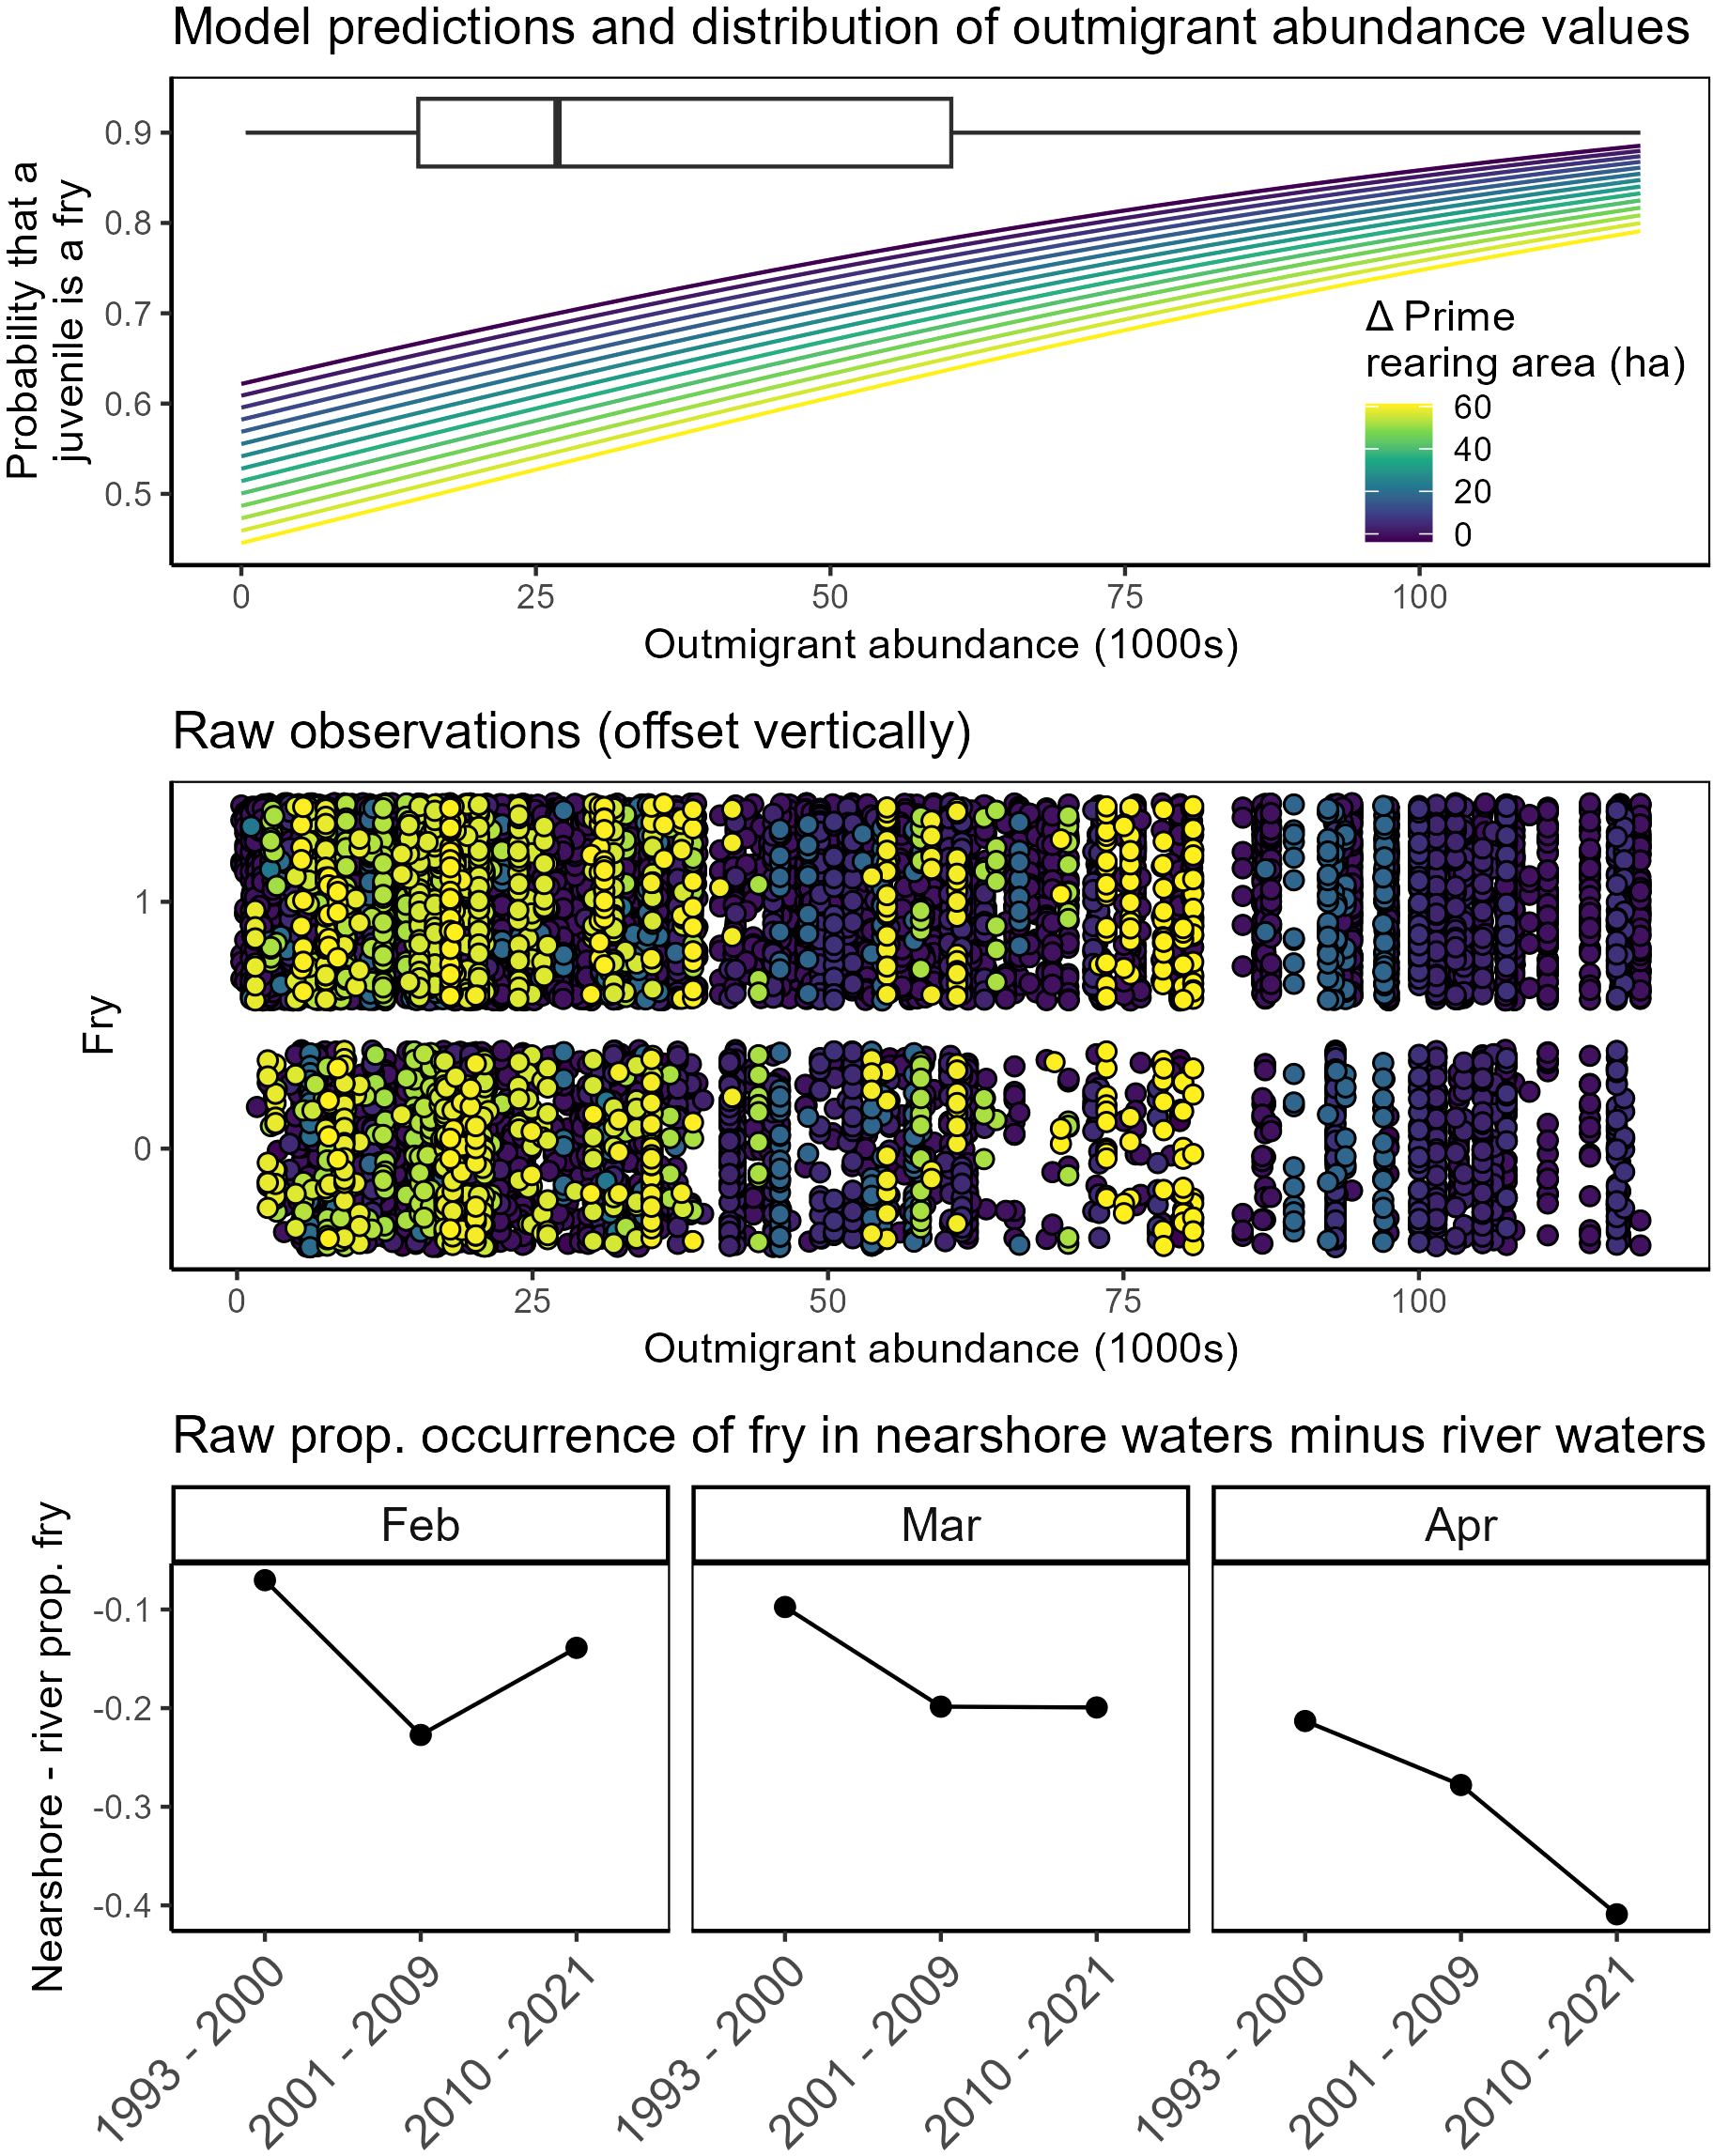
Figure 7. Fry <45 mm) life history expression in nearshore waters relative to the river as functions of outmigration abundance and habitat change across the entire Skagit Delta. Top panel: model predictions of density-dependent habitat benefit shown as color-ramp lines, with dark blue – yellow denoting the total effect from change in prime rearing area. Box plot denotes distribution of observations of 30-day rolling average outmigration abundance. Middle panel: raw data (points) color-coded by Δ prime rearing area. Raw data were grouped as 1 (individual was a fry) or 0 (not a fry). Bottom panels: difference between proportional expressions of fry life history type in nearshore waters relative to that measured in outmigrant abundance, binned by time periods representing different restoration phase (see Methods). Lower values indicate that fry are rarer in nearshore waters compared to the river. Observations are faceted by month because fry become rarer as seasons progress.
Lumping the data by restoration phase (see Methods) revealed that the proportional expression of fry in nearshore waters relative to the river declined with increasing habitat state (Figure 7B).
Discussion
We found evidence of change in juvenile salmon demographics coincident with changes to habitat states in the Skagit tidal delta that was consistent with four ideas: First, more habitat in the delta appeared to reduce juvenile densities in the delta. During rarer situations when outmigrants were especially abundant, more delta habitat appeared to accommodate higher juvenile densities. Second, more habitat in the delta appeared to attract smaller juveniles and alleviate the effects of competition on growth. Third, more habitat in the delta appeared to uncouple the relationship between juvenile densities in the nearshore and outmigrants entering the delta from the river. That is, the delta appeared to hold more individuals when individuals were more abundant across the landscape. Fourth, more habitat in the delta appeared to reduce spillover of fry (and total outmigrants, more generally) into nearshore waters. This aligns with the second and third findings in that it appears that more habitat in the delta allowed more fry to use the delta rather than prematurely spill over into nearshore waters. Altogether, habitat restoration appeared to increase the capacity of the delta to accommodate more juvenile salmon, particularly smaller individuals.
We quantified demographic changes in threatened juvenile salmon across three decades of delta wetland habitat restoration and natural change. Within the delta, subregions subjected to habitat restoration supported lower juvenile densities when landscape-scale migrant abundances were low and, more subtly, greater juvenile densities when outmigrant abundances were very high, and juvenile salmon that were smaller overall and with lengths that declined less when conspecific competitors were more abundant. We also examined salmon captured in nearshore waters, which are generally thought to be representative of later ontogenetic stages. Following cumulative delta habitat increase (largely driven by restoration), we found that nearshore juvenile catches declined relative to outmigration abundances, and prevalence of nearshore fry (<~45 mm) decreased overall. These findings suggest that greater nursery habitat capacity in the delta facilitated greater diffusion of salmon when the system was under capacity but accommodated higher densities when landscape-scale juvenile abundances were especially high, and promoted the use of delta habitats by smaller fish while alleviating competitive effects on growth. Greater diffusion of fish in the tidal delta may be explained by reducing the ratio of fish to habitat area and also by increasing shallow, productive areas that support small juveniles. Perhaps less intuitively, smaller sizes following restoration may be explained by improving the likelihood of sampling fry-sized individuals post-restoration. These findings additionally suggest that greater delta habitat capacity supported more juveniles, decreasing spillover into nearshore environments, especially for the smaller salmon that may benefit most from growth before entering nearshore waters. Altogether, delta restoration appears to have retained and supported growth of smaller juveniles that can rear in the delta before entering nearshore waters. While the delta remains substantially transformed relative to its pre-industrial state, these patterns suggest that increasing rearing area in the delta – primarily via restoration – has increased the capacity of its salmon nursery habitat. It is also possible that habitat quality and diversity has also changed over time, promoting better production of food, cover, and other beneficial habitat traits that were not explicitly accounted for in our metric of prime rearing area.
Our findings suggest that restoring estuarine wetlands can enhance nursery functions. Key functions of nursery habitats include their ability to support early growth and survival as well as ontogenetic habitat shifts reflecting habitat trade-offs (e.g., growth opportunity vs. predation risk) (Sheaves et al., 2015). This is particularly relevant to salmon, as their migratory life histories from river to marine waters ostensibly reflect a tradeoff between freshwater habitats that provide safety but relatively poor growth opportunities and marine-influenced waters that provide improved growth opportunities but with greater predation risk. In this dichotomy, estuaries represent habitats with intermediate risks and benefits (Quinn, 2018). In estuarine waters, shallows are thought to provide predator refuge for smaller fish (Whitfield, 2020) and they are often densely inhabited by small invertebrate fish prey (Beck et al., 2001); thus, shallow habitats like wetlands formed by intact estuaries may be especially important for juvenile salmon (Simenstad et al., 1982). Indeed, salmon in nearshore waters use shallows when they are small and transition to deeper waters as they grow (Beamer et al., 2024b), but small individuals avoid artificially deep shorelines that prevent access to protective shallows and these ontogenetic habitat shifts, suggesting that shallow habitat availability is important for nursery habitat function (Munsch et al., 2016). Our observations of smaller juveniles inhabiting the restored delta may reflect greater availability of these shallow, potentially protective habitats.
Perhaps the strongest evidence of repaired nursery function was reduced overall abundance and expression of fry life history types in nearshore waters as delta habitat area increased. Subyearling-migrant Chinook salmon typically grow to 70–80 mm, either in freshwater or the estuary, prior to migrating to marine environments (Duffy et al., 2005; Rice et al., 2011; Gamble et al., 2018; Greene et al., 2021; Beamer et al., 2024b). We interpret large abundances of Chinook salmon in the nearshore marine environment, particularly early in the season before significant growth has occurred, as fish exceeding capacity of the combined freshwater and estuarine rearing habitats (Beamer et al., 2005; Beamer et al. in review). The reduction in nearshore fry density associated with increased tidal delta rearing habitat suggests that more juveniles were able to find estuarine rearing territories and attain sizes that may increase the probability of survival during the transition to marine habitats. Additionally, we found that salmon were smaller in restored delta habitats, consistent with these smaller salmon remaining in the delta. Altogether, it appears that delta habitat restoration enabled more small salmon to inhabit and grow within the delta prior to their ontogenetic habitat shift into nearshore waters. That is, restoration appeared to reduce juvenile “overflow” from delta to nearshore waters, potentially allowing juveniles to access a less-degraded delta habitat mosaic that offered rearing and growth opportunities more consistent with natural conditions.
Scale is important to consider in the interpretation of these results. First, it may be surprising that juvenile densities decreased with restoration if we expect restored habitats to attract and retain fish. Monitoring sites were not directly within restoration projects, so our findings concerning changes in density reflect changes in other portions of the tidal delta. In addition, project-specific monitoring confirmed that fish used restoration projects (e.g., Beamer et al., 2006; 2014; 2015). The density metric, defined as number of fish/unit area, provides insight into why we observed evidence for both reduced and increased densities depending upon outmigration abundance. With the same numbers of fish, increased area of habitat allows the fish to spread out instead of being concentrated, leading to decreased densities. Lower densities decrease competition for space and prey, leading to increased growth (Greene et al., 2021). That fish length declined with increasing outmigration abundance supports this idea. Tracking individual fish would have enabled a clearer understanding of this pattern, although such procedures at a demographically relevant level were not logistically feasible.
Similarly, we predicted that relieving competition via restored habitat would lead to greater growth and therefore increased size of individual fish. Instead, we observed that smaller sizes were associated with increases in wetland extent. This pattern may reflect more fry-sized fish able to rear in an expanded delta as observed at the population scale, as opposed to declines in individual growth trajectories. Studies of individual growth, not changes in population size distribution, are needed to address the prediction of increased size resulting from reduced competition. That is, it is important to consider the organizational scale (i.e., population rather than individual) that we assessed.
Applications to fisheries management
This study provides important context of decades of studies suggesting that limitations exist in rearing habitat within estuaries, and that restoration of opportunity and capacity (sensu Simenstad and Cordell, 2000; Bottom et al., 2005b) in tidal deltas can improve conditions for anadromous populations. These studies include findings of density-dependent shifts of distribution into tidal deltas (Reimers, 1973; Greene and Beechie, 2004), individual growth within tidal delta restoration sites (Gray et al., 2002; Cordell et al., 2011; David et al., 2014; 2016), and observed smolt-adult survival (Beamer et al. in review). However, it has been extremely difficult to demonstrate from short-term or spatially restricted studies that restoration can have population consequences. This study indicates strong demographic effects of tidal delta habitat restoration, suggesting that cumulative efforts to improve habitat conditions is an effective tool for recovery of threatened anadromous populations. The idea that habitat restoration efforts can boost populations nevertheless implies carryover effects to adulthood. While this study focused on juvenile demography, other work has suggested that density dependence within the tidal delta residence period is sufficient to explain density-dependent recruitment to adult return (Beamer et al. in review), implying that improvement of tidal delta demographics through habitat restoration can boost adult productivity (see also Greene et al., 2024).
Population monitoring – empirically documenting demographic benefits afforded by habitat restoration beyond evaluating fish use of specific restoration projects – requires a multi-decade investment, not only in terms of funding for restoration, but also for the monitoring itself (Roni and Quimby, 2005; Puget Sound Recovery Implementation Technical Team, 2015). This duration of intensive monitoring is difficult for many researchers and program funders to sustain. Longer periods of monitoring facilitate sampling a distribution of outmigration abundances balanced across cumulative habitat restoration (Walters et al., 1988). To the degree possible, restoration practitioners should coordinate with both fish monitors and managers to experimentally vary outmigration size and facilitate population bonanzas during monitoring and restoration time periods (e.g., Pess et al., 2024). This approach could provide opportunities to better document demographic responses in the context of varying degrees of restoration (Bilby et al., 2024; Bisson et al., 2024).
Another important implication from this study is that benefits of habitat restoration will be difficult to infer if the pace of habitat restoration is insufficient to overcome rates of background habitat change (Bisson et al., 2024). Despite a total restored estuary wetland footprint of 255 ha, recent wetland loss due to erosion has been substantial (Hood et al., 2016). This loss is essentially equivalent to the loss of 1–2 habitat restoration projects over the course of the 26 years of this study. Within the South Fork of the Skagit delta for example, this “Red Queen” situation (“it takes all the running you can do, to keep in the same place”; Carroll 1897) strongly argues that the pace of habitat restoration will need to increase if it is to keep up with inundation of extant wetlands due to sea level rise.
Conclusion
We found that estuarine habitat restoration enhanced the nursery habitat availability of a threatened species. Taking a long-term perspective (Pauly, 1995), the Skagit River almost certainly supported more abundant and diverse salmon and habitats in its pre-industrial state than today (Collins and Shiekh 2005; Beechie et al., 2006; Simenstad et al., 2011). Indeed, while restoration efforts have increased delta wetland area considerably on absolute scales observable in one human lifetime, these increases reverse a fraction of total habitat lost (Bernhardt et al., 2005; Brophy et al., 2019). This study is therefore likely describing a time period when historically fewer salmon are competing across a historically lower-capacity habitat mosaic (Achord et al., 2003). However, these restorative actions appear to have reversed a multi-century trend of estuary habitat loss and degradation and improved salmon habitats in recent decades. Furthermore, improving estuarine habitats may increase the viability of life histories that extensively use the estuary, thus increasing life history diversity at the scale of the population complex and bolstering resilience via diversification. As Skagit River Chinook salmon and other species face mounting human stressors near estuaries, restoration may prove critical to their long-term sustainability and recovery.
Data availability statement
Data used in this study were shared by tribes and they exercise sovereign authority over it. Requests for data not supplied in tables, figures, or Supplementary Text may be made by formal request to coauthors, without undue reservation.
Ethics statement
Ethical approval was not required for the study involving animals in accordance with the local legislation and institutional requirements because handling of fish was conducted by state and tribal organizations to monitor populations, and this monitoring effort was approved by comanagers. The species studied is threatened under the US Endangered Species Act, and the highest ethical standards were applied to handle individuals safely and with little discomfort, so as to minimize impacts to the population.
Author contributions
CG: Conceptualization, Funding acquisition, Investigation, Methodology, Project administration, Resources, Supervision, Writing – original draft, Writing – review & editing. EB: Conceptualization, Data curation, Formal analysis, Funding acquisition, Investigation, Methodology, Project administration, Resources, Supervision, Visualization, Writing – review & editing. SM: Conceptualization, Data curation, Formal analysis, Investigation, Visualization, Writing – original draft, Writing – review & editing. JC: Conceptualization, Funding acquisition, Investigation, Methodology, Project administration, Writing – original draft, Writing – review & editing. ML: Conceptualization, Data curation, Investigation, Methodology, Resources, Supervision, Writing – review & editing. JA: Data curation, Investigation, Methodology, Resources, Supervision, Writing – review & editing.
Funding
The author(s) declare that financial support was received for the research and/or publication of this article. Partial funding was through the Salmon Recovery Funding Board’s Intensively Monitored Watershed Program administered by the Washington State Recreation and Conservation Office, and the Estuary and Salmon Restoration Program (Project #18-2248). Additional funding and support for the Skagit IMW are provided by Skagit River System Cooperative and tribal Pacific Salmon Treaty Implementation funding administered through the Northwest Indian Fisheries Commission, National Marine Fisheries Service, and Washington Department of Fish and Wildlife. Outmigrant trapping on the Skagit River was supported by the Dingell-Johnson Sport Fish Restoration Act funding administered by U.S. Fish and Wildlife Service and Washington State General Fund.
Acknowledgments
We thank numerous field crew members for their assistance in collecting data that are summarized in this report. This document was reviewed by the Intensively Monitored Watershed Program Committee, led by William Ehinger (Department of Ecology). We are grateful for the many people who worked to collect the data in the field, and to M. Liermann, T. Conway-Cranos, and S. Schooler for helpful reviews.
Conflict of interest
The authors declare that the research was conducted in the absence of any commercial or financial relationships that could be construed as a potential conflict of interest.
Generative AI statement
The author(s) declare that no Generative AI was used in the creation of this manuscript.
Publisher’s note
All claims expressed in this article are solely those of the authors and do not necessarily represent those of their affiliated organizations, or those of the publisher, the editors and the reviewers. Any product that may be evaluated in this article, or claim that may be made by its manufacturer, is not guaranteed or endorsed by the publisher.
Supplementary material
The Supplementary Material for this article can be found online at: https://www.frontiersin.org/articles/10.3389/fmars.2025.1584913/full#supplementary-material
References
Achord S., Levin P. S., and Zabel R. W. (2003). Density-dependent mortality in Pacific salmon: the ghost of impacts past? Ecol. Lett. 6, 335–342. doi: 10.1046/j.1461-0248.2003.00438.x
Arbeider M., Pemberton-Renaud V., Hodgson E. E., and Moore J. W. (2023). The estuarine growth and residency of juvenile Pacific salmon in North America: a compilation of empirical data. Can. J. Fisheries Aquat. Sci. 81, 253–267. doi: 10.1139/cjfas-2023-0225
Austin C. S., Essington T. E., and Quinn T. P. (2021). In a warming river, natural-origin Chinook salmon spawn later but hatchery-origin conspecifics do not. Can. J. Fish. Aquat. Sci. 78, 68–77. doi: 10.1139/cjfas-2020-0060
Bates D., Mächler M., Bolker B., and Walker S. (2015). Fitting linear mixed-effects models using lme4. J. Stat. softw. 67, 1–48. doi: 10.18637/jss.v067.i01
Bayraktarov E., Saunders M. I., Abdullah S., Mills M., Beher J., Possingham H. P., et al. (2016). The cost and feasibility of marine coastal restoration. Ecol. Appl. 26, 1055–1074. doi: 10.1890/15-1077
Beamer E. M., Greene C. M., Anderson J. H., Henderson R., Kinsel C., and Ruff C. Density-dependent habitat relationships of wild subyearling Chinook Salmon in the Skagit River estuary. Marine Coast. Fish.
Beamer E. M., Greene C. M., Chamberlin J. W., Hood W. G., Ellings C. S., Hodgson S., et al. (2024a). Landscape determinants of aquatic estuarine habitat use by juvenile Chinook salmon. Can. J. Fish. Aquat. Sci. 81, 747–767. doi: 10.1139/cjfas-2023-0249
Beamer E. M., Henderson R., and Brown B. (2015). Juvenile Chinook salmon utilization of habitat associated with the Wiley Slough Restoration Project 2012-2103 (LaConner, WA: Skagit River System Cooperative). Available at: www.skagitcoop.org (Accessed May 17, 2025).
Beamer E. M., Henderson R., Ruff C., and Wolf K. (2014). Juvenile Chinook salmon utilization of habitat associated with the Fisher Slough Restoration Project 2009 - 2013 (LaConner, WA: Skagit River System Cooperative). Available at: www.skagitcoop.org (Accessed May 17, 2025). Report prepared for The Nature Conservancy.
Beamer E. M., Henderson R., and Wolf K. (2006). Effectiveness monitoring of the Deepwater Slough restoration project for wild juvenile Chinook salmon (LaConner, WA: Skagit River System Cooperative). Available at: www.skagitcoop.org (Accessed May 17, 2025).
Beamer E. M. and Larsen K. (2004). The importance of Skagit delta habitat on the growth of wild ocean-type Chinook in Skagit Bay: implications for delta restoration (LaConner, WA: Skagit River System Cooperative). Available at: www.skagitcoop.org (Accessed May 17, 2025). Skagit River System Cooperative research report.
Beamer E. M., McBride A., Greene C. M., Henderson R., Hood W. G., Wolf K., et al. (2005). Delta and nearshore restoration for the recovery of wild Skagit River Chinook salmon: Linking estuary restoration to wild Chinook salmon populations. Supplement to Skagit Chinook Recovery Plan (LaConner, WA: Skagit River System Cooperative). Available at: www.skagitcoop.org (Accessed May 17, 2025).
Beamer E. M., McBride A., Henderson R., and Wolf K. (2003). The importance of non-natal pocket estuaries in Skagit Bay to wild Chinook salmon: an emerging priority for restoration. (LaConner, WA: Skagit River System Cooperative). Available online at: www.skagitcoop.org (Accessed May 17, 2025).
Beamer E. M., Rice C. A., Chamberlin J., Henderson R. A., Lomax D. P., and Greene C. M. (2024b). Differential use of tidal delta, shoreline, and neritic habitats by natural-and hatchery-origin juvenile Chinook Salmon. Trans. Am. Fish. Soc. 153, 802–821. doi: 10.1002/tafs.10488
Beamer E. M., Sartori J., and Larsen K. (2000). Skagit Chinook Life History Study Progress Report 3 (LaConner, WA: Skagit System Cooperative). Available at: www.skagitcoop.org (Accessed May 17, 2025).
Beamer E. M., Zackey W. T., Marks D., Teel D., Kuligowski D., and Henderson R. (2013). Juvenile Chinook salmon rearing in small non-natal streams draining into the Whidbey basin. (LaConner, WA: Skagit River System Cooperative). Available online at: www.skagitcoop.org (Accessed May 17, 2025).
Beck M. W., Heck K. L., Able K. W., Childers D. L., Eggleston D. B., Gillanders B. M., et al. (2001). The identification, conservation, and management of estuarine and marine nurseries for fish and invertebrates: a better understanding of the habitats that serve as nurseries for marine species and the factors that create site-specific variability in nursery quality will improve conservation and management of these areas. BioScience. 51 (8), 633–641. doi: 10.1641/0006-3568(2001)051[0633:TICAMO]2.0.CO;2
Beechie T., Buhle E., Ruckelshaus M., Fullerton A., and Holsinger L. (2006). Hydrologic regime and the conservation of salmon life history diversity. Biol. Conserv. 130, 560–572. doi: 10.1016/j.biocon.2006.01.019
Bernhardt E. S., Palmer M., Allan J. D., Alexander G., Barnas K., Brooks S., et al. (2005). Synthesizing U.S. river restoration efforts. Science 308, 636–637. doi: 10.1126/science.1109769
Bilby R. E., Currens K. P., Fresh K. L., Booth D. B., Fuerstenberg R. R., and Lucchetti G. L. (2024). Why aren’t salmon responding to habitat restoration in the Pacific Northwest? Fisheries 49, 16–27. doi: 10.1002/fsh.10991
Bisson P., Hillman T., Beechie T., and Pess G. (2024). Managing expectations from intensively monitored watershed studies. Fisheries 49, 8–15. doi: 10.1002/fsh.10992
Bottom D. L., Jones K. K., Cornwell T. J., Gray A., and Simenstad C. A. (2005a). Patterns of Chinook salmon migration and residency in the Salmon River estuary (Oregon). Estuarine Coast. Shelf Sci. 64, 79–93. doi: 10.1016/j.ecss.2005.02.008
Bottom D. L., Simenstad C. A., Burke J., Baptista A. M., Jay D. A., Jone K. K., et al. (2005b). Salmon at river’s end: the role of the estuary in the decline and recovery of Columbia River salmon (U.S. Dept. Commer., NOAA Tech), 246. Memo. NMFS-NWFSC-68. https://repository.library.noaa.gov/view/noaa/3432/noaa_3432_DS1.pdf (Accessed May 17, 2025).
Brophy L. S., Greene C. M., Hare V. C., Holycross B., Lanier A., Heady W., et al. (2019). Insights into estuary habitat loss in the western United States using a new method for mapping maximum extent of tidal wetlands. PloS One 14, e0218558. doi: 10.1371/journal.pone.0218558
Carlson S. R., Coggins L. G. Jr., and Swanton C. O. (1998). A simple stratified design for mark-recapture estimation of salmon smolt abundance. Available at: https://www.adfg.alaska.gov/static/home/library/PDFs/afrb/carlv5n2.pdf (Accessed May 17, 2025).
Carroll L. (1897). Through the Looking-Glass and What Alice Found There (Philadelphia: Henry Altemus Company).
Chamberlin J. (2022). Chinook Salmon Use of Tidal Delta Habitats: Synthesis for Snohomish Recovery Plan Revision (U.S. Department of Commerce). NOAA Contract Report NMFS-NWFSC-CR-2022-01. doi: 10.25923/nafn-jp23
Collins B. D., Montgomery D. R., and Sheikh A. J. (2003). “Reconstructing the historical riverine landscape of the Puget lowland,” in Restoration of Puget Sound Rivers. Eds. Montgomery D. R., Bolton S., Booth D. B., and Wall L. (University of Washington Press, Seattle, WA), 79–128.
Collins B. D. and Sheikh A. (2005). Historical reconstruction, classification, and change analysis of Puget Sound tidal marshes (Olympia, WA: Washington Department of Natural Resources). Available at: https://nisquallydeltarestoration.org/pdf/historical_tidal%20marshes.pdf (Accessed May 17, 2025).
Colombano D. D., Carlson S. M., Hobbs J. A., and Ruhi A. (2022). Four decades of climatic fluctuations and fish recruitment stability across a marine-freshwater gradient. Global Change Biol. 28, 5104–5120. doi: 10.1111/gcb.16266
Cordell J. R., Toft J. D., Gray A., Ruggerone G. T., and Cooksey M. (2011). Functions of restored wetlands for juvenile salmon in an industrialized estuary. Ecol. Eng. 37, 343–353. doi: 10.1016/j.ecoleng.2010.11.028
David A. T., Ellings C. S., Woo I., Simenstad C. A., Takekawa J. Y., Turner K. L., et al. (2014). Foraging and growth potential of juvenile Chinook salmon after tidal restoration of a large river delta. Trans. Am. Fish. Soc. 143, 1515–1529. doi: 10.1080/00028487.2014.945663
David A. T., Simenstad C. A., Cordell J. R., Toft J. D., Ellings C. S., Gray A., et al. (2016). Wetland loss, juvenile salmon foraging performance, and density dependence in Pacific Northwest estuaries. Estuaries Coasts 39, 767–780. doi: 10.1007/s12237-015-0041-5
Duffy E. J., Beauchamp D. A., and Buckley R. M. (2005). Early marine life history of juvenile Pacific salmon in two regions of Puget Sound. Estuarine Coast. Shelf Sci. 64, 94–107. doi: 10.1016/j.ecss.2005.02.009
Gamble M. M., Connelly K. A., Gardner J. R., Chamberlin J. W., Warheit K. I., and Beauchamp D. A. (2018). Size, growth, and size-selective mortality of subyearling Chinook Salmon during early marine residence in Puget Sound. Trans. Am. Fish. Soc. 147, 370–389. doi: 10.1002/tafs.2018.147.issue-2
Gittman R. K., Fodrie F. J., Popowich A. M., Keller D. A., Bruno J. F., Currin C. A., et al. (2015). Engineering away our natural defenses: an analysis of shoreline hardening in the US. Front. Ecol. Environ. 13, 301–307. doi: 10.1890/150065
Gray A., Simenstad C. A., Bottom D. L., and Cornwell T. J. (2002). Contrasting functional performance of juvenile salmon habitat in recovering wetlands of the Salmon River estuary, Oregon, USA. Restor. Ecol. 10, 514–526. doi: 10.1046/j.1526-100X.2002.01039.x
Greene C. M., Beamer E. M., Chamberlin J., Hood W. G., Davis M. J., Larsen K., et al. (2021). Landscape, density-dependent, and bioenergetic influences upon Chinook salmon in tidal delta habitats: Comparison of four Puget Sound estuaries. ESRP Report 13-1508. Available online at: https://salishsearestoration.org/w/images/6/66/Greene_et_al_2021_chinook_salmon_estuary_density_dependance.pdf (Accessed May 17, 2025).
Greene C. M. and Beechie T. J. (2004). Habitat-specific population dynamics of ocean-type Chinook salmon Oncorhynchus tshawytscha in Puget Sound. Can. J. Fish. Aquat. Sci. 61, 590–602. doi: 10.1139/f04-024
Greene C. M., Chamberlin J., Munsch S., Anderson J., Beamer E., LeMoine M., et al. (2024). Multi-scale assessment of population responses to estuary restoration for Puget Sound Chinook Salmon, ESRP Report 18-2248. https://salishsearestoration.org/w/images/9/9f/Final_Report.pdf (Accessed May 17, 2025).
Greene C. M., Hall J. E., Guilbault K. R., and Quinn T. P. (2010). Improved viability of populations with diverse life-history portfolios. Biol. Lett. 6, 382–386. doi: 10.1098/rsbl.2009.0780
Hall J. E., Greene C. M., Stefankiv O., Anderson J. H., Timpane-Padgham B., Beechie T. J., et al. (2018). Large river habitat complexity and productivity of Puget Sound Chinook salmon. PloS One 13, e0205127. doi: 10.1371/journal.pone.0205127
Healey M. C. (1980). Utilization of the Nanaimo River estuary by juvenile Chinook salmon, Oncorhynchus tshawytscha. Fish. Bull. 77, 653–668. Available online at: https://spo.nmfs.noaa.gov/sites/default/files/pdf-content/1979/773/healey.pdf (Accessed May 17, 2025).
Healey M. C. (1991). “Life history of chinook salmon (Oncorhynchus tshawytscha),” in Pacific salmon life histories. Eds. Groot C. and Margolis L. (Vancouver BC: UBC Press), 311–393.
Hodgson E. E., Wilson S. M., and Moore J. W. (2020). Changing estuaries and impacts on juvenile salmon: A systematic review. Global Change Biol. 26, 1986–2001. doi: 10.1111/gcb.14997
Hood W. G. (2004). Indirect environmental effects of dikes on estuarine tidal channels: thinking outside of the dike for habitat restoration and monitoring. Estuaries 27, 273–282. doi: 10.1007/BF02803384
Hood W. G. (2007). Scaling tidal channel geometry with marsh island area: A tool for habitat restoration, linked to channel formation process. Water Resour. Res. 43, W03409. doi: 10.1029/2006WR005083
Hood W. G., Grossman E. E., and Veldhuisen C. (2016). Assessing tidal marsh vulnerability to sea-level rise in the Skagit Delta. Northwest Sci. 90, 79–93. doi: 10.3955/046.090.0107
Kinsel C., Zimmerman M. S., Kishimoto L., and Topping P. (2008) 2007 Skagit River salmon production evaluation, FPA 08-08 (Olympia, Washington: Washington Department of Fish and Wildlife). Available at: https://wdfw.wa.gov/sites/default/files/publications/00093/wdfw00093.pdf (Accessed May 17, 2025).
Levings C. (2019). Ecology of Salmonids in Estuaries around the World: Adaptations, Habitats, and Conservation (Vancouver BC: UBC Press).
Levings C. D. (1989). Chinook salmon (Oncorhynchus tshawytscha) and estuarine habitat: a transfer experiment can help evaluate estuary dependency. Can. Spec. Publ. Fish Aquat. Sci. 105, 116–122.
Levy D. A. and Northcote T. G. (1982). Juvenile salmon residency in a marsh area of the Fraser River estuary. Can. J. Fish. Aquat. Sci. 39, 270–276. doi: 10.1139/f82-038
Lotze H. K., Lenihan H. S., Bourque B. J., Bradbury R. H., Cooke R. G., Kay M. C., et al. (2006). Depletion, degradation, and recovery potential of estuaries and coastal seas. Science 312, 1806–1809. doi: 10.1126/science.1128035
Magnuson A. and Hilborn R. (2003). Estuarine influence on survival rates of coho (Oncorhynchus kisutch) and Chinook salmon (Oncorhynchus tshawytscha) released from hatcheries on the U.S. Pacific coast. Estuaries 26, 1094–1103. doi: 10.1007/BF02803366
McBride A. R., Wolf R., and Beamer E. M. (2006). Skagit Bay nearshore habitat mapping (LaConner, WA: Skagit River System Cooperative). Available at: www.skagitcoop.org (Accessed May 17, 2025).
Munsch S. H., Cordell J. R., and Toft J. D. (2016). Fine-scale habitat use and behavior of a nearshore fish community: nursery functions, predation avoidance, and spatiotemporal habitat partitioning. Mar. Ecol. Prog. Ser. 557, 1–15. doi: 10.3354/meps11862
Munsch S. H., Greene C. M., Johnson R. C., Satterthwaite W. H., Imaki H., Brandes P. L., et al. (2020). Science for integrative management of a diadromous fish stock: interdependencies of fisheries, flow, and habitat restoration. Can. J. Fisheries Aquat. Sci. 77.
Munsch S. H., Greene C. M., Mantua N. J., and Satterthwaite W. H. (2022). One hundred-seventy years of stressors erode salmon fishery climate resilience in California’s warming landscape. Global Change Biol. 28, 2183–2201. doi: 10.1111/gcb.16029
Murray N. J., Worthington T. A., Bunting P., Duce S., Hagger V., Lovelock, et al. (2022). High-resolution mapping of losses and gains of Earth’s tidal wetlands. Science 376, 744–749. doi: 10.1126/science.abm9583
Nagelkerken I., Sheaves M., Baker R., and Connolly R. M. (2015). The seascape nursery: a novel spatial approach to identify and manage nurseries for coastal marine fauna. Fish Fisheries 16, 362–371. doi: 10.1111/faf.12057
Nehlsen W., Williams J. E., and Lichatowich J. A. (1991). Pacific salmon at the crossroads: stocks at risk from California, Oregon, Idaho, and Washington. Fisheries 16, 4–21. doi: 10.1577/1548-8446(1991)016<0004:PSATCS>2.0.CO;2
NOAA Climate at a Glance Puget Sound Lowlands August-July mean air temperature. Available online at: https://www.ncei.noaa.gov/access/monitoring/climate-at-a-glance/divisional/time-series/4503/tavg/12/7/1895-2022?base_prd=true&begbaseyear=1901&endbaseyear=2000 (Accessed May 17, 2025).
Pauly D. (1995). Anecdotes and the shifting baseline syndrome of fisheries. Trends Ecol. Evol. 10, 430. doi: 10.1016/s0169-5347(00)89171-5
Pess G. R., McHenry M. L., Denton K., Anderson J. H., Liermann M. C., Peters R. J., et al. (2024). Initial responses of Chinook salmon (Oncorhynchus tshawytscha) and steelhead (Oncorhynchus mykiss) to removal of two dams on the Elwha River, Washington State, USA. Front. Ecol. Evol. 12, 1241028. doi: 10.3389/fevo.2024.1241028
Puget Sound Recovery Implementation Technical Team. (2015). Puget Sound Chinook salmon recovery: A framework for the development of monitoring and adaptive management plans. U.S. Dept. Commer., NOAA Tech. Memo. NMFS-NWFSC-130. doi: 10.7289/V5/TM-NWFSC-130
Quinn T. P. (2018). The Behavior and Ecology of Pacific Salmon and Trout, 2nd ed. (Seattle WA: University of Washington Press).
Reimers P. E. (1973). The length of residence of juvenile fall Chinook salmon in Sixes River, Oregon. Res. Rep. Fish Comm. Oregon 4, 1–42.
Rice C. A., Greene C. M., Moran P., Teel D. J., Kuligowski D. R., Reisenbichler R. R., et al. (2011). Abundance, stock origin, and length of marked and unmarked juvenile Chinook salmon in the surface waters of greater Puget Sound. Trans. Am. Fish. Soc. 140, 170–189. doi: 10.1080/00028487.2010.550253
Rice C. A., Hood W. G., Tear L. M., Simenstad C. A., Johnson L. L., Williams G. D., et al. (2005). “Monitoring rehabilitation in temperate North American estuaries,” in Monitoring River Restoration. Ed. Roni P. (American Fisheries Society, Bethesda, MD), 165–204.
Roni P. and Quimby E. (Eds.) (2005). Monitoring stream and watershed restoration (American Fisheries Society, Bethesda, MD).
Schindler D. E., Hilborn R., Chasco B., Boatright C. P., Quinn T. P., Rogers L. A., et al. (2010). Population diversity and the portfolio effect in an exploited species. Nature 465, 609–612. doi: 10.1038/nature09060
Simenstad C. A. and Cordell J. R. (2000). Ecological assessment criteria for restoring anadromous salmonid habitat in Pacific Northwest estuaries. Ecol. Eng. 15, 283–302. doi: 10.1016/S0925-8574(00)00082-3
Simenstad C. A., Fresh K. L., and Salo E. O. (1982). “The role of Puget Sound and Washington coastal estuaries in the life history of Pacific salmon: an unappreciated function,” in Estuarine Comparisons. Ed. Kennedy V. S. (Academic Press, New York), 343–364.
Simenstad C. A., Ramirez M., Burke J., Logsdon M., Shipman H., Tanner C., et al. (2011). Historical change of Puget Sound shorelines: Puget Sound nearshore ecosystem project change analysis. Puget Sound nearshore ecosystem restoration project report. No. 2011-01. Published by Washington Department of Fish and Wildlife, Olympia, WA, and U.S. Army Corps of Engineers, Seattle, WA.
Sheaves M., Baker R., Nagelkerken I., and Connolly R. M. (2015). True value of estuarine and coastal nurseries for fish: incorporating complexity and dynamics. Estuaries Coasts 38, 401–414. doi: 10.1007/s12237-014-9846-x
Skagit River System Cooperative and Washington Department of Fish and Wildlife (2005). Skagit Chinook Recovery Plan (La Conner, WA: Skagit River System Cooperative). Available at: www.skagitcoop.org (Accessed May 17, 2025).
Sturrock A. M., Carlson S. M., Wikert J. D., Heyne T., Nusslé S., Merz J. E., et al. (2020). Unnatural selection of salmon life histories in a modified riverscape. Global Change Biol. 26, 1235–1247. doi: 10.1111/gcb.14896
Thorpe J. E. (1994). Salmonid fishes and the estuarine environment. Estuaries 17, 76–93. doi: 10.2307/1352336
Toft J. D., Munsch S. H., Cordell J. R., Siitari K., Hare V. C., Holycross B. M., et al. (2018). Impact of multiple stressors on juvenile fish in estuaries of the Northeast Pacific. Global Change Biol. 24, 2008–2020. doi: 10.1111/gcb.14055
Walters C. J., Collie J. S., and Webb T. (1988). Experimental designs for estimating transient responses to management disturbances. Can. J. Fish. Aquat. Sci. 45, 530–538. doi: 10.1139/f88-062
Whitfield A. K. (2020). Littoral habitats as major nursery areas for fish species in estuaries: a reinforcement of the reduced predation paradigm. Mar. Ecol. Prog. Ser. 649, 219–234. doi: 10.3354/meps13459
Zimmerman M. S., Kinsel C., Beamer E., Connor E. J., and Pflug D. E. (2015). Abundance, survival, and life history strategies of juvenile Chinook salmon in the Skagit River, Washington. Trans. Am. Fish. Soc. 144, 627–641. doi: 10.1080/00028487.2015.1017658
Keywords: habitat restoration, tidal wetlands, estuary, Chinook salmon, demographics
Citation: Greene CM, Beamer EM, Munsch SH, Chamberlin JW, LeMoine MT and Anderson JH (2025) Population responses of Chinook salmon to two decades of restoration of estuary nursery habitat. Front. Mar. Sci. 12:1584913. doi: 10.3389/fmars.2025.1584913
Received: 28 February 2025; Accepted: 05 May 2025;
Published: 03 June 2025.
Edited by:
Bernardo Antonio Perez Da Gama, Fluminense Federal University, BrazilReviewed by:
Aaron David, King County Water and Land Resources Division, United StatesMatthew Corsi, Idaho Department of Fish and Game (IDFG), United States
Copyright © 2025 Greene, Beamer, Munsch, Chamberlin, LeMoine and Anderson. This is an open-access article distributed under the terms of the Creative Commons Attribution License (CC BY). The use, distribution or reproduction in other forums is permitted, provided the original author(s) and the copyright owner(s) are credited and that the original publication in this journal is cited, in accordance with accepted academic practice. No use, distribution or reproduction is permitted which does not comply with these terms.
*Correspondence: Correigh M. Greene, Y2dyZWVuZUBza2FnaXRjb29wLm9yZw==
†Present address: Correigh M. Greene, Skagit River System Cooperative, LaConner, WA, United States