Abstract
Bedforms in macrotidal estuaries and deltas are distinguished from those in rivers and oceans due to the tidally-driven water depth variations and the varying hydrodynamic processes resulting from the interaction between tidal and fluvial flows. The relations between hydrodynamics, sediment transport, and bedform morphology in these estuaries are complex, but research on the morphodynamics of bedforms in such environments is still lacking. This study explores the morphodynamic development patterns of multiscale bedforms in mountainous estuaries and tidal deltas, using the Minjiang Estuary as a representative case. Field observations were conducted in the Minjiang Estuary in the East China Sea in December 2021 (dry season) and August 2023 (flood season) using a multibeam echosounder system and an Acoustic Doppler Current Profiler (ADCP). Bedform presence and characteristics were calculated from bed elevation data. The results indicate that bedforms are widely developed from the underwater delta plain to the delta front channel of the Minjiang Estuary, with large compound bedforms being prevalent. Both primary and secondary bedforms coexist, with wavelengths ranging from 2 to 233 meters and heights from 0.1 to 6 meters. About 60% of primary bedforms exhibit ebb asymmetry, indicating ebb-directed sediment transport in the main channel. The average flood/ebb lee side angle is 6°, with an average maximum angle of 19°. The maximum side angle of primary bedforms is observed to be on average greater than that of secondary bedforms. Water depth and riverbed slope significantly affect bedform density, with non-sloping riverbeds favoring bedform development. Variations in bed shear stress throughout the tidal cycle drive differences in bedform size and morphology. High clay content in surface sediments correlates with lower bedform density, indicating fine-grained materials may inhibit bedform development. This study highlights a feedback mechanism where structural geology shapes channel morphology, influencing energy distribution and bedform evolution. The findings enhance our understanding of sediment transport and hydrodynamic processes in macrotidal estuaries, offering insights for estuarine management and conservation. Future research should explore how seasonal and tidal variations influence bedform evolution to refine models of estuarine dynamics.
1 Introduction
Fluid activity over mobile surfaces typically generates bedforms (e. g. ripples, dunes, and antidunes). On Earth, bedforms are present in a variety of environments, including deserts, rivers, estuaries, continental shelves, deep oceans, volcanic regions, and glaciers (Cheng et al., 2004a; Cisneros et al., 2020; Herrling et al., 2021; Lämmel et al., 2018; Vittori and Blondeaux, 2022; Vriend and Jarvis, 2018; Zheng et al., 2017). They have also been observed in extraterrestrial environments, such as Mars and Venus (Claudin and Andreotti, 2006; Davis et al., 2020; Hansen et al., 2011; Jackson et al., 2015; Liu et al., 2023a).
For decades, marine and fluvial bedforms have been a key focus of both applied and fundamental research, due to their central role in the complex interactions of geomorphology, fluid dynamics and sediment movement (Lefebvre and Winter, 2021; Ma et al., 2022; Van Landeghem et al., 2009). Bedforms reflect the intensity and pathways of sediment transport, influence the overlying water flow, and interact with hydrodynamic and sediment transport processes. Theoretical research on bedform development has important applications for predicting modern river evolution and reconstructing environmental changes on both Earth and other planets. These theories are used to manage rivers and coastal areas (Bradley and Venditti, 2017; Couldrey et al., 2020; Duran Vinent et al., 2019; Wu and Cheng, 2022).
Hydrodynamics in estuaries vary strongly in space and time due to the influence of seasonal runoff fluctuations, flood and ebb tides, spring and neap tides, and tidal wave deformation. The interaction between hydrodynamics, sediment transport, and bedform morphology in estuaries is therefore complex (Cheng et al., 2022; Ernstsen et al., 2006; Lefebvre et al., 2021; Zheng et al., 2016). Similar to large river bedforms, estuarine bedforms and their orientation relative to flow may control flow separation and turbulent wake zones, which ultimately affect bed roughness (de Lange et al., 2024; Lefebvre, 2019; Lefebvre et al., 2014). However, there are distinct morphological differences between estuarine and fluvial dunes (Lefebvre et al., 2021; Prokocki et al., 2022). The shape of fluvial bedforms have steeper slope towards the trough and relatively flat crests (Cisneros et al., 2020), whereas estuarine bedforms have steeper slopes close to the crest, and flat troughs (Dalrymple and Rhodes, 1995; Lefebvre et al., 2021).
The interactions between flow and bedforms in unidirectional flow environments, such as rivers and flumes, have been extensively studied (Best, 2005; Reesink et al., 2018). However, there is still limited research on the three-dimensional morphology of natural bedforms, with most studies focusing on large dunes (Lefebvre et al., 2021; Lefebvre and Cisneros, 2023; Zheng et al., 2017). Nevertheless, small secondary bedforms superimposed on larger primary dunes have been observed and studied in rivers worldwide (Cisneros et al., 2020; Galeazzi et al., 2018; Zomer and Hoitink, 2024; Zomer et al., 2021, 2023), as well as in macrotidal estuaries such as the Weser Estuary (Lefebvre et al., 2021) and the Gironde Estuary (Berne et al., 1993), where complex fluvial–tidal interactions promote the development of multiscale bedform structures. Secondary bedforms can increase hydraulic roughness and influence primary dune dynamics (Zomer and Hoitink, 2024). In tidal environment, it has been observed that secondary (superimposed) bedforms often reverse direction and maintain asymmetric alignment with the flow, while larger primary bedforms maintain a consistent orientation (Ernstsen et al., 2006). However, there remains a lack of research on the multiscale bedform dynamics in natural tidal estuaries, particularly regarding how the morphological differences between bedform scales relate to water depth, hydrodynamic forces, sediment properties and transport.
Mountainous macrotidal estuaries, such as the Minjiang Estuary (ME), experience high discharge rates, rapid flood peaks, and large tidal ranges, making them dynamic systems with high sediment fluxes. These estuaries feature a diverse range of bedform types, with frequent changes in channel morphology, and they are highly responsive to human activities (Liu et al., 2022, 2023b; Sun et al., 1983). Understanding bedform development patterns in mountainous macrotidal estuaries provides valuable insights for studying bedform evolution in tidal estuaries globally. Findings from the Minjiang Estuary, in particular, offer a natural reference for other macrotidal systems characterized by strong river-tide interactions. The observed multiscale bedform structures, along with their morphodynamic responses to combined fluvial and tidal forcing, can help inform generalized models of sediment transport in similarly energetic estuarine environments. By linking site-specific mechanisms to broader physical principles, this study advances a transferable framework for understanding bedform dynamics that is applicable beyond the local context. This enhances the broader relevance of the research for both regional estuarine management and global comparative studies of morphodynamics.
Thus, this study aims to investigate the morphodynamics characteristics of multiscale bedforms in a mountainous macrotidal estuary. In particular, the study examines the variation of bedform characteristics across different scales along the estuary and between the flood and dry seasons. Based on this, taking the ME as a representative, this study focuses on the following three questions: (1) How do the developments of multiscale bedform morphologies vary spatially along the estuary due to the interplay between riverine and tidal flows? (2) Are changes in multiscale bedform morphology related to water depth, hydrodynamics, sediment transport, and sediment grain size? (3) How do the morphologies of bedforms at different scales change in such estuaries during the flood and dry seasons?
2 Materials and methods
2.1 Study area
The Minjiang River Basin is located in Southeast China (116°23’~119°35’ E, 25°23’~28°16’ N) with a catchment area of 60,992 km² and a total length of 541 km (Figures 1A, B). The lower reaches of the Minjiang River begin at Shuikou Dam, spanning 117 km (Figure 1C). Below the Tingjiang, the river splits into the Changmen and Meihua waterways, and the Changmen Waterway further subdivides into four secondary channels: Wuzhu, Yundou, Chuanshi, and Hujiang. This creates a complex network of rivers that lead the waters into the East China Sea through five mouths (Figure 1D). Among these, the Chuanshi Waterway is the main channel of the Minjiang Estuary. The ME is fundamentally characterized as a tide-controlled delta (Wang et al., 2024; Boyd et al., 1992; Galloway, 1975). Based on the underwater topography and sediment characteristics, the underwater delta of the ME can be divided into three subgeomorphic zones, extending from the estuarine to the offshore region: the delta plain, the delta front, and the prodelta. These zones roughly correspond to the regions from Tingjiang to Changmen/Tantou, from Changmen/Tantou to the 10-meter isobath offshore, and between the 10- and 15-meter isobaths. During periods of low water and spring tides, the tidal limit can extend to Houguan, which is 68 km away from the river mouth (Zheng, 1989). The average tidal range measured at Meihua Station is 4.46 meters (Lin, 1986). The water level and tidal currents follow a regular semi-diurnal pattern. Additionally, the main channel of ME can be classified as partially mixed, yet it exhibits a highly stratified pattern during the flood season (Jin and Sun, 1992). The freshwater-saltwater interface can extend up to the vicinity of Mawei during low water and spring tides (Yu, 1992). The region extending from Houguan downstream to the mouth of the river can therefore be classified as an estuarine zone, where hydrodynamics and sediment dynamics are influenced by both river and tidal processes.
Figure 1
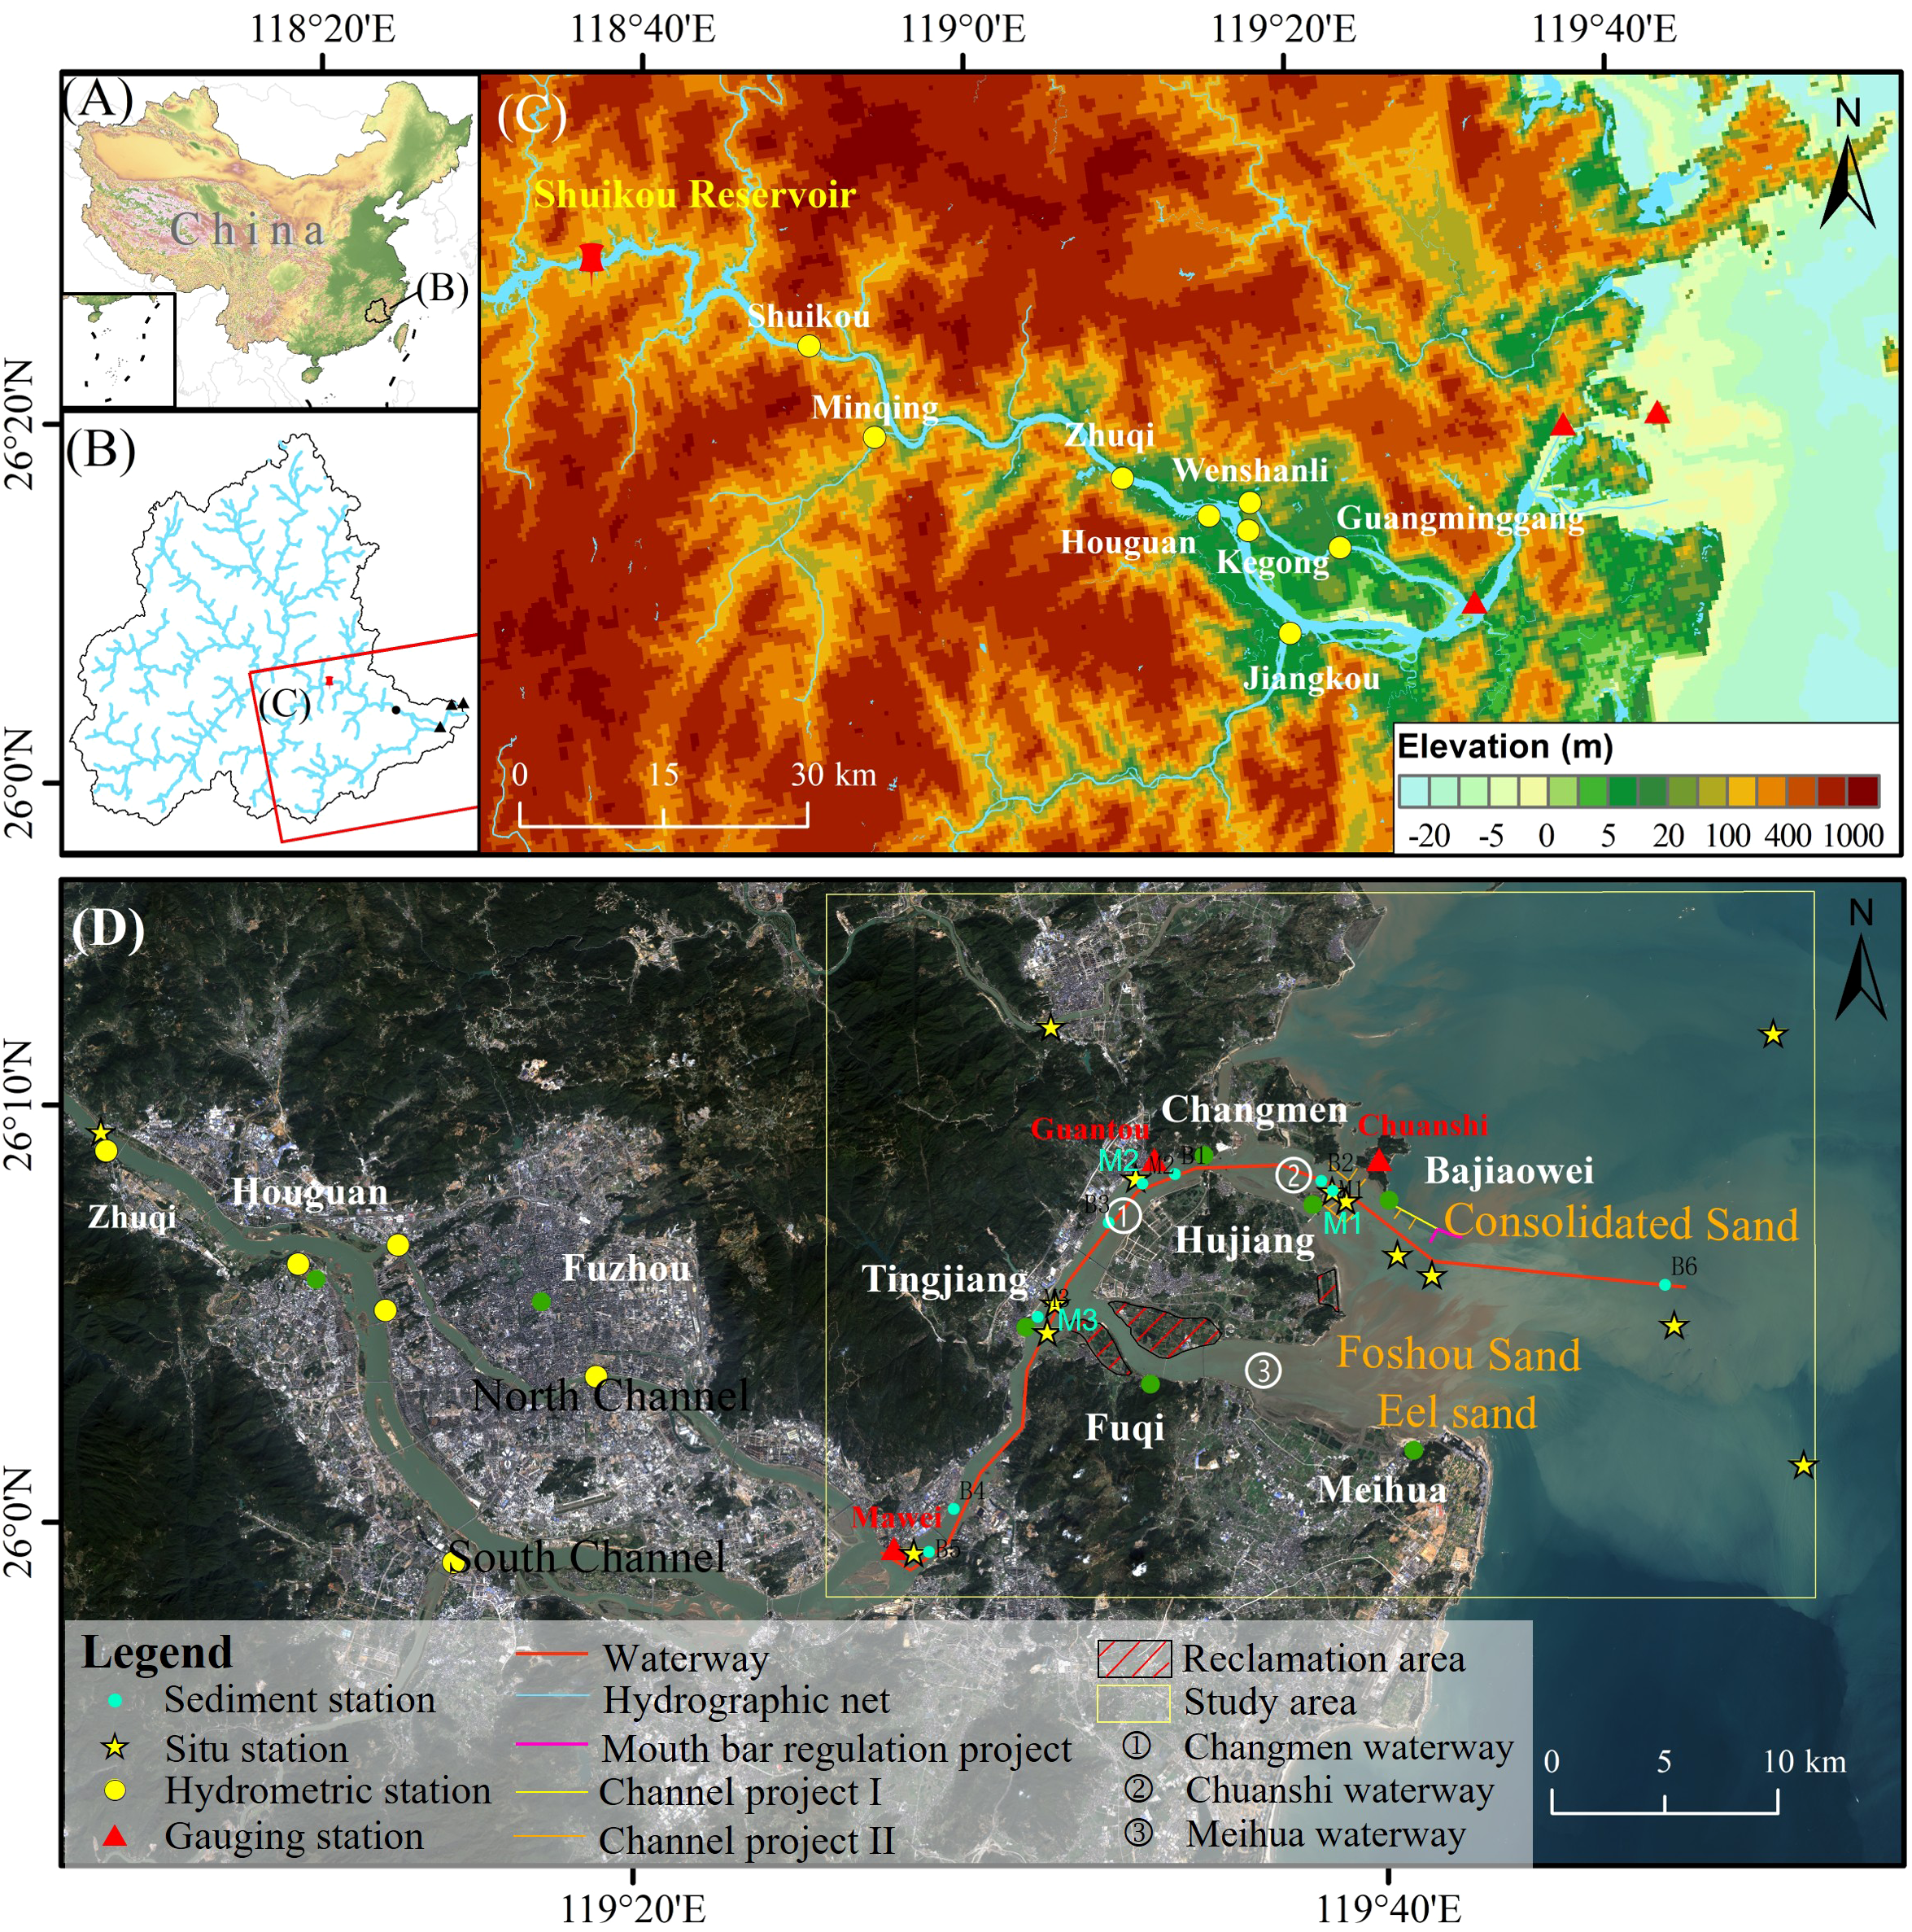
Location of the study area. (A) Location of the Minjiang River Basin, (B) River system of the Minjiang River Basin, (C) Topography of the Minjiang River, (D) Location of the ME.
The Minjiang Basin is predominantly mountainous, and the river sediment transport exhibits distinct seasonal variations (Figure 1C). However, overall suspended sediment concentrations remain low, classifying the river as a water-abundant but sediment-deficient system. The average annual suspended sediment concentration is 0.14 kg/m³ (Chen et al., 1998). At the Zhuqi Station, the mean grain size of suspended sediment over many years has been 0.046 mm (4.44φ), while the median grain size of bed-surface sediment from Zhuqi to the estuary ranges from 0.39 to 0.56 mm (1.36~0.84φ) (Liu et al., 2001). The average annual suspended sediment load is 7.155 million tons, with more than 80% of this transported during the flood season (April to September) and less than 10% during the dry season (October to March) (Zhu, 1991). It is estimated that the bedload sediment transport in the ME is ten times the amount of suspended sediment. The bedload carried by river flow forms the primary material basis for the development of the estuary underwater bedforms (Li et al., 2008). In contrast, the suspended sediment primarily passes through the estuary and disperses offshore, becoming the main source of material for the delta front slope and the prodelta (Liu et al., 2001). The construction of the Shuikou Dam in 1996 resulted in the retention of 86% of the upstream bedload and 48% of the suspended sediment (Ye, 2000), significantly impacting the sediment dynamics and depositional processes of the ME.
2.2 Field measurements
Field observations were carried out in the Minjiang Estuary, East China Sea, in December 2021 (dry season, Figures 2A, C) and August 2023 (flood season, Figures 2B, D-G). A Seabat 7125 multibeam echo sounder (MBES) was utilized to measure bathymetry along the main waterway between Minjiang-km 0.0 and 48 km, with a lateral range of 50 to 150 m (Figures 2A, B). The measured water depths ranged from 5 to 50 m, with a theoretical depth resolution of 6 mm. Positioning accuracy was achieved at the centimeter scale using Continuously Operating Reference Stations (CORS). To ensure data uniformity, an equidistant collection mode was employed in the acquisition module of the Teledyne PDS control center. After considering and analyzing these factors, the mapping resolution was set at 0.5 × 0.5 m. All geo-referenced images are displayed using the UTM 50N projection within the WGS1984 geographic coordinate system. The benchmark for multibeam bathymetric elevation is the WGS84 ellipsoid. In-situ water velocity data were collected using an Acoustic Doppler Current Profiler (ADCP) operating at 600 kHz, mounted on the side of the boat with a steel fixing frame, and integrated with the WinRiver II (RDI) software package. The vertical resolution of the ADCP was set to 0.5 m and a ping rate of 2 Hz was used. The ADCP has a velocity range of ±3.0 m/s. Vertical data collection was conducted continuously along the main waterway between Minjiang-km 0.0 and 48 km. Vertical profiles of water velocity and suspended sediment concentration (SSC) were continuously monitored over a 14 h period at 3 in-situ stations (M1–M3 in Figure 1D) during the spring tide period of the flood season. The characteristics of the bed-surface sediment were determined from samples (2 mm layer) taken along the main channel of the ME using a box dredger. A total of 9 bed-surface sediment samples and 72 suspended sediment samples collected in August 2023 were analyzed. The particle size distributions were determined using a laser particle size analyzers (Microtrac Cmasizer X2, Coulter LS13320) in the laboratory. Suspended sediments in the dry season of 2021 were measured by LISST 200X. Sediment types were classified using the classification schemes of Blair and McPherson (1999) and Folk (1954).
Figure 2
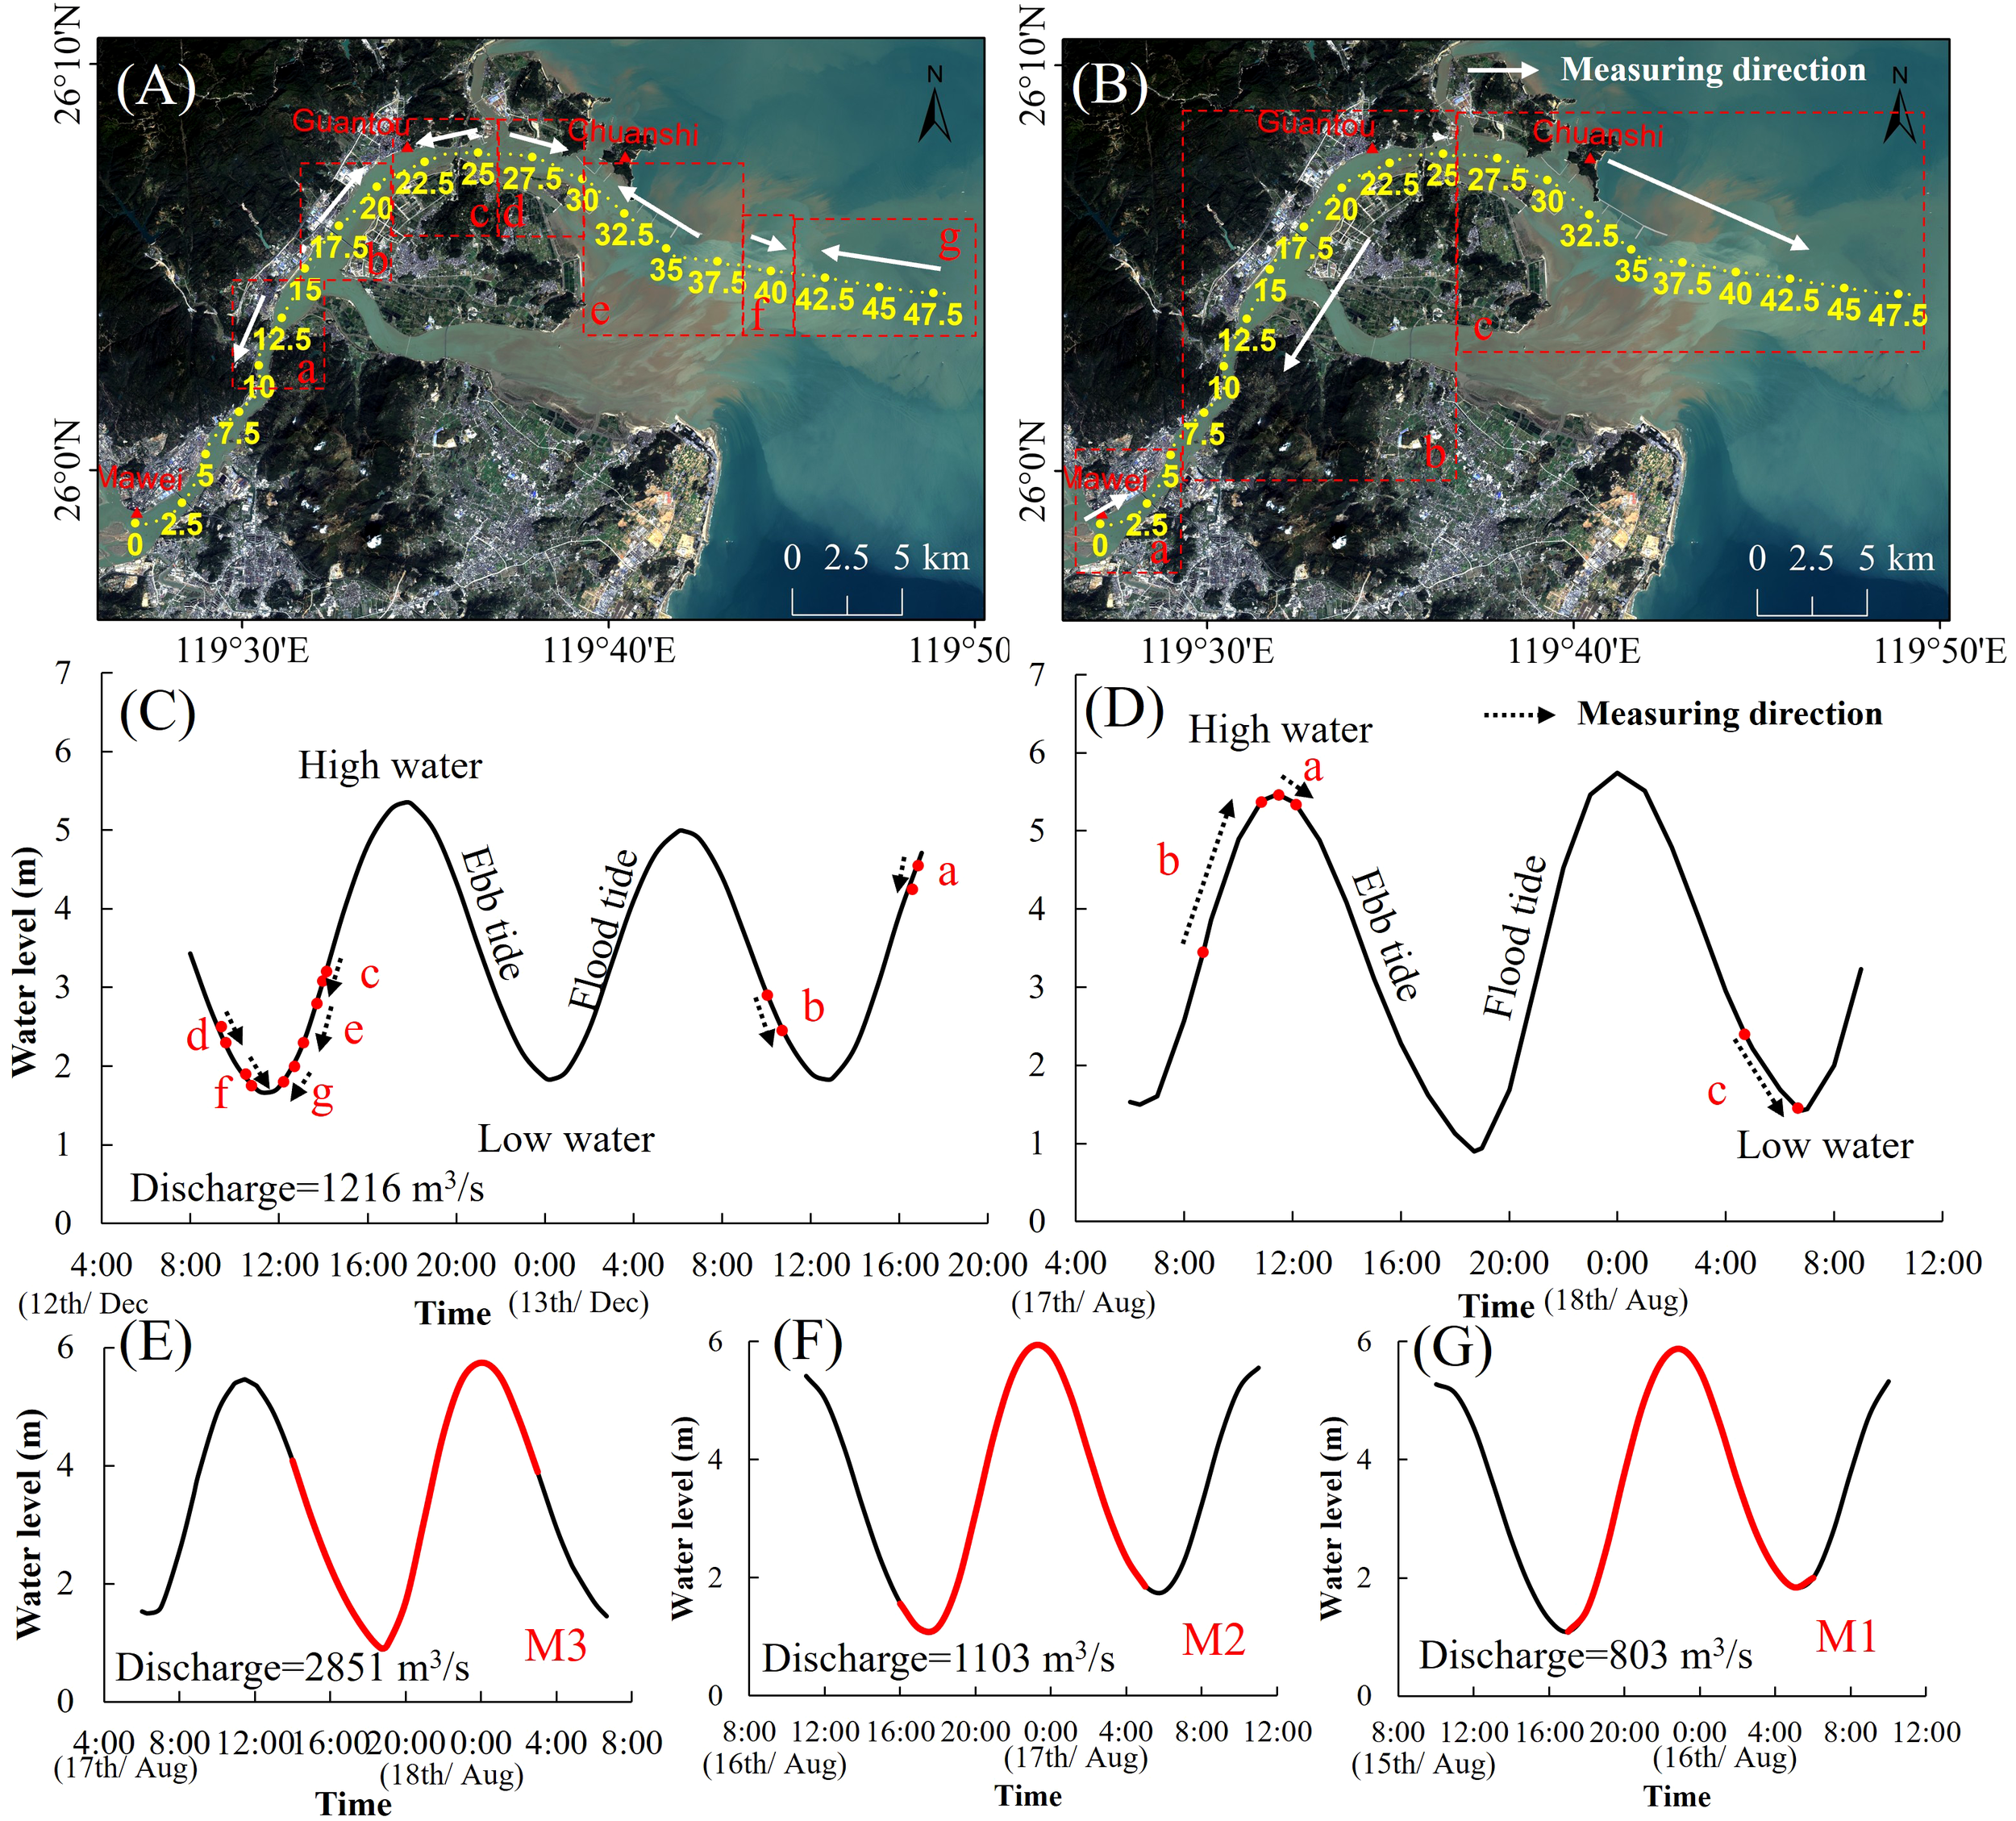
Field observations of the ME and times of the MBES and ADCP surveys during the tidal cycle on 12~13 December 2021 (A, C) and 15~18 August 2023 (B, D-G). The locations of stations M1–M3 are shown in Figure 1D, and the red lines in panels E–G represent the 14-h ADCP measurement period. The water levels represent those from the mean lower low water (MLLW) level at the Guantou tide station in the Minjiang Estuary, with the reference level located 3.25 m below mean sea level.
2.3 Data processing
The MBES bathymetric point cloud data from field observations were preprocessed for subsequent automated bedform detection. Firstly, the data were interpolated onto a custom-designed curvilinear grid created specifically for this study. The grid centerline follows the main channel of the Minjiang River, which corresponds to the primary survey line of the field survey vessel. The channel centerline was interpolated at regular intervals of 0.5 meters in the longitudinal (along-channel) direction, and in the cross-stream direction, points perpendicular to the channel were also generated at 0.5-meter intervals, resulting in a spatial resolution of 0.5 m × 0.5 m. Then, the preprocessed MBES bathymetric point cloud data were input to retrieve the depth data corresponding to the points on the curvilinear grid.
Based on field observations, which revealed the presence of abundant multiscale bedforms in the Minjiang Estuary, this study detected the multiscale bedforms and extracted morphological parameters across different scales to analyze their characteristics and developmental patterns. Firstly, the MBES data were decomposed by elevation profiles into signals representing secondary bedforms, primary bedform and the underlying bed morphology. Subsequently, a zero-crossing detection algorithm (van der Mark and Blom, 2007) was applied to identify both primary and secondary bedforms, and the characteristic parameters of the bedforms at different scales were obtained primarily based on Lefebvre et al. (2021). These included bedform length and height, the height and length of the ebb and flood lee sides, bedform asymmetry (ratio of flood lee side length to total bedform length), mean and maximum angles of the ebb and flood lee sides, the horizontal and vertical positions of the maximum angle on the flood and ebb lee sides, the presence and position of ebb and flood steep faces, bedform density, crestline density, and steep face area density. Primary bedforms longer than 200 m or higher than 6 m, and those smaller than 10 m in length or 0.75 m in height, were excluded from the analysis. Similarly, secondary bedforms longer than 10 m or higher than 0.75 m, and those smaller than 2 m in length or 0.1 m in height, were also excluded because they were assumed to be erroneous measurements. Bedform characteristics were then averaged over 0.5 km-long sections. Finally, threshold values for bedform density were visually determined to delineate zones with and without bedforms, resulting in the final distribution map of multiscale bedform characteristics along the Minjiang Estuary. The specific processing workflow for the MBES bathymetric data is shown in Figure 3A, and examples of primary and secondary bedform detection are illustrated in Figure 3B.
Figure 3
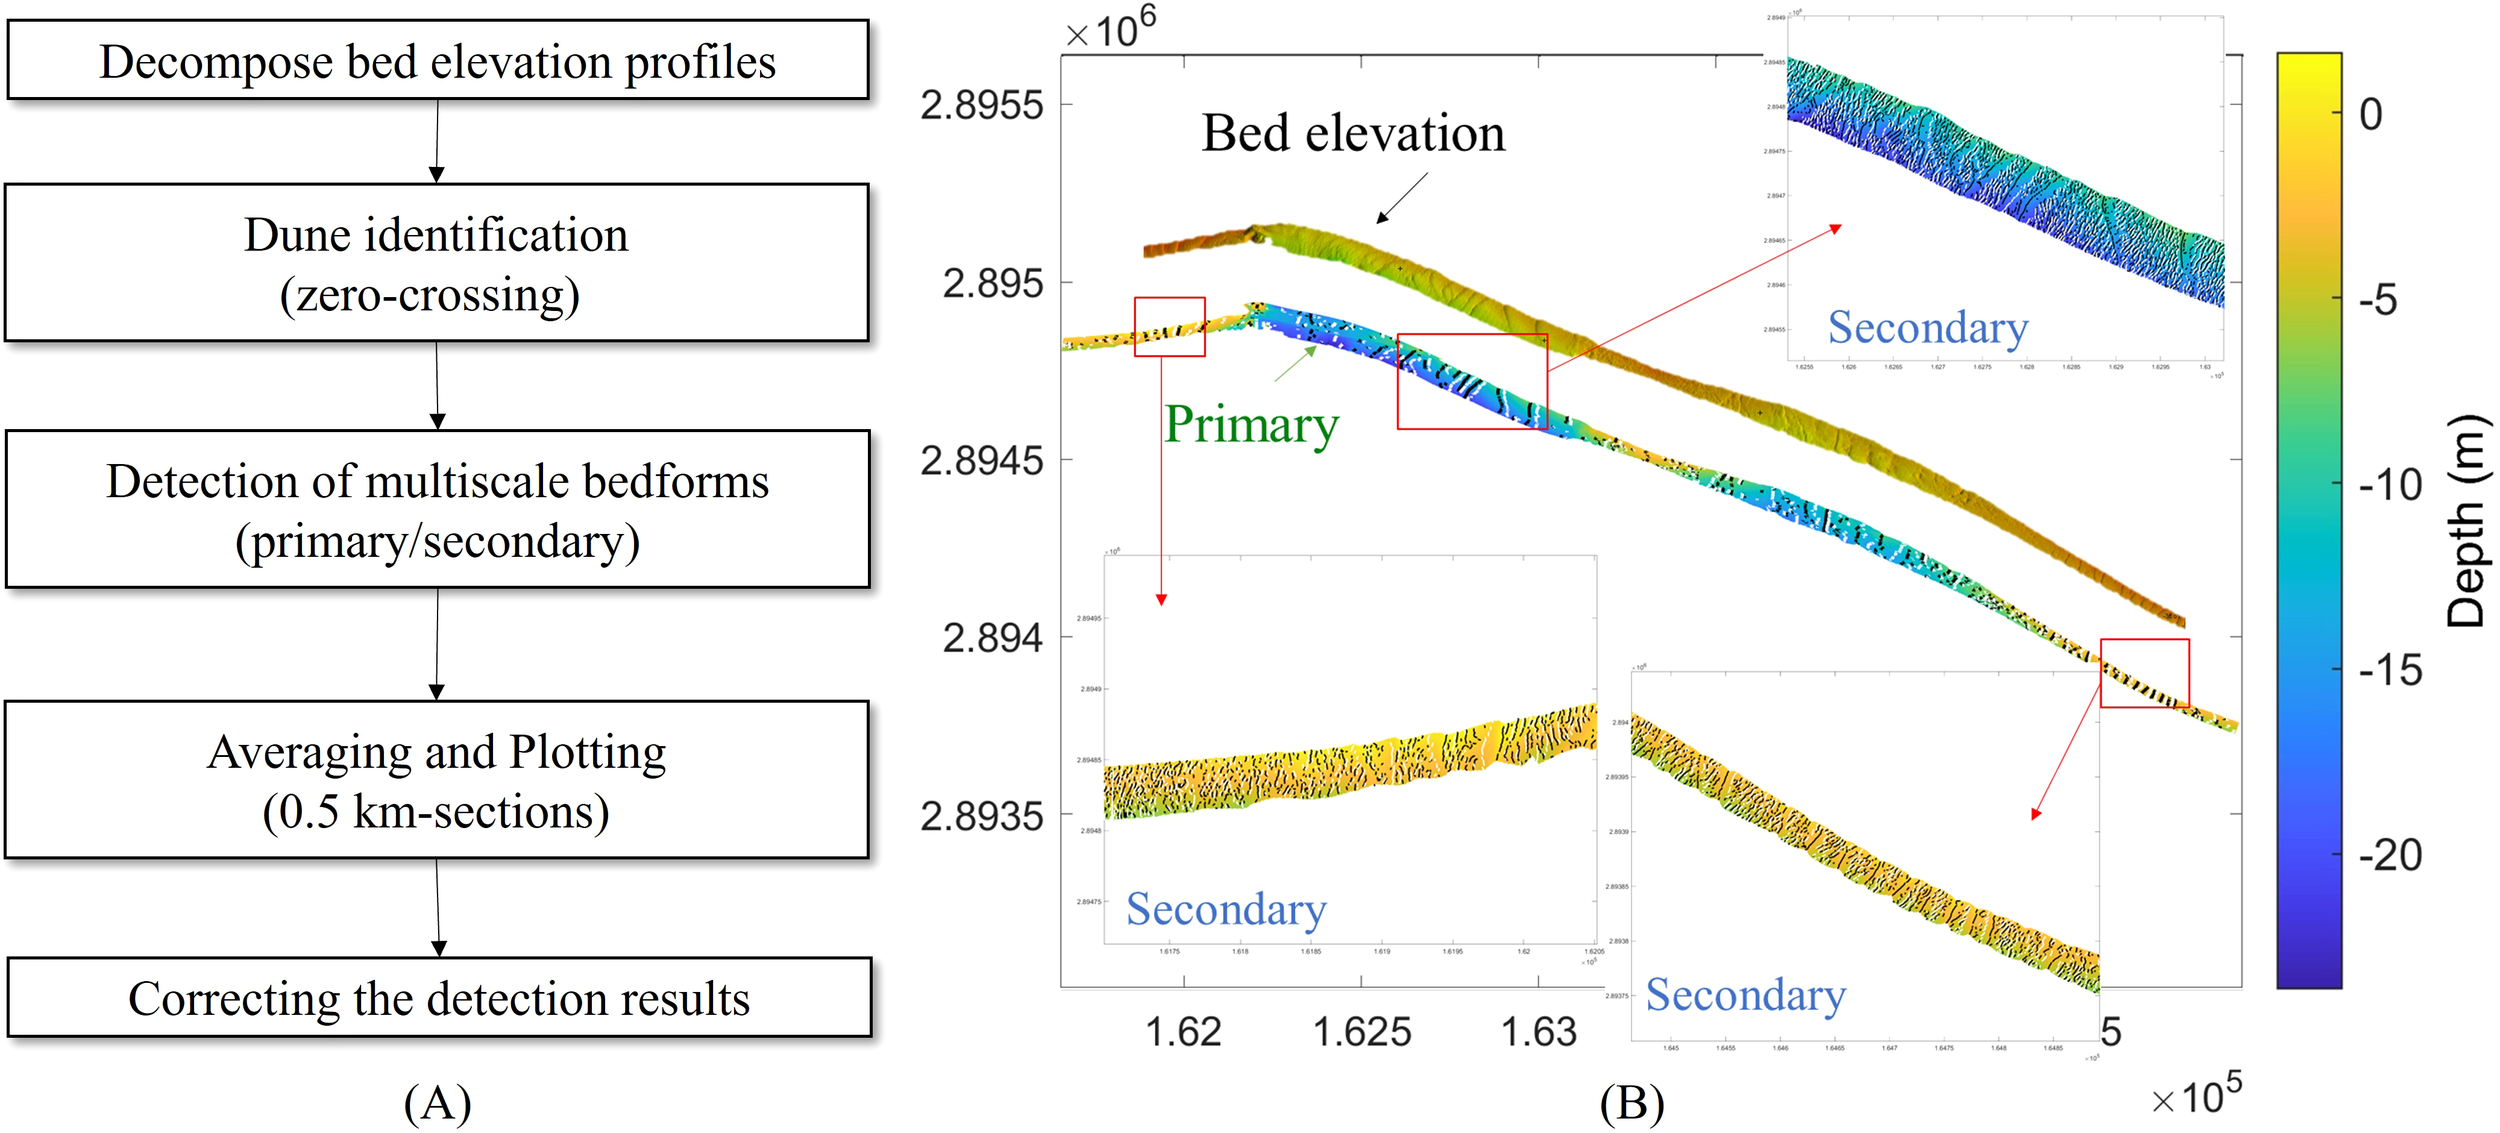
Multiscale bedform detection process (A) and detected examples of primary and secondary bedforms (B).
2.4 Bed slope
Bed slope S is a crucial parameter in describing the longitudinal topography of a river. It is typically defined as the rate of change in riverbed elevation along the direction of flow, expressed as the ratio of elevation difference to horizontal distance. Variations in bed slope can indicate the stability of the riverbed. The Minjiang Estuary, classified as a mountainous estuary, exhibits variable riverbed elevations; hence, the concept is introduced to analyze the impact of bed slope on the distribution of bedforms. In this study, the bed slope is calculated at intervals of 0.5 km along the river channel to analyze the correlation between bed slope and bedform characteristics. The calculation of bed slope S is as shown in Equation 1:
where S is the bed slope, Δh is the change in elevation, and Δx is the horizontal distance. Absolute bed slope Sa is the absolute value of bed slope S.
2.5 Parameterization of hydrodynamics and sediment transport
The parameterization of hydrodynamics and sediment transport is conducted to analyze the influencing factors of bedform morphology dynamics. Key parameters, including the bed shear stress τb, and critical bed shear stress τcr are systematically quantified to establish their roles in governing sediment transport and deposition processes.
The calculation of bed shear stress and related parameters in macrotidal estuaries requires consideration of tidal effects, unsteady flow, and non-uniform flow characteristics. Most studies assume that bedforms are in equilibrium with approximately steady and uniform flow conditions (Villard and Kostaschuk, 1998; Cheng et al., 2004b). For non-cohesive sediment particles, the bed shear stress τb is calculated using the quadratic stress law, as shown in Equation 2 (Van Rijn, 2020):
where u* is the shear velocity (m/s), ρ is the seawater density (ρ = 1030 kg/m3), U is the near-bed current velocity (m/s), and Cf is the bed friction coefficient (Soulsby, 1997), as shown in Equation 3 (Julien, 2010):
where H is the water depth (m) and D50 is the median diameter of the bed material (m).
The critical bed shear stress τcr (N/m2) is calculated by the following Equations 4–6 (Soulsby, 1997; van den Berg et al., 1993; Van Rijn, 2020):
where θcr is dimensionless critical shear stress and D* is dimensionless grain size, ρs is sediment density (2650 kg/m3), ρw is the seawater density (ρw = 1030 kg/m3), g is gravitational acceleration (g = 9.8 m/s2), and ν is the kinematic viscosity of water (ν = 1 × 10⁻⁶ m2/s).
3 Results
3.1 Development of multiscale estuarine bedform morphology
3.1.1 Multiscale bedform types
Multibeam bathymetric data collected from the main channel of the ME revealed various types of multiscale bedforms (Figure 4). From the underwater delta plain to the delta front channel of the ME, bedforms are widely developed, predominantly consisting of large compound dunes with both primary and secondary bedforms coexisting.
Figure 4
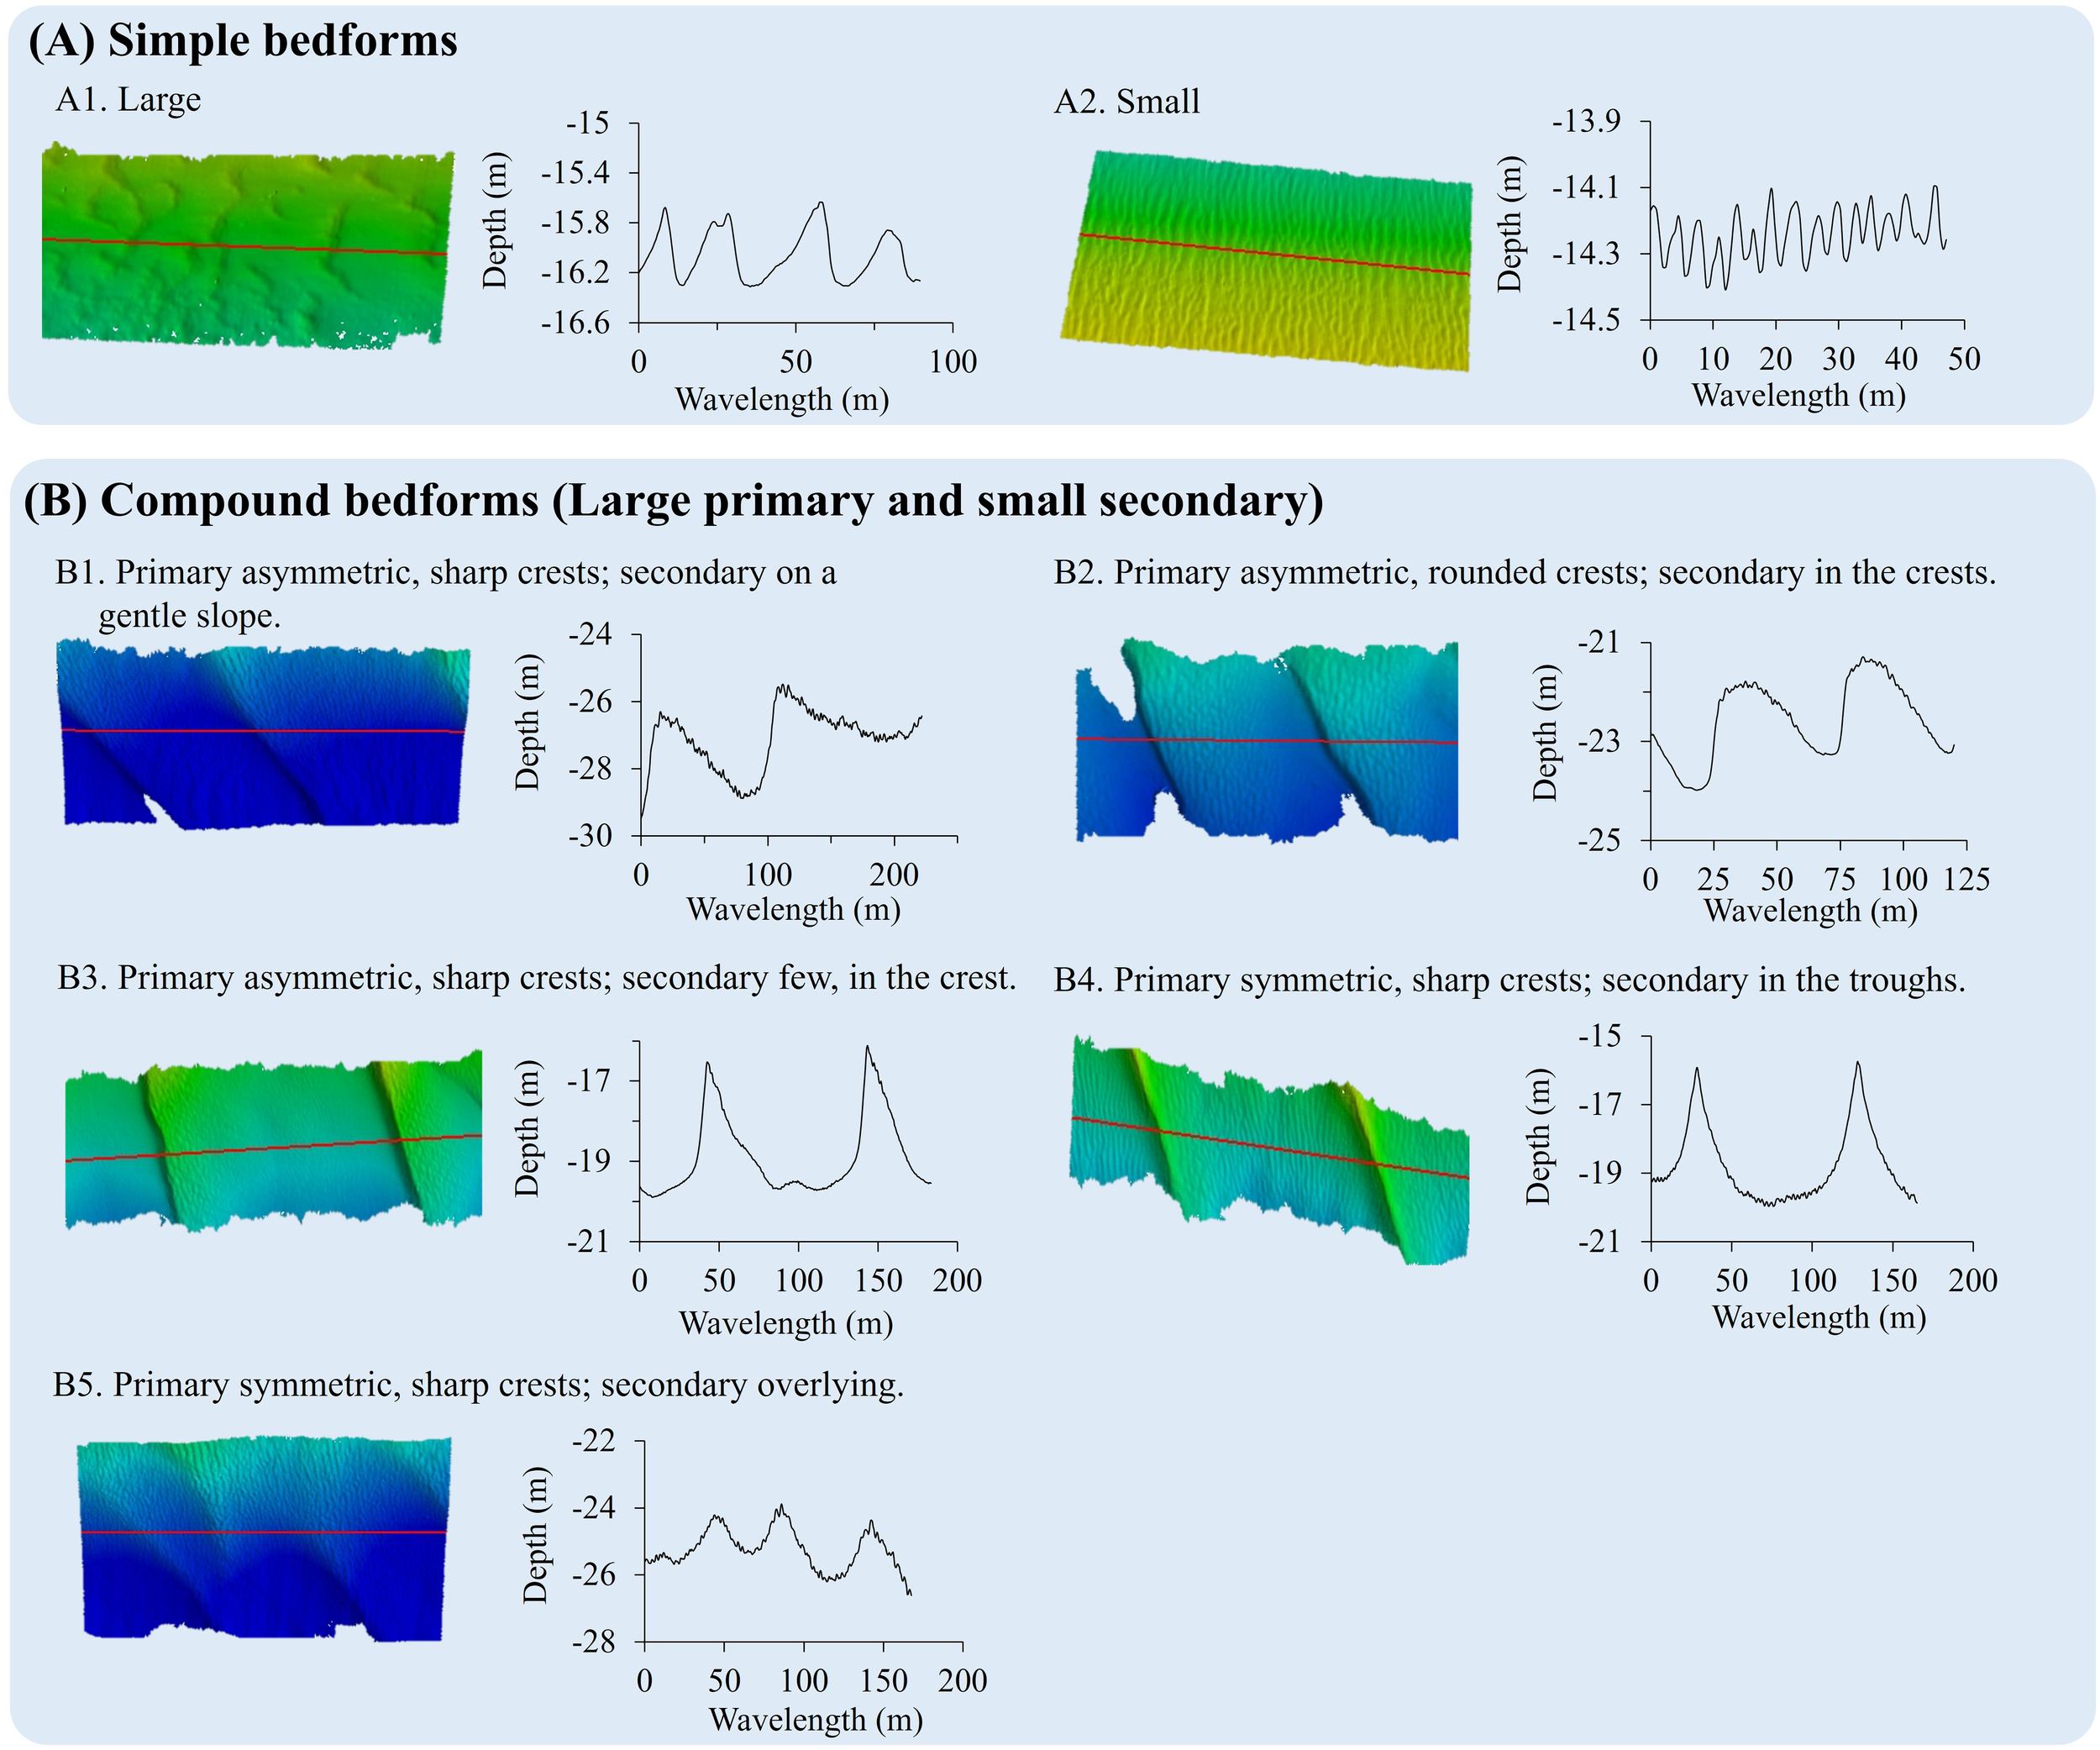
Different types of multiscale bedforms observed in the ME. Diagram showing simple and compound bedforms with topographic images and corresponding graphs. (A) Simple bedforms: A1. Large with undulating elevation profile. A2. Small with finer texture. (B) Compound bedforms (Large primary, small secondary): B1. Asymmetric sharp primary crests with secondary on slopes. B2. Asymmetric rounded primary crests with secondary at crests. B3. Asmmetric, sharp primary crests with few secondary. B4. Symmetric sharp primary crests with secondary in troughs. B5. Symmetric, sharp primary crests with secondary overlaying.
A first visual analysis shows that simple bedforms (i.e. a single bedform size, Figure 4A) are not very common and are mostly distributed near the offshore regions. Simple bedforms are primarily distributed in the Chuanshi Waterway to the outer estuary, specifically in the 30.5–35.5 km section (downstream of Hujiang Island) and the 39.5–41 km section. In the 30.5–35.5 km section, the developed simple bedforms have an average length of 50 m, a relatively small height-to-length ratio, and low-amplitude bedform morphology with evident traces of artificial dredging (Figure 4A1). In contrast, the bedforms in the 39.5–41 km section are smaller in scale, with an average length of 4 meters, a larger height-to-length ratio, and represent naturally developed bedform morphology (Figure 4A2). Large-scale compound bedforms are extensively distributed within the main channel, predominantly occurring in the upper reaches of the Hujiang. Smaller-scale compound bedforms (with lengths around 40 m) also develop near the estuary mouth. These large-scale compound bedforms exhibit a wide variety of types (Figure 4B). These bedforms are primarily categorized into asymmetric and symmetric types. The asymmetric bedforms exhibit a range of shapes, such as sharp or rounded crests, and fewer superimposed secondary bedforms (usually located near the crests on the gentle slope). Symmetric bedforms, on the other hand, include different morphologies such as minimal superimposed secondary bedforms (located in the troughs), or fully covering the primary bedforms. The development of these different bedform morphologies is likely closely related to factors such as water depth, hydrodynamics, and sediment properties.
3.1.2 Comparison of different scale bedforms
A comparison of the morphological characteristics of primary and secondary bedforms during the flood season of 2023 in the ME is presented (Figure 5; Supplementary Figures 1–3). From the trend in the crestline density of primary and secondary bedforms, it is evident that the overall trend remains consistent. Higher crestline densities of primary or secondary bedforms are observed in the 15–20 km and 30–35 km regions of the estuary. During the dry season, crestline densities are approximately 37% higher for primary bedforms and 16.5% higher for secondary bedforms compared to the flood season (Supplementary Figure 4). The primary bedforms in the main channel of the ME exhibit distinct morphological characteristics, reflecting the complex interactions between hydrodynamics and sediment transport processes (Figure 5). Primary bedforms have wavelengths ranging from 10 to 233 meters, with an average of 50 to 100 meters, and heights between 0.75 and 6 meters. The average height-to-length ratio (H/L) of the bedforms varies between 0.02 and 0.05. Most bedforms are ebb-asymmetric, with steeper lee sides facing downstream, accounting for approximately 60% of the total measured bedforms. This suggests that sediment transport during ebb tide dominates in the main channel of the ME. However, between the 15 km and 25 km sections, flood-asymmetric bedforms are more common.
Figure 5
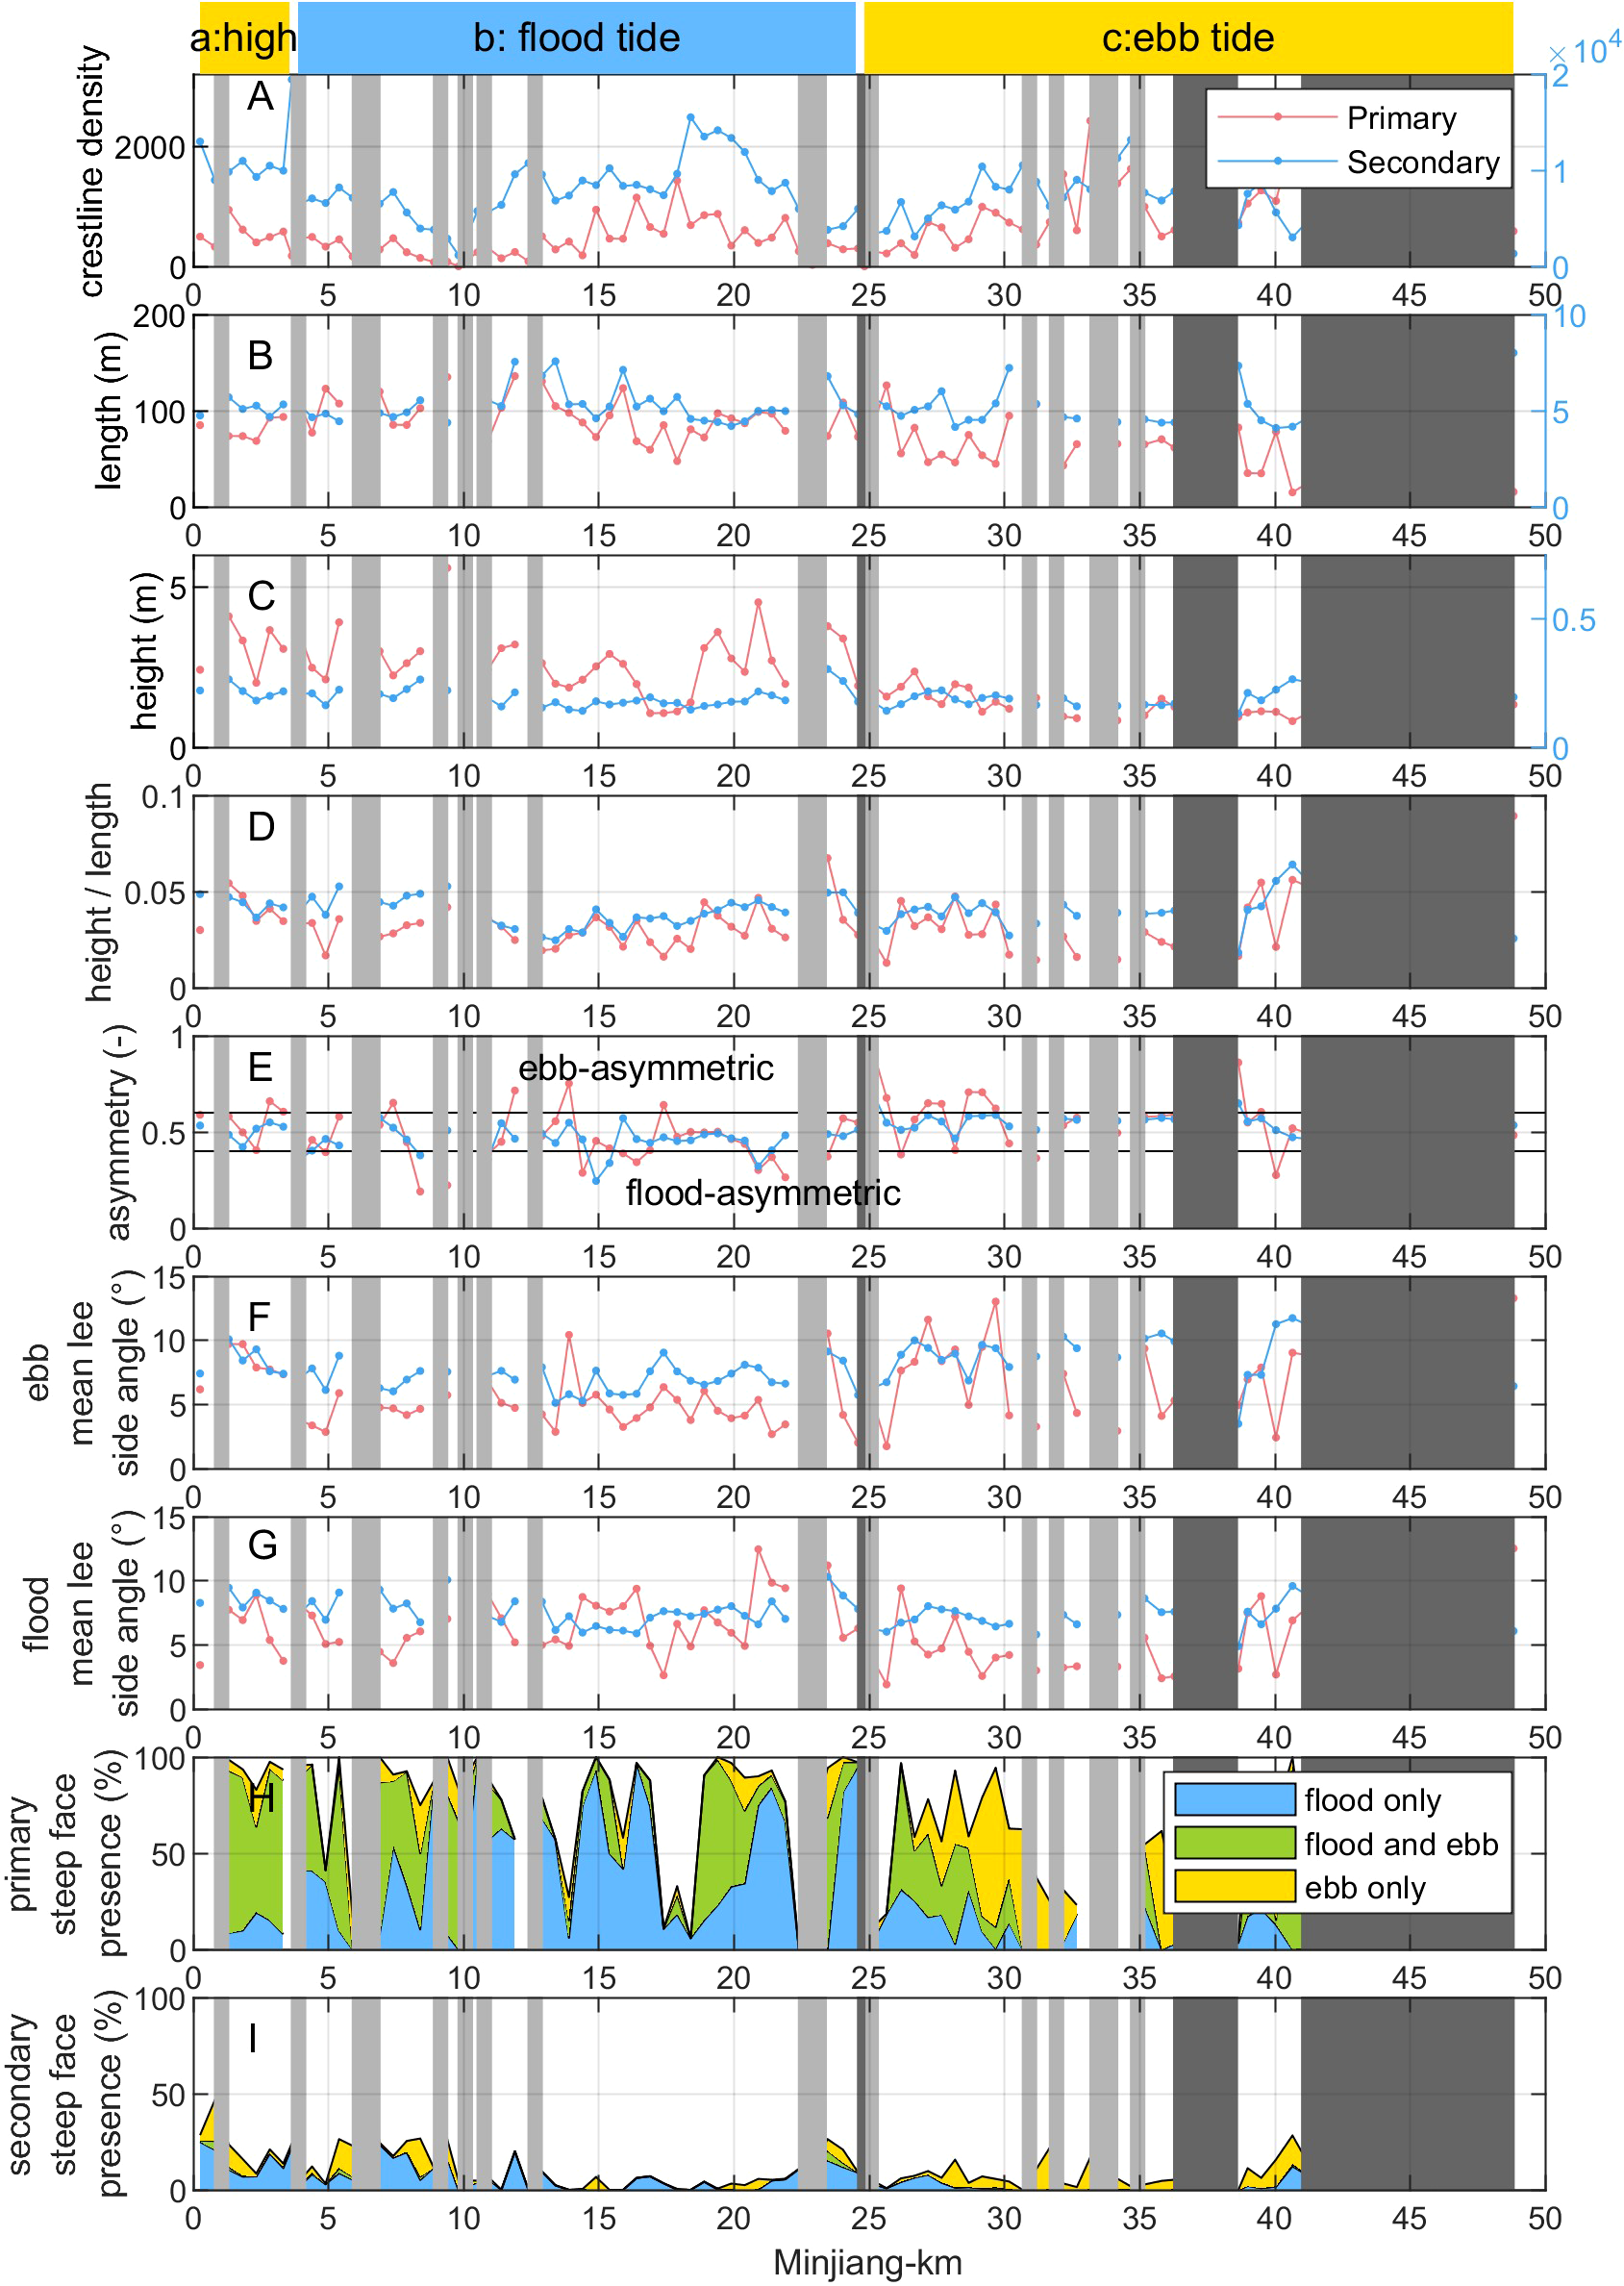
Multiscale bedform characteristics along the Minjiang Estuary, primary (red) and secondary (blue). (A) crestline density (number of crestlines per square kilometer); (B) bedform length; (C) bedform height; (D) height/length; (E) asymmetry; (F) ebb lee side mean angle; (G) flood lee side mean angle; (H) percentage of primary bedforms (compared to the total number of bedforms measured) which possess a flood steep face, an ebb steep face, or both a flood and ebb steep face; (I) percentage of secondary bedforms (compared to the total number of bedforms measured) which possess a flood steep face, an ebb steep face, or both a flood and ebb steep face. The light grey and dark grey areas on all plots represent areas with only few bedform (BEP bedform density < 300 bedforms/km2) and without data, respectively.
Compared to primary dunes, secondary bedforms have shorter wavelengths and heights, with wavelengths ranging from 2 to 10 meters and heights between 0.1 and 0.5 meters. The height-to-length ratio (H/L) for the secondary bedforms varies around 0.05. The height-to-length ratio (H/L) of secondary bedforms is less variable and slightly higher than for primary bedforms, indicating that secondary bedforms are steeper than primary bedforms. Such morphological differences enhance the impact of secondary bedforms on local water flow, and is likely to increase bed roughness and inducing localized turbulence.
These secondary bedforms show pronounced asymmetry. Flood-oriented forms are predominant in the section surveyed during the flood phase (0–25 km section), whereas ebb-oriented bedforms dominate the section surveyed during the ebb phase (25–40 km section). It is therefore observed that the asymmetry of the secondary bedforms was always oriented in the flow direction during measurement, indicating that secondary bedform asymmetry changes during the tidal cycle to align with flow direction. This suggests that secondary bedforms respond more frequently and rapidly to short-term tidal changes, directly affecting sediment transport. In contrast, the asymmetry of primary bedforms does not align consistently with the tidal flow direction, and they are generally ebb-asymmetric.
A comparison of the average slope angles between primary and secondary bedforms reveals distinct morphological differences. Secondary bedforms generally exhibit steeper average slopes (approximately 8°), whereas primary bedforms consistently show lower average slope angles (around 6°). However, the maximum lee side angle of primary bedforms exceeds that of secondary bedforms. For example, in Section B (the river section above 25 km), during flood tide, the maximum lee side angle of primary bedforms reaches 19°, significantly greater than the 11° observed in secondary bedforms.
3.2 Characteristics of estuarine bedforms during flood & dry seasons
The comparison of primary bedform characteristics between the flood and dry seasons reveals that, overall, the primary bedform characteristics along the main channel are relatively similar between the two seasons, with only minor differences in local areas (Figure 6). The spatial variation characteristics such as bedform density, wavelength, height, height-to-length ratio, asymmetry, and average lee side angle are essentially consistent. In the 15–22 km section, the differences in bedform characteristics between the flood and dry seasons are more pronounced. During the flood season, bedform heights and height-to-length ratios are greater than those in the dry season. The ebb mean lee side angle is smaller than in the dry season, while the flood mean lee side angle is larger. Additionally, bedforms in the dry season exhibit more pronounced flood asymmetry. Specifically, in the 18–20 km area, the probability of simultaneous occurrence of flood and ebb steep faces is high during the flood season, while in the dry season, the flood steep face predominates; in the 20–22 km area, the probability of flood steep faces is high during the flood season, while in the dry season, the probability of steep faces is low, and the flood lee side slope angle is larger than in the dry season.
Figure 6
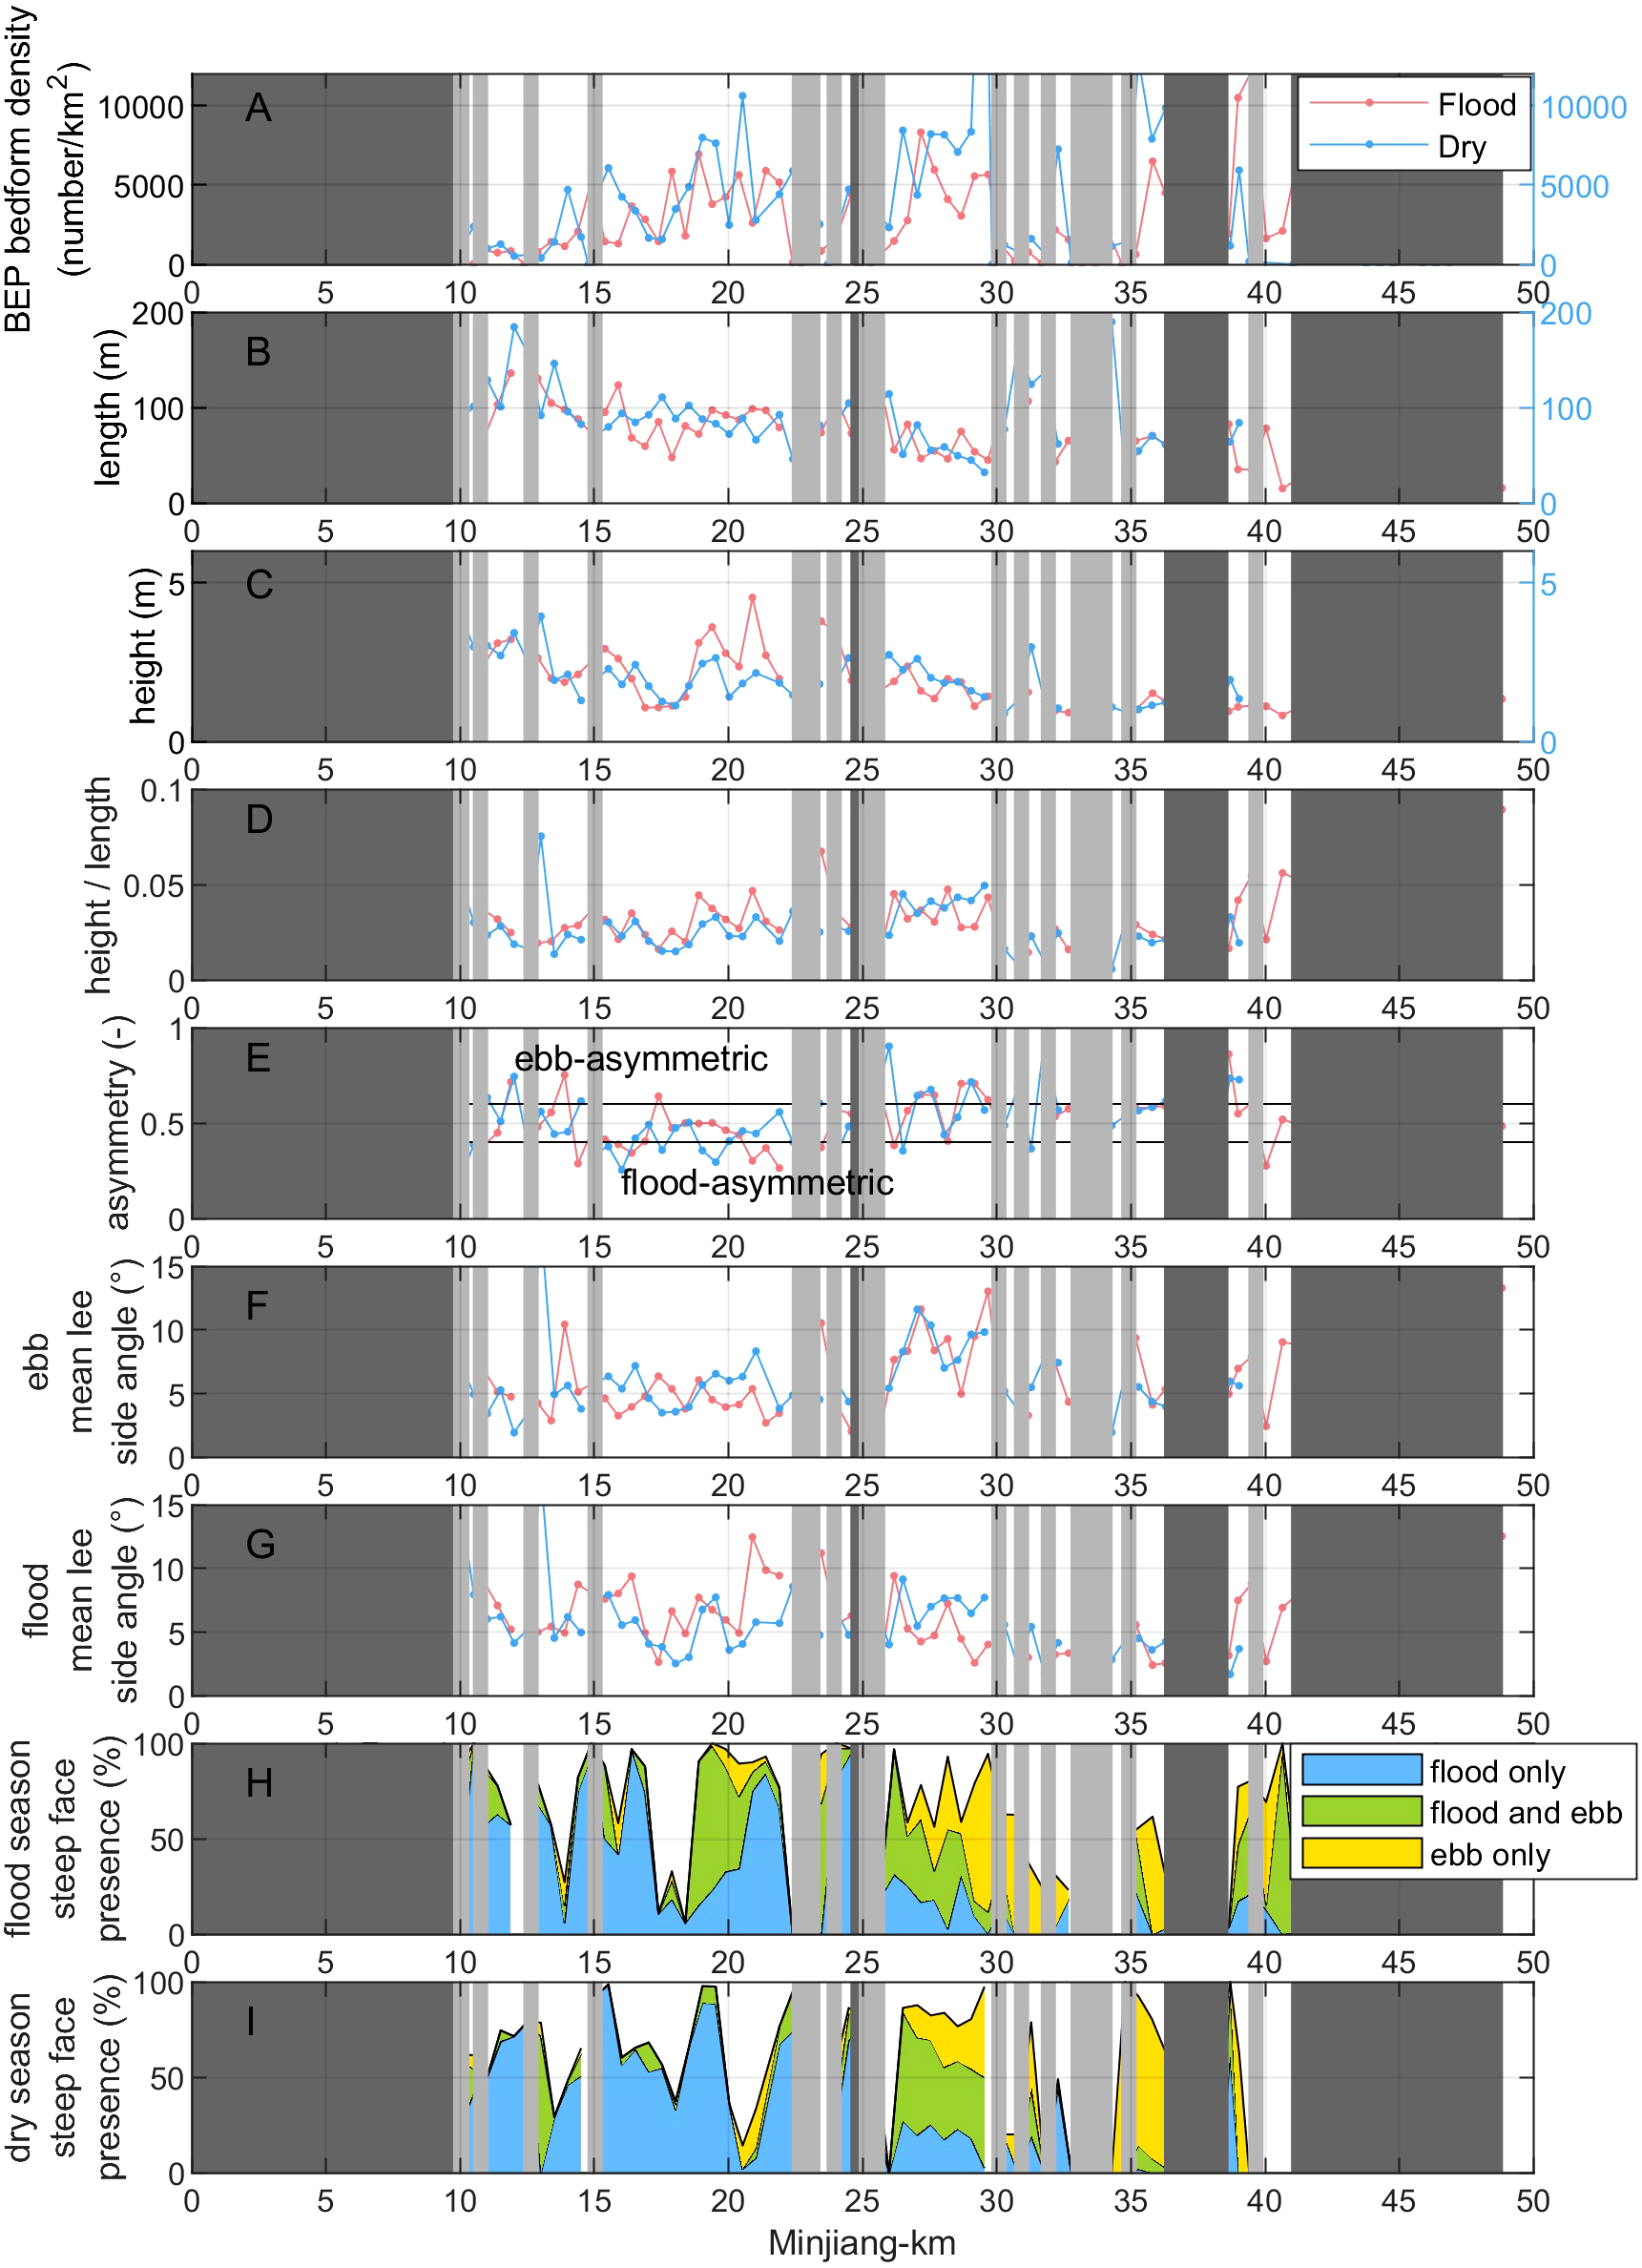
Primary bedform characteristics along the ME in the flood (red) and dry (blue) season. (A) BEP bedform density (number of bedforms per square kilometer); (B) bedform length; (C) bedform height; (D) height/length; (E) asymmetry; (F) ebb lee side mean angle; (G) flood lee side mean angle; (H) percentage of bedforms in flood season (compared to the total number of bedforms measured) which possess a flood steep face, an ebb steep face, or both a flood and ebb steep face; (I) percentage of bedforms in dry season (compared to the total number of bedforms measured) which possess a flood steep face, an ebb steep face, or both a flood and ebb steep face. The light grey and dark grey areas on all plots represent areas with only few bedform (BEP bedform density < 300 bedforms/km2) and without data, respectively.
3.3 Factors affecting the morphology of multiscale estuarine bedforms
3.3.1 Water depth
The results allow to analyze the relation between water depth and the morphological characteristics of bedforms of different scales (Figure 7). The height and length of primary bedforms show an increasing trend with increasing water depth, while the trend for secondary bedforms is less pronounced. The height-to-length ratio (H/L) of both primary (0.032) and secondary bedforms (0.041) remains relatively constant across the range of water depths, though secondary bedforms tend to have a slightly higher H/L ratio, indicating that they are steeper than the primary bedforms (Figures 7A–C). Bedform density decreases with increasing water depth, and both primary and secondary bedforms reach peak densities when bed slope S is low, but densities significantly decrease when slope is high. This suggests that relatively non-sloping riverbeds favor the development of both primary and secondary bedforms in this estuarine environment (Figures 7D–F).
Figure 7
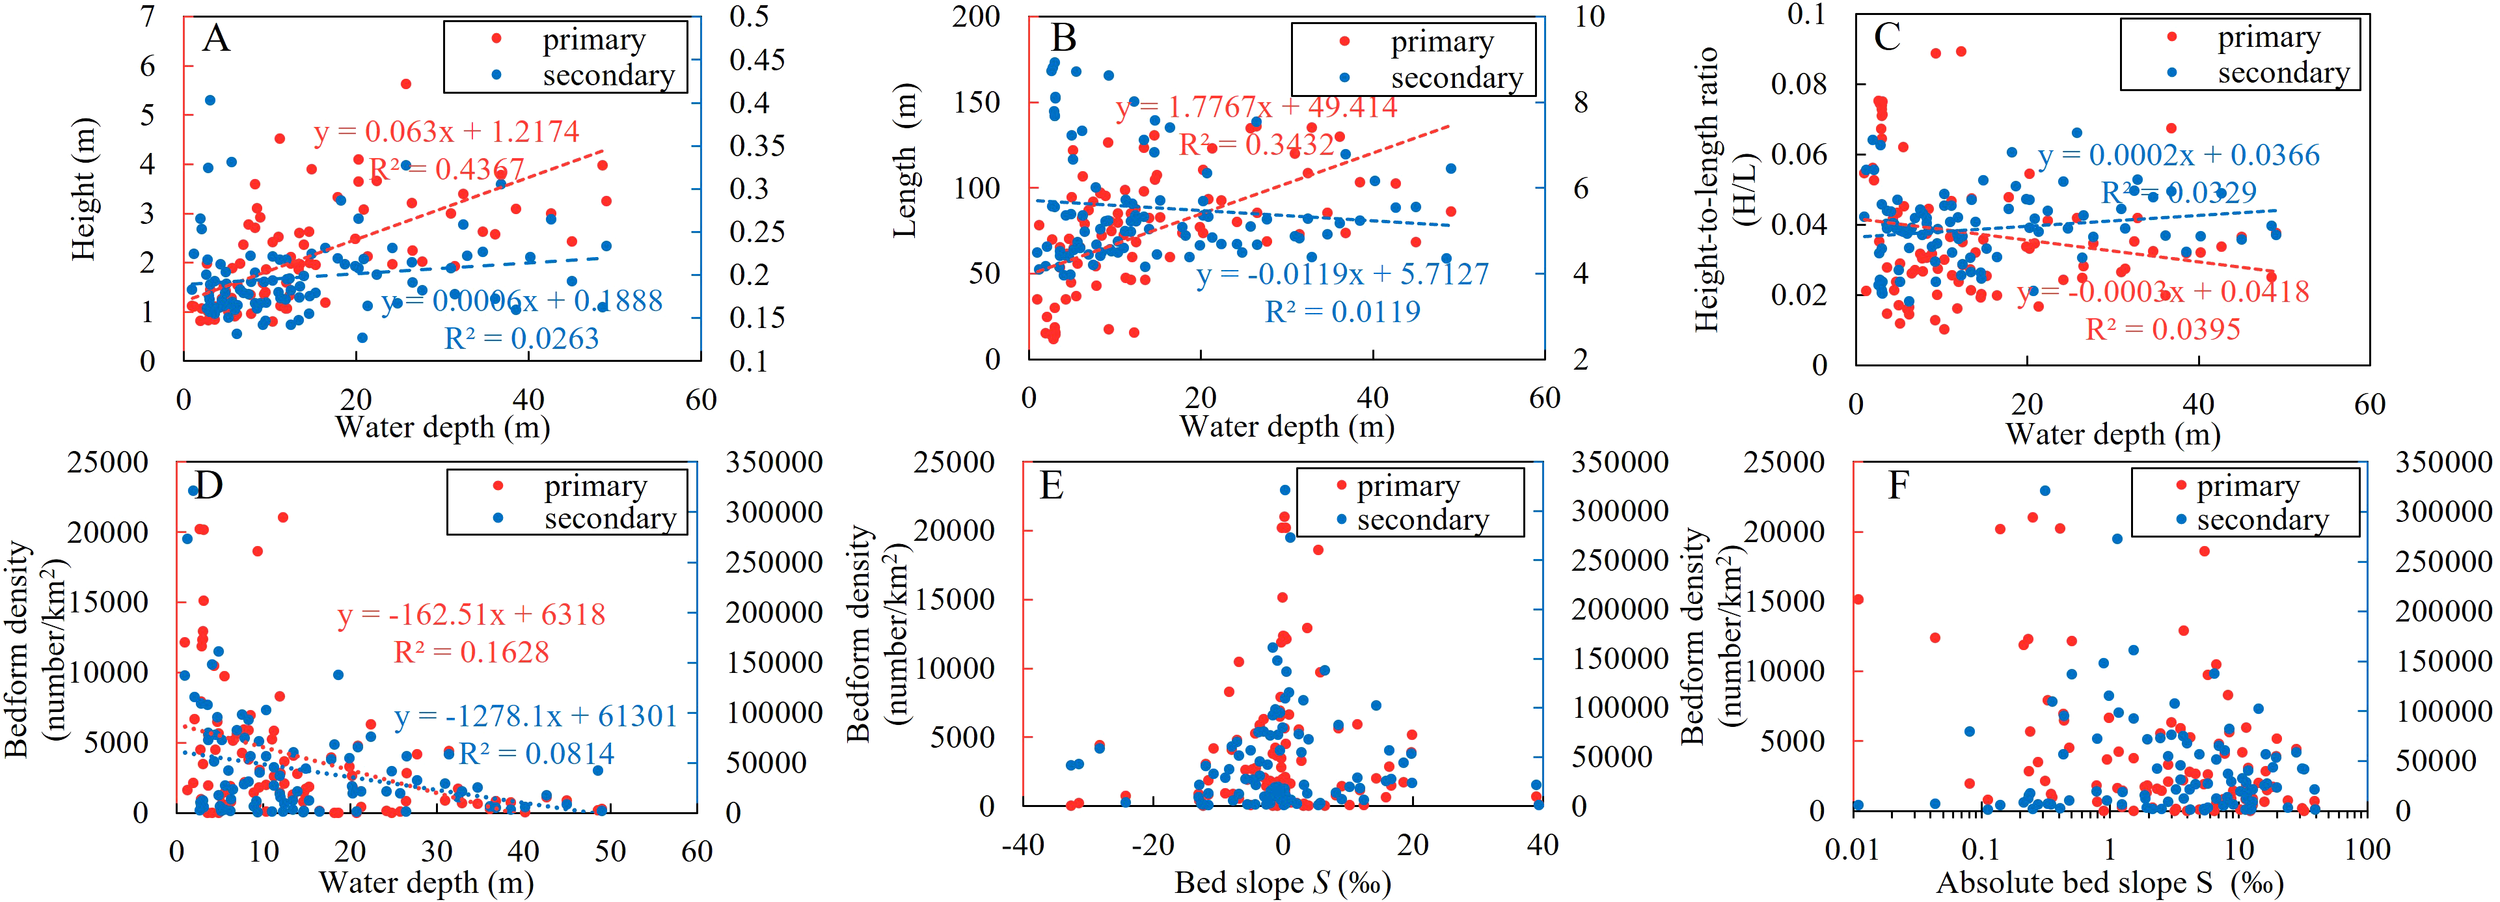
Characteristics of primary and secondary bedforms at varying mean water depths as measured at the ME. (A) The height, (B) length, (C) height-to-length ratio (H/L) versus water depth and bedform density versus water depth (D), bed slope S(E) and absolute bed slope Sa(F).
3.3.2 Hydrodynamics and sediment transport
The depth-averaged flow velocity in the ME during the survey on 17~18 August 2023 is shown in Figure 8A. It is evident that there is a strong correspondence between flow velocity and water depth, with higher instantaneous velocities occurring in the deeper sections of the river. The reason is that the canyon is narrow in mountainous estuaries, the hydrodynamics are enhanced, and the riverbed is washed downwards. From M3 to M2 to M1, the bedforms transition from flood-asymmetry to ebb-asymmetry (Figures 8B–G).
Figure 8
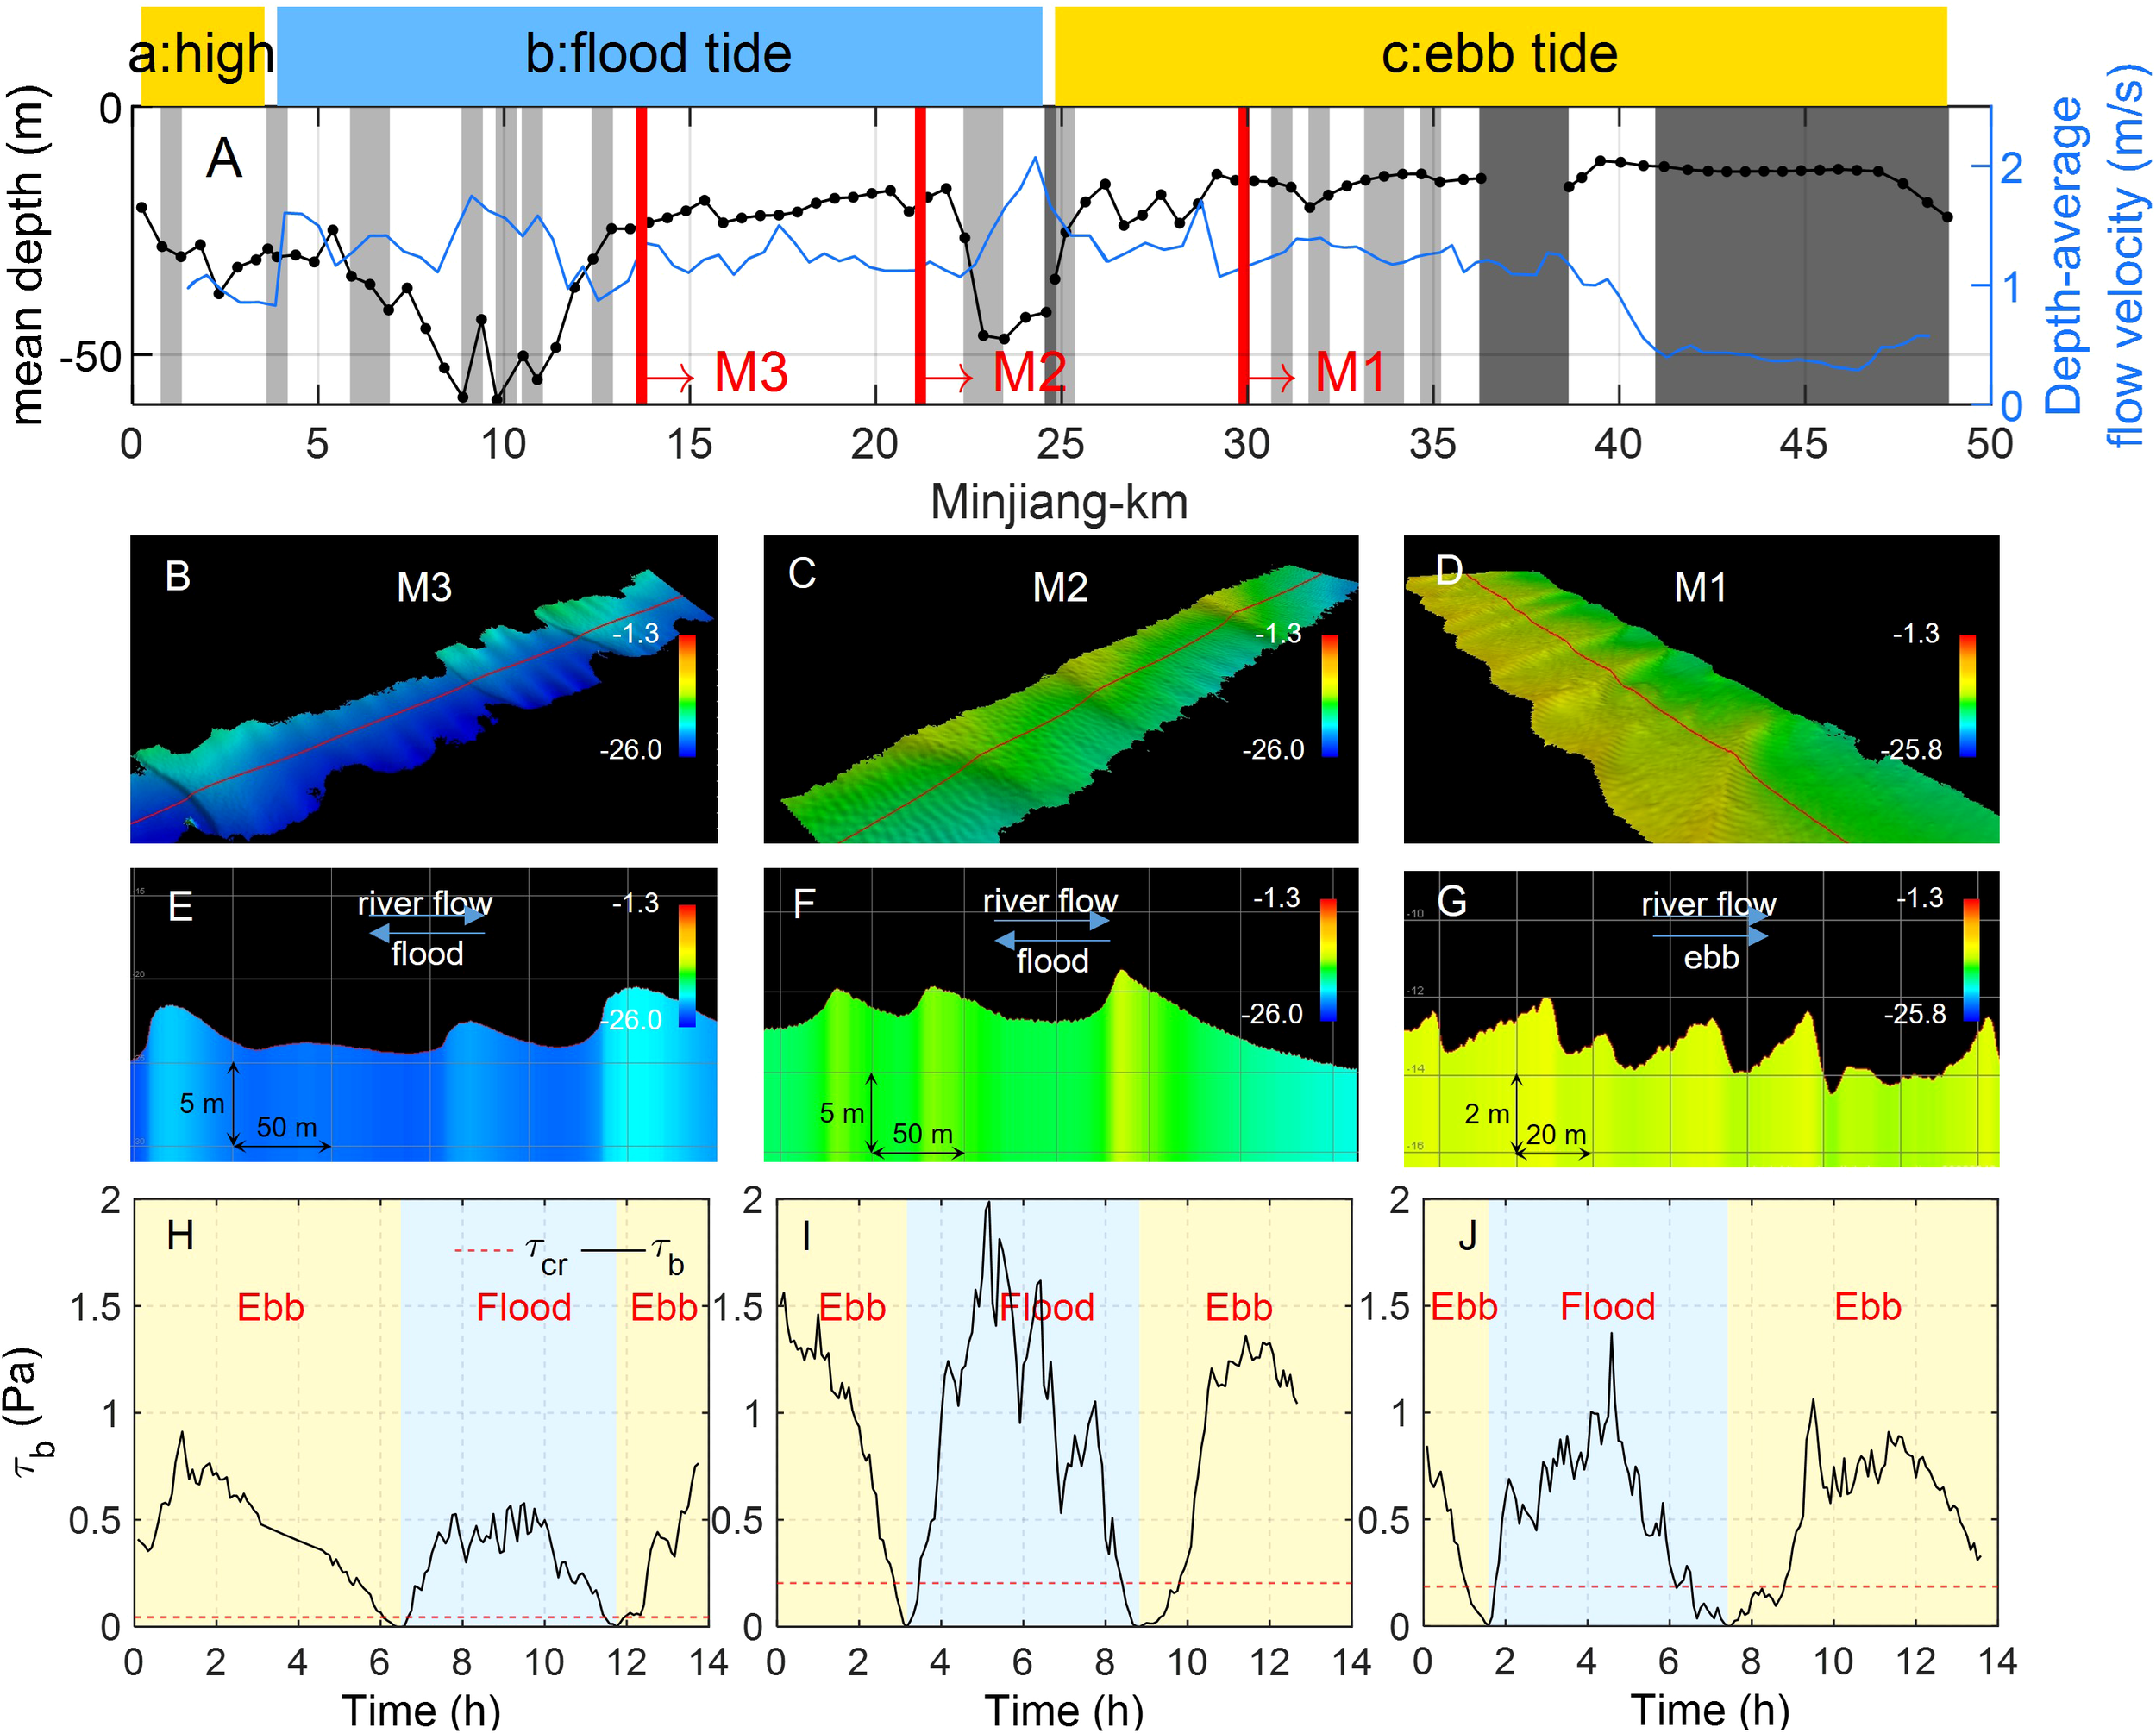
Depth-averaged flow velocity, mean water depth, bedform morphology during the survey, time series distribution of bed shear stress τb and critical bed shear stress τcr during a spring tide cycle in Station M3, M2 & M1 of the ME on 2023-08. M1, M2, and M3 are hydrological observation stations within the tidal cycle. Panel (A) represents the depth-averaged flow velocity and mean water depth along the ME, Panels (B–D) represent the 3D morphology of bedforms near the station, and Panels (E–J) represent the bedform profiles. The yellow-shaded areas in panels (H–J) represent the ebb tide period, while the blue-shaded areas represent the flood tide period.
The study analyzed the relationship between bedform morphology and hydrodynamics (bed shear stress) and sediment transport within the tidal cycle (Figures 8, 9). The bed shear stress at M3 was relatively low and had a small variation amplitude, with higher shear stress during ebb tide than during flood tide (Figure 8H), possibly because it is located upstream where the tidal current weakens and the river flow enhances, with ebb tide being dominant and having a longer duration than flood tide, resulting in more significant sediment motion (potentially including resuspension or transport) during ebb tide (Figure 9). Observations also revealed that the shape of bedforms at M3 is similar to river dunes, with flat crests and steeper slopes towards the trough (Figure 8E). The bed shear stress at M2 is the highest and has the largest variation amplitude, with higher shear stress during flood tide and longer duration of ebb tide, and the maximum velocity is high during both flood and ebb tides (Figure 8I), indicating that M2 is most influenced by bidirectional flow dynamics and has more active sediment transport (Figure 9). The bedforms here have the shape of estuarine bedforms, with steeper slopes near the crests and flat troughs (Figure 8F). The bed shear stress at M1 was slightly higher during flood tide than during ebb tide, with more significant transport of sediment during flood tide, indicating enhanced tidal current effects (Figures 8J, 9). The bedforms at this location are estuarine bedforms, with smaller bedform height and length compared to M2 (Figure 8G). The analysis found a good correspondence between the observed bedform characteristics and types and the bed shear stress within the tidal cycle.
Figure 9
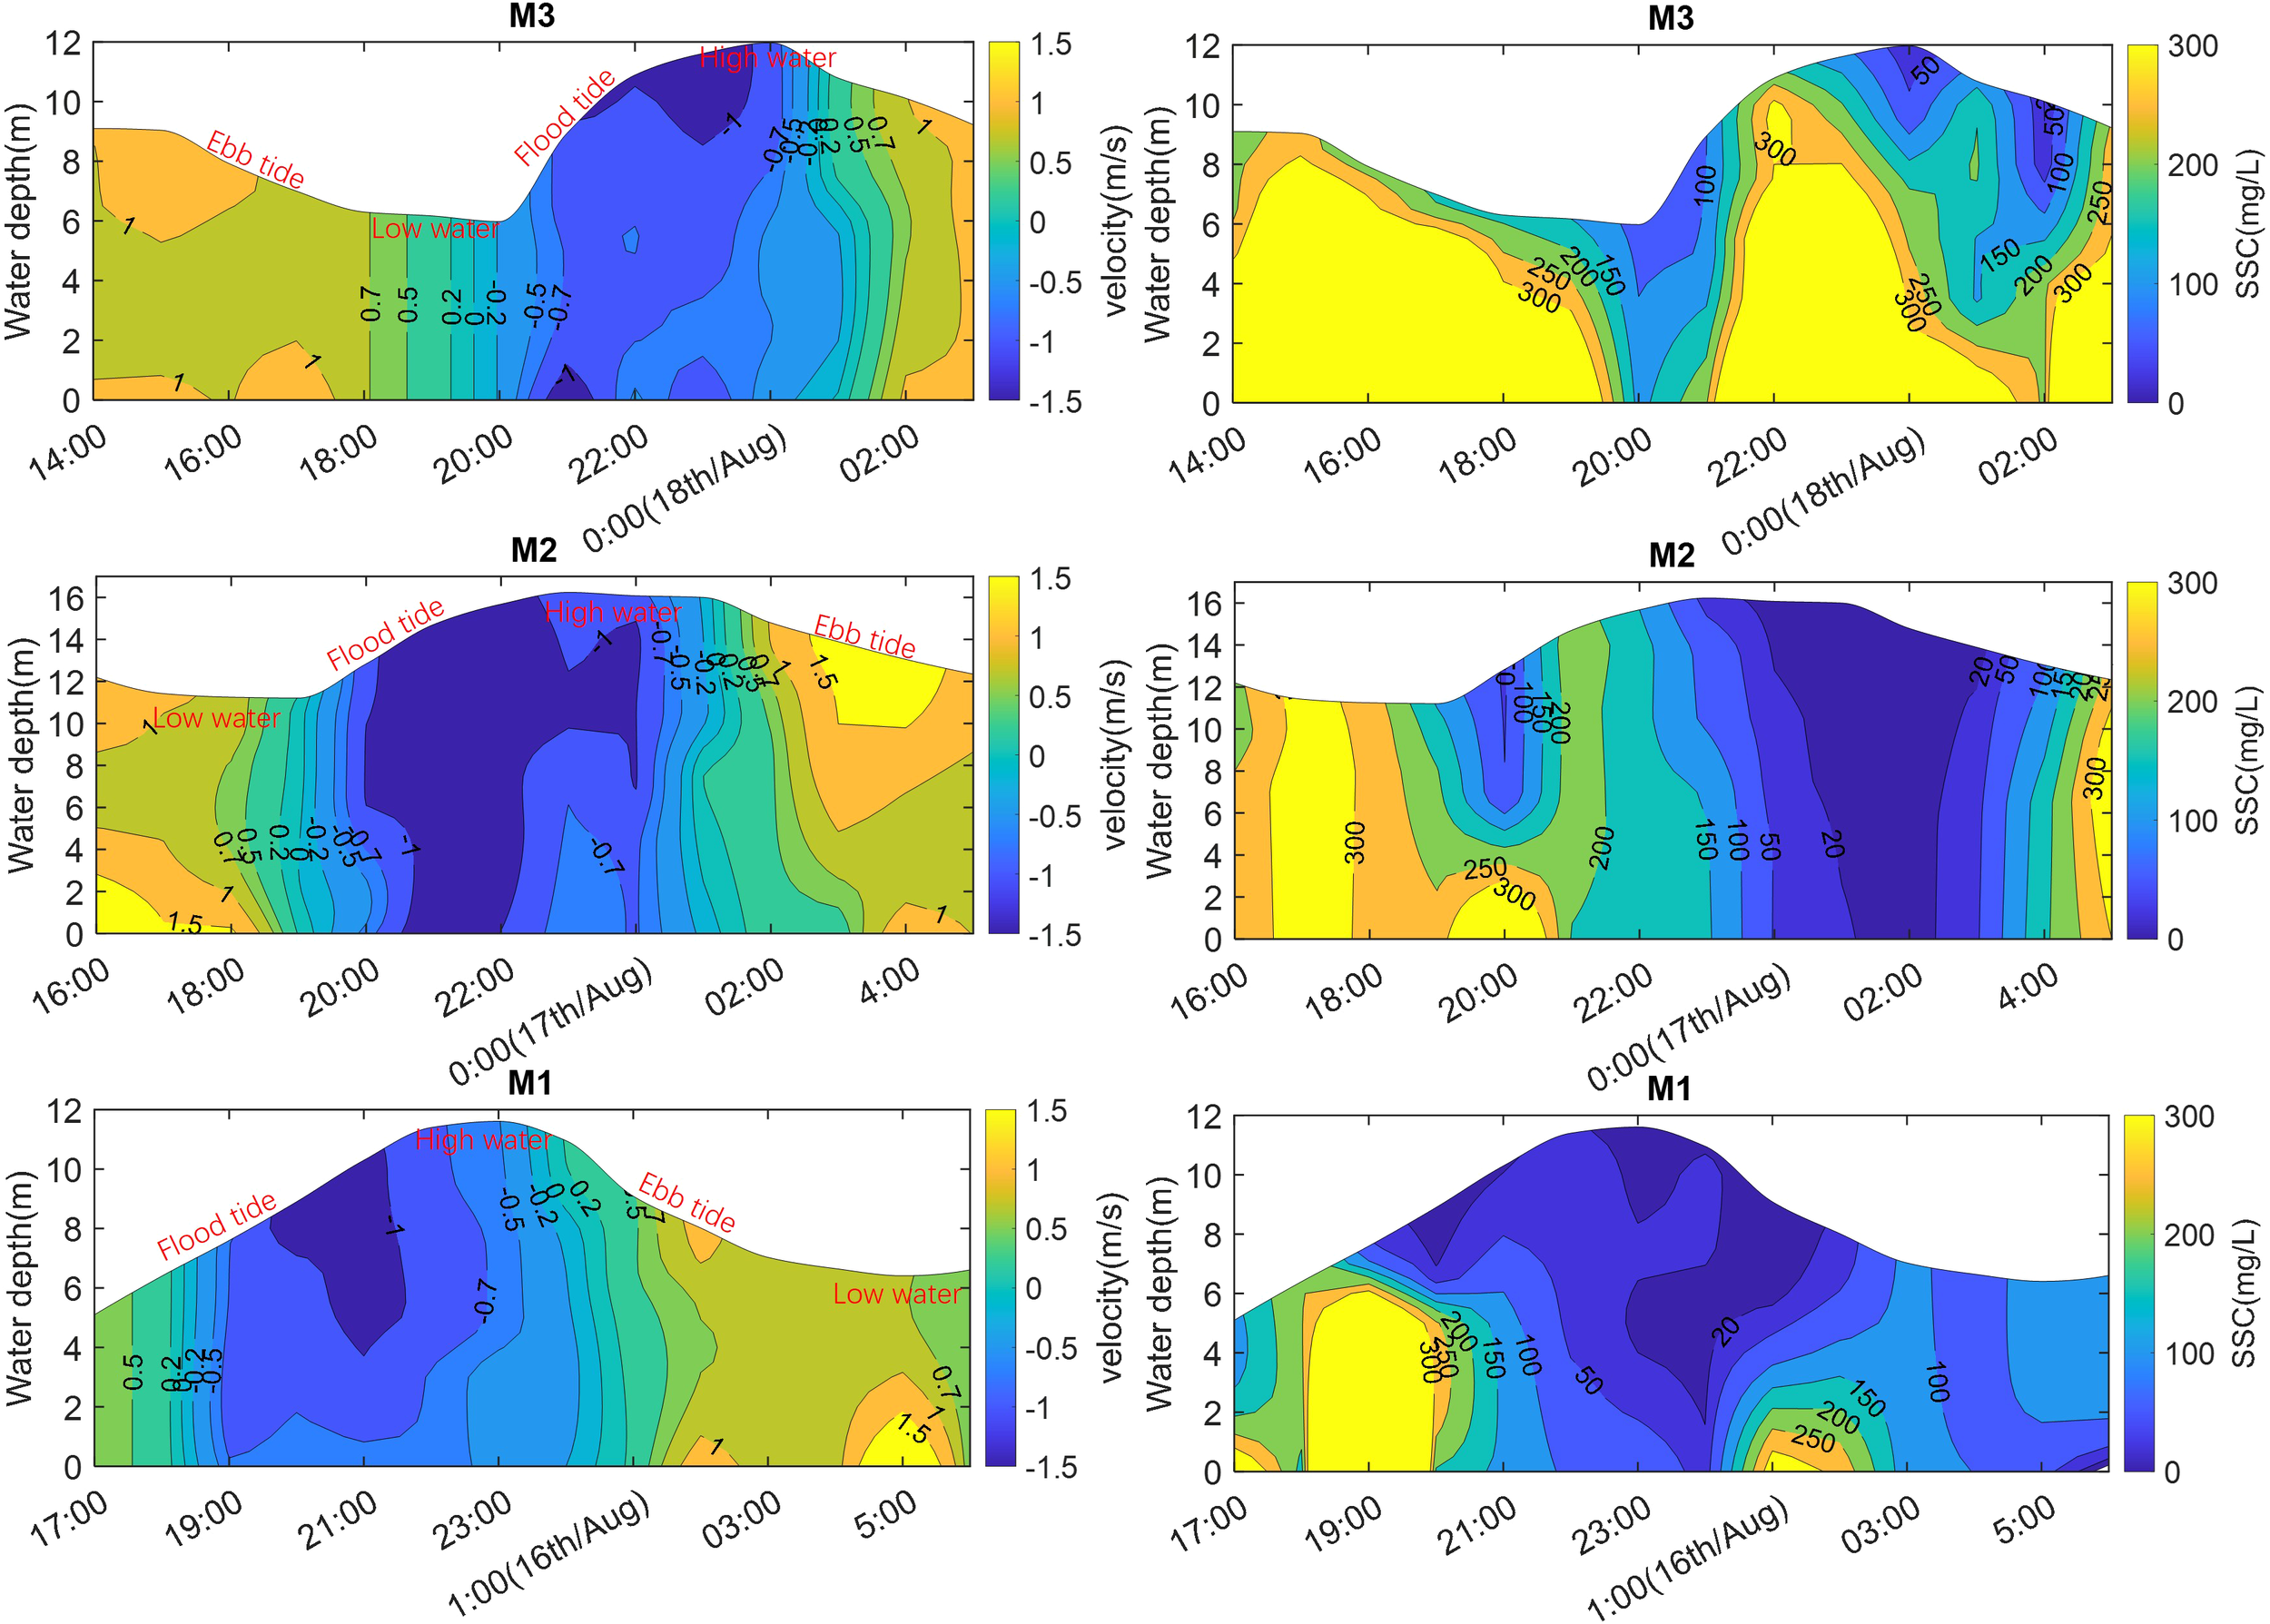
Time series distribution of flow velocity and suspended sediment concentration during a spring tide cycle in the flood season of 2023 at Station M1~M3 in the Minjiang Estuary. Positive velocity values represent ebb-directed flow, and negative values represent flood-directed flow.
3.3.3 Sediment characteristics
In the submerged delta plain and the delta front of the ME that was surveyed, the median grain size of bed-surface sediments ranges from 12.77 to 724.51 µm, predominantly composed of gravelly sand with moderate to good sorting (Figure 10). Additionally, there are sandy silt, muddy sand, and sandy mud, with relatively poor sorting, typically located in the distributary or convergent zones of the estuary, for instance, at Minjiang-km 14 and 30, which are located at the downstream bifurcation of Tingjiang and the branching points of Chuanshi and Yundun channels respectively. Comparative analysis of sediment grain size, composition, and sorting coefficient reveals that at Minjiang-km 14, the median grain size is 12.77 μm, and the sorting coefficient is 3.177, indicating poor sorting. This section is at the bifurcation of the Changmen and Meihua channels downstream of Tingjiang, and it is inferred that the fine-grained sediments originate from the southern branch, the Meihua channel. A similar situation exists at Minjiang-km 30. Based on the survey results, we found that when the clay content in the surface sediments of the Minjiang River estuary is high, the median grain size is smaller, and the bedform density is low (at the 14 km and 30 km sections of the ME). Therefore, we infer that the presence of clay in the bedload may not be conducive to the development of bedforms (Figure 10).
Figure 10
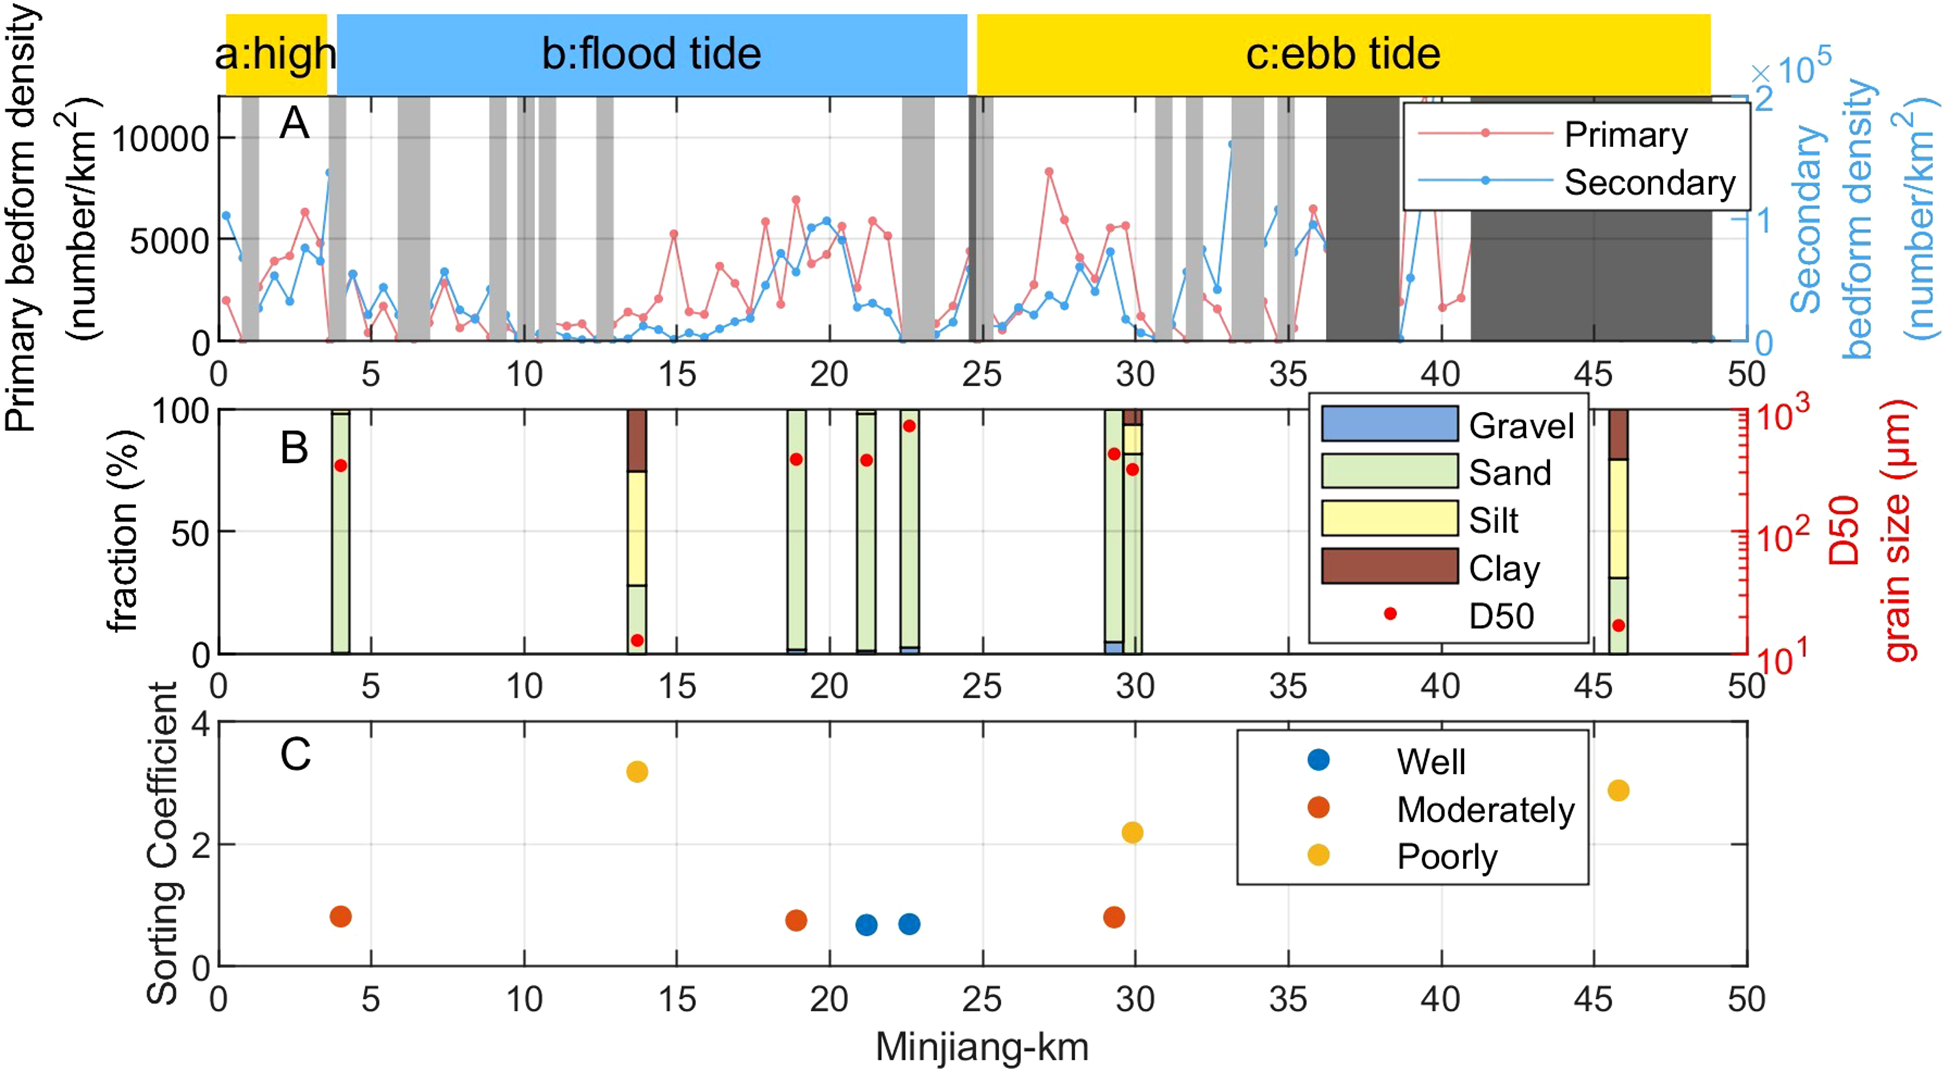
Relationship between bed-surface sediment grain size, fractions, sorting coefficients and bedform distribution. (A) Primary and secondary bedform density, (B) D50 grain size and fractions of bed-surface sediment, and (C) Sorting coefficients along the ME.
4 Discussion
4.1 Influence of resolution on the angles of primary and secondary bedforms
The angles of primary and secondary bedforms are crucial parameters in understanding the morphodynamics of river and estuarine bedforms. These angles provide insights into the interactions between flow dynamics and sediment transport, which are essential for predicting bedform evolution and channel adjustments. However, the accuracy of these measurements is significantly influenced by the resolution of the data used for analysis.
High-resolution datasets can capture subtle variations in bedform angles, which are often missed by coarser data. Galeazzi et al. (2018) used data with a 0.5 m resolution to investigate superimposed bedform dynamics. Their study demonstrated that this resolution is sufficient for capturing and analyzing secondary bedforms. In our research, the data resolution used is 0.5 meters, which is considered high-resolution in many contexts. This resolution provides 4 to 20 data points along the length of a secondary bedform (2–10 m), which is generally sufficient for capturing morphological characteristics, including lee side angles. With a 0.5 m grid, the slope between two adjacent points can be approximated, but finer features, such as abrupt changes in slope, might be smoothed. This could lead to a slight underestimation of the steepest angles, particularly for shorter bedforms (2–4 m). Secondary bedforms in tidal environments are typically steeper and more dynamic than primary bedforms (Dalrymple et al., 1978; Lefebvre et al., 2011; Noormets et al., 2006; Zomer et al., 2023), requiring higher resolution for precise morphological analysis. However, during this study, it was observed that the automatically identified secondary bedforms were predominantly longer than 4 m (Figure 5), indicating that the selected data resolution of 0.5 m adequately meets the requirements for analyzing secondary bedforms in this research.
Future studies could explore the impact of higher resolutions or adaptive grid methods to further enhance the accuracy of bedform angle measurements, particularly in regions with steep slopes or rapid morphological changes.
4.2 Development patterns of multiscale bedforms in mountainous macrotidal estuaries
The geometric scales of the compound bedforms in the Minjiang Estuary, a mountainous macrotidal estuary, are consistent with those of compound dunes investigated in other tidal environments (Ernstsen et al., 2006; Lefebvre et al., 2021; Scheiber et al., 2021). It has been observed that despite the periodic reversal of tidal currents, primary bedforms typically have an asymmetrical shape and are orientated almost steadily towards the main flow direction (Ernstsen et al., 2006; Lefebvre et al., 2011), and bedform height and steep side angle respond to variable flows (Hendershot et al., 2015). Ernstsen et al. (2009) observed that the height of ebb-oriented primary bedforms typically decreases during the ebb and increases during the flood, while secondary bedform deposits, which are relatively small in volume, show a bedform asymmetry that changes with the tidal cycle. Similar patterns are observed in the ME. Figure 11 shows an example of bedform morphology observed at the ME during different tidal stages. The estuarine bedform characteristics observed in this study are consistent with the size of superimposed bedforms observed in river environments, where secondary bedforms are typically smaller but migrate at a faster rate than primary bedforms (Zomer and Hoitink, 2024; Zomer et al., 2023). The difference in scale indicates that primary and secondary bedforms play different roles in shaping the bedform morphology. Primary bedforms mainly reflect the long-term influence of strong hydrodynamic processes, while secondary bedforms are more responsive to short-term tidal fluctuations.
Figure 11
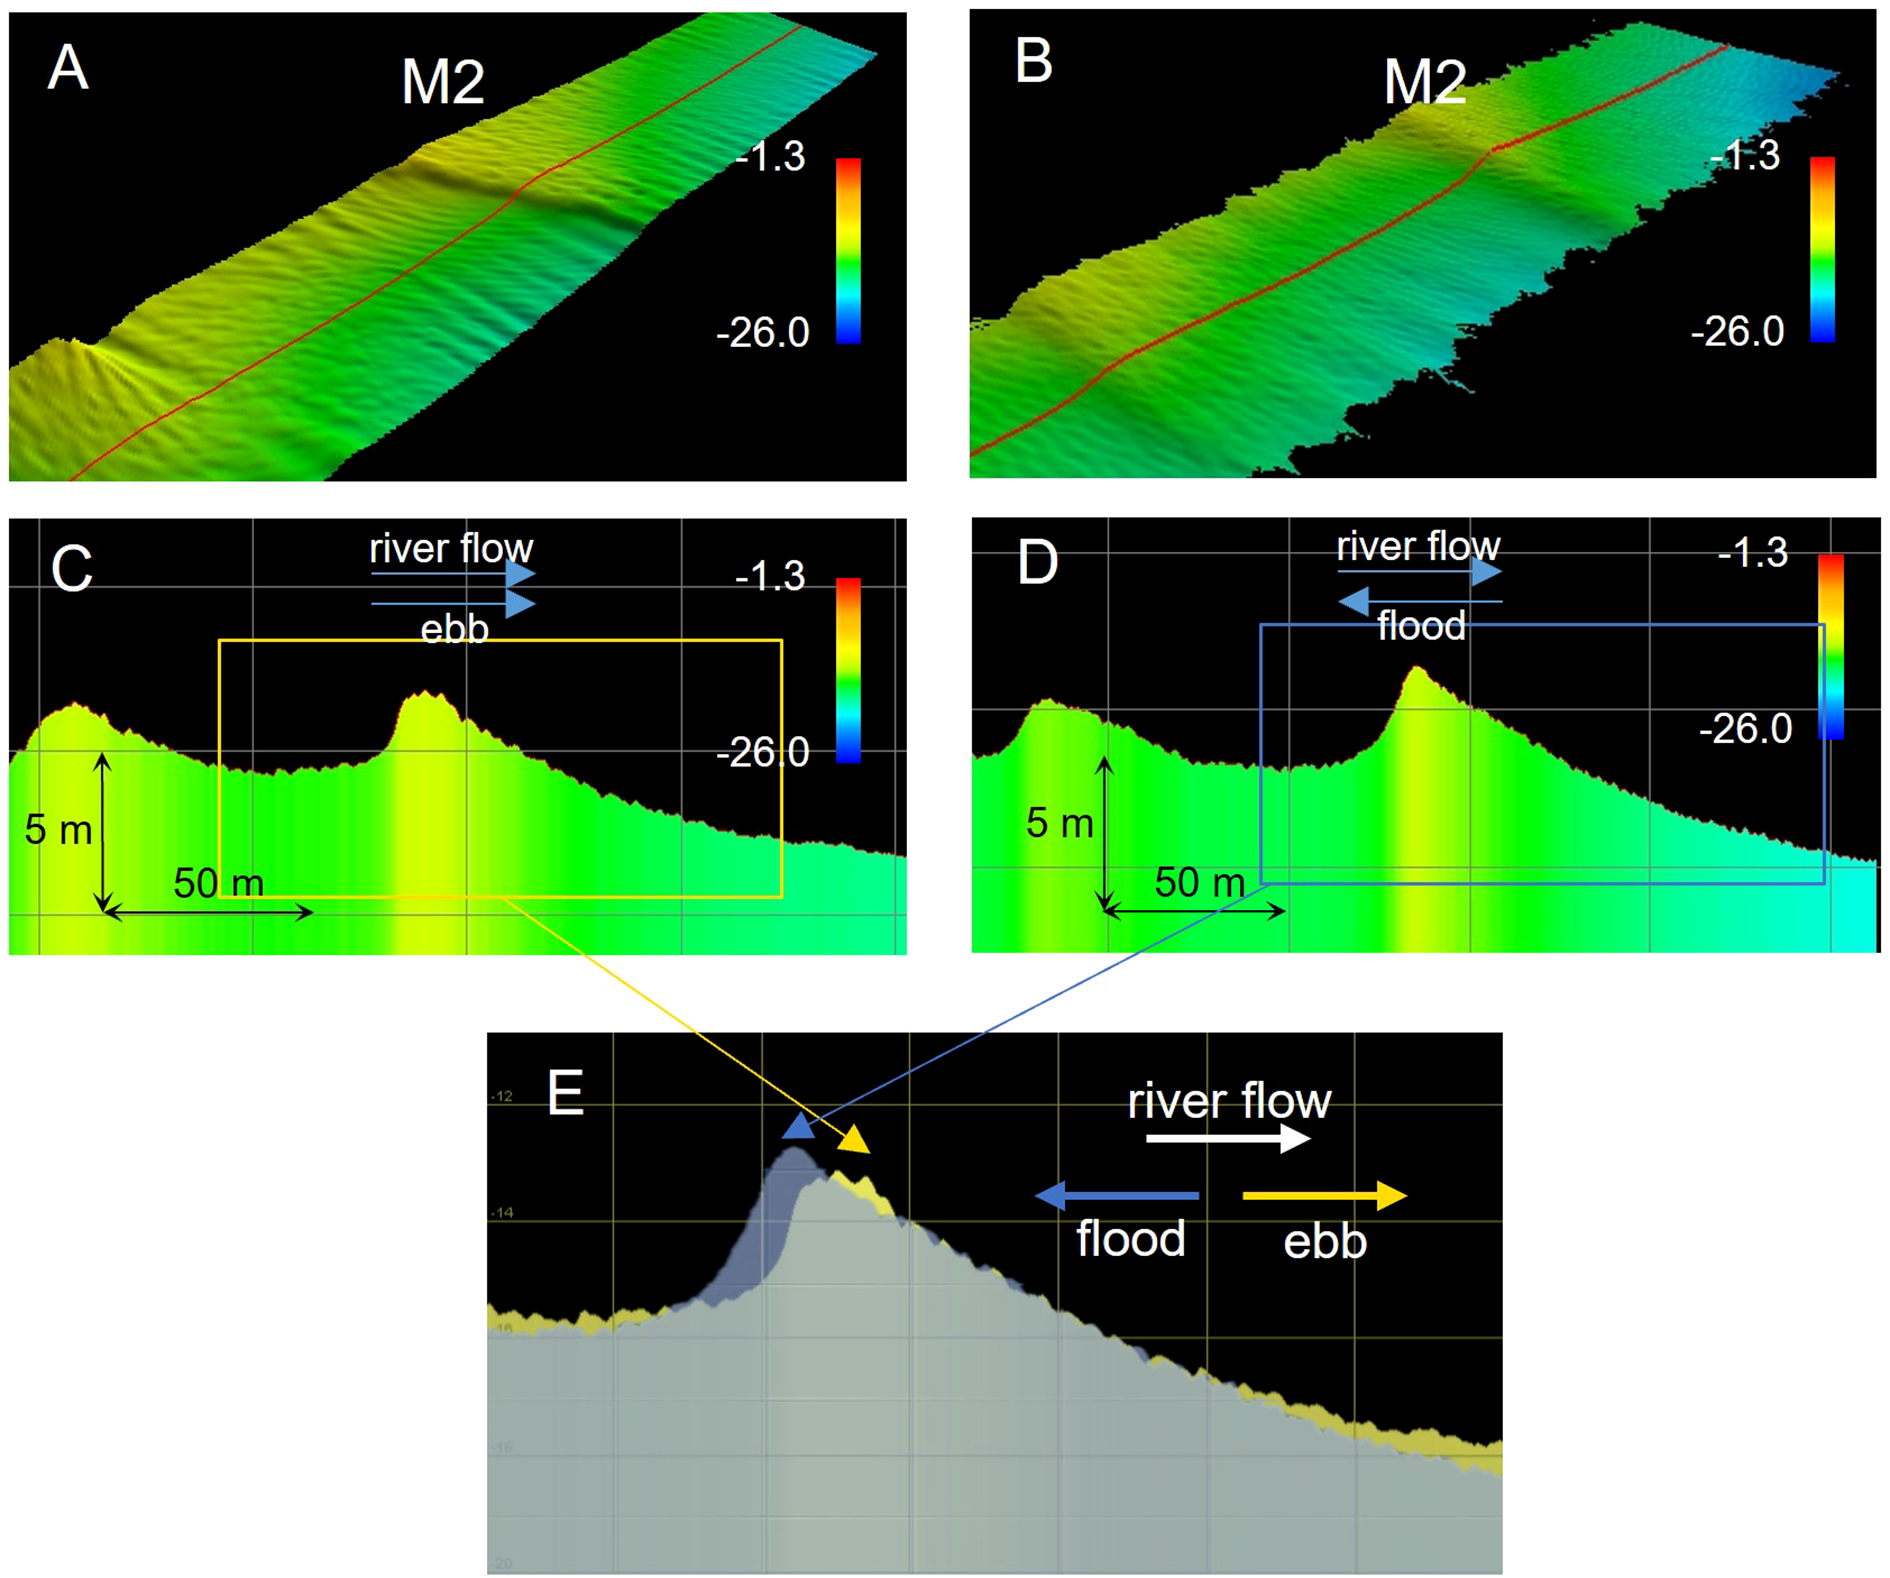
Bedform morphology at Station M2 during flood (2023-08-17, 08:53 UTC+8:00) and ebb tides (2023-08-16, 14:06 UTC+8:00). Panels (A, B) show the 3D morphology of the same bedforms in different tidal phases, while panels (C–E) display the bedform profiles.
The morphological characteristics of primary and secondary bedforms in mountainous macrotidal estuaries also reveal different developmental patterns influenced by tidal cycles. Secondary bedforms show a significant response to tidal cycle changes, while primary bedforms remain relatively stable. During flood and ebb tides, the maximum flood/ebb lee side angle of both primary and secondary bedforms averages about 20°, and can reach up to 30° in some cases. Such steep angles are sufficient to cause (intermittent) flow separation and turbulent wakes, thereby enhancing the suspension and downstream transport of sediments, which significantly impacts the morphodynamic processes of the estuary. The asymmetry of bedforms at different scales suggests that secondary bedforms play a crucial role in the short-term local redistribution of sediments during different stages of the tidal cycle, while primary bedforms better reflect the overall morphology and sediment characteristics of the riverbed.
4.3 Tectonic constraints on mountainous macrotidal estuarine bedform
In mountainous canyon-type macrotidal estuaries, the coupling between long-term geological structures and local hydrodynamic forces exerts a profound influence on bedform evolution. Although tectonic processes operate over geological timescales and are unlikely to drive short-term seasonal changes directly, they shape the underlying geomorphology, which modulates how tidal and fluvial dynamics interact over seasonal cycles (Figure 12). In the Minjiang Estuary, located at the intersection of the Minjiang Fault and the Changle-Nanao Fault zones, tectonic deformation has fragmented the bedrock, creating a structurally confined valley system with numerous rocky outcrops and fault-controlled channel bifurcations (Li et al., 2017; Zhu, 1991). This has led to a complex estuarine morphology characterized by alternating wide and narrow reaches, which strongly influence local hydrodynamics and sediment transport.
Figure 12
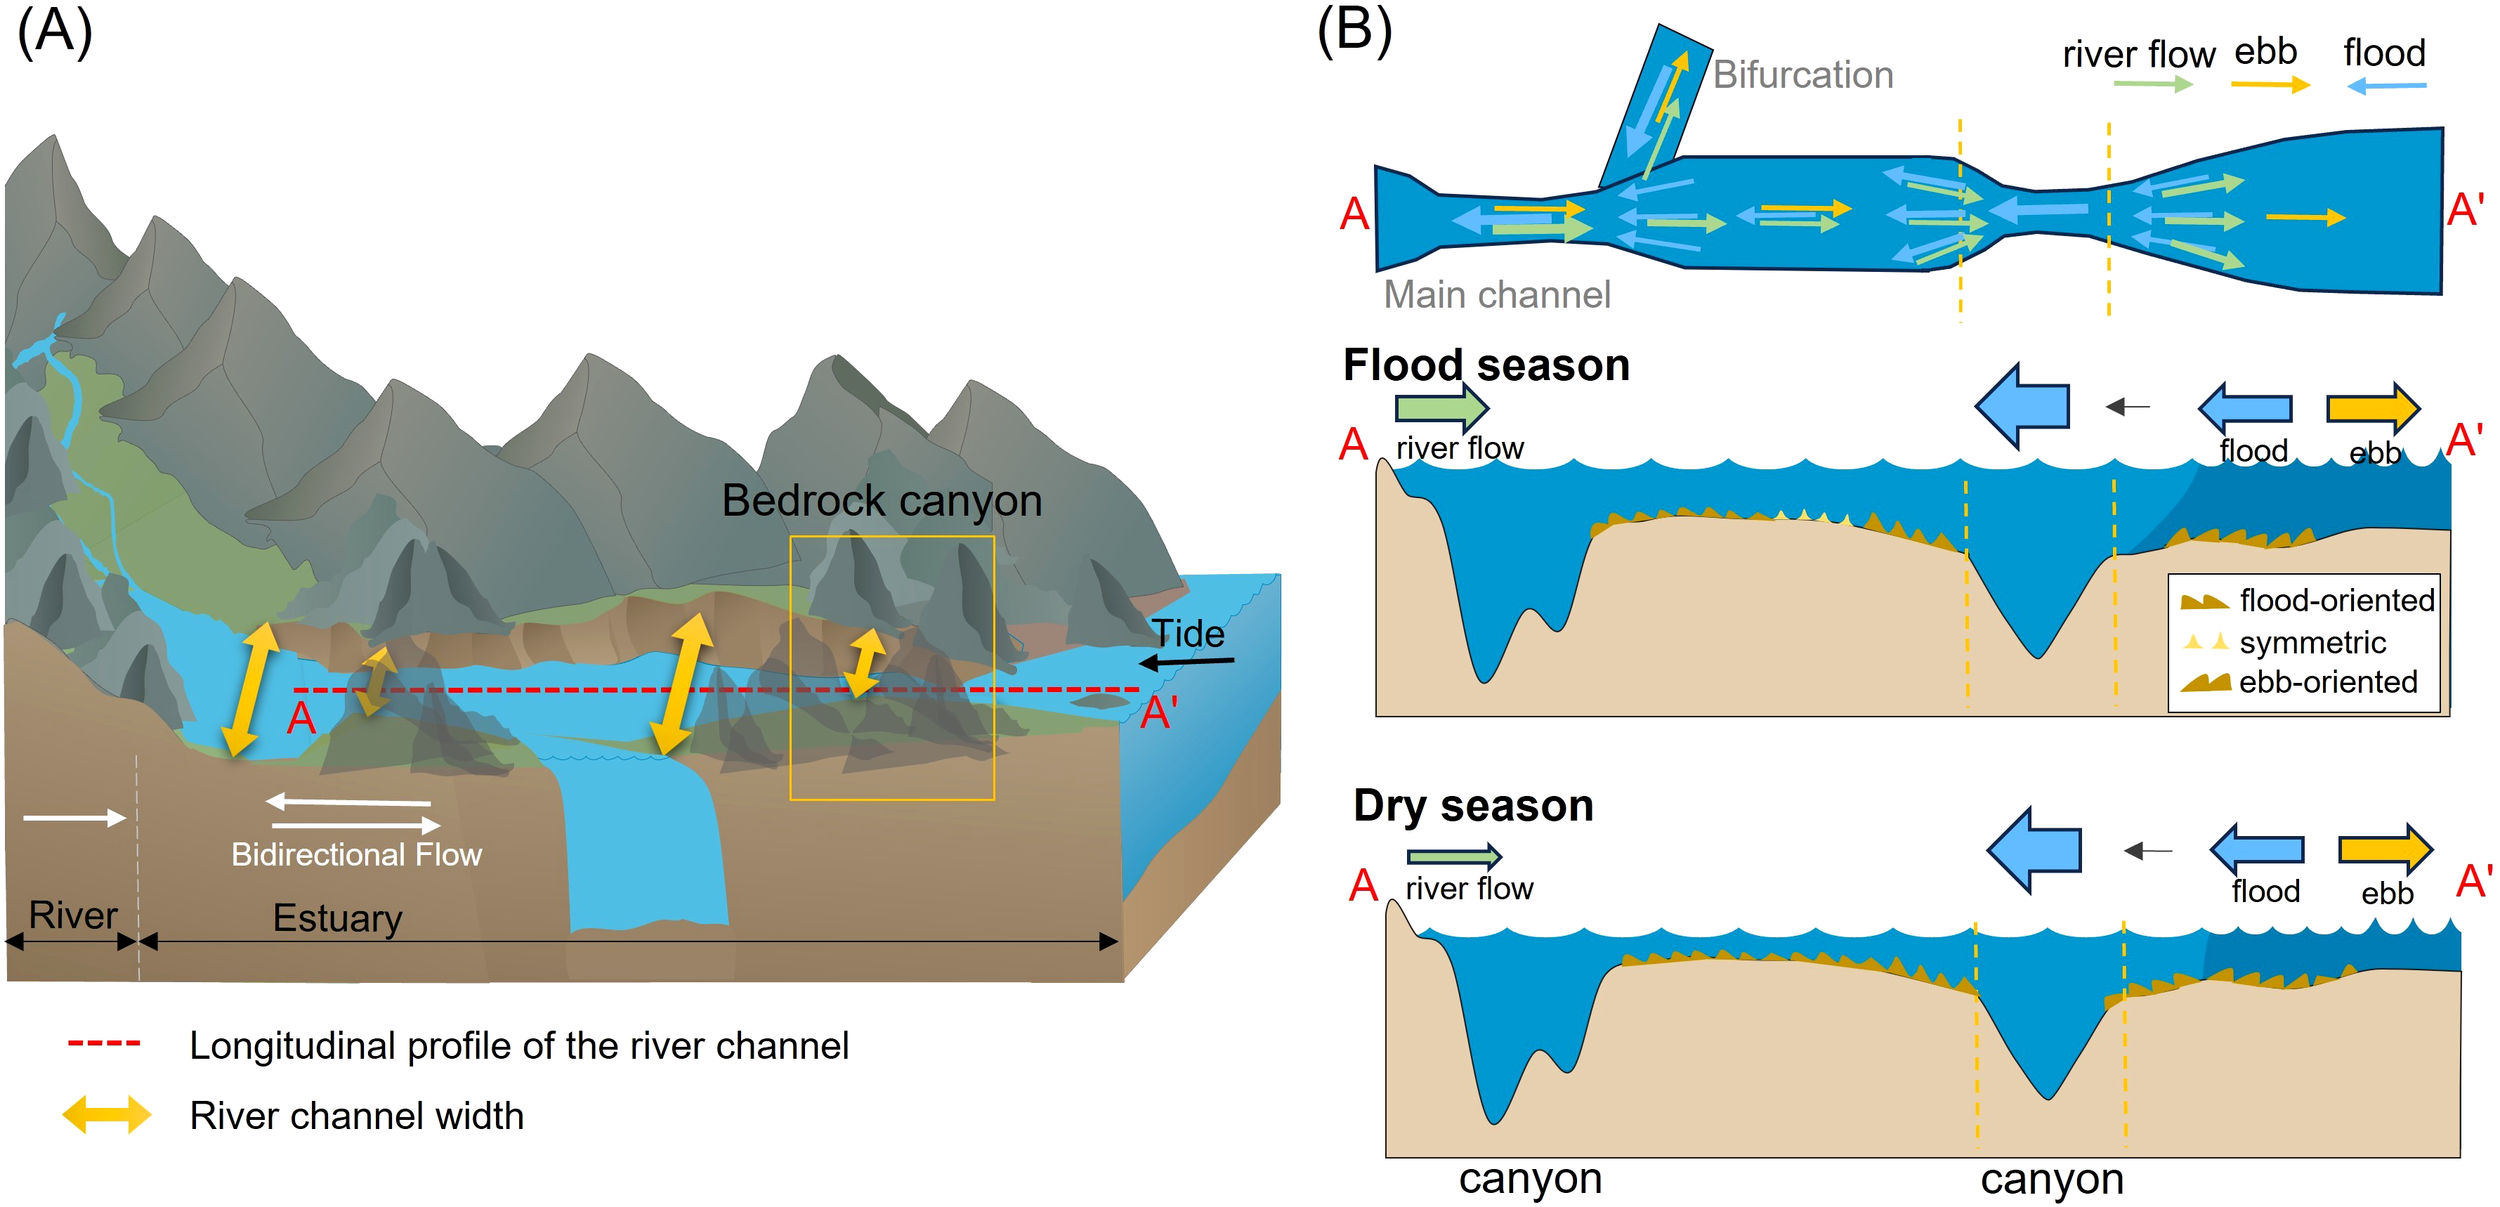
Schematic diagram of the response pattern of bedform development in tectonic macrotidal estuaries to bedrock canyon structure and seasonal hydrodynamic differences. (A) 3D topography of a mountainous macrotidal estuary, (B) Channel plan and micro-topographic longitudinal section of a tectonic mountainous macrotidal estuary.
Within the structurally confined 18–23 km canyon reach of the ME, tectonic structures shape estuarine morphology, which in turn modulates fluvial-tidal interactions and governs bedform variability. The upper Changmen Waterway (18–20 km) exhibits relatively homogeneous hydrodynamic and geomorphic conditions (channel width: 1.5 km; depth: 15 m). In contrast, the downstream Jinpaimen Canyon segment (20–23 km) narrows abruptly to 0.4 km under the control of bedrock uplift, with water depths plunging to 45 m. This sharp transition in channel form induces significant hydrodynamic anomalies.
During the flood season, bidirectional fluvial-tidal forces in the upper Changmen Waterway (18–20 km) promote symmetrical bedform development due to balanced energy distribution. However, within the Jinpaimen Canyon, narrowing induces tidal wave deformation. The venturi effect amplifies flow velocities during flood tides, while topographic constriction during ebb tides causes water level backwater and velocity attenuation. This tidal asymmetry fosters landward-dipping bedforms with flood-dominated geometries. In the dry season, diminished river discharge enhances flood-tide dominance across both the Changmen Waterway and the canyon, intensifying bedform asymmetry. However, reduced overall hydrodynamic energy results in bedforms characterized by low-amplitude gentle slopes and infrequent steep faces. Field measurements further reveal that flood-season bidirectional flows enhance bedform dimensions (e.g., height and aspect ratio), whereas dry-season energy attenuation leads to subdued morphologies (Figure 6).
These findings indicate that seasonal bedform variability arises primarily from the interaction between seasonal hydrodynamic forcing and spatial differences in channel morphology, which in turn are influenced by long-term tectonic shaping. The tectonic framework defines the estuary’s structural configuration, which sets boundary conditions for hydrodynamic responses rather than directly causing seasonal changes. The ME thus provides a valuable example of how structural geology, by shaping river channel form, indirectly governs energy partitioning and bedform evolution. Recognizing this geomorphology–hydrodynamics linkage is critical for understanding other tectonically constrained estuarine systems globally (Figure 12).
4.4 Influence of bed slope and sediment characteristics on bedform development
Here, we focus on some interesting insights inferred from observational results, analyzing the effects of bed slope and sediment properties on bedform development. In our study we observed that both primary and secondary bedforms develop more robustly over relatively non-sloping riverbeds, and this result offers intriguing insights into sediment dynamics. One possible explanation is that flat beds allow for a more uniform distribution of shear stress and turbulence than sloping beds (Best, 2005; Ferraro and Dey, 2015). Under uniform shear stress, flat beds are more susceptible to initial disturbances than sloping beds and thus gradually develop into regular bedform structures, such as ripples or dunes (Bennett and Best, 1995). This is because the turbulent flow structure over a flatbed is more orderly, making it easier to generate stable coherent structures than a sloping bed (Carstensen et al., 2010), which in turn promote the orderly growth of bedforms through periodic scouring and deposition (Sutherland, 1967). In contrast, the situation for inclined beds is more complex. Due to the effect of gravity, sediment migration in the downslope direction is enhanced, while transport in the upslope direction is suppressed, leading to an uneven distribution of shear stress. This asymmetry can interfere with the stable growth of bedforms (Ferraro and Dey, 2015). Additionally, the component of gravity may cause sediment to accumulate at the foot of the slope, while the top area experiences erosion, forming a “starved zone” and thus disrupting the continuity of bedform growth (Bradley and Venditti, 2021). The impact of slope is also reflected in the distribution of turbulent kinetic energy. For example, the slope surface may enhance local flow separation, concentrating energy dissipation in specific areas (such as the foot of the slope), thereby inhibiting the development of large-scale bedforms. Experimental studies have also shown that an increase in slope intensifies the spatial variation of bed roughness (Francalanci et al., 2009), weakening the overall coordination of bedforms.
Our study, in combination with observational data, infers that sediment characteristics impact bedform density, as poorly sorted sediments with high clay content in fine particles are not conducive to bedform development. Recent research has identified the crucial role of sediment properties in bedform development. In particular, the inhibitory effect of clay-rich fine-grained sediments on bedform development has been confirmed by numerous studies (Best, 2005; Smith and McLean, 1977; Wan, 1985; Wan and Wang, 1994). Wan and Wang (1994) constructed a dune stability field model through flume experiments and found that as the clay volume concentration increased, the dunes were gradually replaced by high-position flat beds. Smith and McLean (1977) also found in natural river measurements that as the suspended load/bed load ratio increased (i.e., clay content increased), the dune morphology showed a trend of “low and flat” evolution. The physical mechanisms by which cohesive components inhibit bedform development can be summarized into three aspects: Firstly, the strong cohesion of clay particles forms a “cementation effect” (including physical viscous mud and biological viscous polymers), which increases the shear strength of the surface sediment, significantly reducing the probability of sand - quality bed load initiation (Malarkey et al., 2015). Secondly, the sorting of mixed - size sediments deteriorates (the higher the clay content, the smaller the median grain size), which destroys the homogeneous conditions required for the regular arrangement of bedforms (Baas et al., 2021; Yan et al., 2020). Thirdly, fine-grained materials weaken the near-bed shear stress through the “hydraulic shielding effect”, suppressing turbulence and reducing the hydrodynamic intensity that shapes bedforms (Baas et al., 2011). It should be emphasized that the above mechanisms are still in the theoretical hypothesis category, and their specific working mechanisms need to be further clarified through systematic experimental observations and field data verification.
4.5 Comparison with global river/estuarine bedforms
Comparative analyses of mean lee side angles and maximum lee side angles of dunes in different river and estuarine environments reflect the different hydrodynamic conditions and depositional processes in these systems. Existing studies have concluded that in river systems, dunes with a slope angle of 27° are found in streams <2.5 m, while dunes in deeper streams exhibit lower lee side angles (Bradley and Venditti, 2017). In large rivers, the mean lee side angles generally range from 5° to 20° (Figure 13 (Cisneros et al., 2020)). For example, dunes in the Mississippi River have relatively steep lee sides, with average angles of 15° and maximum angles reaching 22°. In contrast, dunes in the Waal River exhibit milder slopes, with an average lee side angle of 10° and a maximum angle of 14°. Based on the conclusions from numerical simulation experiments by Lefebvre and Cisneros (2023) on the influence of dune lee sides on turbulence, dunes in the Mississippi and Waal Rivers can be classified as intermediate-angle dunes. Intermittent flow separation may occur above the lee side. In tidal environments, bedforms are typically low-angle, with lee side angles ranging from 2° to 20° (Cheng et al., 2004b; Damen et al., 2018; Franzetti et al., 2013; Hu et al., 2018; Lefebvre et al., 2021; Lefebvre and Cisneros, 2023). For instance, bedforms in the Weser Estuary are characterized by gentle slopes, with a mean lee side angle of only 5° and a maximum slope of 11°. These low-angle dunes generally lack flow separation and exhibit weak turbulent wakes, indicating limited hydrodynamic disturbance.
Figure 13
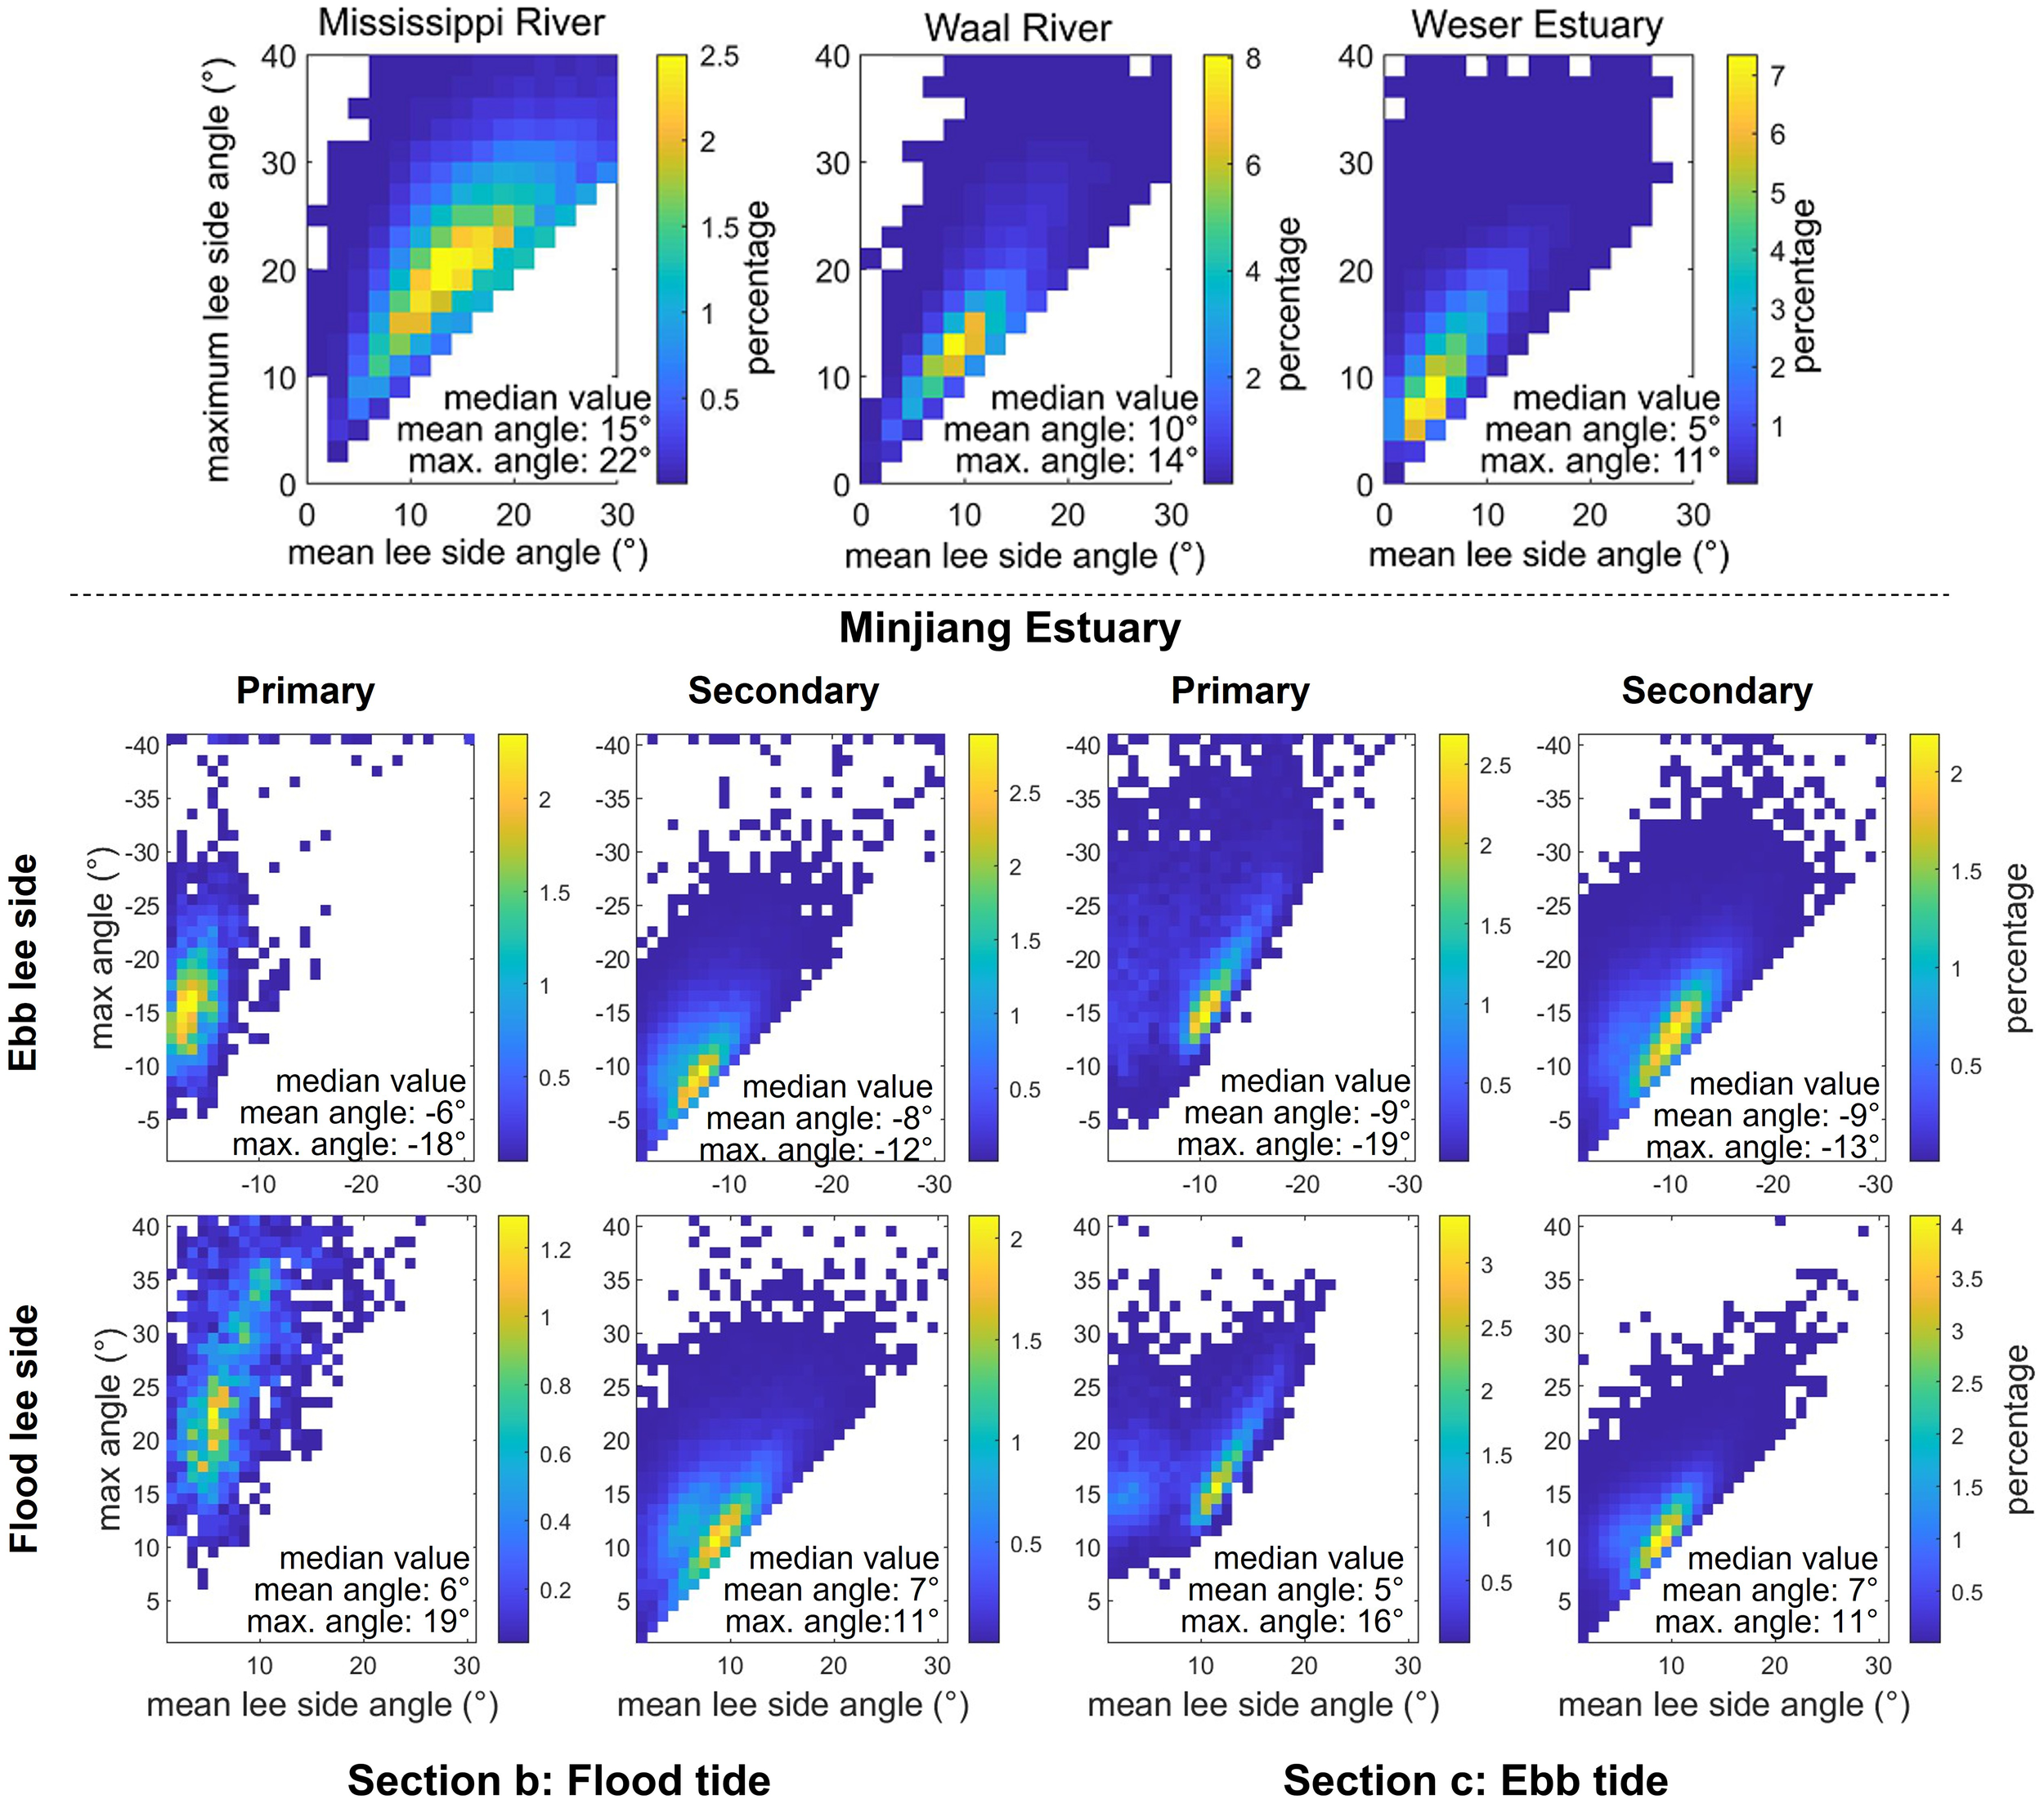
The mean and maximum lee side angles from dunes found in the Mississippi and Waal rivers (data from Cisneros et al., 2020), the Weser estuary (data from Lefebvre et al., 2021) and the Mingjiang Estuary (during the flood season in 2023). Modified from (Lefebvre and Cisneros, 2023). The corresponding locations and tidal phases of Sections b and c are illustrated in Figures 2B, D. The vertical axis labeled “ebb/flood lee side” refers to the maximum lee side angle of dunes facing either the ebb or flood flow direction.
In comparison, primary dunes in the ME have, on average, mean lee side angles of 6° and maximum angles around 18° (Figure 13). This suggests that while bedforms in the ME are predominantly low-angle, localized areas develop intermediate-angle dunes capable of inducing intermittent flow separation. Such flow separation may influence local hydrodynamics and sediment transport. Unlike typical river and estuarine systems (Lefebvre and Cisneros, 2023; Zomer et al., 2022), the Minjiang Estuary is a structurally confined, mountainous macrotidal system where fault-controlled narrow channels (e.g., Jinpaimen Canyon) and steep channel slopes strongly constrain flow pathways and energy distribution. These geological factors, coupled with strong tidal forcing, create localized conditions of intensified flow convergence, which are conducive to the formation of steeper dunes with intermediate lee side angles. This unique setting distinguishes the ME from flatter, less confined systems like the Weser. Furthermore, the fact that the maximum lee side angle of primary bedforms exceeds that of secondary bedforms (Figure 13) highlights the influence of localized topographic and structural constraints on bedform steepening. While low-angle dunes dominate the estuary, the occurrence of steep lee faces in confined segments is consistent with the estuary’s tectonically influenced morphology.
This distinct morphology underscores the influence of macrotidal dynamics and structural confinement on bedform development in the Minjiang Estuary, offering insights that are not readily observed in other estuarine systems.
5 Conclusions
This study provides a comprehensive analysis of the morphodynamic characteristics of multiscale bedforms in mountainous macrotidal estuaries, using the ME as a case study. The results demonstrate that bedform development in such estuaries is strongly influenced by tidal water depth variations, riverbed slope, structural geology, and the interplay between tidal and fluvial hydrodynamic forces. These factors distinguish estuarine bedforms from those found in purely fluvial or marine environments.
Field observations conducted across a full tidal cycle, using multibeam echosounder systems and Acoustic Doppler Current Profilers, reveal a widespread presence of large compound bedforms in the Minjiang Estuary. The study identifies both primary and secondary bedforms, with wavelengths ranging from 2 to 233 meters and heights between 0.1 and 6 meters. Approximately 60% of the primary bedforms exhibit ebb asymmetry, suggesting that ebb tides dominate sediment transport in the main channel. The flood/ebb lee side angle averages 6°, with a maximum reaching 19°. Interestingly, unlike many other studied environments, the maximum side angle of primary bedforms in this estuary is greater than that of secondary bedforms, highlighting unique hydrodynamic conditions that influence sediment transport and bedform evolution.
The results further indicate that water depth and riverbed slope significantly impact bedform density, with flatter areas promoting bedform formation compared to sloping beds. Bed shear stress fluctuations throughout the tidal cycle contribute to variations in bedform size and morphology. Additionally, high clay content in surface sediments appears to reduce bedform density due to poor sorting characteristics, suggesting that clay-rich environments may be less conducive to bedform development.
The insights gained from this study are transferable to other macrotidal estuaries worldwide, particularly those with strong river-tide interactions and complex geological settings. By identifying key drivers and feedback mechanisms controlling multiscale bedform development, this research contributes broadly applicable principles for interpreting sediment transport dynamics and morphologic evolution in estuaries with similarly energetic and variable flow regimes.
Beyond enhancing our knowledge of bedform dynamics and sediment transport in macrotidal estuaries, this research offers valuable insights for hydrodynamic modeling and estuarine management. The findings contribute to better strategies for estuarine conservation and sustainable development. Future research should further investigate the multiscale evolution of bedforms under varying seasonal and tidal conditions to refine our understanding of their formation mechanisms and long-term morphological changes.
Statements
Data availability statement
The raw data supporting the conclusions of this article will be made available by the authors, without undue reservation.
Author contributions
RL: Conceptualization, Data curation, Formal analysis, Funding acquisition, Investigation, Methodology, Project administration, Software, Validation, Visualization, Writing – original draft. HC: Conceptualization, Data curation, Funding acquisition, Investigation, Project administration, Resources, Supervision, Visualization, Writing – review & editing. JC: Data curation, Investigation, Software, Writing – review & editing. LT: Conceptualization, Data curation, Formal analysis, Methodology, Software, Writing – review & editing. ZR: Data curation, Investigation, Methodology, Software, Writing – review & editing. QY: Investigation, Writing – review & editing. HF: Visualization, Writing – review & editing. AL: Conceptualization, Methodology, Software, Supervision, Visualization, Writing – review & editing.
Funding
The author(s) declare that financial support was received for the research and/or publication of this article. This work was supported by the National Natural Science Foundation of China (grant number 42271009) and the China Scholarship Council (grant number 202306140099).
Conflict of interest
The authors declare that the research was conducted in the absence of any commercial or financial relationships that could be construed as a potential conflict of interest.
Generative AI statement
The author(s) declare that Generative AI was used in the creation of this manuscript. During the preparation of this work, the authors used ChatGPT to polish the language. After using this tool, the authors reviewed and edited the content as needed and take full responsibility for the content of the publication.
Publisher’s note
All claims expressed in this article are solely those of the authors and do not necessarily represent those of their affiliated organizations, or those of the publisher, the editors and the reviewers. Any product that may be evaluated in this article, or claim that may be made by its manufacturer, is not guaranteed or endorsed by the publisher.
Supplementary material
The Supplementary Material for this article can be found online at: https://www.frontiersin.org/articles/10.3389/fmars.2025.1585285/full#supplementary-material
References
1
Baas J. H. Best J. L. Peakall J. (2011). Depositional processes, bedform development and hybrid bed formation in rapidly decelerated cohesive (mud–sand) sediment flows. Sedimentology.58, 1953–1987. doi: 10.1111/j.1365-3091.2011.01247.x
2
Baas J. H. Malarkey J. Lichtman I. D. Amoudry L. O. Thorne P. D. Hope J. A. et al . (2021). Current-and wave-generated bedforms on mixed sand–clay intertidal flats: a new bedform phase diagram and implications for bed roughness and preservation potential. Front. Earth Sci.9, 747567. doi: 10.3389/feart.2021.747567
3
Bennett S. J. Best J. L. (1995). Mean flow and turbulence structure over fixed, two-dimensional dunes: implications for sediment transport and bedform stability. Sedimentology.42, 491–513. doi: 10.1111/j.1365-3091.1995.tb00386.x
4
Berne S. Castaing P. Le Drezen E. Lericolais G. (1993). Morphology, internal structure, and reversal of asymmetry of large subtidal dunes in the entrance to Gironde Estuary (France). Journal of Sedimentary Research. 63 (5), 780–793. doi: 10.1306/D4267C03-2B26-11D7-8648000102C1865D
5
Best J. (2005). The fluid dynamics of river dunes: a review and some future research directions. J. Geophysical Research: Earth Surface110, 1–21. doi: 10.1029/2004JF000218
6
Blair T. C. McPherson J. G. (1999). Grain-size and textural classification of coarse sedimentary particles. Journal of Sedimentary Research. 69 (1), 6–19. doi: 10.2110/jsr.69.6
7
Boyd R. Dalrymple R. Zaitlin B. A. (1992). Classification of clastic coastal depositional environments. Sedimentary Geology. 80 (3), 139–150. doi: 10.1016/0037-0738(92)90037-R
8
Bradley R. W. Venditti J. G. (2017). Reevaluating dune scaling relations. Earth-Sci. Rev.165, 356–376. doi: 10.1016/j.earscirev.2016.11.004
9
Bradley R. W. Venditti J. G. (2021). Mechanisms of dune growth and decay in rivers. Geophys. Res. Lett.48, e2021G–e94572G. doi: 10.1029/2021GL094572
10
Carstensen S. Sumer B. FredSØE J. (2010). Coherent structures in wave boundary layers. Part 1. Oscillatory motion. J. Fluid Mech.646, 169–206. doi: 10.1017/S0022112009992825
11
Chen X. F. Ma S. Y. Liu C. Z. (1998). Dynamic deposition characteristics of the Minjiang Estuary. Mar. Bulletin.6, 40–47.
12
Cheng H. Q. Chen W. Li J. F. Jiang Y. H. Hu X. Zhang X. L. et al . (2022). Morphodynamic changes in the yangtze estuary under the impact of the three gorges dam, estuarine engineering interventions and climate-induced sea level rise. Earth Planet. Sci. Lett.580, 117385. doi: 10.1016/j.epsl.2022.117385
13
Cheng H. Q. Kostaschuk R. Shi Z. (2004a). Tidal currents, bed sediments, and bedforms at the south branch and the south channel of the changjiang (yangtze) estuary, China; Implications for the ripple-dune transition. Estuaries.27, 861–866. doi: 10.1007/BF02912047
14
Cheng H. Q. Shi Z. Ray K. Dong L. X. (2004b). Stability field for sand bedforms at the South Branch and the South Channel in the Changjiang (Yangtze) Estuary. Oceanologia Et Limnologia Sinica.35, 214–220. doi: 10.3321/j.issn:0029-814X.2004.03.004
15
Cisneros J. Best J. van Dijk T. Almeida R. P. D. Amsler M. Boldt J. et al . (2020). Dunes in the world’s big rivers are characterized by low-angle lee-side slopes and a complex shape. Nat. Geosci.13, 156–162. doi: 10.1038/s41561-019-0511-7
16
Claudin P. Andreotti B. (2006). A scaling law for aeolian dunes on mars, venus, earth, and for subaqueous ripples. Earth Planet. Sci. Lett.252, 30–44. doi: 10.1016/j.epsl.2006.09.004
17
Couldrey A. J. Benson T. Knaapen M. A. F. Marten K. V. Whitehouse R. J. S. (2020). Morphological evolution of a barchan dune migrating past an offshore wind farm foundation. Earth Surf. Process. Landf.45, 2884–2896. doi: 10.1002/esp.4937
18
Dalrymple R. W. Knight R. J. Lambiase J. J. (1978). Bedforms and their hydraulic stability relationships in a tidal environment, bay of fundy, Canada. Nature.275, 100–104. doi: 10.1038/275100a0
19
Dalrymple R. W. Rhodes R. N. (1995). Chapter 13 estuarine dunes and bars. In Perillo, G. M. E. (Ed.). Developments Sedimentology53, pp. doi: 10.1016/S0070-4571(05)80033-0
20
Damen J. M. Dijk T. A. G. P. Hulscher S. J. M. H. (2018). Spatially varying environmental properties controlling observed sand wave morphology. J. geophysical Res. Earth surface.123, 262–280. doi: 10.1002/2017JF004322
21
Davis J. M. Banham S. G. Grindrod P. M. Boazman S. J. Balme M. R. Bristow C. S. (2020). Morphology, development, and sediment dynamics of elongating linear dunes on mars. Geophys. Res. Lett.47, 1–9. doi: 10.1029/2020GL088456
22
de Lange S. I. Bradley R. Schrijvershof R. A. Murphy D. Waldschlaeger K. Kostaschuk R. et al . (2024). Dune geometry and the associated hydraulic roughness in the fluvial to tidal transition zone of the fraser river at low river flow. J. Geophysical Research: Earth Surface129, 1–25. doi: 10.1029/2023JF007340
23
Duran Vinent O. Andreotti B. Claudin P. Winter C. (2019). A unified model of ripples and dunes in water and planetary environments. Nat. Geosci.12, 345–350. doi: 10.1038/s41561-019-0336-4
24
Ernstsen V. B. Noormets R. Winter C. Hebbeln D. Bartholomä A. Flemming B. W. et al . (2006). Quantification of dune dynamics during a tidal cycle in an inlet channel of the danish wadden sea. Geo-Mar. Lett.26, 151–163. doi: 10.1007/s00367-006-0026-2
25
Ernstsen V. Winter C. Becker M. Bartholdy J. (2009). Tide-controlled variations of primary- and secondary-bedform height: Innenjade tidal channel (Jade Bay, German Bight). In VionnetC.PerilloG.LatrubesseE.GarciaM. (Eds.), River, Coastal and Estuarine Morphodynamics: RCEM 2009 (1 ed., pp. 779-786). London: Taylor & Francis.
26
Ferraro D. Dey S. (2015). “Principles of mechanics of bedforms,” in Rivers – physical, fluvial and environmental processes. Eds. RowińskiP.Radecki-PawlikA. (Springer International Publishing, Cham), 79–98.
27
Francalanci S. Solari L. Toffolon M. (2009). Local high-slope effects on sediment transport and fluvial bed form dynamics. Water Resour. Res.45, W05426. doi: 10.1029/2008WR007290
28
Folk R. L. (1954). The Distinction between Grain Size and Mineral Composition in Sedimentary-Rock Nomenclature. The Journal of Geology. 62, 344–359. doi: 10.1086/626171
29
Franzetti M. Le Roy P. Delacourt C. Garlan T. Cancouet R. Sukhovich A. et al . (2013). Giant dune morphologies and dynamics in a deep continental shelf environment: example of the banc du four (western brittany, France). Mar. Geol.346, 17–30. doi: 10.1016/j.margeo.2013.07.014
30
Galeazzi C. P. Almeida R. P. Mazoca C. E. M. Best J. L. Freitas B. T. Ianniruberto M. et al . (2018). The significance of superimposed dunes in the amazon river: implications for how large rivers are identified in the rock record. Sedimentology.65, 2388–2403. doi: 10.1111/sed.12471
31
Galloway W. E. (1975). Process framework for describing the morphologic and stratigraphic evolution of deltaic depositional systems. In: BroussardM. L. (Ed.). (Houston: Houston Geological Society), 87–98.
32
Hansen C. J. Bourke M. Bridges N. T. Byrne S. Colon C. Diniega S. et al . (2011). Seasonal erosion and restoration of mars’ northern polar dunes. Sci. (American Assoc. Advancement Science).331, 575–578. doi: 10.1126/science.1197636
33
Hendershot M. L. Venditti J. G. Bradley R. W. Kostaschuk R. A. Church M. Allison M. A. et al . (2015). Response of low-angle dunes to variable flow. Sedimentology.63, 743–760. doi: 10.1111/sed.12236
34
Herrling G. Becker M. Lefebvre A. Zorndt A. Krämer K. Winter C. (2021). The effect of asymmetric dune roughness on tidal asymmetry in the weser estuary. Earth Surf. Process. Landf.46, 2211–2228. doi: 10.1002/esp.5170
35
Hu H. Taoyuan W. Zhongyong Y. Hackney C. R. Parsons D. R. (2018). Low-angle dunes in the changjiang (yangtze) estuary; Flow and sediment dynamics under tidal influence. Estuarine Coast. shelf science.205, 110–122. doi: 10.1016/j.ecss.2018.03.009
36
Jackson D. W. T. Bourke M. C. Smyth T. A. G. (2015). The dune effect on sand-transporting winds on mars. Nat. Commun.6, 8796. doi: 10.1038/ncomms9796
37
Jin Y. H. Sun Z. L. (1992). Mixing characteristics of salt and freshwater in Chinese estuaries. Acta Geographica Sinica.47, 165–173. doi: 10.11821/xb199202008
38
Julien P. Y. (2010). Erosion and sedimentation (Cambridge: Cambridge University Press).
39
Lämmel M. Meiwald A. Yizhaq H. Tsoar H. Katra I. Kroy K. (2018). Aeolian sand sorting and megaripple formation. Nat. Phys.14, 759–765. doi: 10.1038/s41567-018-0106-z
40
Lefebvre A. (2019). Three-dimensional flow above river bedforms: insights from numerical modeling of a natural dune field (río paraná, Argentina). J. Geophysical Research: Earth Surface.124, 2241–2264. doi: 10.1029/2018JF004928
41
Lefebvre A. Cisneros J. (2023). The influence of dune lee side shape on time-averaged velocities and turbulence. Earth Surf. Dyn.11, 575–591. doi: 10.5194/esurf-11-575-2023
42
Lefebvre A. Ernstsen V. B. Winter C. (2011). Influence of compound bedforms on hydraulic roughness in a tidal environment. Ocean Dyn.61, 2201–2210. doi: 10.1007/s10236-011-0476-6
43
Lefebvre A. Herrling G. Becker M. Zorndt A. Krämer K. Winter C. (2021). Morphology of estuarine bedforms, weser estuary, Germany. Earth Surf. Process. Landf.47, 242–256. doi: 10.1002/esp.5243
44
Lefebvre A. Paarlberg A. J. Ernstsen V. B. Winter C. (2014). Flow separation and roughness lengths over large bedforms in a tidal environment: a numerical investigation. Cont. Shelf Res.91, 57–69. doi: 10.1016/j.csr.2014.09.001
45
Lefebvre A. Winter C. (2021). Special issue: marine and river bedforms dynamics, marid vi. Earth Surf. Process. Landf.46, 1646–1651. doi: 10.1002/esp.5091
46
Li D. Y. Chen J. Wang A. J. Yu X. G. (2008). Recent progress in sediment transport research in Minjiang Estuary. Mar. Sci. Bulletin.02, 111–116. doi: 1001-6932(2008)02-0111-0006
47
Li D. Li Y. Xu Y. (2017). Observations of distribution and flocculation of suspended particulate matter in the minjiang river estuary, China. Mar. Geol.387. doi: 10.1016/j.margeo.2017.03.006
48
Lin Q. D. (1986). A preliminary study on tidal wave evolution in the tidal zone of the Minjiang Estuary. J. Fujian Normal Univ. (Natural Science).04, 89–96.
49
Liu R. Cheng H. Teng L. Fan H. (2023b). Changes over flood season in turbidity maximum zone in a mountainous macrotidal estuary from 1986 to 2020. J. Geogr. Sci.33, 980–998. doi: 10.1007/s11442-023-2116-8
50
Liu C. Z. Jia H. L. Chen X. F. (2001). Sedimentary texture and sedimentation in the Minjiang River Estuary. Oceanologia Et Limnologia Sinica.02, 177–184.
51
Liu J. Lu Y. Zuo L. Liu H. Xu Q. Hou Q. (2022). Morphologic evolution of bifurcated reaches in a macrotidal estuary with mountain streams. Int. J. Sediment Res.37, 857–870. doi: 10.1016/j.ijsrc.2022.07.004
52
Liu J. Qin X. Ren X. Wang X. Sun Y. Zeng X. et al . (2023a). Martian dunes indicative of wind regime shift in line with end of ice age. Nature.620, 303–309. doi: 10.1038/s41586-023-06206-1
53
Ma X. Li J. Yan J. Feng X. Song Y. Xu T. et al . (2022). The encountering dune fields in a bidirectional flow system in the northwestern south China sea: pattern, morphology, and recent dynamics. Geomorphology.406, 108210. doi: 10.1016/j.geomorph.2022.108210
54
Malarkey J. Baas J. H. Hope J. A. Aspden R. J. Parsons D. R. Peakall J. et al . (2015). The pervasive role of biological cohesion in bedform development. Nat. Commun.6, 6257. doi: 10.1038/ncomms7257
55
Noormets R. Ernstsen V. B. Bartholomä A. Flemming B. W. Hebbeln D. (2006). Implications of bedform dimensions for the prediction of local scour in tidal inlets: a case study from the southern north sea. Geo-Mar. Lett.26, 165–176. doi: 10.1007/s00367-006-0029-z
56
Prokocki E. W. Best J. L. Perillo M. M. Ashworth P. J. Parsons D. R. Smith G. H. S. et al . (2022). The morphology of fluvial-tidal dunes: lower columbia river, Oregon/Washington, USA. Earth Surf. Process. Landf.47, 2079–2106. doi: 10.1002/esp.5364
57
Reesink A. J. H. Parsons D. R. Ashworth P. J. Best J. L. C. Hardy R. J. Murphy B. J. et al . (2018). The adaptation of dunes to changes in river flow. Earth-Sci. Rev.185, 1065–1087. doi: 10.1016/j.earscirev.2018.09.002
58
Scheiber L. Lojek O. Götschenberg A. Visscher J. Schlurmann T. (2021). Robust methods for the decomposition and interpretation of compound dunes applied to a complex hydromorphological setting. Earth Surf. Process. Landf.46, 478–489. doi: 10.1002/esp.5040
59
Smith J. D. McLean S. R. (1977). Spatially averaged flow over a wavy surface. J. Geophys. Res. (1896-1977).82, 1735–1746. doi: 10.1029/JC082i012p01735
60
Soulsby R. L. V. (1997). Dynamics of marine sands: a manual for practical applications (London: Telford).
61
Sun Y. Cai T. L. Chai J. L. Jin R. Y. (1983). Runoff characteristics of mountainous estuaries in Fujian-Zhejiang and their influence on estuarine erosion and deposition. East China Sea Ocean.02, 29–35.
62
Sutherland A. J. (1967). Proposed mechanism for sediment entrainment by turbulent flows. J. Geophysical Res. (1896-1977).72, 6183–6194. doi: 10.1029/JZ072i024p06183
63
van den Berg J. H. van Gelder A. Marzo M. Puigdefábregas C. Marzo M. Puigdefabregas C. (1993). A new bedform stability diagram, with emphasis on the transition of ripples to plane bed in flows over fine sand and silt. Alluvial Sedimentation.17, 11–21. doi: 10.1002/9781444303995.ch2
64
van der Mark R. Blom A. (2007). A new and widely applicable tool for determining the geometric properties of bedforms (Enschede, Netherlands: Water Engineering & Management (WEM).
65
Van Landeghem K. J. J. Wheeler A. J. Mitchell N. C. Sutton G. (2009). Variations in sediment wave dimensions across the tidally dominated irish sea, nw europe. Mar. Geol.263, 108–119. doi: 10.1016/j.margeo.2009.04.003
66
Van Rijn L. C. (2020). Erodibility of mud-sand bed mixtures. J. Hydraul. Eng.-ASCE.146. doi: 10.1061/(ASCE)HY.1943-7900.0001677
67
Villard P. Kostaschuk R. (1998). The relation between shear velocity and suspended sediment concentration over dunes; Fraser estuary, Canada. Mar. Geol.148, 71–81. doi: 10.1016/S0025-3227(98)00015-2
68
Vittori G. Blondeaux P. (2022). Predicting offshore tidal bedforms using stability methods. Earth-Sci. Rev.235, 104234. doi: 10.1016/j.earscirev.2022.104234
69
Vriend N. M. Jarvis P. A. (2018). Megaripples: between a ripple and a dune. Nat. Phys.14, 641–642. doi: 10.1038/s41567-018-0113-0
70
Wan Z. (1985). Bed material movement in hyperconcentrated flow. J. Hydraul. Eng.-ASCE.111, 987–1002. doi: 10.1061/(ASCE)0733-9429(1985)111:6(987
71
Wan Z. Wang Z. (1994). Hyperconcentrated flow (1st editioned.) (London: CRC Press).
72
Wang C. Cai F. Qi H. Zhao S. Liu G. He Y. et al . (2024). Response patterns of mountain river deltas and adjacent coasts to the changes in sediment discharge: A case study of Minjiang River, China. Journal of Hydrology: Regional Studies. 56, 102051. doi: 10.1016/j.ejrh.2024.102051
73
Wu S. H. Cheng H. Q. (2022). Two decades of morphological changes of the South Branch of the Yangtze River Estuary in response to fluvial sediment decline. J. Sediment Res.47, 74–80. doi: 10.16239/j.cnki.0468-155x.2022.06.011
74
Yan J. Zhu Y. M. Chen D. Lu P. (2020). Influence of bed surface armoring on bed-load transport rate and particle gradation. J. Sediment Res.45, 15–20. doi: 10.16239/j.cnki.0468-155x.2020.06.003
75
Ye Y. Y. (2000). Impact of the Shuikou Hydropower Station construction on the Minjiang Estuary region. Port Waterway Eng.06, 33–36 + 38. doi: 10.16233/j.cnki.issn1002-4972.2000.06.007
76
Yu M. T. (1992). Study on saltwater transgression in north tributary of Minjiang Estuary in winter. Mar. Sci. Bulletin.11, 17–22.
77
Zheng X. P. (1989). A preliminary analysis of tidal characteristics in the Minjiang Estuary. Hydraulic Sci. Technol.02, 31–36 + 27.
78
Zheng S. Cheng H. Wu S. Shi S. Xu W. Zhou Q. et al . (2017). Morphology and mechanism of the very large dunes in the tidal reach of the yangtze river, China. Cont. Shelf Res.139, 54–61. doi: 10.1016/j.csr.2016.10.006
79
Zheng S. W. Cheng H. Q. Wu S. H. Liu G. W. Lu X. J. Xu W. X. (2016). Discovery and significance of bead-chain sand ripples. Sci. China: Earth Sci.46, 18–26. doi: 10.1007/s11430-015-5194-3
80
Zhu Y. K. (1991). Characteristics, types, and formation of bifurcated riverbeds in the Minjiang Estuary. Acta Oceanologica Sinica.13, 363–370.
81
Zomer J. Y. Hoitink A. J. F. (2024). Evidence of secondary bedform controls on river dune migration. Geophys. Res. Lett.51, 1–9, e2024GL109320. doi: 10.1029/2024GL109320
82
Zomer J. Y. Naqshband S. Hoitink A. J. F. (2022). Short communication: a tool for determining multiscale bedform characteristics from bed elevation data. Earth Surf. Dyn.10, 865–874. doi: 10.5194/esurf-10-865-2022
83
Zomer J. Y. Naqshband S. Vermeulen B. Hoitink A. J. F. (2021). Rapidly migrating secondary bedforms can persist on the lee of slowly migrating primary river dunes. J. Geophysical Research: Earth Surface126, 1–20, e2020JF005918. doi: 10.1029/2020JF005918
84
Zomer J. Y. Vermeulen B. Hoitink A. J. F. (2023). Coexistence of two dune scales in a lowland river. Earth Surf. Dyn.11, 1283–1298. doi: 10.5194/esurf-11-1283-2023
Summary
Keywords
mountainous macrotidal estuary, bedform morphology, multiscale, hydrodynamics, Minjiang Estuary
Citation
Liu R, Cheng H, Chen J, Teng L, Ren Z, Yang Q, Fan H and Lefebvre A (2025) Subaqueous multiscale bedform morphology dynamics in a mountainous macrotidal estuary. Front. Mar. Sci. 12:1585285. doi: 10.3389/fmars.2025.1585285
Received
28 February 2025
Accepted
03 June 2025
Published
23 June 2025
Volume
12 - 2025
Edited by
Marco Bajo, National Research Council (CNR), Italy
Reviewed by
Leiping Ye, Sun Yat-sen University, China
Shidong Liu, Ocean University of China, China
Updates
Copyright
© 2025 Liu, Cheng, Chen, Teng, Ren, Yang, Fan and Lefebvre.
This is an open-access article distributed under the terms of the Creative Commons Attribution License (CC BY). The use, distribution or reproduction in other forums is permitted, provided the original author(s) and the copyright owner(s) are credited and that the original publication in this journal is cited, in accordance with accepted academic practice. No use, distribution or reproduction is permitted which does not comply with these terms.
*Correspondence: Heqin Cheng, hqch@sklec.ecnu.edu.cn; Alice Lefebvre, alefebvre@marum.de
Disclaimer
All claims expressed in this article are solely those of the authors and do not necessarily represent those of their affiliated organizations, or those of the publisher, the editors and the reviewers. Any product that may be evaluated in this article or claim that may be made by its manufacturer is not guaranteed or endorsed by the publisher.