Abstract
Estuarine hydrodynamics, governing the interplay between riverine inputs, tidal currents, and coastal processes, are critical to understanding material transport, ecosystem dynamics, and anthropogenic impacts in transitional coastal zones. This study uses a high-resolution Coupled-Ocean-Atmosphere-Wave-Sediment Transport Modeling System (COAWST) to investigate the wave-current interactions in the shallow Pearl River Estuary during the winter, focusing on two typical tidal phases: maximum flood and maximum ebb. The results indicate that tidal currents significantly modulate the significant wave height, wave direction, and absolute mean bottom period within the estuary, with stronger modulation during maximum ebb. The wave-enhanced bottom friction notably weakens both maximum flood and ebb tidal currents, causes phase delays in the water level, and enhances tidal energy dissipation, which results in a reduction of water level amplitudes, especially at the estuary head. Wave-enhanced mixing and 3D wave forces cause significant adjustments in the current field nearby the plume front. The adjustments in the current field by the wave-enhanced bottom stress restrict more freshwater near the river mouths, lowering the salinity at the estuary head while increasing the salinity south of Qi’ao Island, significantly influencing the location of the plume front. Additionally, wave-enhanced mixing and wave forces significantly influence the position of the plume front. This study provides new insights into the wave-current interactions in the Pearl River Estuary and their impact on the dynamics of the freshwater plume.
1 Introduction
Estuaries play a crucial role in supporting human societies by providing resources for agriculture, fisheries, and tourism, while also serving as critical habitats for diverse ecosystems. These dynamic regions serve as a transition zone between land and sea, where freshwater and seawater interact, influencing coastal productivity and biodiversity. In particular, the Pearl River Estuary, located in the northern South China Sea, is a vital environmental and economic area, contributing significantly to the surrounding ecosystem and human livelihoods. The Pearl River, approximately 2,214 km in length with a drainage area of about 452,000 km², is the third-longest river in China, after the Yangtze and Yellow Rivers. In terms of runoff volume, it ranks second only to the Yangtze, with an average annual discharge of 10,000 m³/s (Zhao, 1990), making it the most significant runoff input to the northern South China Sea.
At the estuary, the river network is intricate, with freshwater primarily entering the South China Sea through eight outlets: Humen, Jiaomen, Hongqili, Hengmen, Modaomen, Jitimen, Hutiaomen, and Yamen, as shown in Figure 1A. In this paper, the Pearl River Estuary under discussion specifically refers to the Lingding Bay. Approximately 60% of the Pearl River’s discharge flows into this area through Humen, Jiaomen, Hongqimen, and Hengmen (Zhao, 1990). The estuary has a semi-enclosed bell-shaped morphology, covering an area of approximately 2,500 km² (Larson et al., 2005). The estuary’s head is approximately 5 km wide, but expanding to about 60 km at the southern end. The presence of deep channels, shoals, islands, and a meandering coastline makes the topography within the estuary highly complex. The western part of the estuary has depths ranging from 2 to 5 m, while the eastern part is slightly deeper, with two deep channels approximately 10 m deep located along the estuary’s central axis and near the eastern shore. Situated in the subtropical monsoon zone, the estuary receives an average annual precipitation of 1,600 to 2,300 mm (Ji et al., 2011). During the dry season (October to April of the following year), the dry northeast monsoon dominates most of the Pearl River Basin, with precipitation measuring only 3–4 cm/month (Ding, 1994; Harrison et al., 2008). In contrast, the southwest monsoon during the wet season (May to August) brings warm and moist air, resulting in precipitation of 30–40 cm/month over the Pearl River Basin (Larson et al., 2005). Consequently, the estuary receives only 1,500 m³/s of freshwater during the dry season, but up to 20,000 m³/s during the wet season (Zhao, 1990).
Figure 1
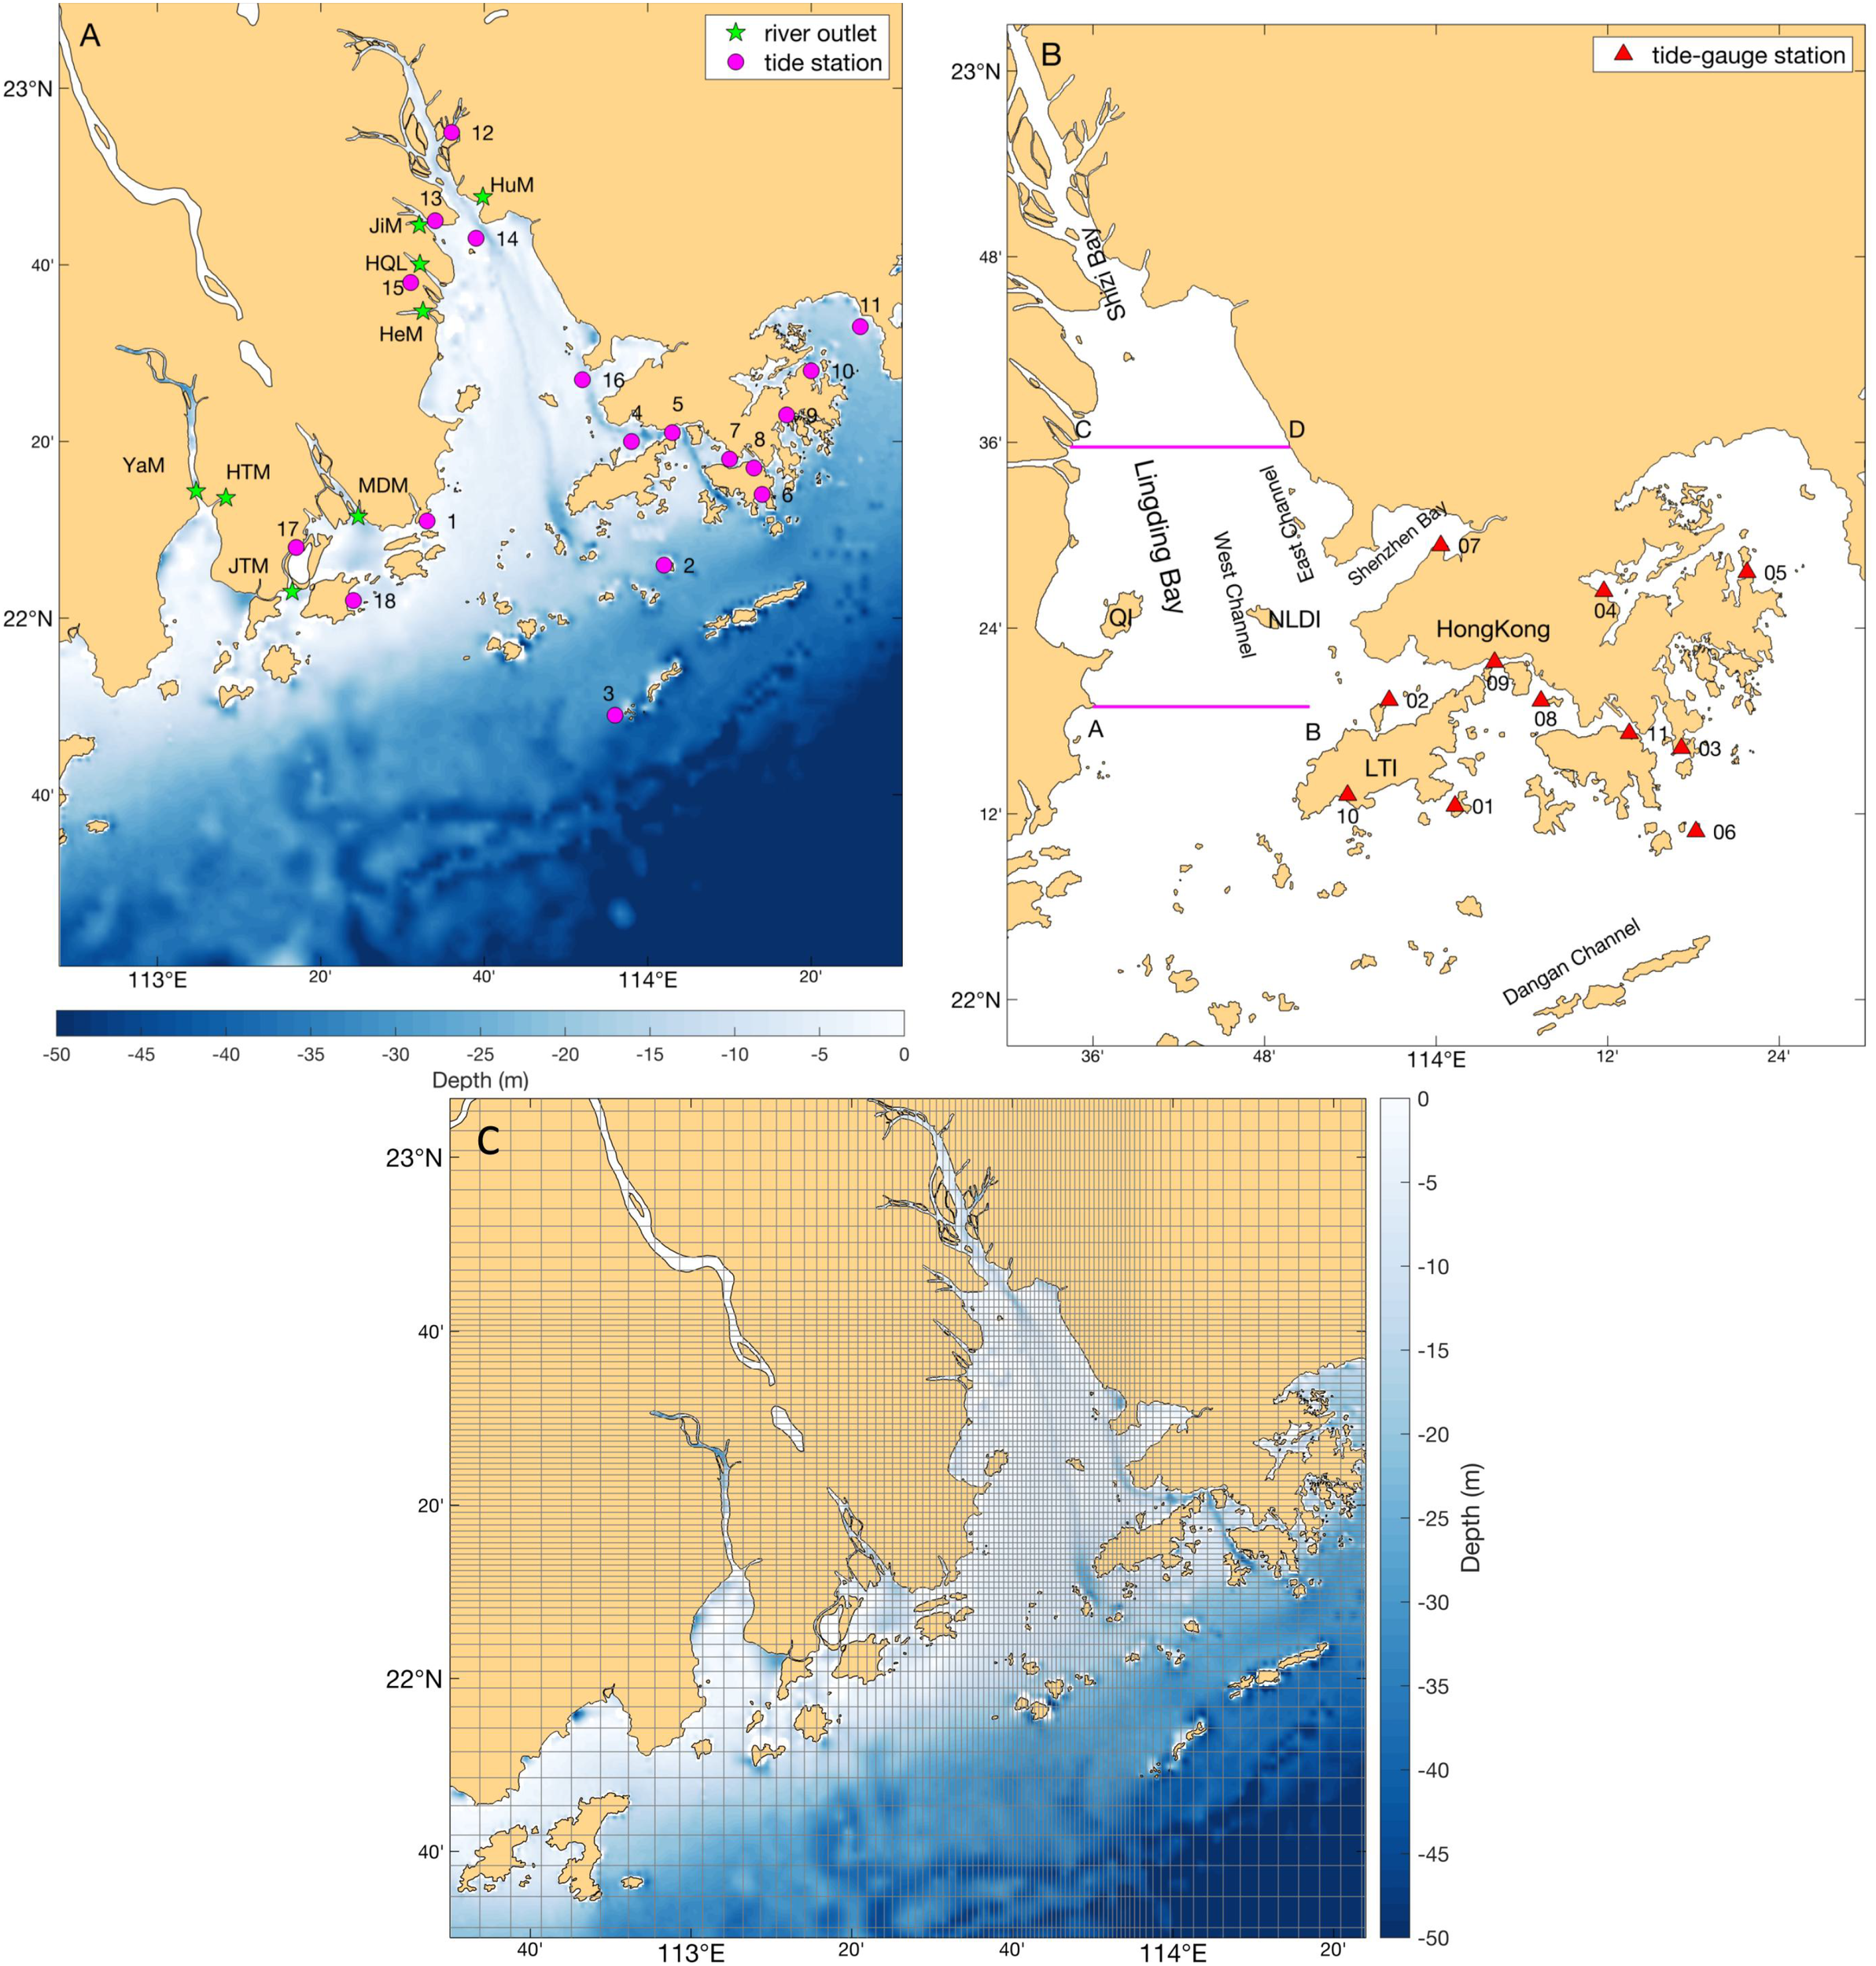
(A) Topography of the Pearl River Estuary and its adjacent seas; (B) distribution of some islands and bays; the abbreviations represent Humen (HuM), Jiaomen (JiM), Hongqili (HQL), Hengmen (HeM), Modaomen (MDM), Jitimen (JTM), Hutiaomen (HTM), Yamen (YaM), Qi’ao Island (QI), Neilingding Island (NLDI), and Lantau Island (LTI). In (A), the asterisks denote the river outlets, and the purple dots represent tide stations. In (B), the triangles denote the Hong Kong tide-gauge stations. (C) The refined grid design for the Pearl River Estuary, with every third grid line plotted.
The tidal range within the Pearl River Estuary varies between 1.0–1.7 m (Ye and Preiffer, 1990). The four principal tidal constituents in this region are M2, S2, K1, and O1, with M2 being the most dominant. The form number ranges from 0.94 to 1.77, classifying the estuary as having a mixed semidiurnal-diurnal tidal regime (Zhao, 1990). In the marine area north of Neilingding Island, tidal currents are predominantly characterized by rectilinear tidal currents. In contrast, south of the island, the area exhibits both rectilinear tidal currents within deep channels and rotational tidal currents over shoals. The scale of the Pearl River Estuary is sufficient to make the Coriolis effect significant, allowing both incident and reflected tidal Kelvin waves to form within the estuary (Ye and Preiffer, 1990). Tidal currents play a crucial role in turbulent mixing within the estuary. Mao et al. (2004) noted that the stability of water columns in the Pearl River Estuary is regulated by tidal energy dissipation and transformation. Consequently, numerous studies have focused on tidal energy budgets within the estuary (Ni et al., 2012; Liu et al., 2015; Bai et al., 2016). Bai et al. (2016) investigated the tidal energy budget within the Pearl River Estuary using a high-resolution baroclinic ROMS model. Their results indicate that approximately 343.49 MW of tidal energy is transmitted into the estuary during the dry season, which is higher than the 336.18 MW during the wet season. This difference is attributed to lower net flow, higher seawater density, and higher average sea surface height in the estuary during the dry season.
In the estuary and adjacent coastal waters, the interactions among runoff, sediment transport, tides, wind forcing, complex topography, large-scale circulation, and Coriolis effects form a complex hydrodynamic system. Wong et al. (2003a, b) conducted a systematic study of the circulation system in the estuary and adjacent offshore areas by combining field measurements with numerical models. They pointed out that the circulation in the Pearl River Estuary exhibits a two-layer structure: low-salinity freshwater spreads outward in the upper layer, while high-salinity coastal water enters the estuary from the lower layer and intrudes toward the bay head. This view has been confirmed by subsequent studies (Wong et al., 2004; Ji et al., 2011; Zheng et al., 2014).
Monsoons have a significant influence on the circulation within the estuary and the expansion of freshwater plumes (Wong et al., 2003b; Dong et al., 2004; Zheng et al., 2014). Based on field measurements, Ou et al. (2007) classified the expansion patterns of the Pearl River plume into four types: offshore bulging expansion, westward coastal expansion, eastward coastal expansion, and coastal symmetric expansion. The size of the freshwater plume is primarily determined by the magnitude of the net discharge, while its shape is regulated by the wind field (Wong et al., 2003b; Ou et al., 2007; Zheng et al., 2014). Zheng et al. (2014) noted that the position of the plume front in the estuary responds differently to changes in discharge at various river outlets, with the most sensitivity observed at Humen. Similarly, Lai et al. (2015) indicated that the upstream river network of the Pearl River plays a crucial role in distributing discharge among the eight river outlets, thereby affecting the dynamic state of the frontal systems within the estuary. Due to the continuous influx of freshwater, the Pearl River Estuary remains highly stratified, especially during the summer (Wong et al., 2003a; Dong et al., 2004). During the dry season, low-salinity water occupies the western estuary, while the eastern region is dominated by vertically homogeneous high-salinity water, resulting in strong salinity fronts within the estuary. In the wet season, the salinity front remains but is confined to the bottom layer, and it can also be observed near the outer estuary. Pan et al. (2014) noted that flood tides and southeast winds promote the formation of supercritical plume fronts outside the estuary, with tidal contributions being more significant. Furthermore, tidal processes critically regulate circulation patterns, sediment transport, and saltwater intrusion within the estuary and its adjacent coastal zones (Wong et al., 2003b, 2004; Mao et al., 2004; Wang and Wai, 2006; Zu et al., 2014).
In summer, the southwest monsoon facilitates the eastward expansion of the Pearl River plume and also triggers upwelling along the Guangdong coast (Gan et al., 2009a; Wang et al., 2012, 2014; Gu et al., 2012). Consequently, interactions between the Pearl River plume and the eastern Guangdong upwelling emerge: the offshore currents within the wind-driven upwelling system enhance plume expansion,while the pressure gradient force generated by the plume and surrounding waters accelerates the wind-driven current near the plume’s coastal edge and weakens it at the offshore edge (Gan et al., 2009b).
Waves and currents play pivotal roles in shaping marine environments through multifaceted mechanisms and complicated wave-current interactions (e.g., Gao et al., 2021, 2023, 2024; Yang et al., 2020; Bai et al., 2019, 2020). In their study on wave-current interactions within the Pearl River Estuary, Wang et al. (2006) concluded that tidal currents generally facilitate the propagation of southeastward waves toward the upper estuary. They observed that ebb tidal currents amplify wave heights (when waves and currents are nearly opposing), whereas flood tidal currents reduce wave heights (when waves and currents are nearly codirectional). However, their model was overly simplified and did not discuss the modulation of the current field by the wave field, nor did it consider the effect of the Pearl River runoff, limiting its ability to explore the dynamic regulation of the freshwater plume by wave-current interactions. Furthermore, Wang (2006) noted that wave-current interactions in the estuary only increase suspended sediment concentrations over shoals and sand ridges, with minimal impact on the overall turbidity distribution within the estuary. Jia et al. (2014) found that in the Modaomen Estuary, flood tidal current can increase the ability of waves to stir the seafloor and increases the concentration of suspended sediment at the bottom. Tidal currents are unable to resuspend bottom sediments, but wave-current interactions facilitate the resuspension of coarse-grained sediments. Later, Jia et al. (2015) investigated wave-current interactions in the Modaomen Estuary across different seasons, they highlighted that waves bring a minor effect on the current in wet season, while both the effects of waves on the current and current on the waves are significant in dry season. They also found that the effects of waves on currents change with the tide, and the changes are larger during neap tide than during spring tide.
Recently, a series of investigations highlighted the vital contributions of wave-current interactions to the storm surge (Luo et al., 2021; Bai et al., 2023; Hu et al., 2023), sediment dynamics (Zhang et al., 2021a; Yang et al., 2022; Zhang et al., 2024), and freshwater transport (Zhang et al., 2021b) in the Pearl River Estuary. However, the existing findings are mainly focused on strong forcing conditions (e.g., typhoons) or limited to part of the Pearl River Estuary (e.g., the Modaomen Estuary). In fact, the numerical models used by previous researchers have either inadequately covered or failed to distinguish between the three main effects of waves on the current field: wave-enhanced bottom boundary layer, wave-enhanced mixing, and 3D wave forces. To address these limitations in previous studies of wave-current interactions within the Pearl River Estuary, this paper employs the COAWST fully coupled wave-current model. Through designed sensitivity experiments, we systematically discuss the wintertime wave-current dynamics in the Pearl River Estuary, with particular focus on their impacts on plume frontal processes. Following this introduction, Section 2 introduces the multi-source data and the configuration of COAWST used in this study; Section 3 mainly presents the spatiotemporal distribution of wave field, current field, and the salinity front within the Pearl River Estuary; Section 4 detailed documents the effects of different wave-current coupling processes on local hydrodynamics; finally, Section 5 briefly summarizes the current work.
2 Data and method
2.1 Tidal observation data
In this study, we collected tidal harmonic constants of M2, S2, K1 and O1 at 18 tide stations (Figure 1A) along the coast of the Pearl River Estuary and its adjacent waters to validate the model tidal performance. Besides, the hourly sea level height data from 9:00 15th April to 18:00 27th April 2015 (GMT+8) provided by the Hong Kong Marine Department and Hong Kong Observatory at 11 stations (Figure 1B) also contribute to the verification on the model.
2.2 ERA-interim reanalysis product
The ERA-interim reanalysis product for Januaries of 1979–2014 was employed to generate the wind forcing as well as the wave boundary conditions for the model. Provided by the European Centre for Medium-Range Weather Forecasts (ECMWF, https://www.ecmwf.int/), this product includes a variety of surface parameters, describing weather as well as ocean-wave and land-surface conditions. The ERA-interim reanalysis is applied extensively in regional oceanographic studies for its high accuracy.
2.3 HYCOM reanalysis data
To obtain the initial and boundary conditions for the circulation model, we used the HYbrid Coordinate Ocean Model (HYCOM, https://www.hycom.org/) GLBa0.08 global ocean reanalysis dataset for Januaries of 2009–2014. This dataset features a horizontal resolution of 1/12° and a vertical hybrid coordinate system with 33 layers. It assimilates multi-source observations, showing high quality during its wide applications in investigations of ocean circulation, fronts, eddies, and air-sea interactions.
2.4 Numerical simulation
This study employs the COAWST modeling system (Warner et al., 2010), which integrates the Regional Ocean Modeling System (ROMS) ocean model (Shchepetkin and McWilliams, 2005), Simulating WAves Nearshore (SWAN) wave model (Booij et al., 1999), and other components (e.g., atmosphere and sediment models). Data exchange between modules is facilitated by the Model Coupling Toolkit (Larson et al., 2005). To isolate wave-current interactions, we exclusively utilize the coupled ROMS-SWAN framework.
2.4.1 Model configuration
For the complicated topography of the Pearl River Estuary, a locally refined computational grid (shared by ROMS and SWAN) was designed (Figure 1C). The grid covers a range of 112.3°E–114.5°E, 21.3°N–23.2°N, with a grid size of 250×280. The locally refined design results in a horizontal resolution of approximately 3 km in the outer estuary, while the resolution within the estuary reaches 300 m. ROMS employs 20 vertical layers, optimized using stretching parameters = 2.0 and = 0.8 to enhance the model’s resolution in the surface and bottom boundary layers. This grid design helps to resolve the hydrodynamic processes within the estuary. The depth data inside the estuary are based on local nautical chart data, while the outer sea region uses the GEBCO 30 arc-second dataset for smooth extension to better depict the study area. Additionally, the minimum depth is set to 2 m to ensure the stability of model integration. When wave-enhanced bottom friction is not considered, the bottom drag coefficient is prescribed as , where , is the von Karman constant, is the vertical distance between the seabed and the center of the bottom grid layer, and the bottom roughness parameter z0 is set to 1 mm (Rong et al., 2014).
At the open boundaries, the harmonic constants of 8 tidal constituents (M2, S2, N2, K2, K1, O1, P1, Q1) derived from the TPXO7 product were considered. In the winter, the wind field has a significant impact on the position of the plume front within the estuary (Zheng et al., 2014). The multi-year monthly-averaged winds based on the ERA-interim reanalysis were used as the wind forcing for the model (Figure 2A). Additionally, other atmospheric forcing terms such as heat and freshwater fluxes were set to 0. For the initial conditions, the salinity field was derived from the HYCOM GLBa0.08 product, the temperature was set to a constant value of 15°C since our focus is on the salinity front. Moreover, the model initialized from a motionless state with both velocity and water level were set to 0. The river discharge was derived from the climatological monthly-averaged data for January at 8 river outlets provided by Zhao (1990). The model’s baroclinic time step was set to 60 s, with a discretization ratio of 30, and data were output every 3 hours.
Figure 2
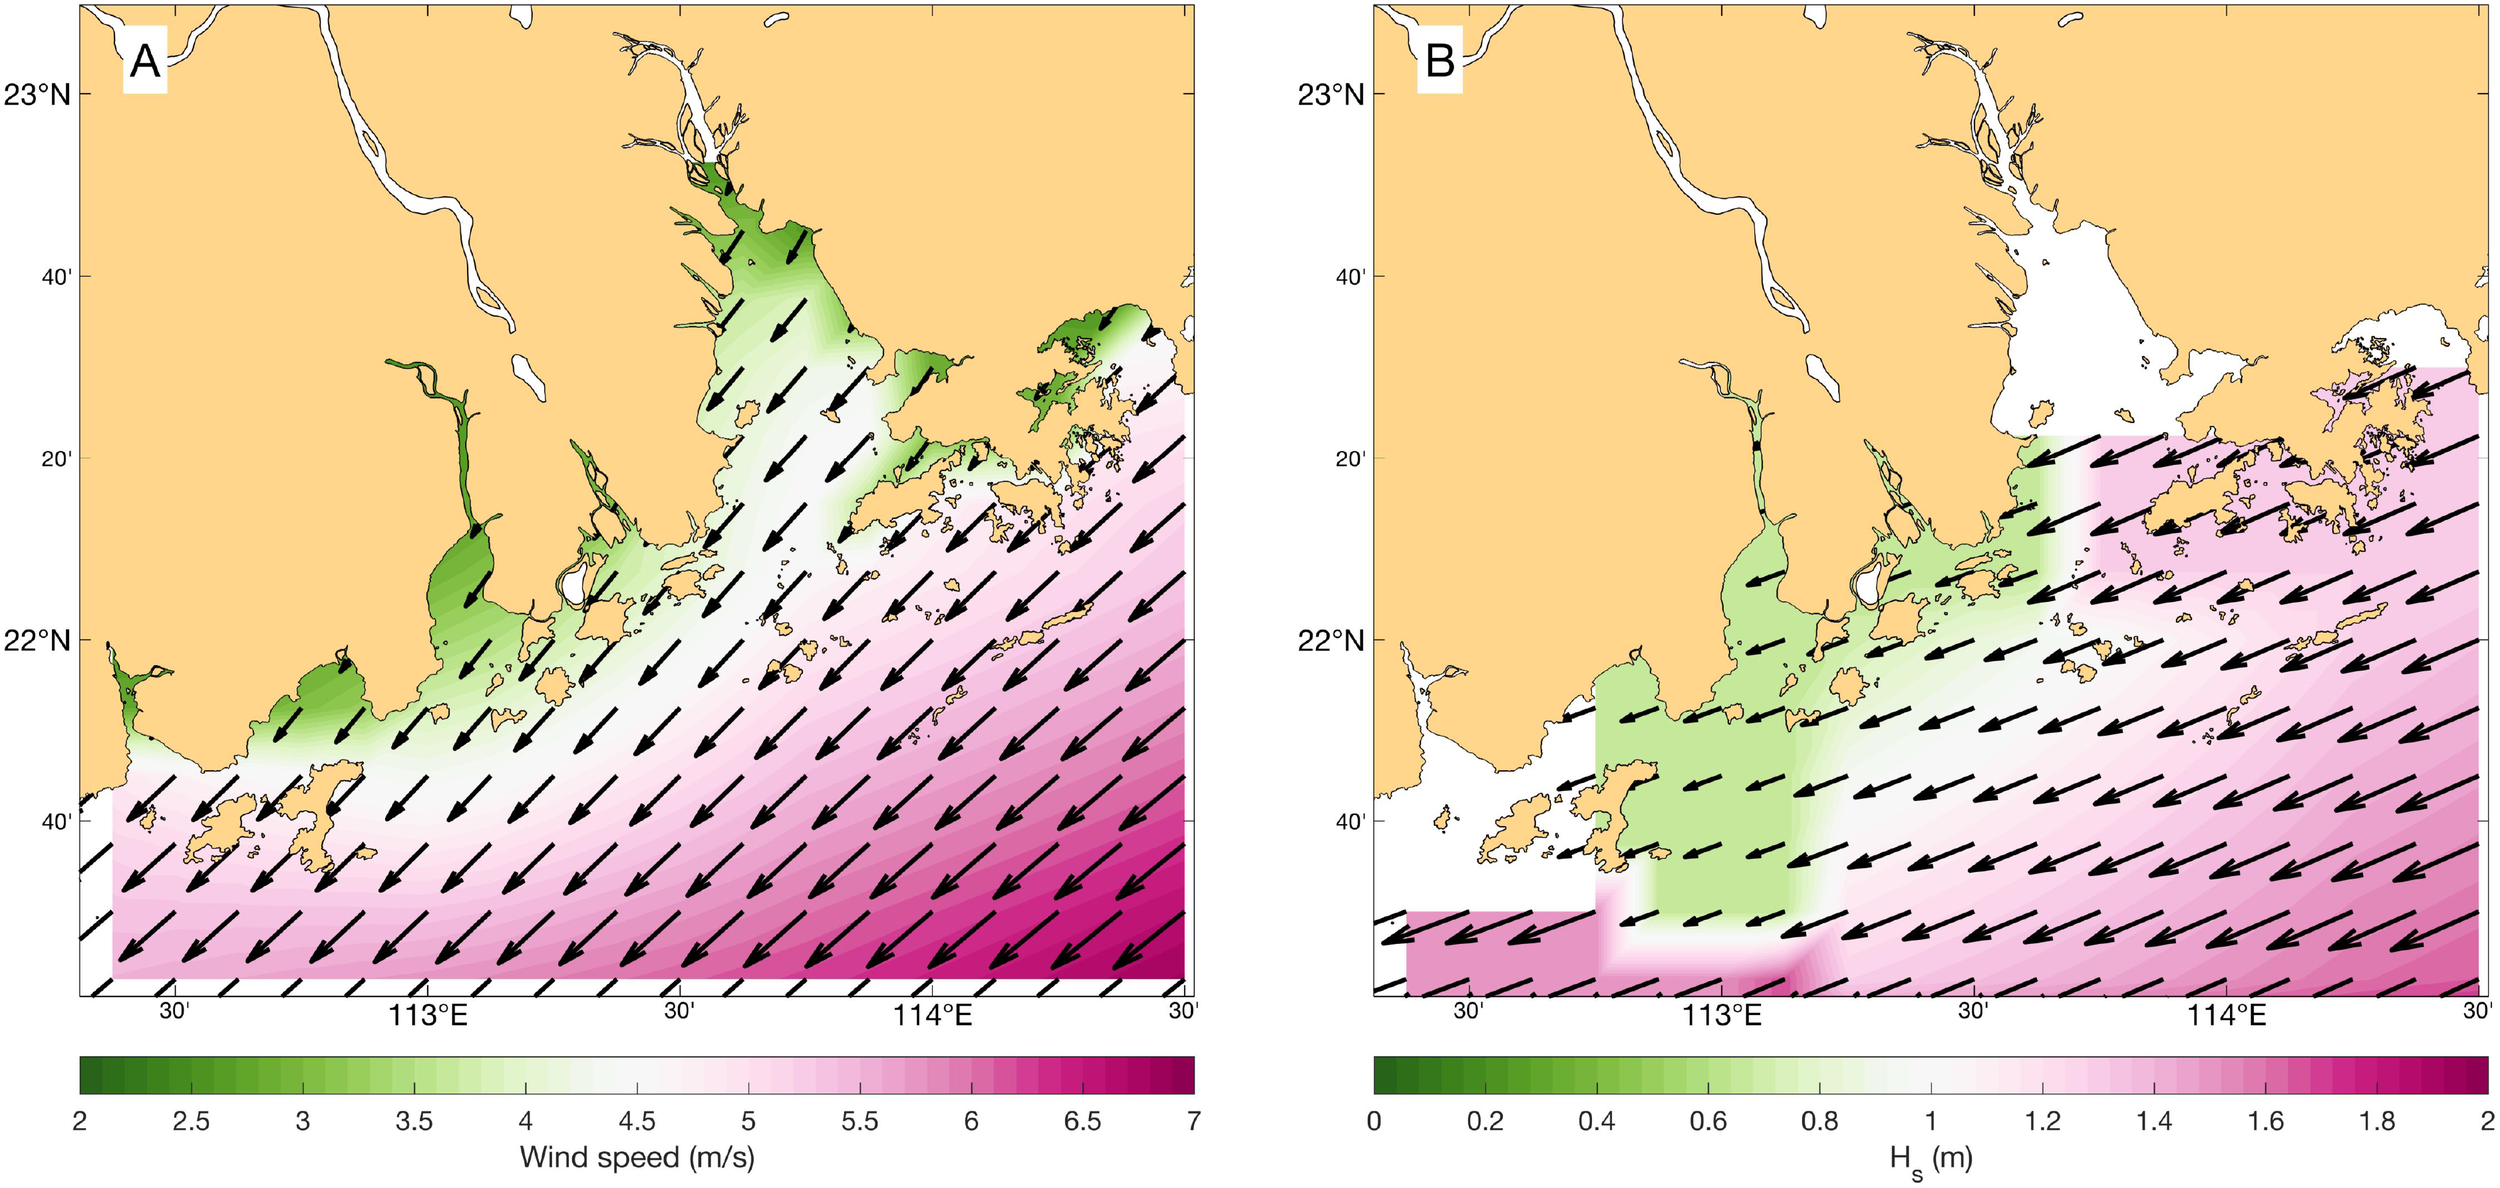
Climatological monthly-averaged wintertime wind (A) and wave (B) fields in the Pearl River Estuary. Data is originated from the ERA-interim reanalysis, the arrows represent the wind or wave direction, with their length and background color corresponding to wind speed or significant wave height.
In the SWAN model, for simplicity, the wind field forcing was set as a uniform wind field with a wind velocity of 3.79 m/s and a wind direction of 40.65°, which was the area-averaged result of the wind forcing for ROMS (Figure 2A). Since the model domain is relatively small, climatological significant wave height, wave period, and wave direction from the ERA-interim reanalysis were input at the eastern, southern, and western boundaries as forcing, in order to more accurately reproduce the wave field within the estuary during winter. The climatological wave field is displayed in Figure 2B. To characterize the wave spectrum, we used 25 frequency bands (0.01-1 Hz) and 36 wave directional bins. Additionally, the computational time step was set to 300 s, with output intervals of 3 hours.
2.4.2 Design of numerical experiments
Wave-current interactions involve bidirectional modulation mechanisms. Currents influence waves through refraction, blocking effects, and modification of wave-bottom drag coefficients (Vincent, 1979; Ris et al., 1999), while water level variations alter wave characteristics via depth-dependent processes (Pleskachevsky et al., 2009).
Conversely, waves modulate currents through three primary pathways: (1) wave-induced enhancement of bottom boundary layer roughness via turbulent kinetic energy transfer (Wave-enhanced BBL, Madsen, 1994; Zou, 2002); (2) Wave breaking injects substantial turbulent kinetic energy to the upper ocean, enhancing the mixing (Wave-induced TKE, Weber, 2008; Olabarrieta et al., 2011); (3) momentum redistribution through 3D vortex forces (3D wave foreces, McWilliams et al., 2004; Uchiyama et al., 2010).
To quantify these coupled dynamics in the Pearl River Estuary, we designed seven numerical experiments (Table 1) using synchronized ROMS-SWAN coupling with 10-minute data exchange intervals. Model outputs at two representative tidal phases (maximum flood/ebb) under equilibrium conditions were analyzed to disentangle dominant interaction mechanisms.
Table 1
| Case abbreviation and description | Model setting | Currents | Water level fluctuation | Wave-induced TKE | Wave-enhanced BBL | 3D wave forces |
|---|---|---|---|---|---|---|
| ROMS: base circulation case | ROMS only | N/A | N/A | N/A | N/A | N/A |
| SWAN: base wave case | SWAN only | N/A | N/A | N/A | N/A | N/A |
| ELV: SWAN with water level fluctuation | ROMS→SWAN partly coupled | OFF* | ON* | OFF | OFF | OFF |
| COUPLE (CUR+ELV): control case | ROMS←→SWAN fully coupled | ON | ON | ON | ON | ON |
| TKE: ROMS with wave-enhanced mixing | ROMS←→SWAN partly coupled | ON | ON | ON | OFF | OFF |
| BBL: ROMS with wave-enhanced bottom boundary layer | ROMS←→SWAN partly coupled | ON | ON | OFF | ON | OFF |
| VF: ROMS with 3D wave forces | ROMS←→SWAN partly coupled | ON | ON | OFF | OFF | ON |
Design of numerical experiments for wave-current interactions in the Pearl River Estuary.
* “ON”/”OFF” indicates specific physical process is considered/omitted.
3 Results
The Pearl River Estuary is a tide-dominated estuary with strong tides, thus, validation of the simulated tides is a critical work before discussing the wave-current interactions within the estuary.
3.1 Model validation
A barotropic tidal model for the Pearl River Estuary was established based on the designed computational grid and tidal boundary forcing. The water level series after model stabilization were subjected to harmonic analysis using the “T_tide” toolbox provided by Pawlowicz et al. (2002). The results were then compared with the tidal harmonic constants from tide gauge stations located in the Pearl River Estuary and its adjacent waters (Figure 1A), as detailed in Table 2. Among the 18 tide gauge stations, the mean absolute errors (MAEs) for the amplitudes of the M2, S2, K1, and O1 tidal constituents are 4.6 cm, 2.8 cm, 3.2 cm, and 2.8 cm, respectively. The MAEs for the phase lags are 9.8°, 15.0°, 4.6°, and 4.6°, with the largest phase lag error occurring in the S2 constituent, likely due to observational errors caused by its small amplitude (Fang et al., 1999; Chen et al., 2009). Overall, the simulation results are reasonable.
Table 2
| Station No. | Longitude (°E) Latitude (°N) | M2 | S2 | K1 | O1 | ||||
|---|---|---|---|---|---|---|---|---|---|
| H | g | H | g | H | g | H | g | ||
| 1 | 113.55/22.18 | 46(46) | 306(290) | 18(16) | 342(326) | 37(35) | 318(310) | 27(29) | 267(262) |
| 2 | 114.03/22.10 | 40(42) | 272(263) | 15(14) | 299(294) | 37(34) | 301(296) | 30(27) | 252(248) |
| 3 | 113.93/21.82 | 30(40) | 275(264) | 12(14) | 305(296) | 34(34) | 302(297) | 27(27) | 255(250) |
| 4 | 113.97/22.33 | 49(46) | 292(299) | 18(14) | 323(334) | 40(35) | 315(312) | 30(29) | 264(266) |
| 5 | 114.05/22.35 | 49(41) | 275(286) | 21(13) | 306(322) | 37(34) | 303(305) | 30(28) | 250(257) |
| 6 | 114.23/22.23 | 40(38) | 265(256) | 15(13) | 295(286) | 37(32) | 298(296) | 30(25) | 250(247) |
| 7 | 114.17/22.30 | 40(44) | 268(266) | 15(15) | 299(297) | 37(34) | 299(297) | 27(27) | 249(249) |
| 8 | 114.22/22.28 | 40(42) | 269(265) | 15(14) | 299(296) | 37(34) | 299(298) | 27(27) | 251(249) |
| 9 | 114.28/22.38 | 37(36) | 262(253) | 15(12) | 287(282) | 34(31) | 295(297) | 27(25) | 247(249) |
| 10 | 114.33/22.47 | 40(37) | 256(253) | 15(12) | 285(281) | 37(32) | 302(298) | 27(25) | 246(249) |
| 11 | 114.43/22.55 | 43(36) | 268(251) | 18(12) | 300(280) | 37(32) | 305(297) | 27(25) | 247(249) |
| 12 | 113.60/22.92 | 67(72) | 7(13) | 23(22) | 43(69) | 39(40) | 341(348) | 30(36) | 292(230) |
| 13 | 113.57/22.75 | 55(62) | 353(6) | 20(19) | 29(61) | 35(38) | 340(345) | 28(35) | 292(298) |
| 14 | 113.65/22.72 | 66(60) | 338(3) | 24(18) | 13(57) | 41(38) | 327(334) | 32(34) | 277(297) |
| 15 | 113.52/22.63 | 44(56) | 345(4) | 16(17) | 20(57) | 31(37) | 341(344) | 25(33) | 295(297) |
| 16 | 113.87/22.45 | 58(51) | 305(314) | 22(15) | 340(352) | 40(36) | 311(318) | 32(30) | 262(271) |
| 17 | 113.28/22.13 | 48(48) | 299(302) | 19(18) | 337(352) | 36(36) | 319(320) | 29(31) | 271(271) |
| 18 | 113.40/22.03 | 45(48) | 278(281) | 18(17) | 313(319) | 37(35) | 305(307) | 30(29) | 256(259) |
| Mean Absolute Error | 4.6 | 9.8 | 2.8 | 15.0 | 3.2 | 4.6 | 2.8 | 4.6 | |
Comparison between simulated and observed values for the four major tidal constituents (M2, S2, K1, and O1), values in parentheses represent simulated results, with amplitude (H) in centimeters and phase lag (g) in the UTC+8 time zone.
Furthermore, the model’s hindcast water levels were validated against tidal observations from 11 tidal gauge stations (Figure 1B) provided by the Hong Kong Observatory, covering the period from 9:00 15th April to 18:00 27th April 2015 (GMT+8). As visually demonstrated in Figure 3, simulated results closely match observations.
Figure 3
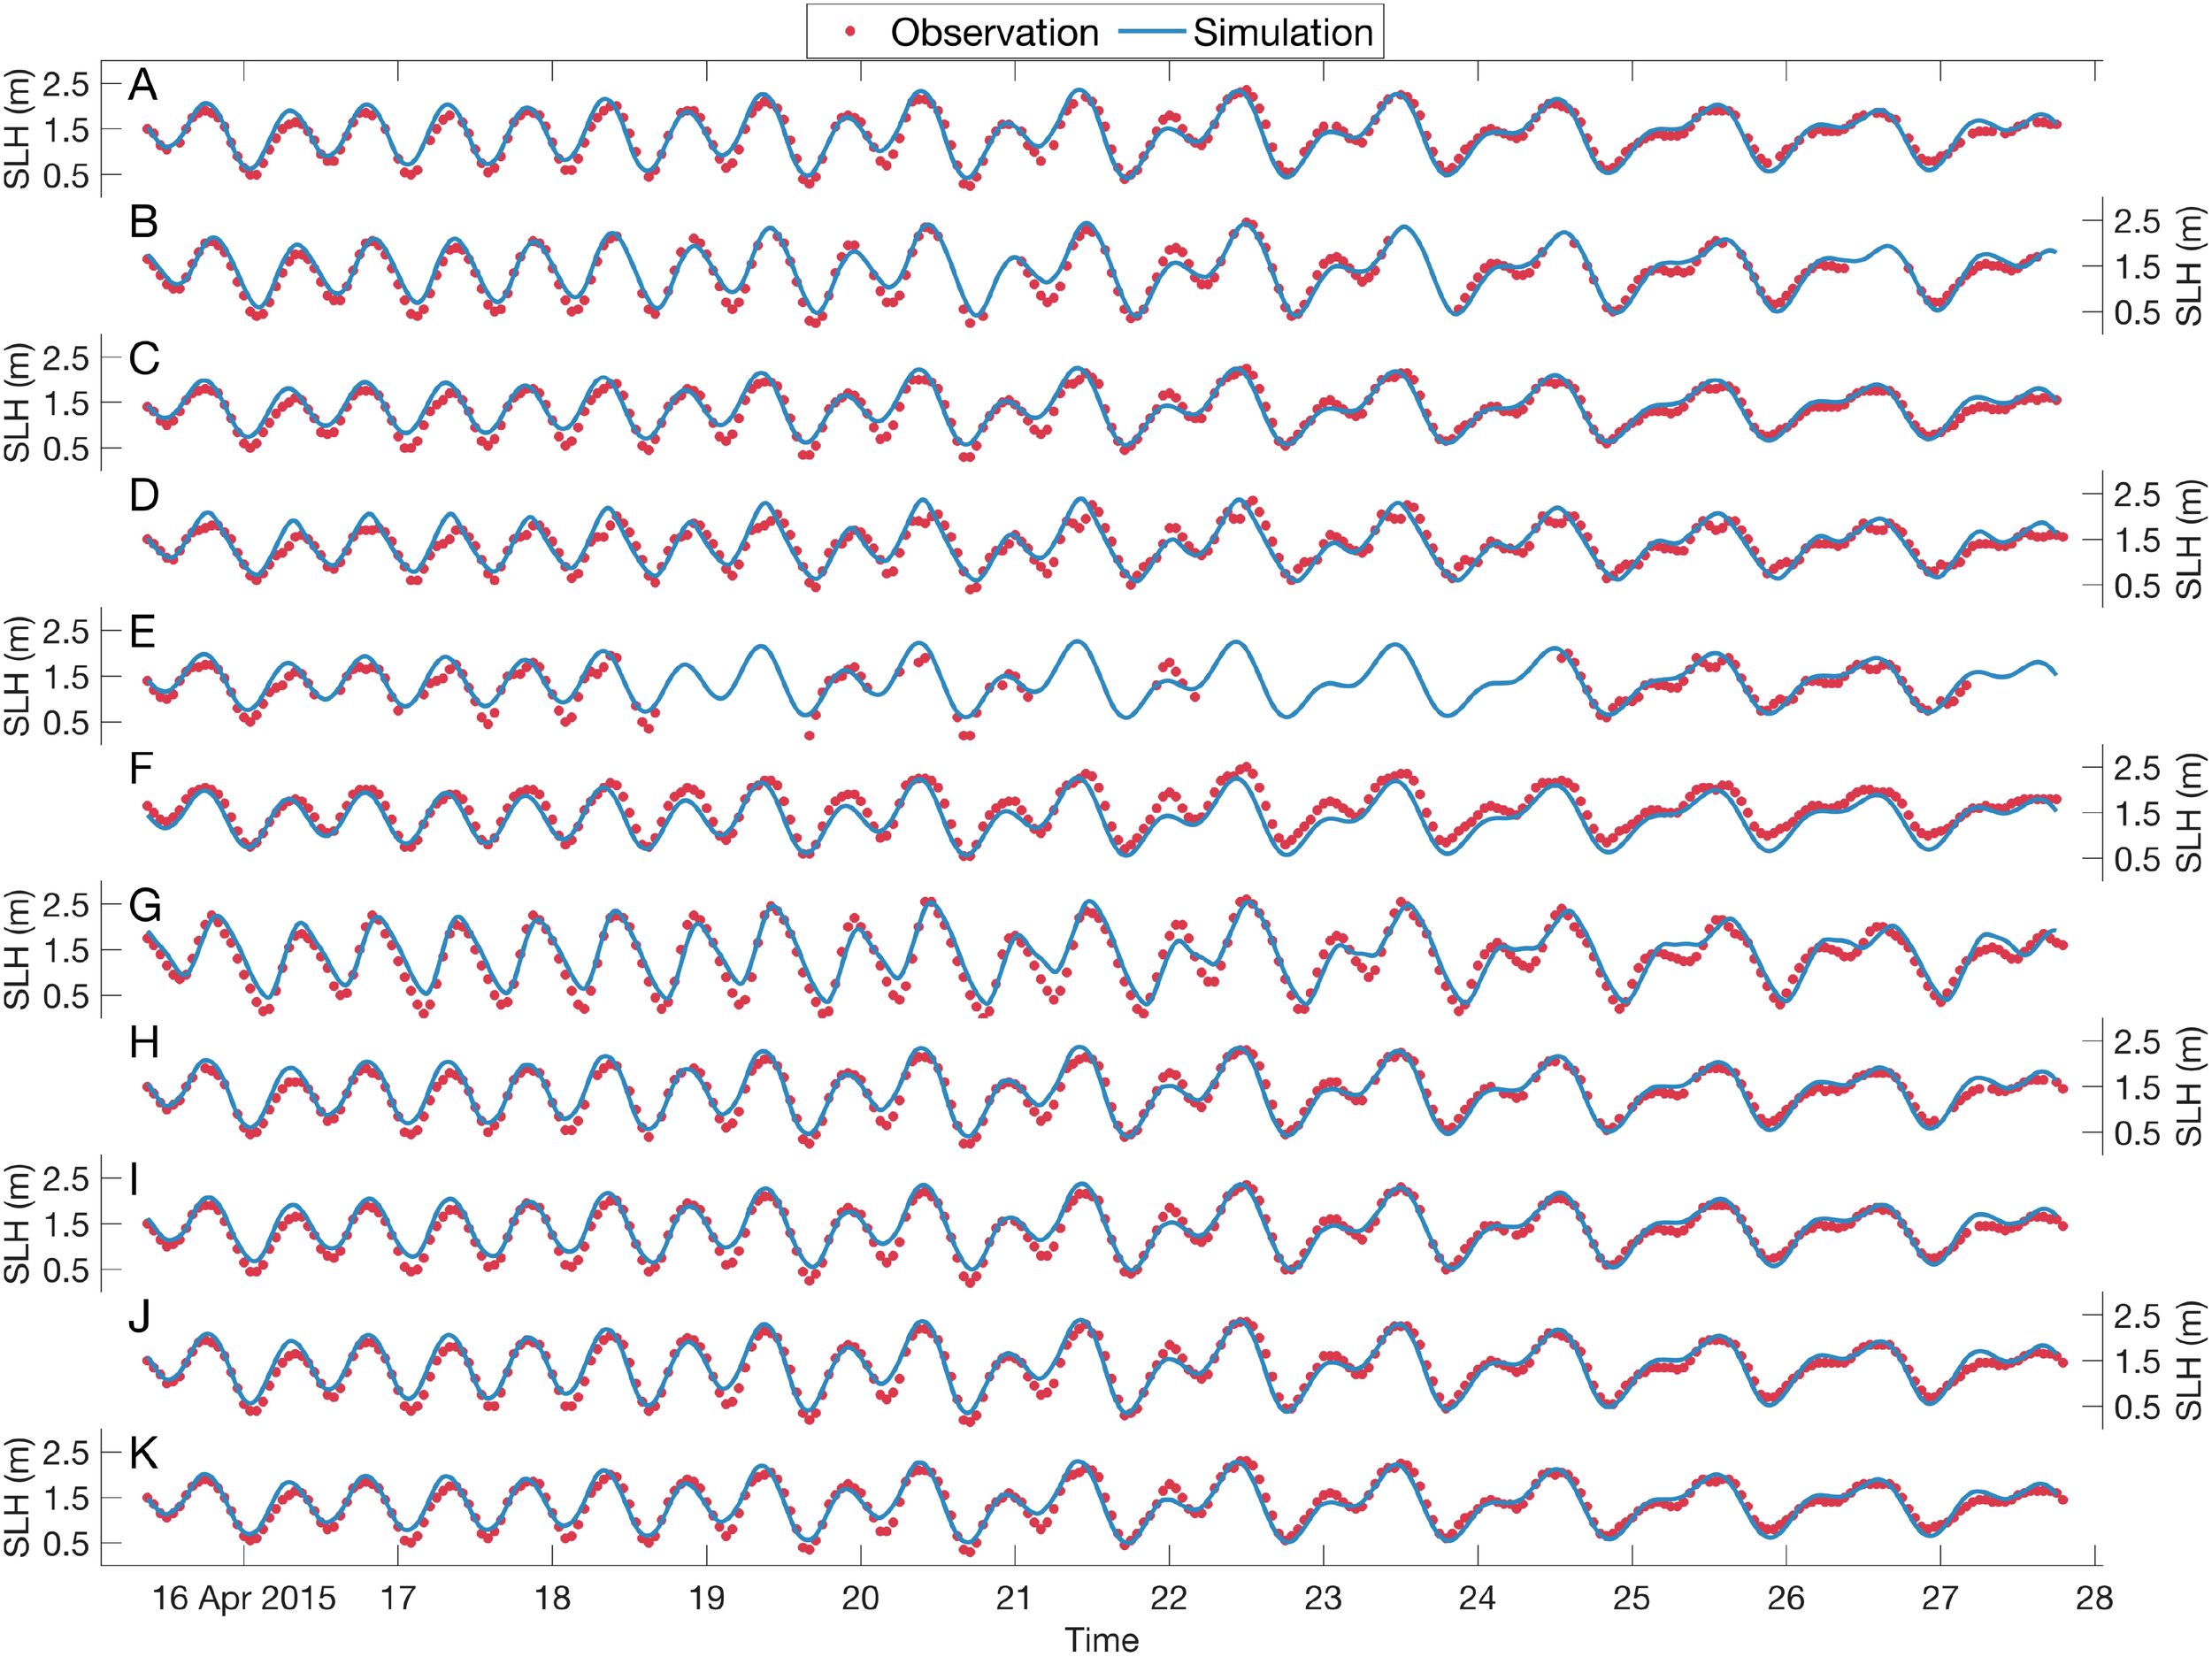
Comparison of observed and simulated water level time series at 11 stations, with (A-K) corresponding to stations 01-11 in Figure 1B, respectively.
Following the methods commonly adopted in previous studies (e.g., Willmott, 1981; Warner et al., 2005; Zhong and Li, 2006), this study further evaluates the model’s hindcast skill, defined as:
where is the simulated salinity value, is the observed salinity value, is the mean of the observed series, and is the number of samples. A SKILL value closer to 1 indicates better performance of the simulation in terms of both trend and magnitude. For all 11 stations, the minimum SKILL value exceeded 0.93, with an average value of 0.96, indicating that the model provided a good simulation of the water levels.
Figure 4 shows the cotidal charts for the M2, S2, K1, and O1 tidal constituents, with results similar to those of Zheng et al. (2014). In terms of amplitude, the M2 tidal constituent, with the largest amplitude exceeding 65 cm at the head of the estuary, is the most important tidal constituent, followed by K1, O1, and S2. Figure 4 also indicates that the tidal range on the eastern bank of the estuary is slightly larger than that on the western bank, as reported by Zhao (1990) and confirmed by observations (Mao et al., 2004). Additionally, the phase lags of the four major tidal constituents are generally tilted in the northeast direction, which is due to the deeper water depths on the eastern bank of the estuary compared to the western bank, causing local tidal waves to propagate faster (Wang et al., 2012).
Figure 4
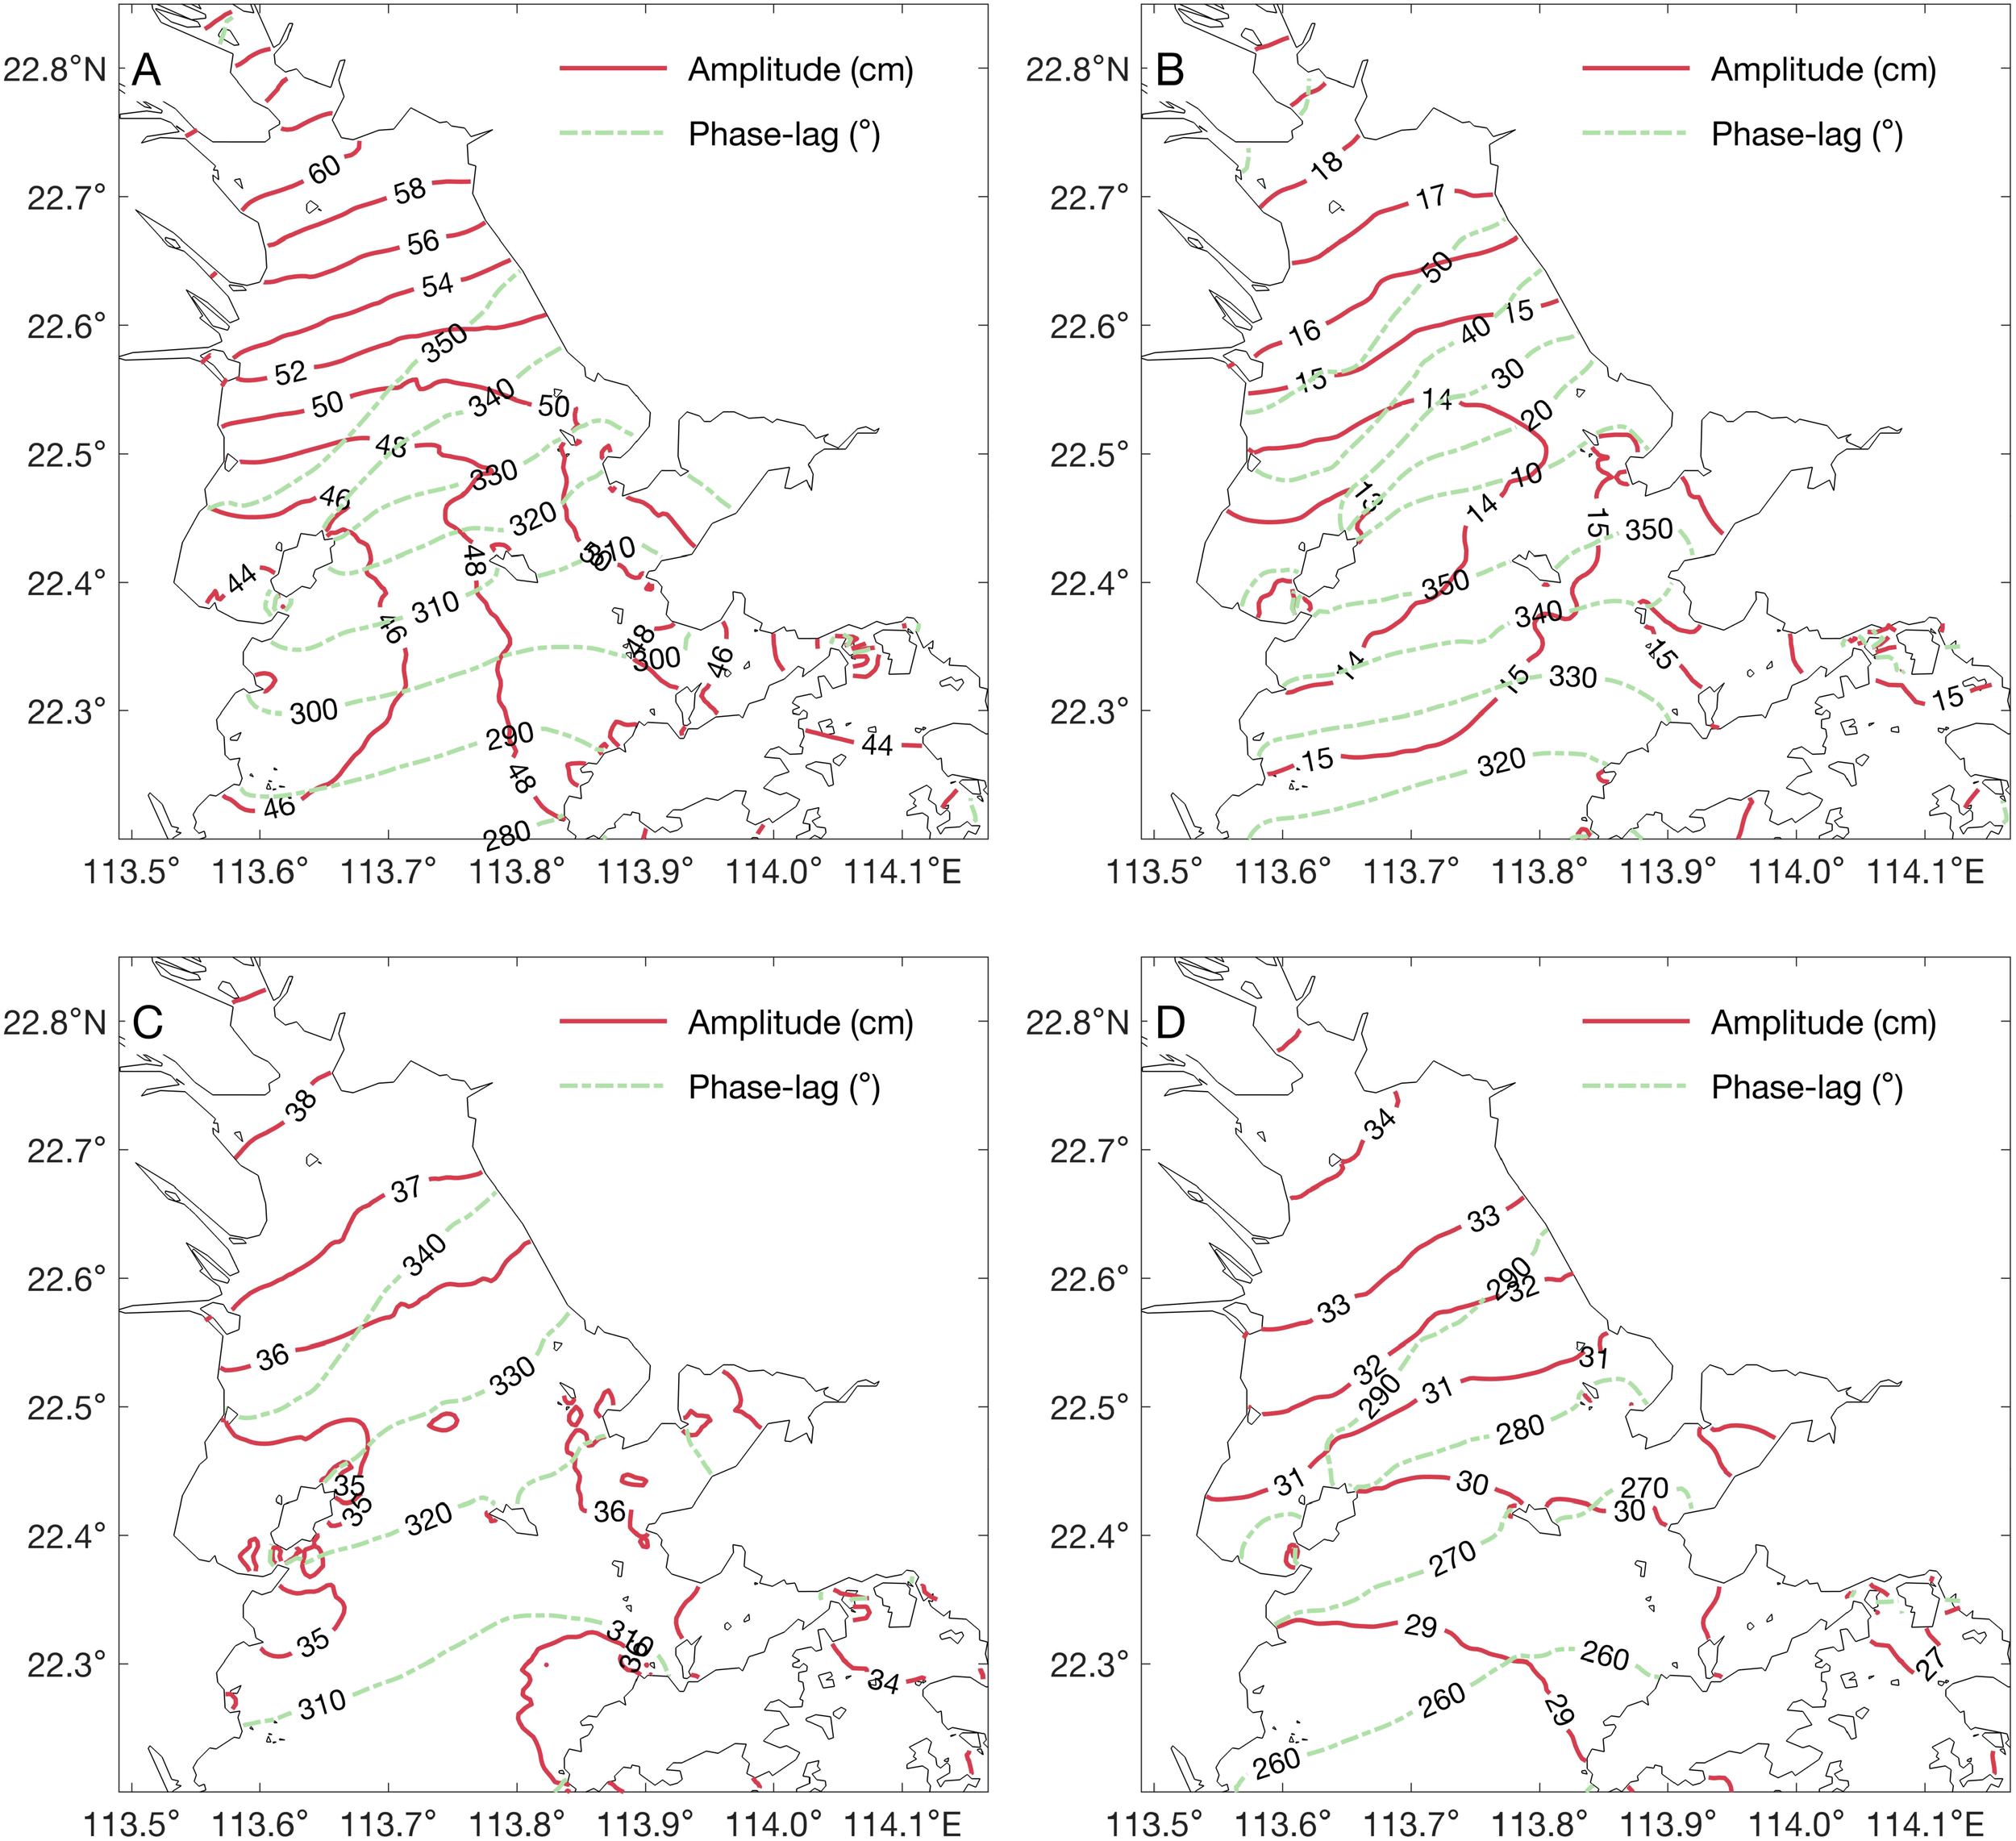
Cotidal charts of the M2(A), S2(B), K2(C), and O1(D) tidal constituents in the Pearl River Estuary.
3.2 Basic characteristics of the waves
Figure 5A shows the significant wave height and wave direction in the Pearl River Estuary during winter. As revealed, under the forcing of the northeast monsoon, the prevailing waves in the estuary are oriented from the northeast. Based on the distribution of wave height and direction, it can be inferred that waves from outside the estuary cannot effectively propagate toward the head of the estuary. A distinct east-west difference is observed: wave heights range 0.3–0.4 m along the eastern sector but decrease to 0.1–0.2 m in the western sector, likely due to stronger wave energy dissipation over shallower western bathymetry. The maximum wave height within the estuary is observed on the eastern bank, where it forms a narrow band parallel to the coastline, with a wave height of approximately 0.5 m.
Figure 5
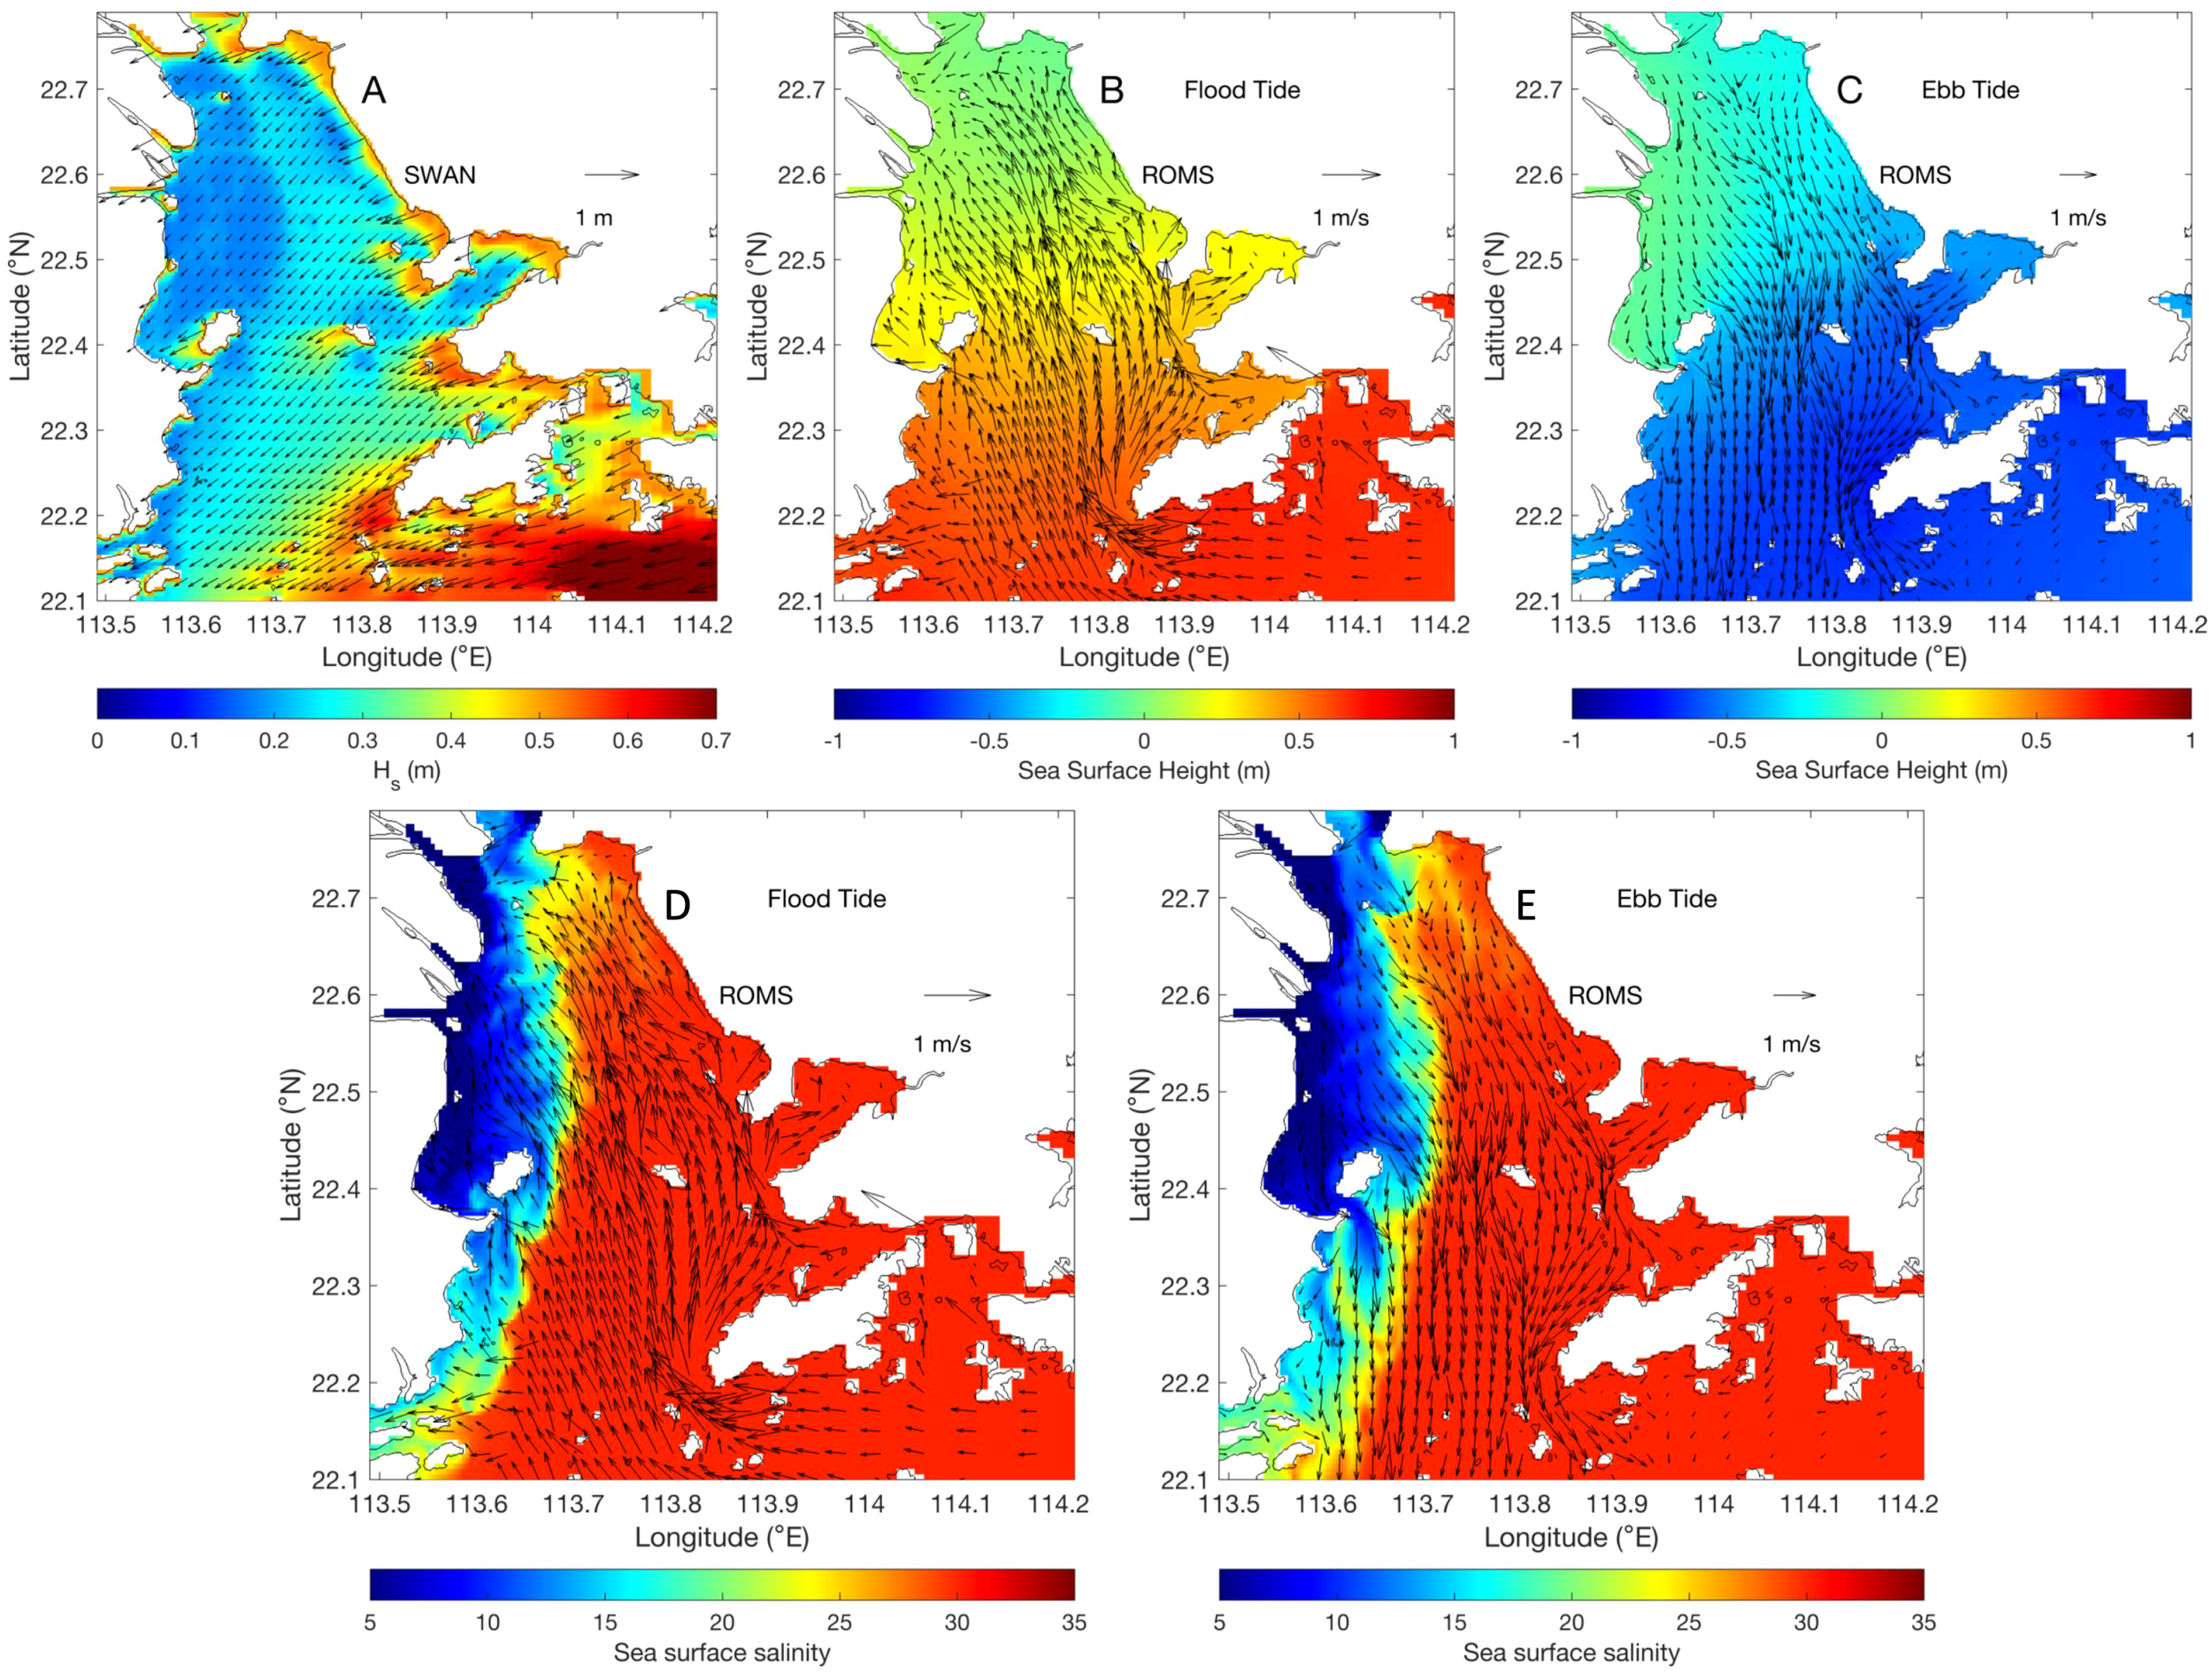
(A) Characteristics of significant wave height and wave direction in the Pearl River Estuary during winter; (B) distribution of surface currents and water levels at maximum flood from experiment ROMS; and (C) the same as (B) but for maximum ebb. Surface salinity distribution and surface currents in the Pearl River Estuary at (D) Maximum flood and (E) Maximum ebb.
3.3 Characteristics of the currents
Given that wave-current interactions are more pronounced under high flow conditions, we analyzed hydrodynamic patterns at adjacent maximum flood and ebb. The distributions of currents and water levels are shown in Figures 5B, C. Figure 5B indicates that at maximum flood, tidal currents propagate from offshore into the estuary, with maximum velocity (~1 m/s) in the western and eastern channels, consistent with tidal energy flux propagation directions (Liu et al., 2015; Bai et al., 2016). At maximum ebb, currents generally reverse direction. However, west of Lantau Island, ebb tidal currents exhibit southward transport, contrasting with northwestward flood tidal currents. Water levels at maximum flood show negative values north of 22.6°N and positive values southward. At maximum ebb, positive levels are confined near the Jiaomen, Hongqili, and Hengmen river outlets and coastal areas north of Qi’ao Island, with negative values elsewhere. Understanding the distribution characteristics of the flow field and water level field at these two typical tidal phases helps us comprehend the feedback of the waves on currents and water levels.
3.4 Characteristics of the salinity front
Figures 5D, E show the surface salinity and surface currents distribution at maximum flood and ebb. Due to the small river discharge in winter, the northeast monsoon can restrict freshwater to the western side of the estuary, forming a low-salinity water plume, while high-salinity water from the outer sea can intrude into the estuary through the eastern part, forming a distinct arcuate salinity front within the estuary. The salinity at the front ranges from 20 to 25 psu. While Zheng et al. (2014) defined the winter frontal boundary using the 22 psu isohaline, this study adopts the 25 psu isohaline as the frontal criterion. This difference may be due to our use of the January discharge forcing, while Zheng et al. (2014) used winter average discharge forcing. In fact, this choice does not affect the conclusions of this work.
It can be observed that maximum flood tidal currents act similarly to monsoonal forcing, suppressing eastward plume expansion and compressing freshwater along the western coast. Conversely, maximum ebb tidal currents enhance eastward and southward freshwater spreading, enlarging plume area and shifting the front significantly eastward compared to flood conditions.
4 Discussion
4.1 Currents modulation on waves
4.1.1 Variations in significant wave height
Using the results from the numerical experiments ELV (coupling only water levels) and CUR+ELV (coupling both currents and water levels), we analyzed the influence of the currents and water levels on significant wave height at maximum flood and ebb, as detailed in Figure 6. Figure 6A shows that at maximum flood, the significant wave heights increase across most estuarine areas, particularly west and north of Lantau Island. In this region, the tidal currents and waves are nearly opposite in direction, and the deep channel topography results in a higher local current velocity. The opposing currents enhance wave energy convergence more significantly here than in other areas of the estuary, leading to an adjustment in wave height of approximately 10%. This magnitude is consistent with the changes in typhoon-induced wave heights within the estuary caused by currents, as reported by Ren and Bao (2013). Figure 6B indicates that water levels also have a certain influence on wave height at maximum flood, especially in the coastal bays or islands south of 22.6°N, where the impact is approximately 4 cm. The variation in wave height is closely related to the spatial distribution of the water levels: at bay heads with negative water levels, the wave height slightly decreases due to the shallow water effect associated with negative water levels, which increases wave energy dissipation, thus reducing the wave height, and vice versa.
Figure 6
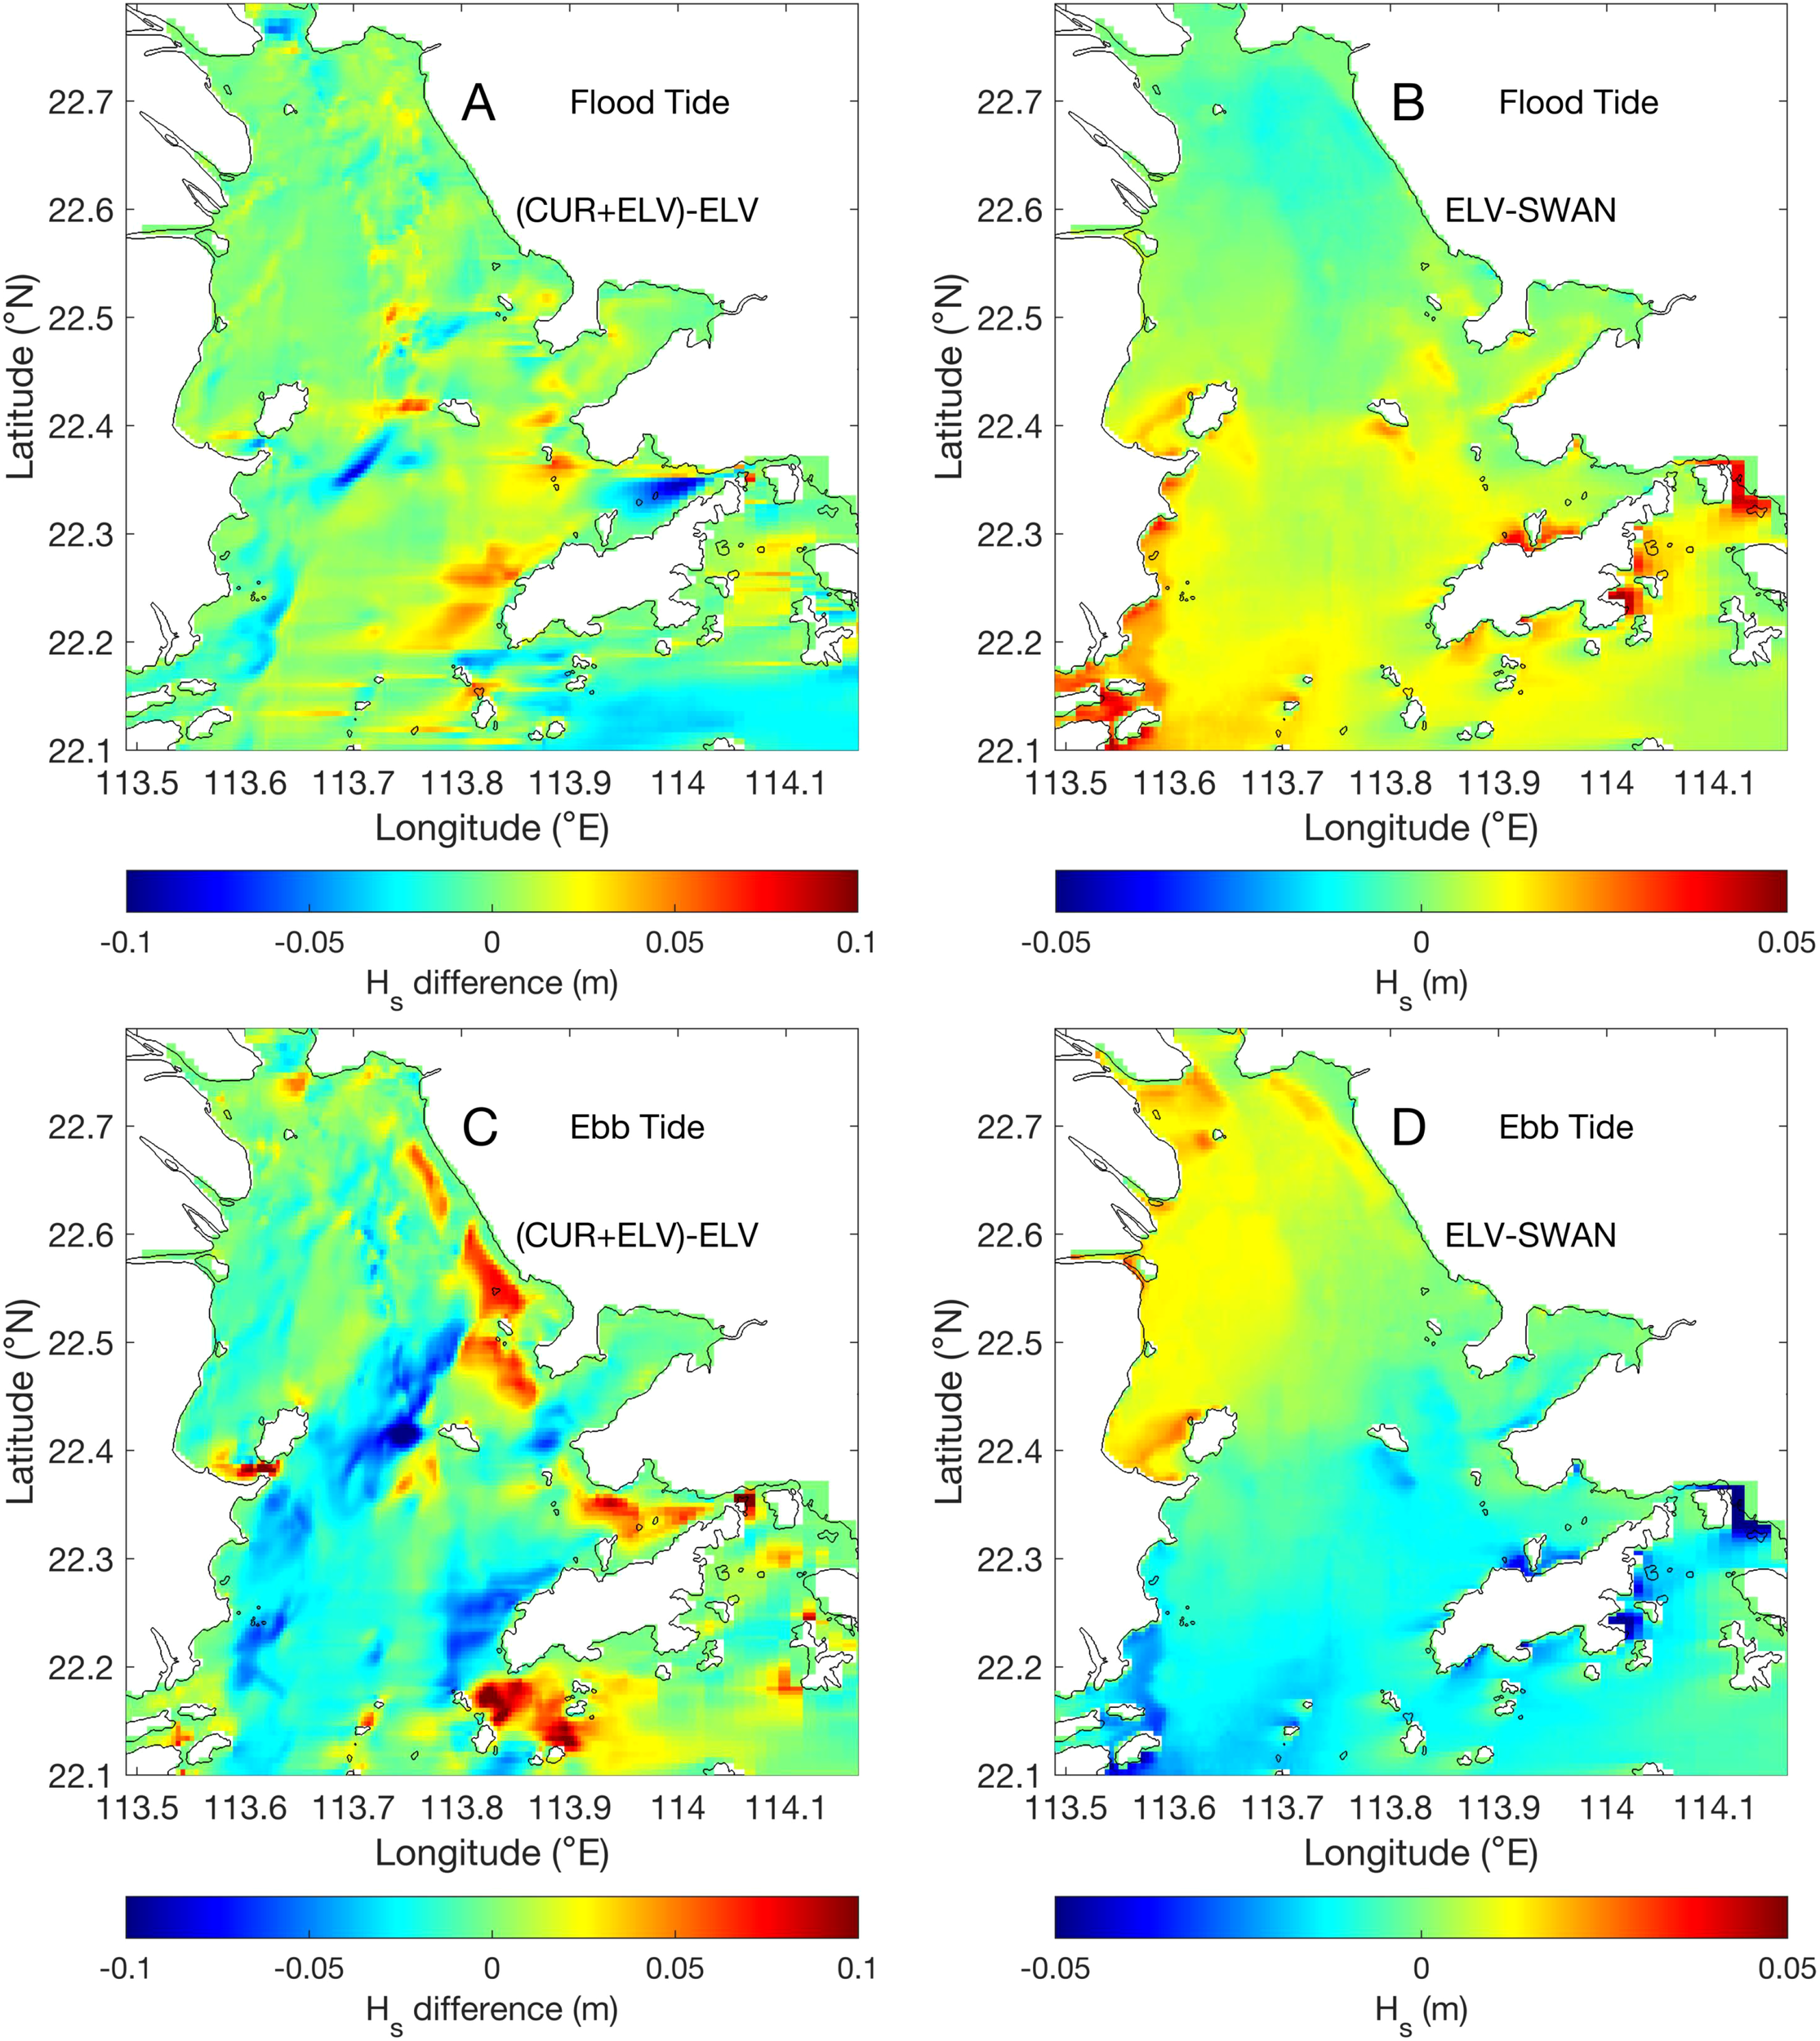
Adjustment of significant wave height by (A) the current field and (B) the water level at maximum flood; adjustment of significant wave height by (C) the current field and (D) the water level at maximum ebb. Note that the colorbar scale differs.
Figure 6C shows that at maximum ebb, tidal currents cause a reduction in wave height in areas where waves and currents are nearly aligned, such as the western coast of Lantau Island, the southern waters of Qi’ao Island, and the area between Qi’ao Island and Neilingding Island, with reductions of 5–10 cm. However, considering the original wave height is relatively small, in regions like the southern coast of Qi’ao Island, the adjustment in wave height by the currents can reach 25–50% of the original value. Near the eastern shore of the estuary, ebb tidal currents can induce a increase in wave height in certain areas. In these regions, the current direction is nearly perpendicular to the wave direction, indicating that the currents can also contribute to wave energy convergence under such conditions. Figure 6D reflects a pattern similar to that in Figure 6B: wave heights slightly increase in areas with positive water levels and decrease in areas with negative water levels.
Overall, in the central estuary, the currents have a more significant impact on wave height than the water levels. However, in nearshore zones, water levels dominate wave height modulation compared to tidal currents. There are two key factors explaining this pattern: (1) weak tidal currents provide limited energy redistribution capacity; (2) shallow nearshore depths amplify water level effects on wave dissipation. Additionally, current-induced wave height modifications are more pronounced at maximum ebb than flood.
4.1.2 Variations in wave direction
Figure 7A displays the wave directions obtained by coupling both the currents and water levels at maximum flood, as well as those obtained by coupling only water levels. Figure 7B shows the changes in wave direction induced by the maximum flood tidal currents. It can be observed that the changes in wave direction within the estuary caused by maximum flood tidal currents are relatively irregular. In open waters, wave directions generally decrease overall, but areas with increased wave directions should not be ignored. The magnitude of the wave direction change is within ±10°. Similarly, Figure 7C presents the wave directions obtained by coupling both the currents and water levels at maximum ebb, as well as those obtained by coupling only water levels. Figure 7D illustrates the changes in wave direction induced by the maximum ebb currents. As displayed, maximum ebb tidal currents cause an overall increase in wave direction within the estuary, with the magnitude of increase ranging between 10–20°, and exceeding 20° in some areas. This effect is more pronounced compared to the influence of maximum flood tidal currents.
Figure 7
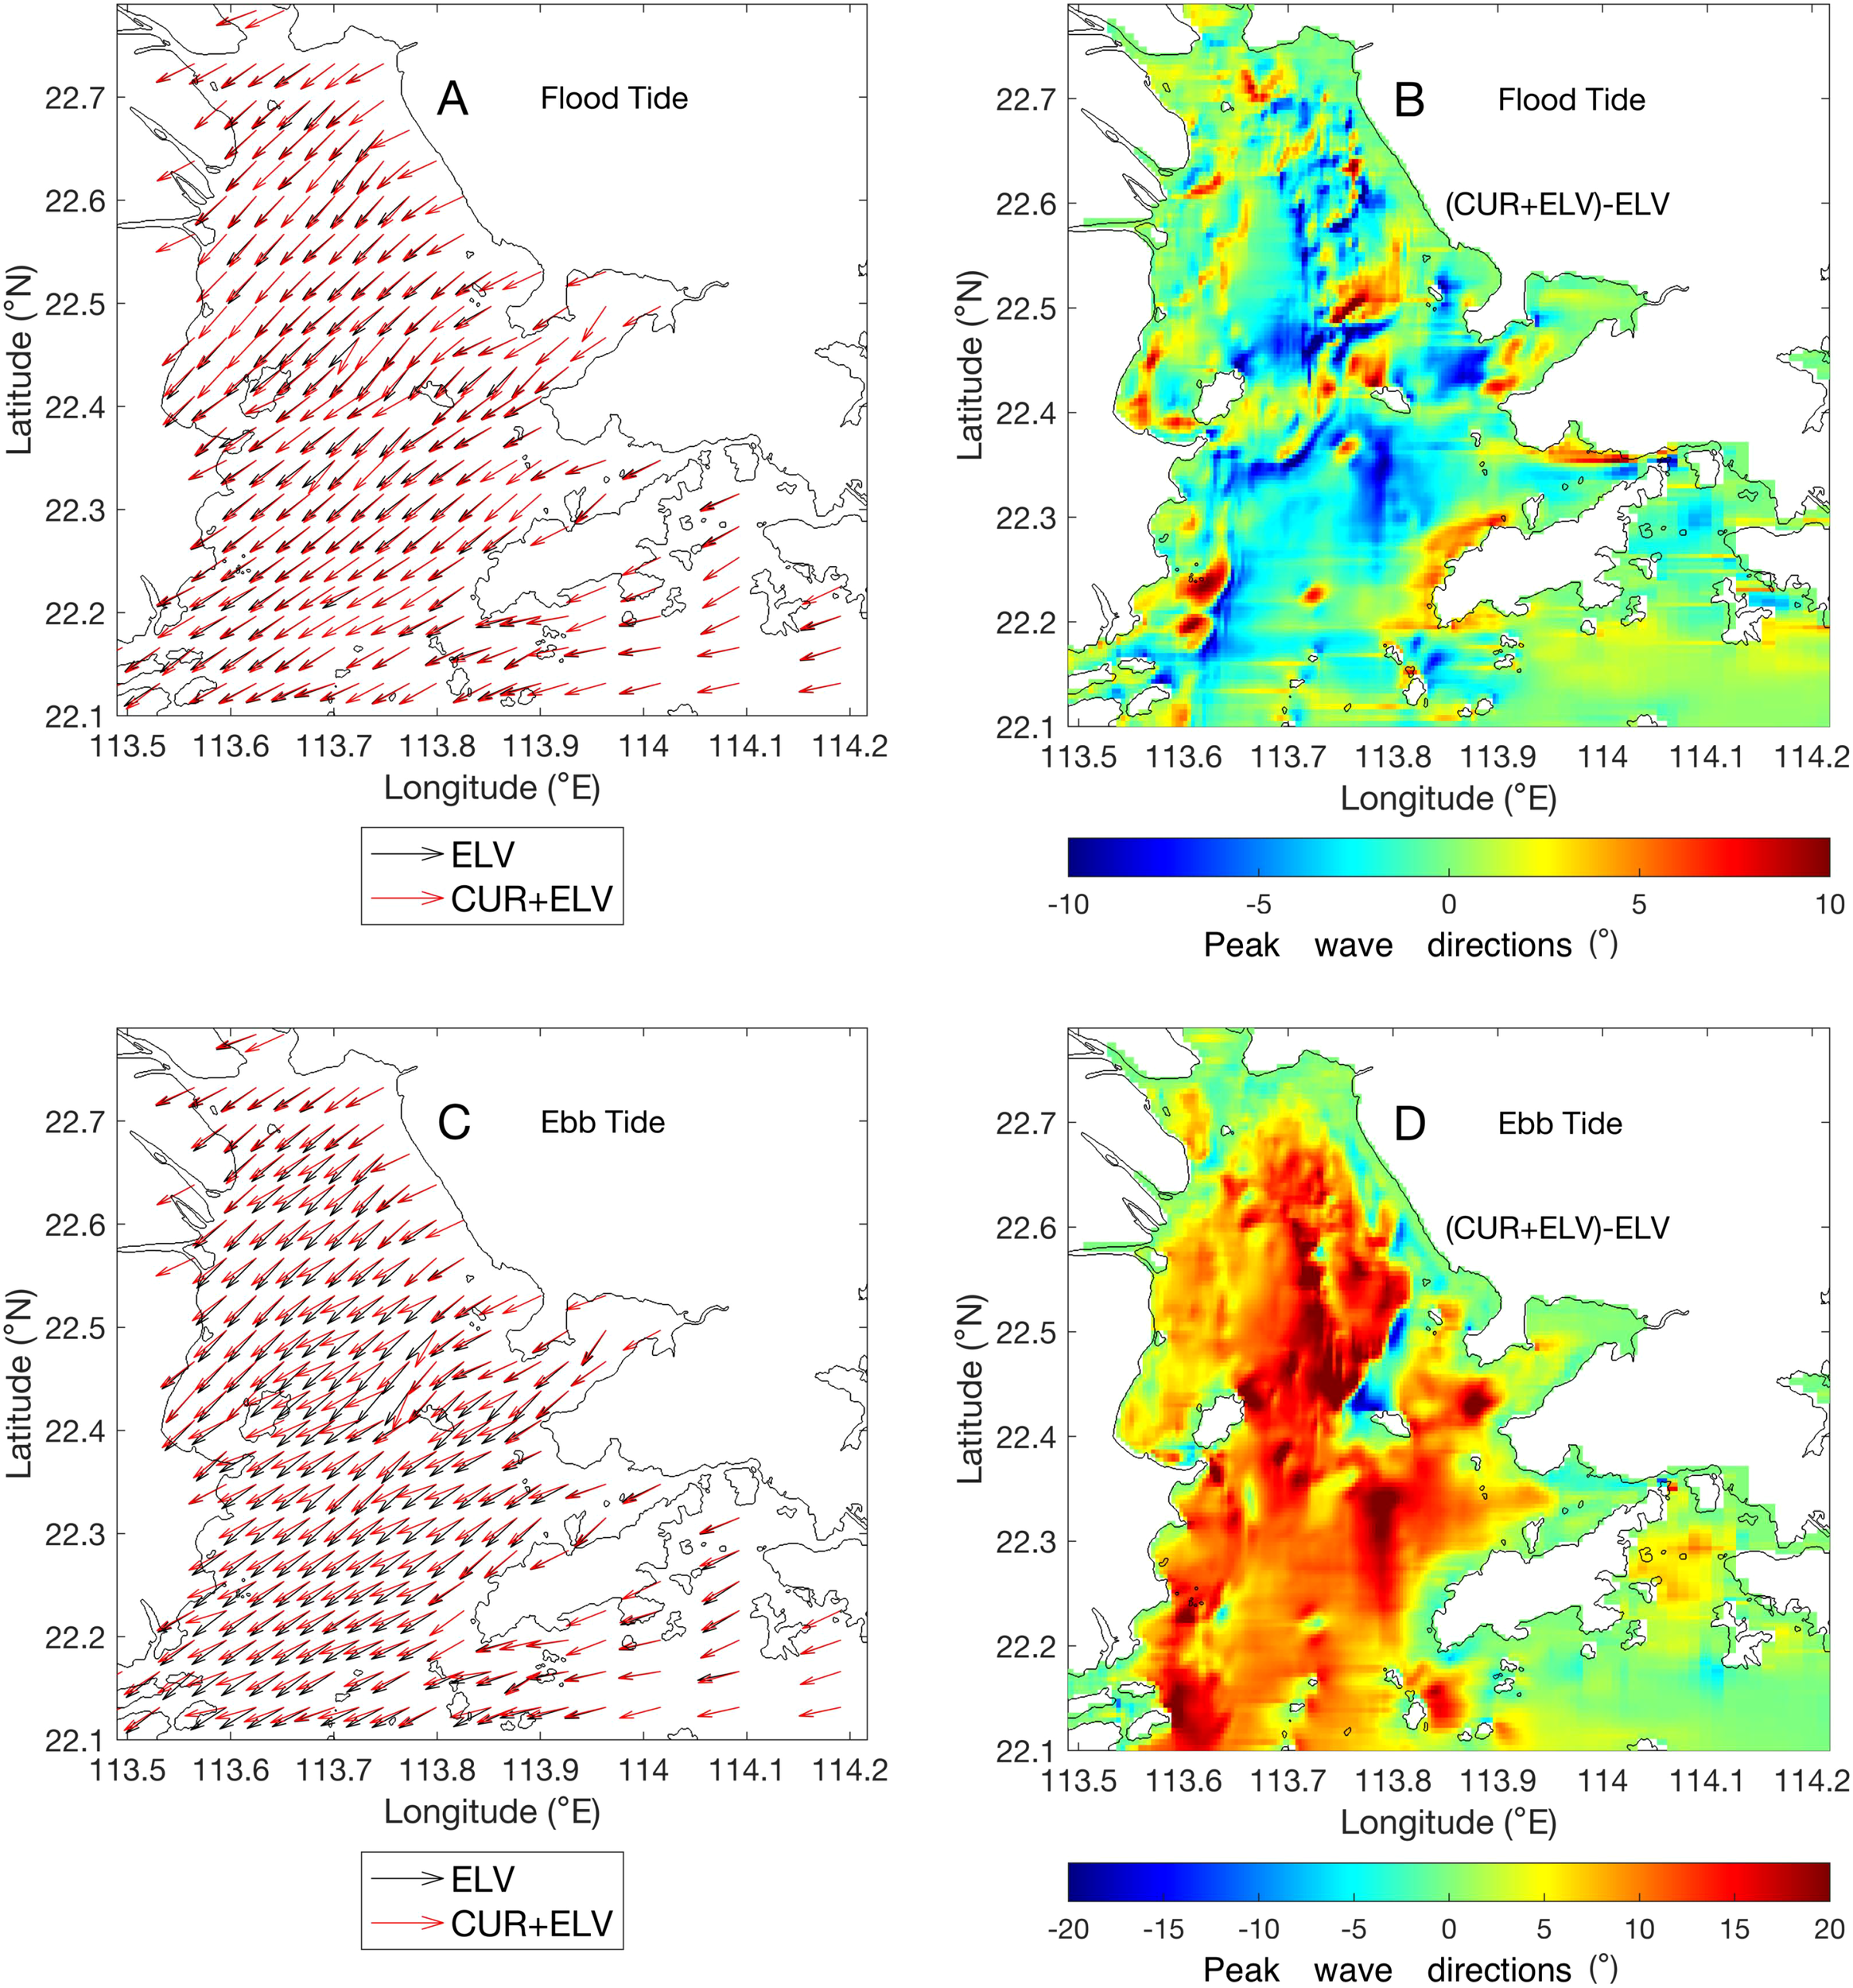
Peak wave directions obtained from the CUR+ELV and ELV cases (A), with wave direction changes induced by the currents at maximum flood (B); (C, D) are the same as (A, B), respectively, but for ebb tide.
4.1.3 Variations in absolute mean bottom period
This section prioritizes the absolute mean bottom period over the peak period due to its direct control over wave boundary layer dynamics and subsequent sediment transport. Defined as the ratio of bottom orbital excursion amplitude to orbital velocity, this parameter provides critical insights into morphological evolution, as its temporal variations exhibit stronger correlations with bedform adjustments than peak period fluctuations. Figures 8A, B illustrate the adjustments to the absolute mean bottom period induced by the currents at maximum flood and ebb, respectively. The results indicate that both maximum flood and ebb tidal currents generally enhance the sediment resuspension capacity of waves within the estuary. However, the increase in the absolute mean bottom wave period is mostly below 0.2 s in most areas, suggesting that wave-current interactions do not significantly improve the sediment resuspension capacity of waves. This finding is consistent with the results reported by Wang (2006). Figure 8 also shows that the adjustment of the absolute mean bottom wave period by maximum ebb tidal currents is stronger than by maximum flood tidal currents, with increases of about 0.3–0.5 s observed in areas such as the southern coast of Qi’ao Island, northwest of Neilingding Island, and north of Lantau Island.
Figure 8
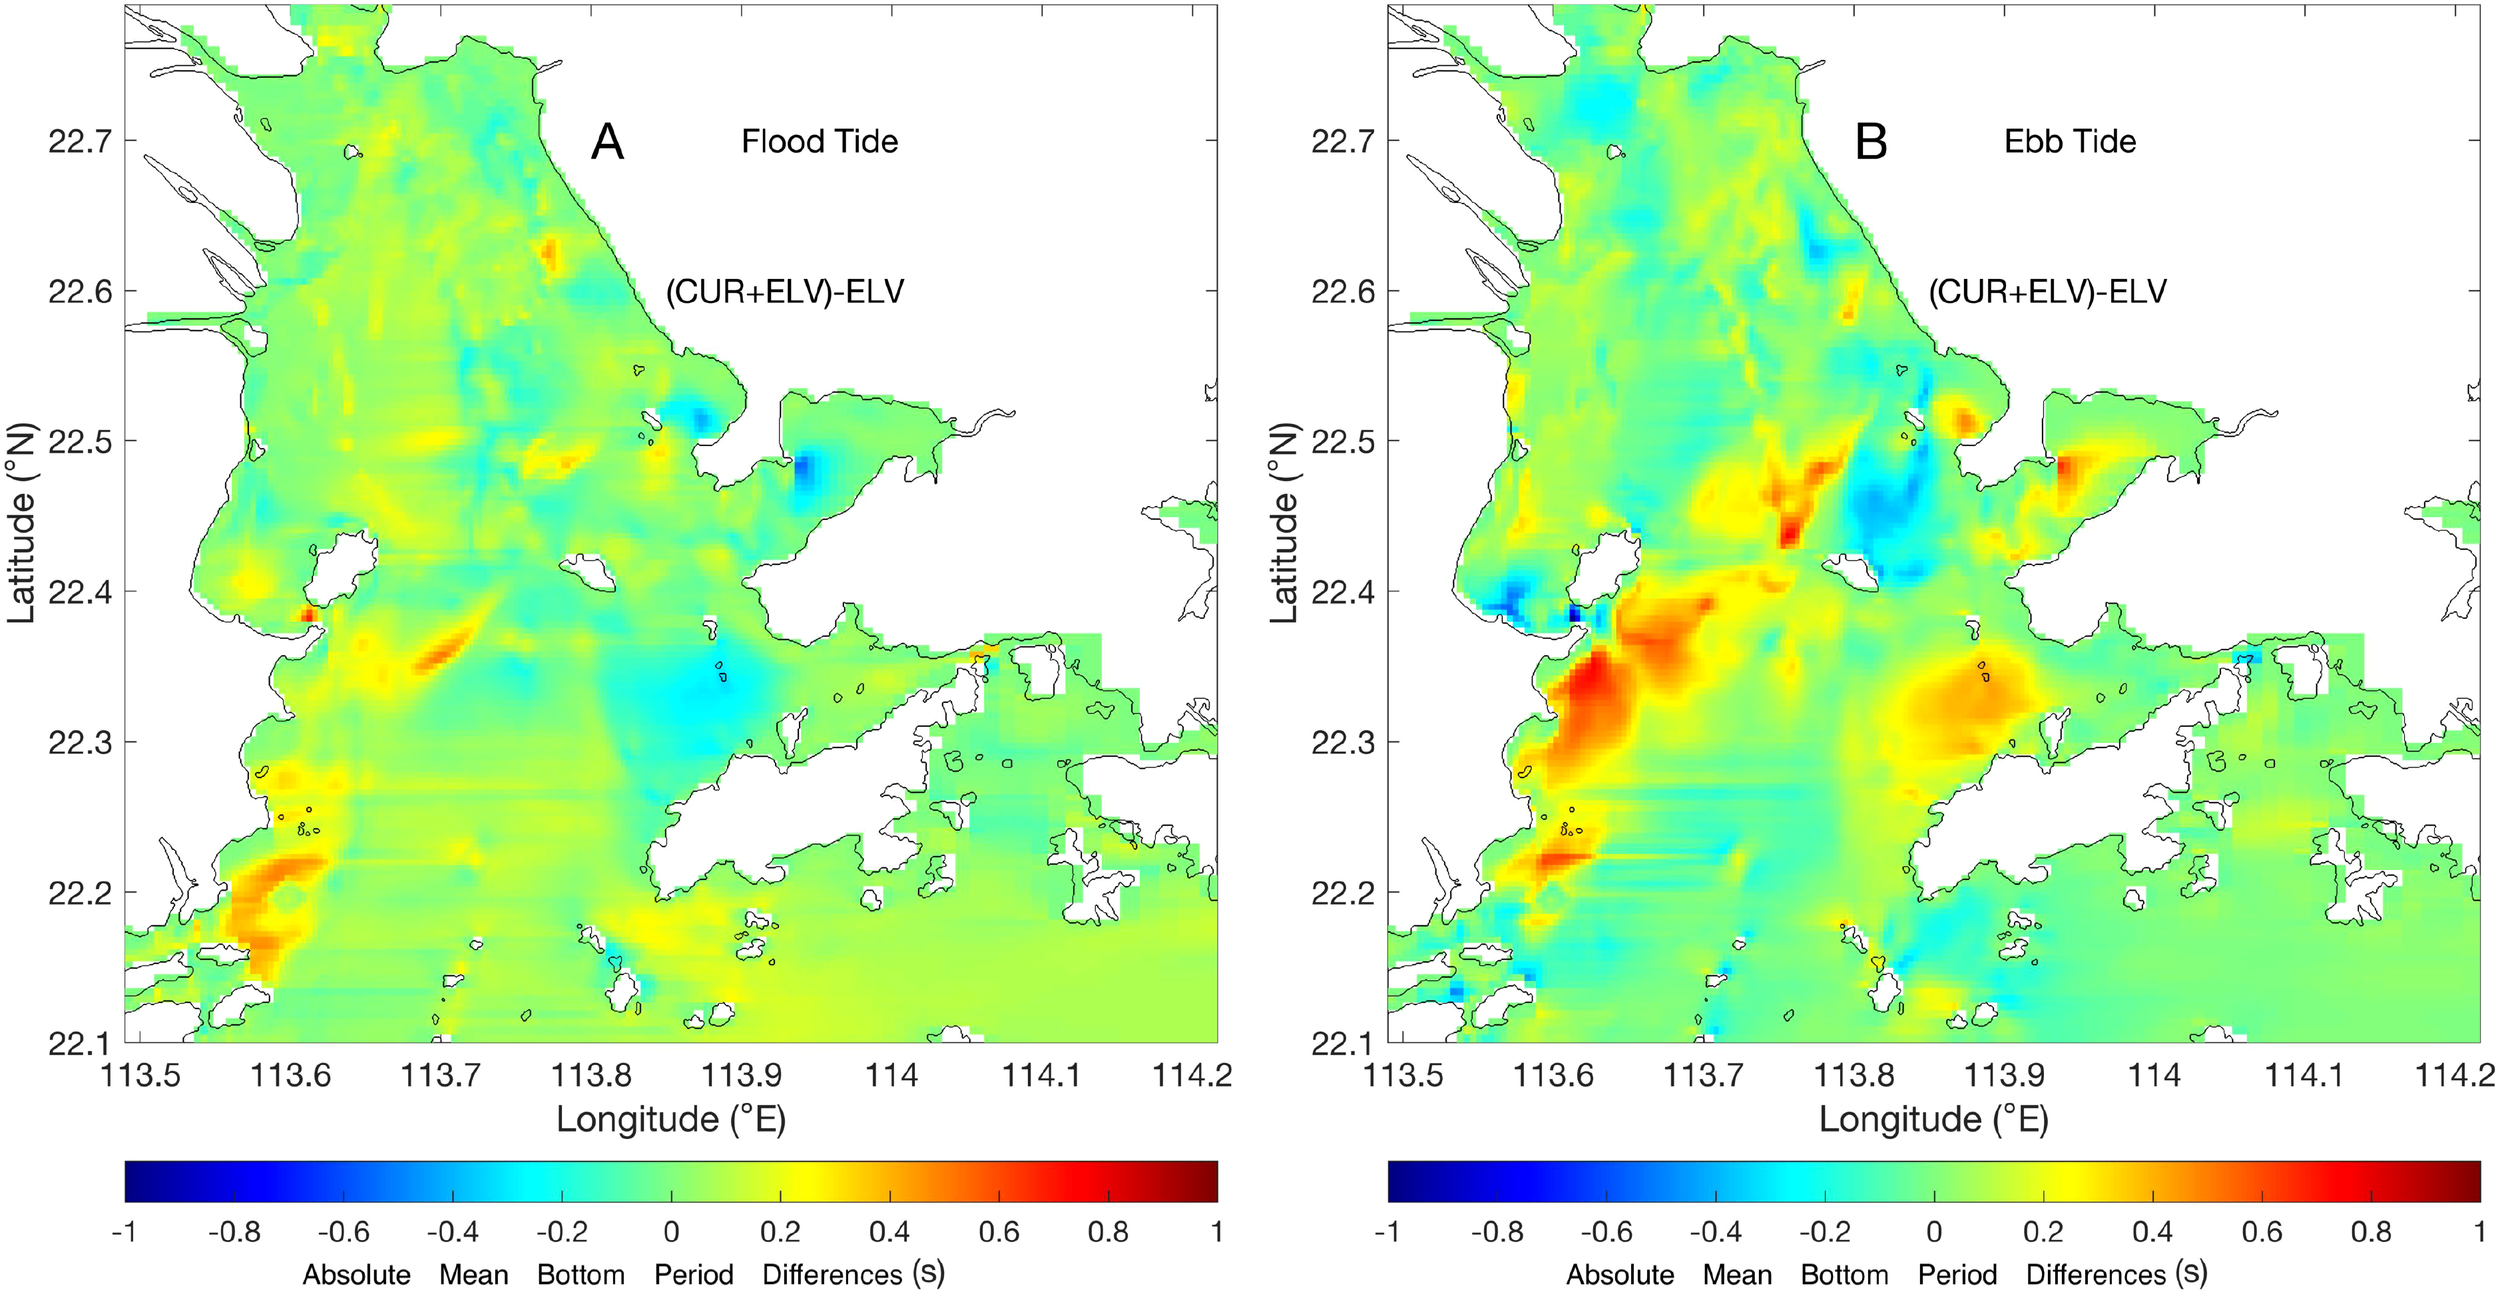
Adjustments to the absolute mean bottom period induced by the currents at maximum flood (A) and ebb (B).
4.2 Influence of the waves on the hydrodynamics
4.2.1 Variations in the currents
Figure 9 illustrates the modulation of depth-averaged currents at maximum flood and ebb, respectively, under the full coupling of wave effects (COUPLE), coupling of wave-enhanced mixing (TKE), coupling of wave-enhanced bottom boundary layer (BBL), and coupling of 3D wave forces (VF). It can be observed that waves significantly weaken the maximum flood and ebb tidal currents across the entire estuary, with reductions mostly ranging from 0.1 to 0.2 m/s. In the eastern and western channels, as well as near some headlands, the reduction can reach up to 0.3 m/s. By comparing the various numerical experiments, it is evident that the increased bottom friction caused by wave-enhanced bottom boundary layer is the primary reason for the weakening of the current field. This wave-induced current reduction has also been shown to play an important role in other regions (e.g., Jin et al., 1998; Xie et al., 2001; Olabarrieta et al., 2011; Rong et al., 2014).
Figure 9
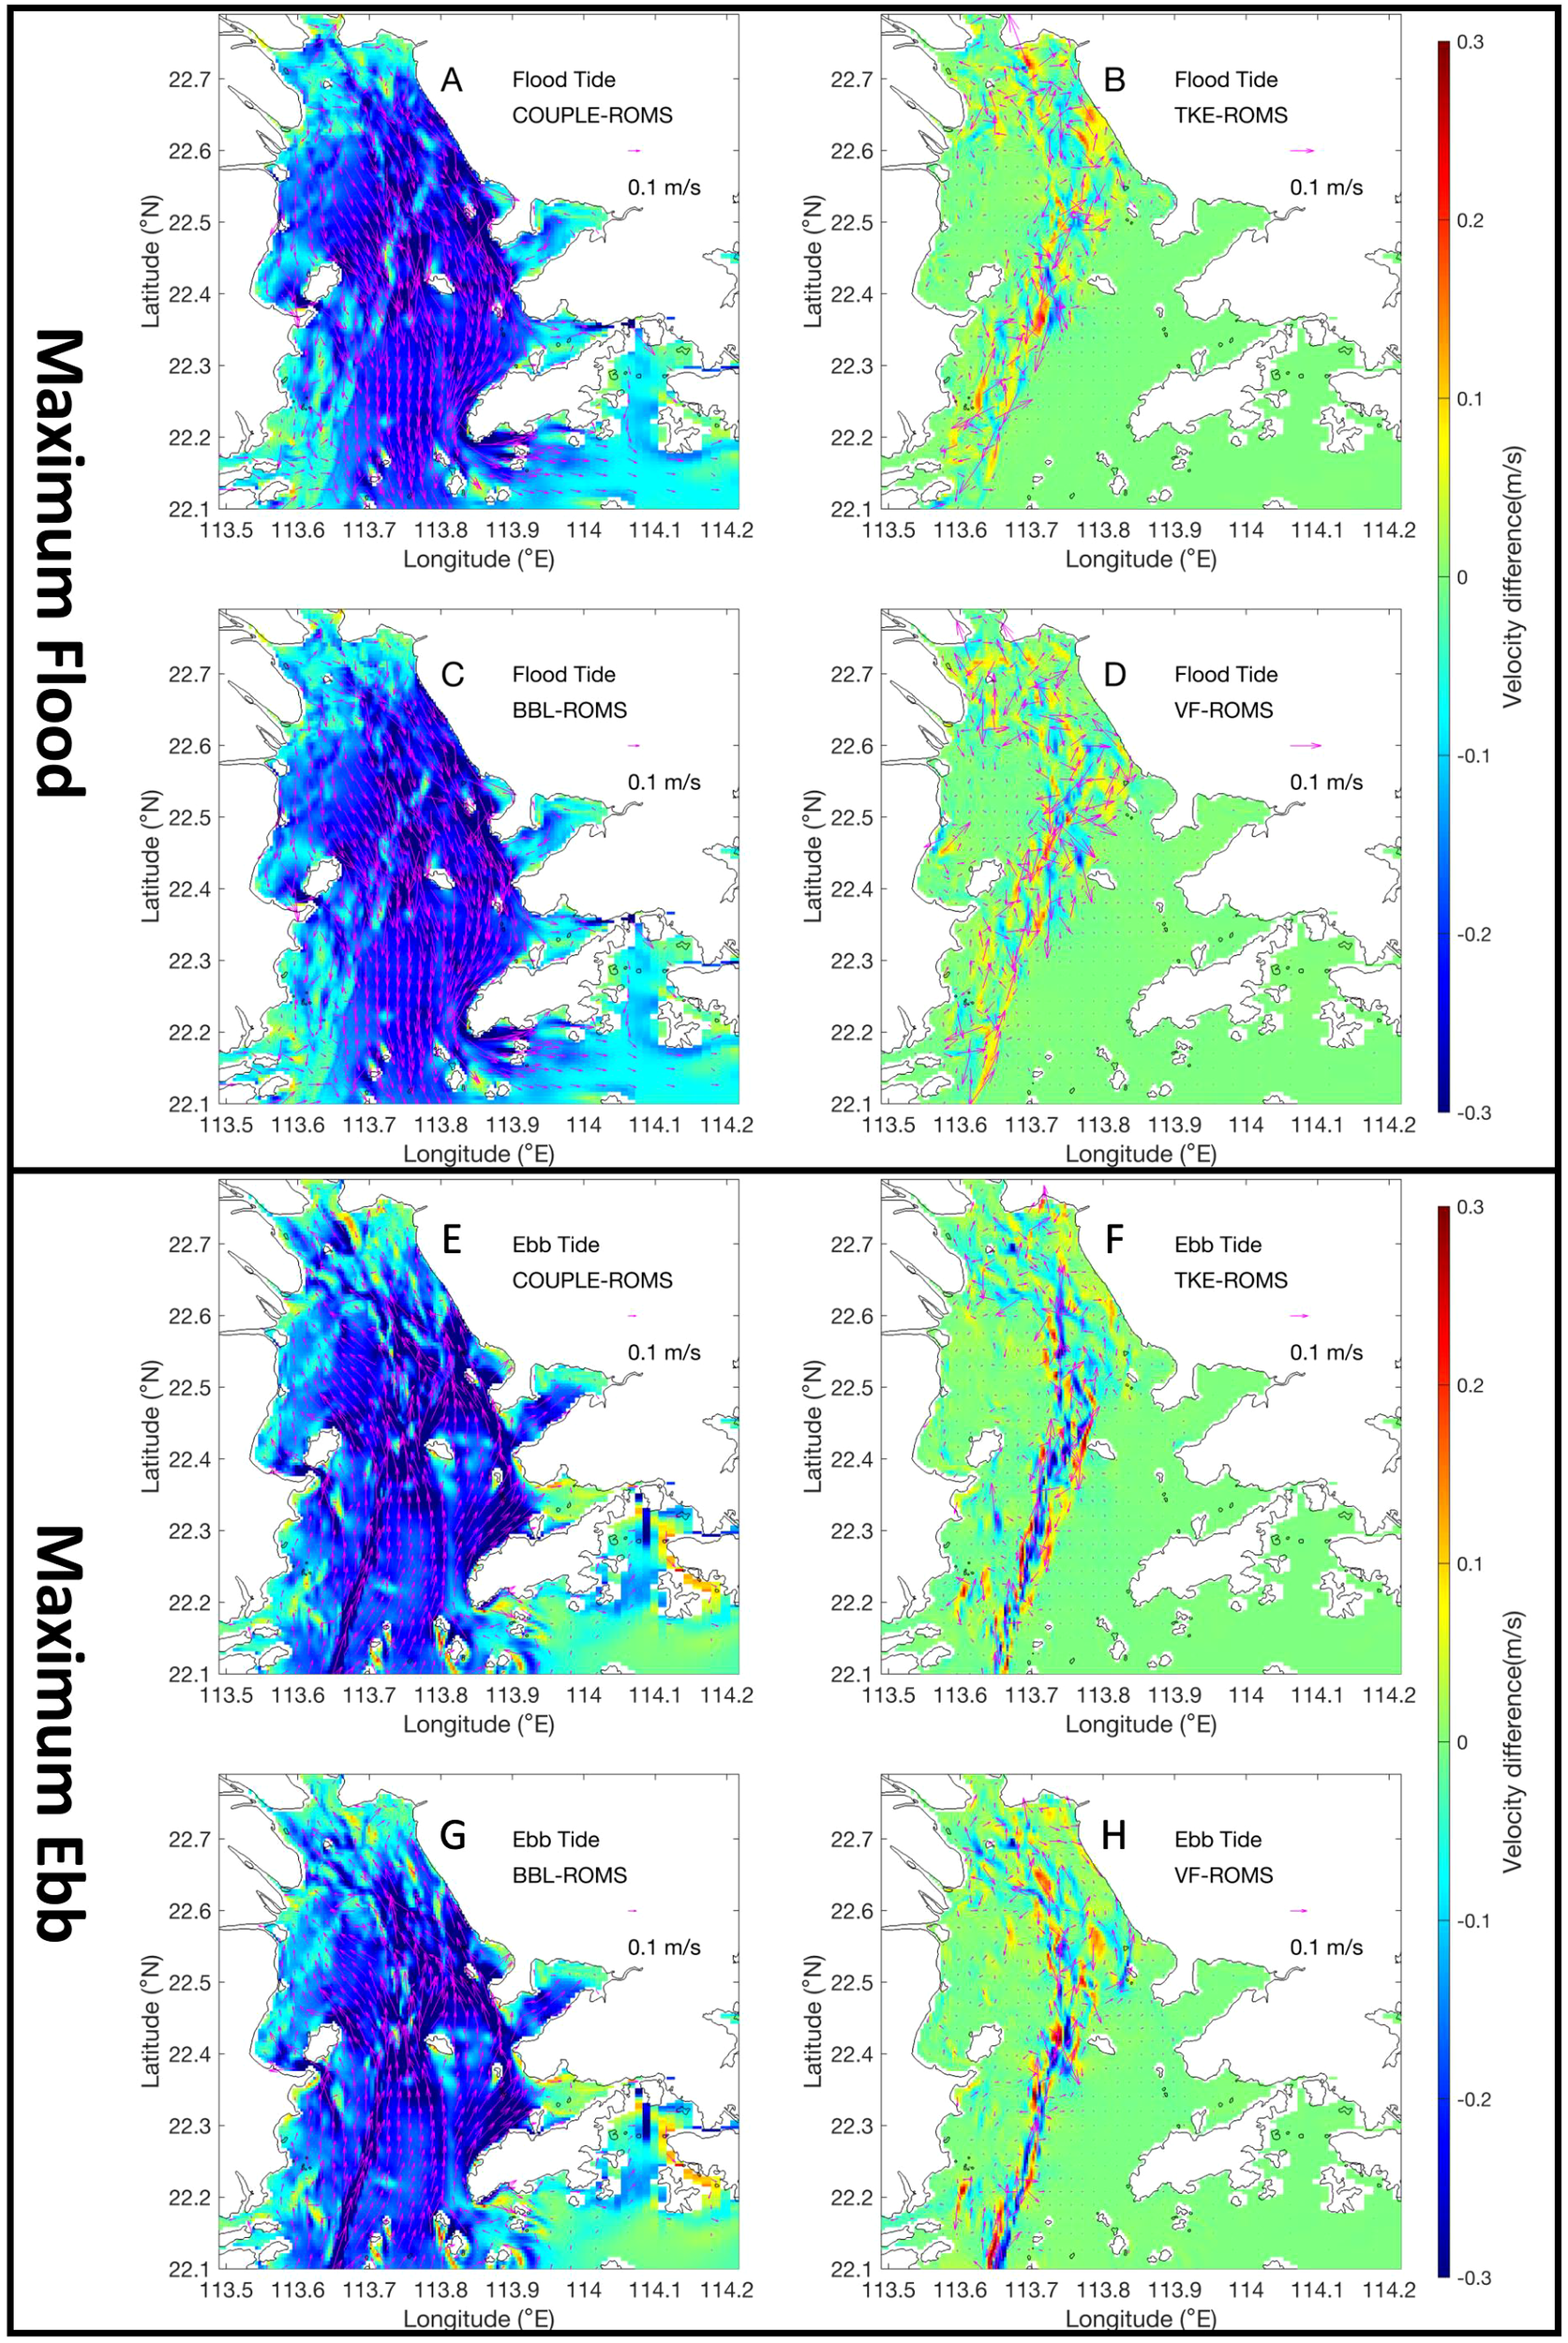
Adjustment of the depth-averaged currents by the (A, E) fully coupled model, (B, F) coupled TKE, (C, G) coupled BBL, and (D, H) coupled VF at maximum flood and ebb, respectively. The colors represent the magnitude of change in current speed, and the arrows indicate the direction of change.
In addition, significant changes in the depth-averaged currents near the salinity front caused by wave-enhanced mixing and 3D wave forces are also observed, but the signals are rather chaotic. This is not difficult to understand: the mixing at the plume front of the Pearl River Estuary is intense (Bai et al., 2016), resulting in unstable local dynamic conditions. Under such background, the intervention of wave mixing or 3D wave forces can directly affect the local momentum balance, or induce changes in the spatial distribution of salinity (both horizontally and vertically), which in turn triggers variations in baroclinic pressure gradient forces, leading to significant variations in local currents. These changes in currents induced by small perturbations are highly uncertain, and this is reflected in the irregularity of the currents differences. Furthermore, away from the front, the impacts of these two wave effects on currents are extremely weak and nearly negligible.
4.2.2 Variations in the water levels
Figure 10 shows the water levels changes induced by fully coupled wave effects at maximum flood (A) and ebb (B). It can be seen that at the maximum flood, waves cause a slight decrease in the water level throughout the estuary, whereas at the maximum ebb, the water level increases significantly, with the maximum value approaching 0.4 m. It is not caused by direct wave setup or setdown, but rather by the wave-enhanced bottom friction perceived by the tidal waves, which causes a phase delay. In fact, the enhanced bottom friction increases the dissipation of tidal energy, reducing the water level amplitude. We selected three representative points from south to north within the estuary, namely P1, P2, and P3 (Figure 10A), and the corresponding water level time series are shown in Figures 10C–E, respectively. As revealed, the decrease in the amplitude of the water level series and the phase delay become more pronounced as the tidal waves progress towards the estuary head. This suggests that when studying tidal currents and related issues in the Pearl River Estuary, the impact of wave-enhanced bottom stress should be given significant attention.
Figure 10
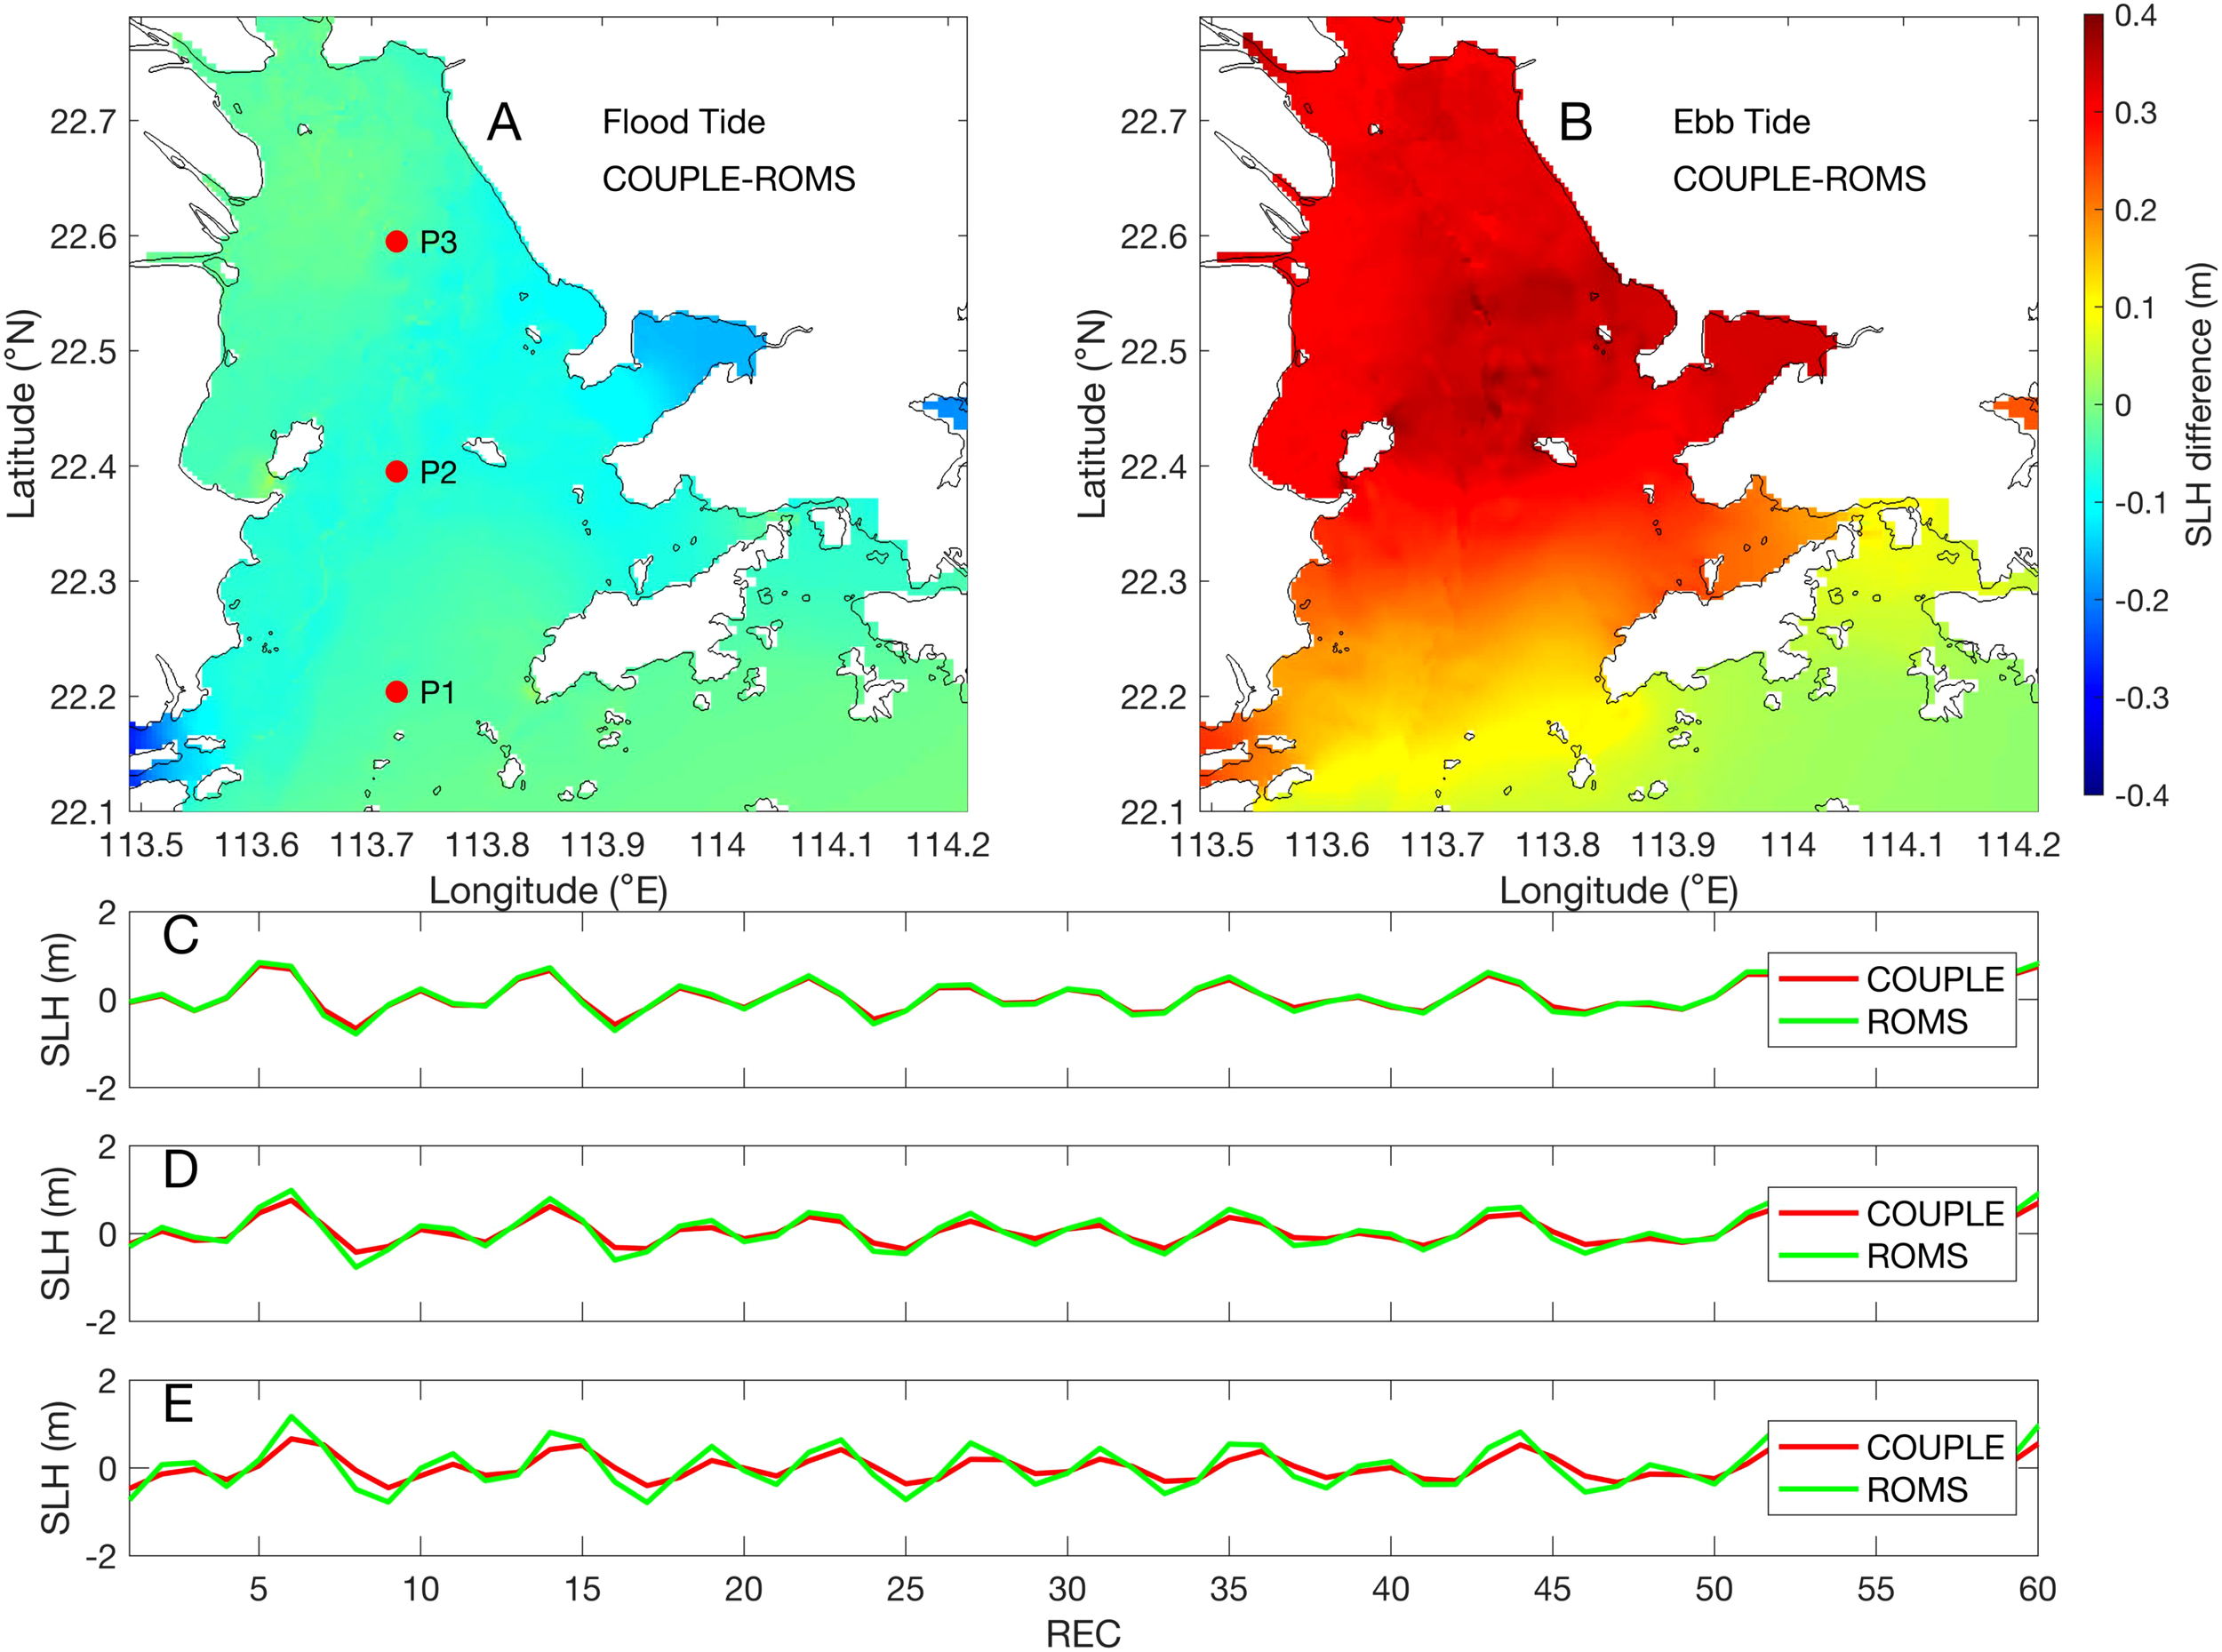
(A) Water level changes caused by all wave effects in the fully coupled model at maximum flood; (B) is the same as (A), but for maximum ebb. The water level time series at points P1, P2, and P3 in (A) are displayed in (C-E), respectively.
4.2.3 Variations in the freshwater plume
Figure 11 shows the adjustments of sea surface salinity induced by fully coupled wave effects (COUPLE), wave-enhanced mixing (TKE), wave-enhanced bottom boundary layer (BBL), and 3D wave forces (VF) during maximum flood and ebb, respectively. It can be seen that, in both tidal phases, waves reduce salinity north of Qi’ao Island while increasing salinity south of the island. This is due to waves weakening the southward transport of freshwater, resulting in more freshwater being confined to the river mouths. The wave-enhanced mixing and 3D wave forces also cause significant salinity variations near the salinity front, with high-variation zones exhibiting patchy, random, and irregular distributions. This is actually consistent with the variations in the current field (Figure 9), and it also indicates that both wave mixing and 3D wave forces, either directly or indirectly, ultimately influence the horizontal distribution of salinity.
Figure 11
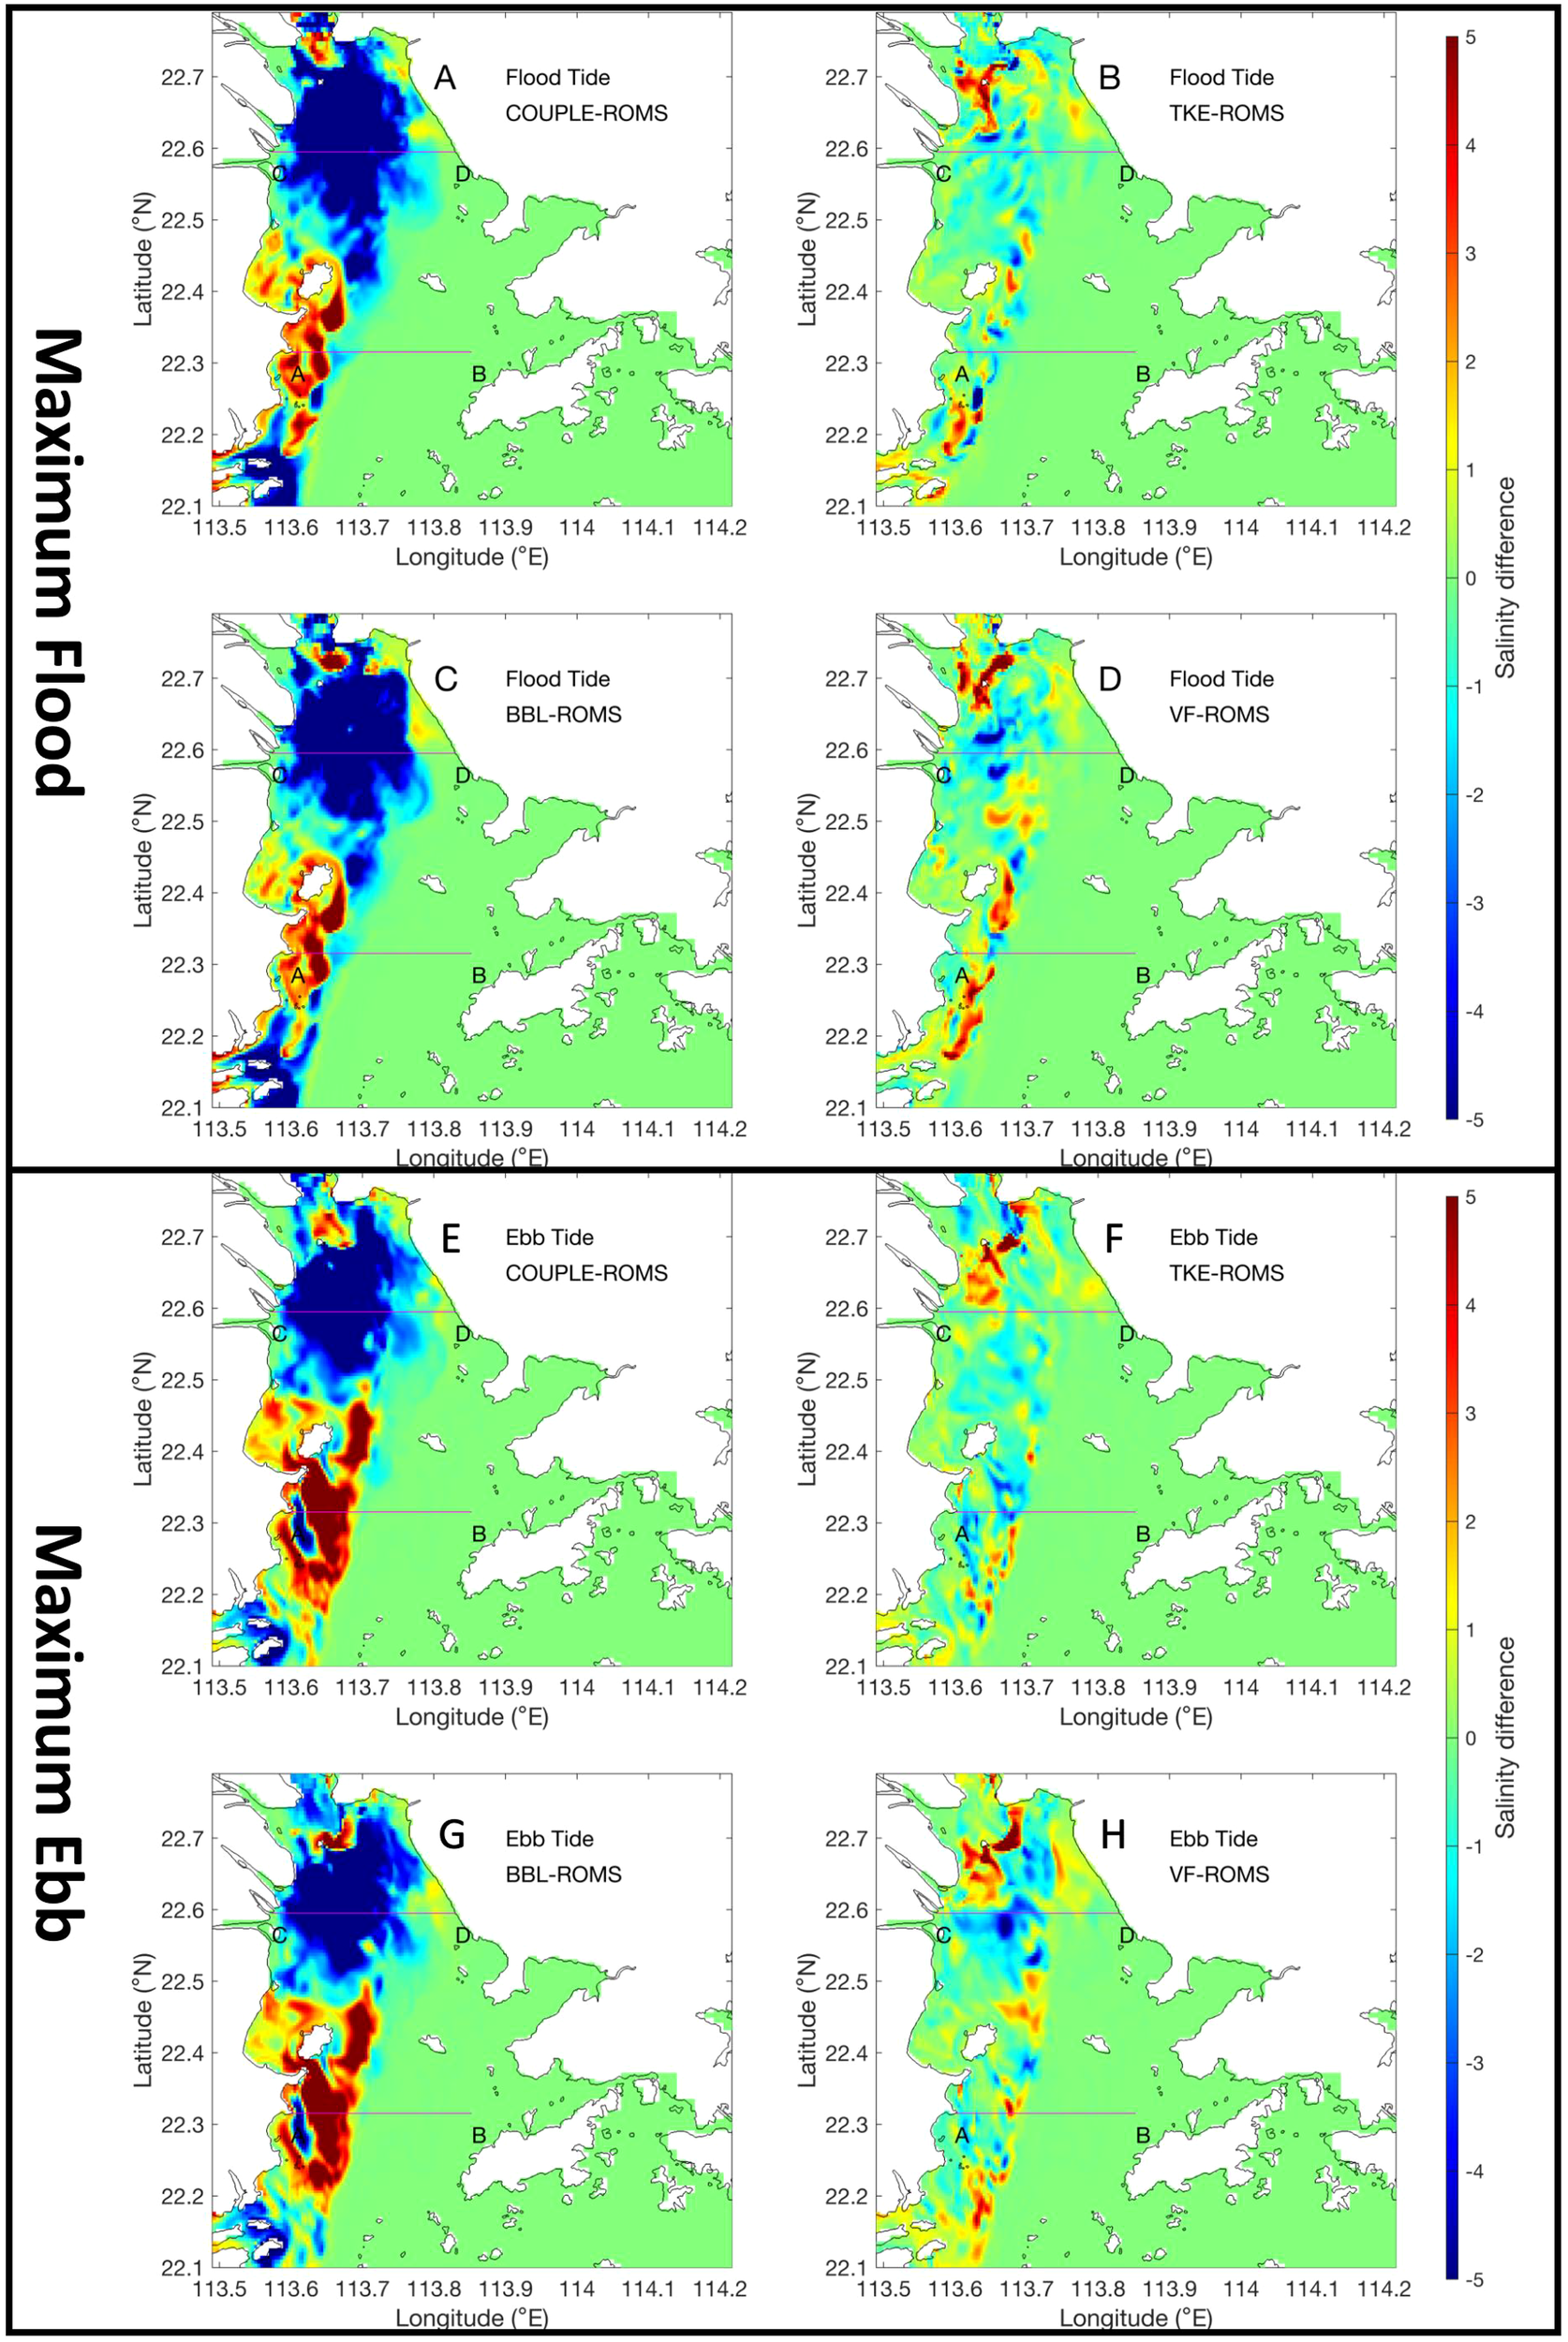
Adjustment of sea surface salinity by all wave effects in the (A, E) fully coupled model, (B, F) wave-enhanced mixing, (C, G) wave-enhanced bottom boundary layer, and (D, H) 3D wave forces at maximum flood and ebb, respectively. Additionally, the figure shows two sections, AB and CD.
Figure 12 shows the salinity changes induced by each numerical experiment at maximum flood and ebb along sections AB and CD (locations shown in Figures 1B and 11), respectively. It can be observed that wave-enhanced bottom boundary layer consistently cause full-depth salinity reduction in section CD under both tidal phases. This further confirms that more freshwater is trapped near the western estuary. Overall, the wave-enhanced mixing tends to decrease salinity throughout the entire water column at the front, as the enhanced mixing facilitates the downward expansion of the low-salinity water from the upper layer nearby the front. Additionally, due to the shallow bathymetry of the Pearl River Estuary, the effects of waves often lead to uniform salinity changes in the entire water column. The three wave effects can cause vertical adjustments in salinity across the entire water column depth, thereby altering the stratification within the estuary.
Figure 12
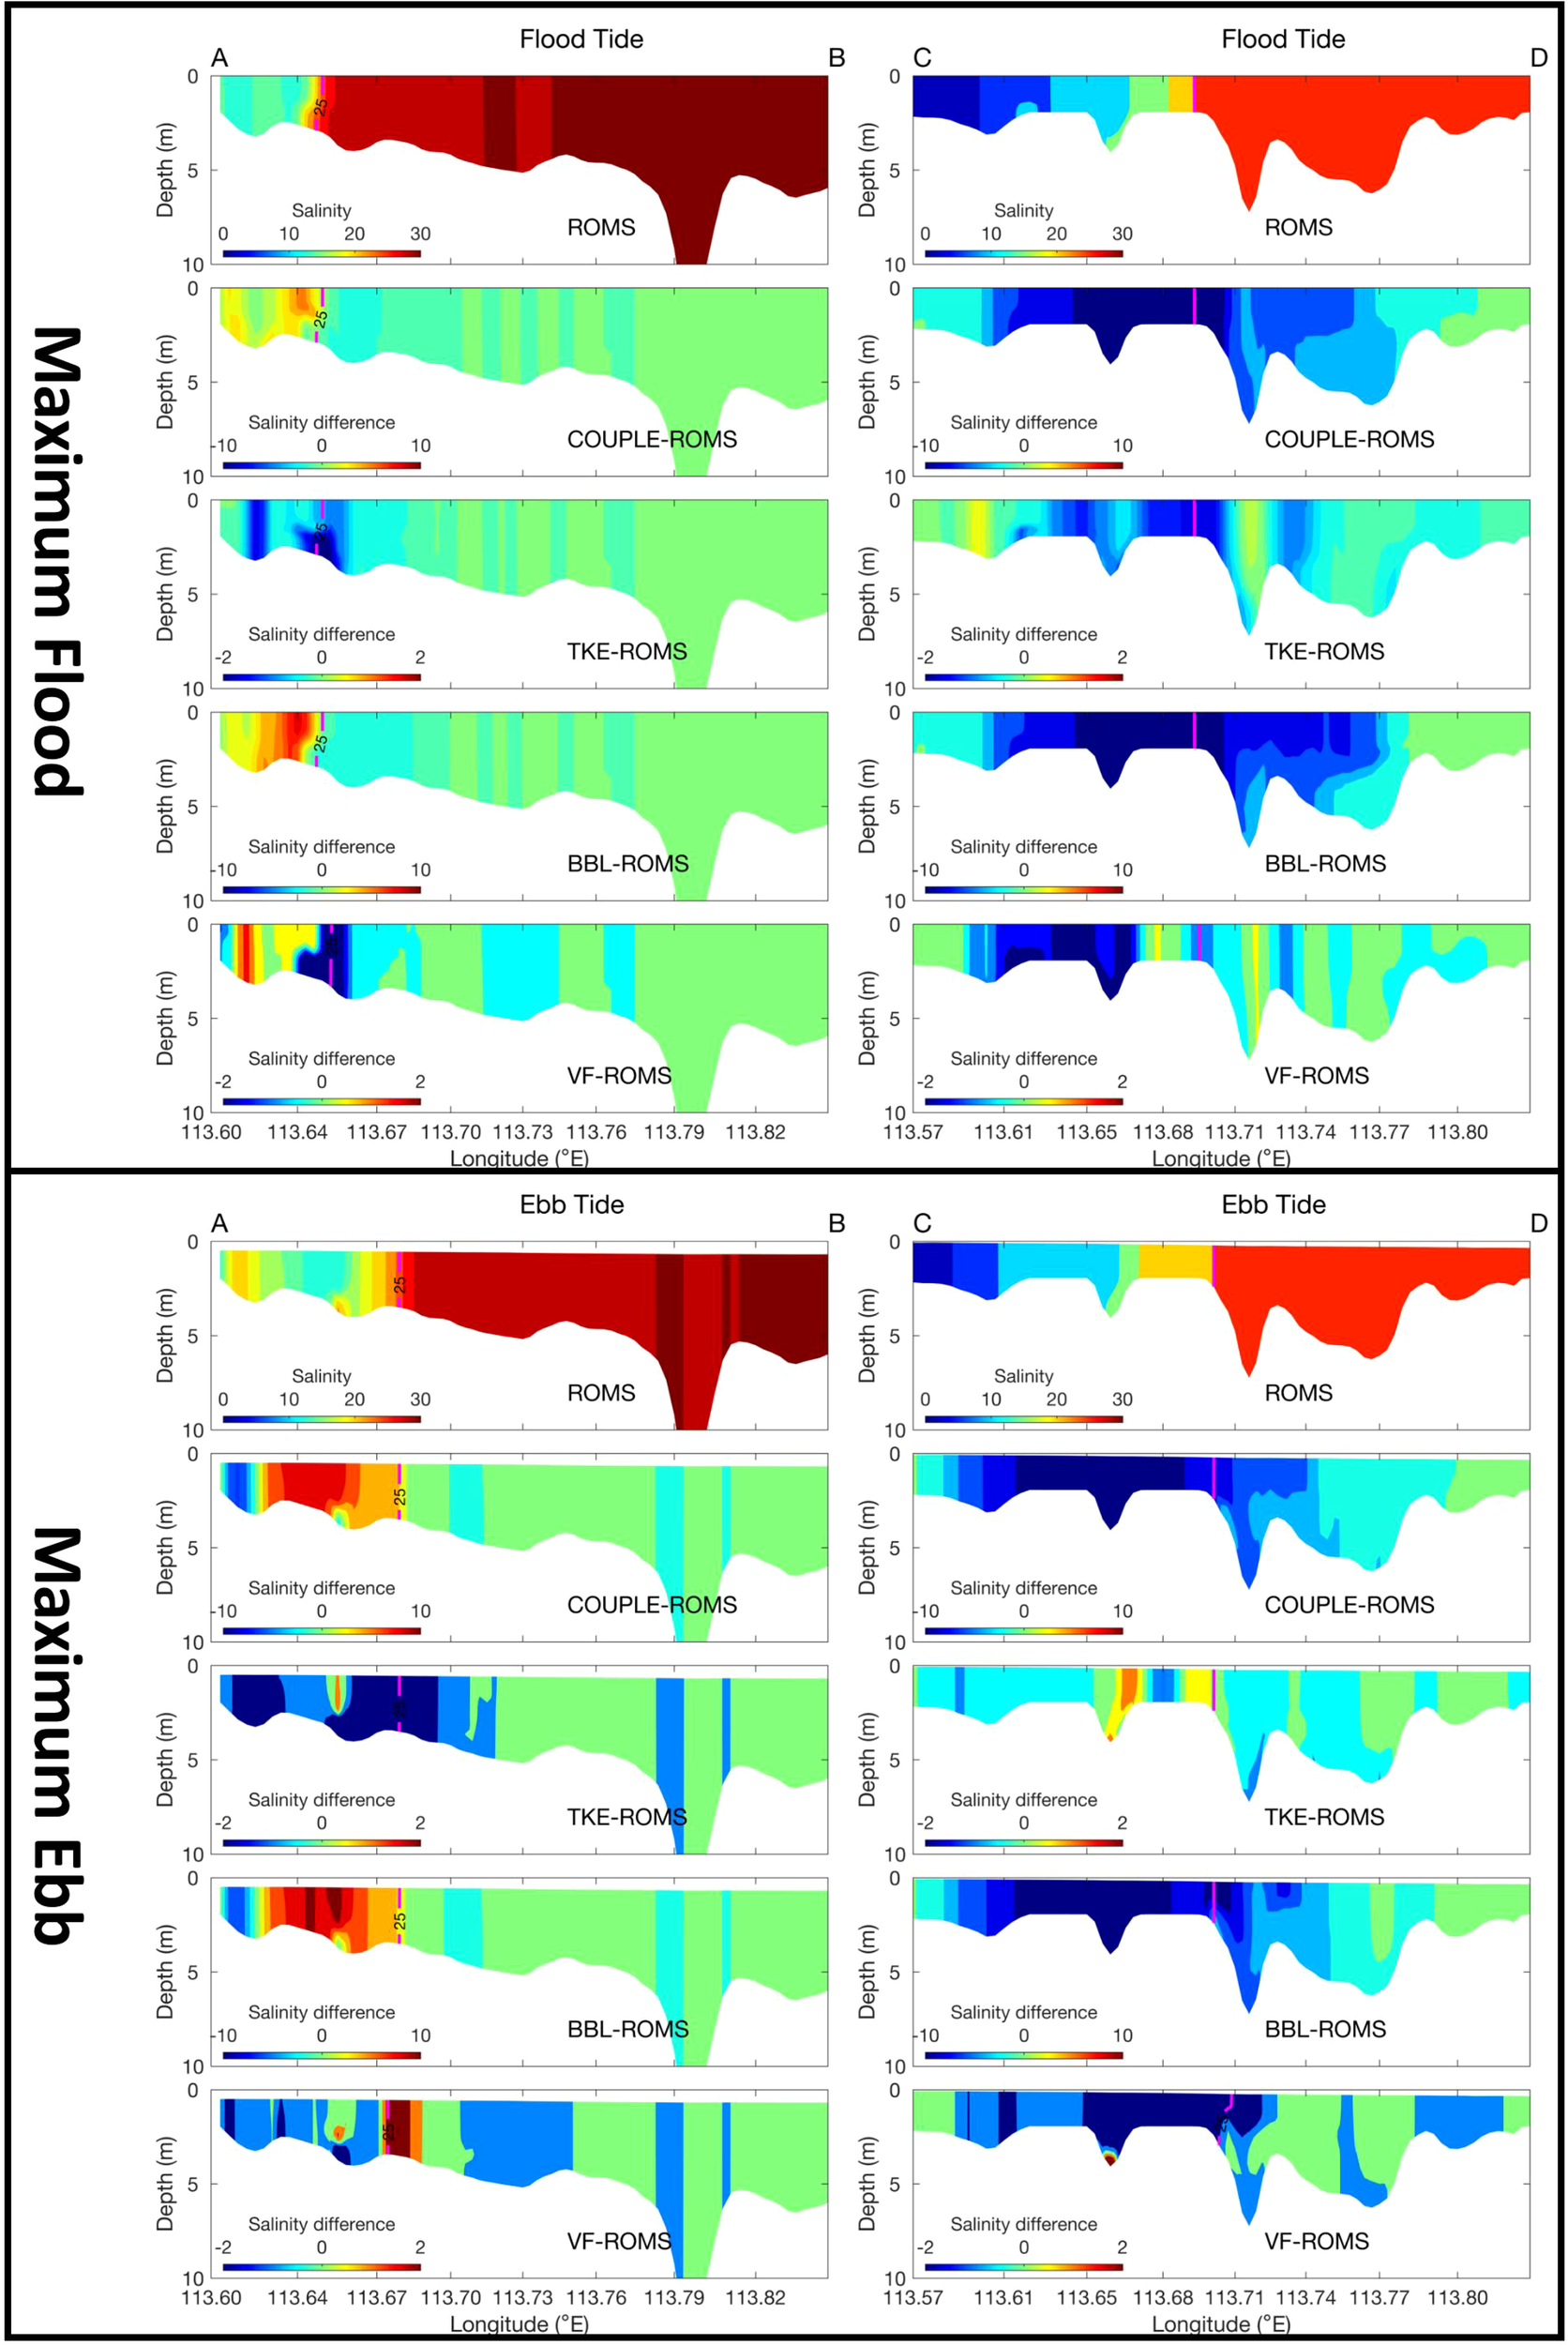
Salinity changes induced by each numerical experiment on sections AB (left column) and CD (right column) at maximum flood and ebb, respectively. The purple line represents the 25 isohaline, note that the colorbar scale differs.
Figure 13 shows the distribution of the salinity front (25 psu isohaline) at maximum flood and ebb under different numerical experiments. At both tidal phases, more freshwater is confined to the head of the estuary (north of approximately 22.5°N) due to wave-enhanced bottom friction. As a result, the front position in the BBL experiment is significantly shifted eastward compared to ROMS. In this region, wave-enhanced bottom friction dominates among the three wave effects, and thus, the front position in the COUPLE experiment is also shifted eastward compared to ROMS, but slightly to the west compared to BBL. This may be due to the wave-enhanced mixing aiding the westward intrusion of high-salinity water from the east.
Figure 13
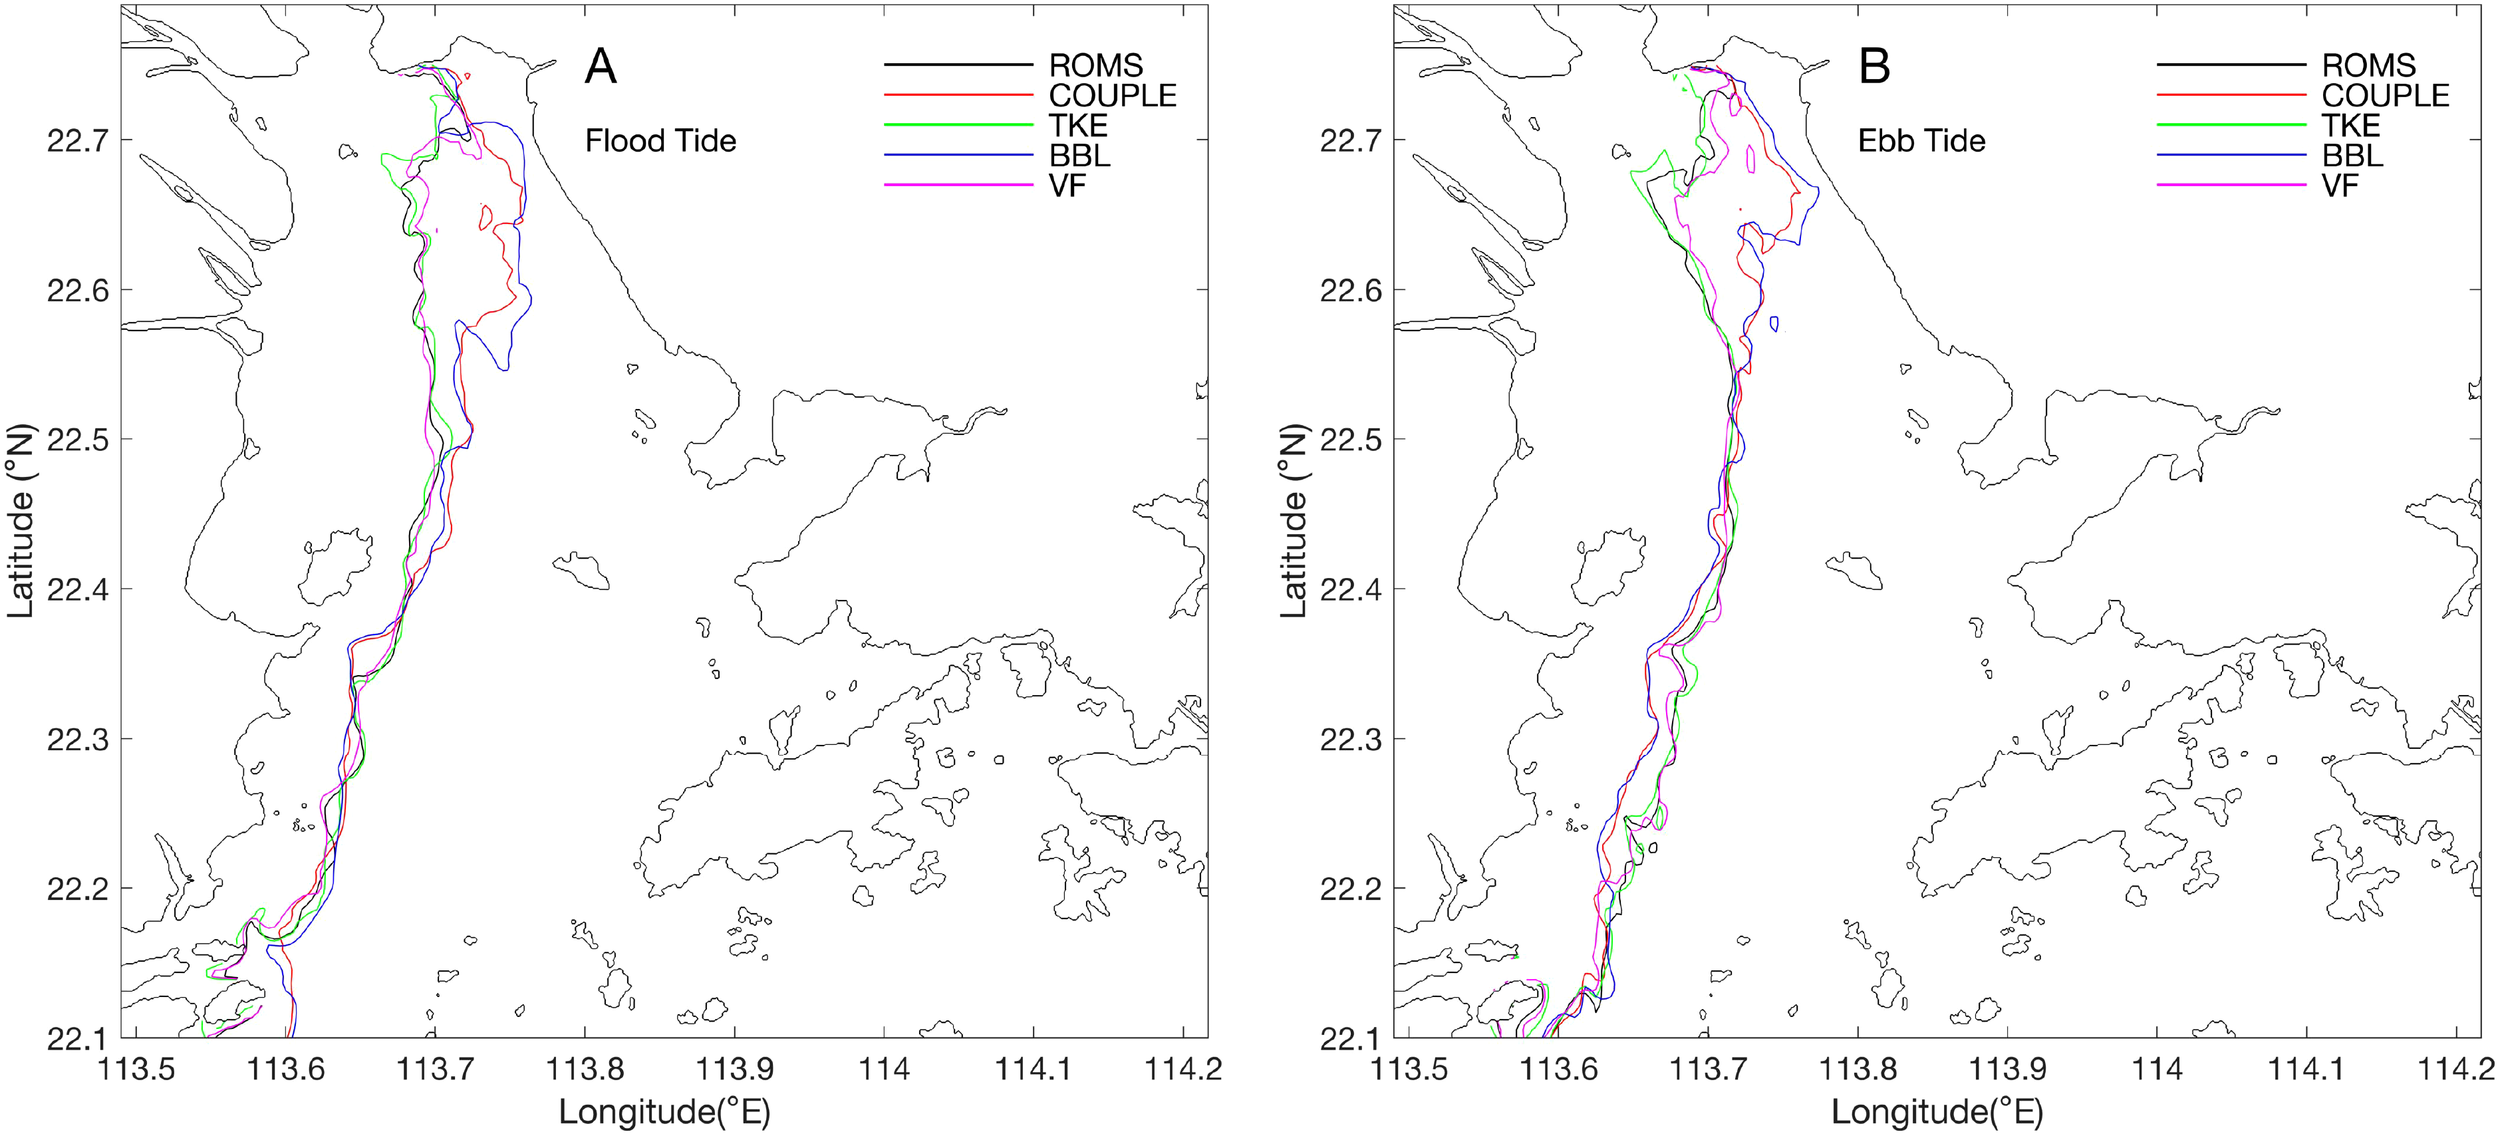
Distribution of the salinity front (25 psu isohaline) positions at (A) maximum flood and (B) maximum ebb for each numerical experiment.
In contrast, the 3D wave forces promote the eastward expansion of freshwater in this region. At maximum ebb, the front positions in both the BBL and COUPLE experiments shift significantly westward compared to ROMS in the area south of Qi’ao Island, due to reduced freshwater transport to this region. However, at maximum flood, the front positions in the experiments overlap, indicating a complex spatial redistribution process of the freshwater plume in this area. From the perspective of the entire salinity front, the effects of wave mixing and wave forces on the front vary at different locations: at the head of the estuary, wave mixing facilitates the westward expansion of high-salinity water, while south of Qi’ao Island, it promotes the eastward expansion of freshwater. The effect of wave forces is exactly the opposite of wave mixing: it helps the eastward expansion of freshwater at the head of the estuary, but often aids the westward expansion of high-salinity water south of Qi’ao Island. This demonstrates that the various wave effects are both mutually constraining and complementary in dynamically sensitive regions such as the plume front.
5 Summary
The Pearl River Estuary, as a crucial hydrodynamic environment in the northern South China Sea, plays an essential role in various aspects such as human society, production, fisheries, aquaculture, leisure tourism, and ecosystem stability. Understanding the complex interactions between tidal currents and wave fields in this region is crucial for comprehending the dynamics that influence water quality, sediment transport, and the overall ecological health of the estuary.
This study explored the modulation of wave fields by tidal currents, showing that tidal currents significantly influence wave characteristics, including significant wave height, wave direction, and the absolute mean bottom period. The ebb tide has a more pronounced impact on the wave field, contributing to a reduction in wave heights and directional changes. These findings demonstrate the importance of tidal currents in shaping wave dynamics and their impact on the estuarine environment.
The reverse modulation of wave effects on the currents was also examined. Wave-enhanced bottom boundary layer, wave mixing, and 3D wave forces all contributed to the weakening of tidal currents, with wave-induced bottom friction causing a phase delay in the water level and a decrease in the tidal amplitude. Additionally, the interaction between waves and currents significantly altered the salinity distribution, especially near the plume front, where wave-enhanced mixing and 3D wave forces caused substantial changes in the current and salinity fields.
Finally, these results highlight the intertwined relationship between tidal currents and wave fields, emphasizing the critical role of wave-current interactions in the dynamic processes of the Pearl River Estuary. Understanding these interactions is essential for predicting and managing estuarine and coastal environments, particularly in the context of increasing human activities and climate change.
Statements
Data availability statement
The original contributions presented in the study are included in the article/supplementary material. Further inquiries can be directed to the corresponding author.
Author contributions
PB: Formal Analysis, Funding acquisition, Methodology, Supervision, Validation, Visualization, Writing – original draft, Writing – review & editing. GC: Validation, Visualization, Writing – original draft. YW: Formal Analysis, Investigation, Resources, Writing – review & editing. BL: Conceptualization, Formal Analysis, Funding acquisition, Supervision, Writing – review & editing. ZR: Formal Analysis, Methodology, Writing – review & editing. YG: Formal Analysis, Investigation, Methodology, Visualization, Writing – review & editing.
Funding
The author(s) declare that financial support was received for the research and/or publication of this article. This study was jointly funded by the the National Natural Science Foundation of China (Nos. 42106017, 42449903), the Zhejiang Provincial Natural Science Foundation of China (No. LMS25D060003), the Special Fund for Zhejiang Ocean University from Bureau of Science and Technology of Zhoushan (No. 2023C41006), and the National Undergraduate Training Program for Innovation and Entrepreneurship (No. 202210340012).
Conflict of interest
The authors declare that the research was conducted in the absence of any commercial or financial relationships that could be construed as a potential conflict of interest.
Generative AI statement
The author(s) declare that no Generative AI was used in the creation of this manuscript.
Publisher’s note
All claims expressed in this article are solely those of the authors and do not necessarily represent those of their affiliated organizations, or those of the publisher, the editors and the reviewers. Any product that may be evaluated in this article, or claim that may be made by its manufacturer, is not guaranteed or endorsed by the publisher.
References
1
Bai P. Gu Y. Li P. Wu K. (2016). Tidal energy budget in the Zhujiang (Pearl River) Estuary. Acta Oceanologica Sinica.35, 54–65. doi: 10.1007/s13131-016-0850-9
2
Bai P. Ling Z. Liu C. Wu J. Xie L. (2020). Effects of tidal currents on winter wind waves in the Qiongzhou Strait: A numerical study. Acta Oceanologica Sin.39, 33–43. doi: 10.1007/s13131-020-1673-2
3
Bai P. Wu L. Chen Z. Xu J. Li B. Li P. (2023). Investigating the storm surge and flooding in shenzhen city, China. Remote Sens.15, 5002. doi: 10.3390/rs15205002
4
Bai P. Yang J. Zhang S. Xie L. Wu J. (2019). Upwelling off the west coast of Hainan Island: Sensitivity to wave-mixing. Acta Oceanologica Sin.38, 11–19. doi: 10.1007/s13131-019-1494-3
5
Booij N. R. R. C. Ris R. C. Holthuijsen L. H. (1999). A third-generation wave model for coastal regions: 1. Model description and validation. J. geophysical research: Oceans104, 7649–7666. doi: 10.1029/98JC02622
6
Chen C. Li P. Shi M. Zuo J. Chen M. Sun H. (2009). Numerical study of the tides and residual currents in the Qiongzhou Strait. Chin. J. Oceanology Limnology.27, 931–942. doi: 10.1007/s00343-009-9193-0
7
Ding Y. (1994). The summer monsoon in East Asia. In Monsoons over China (pp. 1-90). Dordrecht: Springer Netherlands.
8
Dong L. Su J. Wong L. A. Cao Z. Chen J. C. (2004). Seasonal variation and dynamics of the Pearl River plume. Continental Shelf Res.24, 1761–1777. doi: 10.1016/j.csr.2004.06.006
9
Fang G. Kwok Y. K. Yu K. Zhu Y. (1999). Numerical simulation of principal tidal constituents in the South China Sea, Gulf of Tonkin and Gulf of Thailand. Continental Shelf Res.19, 845–869. doi: 10.1016/S0278-4343(99)00002-3
10
Gan J. Cheung A. Guo X. Li L. (2009a). Intensified upwelling over a widened shelf in the northeastern South China Sea. J. Geophysical Research: Oceans114, C09019. doi: 10.1029/2007JC004660
11
Gan J. Li L. Wang D. Guo X. (2009b). Interaction of a river plume with coastal upwelling in the northeastern South China Sea. Continental Shelf Res.29, 728–740. doi: 10.1016/j.csr.2008.12.002
12
Gao J. Hou L. Liu Y. Shi H. (2024). Influences of bragg reflection on harbor resonance triggered by irregular wave groups. Ocean Eng.305, 117941. doi: 10.1016/j.oceaneng.2024.117941
13
Gao J. Ma X. Dong G. Chen H. Liu Q. Zang J. (2021). Investigation on the effects of Bragg reflection on harbor oscillations. Coastal Eng.170, 103977. doi: 10.1016/j.coastaleng.2021.103977
14
Gao J. Shi H. Zang J. Liu Y. (2023). Mechanism analysis on the mitigation of harbor resonance by periodic undulating topography. Ocean Eng.281, 114923. doi: 10.1016/j.oceaneng.2023.114923
15
Gu Y. Pan J. Lin H. (2012). Remote sensing observation and numerical modeling of an upwelling jet in Guangdong coastal water. J. Geophysical Research: Oceans117, C08019. doi: 10.1029/2012JC007922
16
Harrison P. J. Yin K. Lee J. H. W. Gan J. Liu H. (2008). Physical–biological coupling in the Pearl River Estuary. Cont. Shelf Res.28 (12), 1405–1415. doi: 10.1016/j.csr.2007.02.011
17
Hu S. Liu B. Hu M. Yu X. Deng Z. Zeng H. et al . (2023). Quantification of the nonlinear interaction among the tide, surge and river in Pearl River Estuary. Estuarine Coastal Shelf Sci.290, 108415. doi: 10.1016/j.ecss.2023.108415
18
Ji X. Sheng J. Tang L. Liu D. Yang X. (2011). Process study of circulation in the Pearl River Estuary and adjacent coastal waters in the wet season using a triply-nested circulation model. Ocean Modelling.38, 138–160. doi: 10.1016/j.ocemod.2011.02.010
19
Jia L. Ren J. Nie D. Chen B. Lv X. (2014). Wave-current bottom shear stresses and sediment re-suspension in the mouth bar of the Modaomen Estuary during the dry season. Acta Oceanologica Sinica.33, 107–115. doi: 10.1007/s13131-014-0510-x
20
Jia L. Wen Y. Pan S. Liu J. T. He J. (2015). Wave–current interaction in a river and wave dominant estuary: A seasonal contrast. Appl. Ocean Res.52, 151–166. doi: 10.1016/j.apor.2015.06.004
21
Jin Z. Wang T. Yin B. (1998). Effects of combined wave, tide, and storm surge on bottom stress. Oceanologia Limnologia Sinica.29, 604–610. (In Chinese)
22
Lai Z. Ma R. Gao G. Chen C. Beardsley R. C. (2015). Impact of multichannel river network on the plume dynamics in the Pearl River estuary. J. Geophysical Research: Oceans120, 5766–5789. doi: 10.1002/2014JC010490
23
Larson J. Jacob R. Ong E. (2005). The model coupling toolkit: A new Fortran90 toolkit for building multiphysics parallel coupled models. Int. J. High Performance Computing Appl.19, 277–292. doi: 10.1177/109434200505611
24
Liu H. Wu C. Wu Y. (2015). The energy budget under the influence of topography in the Zhujiang River Estuary in China. Acta Oceanologica Sinica.34, 148–158. doi: 10.1007/s13131-015-0606-y
25
Luo Z. Huang B. Chen X. Tan C. Qiu J. Huang G. (2021). Effects of wave-current interaction on storm surge in the Pearl River Estuary: A case study of super typhoon Mangkhut. Front. Marine Sci.8. doi: 10.3389/fmars.2021.692359
26
Madsen O. S. (1994). Spectral wave-current bottom boundary layer flows. Coastal Eng., 384–398. doi: 10.1061/9780784400890.030
27
Mao Q. Shi P. Yin K. Gan J. Qi Y. (2004). Tides and tidal currents in the Pearl River Estuary. Continental Shelf Res.24, 1797–1808. doi: 10.1016/j.csr.2004.06.008
28
McWilliams J. C. Restrepo J. M. Lane E. M. (2004). An asymptotic theory for the interaction of waves and currents in coastal waters. J. Fluid Mechanics511, 135–178. doi: 10.1017/S0022112004009358
29
Ni P. Wei X. Liu H. (2012). Spatial distribution of tidal energy and its dissipation in the Pearl River Estuary. Acta Scientiarum Naturalium Universitatis Sunyatseni.51, 128–132.
30
Olabarrieta M. Warner J. C. Kumar N. (2011). Wave-current interaction in willapa bay. J. Geophysical Research: Oceans116, C12014. doi: 10.1029/2011JC007387
31
Ou S. Zhang H. Wang D. He J. (2007). Horizontal characteristics of buoyant plume off the Pearl River Estuary during summer. J. Coastal Res.50, 652–657. doi: 10.2112/JCR-SI50-123.1
32
Pan J. Gu Y. Wang D. (2014). Observations and numerical modeling of the Pearl River plume in summer season. J. Geophysical Research: Oceans119, 2480–2500. doi: 10.1002/2013JC009042
33
Pawlowicz R. Beardsley B. Lentz S. (2002). Classical tidal harmonic analysis including error estimates in MATLAB using T_TIDE. Comput. Geosciences.28, 929–937. doi: 10.1016/S0098-3004(02)00013-4
34
Pleskachevsky A. Eppel D. P. Kapitza H. (2009). Interaction of waves, currents and tides, and wave-energy impact on the beach area of Sylt Island. Ocean Dynamics59, 451–461. doi: 10.1007/s10236-008-0174-1
35
Ren Z. Bao Y. (2013). Simulation of wave fields in Lingdingyang under typhoon conditions. J. Hydrodynamics.3, 008. doi: 10.3969/j.issn1000-4874.2013.03.007
36
Ris R. C. Holthuijsen L. H. Booij N. (1999). A third-generation wave model for coastal regions: 2. Verification. J. Geophysical Research: Oceans104, 7667–7681. doi: 10.1029/1998JC900123
37
Rong Z. Hetland R. D. Zhang W. Zhang X. (2014). Current–wave interaction in the Mississippi–Atchafalaya river plume on the Texas–Louisiana shelf. Ocean Modelling.84, 67–83. doi: 10.1016/j.ocemod.2014.09.008
38
Shchepetkin A. F. McWilliams J. C. (2005). The regional oceanic modeling system (ROMS): a split-explicit, free-surface, topography-following-coordinate oceanic model. Ocean modelling9, 347–404. doi: 10.1016/j.ocemod.2004.08.002
39
Uchiyama Y. McWilliams J. C. Shchepetkin A. F. (2010). Wave–current interaction in an oceanic circulation model with a vortex-force formalism: Application to the surf zone. Ocean Modelling34, 16–35. doi: 10.1016/j.ocemod.2010.04.002
40
Vincent C. E. (1979). The interaction of wind-generated sea waves with tidal currents. J. Phys. Oceanography9, 748–755. doi: 10.1175/1520-0485(1979)009<0748:TIOWGS>2.0.CO;2
41
Wang C. (2006). Numerical modelling of wave-current induced turbidity maximum in the Pearl River estuary [D]. Hong Kong Polytechnic University.
42
Wang D. Shu Y. Xue H. Hu J. Chen J. Zhuang W. et al . (2014). Relative contributions of local wind and topography to the coastal upwelling intensity in the northern South China Sea. J. Geophysical Research: Oceans119, 2550–2567. doi: 10.1002/2013JC009172
43
Wang C. H. Wai O. W. (2006). Three-dimensional modeling of sediment transport in the Pearl River Estuary. J. China Institute Water Resour. Hydropower Res.4, 246–252. doi: 10.13244/j.cnki.jiwhr.2006.04.002 (In Chinese)
44
Wang C. Wai O. W. H. Li Y. S. Chen Y. (2006). Modelling of the wave-current interaction in the Pearl River Estuary. J. Hydrodynamics Ser. B.18, 159–165. doi: 10.1016/S1001-6058(06)60047-4
45
Wang D. Zhuang W. Xie S. P. Hu J. Shu Y. Wu R. (2012). Coastal upwelling in summer 2000 in the northeastern South China Sea. J. Geophysical Research: Oceans117, C04009. doi: 10.1029/2011JC007465
46
Warner J. C. Armstrong B. He R. Zambon J. B. (2010). Development of a coupled ocean-atmosphere-wave-sediment transport (COAWST) modeling system. Ocean modelling35, 230–244. doi: 10.1016/j.ocemod.2010.07.010
47
Warner J. C. Geyer W. R. Lerczak J. A. (2005). Numerical modeling of an estuary: a comprehensive skill assessment. J. Geophysical Research: Oceans (1978 - 2012)110, C05001. doi: 10.1029/2004JC002691
48
Weber J. E. H. (2008). A note on mixing due to surface wave breaking. J. Geophysical Research: Oceans113, C11009. doi: 10.1029/2008JC004758
49
Willmott C. J. (1981). On the validation of models. Phys. Geography.2, 184–194. doi: 10.1080/02723646.1981.10642213
50
Wong L. A. Chen J. C. Dong L. X. (2004). A model of the plume front of the Pearl River Estuary, China and adjacent coastal waters in the winter dry season. Continental Shelf Res.24, 1779–1795. doi: 10.1016/j.csr.2004.06.007
51
Wong L. A. Chen J. C. Xue H. Dong L. X. Guan W. B. Su J. L. (2003b). A model study of the circulation in the Pearl River Estuary (PRE) and its adjacent coastal waters: 2. Sensitivity experiments. J. Geophysical Research: Oceans108, 3157. doi: 10.1029/2002JC001452
52
Wong L. A. Chen J. C. Xue H. Dong L. X. Su J. L. Heinke G. (2003a). A model study of the circulation in the Pearl River Estuary (PRE) and its adjacent coastal waters: 1. Simulations and comparison with observations. J. Geophysical Research: Oceans108, 3156. doi: 10.1029/2002JC001451
53
Xie L. Wu K. Pietrafesa L. Zhang C. (2001). A numerical study of wave-current interaction through surface and bottom stresses: Wind-driven circulation in the South Atlantic Bight under uniform winds. J. Geophysical Research: Oceans106, 16841–16855. doi: 10.1029/2000JC000292
54
Yang Y. Guan W. Deleersnijder E. He Z. (2022). Hydrodynamic and sediment transport modelling in the Pearl River Estuary and adjacent Chinese coastal zone during Typhoon Mangkhut. Continental Shelf Res.233, 104645. doi: 10.1016/j.csr.2022.104645
55
Yang J. Jiang S. Wu J. Xie L. Zhang S. Bai P. (2020). Effects of wave-current interaction on the waves, cold-water mass and transport of diluted water in the Beibu Gulf. Acta Oceanologica Sin.39, 25–40. doi: 10.1007/s13131-019-1529-9
56
Ye L. Preiffer K. D. (1990). Studies of 2D & 3D numerical simulation of Kelvin tide wave in Nei Lingdingyang at Pearl River Estuary. Ocean Eng.8, 33–44.
57
Zhang G. Chen Y. Cheng W. Zhang H. Gong W. (2021a). Wave effects on sediment transport and entrapment in a channel-shoal estuary: The Pearl River Estuary in the dry winter season. J. Geophysical Research: Oceans126, e2020JC016905. doi: 10.1029/2020JC016905
58
Zhang H. Hu S. Cheng W. Zhu L. Chen Y. Liu J. et al . (2021b). Response of freshwater transport during typhoons with wave-induced mixing effects in the Pearl River Estuary, China. Estuarine Coastal Shelf Sci.258, 107439. doi: 10.1016/j.ecss.2021.107439
59
Zhang G. Hu S. Yu X. Zhang H. Gong W. (2024). Wind and wave effects on the dispersal of the Pearl River-derived sediment over the Shelf. EGUsphere2024, 1–61. doi: 10.5194/egusphere-2024-3289
60
Zhao H. (1990). Evolution of the Pearl River Estuary (Beijing: Ocean Press).
61
Zheng S. Guan W. Cai S. Wei X. Huang D. (2014). A model study of the effects of river discharges and interannual variation of winds on the plume front in winter in Pearl River Estuary. Continental Shelf Res.73, 31–40. doi: 10.1016/j.csr.2013.11.019
62
Zhong L. Li M. (2006). Tidal energy fluxes and dissipation in the Chesapeake Bay. Continental Shelf Res.26, 752–770. doi: 10.1016/j.csr.2006.02.006
63
Zou Q. (2002). An analytical model of wave bottom boundary layers incorporating turbulent relaxation and diffusion effects. J. Phys. oceanography32, 2441–2456. doi: 10.1175/1520-0485(2002)032<2441:AAMOWB>2.0.CO;2
64
Zu T. Wang D. Gan J. Guan W. (2014). On the role of wind and tide in generating variability of Pearl River plume during summer in a coupled wide estuary and shelf system. J. Marine Systems.136, 65–79. doi: 10.1016/j.jmarsys.2014.03.005
Summary
Keywords
pearl river estuary, wave-current interaction, wave field, tidal currents, freshwater plume, COAWST
Citation
Bai P, Chen G, Wang Y, Li B, Ruan Z and Gao Y (2025) Effect of wave-current interaction on the hydrological environment in a shallow river estuary. Front. Mar. Sci. 12:1585330. doi: 10.3389/fmars.2025.1585330
Received
28 February 2025
Accepted
31 March 2025
Published
08 May 2025
Volume
12 - 2025
Edited by
Qinsheng Wei, Ministry of Natural Resources, China
Reviewed by
Shivanesh Rao, Industry and Environment (DPIE), Australia
Junliang Gao, Jiangsu University of Science and Technology, China
Updates
Copyright
© 2025 Bai, Chen, Wang, Li, Ruan and Gao.
This is an open-access article distributed under the terms of the Creative Commons Attribution License (CC BY). The use, distribution or reproduction in other forums is permitted, provided the original author(s) and the copyright owner(s) are credited and that the original publication in this journal is cited, in accordance with accepted academic practice. No use, distribution or reproduction is permitted which does not comply with these terms.
*Correspondence: Bo Li, acelibo@zjou.edu.cn
†These authors contributed equally to this work and share first authorship
Disclaimer
All claims expressed in this article are solely those of the authors and do not necessarily represent those of their affiliated organizations, or those of the publisher, the editors and the reviewers. Any product that may be evaluated in this article or claim that may be made by its manufacturer is not guaranteed or endorsed by the publisher.