 Zhiyuan Wu1,2,3,4*
 Zeyuan Zou1
 Jie Chen1,3,4*Hongmei Luo2Bin Deng1,3,4
 Changbo Jiang1,3,4Zhao Lv1,5Haojian Zhang1,5
- 1School of Hydraulic and Ocean Engineering, Changsha University of Science & Technology, Changsha, China
- 2Key Laboratory of High Impact Weather (Special), China Meteorological Administration, Changsha, China
- 3Key Laboratory of Water-Sediment Sciences and Water Disaster Prevention of Hunan Province, Changsha, China
- 4Key Laboratory of Dongting Lake Aquatic Eco-Environmental Control and Restoration of Hunan Province, Changsha, China
- 5China Communications Construction Group (CCCC) Third Harbor Consultants Co., Ltd., Shanghai, China
The impact of the South China Sea (SCS) to the super typhoon Mangkhut (2018) and the air-sea interaction are evaluated through COAWST model in this study which fully coupled with the atmosphere model (WRF), the ocean model (ROMS), and the wave model (SWAN). A comparison of our modeled results with several buoys and tide stations revealed remarkable consistency, the minimum root mean square error (RMSE) for wind speed, significant wave height, and water level are 3.013 m/s, 0.641m, 0.007m. During the development and dissipation of super typhoon Mangkhut, the Coriolis force caused the typhoon wind field to exhibit a pronounced rightward deflection. The characteristics of the significant wave height field are generally similar to those of the wind field, although there is a temporal lag of several hours. Moreover, we researched on the spatiotemporal variations of sea surface temperature (SST) impact by the Mangkhut’s passage, and found that it exhibits two main characteristics: spatial asymmetry and temporal lag. The spatial asymmetry is primarily governed by typhoon-generated wind fields, while the temporal lag is mainly controlled by upwelling and vertical mixing processes during the typhoon’s passage, with Ekman pumping playing a pivotal role in these dynamics. This study mainly concentrates on investigating the dynamic and thermodynamic responses of the ocean during extreme weather conditions by using COAWST model.
1 Introduction
The South China Sea is one of the most active regions for typhoon formation and development. According to previous typhoons record, a total of 853 typhoons occurred during the period from 1951 to 2012 in the South China sea, 228 of them caused economic damages and human casualties (Chia and Ropelewski, 2002; Yap et al., 2015). Storm surge, strong wind and giant waves caused by typhoons represent a significant contributor to disasters and associated losses along the South China Sea coastline (Yin et al., 2013; Gao et al., 2014). Although there is a decreasing trend in the frequency of typhoons in the South China Sea due to the global warming, the intensity of these typhoons has been progressively increasing (Tsuboki et al., 2015; Tsou et al., 2016).Therefore accurate forecasting of typhoon behavior in the South China Sea, coupled with a thorough understanding of oceanic and wave dynamics under their influence, is imperative for strengthening disaster mitigation strategies and ensuring the sustainable development of national economies.
During the passage of a typhoon, intense interactions among the ocean, the atmosphere, the wave are induced, which affects the exchange of momentum, energy, and water vapor at the air-sea interface. The main forcing effects of a typhoon on the ocean include wind stress, pressure, heat flux, and solar radiation at the ocean surface. Throughout the typhoon’s influence, the upper ocean acts as a crucial mediator in the coupling response mechanisms between the ocean and the atmosphere. It governs the extent of energy and momentum exchange at the air-sea interface and plays a vital role in shaping the evolution and intensity of tropical cyclones by regulating heat flux and sea surface temperature. As the typhoon traverses the sea surface, the intense cyclonic wind stress acts as a primary driver of Ekman pumping (Lei et al., 2023). This process induces vertical water movements that uplift the thermocline, causing cooler subsurface waters to rise to the surface. This uplift triggers oceanic oscillations characterized by near-inertial responses (Anderson, 1952; Liu et al., 2011) and simultaneously leads to a significant decrease in sea surface temperature as cooler subsurface waters mix with the warmer upper layer (Liu et al., 2007; Pun et al., 2018). Chiang et al. (2011) found that the upwelling and entrainment induced by Typhoon Kide’s impact accounted for 62% and 31% of the temperature changes, respectively. Furthermore, variations in heat flux are among the most critical aspects of the feedback mechanisms linking the ocean, waves, and the atmosphere, as they directly influence energy transfer at the air-sea interface and impact the intensity and structure of tropical cyclones (Mei et al., 2015; Zhang et al., 2019).
Typhoons induce complex interactions among wind, waves, and currents through intense energy transfer at the air-sea interface. The asymmetric wind field of a typhoon drives non-uniform wave distribution, with higher wave heights typically observed on the right side of the storm due to the combined effect of wind speed and typhoon motion (Yang et al., 2020; Yin et al., 2021; Wu et al., 2021, Wu et al., 2024; Cheng et al., 2024). Satellite and buoy observations reveal a global increase in typhoon-induced wave extremes, with significant growth rates in maximum wave height (0.32%/yr), affected area (0.57%/yr), and cumulative wave energy (0.9%/yr) since 1979 (Wu et al., 2021; Sun et al., 2021; Wang et al., 2022; Chen et al., 2025). Notably, the Northwest Pacific exhibits faster wave height growth (0.41%/yr), though cumulative wave energy trends remain subdued due to reduced typhoon duration. Concurrently, typhoon-induced sea surface cooling, primarily driven by vertical mixing in deep waters and advection in coastal regions, exhibits a negative feedback mechanism, suppressing typhoon intensity (Wada et al., 2014; Wu et al., 2019a, Wu et al., 2019b; Wu et al., 2020; Lin et al., 2023). For instance, Typhoon Usagi (2013) caused a sea surface temperature (SST) drop of 4.5°C, validated by satellite and buoy data (Pan et al., 2018; Deng et al., 2019; Huang et al., 2022);. Storm surges, propagating as continental shelf waves along coastal regions, further compound hazards. Remote sensing analyses of Typhoons Fitow (2013) and Usagi (2013) highlight the alignment of surge characteristics with theoretical models, emphasizing the role of coupled wind stress and freshwater flux in modulating SST responses (Bao et al., 2019; Lou and Li, 2016; Zhao et al., 2022).
The wind-wave-current triad exhibits strong nonlinearity, particularly in typhoon systems. Wave breaking enhances sea surface roughness, altering air-sea momentum fluxes and feeding back into typhoon intensification (Liu et al., 2022; Li and Chen, 2022; Lan et al., 2022; Zhang and Yu, 2024), and waves impact on coastal and harbor structures (Gao et al., 2021, Gao et al., 2024, Gao et al., 2023). Coupled models, such as the typhoon-wave-current framework, have advanced hazard assessments for offshore infrastructure, yet challenges persist in resolving submesoscale eddies and boundary layer turbulence (Wei et al., 2023; Yang et al., 2024; Li et al., 2025). Recent innovations integrate artificial intelligence (AI) with physical models; for example, LSTM neural networks predict SST cooling patterns under typhoons, deep learning-based, a deep learning-based parameterization scheme, improves turbulent flux simulations in mesoscale models (Wu et al., 2019c; Cui et al., 2023, Cui et al., 2024; Wang et al., 2024).
In particular, ocean waves also play a crucial intermediary role by amplifying air-sea interactions. The wave breaking induced by the typhoon increases the air-sea contact area, leading to an increase in the typhoon’s water vapor flux and heat flux (Li et al., 2014; Zhao et al., 2017). However, the sea surface roughness exerts a negative feedback on typhoon development. Liu et al. (2012) conducted multiple experiments using a wind-wave-current coupled model to examine the effects of wave state, oceanic spray, and wave dissipation on typhoon Nabi’s intensity. The results showed that after including waves, the air-sea flux increased by 22%, and the average latent heat flux increased by 31%. The Stokes drift generated by ocean waves affects the dynamic and thermodynamic structures of the mixed layer, increasing vertical shear instability in the upper ocean, which enhances turbulent mixing in the upper layers, facilitating the transfer of momentum and heat to deeper ocean layers (Mellor and Blumberg, 2004; Deng et al., 2012). In summary, these studies provide valuable insights into the ocean and wave responses to typhoons, with considerable scientific value.
This study utilizes the COAWST model, with super typhoon Mangkhut (2018) as a representative case, to conduct coupled numerical simulations. We explore the complex interactions between the atmosphere, ocean waves, and ocean currents during the typhoon’s passage. A detailed analysis of the dynamic and thermodynamic response processes in the northern South China Sea under the influence of the typhoon is presented. Furthermore, we investigate the spatiotemporal variations of typhoon-induced waves and storm surges. Additionally, the research examines the underlying causes of the sea surface temperature decrease triggered by super typhoon Mangkhut.
2 Data and methods
2.1 Best track data and observational data
The best track data were obtained from three sources: the Tropical Cyclone Data Center of the China Meteorological Administration (https://tcdata.typhoon.org.cn) The datasets include the typhoon track and intensity recorded every 6 hours. We select four buoys provided by South China Sea Forecasting Center for validation of wind, sea level pressure, waves (http://g.hyyb.org/systems/HyybData/DataDB). Water levels data came from the global tide forecasting service platform (Global tide forecasting service platform).
2.2 COAWST coupled model
The COAWST model, developed and maintained by Warner et al. (2010), integrates the WRF atmospheric model, ROMS ocean model, and SWAN wave model through the Model Coupling Toolkit (Larson et al., 2005). The MCT handles data exchanges between the atmospheric, oceanic, and wave models
The versions used in this study include WRF 4.2 (Skamarock et al., 2019), ROMS with a free-surface and three-dimensional nonlinear baroclinic features (Shchepetkin and McWilliams, 2005), and the SWAN third-generation wave model optimized for nearshore wave simulations.
3 Experiment design and validation
3.1 Overview of super typhoon Mangkhut
Considering factors such as typhoon track, intensity, impact range, and disaster losses, the 2018 super typhoon Mangkhut has been selected as the subject of this study. The super typhoon Mangkhut, formed in the western Pacific on 18:00 (UTC) 7 September 2018, in the western Pacific, east of Guam. It strengthened into a severe tropical storm on 11:00 (UTC) 9 September and developed into a super typhoon on 16:00 (UTC) on September 11. Before making landfall on the Philippine Islands, it reached its peak intensity, with maximum sustained wind speeds of 250 km/h (69.4 m/s). Finally, Mangkut made landfall in Jiang meng, Guangdong, at 01:00 (UTC) on September 17, with maximum wind speeds of 45 m/s (14 on the Beaufort scale) and a minimum central pressure of 955 hPa. By the afternoon of September 17, the typhoon had significantly dissipated, downgrading into a tropical depression.
3.2 Domain and model design
Model domain set for this study covers 14°N–28°N, 105°E–125°E, including the northern South China Sea and the coastal areas of the Philippines (Figure 1). A two-layer grid system is utilized in the WRF model, with the primary grid defined at a resolution of 9 km and the secondary grid refined to a resolution of 3 km. Additionally, a vertical stratification of 32 layers is employed to capture the necessary atmospheric. ROMS model grid zone is nested within atmospheric model grid, consisted of resolution of 9km and 3km, with 16 sigma levels, and the grid domain of SWAN model is congruent with the spatial extent of ROMS model.
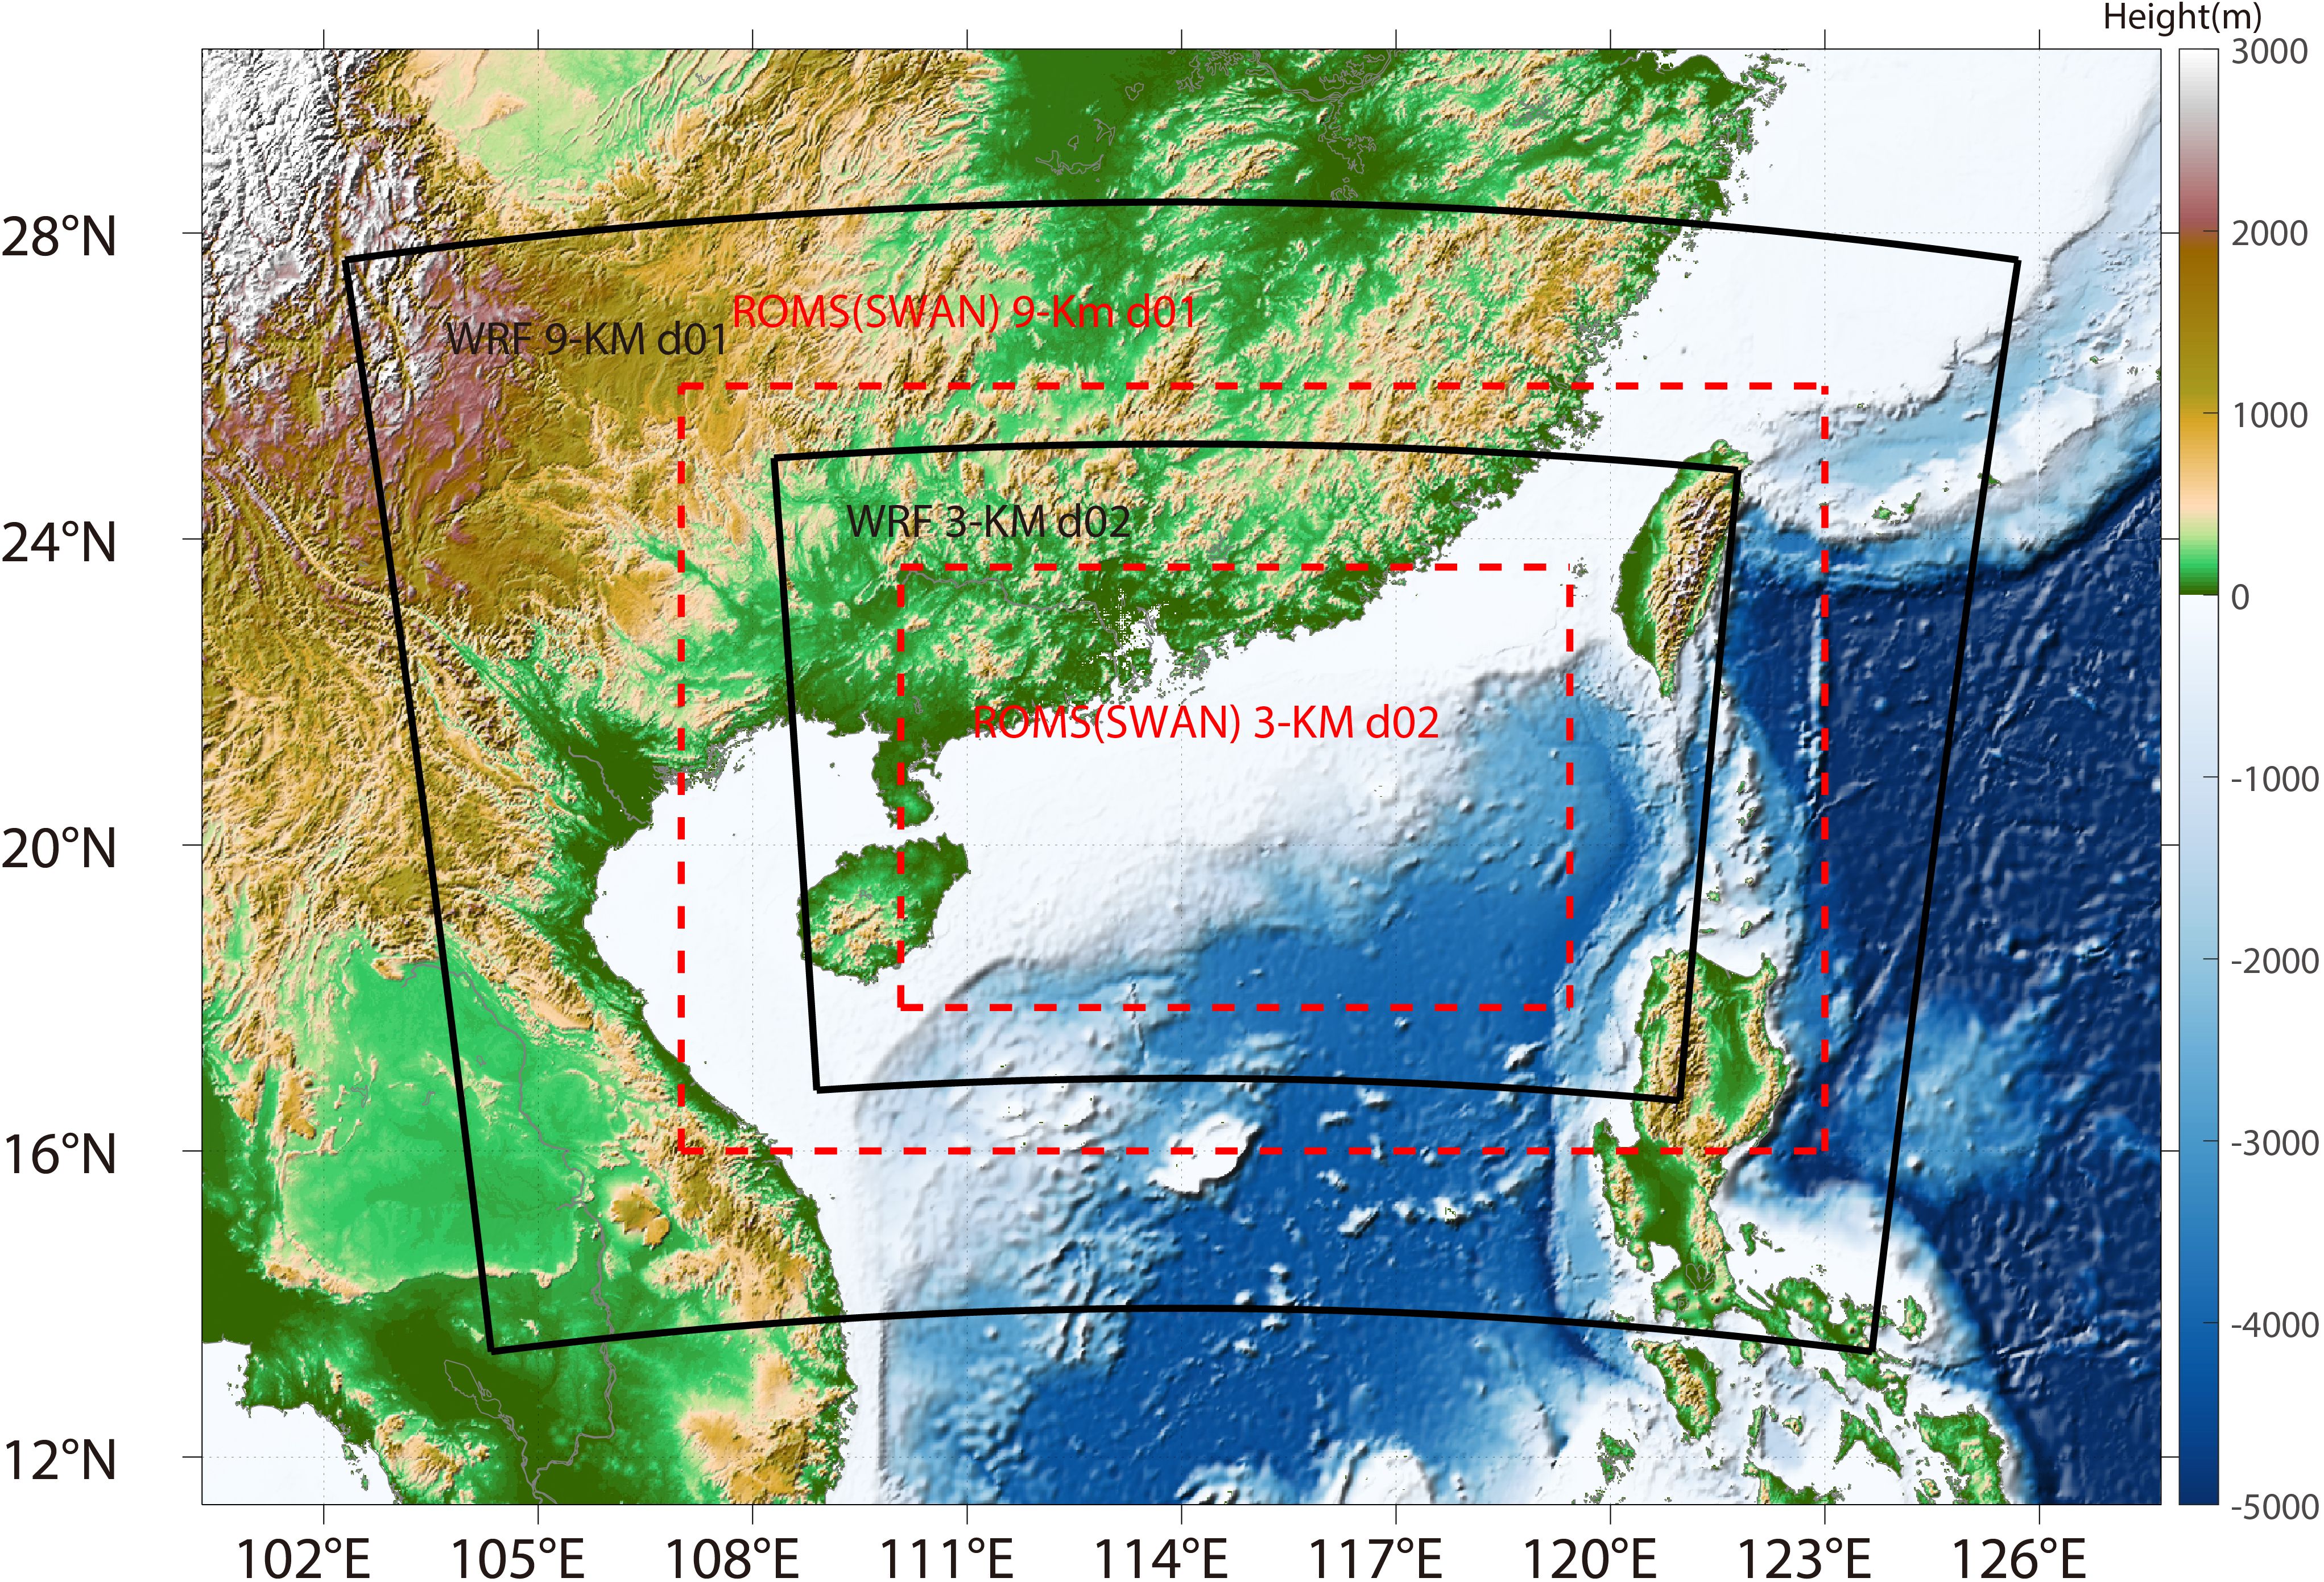
Figure 1. Domain set in SCS for coupled models.
The initial and boundary conditions of the WRF model were derived via the historical reanalysis dataset Final Analysis (FNL) provided by the National Centers for Environmental Prediction (NCEP), which have a horizontal resolution of 0.25° × 0.25° and a temporal interval of 6 hours (https://rda.ucar.edu/datasets/ds083.2/). The initial and boundary conditions required for ROMS model were obtained by interpolating the HYCOM reanalysis field (ftp://ftp.hycom.org) and OSU tidal data base, while the initial conditions for the wave model were sourced from NOAA’s historical wave data (ftp://polar.ncep.noaa.gov/pub/history/waves).
The simulation period covers September 13 to 20, 2018, with the first two days used for model initialization, and data exchange among atmosphere, ocean, wave component models occur every half hour through the MCT coupler. Table 1 summarizes the configurations for each model.
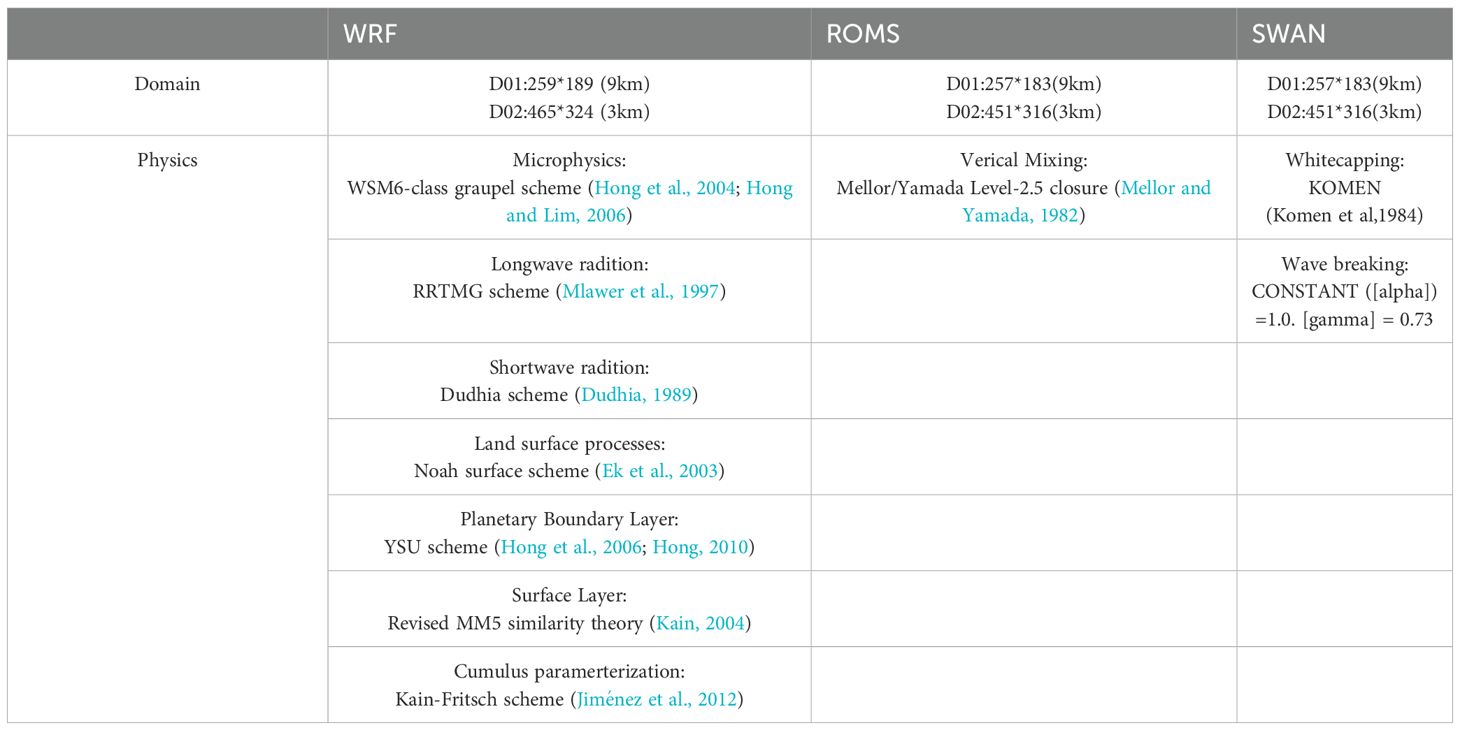
Table 1. Summary of experiments setup and configuration in this study.
3.3 Validation of typhoon track, wind and sea level pressure
After a two-days spin-up, we selected the simulation data from September 15 to 18 (UTC) for analysis. Figures 2, 3 includes the simulated typhoon tracks and the best-track data, with the verification sites also marked in the figure. Typhoon Mangkhut moved from southeast to northwest of SCS, and the simulated track closely matched the best track, with a maximum error of 60km. Typhoon first made landfall at 00:00 UTC on September 15 on the Philippine Peninsula, with a central pressure that was notably elevated and a track error of approximately 50 km. Influenced by the terrain of northern Luzon, the typhoon’s speed significantly decreased as it exited the Philippines and entered the South China Sea. The track error reduced considerably, remaining within 60 km, with the central low pressure and maximum wind speed near the center closely matching observations. During its passage through the South China Sea, Typhoon Mangkhut maintained a low-pressure stage of 940 hPa for 24 hours and the maximum wind speed near the center reached Category 1 strength (41.5–46.1 m/s). At 06:00 (UTC) on September 16, it made landfall in Jiangmen, Guangdong. The influence of the underlying surface gradually reduced the energy input sustaining the typhoon’s motion, leading to a rapid weakening of the cyclone’s intensity.
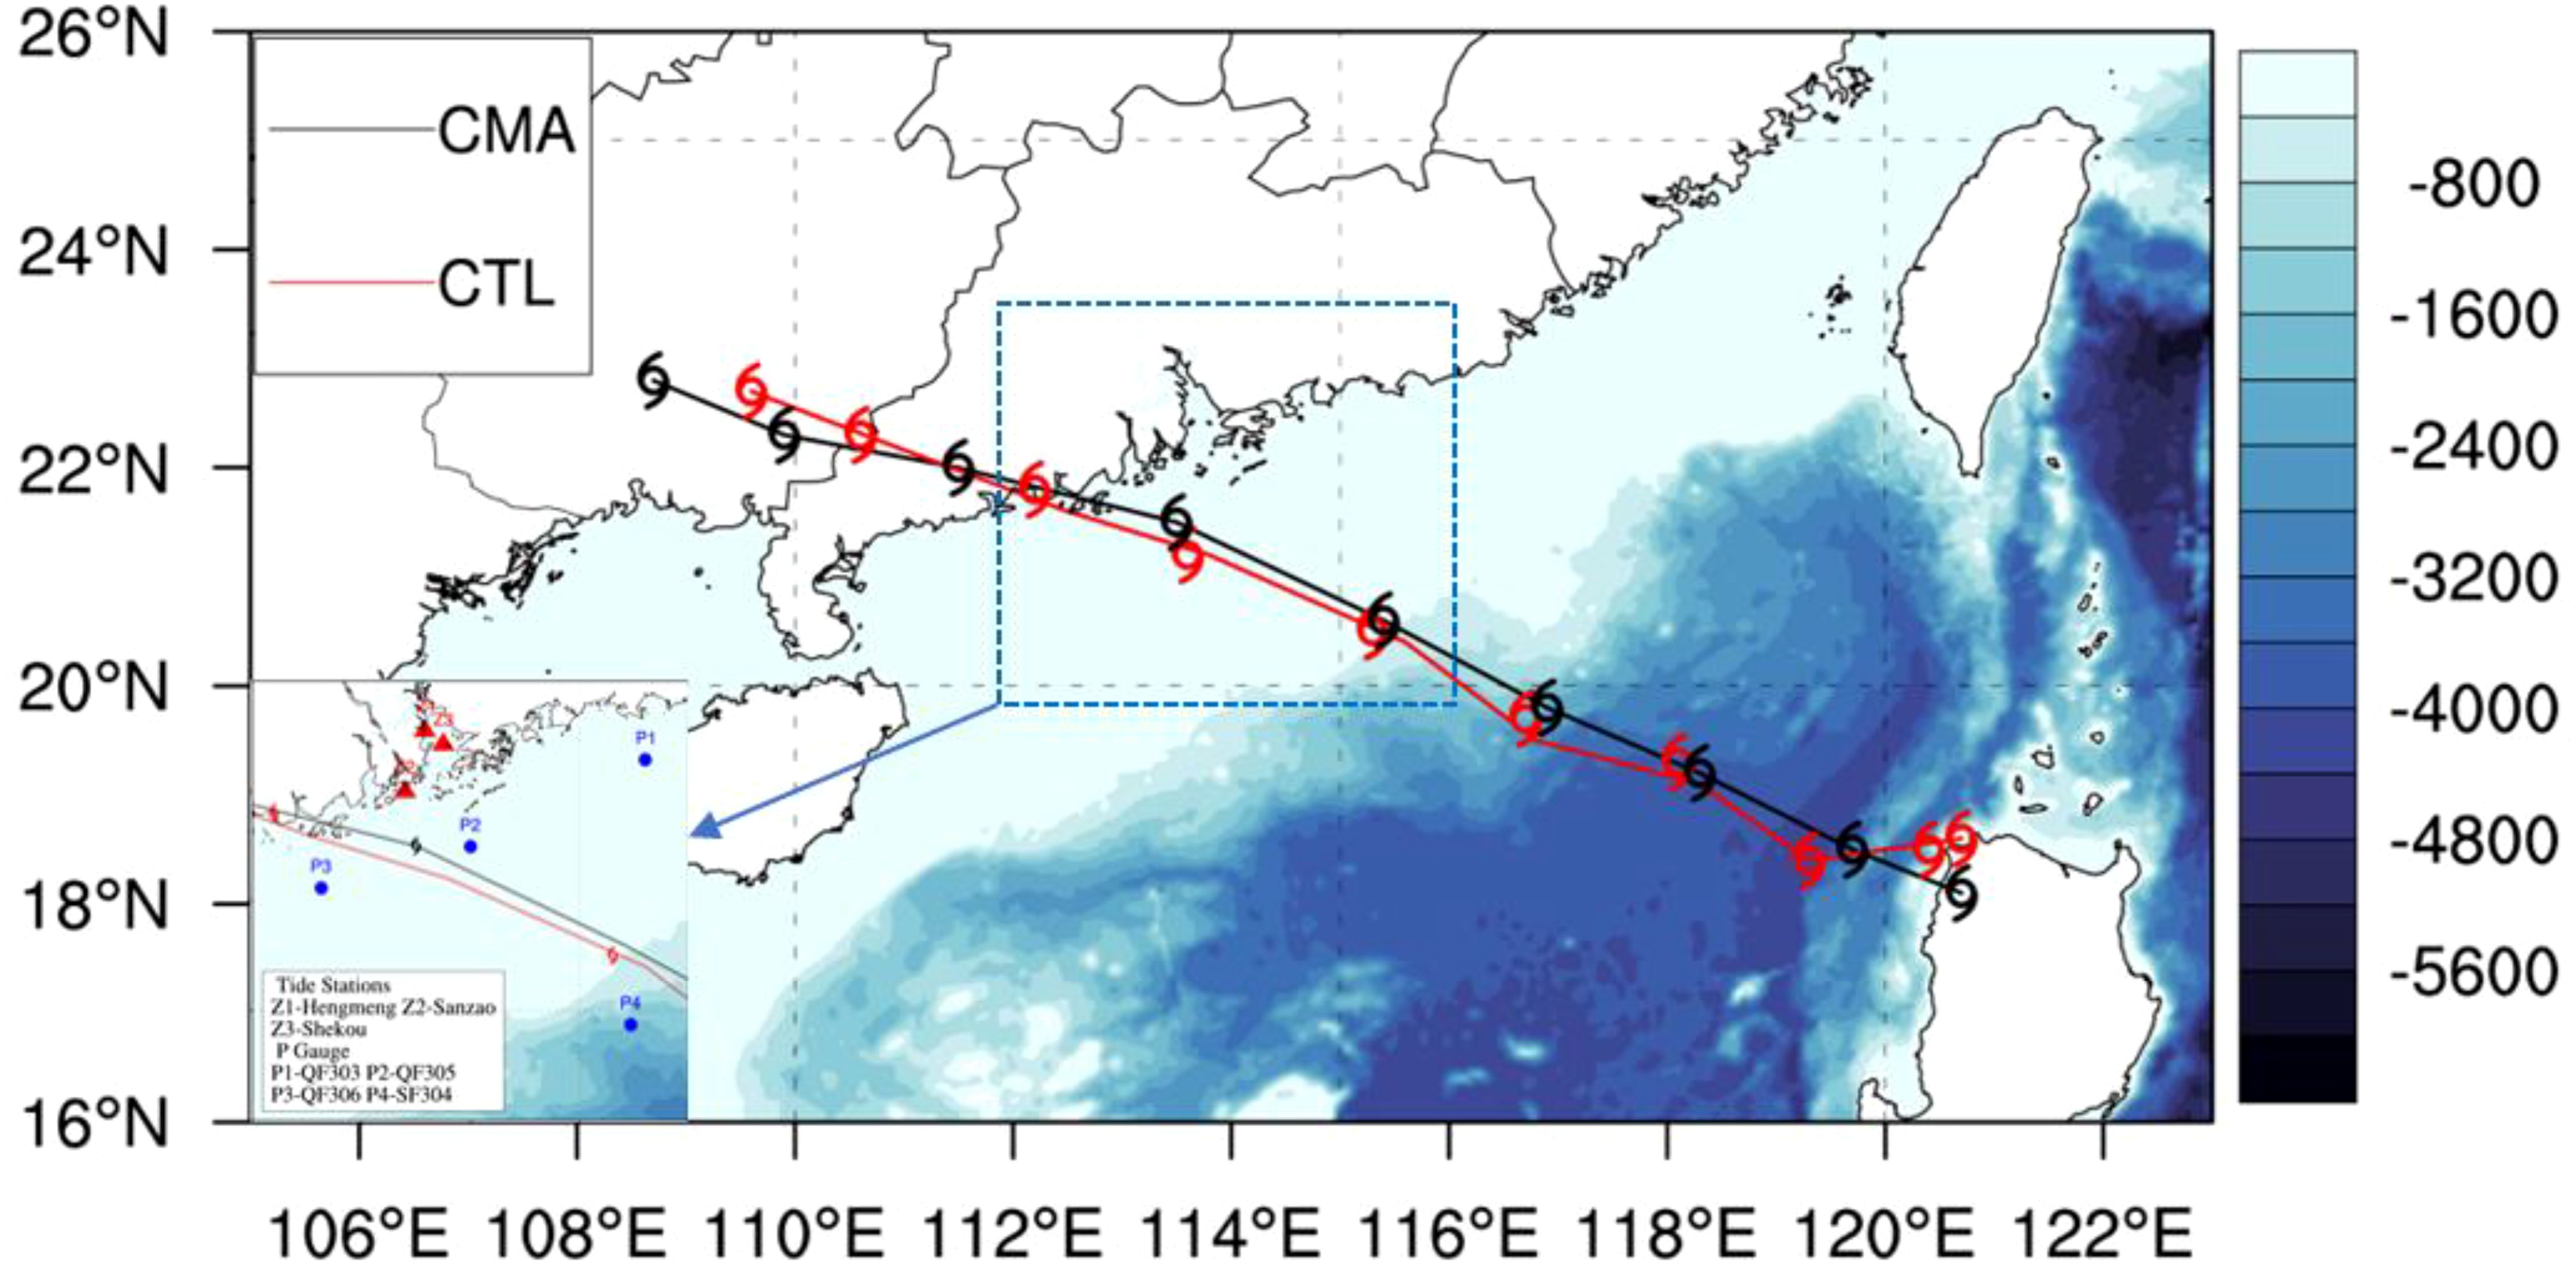
Figure 2. Distribution of buoys and tide gauge stations with tracks of Typhoon Mangkhut.

Figure 3. Comparison of the simulated intensity and track errors with CMA production.
Simulation results show that wind speed and sea level pressure (SLP) are in close agreement with the observed values, as illustrated in Figures 4, 5. However, the typhoon intensity is slightly stronger than the observed intensity. Furthermore, the R(correlation coefficient value) and for wind speed exceed 0.9 at all stations (Table 2), except for the SF304 buoy station, where the simulated results show reduced accuracy due to its location within the typhoon’s eye. As for SLP(sea level pressure) validation, the results indicate that the correlation coefficient values for observation stations are all above 0.9. Specifically, the RMSE of SLP at the QF306 and SF304 buoy stations are 4.642 hPa and 2.248 hPa (Table 3), respectively. Based on the validation results from these four stations, it can be concluded that the simulation effectively captured the distribution of wind and sea level pressure field.
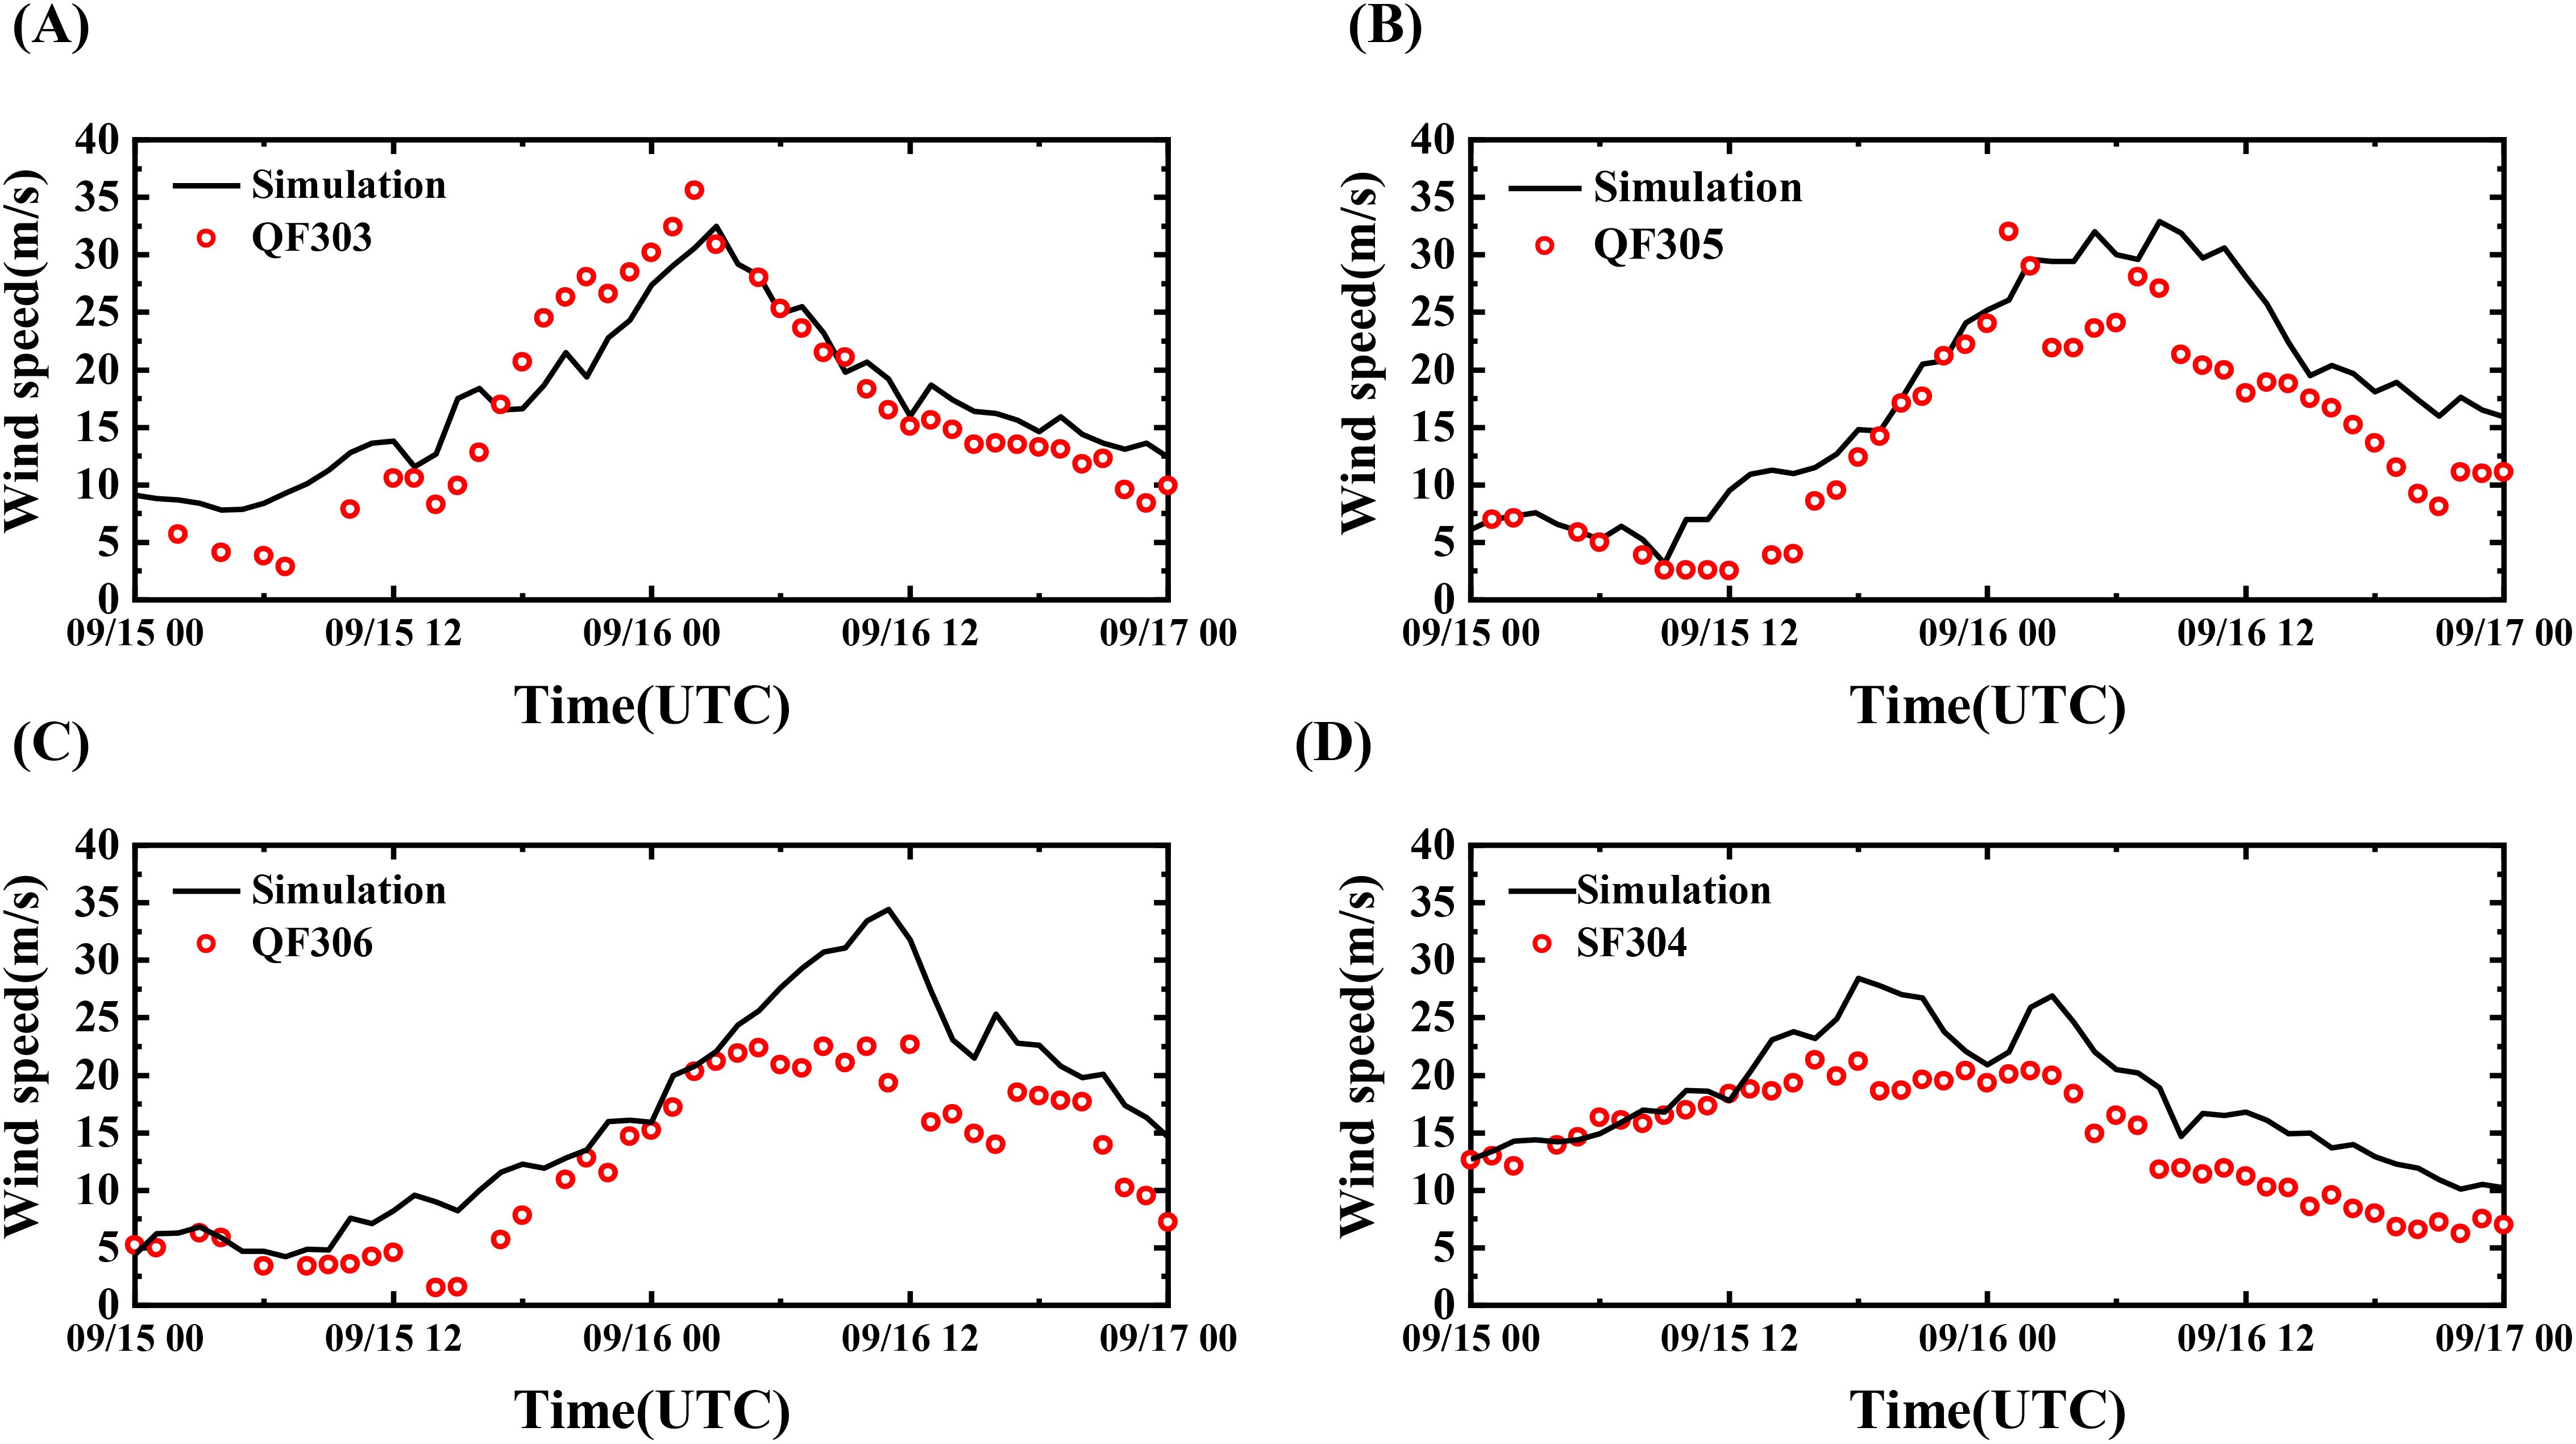
Figure 4. Time series comparison of simulated and observed wind speed during the typhoon: (A) QF303, (B) QF305, (C) QF306, (D) SF304.
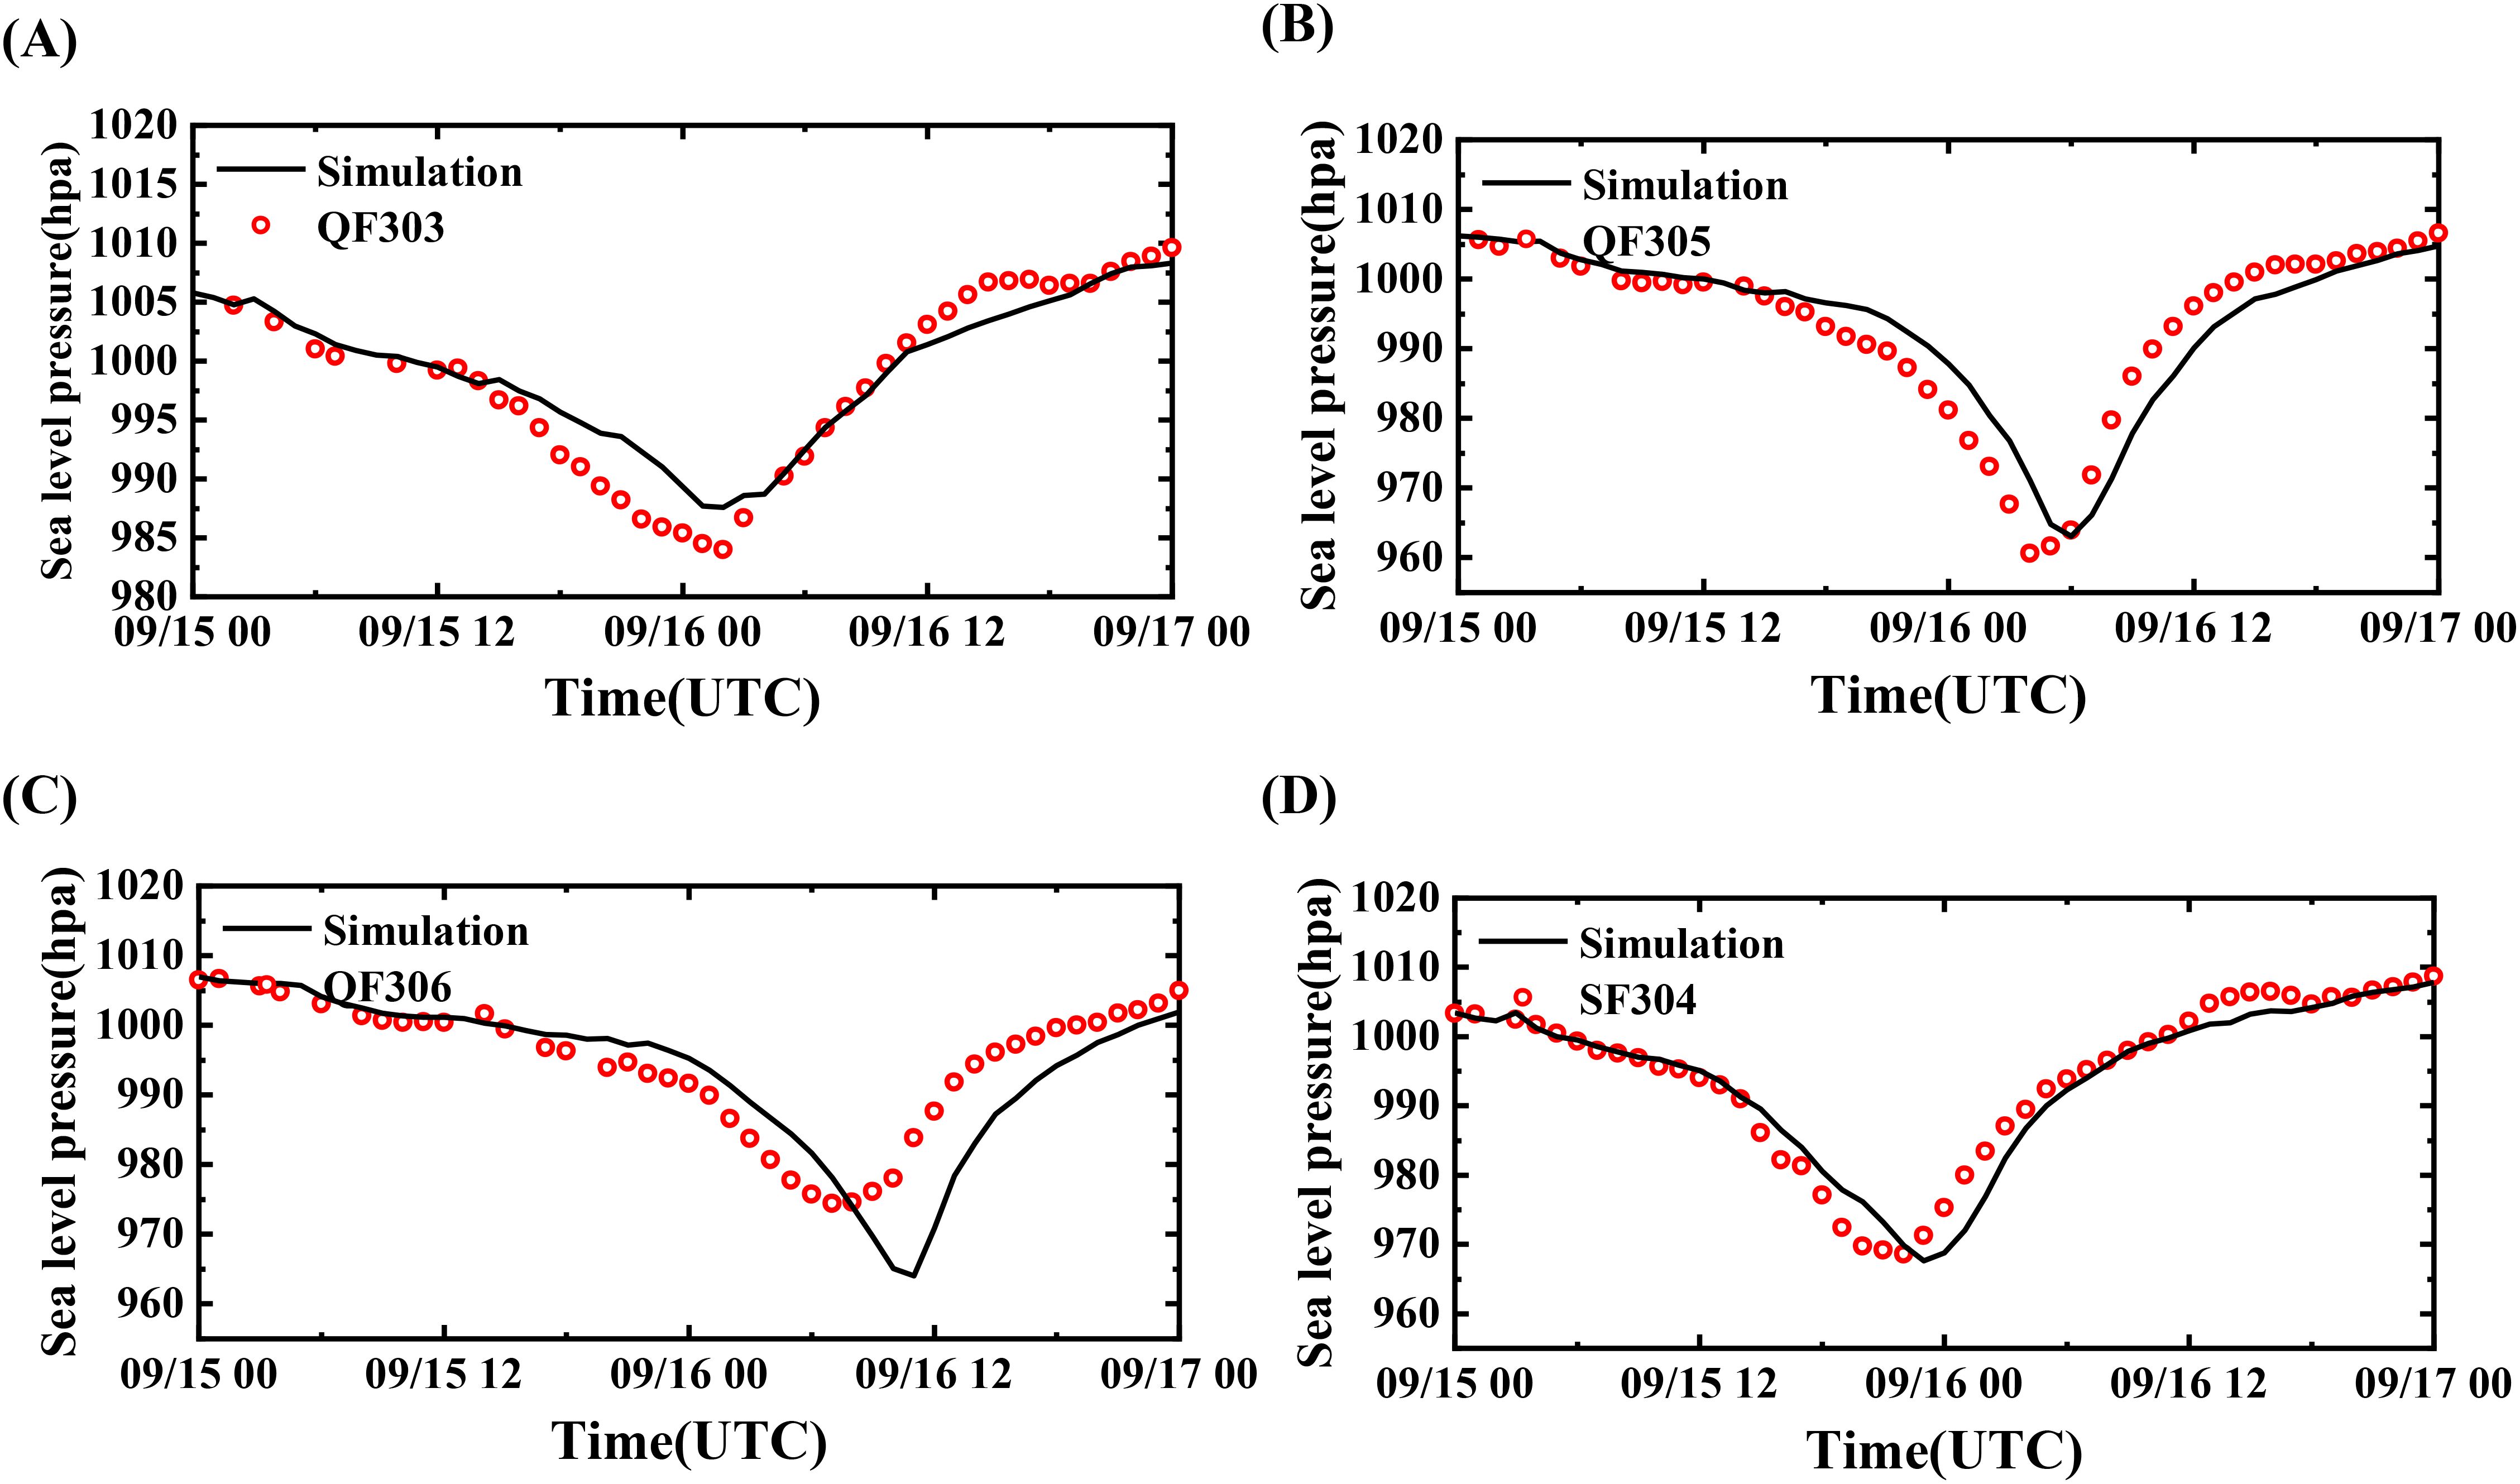
Figure 5. Time series comparison of simulated and observed sea level pressure during the typhoon: (A) QF303, (B) QF305, (C) QF306, (D) SF304.
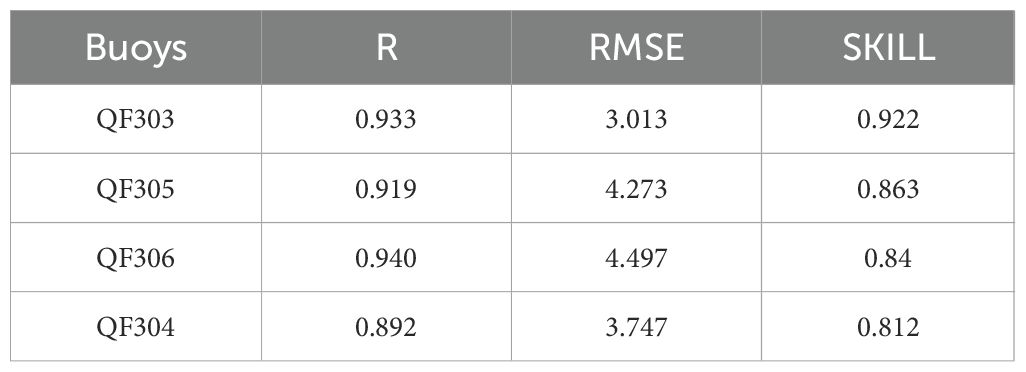
Table 2. Error statistics of wind speed.

Table 3. Error statistics of SLP.
3.4 Validation of significant wave height
The validation of significant wave height during Typhoon Mangkhut’s passage is shown in Figure 6. The simulated results at the buoy stations generally provide an accurate representation of the wave development process under the influence of the typhoon. Buoy stations QF303 and QF305, situated to the right of the typhoon’s track, exhibit notably higher significant wave heights compared to QF306 on the left, which aligns with the temporal and spatial variations in wind speed. The simulated results at the buoy stations generally provide an accurate representation of the wave development process under the influence of the typhoon. Specifically, buoy stations QF303 and QF305, located to the right of the typhoon’s track, exhibit significantly higher significant wave heights compared to QF306 on the left. This pattern is consistent with the observed temporal and spatial variations in wind speed. Furthermore, although the SF304 buoy station is positioned on the left side of the track, it is situated farther from the coastline, which results in a higher simulated significant wave height compared to the buoy stations on the right. Consequently, the maximum wave heights recorded at the buoy stations were 10.4m, 10.2m, 7.1m, and 11.2m, respectively. Table 4 record the correlation coefficient, RMSE and SKILL of buoys for significant wave height validation.
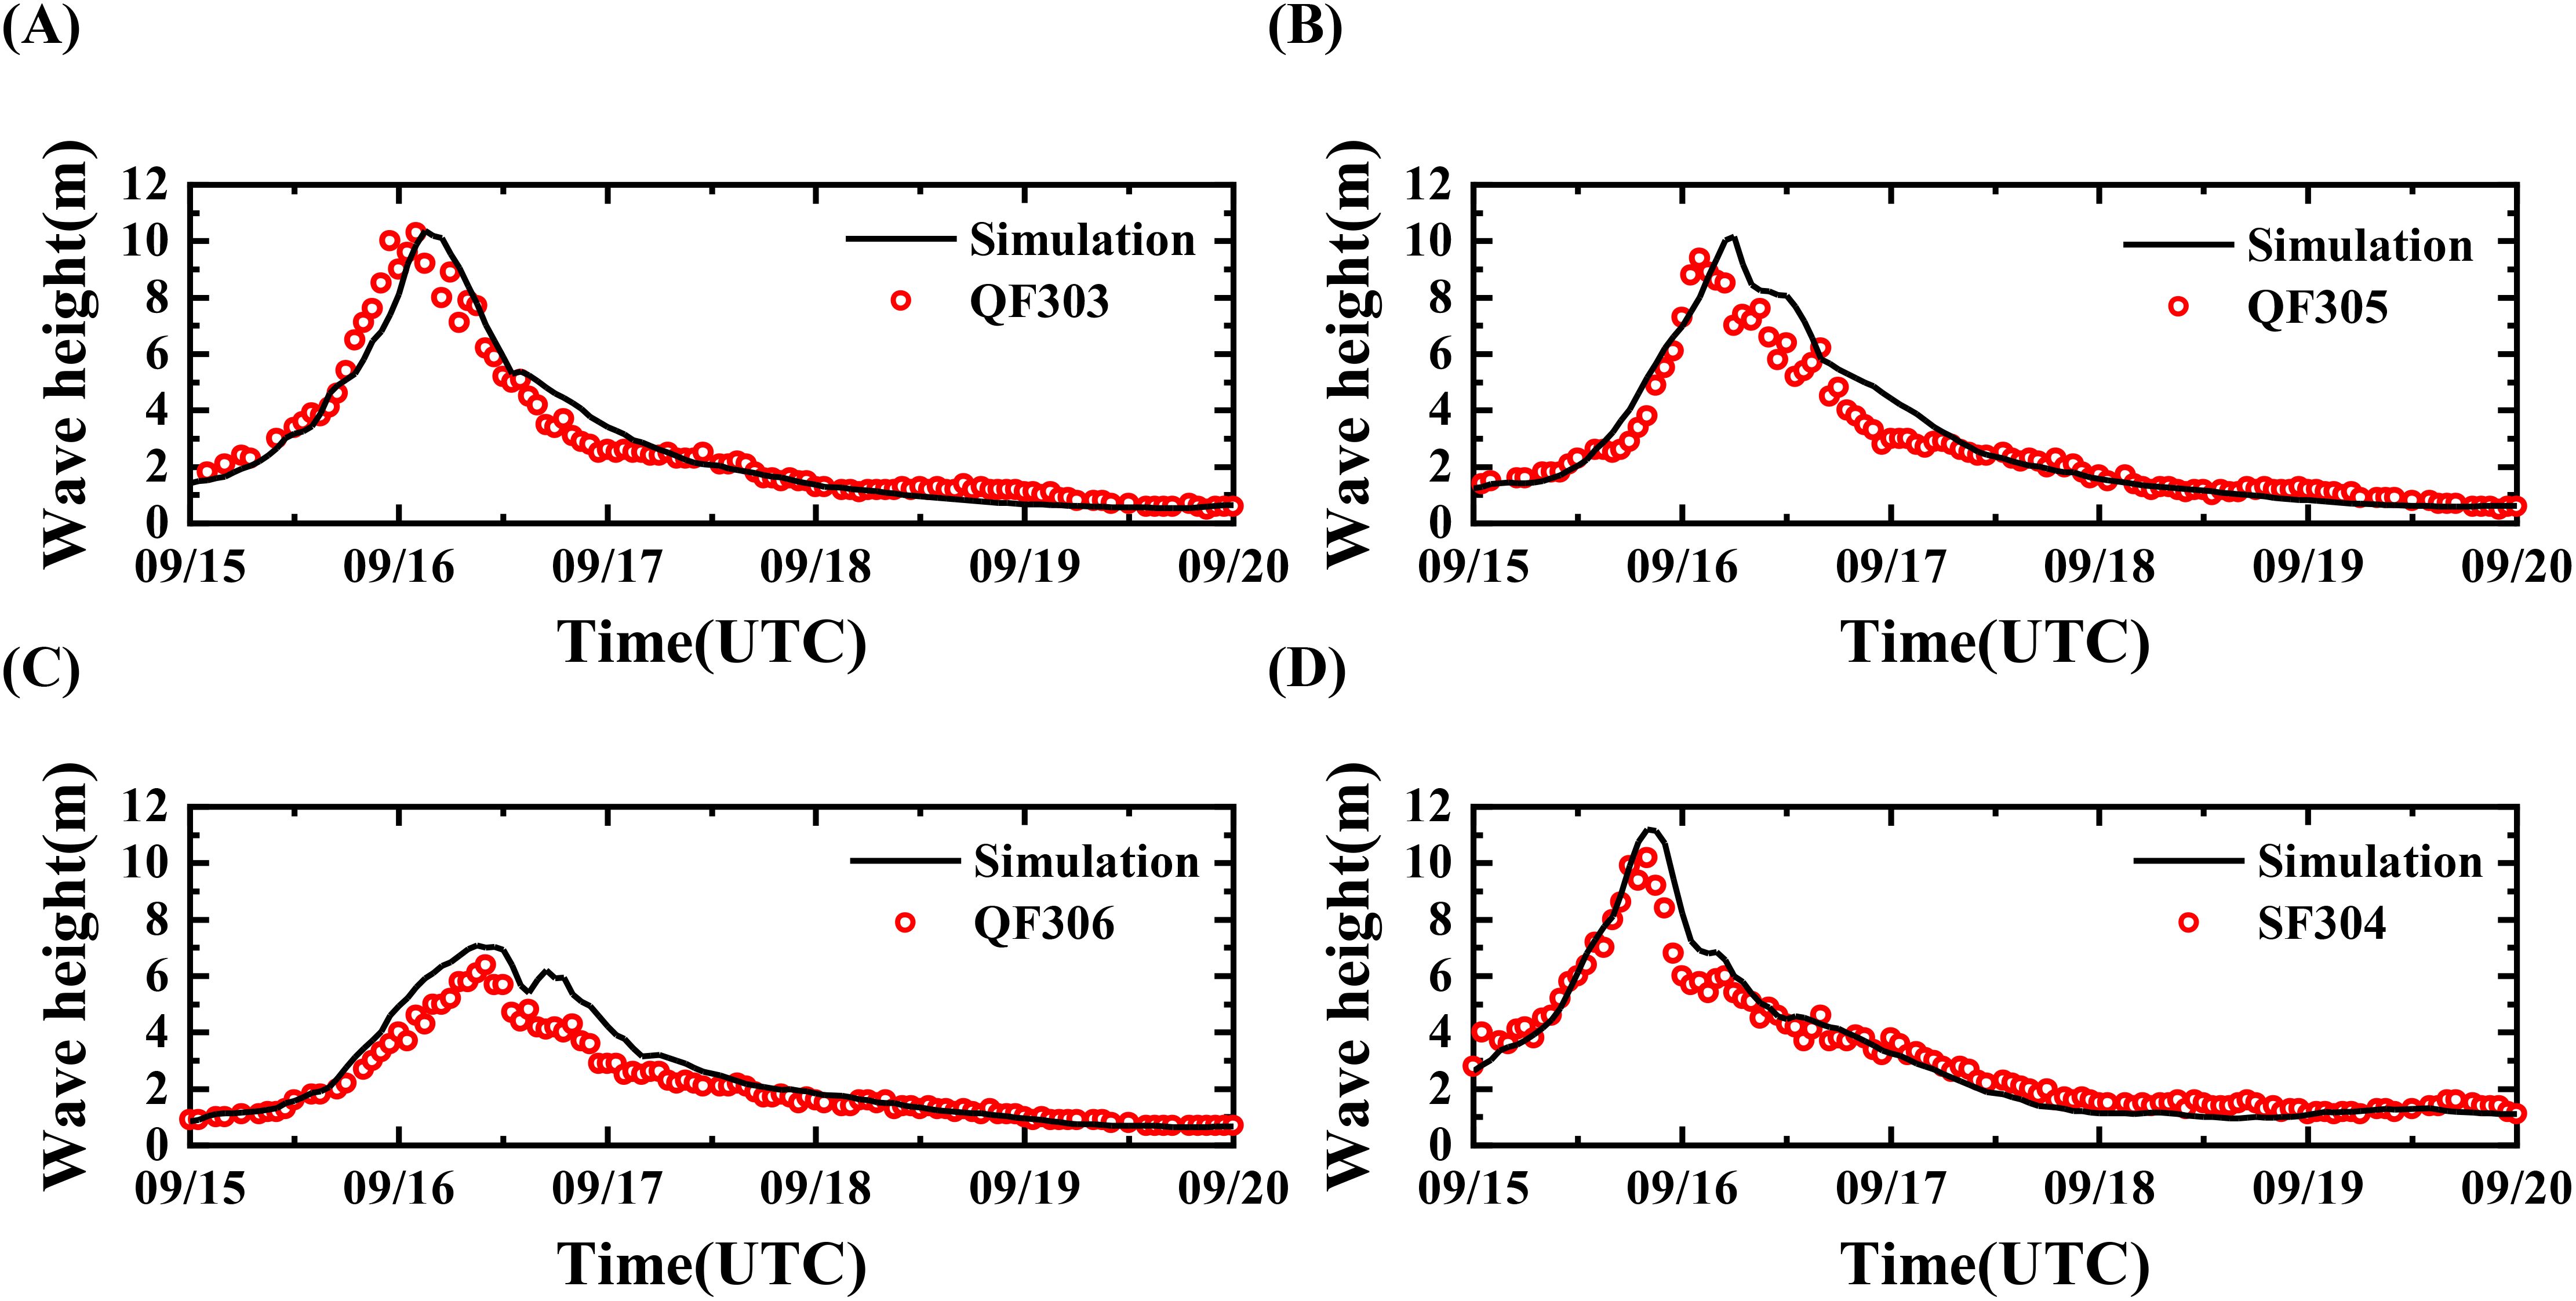
Figure 6. Time series comparison of simulated and observed wave heights during the typhoon: (A) QF303, (B) QF305, (C) QF306, (D) SF304.
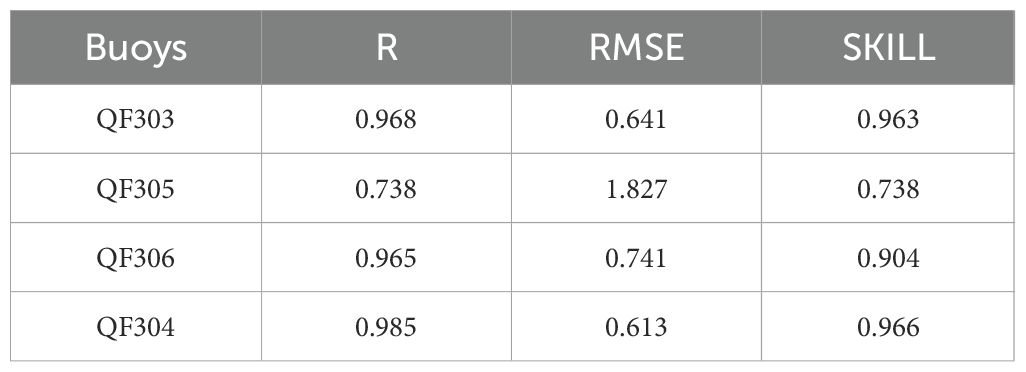
Table 4. Error statistics of significant wave height.
3.5 Validation of sea level
Figure 7 shows the temporal evolution of astronomical tide prediction and the observed water level during typhoon from different stations. The comparison between observed and simulated results at each station demonstrates a high degree of agreement, effectively capturing the tidal variations during the typhoon. The error analysis of the model is detailed in Table 5. The RMSE for the astronomical tide simulations are 0.036m, 0.006m, and 0.046m, respectively, while those for the storm surge simulations are 0.008m, 0.032m, and 0.007m, respectively. Overall, the model’s performance satisfies the accuracy requirements for numerical simulation.
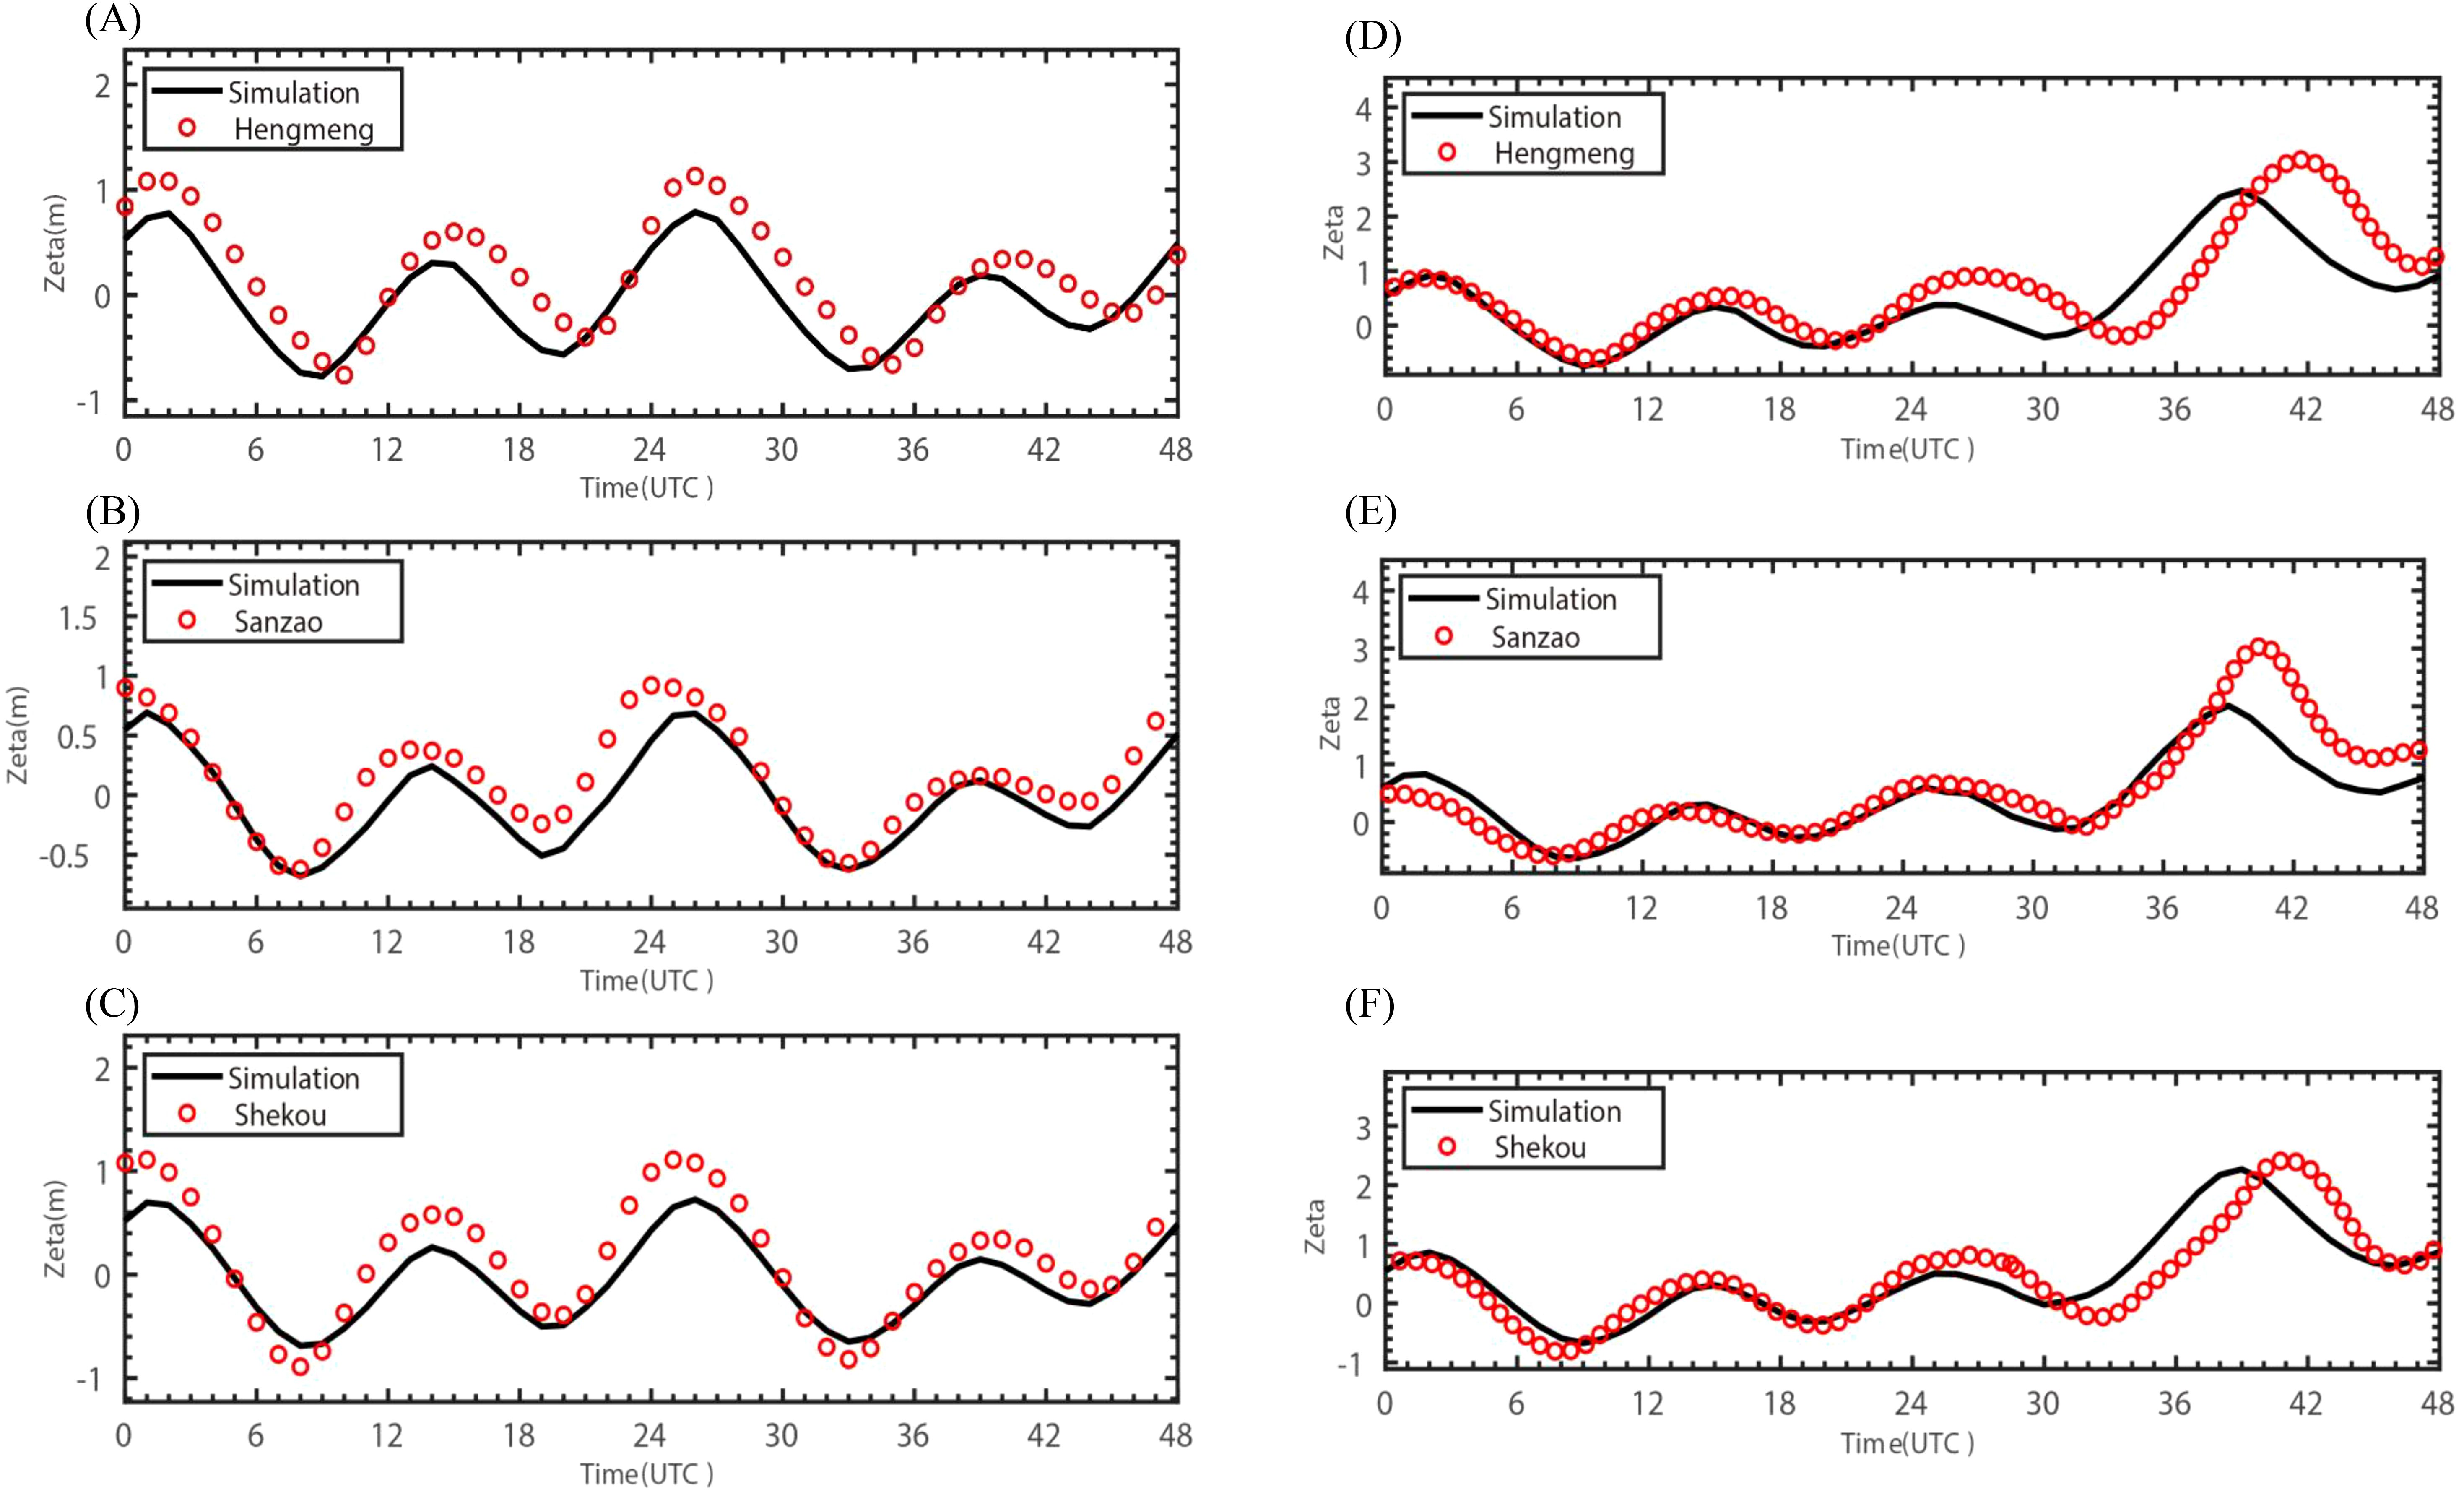
Figure 7. Time series comparison of simulated and observed water level during the typhoon, left plot is validation of astronomical tide and right is validation of storm surge: (A, D) Hengmeng, (B, E) Sanzao, (C, F) Shekou.
Table 5. Error statistics of water level.
4 Results and analysis
4.1 Wind and pressure field characteristics
The wind field acts as the primary driver of upper-ocean dynamics, as typhoon-induced winds typically lead to abnormal tidal levels and extreme wave events. Consequently, analyzing the spatiotemporal variations of the wind field is vital for understanding the anomalous hydrodynamic phenomena triggered by the super typhoon Mangkhut. Figure 8 illustrates the spatiotemporal overlay of the wind and pressure fields throughout Mangkhut’s track, from its departure from the Philippines to its landfall along the Guangdong coastline. The red lines indicate the extents of the typhoon’s radii of gale-force winds (Beaufort scale 7) and strong gale-force winds (Beaufort scale 10).
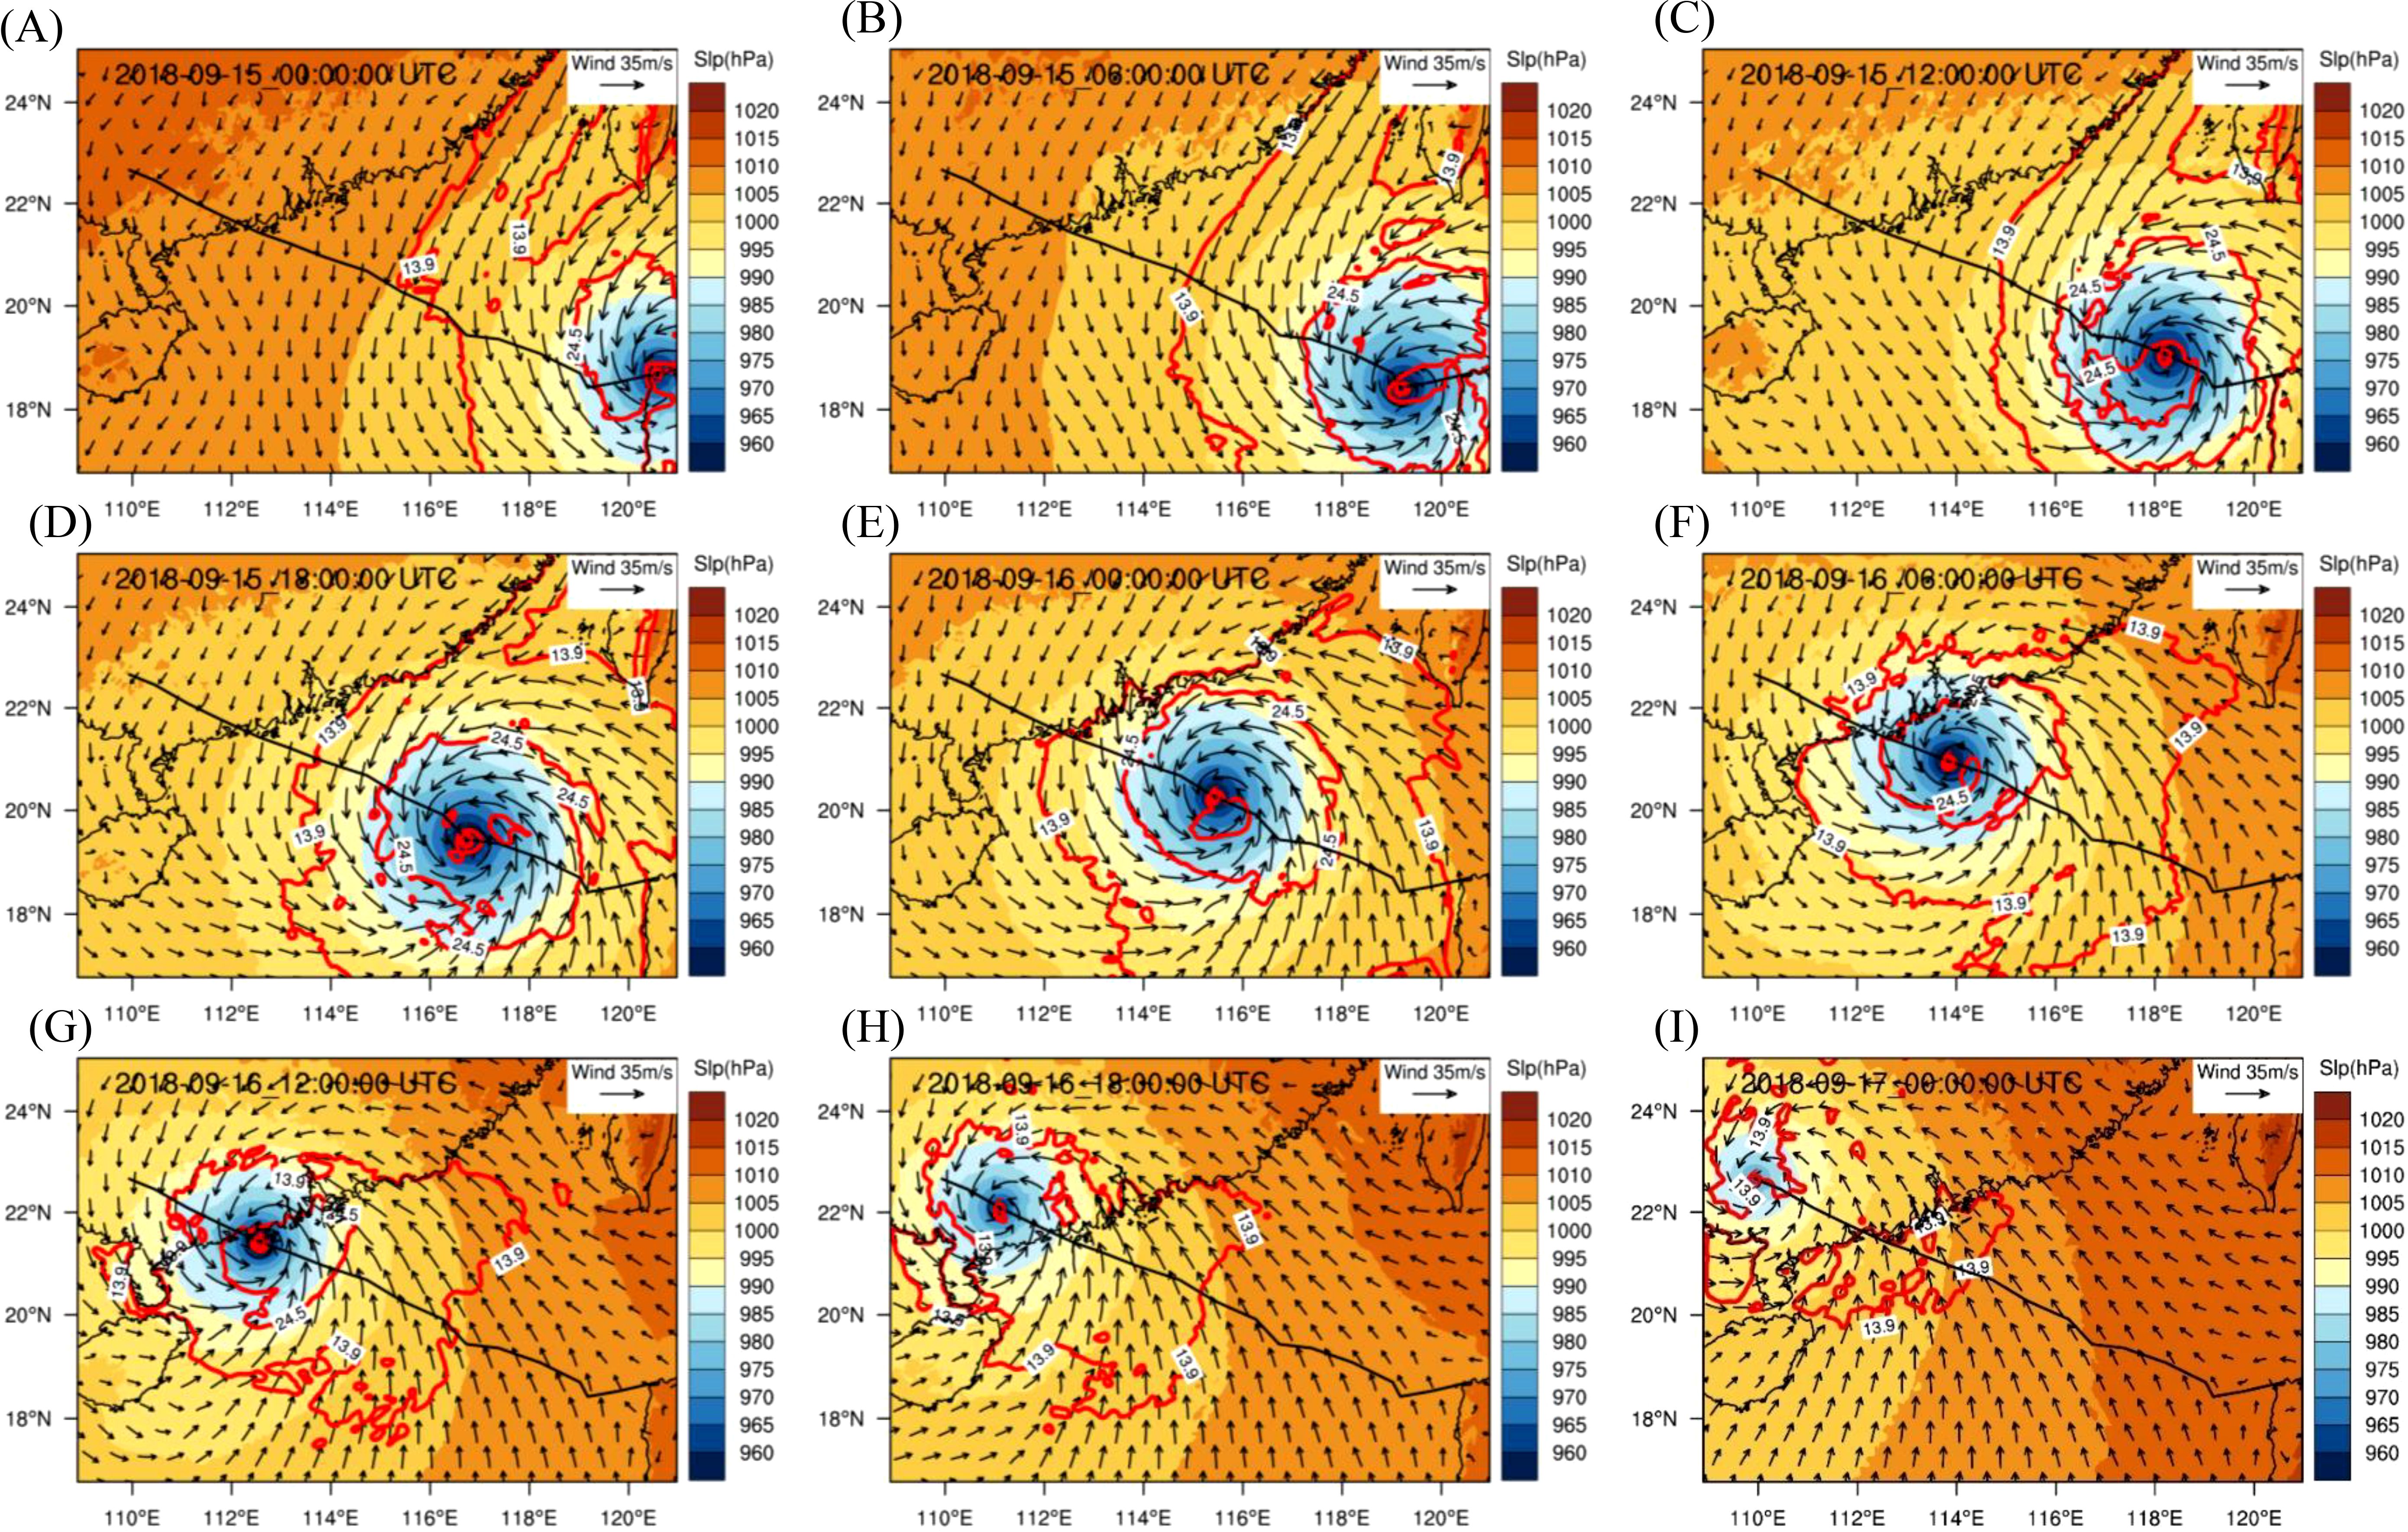
Figure 8. Spatiotemporal distribution of pressure and wind fields: Panels (A–I) represent 6-hour intervals from 15 to 17 September.
The intensity of a typhoon hinges on heat exchange at the air-sea interface. After typhoon departed the Philippines and transitioned into the South China Sea, the underlying terrain shifted from mountainous regions to oceanic basins, which provided abundant energy and significantly amplified its strength. Consequently, a pronounced low-pressure center and cyclonic wind fields formed. Moreover, Mangkhut sustained its status as a Category 4 super typhoon, with gale-force wind radii extending from 400 km to 550 km. During the period from 18:00(UTC) on September 15 to 06:00(UTC) on September 16, the Coriolis effect further induced notable asymmetry in the wind and pressure fields, with larger wind radii observed in the rear-right and rear-center quadrants of the typhoon’s track. However, as the system approached coastal regions, its wind radii gradually diminished to 250 km to 350 km, while variations in the underlying surface along the coastline further contributed to reductions in the wind field.
4.2 Wave characteristics
Figure 9 illustrates the main formation and development process of typhoon-induced waves in the northern South China Sea during Typhoon Mangkhut’s passage. The black arrows represent wave direction vectors, the black line represents the typhoon’s track, and the red typhoon symbol marks the position of the typhoon center. Throughout the typhoon’s movement, a counterclockwise rotating wave field, similar to the wind direction, developed in the study area, with the wave center located behind the typhoon’s cyclone center. On September 15, 2018, Typhoon Mangkhut moved from the Philippine Sea into the South China Sea. As a result of the typhoon’s wind field, the typhoon-induced waves gradually intensified. When the typhoon was 260 km from Guangdong Province, a storm surge area, with a radius exceeding 100 km, formed. By the early morning of September 16, the wave anomalies triggered by the typhoon were approaching the Guangdong coastline, with the maximum significant wave height along the coast reaching 9 meters. However, upon entering shallow waters, the waves began to break and dissipate due to significant topographical changes and a reduction in the wind radius, leading to a sharp decrease in the significant wave height.
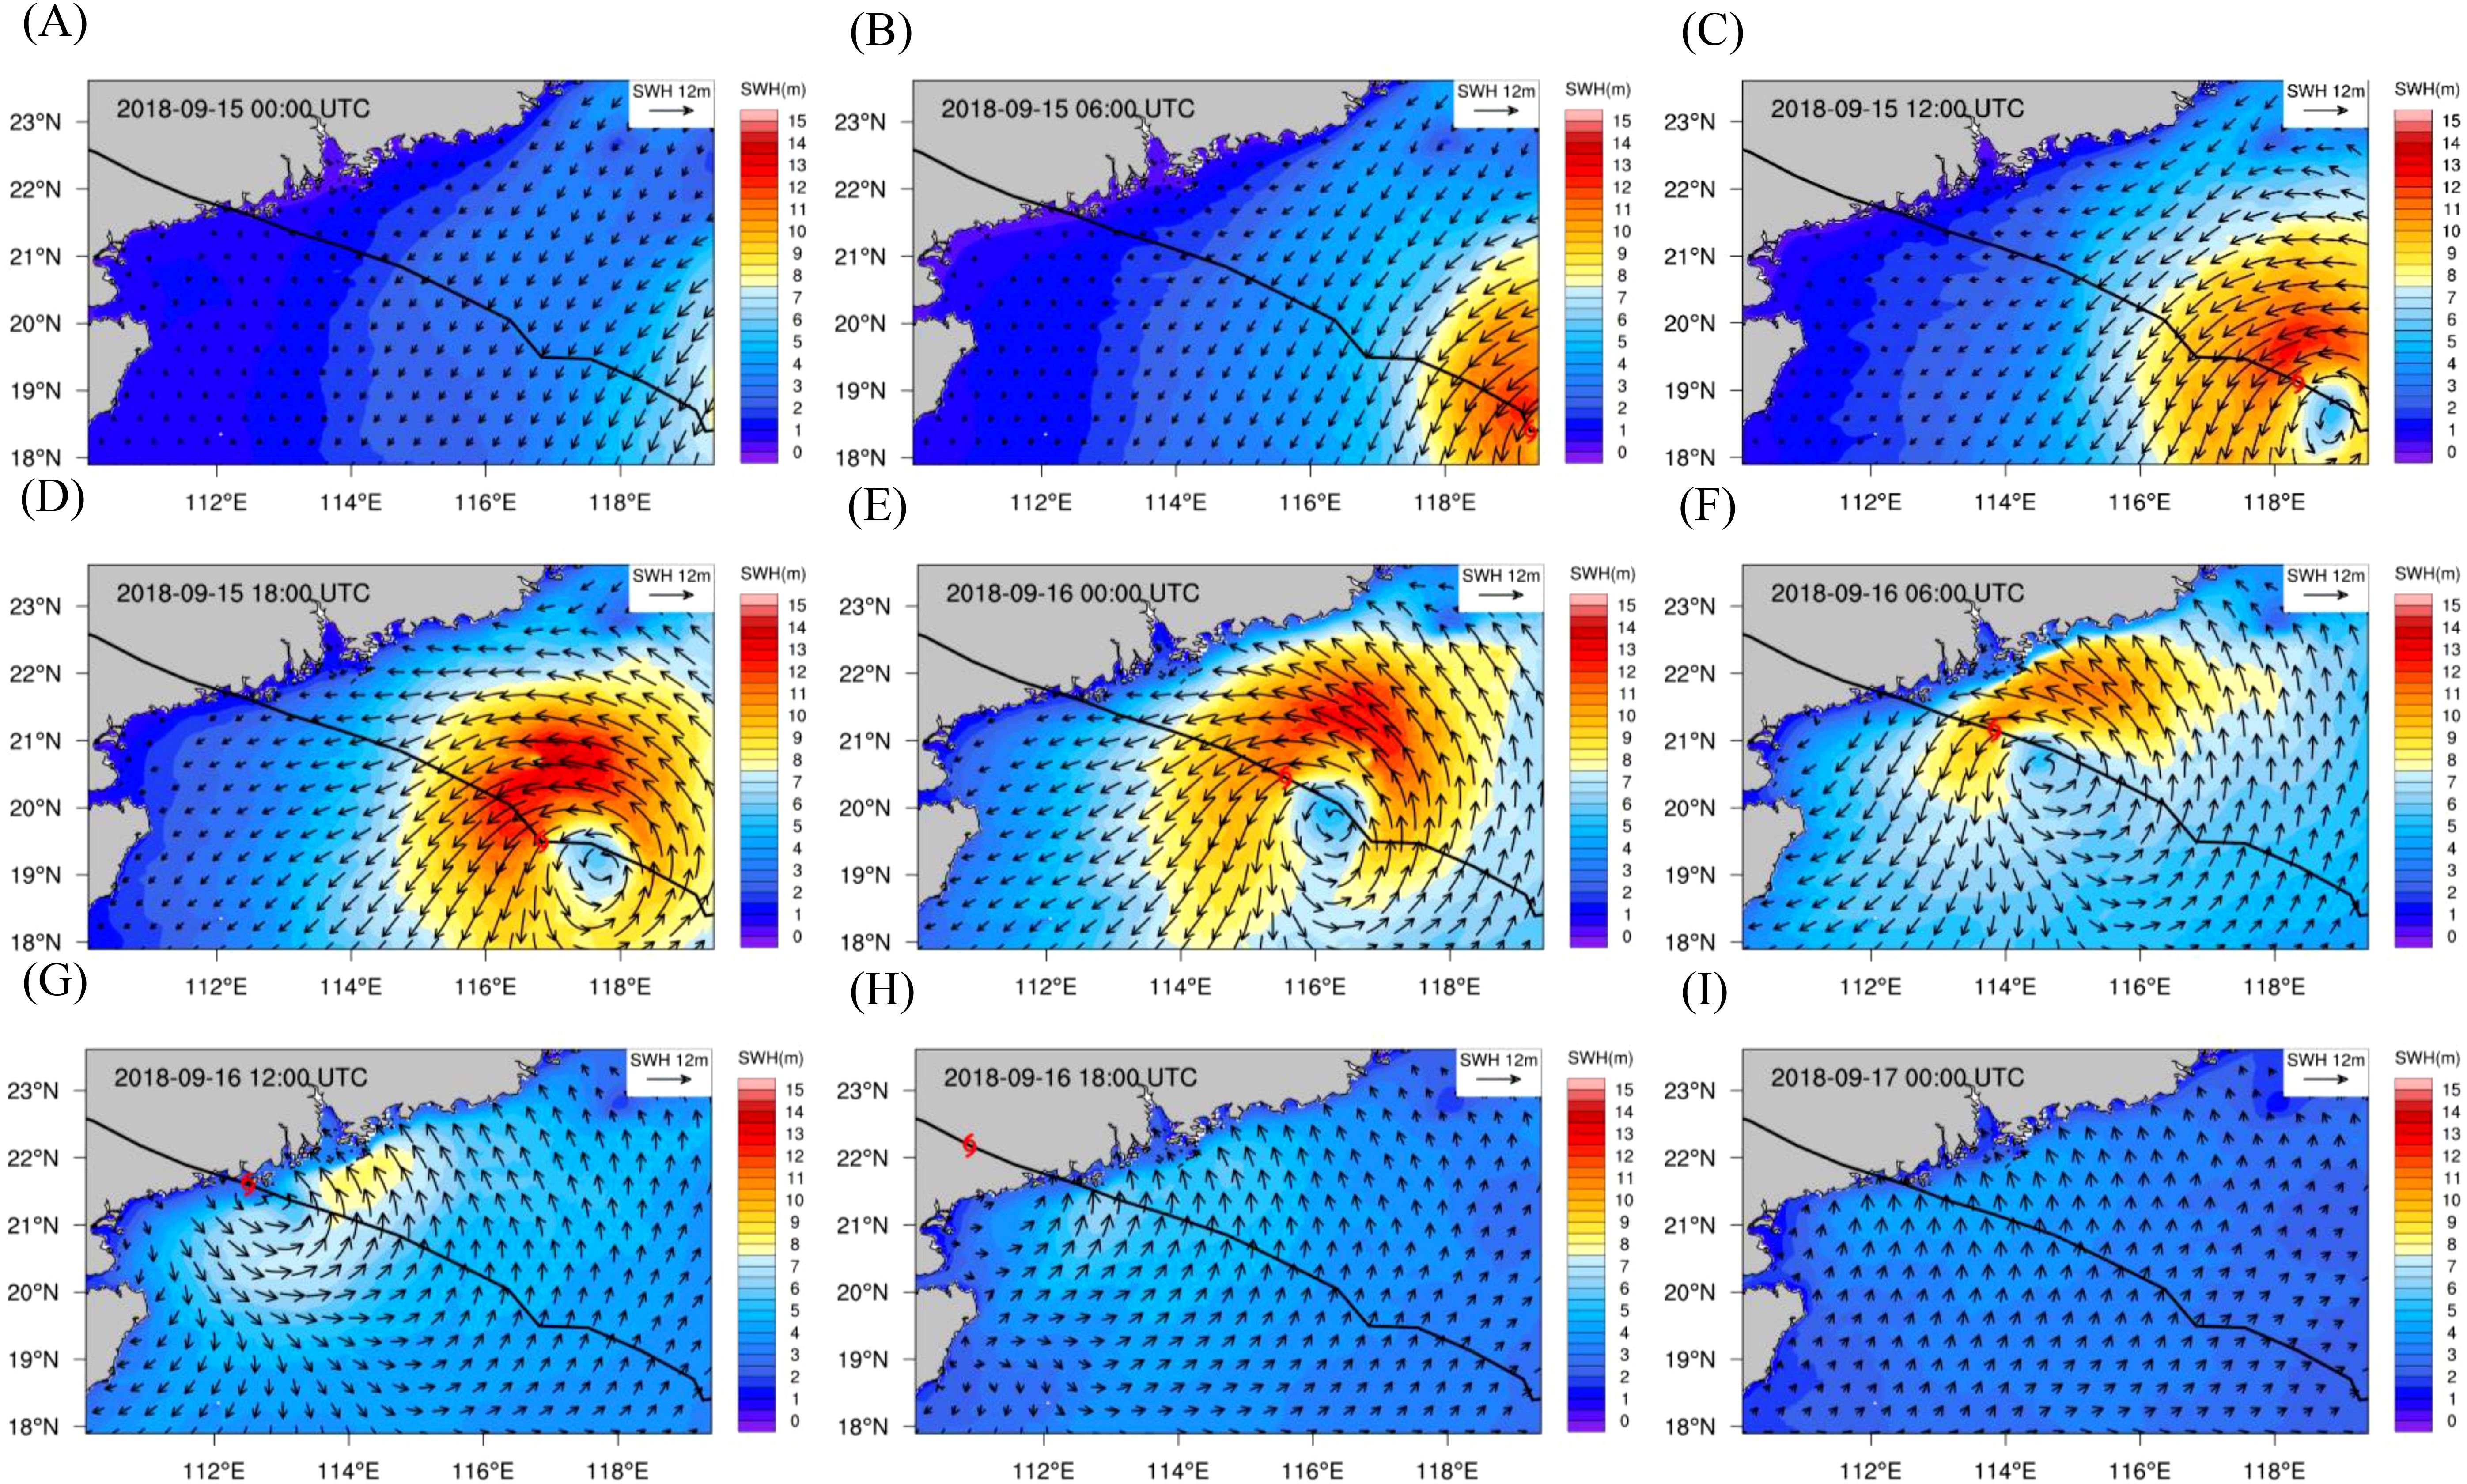
Figure 9. Spatiotemporal distribution of significant wave heights: Panels (A–I) represent 6-hour intervals from 15 to 17 September.
Waves induced by Typhoon Mangkhut exhibit typical characteristics of typhoon-generated waves, with wind speed variations strongly correlated to changes in significant wave height. Statistical analysis of the wind speed, wave height, wind direction, and wave direction duration curves at different locations is shown in Figure 10. It is evident that the wave center is positioned behind the typhoon’s center, and the growth of wave height responds to wind speed with a lag of only 1 hour. When Typhoon Mangkhut passed through QF303 and QF305, the change in wave direction exhibited a consistent clockwise rotation. The angle of change at QF303 was slightly less than at QF305, due to its greater distance from the typhoon center, which resulted in a lower wind speed. Meanwhile, at QF306 and SF304, located on the left side of the typhoon’s track, both the wave and wind directions exhibited counterclockwise rotation. Since QF306 is located closer to the coastline and is influenced by offshore currents, the wave direction closely aligned with the wind direction as the typhoon passed. In contrast, at the SF304 station, situated farther from the coastline, there was a deviation of approximately 5 degrees between the wave direction and wind direction angles.
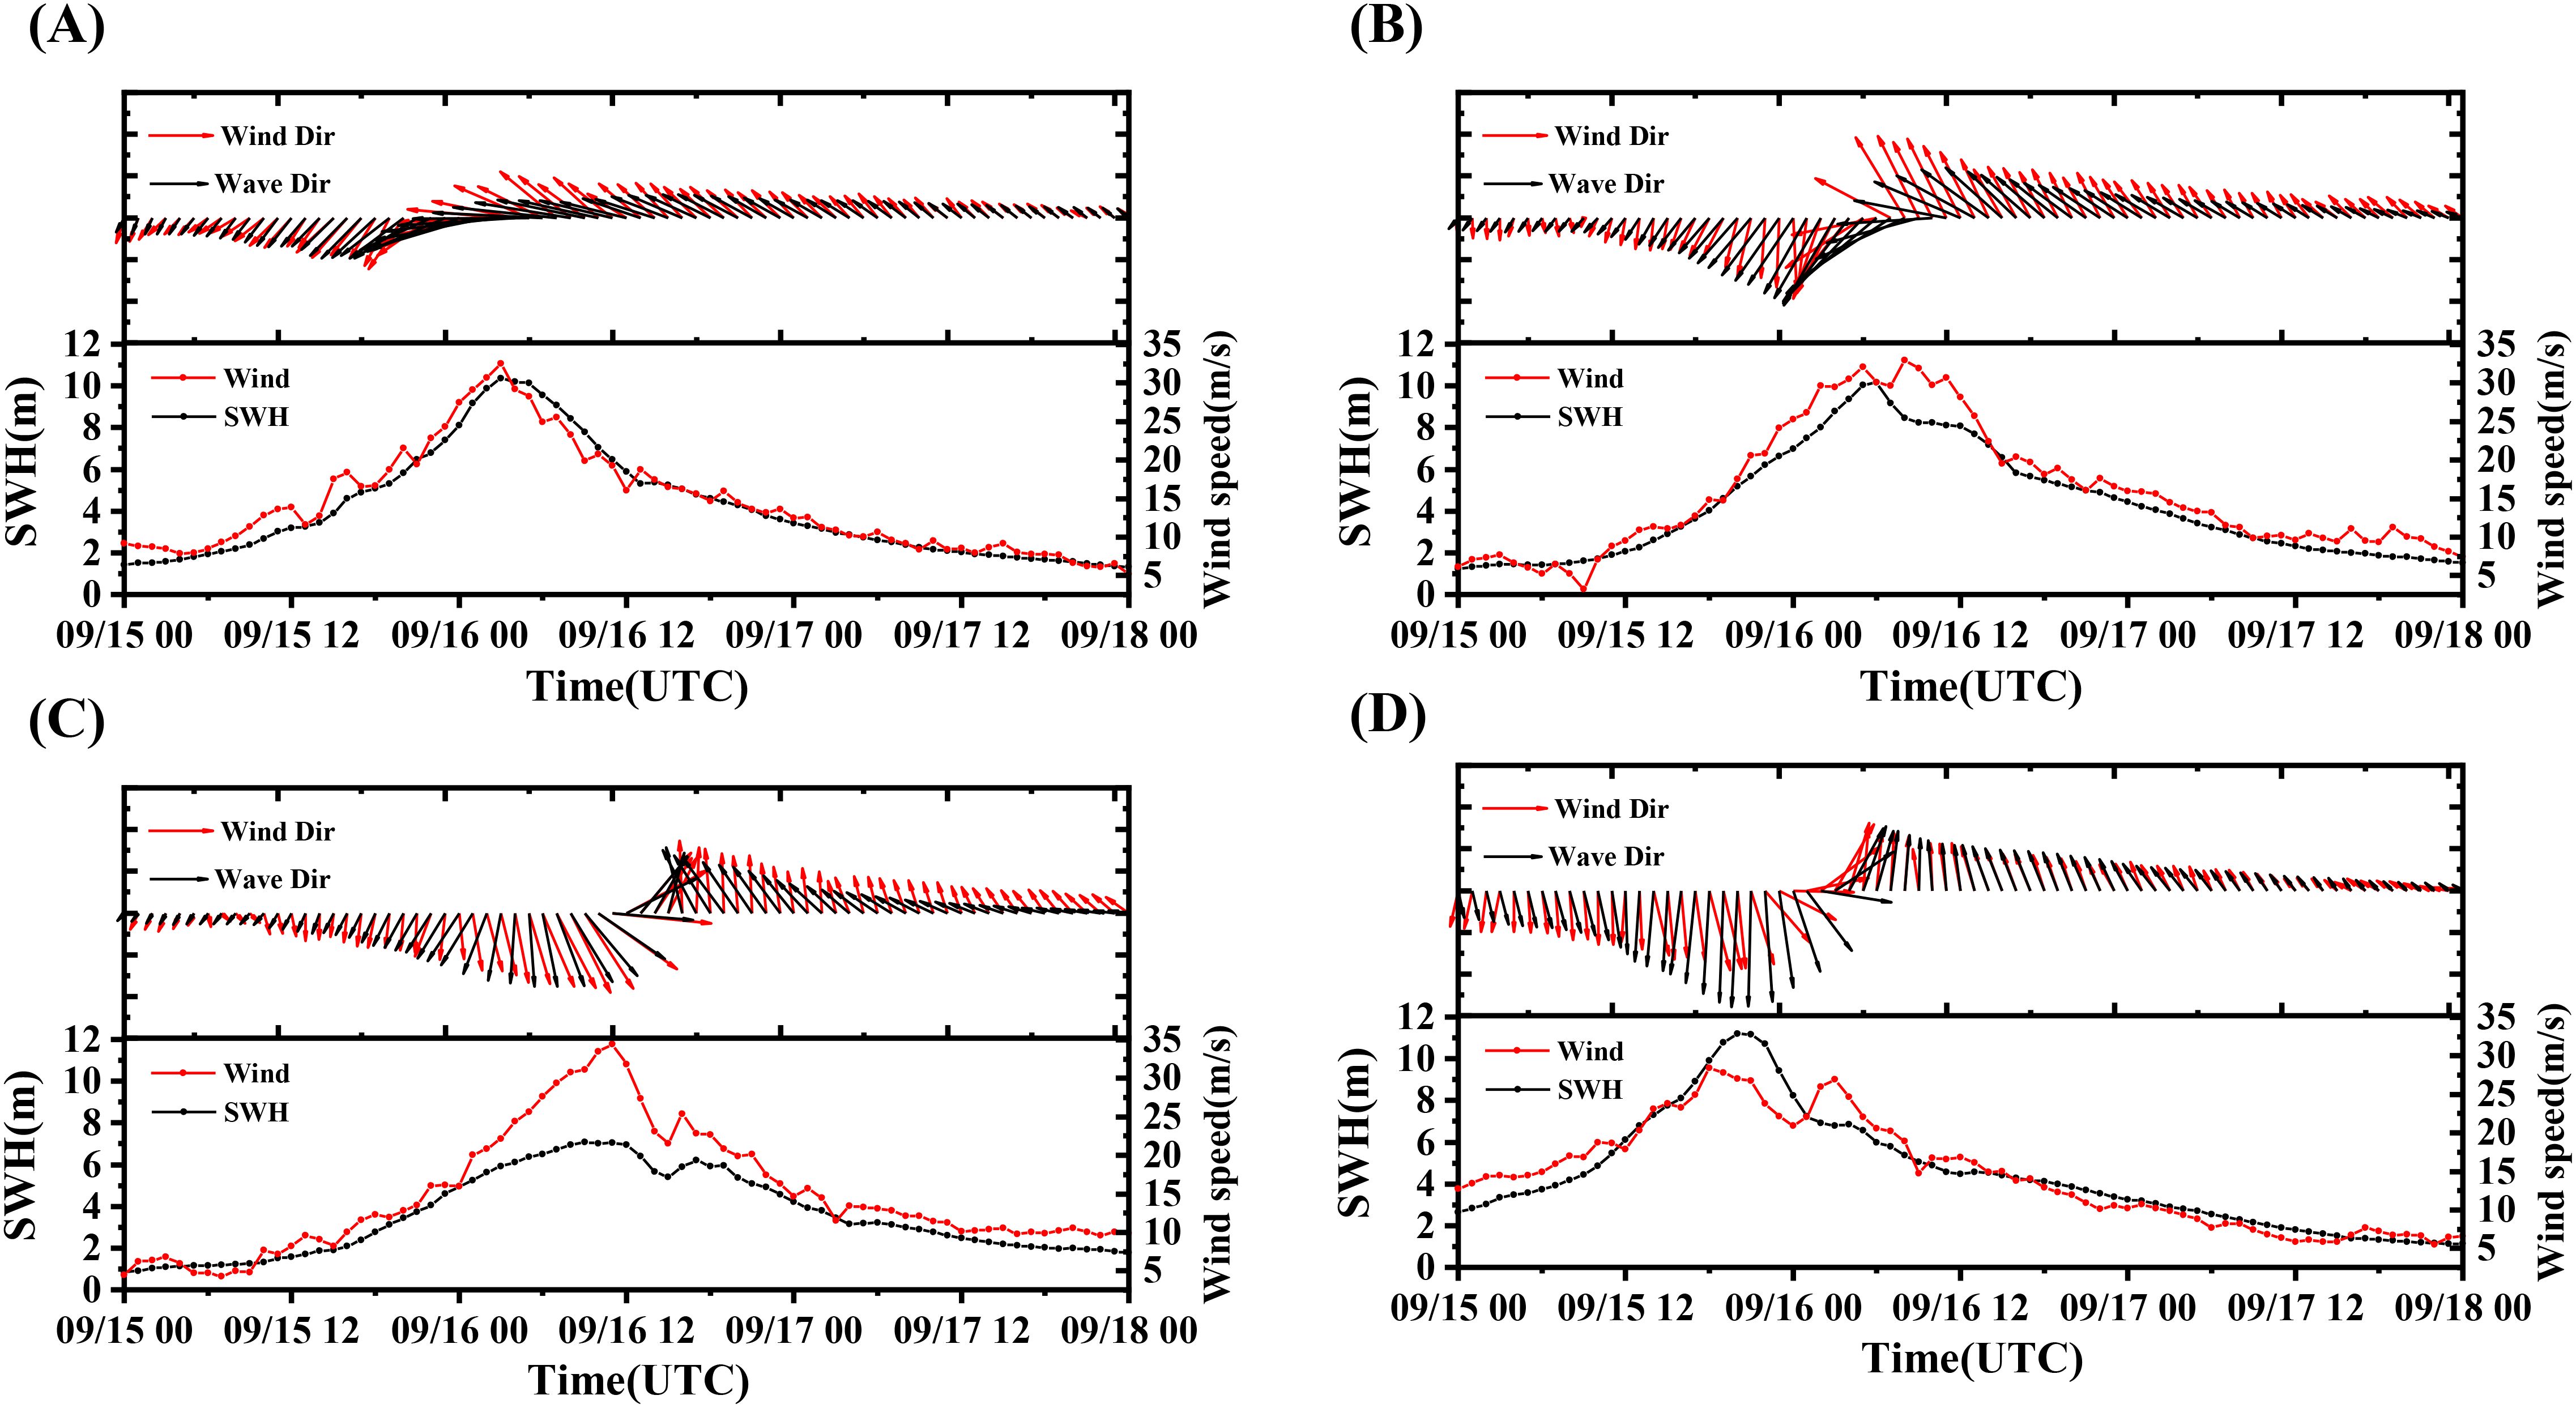
Figure 10. Comparison of the wind speed, wave height, wind direction, and wave direction duration curves at different characteristic stations: (A) QF303, (B) QF305, (C) QF306, (D) SF304.
4.3 Storm surge
Storm surge results from the interaction of wind and tidal dynamics. It is calculated by subtracting the water level driven purely by tidal forces from the water level under fully coupled conditions. Figure 11 illustrates the spatiotemporal distribution of the storm surge in the northern South China Sea due to the impact of Typhoon Mangkhut. At 06:00 UTC on September 15, Mangkhut entered the South China Sea, and as a result of Ekman suction around the typhoon’s eye, a water level increase of approximately 0.4 meters was observed. As the typhoon continued to move toward the coast, the intensity and extent of the storm surge gradually increased. After making landfall, the surge exceeded 2 meters to the right of the landfall point. Subsequently, as the typhoon weakened, the surge shifted from the Pearl River Delta to the left of the landfall point, with the water level gradually returning to normal.
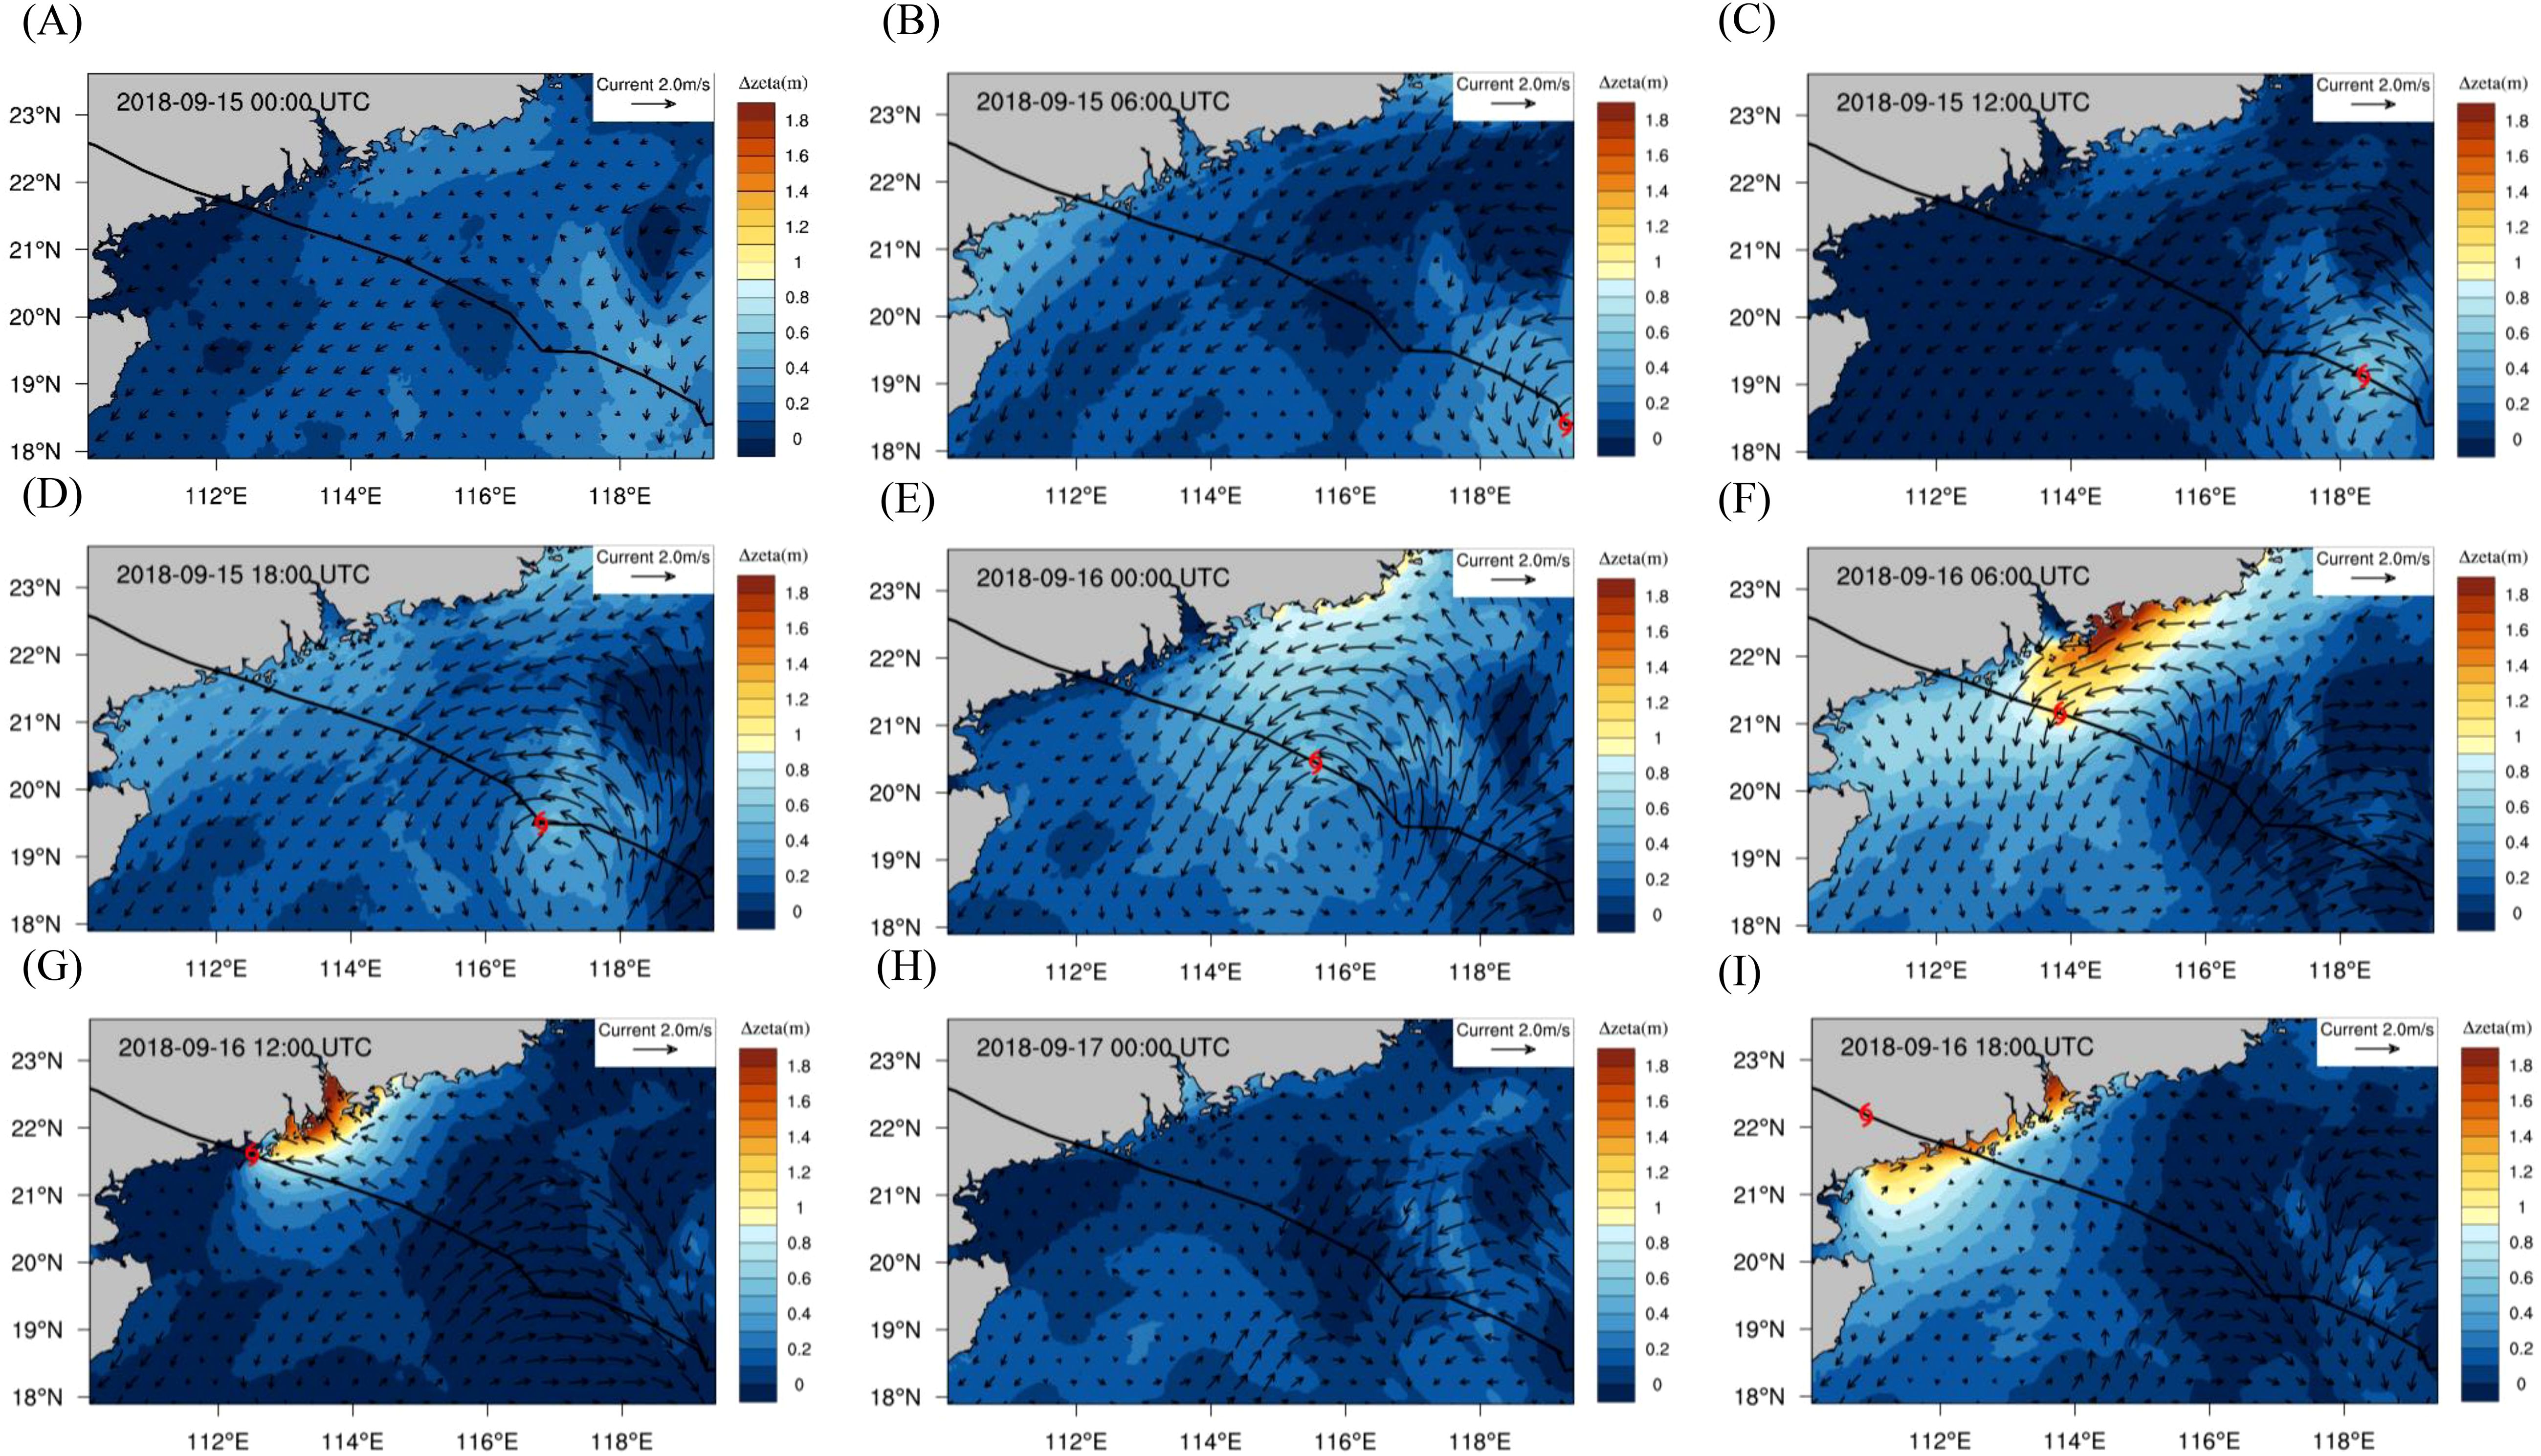
Figure 11. Spatiotemporal distribution of water level: Panels (A–I) represent 6-hour intervals from 15 to 17 September.
Figure 12 presents a comparison of the time series of sea surface pressure, velocity, storm surge, and significant wave height at the four key stations (QF303, QF305, QF306, and SF304). The storm surge is predominantly driven by the intricate interaction of typhoon intensity, tidal forces, and wave dynamics. At SF304, located in deeper offshore waters, surge amplitudes were limited (<0.5 m) as deeper bathymetry attenuated storm-induced water level rise through energy dispersion. For stations QF303 and QF305 (right of the typhoon track), peak surge coincided with maximum typhoon intensity and wave height, as onshore-directed winds, currents, and waves synergistically enhanced coastal water convergence. However, at QF306 (left of the track), peak surge lagged behind maximum pressure and significant wave height by 3 hours. This delay stems from offshore-directed wind and current components opposing surge development during typhoon approach, followed by southwestward coastal currents propagating surge effects post-landfall.
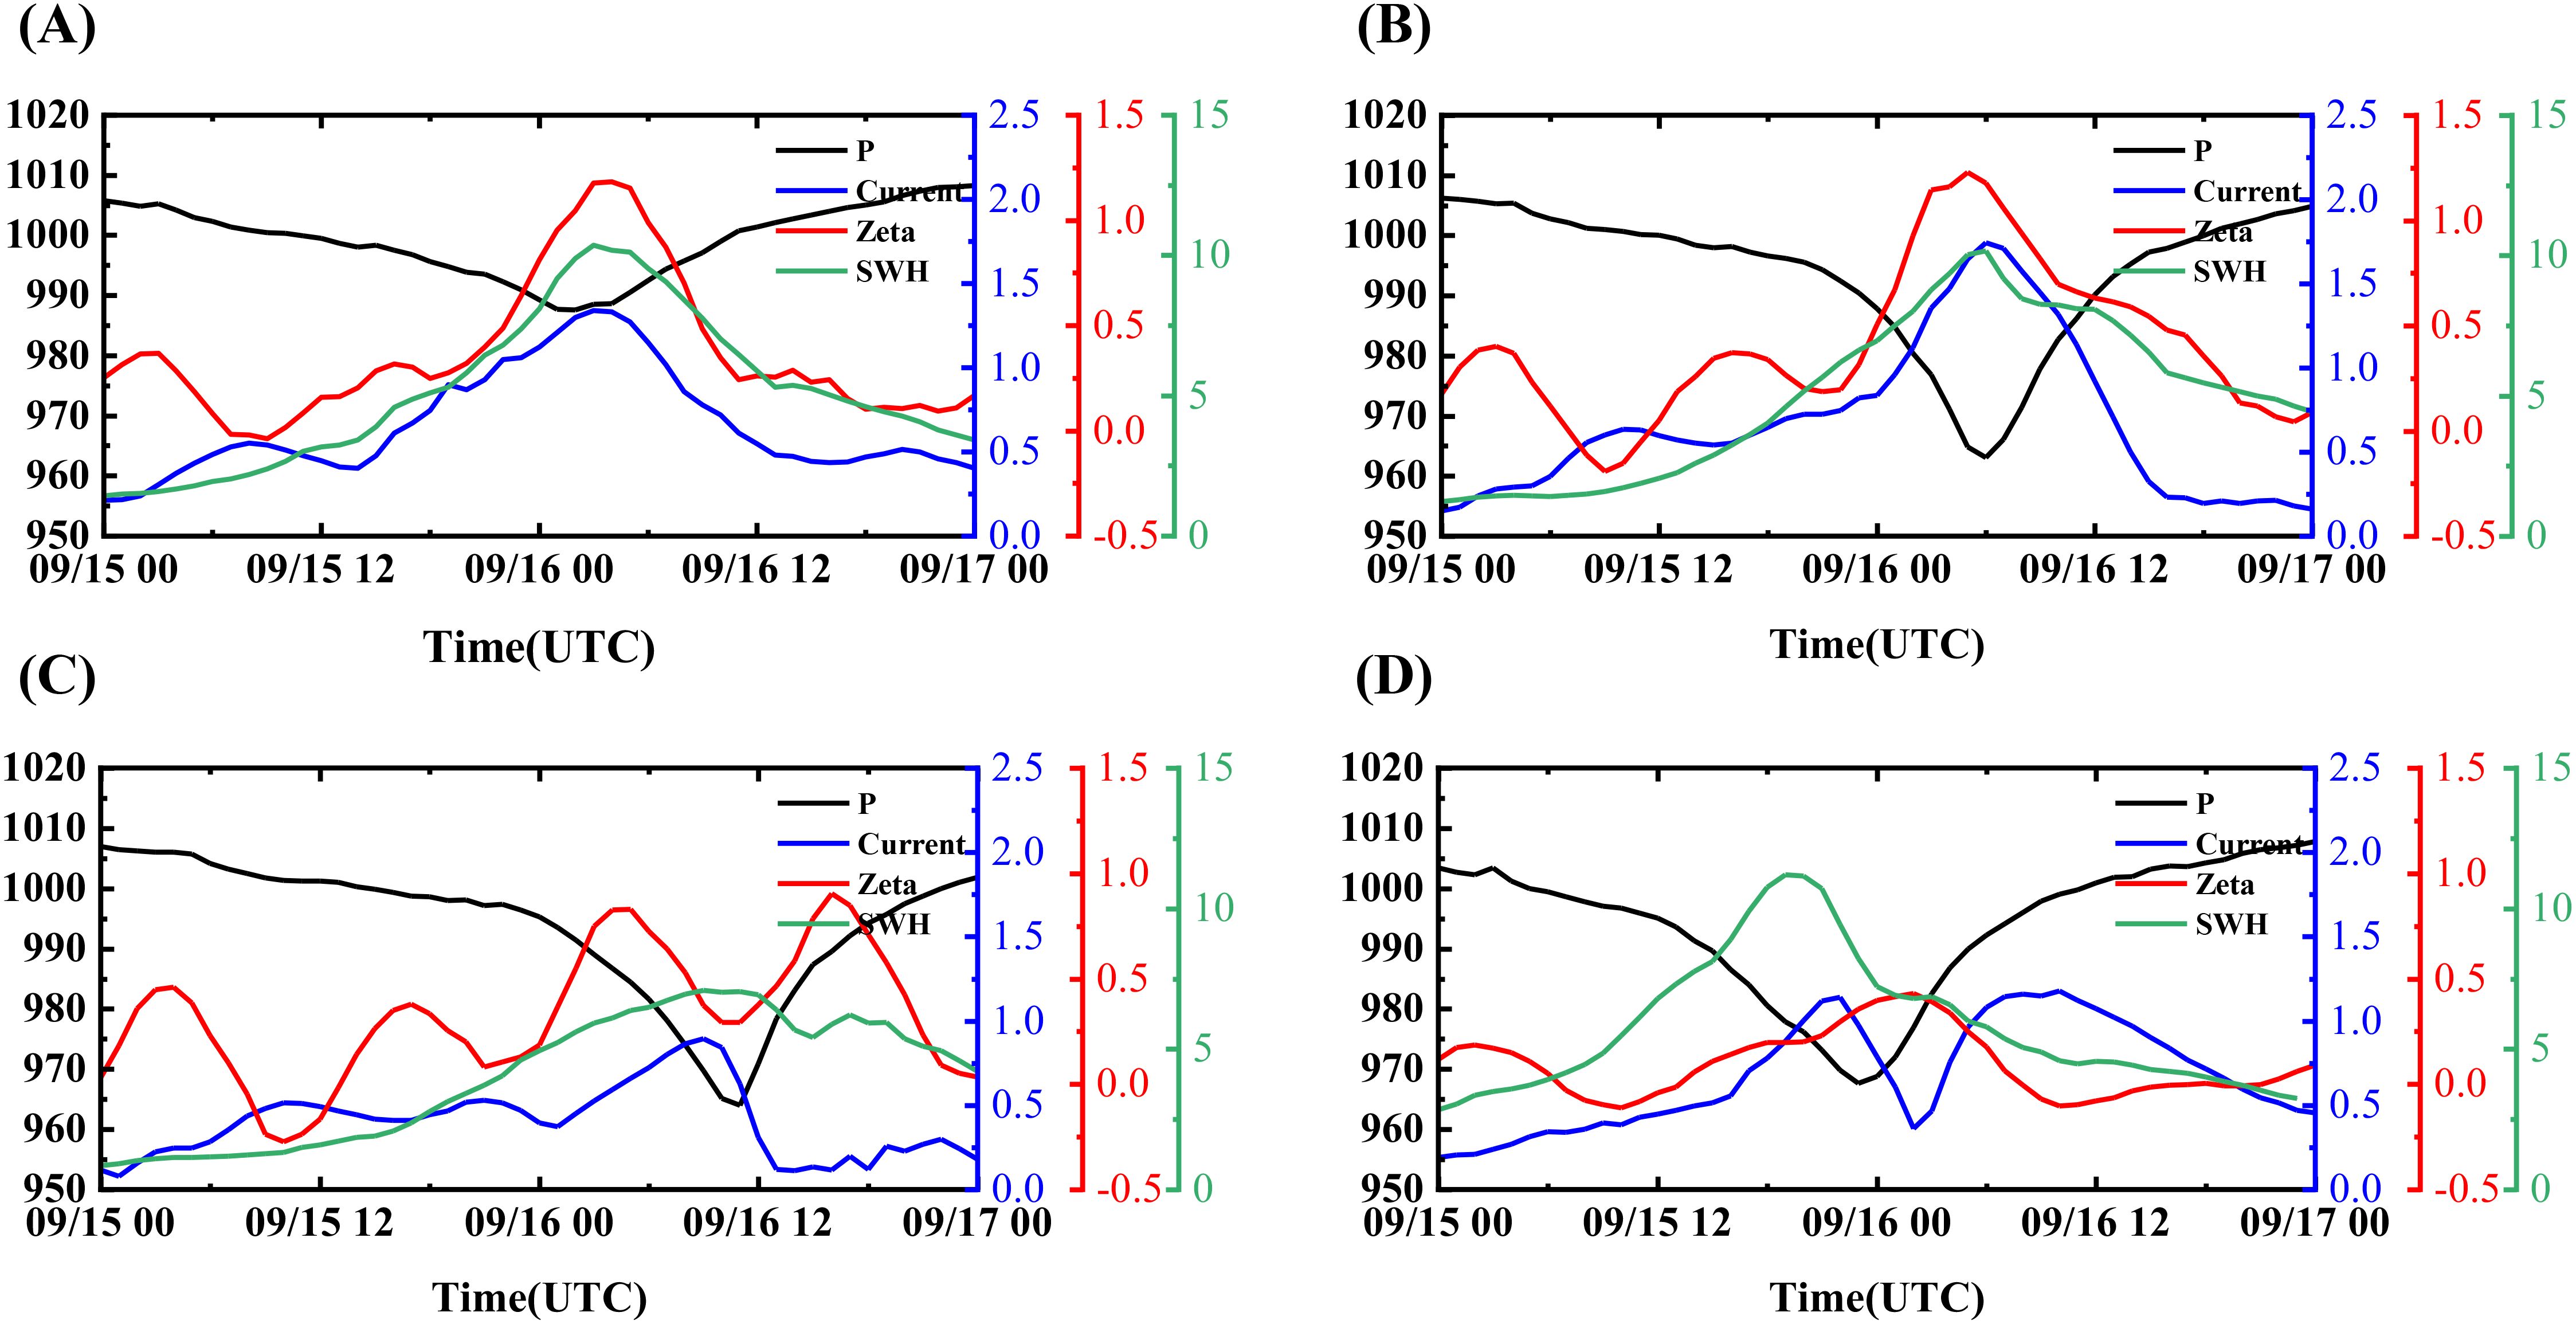
Figure 12. Time series of pressure, velocity, storm surge, and significant wave height at different stations: (A) QF303, (B) QF305, (C) QF306, (D) SF304.
4.4 Ekman pumping velocity
When the wind blows across the sea surface, it generates an Ekman layer, where the mass transport is perpendicular to the direction of the wind. This results in an inhomogeneity in horizontal mass transport under the non-uniform wind field of a typhoon, causing convergence in some areas and divergence in others. According to the continuity equation:
The convergence and divergence of the water mass result in the generation of vertical flow velocity at the top of the Ekman layer. Based on the sea surface boundary condition when , the vertical velocity at the top of the Ekman layer can be calculated as follows:
According to the classical Ekman drift theory, assuming that the background geostrophic flow is spatially uniform and H is constant, the relationship between the Ekman suction rate and wind stress can be derived as follows (Price, 1981):
where EPV represents Ekman pumping velocity (m/s), positive values indicate upward motion, and negative values indicate downward motion. represents the Coriolis parameter, represents seawater density (set at 1024 kg/m3). and are wind stress components. The characteristics of Ekman pumping velocity under typhoon conditions are analyzed at typical times (Figure 13). Specifically, the low-pressure system and asymmetric cyclonic wind field driven by Typhoon Mangkhut exerted intense wind stress, which in turn initiated a pronounced Ekman suction effect in the upper layers of the South China Sea. As a result, this effect induced upwelling at the typhoon’s core, thereby bringing colder subsurface water to the surface and consequently lowering the sea surface temperature. Meanwhile, within the outer wind field, downwelling processes prevailed, facilitating the descent of warm surface water into deeper ocean layers and consequently contributing to an increase in subsurface temperatures. As Typhoon Mangkhut’s entry into the South China Sea, the wind speed shear stress was primarily directed northeastward and relatively weak, resulting in a negligible Ekman suction effect. The Ekman suction is primarily distributed on both sides of the typhoon, with a more pronounced suction effect on the right side, which is partly influenced by the asymmetric structure of the typhoon. The direction of ocean currents around the typhoon is nearly perpendicular to the wind stress, with an angle close to 90 degrees. However, at 16:00 (UTC) on September 15, as the typhoon passed north of the Philippines and entered the South China Sea, the Ekman suction effect underwent a notable shift. Specifically, the upwelling velocity at the typhoon’s center reached 1.8 × 10-³ m/s, while a downwelling velocity of 1.6 × 10-³ m/s was observed off the western Philippines. This change can be attributed to the shift in the underlying surface from land to ocean, in addition to the influence of local topography, which resulted in a more pronounced gradient of wind stress in the typhoon’s vicinity. Moreover, the Ekman suction induces deeper ocean mixing, causing cold water to upwell from the mixed layer, thereby leading to a decrease in sea surface temperature (Figure 14).
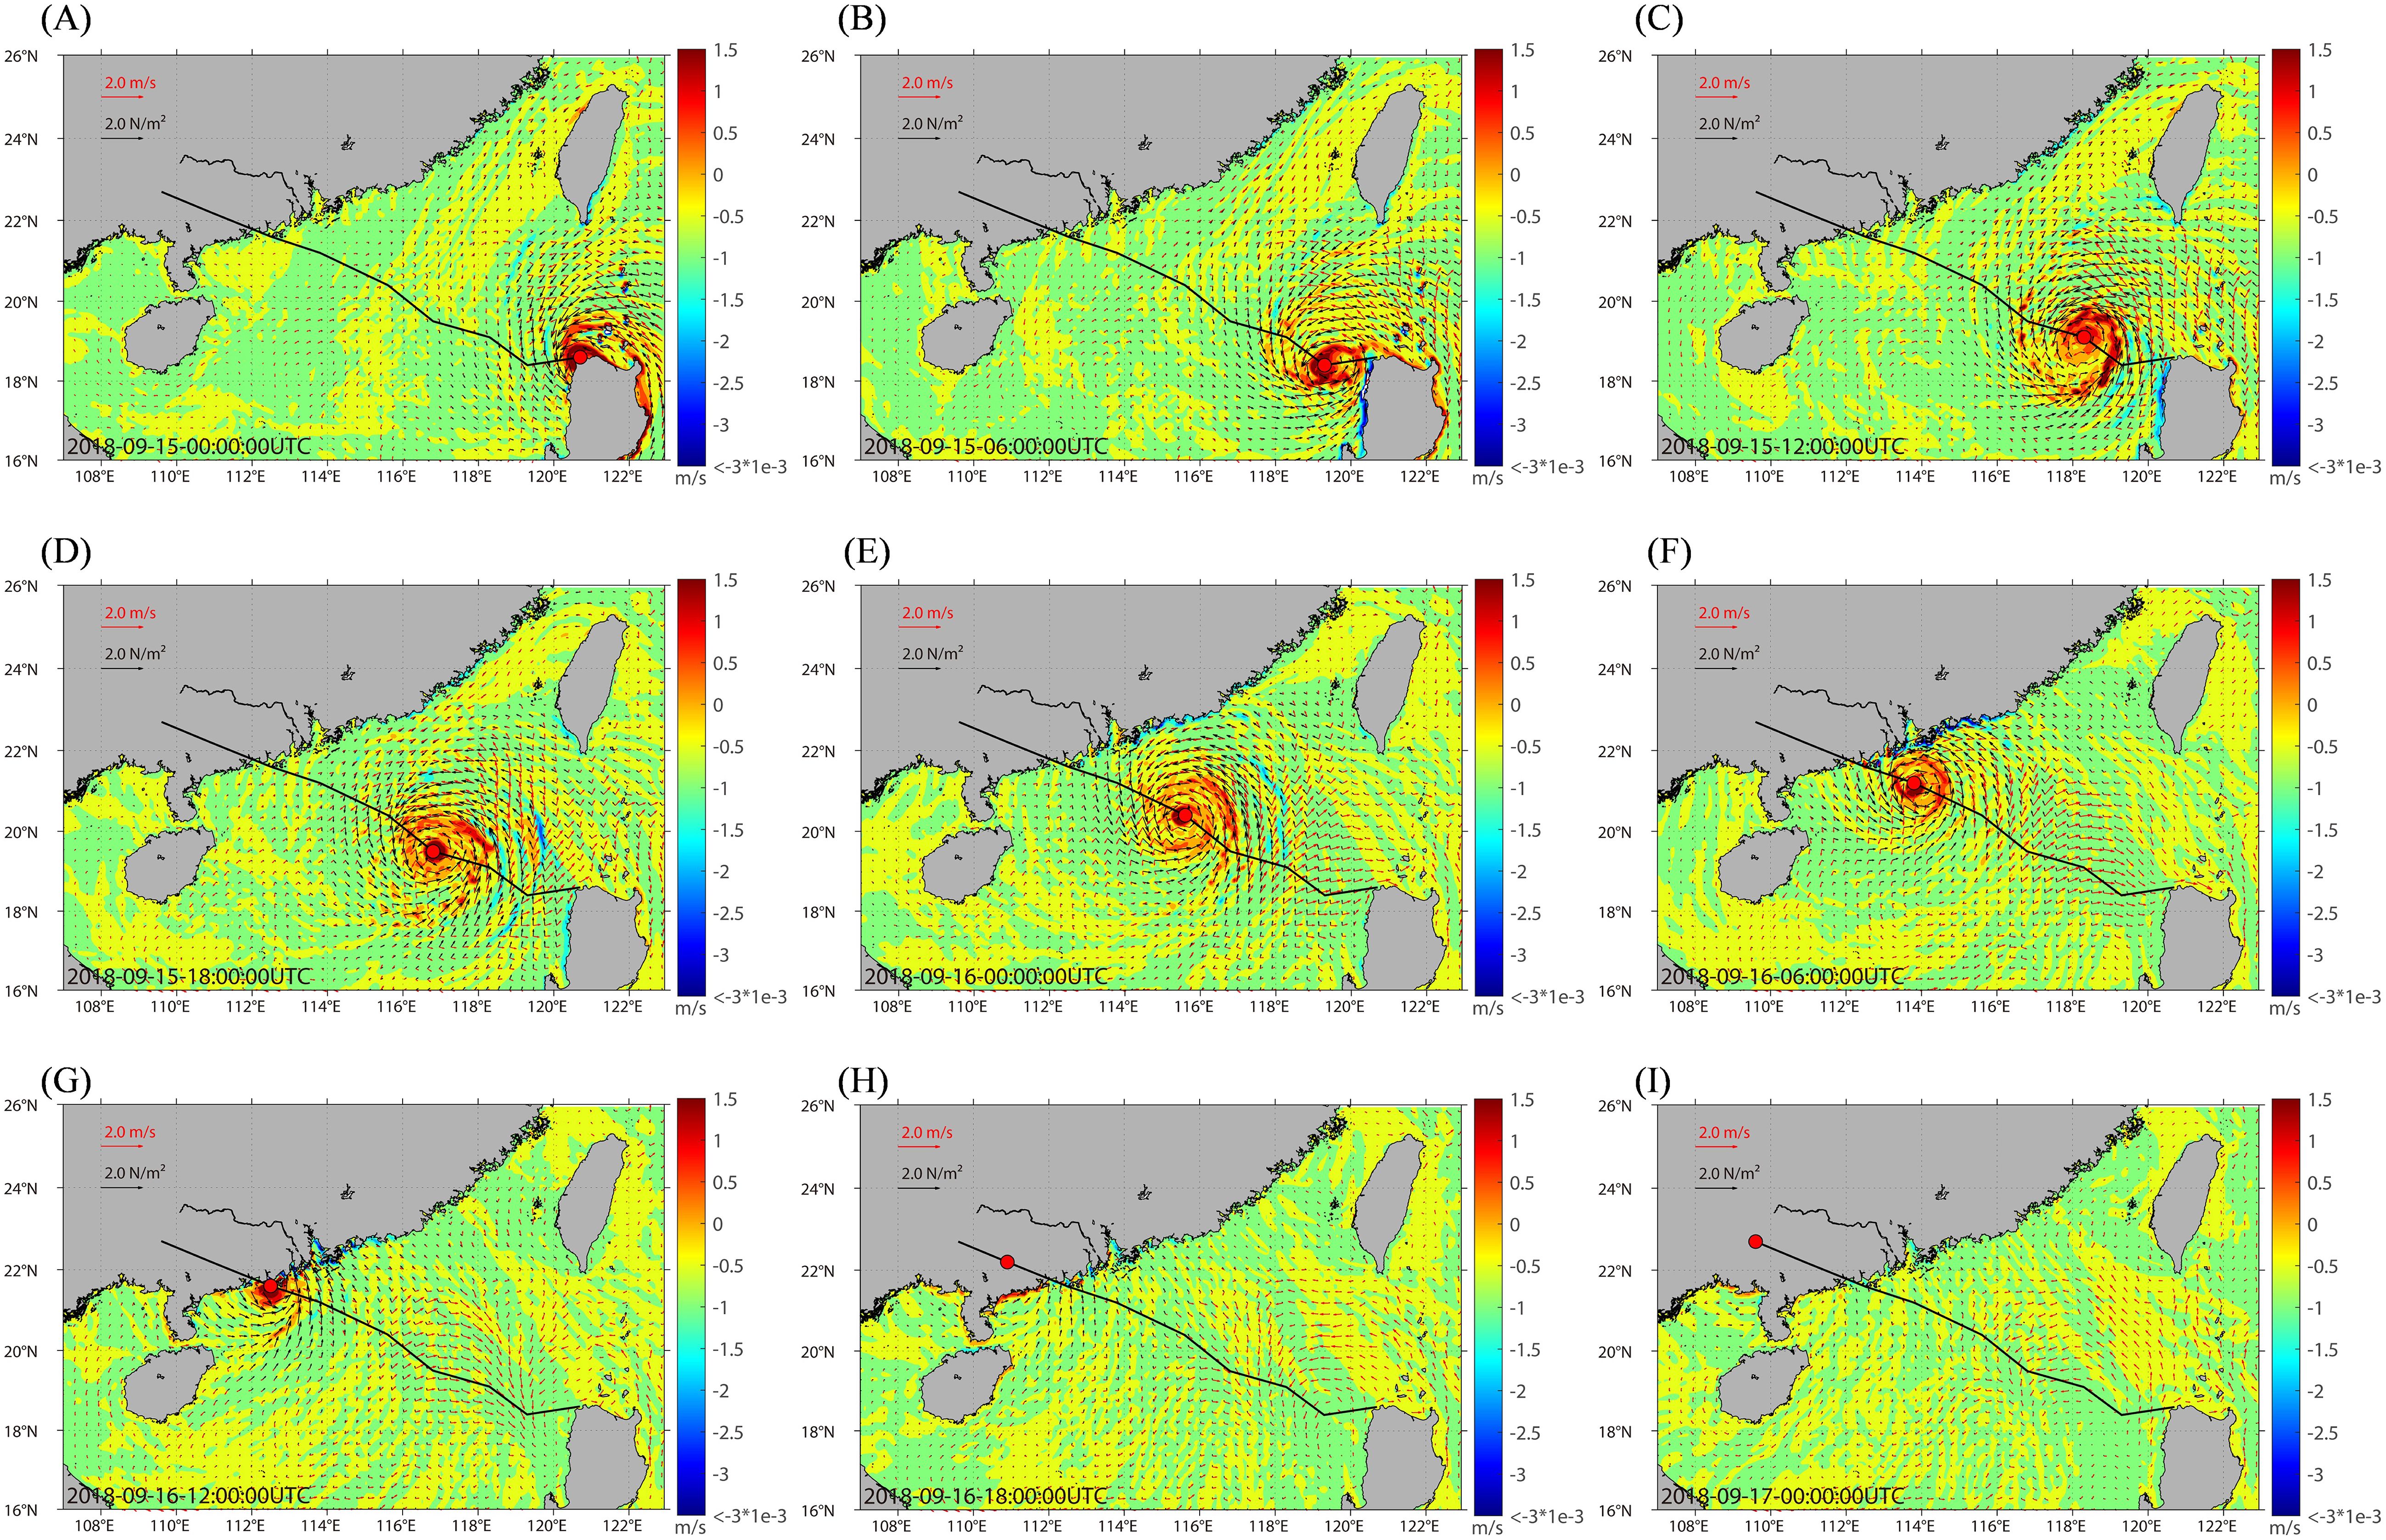
Figure 13. Spatiotemporal distribution of Ekman pumping velocity: Panels (A–I) represent 6-hour intervals from 15 to 17 September.
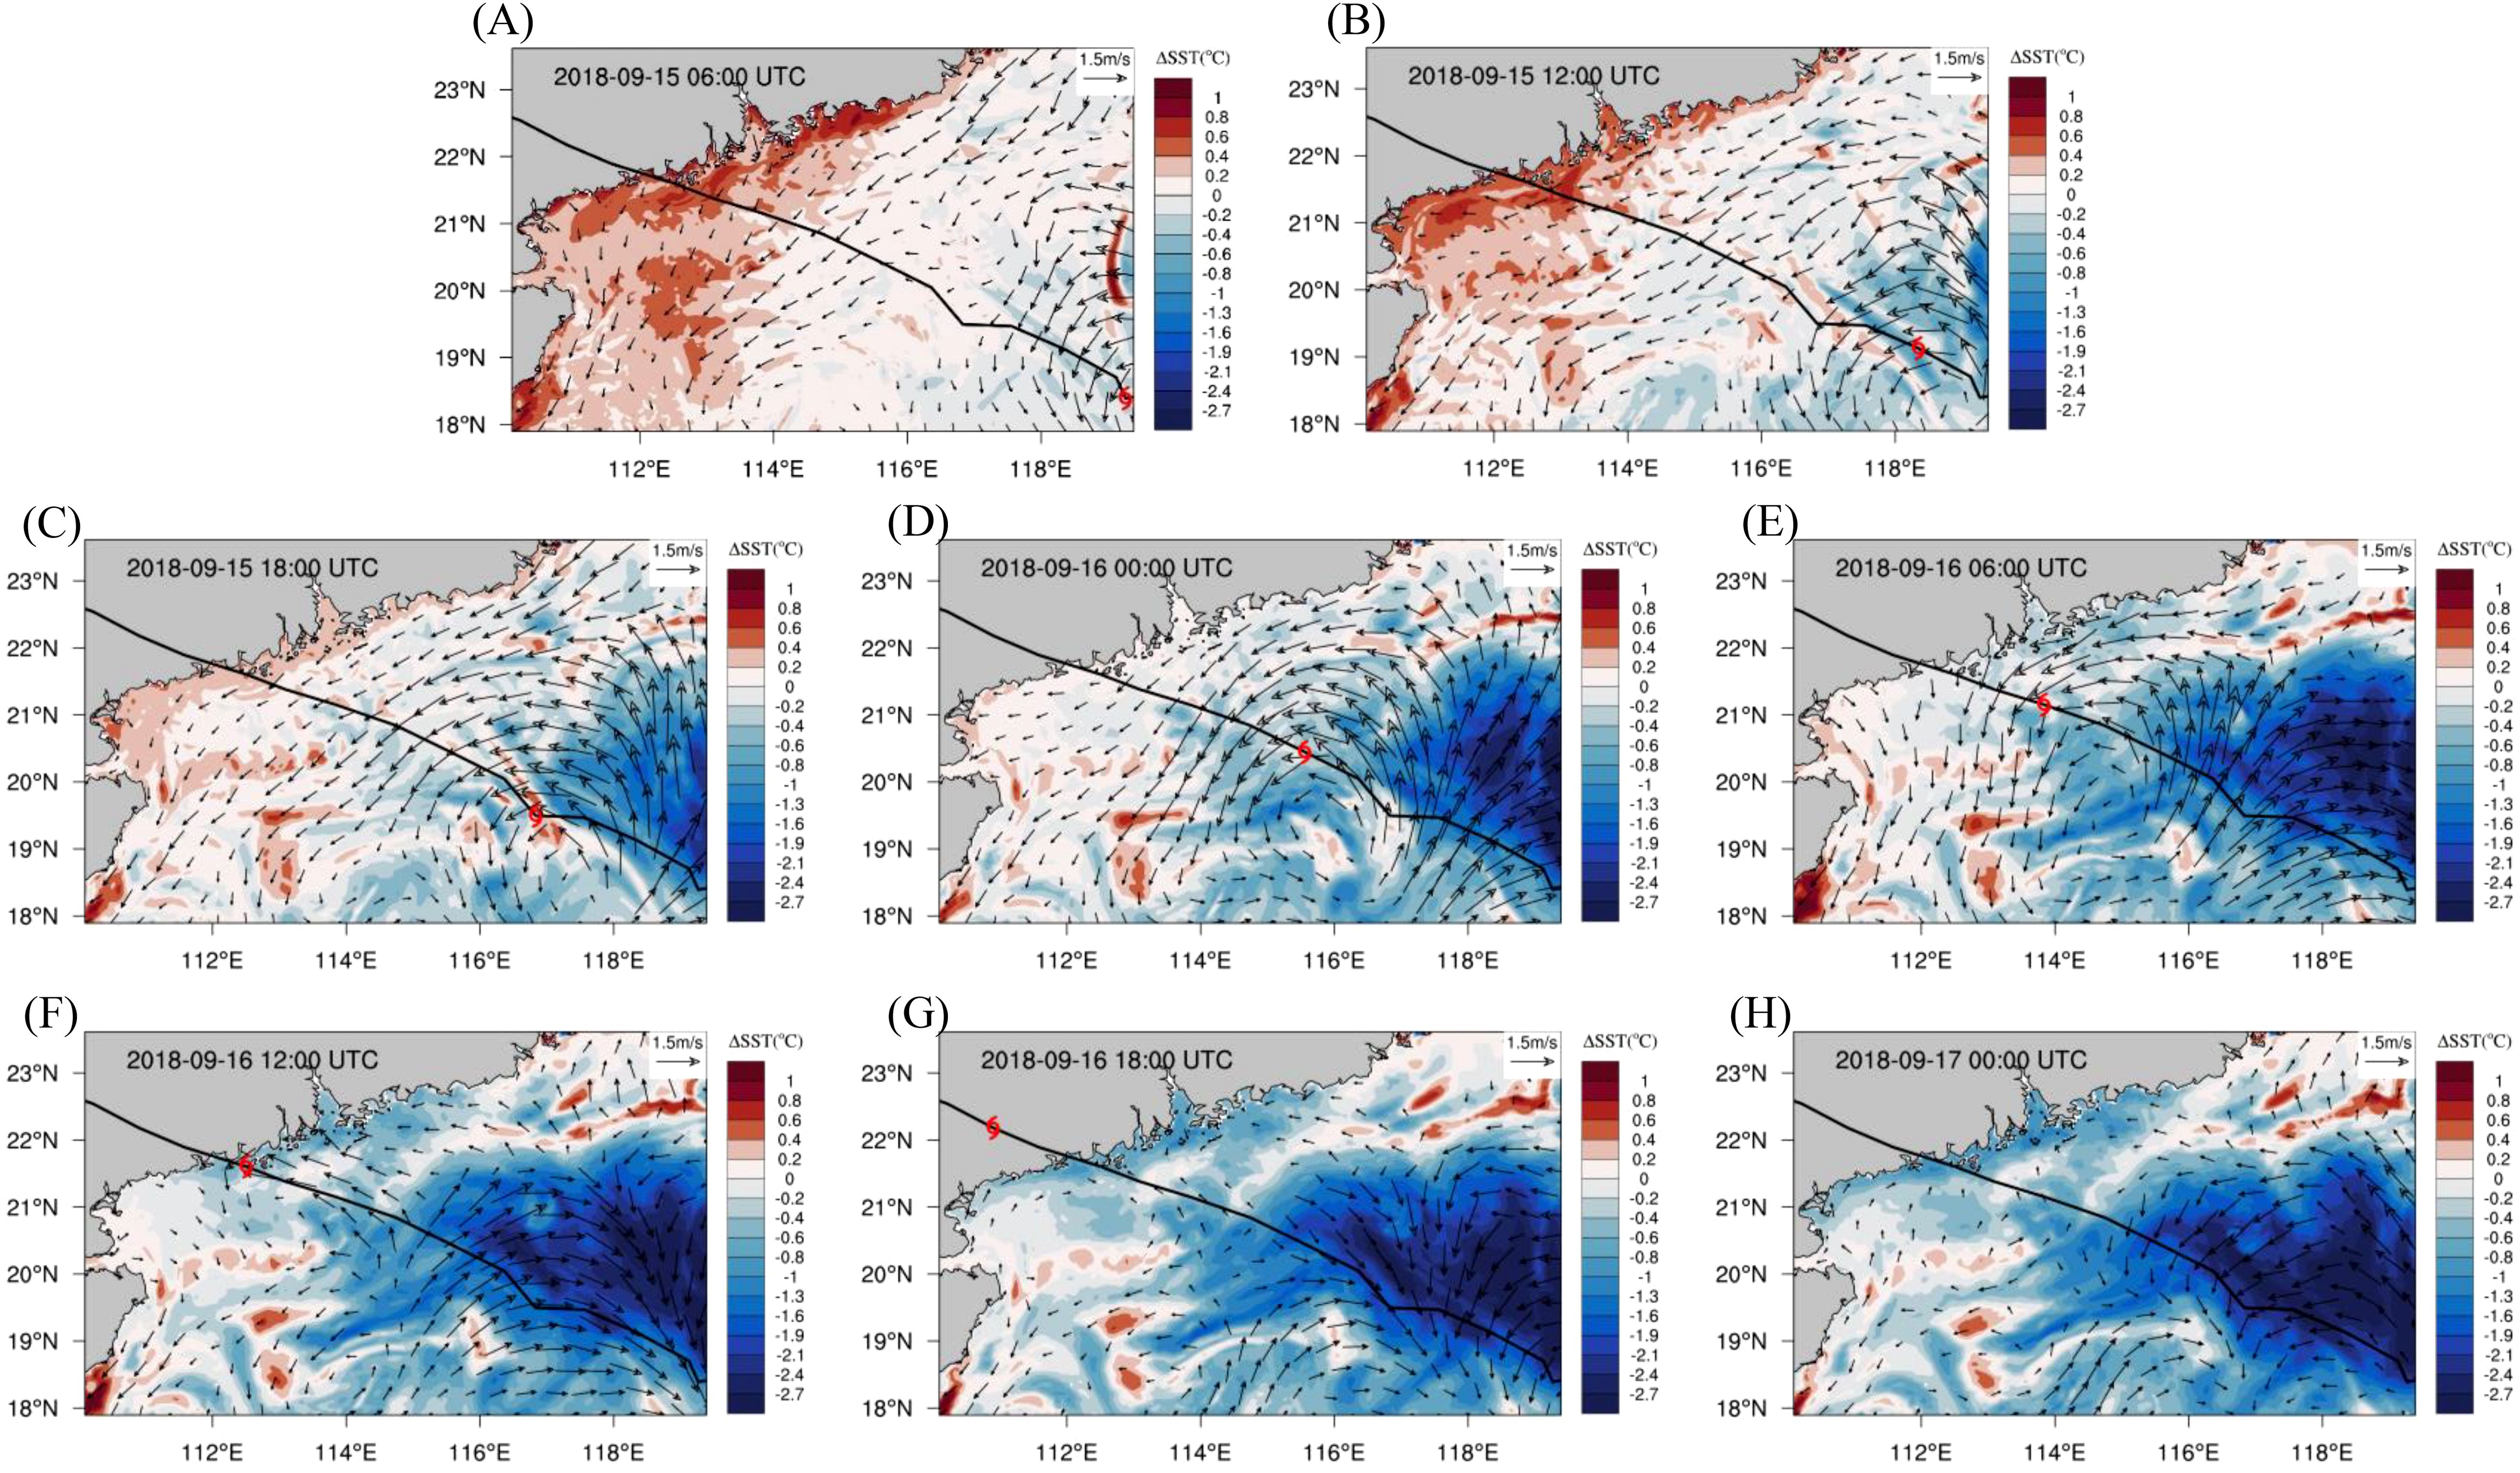
Figure 14. The spatial distribution of sea surface cooling: Panels (A–H) represent 6-hour intervals from 15 to 17 September.
Overall, the Ekman effect induced by Typhoon Mangkhut exhibits the following characteristics: (1) due to the asymmetric structure of the typhoon, the Ekman effect on the right side of the typhoon track is stronger than on the left side; (2) after the typhoon made landfall in Guangdong Province, the Ekman pumping effect on the left bank of Guangdong was positive and significantly stronger than on the right bank.
4.5 Sea surface temperature and heat flux
The sea surface cooling caused by the passage of a typhoon is a significant feature of the air-sea interaction. Approximately three hours after the typhoon passed, a cooling zone of 3°C appeared on the right side of the typhoon’s track, while the nearshore shallow waters experienced a smaller temperature change, with a decrease of only about 1°C (Figure 14). The observed temperature changes can be attributed to two key factors. Firstly, the stronger wind stress and surface currents on the right side of the typhoon’s track result in greater heat flux loss in this region (Chen et al., 2014; Shen et al., 2021). Additionally, the Ekman pumping effect generates vertical flow velocities which lifts the thermocline and cools the sea surface, known as the “cold pumping” effect (Chen et al., 2021). As illustrated in Figure 13, the flow direction is deflected to the right of the wind stress, with ocean currents transporting cold water upwelled by Ekman pumping toward the right side of the typhoon’s track. In contrast, sea surface temperature (SST) variations in nearshore shallow waters are relatively low, with a temperature drop of approximately 1°C. This limited cooling is primarily attributed to the inclusion of solar radiation effects in the model, which allow nearshore waters to absorb external heat, thereby mitigating temperature reductions.
To further investigate the internal ocean temperature changes following the passage of the typhoon, the temporal variation of upper ocean temperature, heat flux and MLD (Mixed layer depth) were analyzed for three observation points, located at different positions with a depth of 400 meters, as shown in Figure 15.

Figure 15. Characteristic points for heat flux and SST analysis.
The latent and sensible heat fluxes display a largely consistent variation trend, with the latent heat flux emerging as the predominant contributor (Figure 16). As the typhoon approached the observation points, the increasing heat flux triggered a noticeable cooling trend in the sea surface temperature (SST). At PL and PR, as the heat flux reached its peak, the SST underwent a rapid decline. Subsequently, as the heat flux diminished to near zero, the SST stabilized and showed a slight warming trend. Meanwhile, at PC, the initial period of elevated heat flux occurred at 13:00 UTC on the 15th, characterized by a relatively low intensity and a corresponding SST drop of 0.5°C; however, the subsequent period, at 02:00 UTC on the 16th, was accompanied by a pronounced SST decline. This suggests a robust and direct correlation between heat flux and SST variations. Furthermore, After the typhoon made landfall, although the temperature continued to decrease, the rate of decline gradually slowed. The causes of this temperature lag will be explained in the following sections.
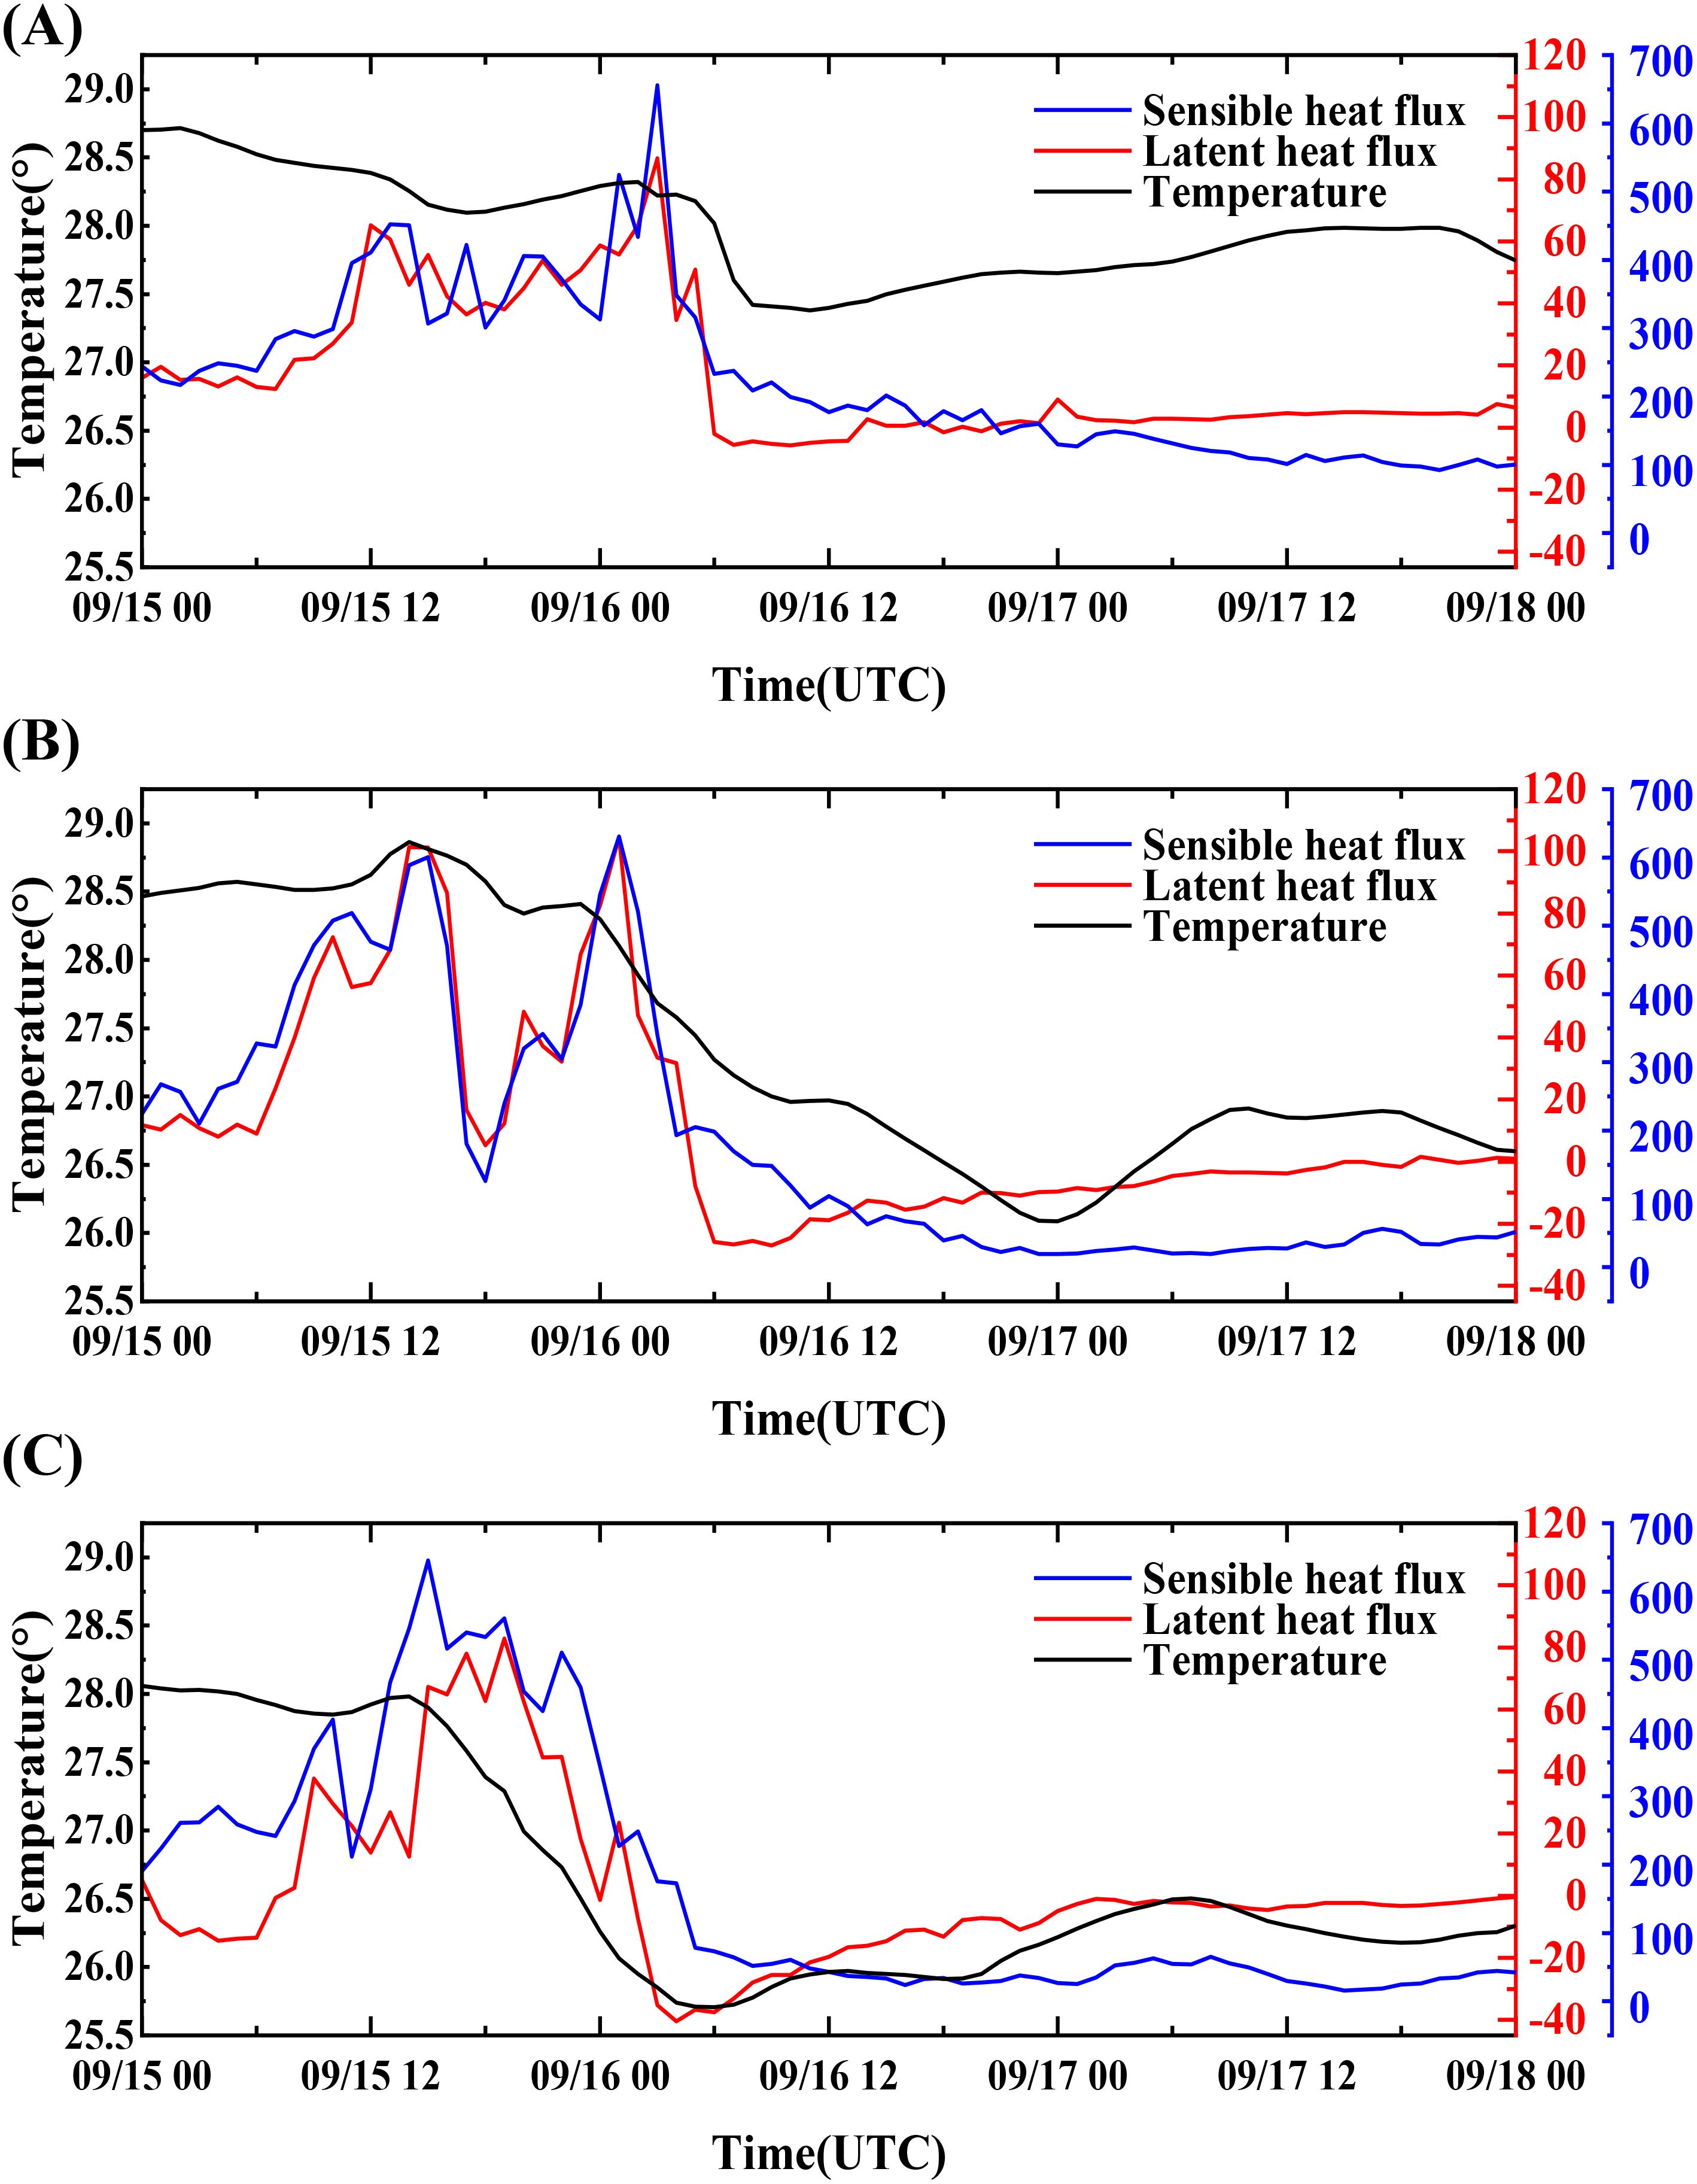
Figure 16. Time series curves of latent, sensible heat fluxes and temperature at different location: (A) PL, (B) PC, (C) PR.
The vertical mixing and upwelling induced by the typhoon’s passage significantly influence the distribution of oceanic water and temperature in the interior ocean. The maximum cooling occurred at depths of 50–100 m (Figure 17), with a peak temperature drop of up to 3.8°C approximately 12 hours after the typhoon’s passage.
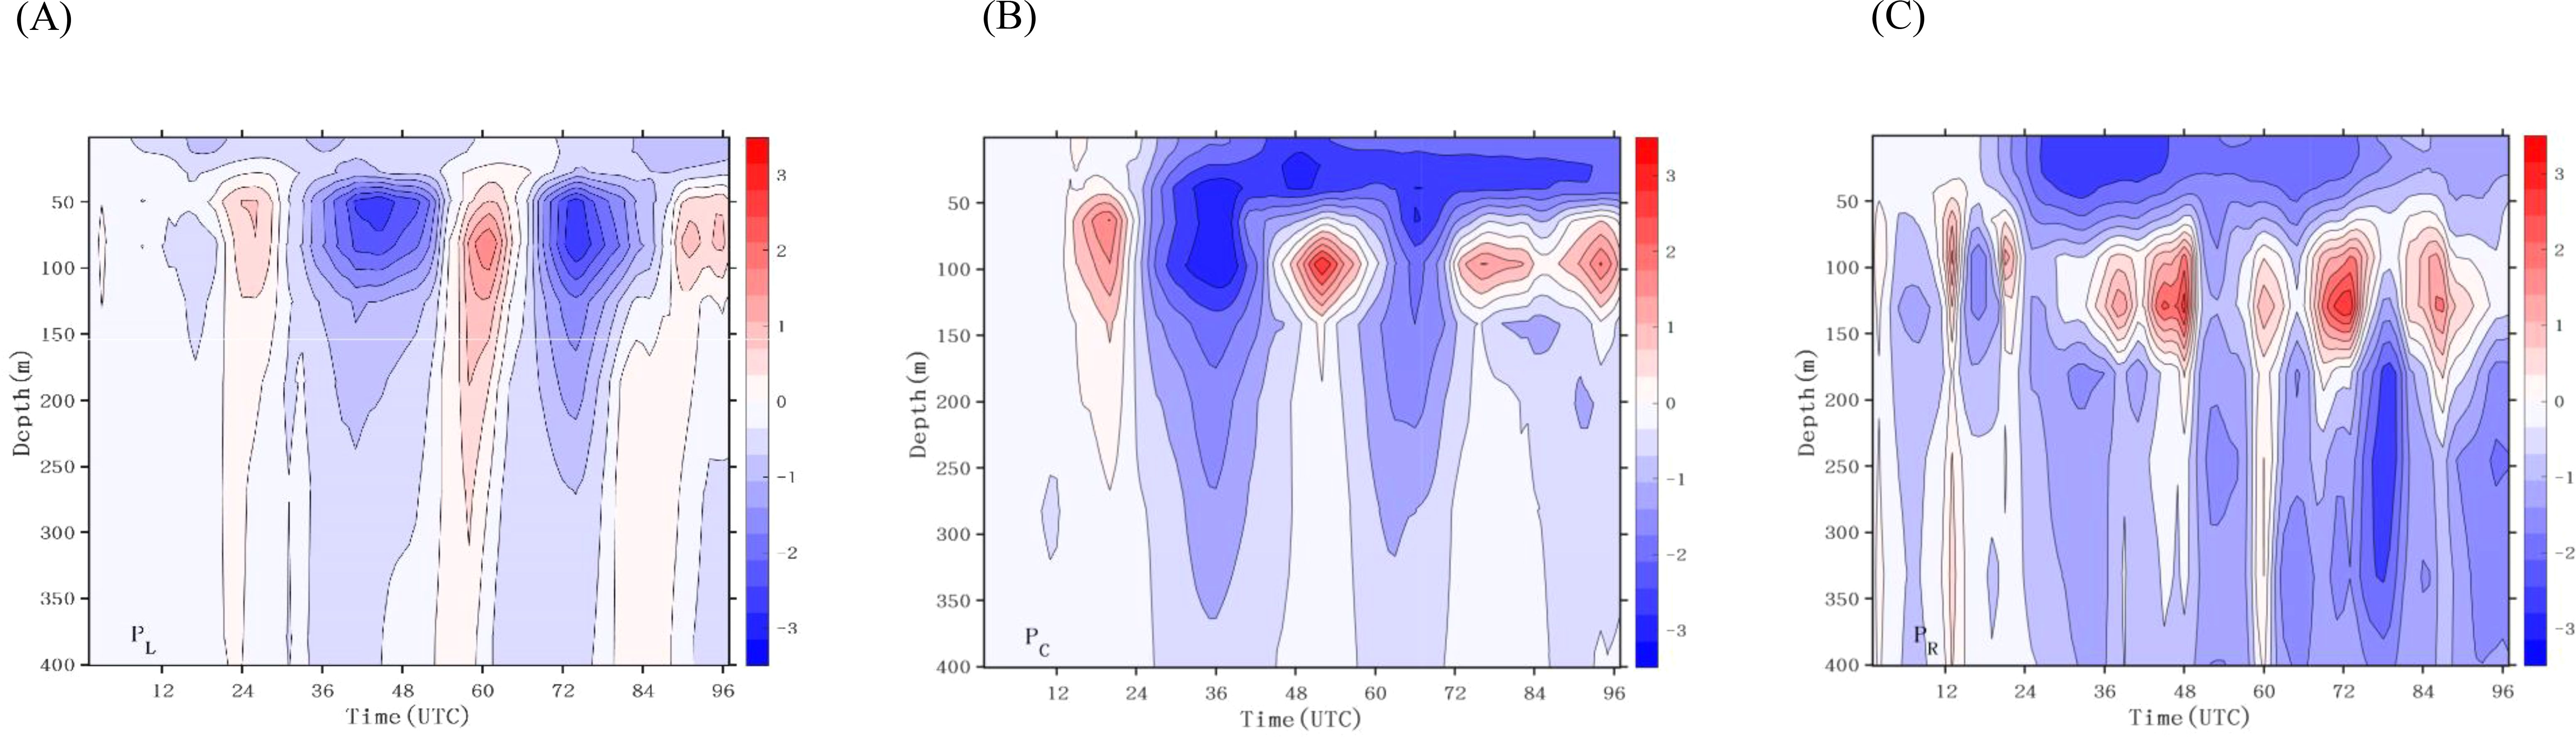
Figure 17. The temporal evolution of upper ocean temperatures at different observation points during the passage of the typhoon: (A) PL, (B) PC, (C) PR.
The sea surface cooling at three characteristic points of the typhoon exhibit distinct near-inertial oscillation (NIO) signatures. The right-hand side of the typhoon track shows the most pronounced NIOs, driven by Ekman pumping under strong wind forcing, which fosters vigorous exchanges between surface and subsurface waters, resulting in surface cooling and subsurface warming. And the typhoon center displays weaker but still detectable NIOs, yet demonstrates more significant and prolonged cooling. This occurs through the combined effects of upwelling motion (which dominates with greater intensity) and NIOs, where upwelling rapidly transports cold subsurface water to the surface. Meanwhile, the left-hand side exhibits substantially weaker NIO amplitude; here upwelling prevails over vertical mixing, causing upward advection of colder deep water that suppresses expected warming. Both surface and subsurface temperatures decrease, with the cooling effect extending to a depth of 250 meters. The difference in cooling duration arises because upwelling ceases quickly after the typhoon’s passage, while NIOs continue to dissipate energy over days to weeks. Consequently, the left-hand side of the typhoon track exhibits relatively rapid temperature recovery, whereas the cooling effects persist for several days in both the central eyewall region and the right-hand side. Following the typhoon’s passage, vertical mixing and upwelling weaken concurrently with the relaxation of wind stress, while the restoration of solar radiation and surface heat fluxes facilitates the gradual recovery of sea surface temperature.
To explore the causes of the temporal lag and the Asymmetry in upper ocean temperature, we analyze mixed layer depth, Ekman pumping velocity and vertical velocity of points PL and PR in on both sides of the typhoon as Figure 18 (The black dashed line represents the time when the typhoon passed). When the typhoon approached the two characteristic points, mixed layer depth and Ekman pumping Velocity exhibit a significant increase. Although the peak Ekman pumping velocity on the left side exceeds that on the right side, the cumulative Ekman pumping velocity on the right side surpasses that on the left. After Typhoon Mangkhut made landfall in Guangdong at 12:00(UTC) on September 16, Ekman pumping velocity on both sides decreased significantly. Accordingly, we propose that vertical oscillations persist following the typhoon’s passage. And we comparing the vertical velocities on both sides, it is evident that the right side exhibits continuous and pronounced oscillations, whereas the vertical velocity on the left side shows only low-frequency, small-amplitude variations. Then we analyzed the mixed layer depth (MLD) on both sides. The results reveal that after the typhoon’s passage, the MLD amplitude and oscillation frequency on the right side are significantly higher than those on the left. The maximum MLD variation on the right reaches 12 m, while on the left it only reaches 8 m. Typically, such oscillations take 3–5 weeks to subside. However, due to the limited duration of our simulation (7 days), we were unable to observe the complete cessation of these oscillations. Nonetheless, this analysis provides evidence for the cause of the temperature lag.
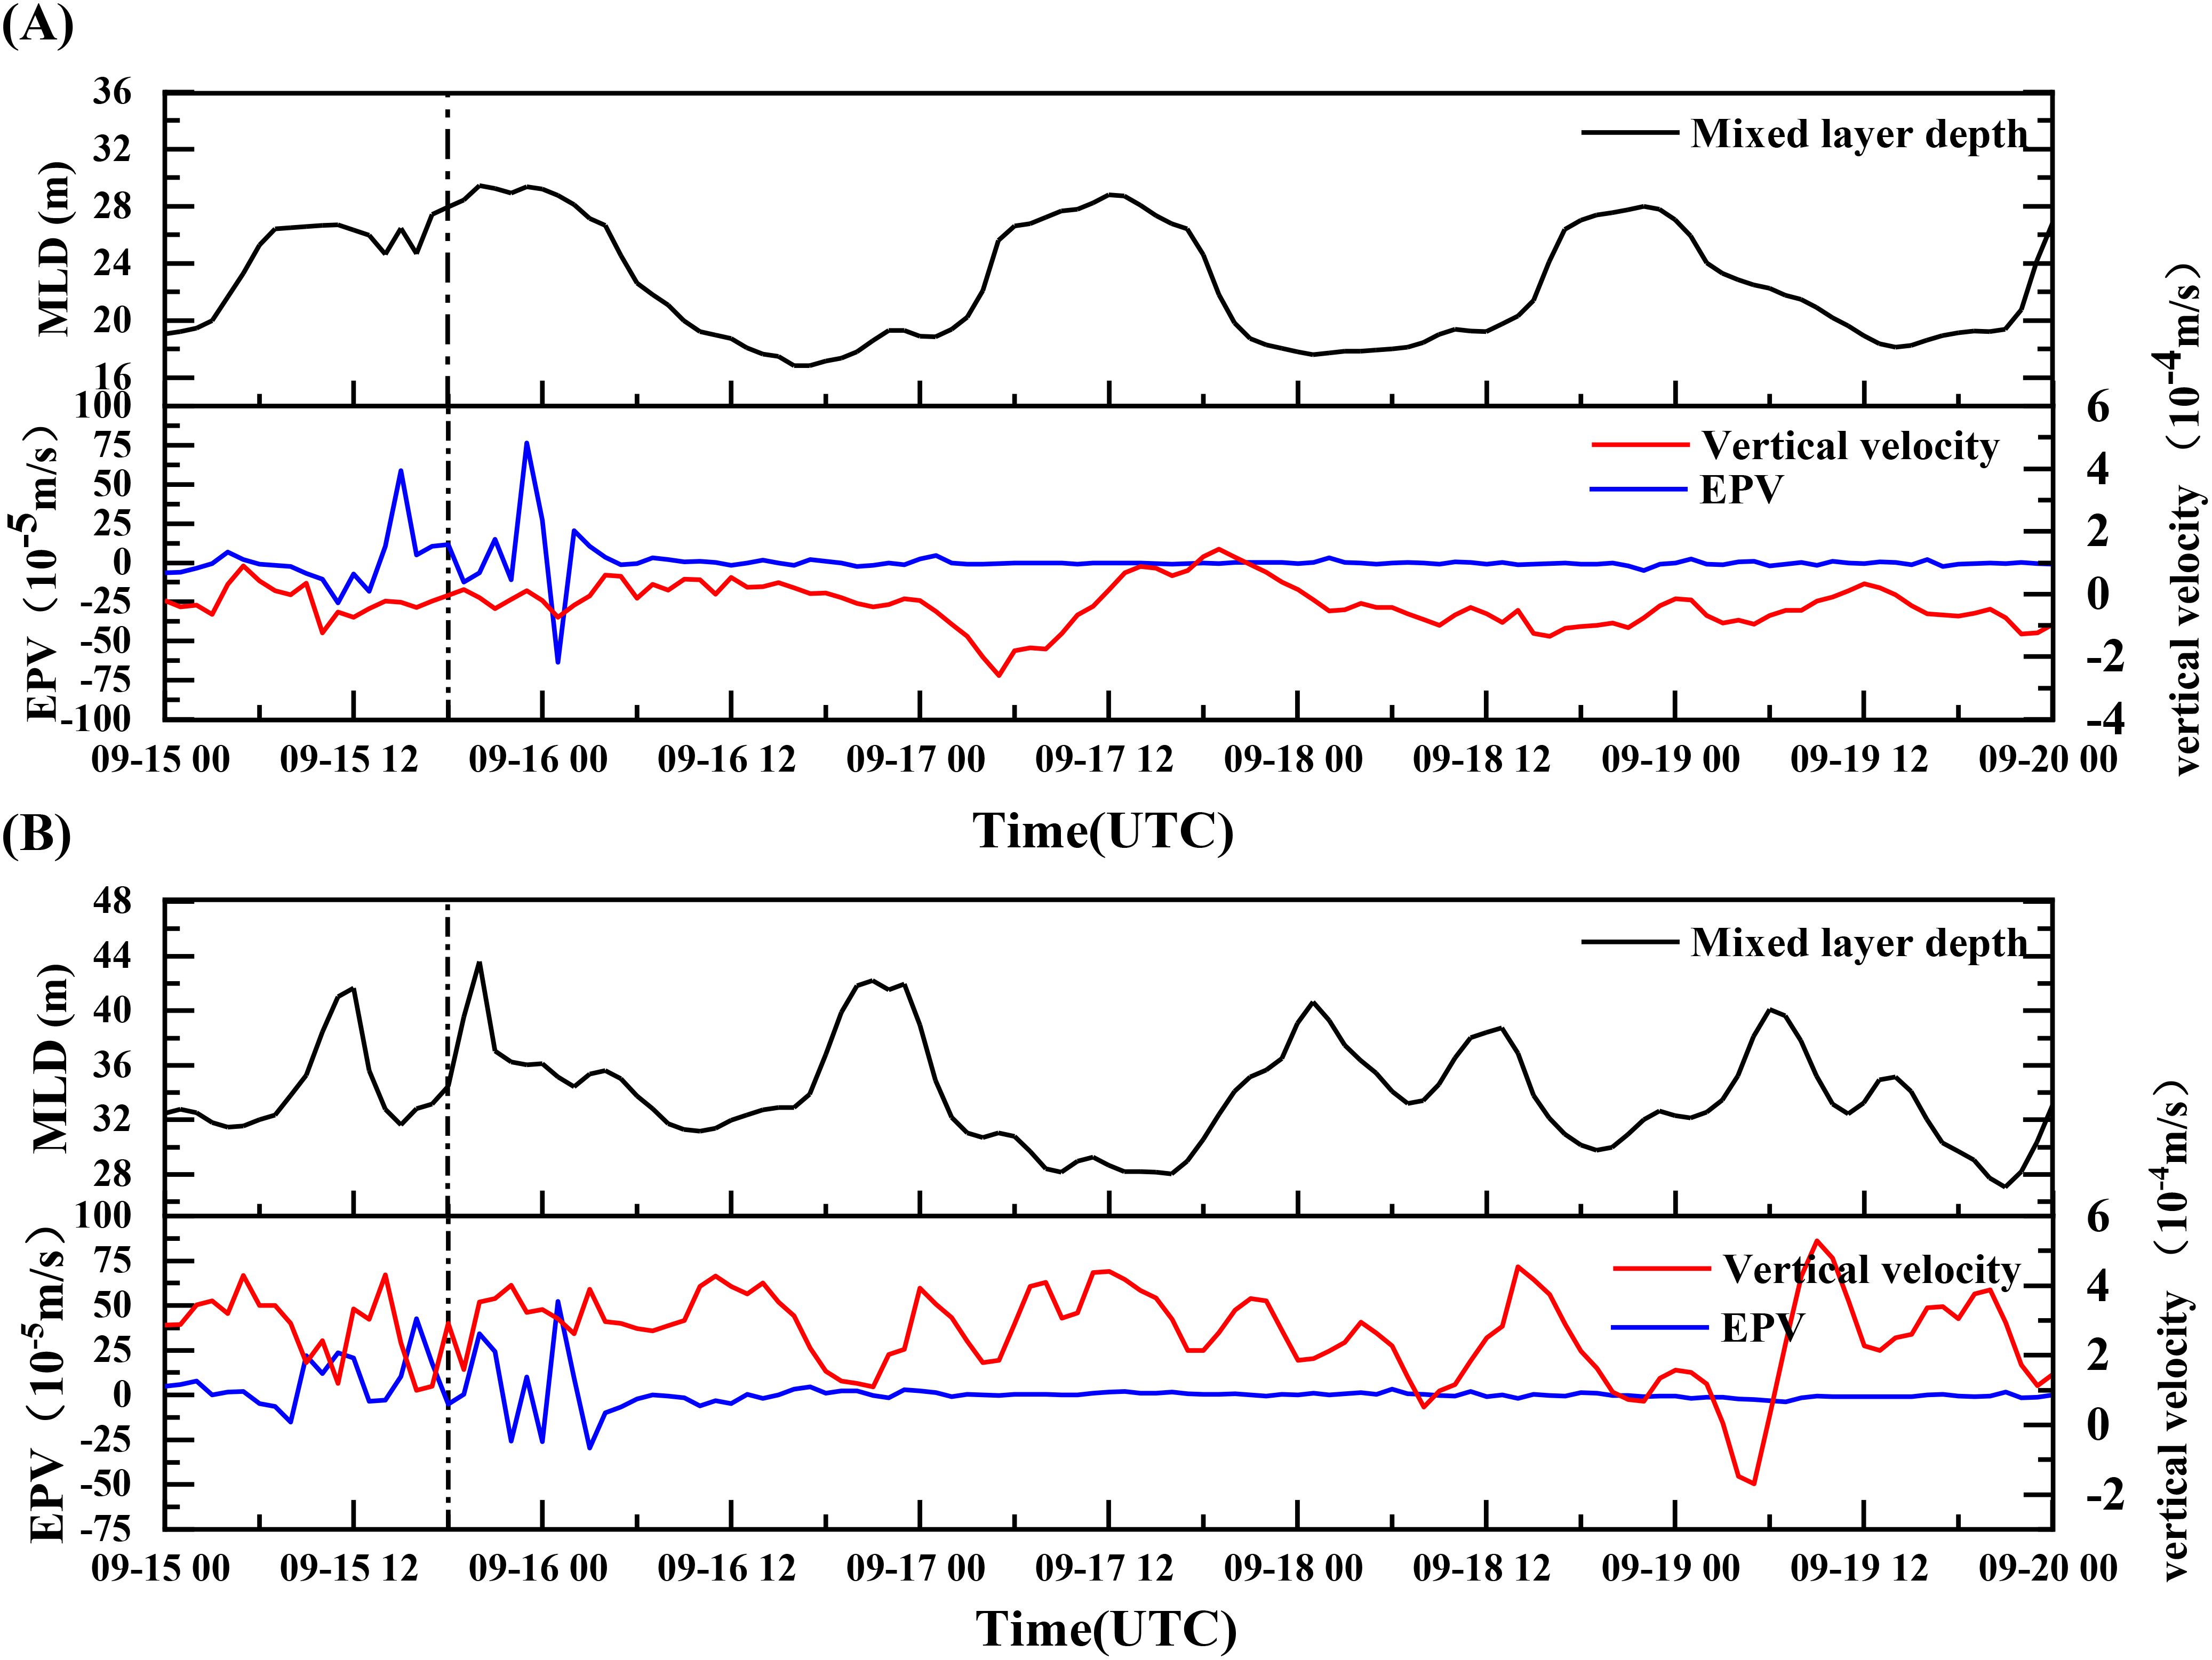
Figure 18. The temporal evolution of upper ocean Vertical velocity, EPV and MLD at points PL and PR during the passage of the typhoon: (A) PL, (B) PR.
5 Conclusions
Utilizing the COAWST coupled model, this study thoroughly examined the dynamic and thermodynamic responses of the northern South China Sea to the passage of super typhoon Mangkhut. The primary findings are summarized as follows:
Under the influence of the Coriolis force, super typhoon Mangkhut exhibits a pronounced structural asymmetry. As a result, during its passage, the wind field, surface current field, significant wave height field, and maximum storm surge along the coastline are all predominantly observed on the right side of the typhoon’s track. This leads to a distinct spatial characteristic, marked by a pronounced rightward bias in the distribution of these critical meteorological and oceanographic parameters.
The vertical mixing and upwelling triggered by the typhoon’s passage exert a substantial influence on the distribution of water and temperature in the ocean’s interior. The mechanisms responsible for cooling at the typhoon’s center and on its right side differ significantly. The cooling at the typhoon’s center is mainly driven by upwelling, which transports cold water from deeper layers to the ocean surface. Conversely, the cooling on the right side is primarily caused by the vertical mixing effect of the typhoon’s wind field.
Throughout the movement of super typhoon Mangkhut across the South China Sea, both the significant wave height and temperature fields show a temporal lag relative to the wind speed and pressure fields. Although intense Ekman suction was induced during the typhoon’s passage, the primary cause of the lag in sea surface temperature reduction is the vertical oscillations left behind after the typhoon.
Data availability statement
The original contributions presented in the study are included in the article/supplementary material. Further inquiries can be directed to the corresponding authors.
Author contributions
ZW: Funding acquisition, Methodology, Project administration, Resources, Software, Supervision, Writing – original draft, Writing – review & editing. ZZ: Data curation, Formal Analysis, Validation, Visualization, Writing – original draft. JC: Funding acquisition, Project administration, Writing – review & editing. BD: Writing – review & editing. CJ: Funding acquisition, Project administration, Supervision, Writing – review & editing. HL: Writing – review & editing. ZL: Writing – review & editing. HZ: Writing – review.
Funding
The author(s) declare that financial support was received for the research and/or publication of this article. This research was supported by the National Natural Science Foundation of China (Grant No. 52171246 and 52479063). The partial support also comes from the Open Project of Key Laboratory of High Impact Weather (special), China Meteorological Administration; the Open Research Fund of Key Laboratory of Water Security Guarantee in Guangdong-Hong Kong-Marco Greater Bay Area of Ministry of Water Resources (Grant No. WSGBA-KJ2023012); the Science and Technology Innovation Program of Hunan Province (2023RC3136); Educational Science Foundation of Hunan Province (23A0265); the Graduate Scientific Research and Innovation Project of Changsha University of Science & Technology (Grant No. CSLGCX23050).
Conflict of interest
The authors declare that the research was conducted in the absence of any commercial or financial relationships that could be construed as a potential conflict of interest.
Generative AI statement
The author(s) declare that no Generative AI was used in the creation of this manuscript.
Publisher’s note
All claims expressed in this article are solely those of the authors and do not necessarily represent those of their affiliated organizations, or those of the publisher, the editors and the reviewers. Any product that may be evaluated in this article, or claim that may be made by its manufacturer, is not guaranteed or endorsed by the publisher.
References
Bao X., Wu L., Tang B., Ma L., Wu D., Tang J., et al. (2019). Variable raindrop size distributions in different rainbands associated with Typhoon Fitow (2013). J. Geophysical Research: Atmospheres 124 (22), 12262–12281. doi: 10.1029/2019JD030268
Chen H., Li S., He H., Song J., Ling Z., Cao A., et al. (2021). Observational study of super typhoon Meranti, (2016) using satellite, surface drifter, Argo float and reanalysis data. Acta Oceanologica Sinica. 40, 70–84. doi: 10.1007/s13131-021-1702-9
Chen S., Li W., Lu Y., Wen Z. (2014). Variations of latent heat flux during tropical cyclones over the south China sea. Meteorological Applications. 21, 717–723. doi: 10.1002/met.1398
Chen T.-C., Hu K.-C., Wu H.-L., Lu W.-S., Chen W.-B., Chiang W.-S., et al. (2025). Typhoon blend wind field optimization using wave-height hindcasts. J. Marine Sci. Eng. 13, 354. doi: 10.3390/jmse13020354
Cheng S., Cao A., Song J., Guo X. (2024). Contribution of high-mode near-inertial waves to enhanced typhoon-induced sea surface temperature cooling in the South China Sea. Ocean Modelling 192, 102452. doi: 10.1016/j.ocemod.2024.102452
Chia H. H., Ropelewski C. (2002). The interannual variability in the genesis location of tropical cyclones in the northwest Pacific. J. Climate. 15, 2934–2944. doi: 10.1175/1520-0442(2002)015<2934:TIVITG>2.0.CO;2
Chiang T.-L., Wu C.-R., Oey L.-Y. (2011). Typhoon Kai-Tak: An ocean’s perfect storm. J. Phys. Oceanography. 41, 221–233. doi: 10.1175/2010JPO4518.1
Cui H., Tang D., Liu H., Liu H., Sui Y., Lai Y., et al. (2024). Modeling ocean cooling induced by tropical cyclone wind pump using explainable machine learning framework. IEEE Trans. Geosci. Remote Sens. 62, 1–17. doi: 10.1109/TGRS.2024.3358374
Cui H., Tang D., Mei W., Liu H., Sui Y., Gu X. (2023). Predicting tropical cyclone-induced sea surface temperature responses using machine learning. Geophysical Res. Lett. 50, e2023GL104171. doi: 10.1029/2023GL104171
Deng L., Gao W., Duan Y., Wang Y. (2019). Microphysical properties of rainwater in Typhoon Usagi, (2013): A numerical modeling study. Adv. Atmospheric Sci. 36, 510–526. doi: 10.1007/s00376-019-8170-6
Deng Z., Xie L., Han G., Zhang X., Wu K. (2012). The effect of Coriolis-Stokes forcing on upper ocean circulation in a two-way coupled wave-current model. Chin. J. oceanology limnology. 30, 321–335. doi: 10.1007/s00343-012-1069-z
Dudhia J. (1989). Numerical study of convection observed during the winter monsoon experiment using a mesoscale two-dimensional model. J. Atmospheric Sci. 46, 3077–3107. doi: 10.1175/1520-0469(1989)046<3077:NSOCOD>2.0.CO;2
Ek M., Mitchell K., Lin Y., Rogers E., Grunmann P., Koren V., et al. (2003). Implementation of Noah land surface model advances in the National Centers for Environmental Prediction operational mesoscale Eta model. J. Geophysical Research: Atmospheres 108 (D22). doi: 10.1029/2002JD003296
Gao J., Hou L., Liu Y., Shi H. (2024). Influences of bragg reflection on harbor resonance triggered by irregular wave groups. Ocean Eng. 305, 117941. doi: 10.1016/j.oceaneng.2024.117941
Gao J., Ma X., Dong G., Chen H., Liu Q., Zang J. (2021). Investigation on the effects of Bragg reflection on harbor oscillations. Coastal Eng. 170, 103977. doi: 10.1016/j.coastaleng.2021.103977
Gao J., Shi H., Zang J., Liu Y. (2023). Mechanism analysis on the mitigation of harbor resonance by periodic undulating topography. Ocean Eng. 281, 114923. doi: 10.1016/j.oceaneng.2023.114923
Gao Y., Wang H., Liu G., Sun X., Fei X., Wang P., et al. (2014). Risk assessment of tropical storm surges for coastal regions of China. J. Geophysical Research: Atmospheres. 119, 5364–5374. doi: 10.1002/2013JD021268
Hong S. Y. (2010). A new stab le boundary-layer mixing scheme and its impact on the simulated East Asian summer monsoon. Q. J. R. Meteorological Society. 136, 1481–1496. doi: 10.1002/qj.665
Hong S.-Y., Dudhia J., Chen S.-H. (2004). A revised approach to ice microphysical processes for the bulk parameterization of clouds and precipitation. Monthly weather review. 132, 103–120. doi: 10.1175/1520-0493(2004)132<0103:ARATIM>2.0.CO;2
Hong S.-Y., Lim J.-O. J. (2006). The WRF single-moment 6-class microphysics scheme (WSM6). Asia-Pacific J. Atmospheric Sci. 42, 129–151.
Hong S.-Y., Noh Y., Dudhia J. (2006). A new vertical diffusion package with an explicit treatment of entrainment processes. Monthly weather review. 134, 2318–2341. doi: 10.1175/MWR3199.1
Huang M., Wang Q., Liu M., Lin N., Wang Y., Jing R., et al. (2022). Increasing typhoon impact and economic losses due to anthropogenic warming in Southeast China. Sci. Rep. 12, 14048. doi: 10.1038/s41598-022-17323-8
Jiménez P. A., Dudhia J., González-Rouco J. F., Navarro J., Montávez J. P., García-Bustamante E. (2012). A revised scheme for the WRF surface layer formulation. Monthly weather review. 140, 898–918. doi: 10.1175/MWR-D-11-00056.1
Kain J. S. (2004). The Kain–Fritsch convective parameterization: an update. J. Appl. meteorology. 43, 170–181. doi: 10.1175/1520-0450(2004)043<0170:TKCPAU>2.0.CO;2
Lan Y., Sun D., Leng H., Song J., Cao X., Dong R. (2022). A new sea surface roughness parameterization and its application in tropical cyclone modeling. J. Geophysical Research: Atmospheres 127, e2022JD037159. doi: 10.1029/2022JD037159
Larson J., Jacob R., Ong E. (2005). The model coupling toolkit: A new Fortran90 toolkit for building multiphysics parallel coupled models. Int. J. High Performance Computing Applications. 19, 277–292. doi: 10.1177/1094342005056115
Lei F., Dai H., Shang S., He Z., Yang S. (2023). Analysis of the dynamic mechanisms of upwelling in deep ocean water caused by typhoons. Ocean Dynamics. 73, 517–529. doi: 10.1007/s10236-023-01563-x
Li S., Chen C. (2022). Air-sea interaction processes during hurricane Sandy: Coupled WRF-FVCOM model simulations. Prog. Oceanography 206, 102855. doi: 10.1016/j.pocean.2022.102855
Li W., Ke S., Wang B., Zhu T., Ren H., Qian K. (2025). Slamming load and hydroelastic response of marine very large floating structures under coupled typhoon-wave-current action. Ocean Eng. 319, 120264. doi: 10.1016/j.oceaneng.2024.120264
Li Y., Peng S., Wang J., Yan J. (2014). Impacts of nonbreaking wave-stirring-induced mixing on the upper ocean thermal structure and typhoon intensity in the South China Sea. J. Geophysical Research: Oceans. 119, 5052–5070. doi: 10.1002/2014JC009956
Lin S., Zhang W. Z., Wang Y., Chai F. (2023). Mechanism of oceanic eddies in modulating the sea surface temperature response to a strong typhoon in the western North Pacific. Front. Marine Sci. 10, 1117301. doi: 10.3389/fmars.2023.1117301
Liu J., Cai S., Wang S. (2011). Observations of strong near-bottom current after the passage of Typhoon Pabuk in the South China Sea. J. Marine Systems. 87, 102–108. doi: 10.1016/j.jmarsys.2011.02.023
Liu B., Guan C., Xie L.A., Zhao D. (2012). An investigation of the effects of wave state and sea spray on an idealized typhoon using an air-sea coupled modeling system. Adv. Atmospheric Sci. 29, 391–406. doi: 10.1007/s00376-011-1059-7
Liu Z., Xu J., Zhu B., Sun Z., Zhang L. (2007). The upper ocean response to tropical cyclones in the northwestern Pacific analyzed with Argo data. Chin. J. Oceanol. Limnol. 25, 123–131. doi: 10.1007/s00343-007-0123-8
Liu J., Zhang H., Zhong R., Han B., Wu R. (2022). Impacts of wave feedbacks and planetary boundary layer parameterization schemes on air-sea coupled simulations: A case study for Typhoon Maria in 2018. Atmospheric Res. 278, 106344. doi: 10.1016/j.atmosres.2022.106344
Lou L., Li X. (2016). Radiative effects on torrential rainfall during the landfall of Typhoon Fitow, (2013). Adv. Atmospheric Sci. 33, 101–109. doi: 10.1007/s00376-015-5139-y
Mei W., Xie S.-P., Primeau F., McWilliams J. C., Pasquero C. (2015). Northwestern Pacific typhoon intensity controlled by changes in ocean temperatures. Sci. advances. 1, e1500014. doi: 10.1126/sciadv.1500014
Mellor G., Blumberg A. (2004). Wave breaking and ocean surface layer thermal response. J. Phys. oceanography. 34, 693–698. doi: 10.1175/2517.1
Mellor G. L., Yamada T. (1982). Development of a turbulence closure model for geophysical fluid problems. Rev. Geophysics. 20, 851–875. doi: 10.1029/RG020i004p00851
Mlawer E. J., Taubman S. J., Brown P. D., Iacono M. J., Clough S. A. (1997). Radiative transfer for inhomogeneous atmospheres: RRTM, a validated correlated-k model for the longwave. J. Geophysical Research: Atmospheres. 102, 16663–16682. doi: 10.1029/97JD00237
Pan J., Huang L., Devlin A. T., Lin H. (2018). Quantification of typhoon-induced phytoplankton blooms using satellite multi-sensor data. Remote Sens. 10, 318. doi: 10.3390/rs10020318
Price J. F. (1981). Upper ocean response to a hurricane. J. Phys. Oceanography. 11, 153–175. doi: 10.1175/1520-0485(1981)011<0153:UORTAH>2.0.CO;2
Pun I.-F., Lin I.-I., Lien C.-C., Wu C.-C. (2018). Influence of the size of Supertyphoon Megi, (2010) on SST cooling. Monthly Weather Review. 146, 661–677. doi: 10.1175/MWR-D-17-0044.1
Shchepetkin A. F., McWilliams J. C. (2005). The regional oceanic modeling system (ROMS): a split-explicit, free-surface, topography-following-coordinate oceanic model. Ocean modelling. 9, 347–404. doi: 10.1016/j.ocemod.2004.08.002
Shen L.-Z., Wu C.-C., Judt F. (2021). The role of surface heat fluxes on the size of Typhoon Megi, (2016). J. Atmospheric Sci. 78, 1075–1093. doi: 10.1175/JAS-D-20-0141.1
Skamarock W. C., Klemp J. B., Dudhia J., Gill D. O., Liu Z., Berner J., et al. (2019). A description of the advanced research WRF version 4. National Center for Atmospheric Research: Boulder, CO, USA. 145 (145), 550.
Sun Y., Wang K., Zhong X., Zhou Z., Ren Z., Zhang J. (2021). Assess the typhoon-driven extreme wave conditions in manila bay through numerical simulation and statistical analysis. Appl. Ocean Res. 109, 102565. doi: 10.1016/j.apor.2021.102565
Tsou C.-H., Pei-Yu H., Tu C.-Y., Cheng-Ta C., Tzeng T.-P., Cheng C.-T. (2016). Present simulation and future typhoon activity projection over western North Pacific and Taiwan/east coast of China in 20-km HiRAM climate model. TAO: Terrestrial Atmospheric Oceanic Sci. 27, 6. doi: 10.3319/TAO.2016.06.13.04
Tsuboki K., Yoshioka M. K., Shinoda T., Kato M., Kanada S., Kitoh A. (2015). Future increase of supertyphoon intensity associated with climate change. Geophysical Res. Letters. 42, 646–652. doi: 10.1002/2014GL061793
Wada A., Uehara T., Ishizaki S. (2014). Typhoon-induced sea surface cooling during the 2011 and 2012 typhoon seasons: Observational evidence and numerical investigations of the sea surface cooling effect using typhoon simulations. Prog. Earth Planetary Sci. 1, 1–25. doi: 10.1186/2197-4284-1-11
Wang C., Li X., Zheng G. (2024). Tropical cyclone intensity forecasting using model knowledge guided deep learning model. Environ. Res. Lett. 19, 024006. doi: 10.1088/1748-9326/ad1bde
Wang J., Mo D., Hou Y., Li S., Li J., Du M., et al. (2022). The impact of typhoon intensity on wave height and storm surge in the northern East China sea: a comparative case study of typhoon muifa and typhoon lekima. J. Marine Sci. Eng. 10, 192. doi: 10.3390/jmse10020192
Warner J. C., Armstrong B., He R., Zambon J. B. (2010). Development of a coupled ocean–atmosphere–wave–sediment transport (COAWST) modeling system. Ocean modelling. 35, 230–244. doi: 10.1016/j.ocemod.2010.07.010
Wei K., Shang D., Zhong X. (2023). Integrated approach for estimating extreme hydrodynamic loads on elevated pile cap foundation using environmental contour of simulated typhoon wave, current, and surge conditions. J. Offshore Mechanics Arctic Eng. 145, 021702. doi: 10.1115/1.4056037
Wu Z., Chen J., Jiang C., Liu X., Deng B., Qu K., et al. (2020). Numerical investigation of Typhoon Kai-tak, (1213) using a mesoscale coupled WRF-ROMS model—Part II: Wave effects. Ocean Eng. 196, 106805. doi: 10.1016/j.oceaneng.2019.106805
Wu Z., Chen J., Jiang C., Deng B. (2021). Simulation of extreme waves using coupled atmosphere-wave modeling system over the South China Sea. Ocean Eng. 221, 108531. doi: 10.1016/j.oceaneng.2020.108531
Wu Z., Gao K., Chen J., Zhang H.-J., Deng B., Jiang C.-B., et al. (2024). Typhoon-induced ocean waves and stokes drift: A case study of Typhoon Mangkhut. China Ocean Eng. 38, 711–724. doi: 10.1007/s13344-024-0056-4
Wu Z., Jiang C., Conde M., Deng B., Chen J. (2019c). Hybrid improved empirical mode decomposition and BP neural network model for the prediction of sea surface temperature. Ocean Sci. 15, 349–360. doi: 10.5194/os-15-349-2019
Wu Z., Jiang C., Deng B., Chen J., Long Y., Qu K., et al. (2019a). Numerical investigation of Typhoon Kai-tak, (1213) using a mesoscale coupled WRF-ROMS model. Ocean Eng. 175, 1–15. doi: 10.1016/j.oceaneng.2019.01.053
Wu Z., Jiang C., Deng B., Chen J., Liu X. (2019b). Sensitivity of WRF simulated typhoon track and intensity over the South China Sea to horizontal and vertical resolutions. Acta Oceanologica Sin. 38, 74–83. doi: 10.1007/s13131-019-1459-z
Yang L., Cheng X., Huang X., Fei J., Li X. (2020). Effects of air-sea interaction on the eyewall replacement cycle of Typhoon Sinlak): Verification of numerical simulation. Earth Space Sci. 7, e2019EA000763. doi: 10.1029/2019EA000763
Yang Q., Liu Y., Wu S., Yu M., Xie J., Xue X. (2024). Super typhoon impact on the dynamic behavior of floating offshore wind turbine drivetrains: A comprehensive study. Ocean Eng. 312, 119084. doi: 10.1016/j.oceaneng.2024.119084
Yap W., Lee Y., Gouramanis C., Switzer A. D., Yu F., Lau A. Y. A., et al. (2015). A historical typhoon database for the southern and eastern Chinese coastal region to 2012. Ocean Coastal Management. 108, 109–115. doi: 10.1016/j.ocecoaman.2014.05.024
Yin J., Lin N., Yang Y., Pringle W. J., Tan J., Westerink J. J., et al. (2021). Hazard assessment for typhoon-induced coastal flooding and inundation in Shanghai, China. J. Geophysical Research: Oceans 126, e2021JC017319. doi: 10.1029/2021JC017319
Yin J., Yin Z., Xu S. (2013). Composite risk assessment of typhoon-induced disaster for China’s coastal area. Natural hazards. 69, 1423–1434. doi: 10.1007/s11069-013-0755-2
Zhang Z., Wang Y., Zhang W., Xu J. (2019). Coastal ocean response and its feedback to Typhoon Hato, (2017) over the South China Sea: A numerical study. J. Geophysical Research: Atmospheres. 124, 13731–13749. doi: 10.1029/2019JD031377
Zhang A., Yu X. (2024). A major improvement of atmospheric wave boundary layer model for storm surge modeling by including effect of wave breaking on air–sea momentum exchange. J. Phys. Oceanography 54, 1153–1168. doi: 10.1175/JPO-D-23-0233.1
Zhao B., Qiao F., Cavaleri L., Wang G., Bertotti L., Liu L. (2017). Sensitivity of typhoon modeling to surface waves and rainfall. J. Geophysical Research: Oceans. 122, 1702–1723. doi: 10.1002/2016JC012262
Keywords: COAWST, super typhoon Mangkhut, spatiotemporal variations, significant wave height, sea surface temperature
Citation: Wu Z, Zou Z, Chen J, Luo H, Deng B, Jiang C, Lv Z and Zhang H (2025) Dynamic and thermodynamic characteristics of ocean response to super typhoon Mangkhut in the South China Sea. Front. Mar. Sci. 12:1586377. doi: 10.3389/fmars.2025.1586377
Received: 02 March 2025; Accepted: 03 April 2025;
Published: 30 April 2025.
Edited by:
Juan Jose Munoz-Perez, University of Cádiz, SpainReviewed by:
Junliang Gao, Jiangsu University of Science and Technology, ChinaMingming Shao, Atlantic Oceanographic and Meteorological Laboratory (NOAA), United States
Copyright © 2025 Wu, Zou, Chen, Luo, Deng, Jiang, Lv and Zhang. This is an open-access article distributed under the terms of the Creative Commons Attribution License (CC BY). The use, distribution or reproduction in other forums is permitted, provided the original author(s) and the copyright owner(s) are credited and that the original publication in this journal is cited, in accordance with accepted academic practice. No use, distribution or reproduction is permitted which does not comply with these terms.
*Correspondence: Zhiyuan Wu, end1QGNzdXN0LmVkdS5jbg==; Jie Chen, Y2hlbmppZTE2NkAxNjMuY29t