 Eric Mortenson1,2*
 Andrew Lenton1
 Elizabeth H. Shadwick1,3
 Thomas W. Trull1
 Matthew A. Chamberlain1
 Ramkrushnbhai Patel4,5
 Xuebin Zhang1
 Rik Wanninkhof6
- 1Oceans and Atmosphere, Commonwealth Scientific and Industrial Research Organisation (CSIRO), Hobart, TAS, Australia
- 2Cooperative Institute for Marine and Atmospheric Studies (CIMAS), University of Miami, Miami, FL, United States
- 3Australian Antarctic Program Partnership (AAPP), University of Tasmania, Hobart, TAS, Australia
- 4Institute for Marine and Antarctic Studies (IMAS), University of Tasmania, Hobart, TAS, Australia
- 5Australian Research Council Centre of Excellence for Climate Extremes (Clex), University of Tasmania, Hobart, TAS, Australia
- 6National Oceanic and Atmospheric Administration, Atlantic Oceanographic and Meteorological Laboratory (NOAA-AOML), Miami, FL, United States
The Southern Ocean plays a key role in removing anthropogenic carbon dioxide (CO2) from the atmosphere, accounting for a quarter of the global ocean uptake during the Anthropocene period. Here we show, using a high-resolution ocean model under high-emission forcing (RCP8.5), that the Southern Ocean contribution to the global ocean CO2 sink increases from 40 to 50% by 2100. This increase is accompanied by a robust poleward shift in the ocean CO2 sink. Specifically, regions north and south of the maximum zonal wind stress (located between 50-55°S) exhibit distinct carbon-uptake trajectories. The southern region (poleward of 55°S) exhibits a near-linear increase in annual carbon uptake, from near 0 to 0.75 Pg C yr-1 over the century. In contrast, the northern region (35-50°S) carbon uptake increases over the 1st half of the century, from 0.8 to 1.2 Pg C yr-1, but stagnates afterward. Our analysis indicates that the former is due to the high turnover rate (upwelling followed by subduction) of the Circumpolar Deep Water, which becomes increasingly undersaturated relative to atmospheric CO2, while the latter is due to weakening carbon solubility after the mid-21st century. Finally, the resolution in this study allows for the representation of mesoscale eddies. Eddy activity is generally enhanced along with the poleward shift in the zonal wind forcing, but its net impact on the air-sea exchange of carbon appears to be minimal.
1 Introduction
The global oceans serve as a major sink of anthropogenic carbon dioxide, with more than a quarter of the CO2 produced through human activity estimated to have gone into the oceans (Friedlingstein et al., 2025; DeVries et al., 2023; Khatiwala et al., 2013; Takahashi et al., 2009). The Southern Ocean defined as the region south of 30° S accounts for a disproportionately large fraction of this global ocean anthropogenic carbon sink, responsible for ~40% of the total despite making up only 30% of the global ocean area (Frölicher et al., 2015). However, this contribution has been difficult to quantify, in part due to lack of observations, with large uncertainties both spatially and temporally. The Southern Ocean has exhibited substantial interdecadal variability in air-sea carbon exchange overlying the longer-term trend, with a lower-than-expected increase in uptake through most of the 1990’s (Le Quéré et al., 2007) and a higher-than-expected increase in uptake through most of the 2000’s, when compared to the predicted change in uptake based on increases in atmospheric CO2 over the time period (Landschützer et al., 2016). The Southern Ocean is also spatially heterogeneous, with pronounced meridional gradients in carbon uptake across its extent (Frölicher et al., 2015) as well as local hotspots resulting from interactions between dynamics and topography (Sallée et al., 2012; Rintoul, 2018).
The Southern Ocean has complex dynamics that influence its impact on atmospheric CO2 and climate in general. Here we describe two of these dynamic features and how they facilitate air-sea exchange of CO2 in the region. Firstly, the unique circumpolar nature of the Southern Ocean, coupled with strong westerly winds, allows the globally dominant Antarctic Circumpolar Current (ACC) to form. The ACC has strong north-south biogeochemical gradients (Chapman et al., 2020) and its interaction with topography produces local hotspots of ocean mixing and biological activity. Secondly, the Southern Ocean hosts an extensive meridional overturning circulation, with upwelling of carbon-rich Circumpolar Deep Water (CDW). This upwelled CDW divides into northward- and southward-flowing branches near the surface. The ventilation of the southern branch of CDW facilitates air-sea exchange of carbon from the deep ocean interior in the southern outcropping region (Morrison et al., 2022) which was last exposed to the atmosphere more than 400 years ago (DeVries and Primeau, 2011) (i.e., before the Industrial era). It is generally supersaturated relative to both historical and present-day atmospheric pCO2 levels. The supersaturation is due, in part, to remineralization of organic matter, i.e. the biological pump (Iversen, 2023). This leads to sea-to-air outgassing of CO2 from the region, as seen in observations (Gray et al., 2018; Chen et al., 2022). As the southern branch of upwelled CDW travels south it loses buoyancy through heat loss and brine rejection during sea-ice formation and sinks to form Antarctic Bottom Water (AABW) (Morrison et al., 2022; Marshall and Speer, 2012). The other branch of the upwelled CDW travels northward via wind-forcing (Mazloff et al., 2013), and supplies nutrients that fuel biological primary production (PP) that drives sea-surface pCO2 undersaturation relative to the atmosphere (Shadwick et al., 2015a, 2015b, Takahashi et al., 2012). This northern branch of upwelled CDW accounts for most of the present-day Southern Ocean’s air-to-sea uptake of anthropogenic carbon, roughly centered around 40°S, which is then subducted into the interior as Subantarctic Mode Water and Antarctic Intermediate Water (Morrison et al., 2022).
This study builds on the work of Langlais et al. (2017), which analysed the Southern Ocean under historical forcing with a model resolution capable of representing mesoscale processes. This work was extended to assess global changes over the 21st century under a high emission scenario (RCP8.5)-forced projection experiment as described in Mortenson et al., 2021. Here we focus on how the Southern Ocean carbon sink will evolve over the 21st century under this scenario. Our high-resolution simulation helps to assess where the changes are most pronounced and the processes that drive them.
Earlier work has quantified the key drivers of air-sea carbon exchange in the Southern Ocean, e.g., Lauderdale et al., 2016. This work goes beyond a steady-state assessment by addressing the changing Southern Ocean carbon sink and identifying the mechanisms driving these changes. Although other recent work has also focused on changes to the Southern Ocean carbon sink (e.g., Mongwe et al., 2023; Roy et al., 2021; Lovenduski and Ito, 2009), this is the first study to analyse the changes in Southern Ocean carbon uptake over the 21st century with a resolution capable of representing mesoscale processes. This is important because of the high levels of (mesoscale) eddy kinetic energy in the region, and their roles in localizing vertical transports of CO2 (Sallée et al., 2012) and possibly buffering changes to air-sea interactions in the Southern Ocean (Farneti et al., 2010).
The overarching objective of this study is to quantify the evolution of the Southern Ocean contribution to total global ocean carbon uptake in the extreme-case (RCP8.5) scenario over the 21st century. We analyze the projected ocean uptake for the region from a large-scale perspective encompassing the entire Southern Ocean, from a zonally-averaged meridional perspective, and finally through local effects. We discuss how the change in uptake evolves between the first and latter halves of the century.
2 Methodology
2.1 Model description and experimental setup
We utilize the high-resolution (0.1°) configuration of the Modular Ocean Model (MOM; Griffies et al., 2009) version 4.1, incorporating biogeochemistry through the World Ocean Model of Biology and Trophic Dynamics (WOMBAT; Oke et al., 2013). This ocean biogeochemical model setup is called the Ocean Forecasting Australia Model, version 3 (OFAM3), and is used in multiple studies, including an evaluation of ocean physical and biogeochemical properties in comparison to observations (Oke et al., 2013), an analysis of global and regional ocean heat and carbon uptake (Mortenson et al., 2021), and analysis of projected marine heat waves (Hayashida et al., 2020). To run the high-resolution model incorporating BGC tracers and using 1000 CPU’s takes approximately one day per model year (roughly double the time of the physics-only configuration) and produces about 3.2 TB of model output (roughly triple that of the physics-only configuration) per year.
An initial study analysed OFAM3 through comparisons to various physical observables (e.g., mixed layer depth, volume transport, SST seasonality) as well as regional phytoplankton blooms (Oke et al., 2013). After a 30-year, repeat annual (1979) atmospheric forcing, a hindcast experiment spanning the period 1979-2014, described in Langlais et al. (2017), includes two ocean carbon tracers: a “natural” tracer with the ocean exposed to a constant atmospheric pCO2 of 280 ppm, and a “rising” carbon tracer with an ocean exposed to rising atmospheric pCO2. The future RCP8.5 scenario experiment branches off the historical experiment at the end of 2005 and is integrated over the 21st century with a physical forcing based on the Japanese 55-year reanalysis product (JRA55; Kobayashi et al., 2015) in combination with RCP8.5 forcing derived from an ensemble of 17 CMIP5 model outputs (Zhang et al., 2017).
The two carbon tracers effectively represent two experiments that provide a way to separate the effects on air-sea CO2 exchange due to physical forcing (e.g., changing air-sea heat, moisture, and momentum fluxes) alone, and in combination with a rising atmospheric pCO2. These are referred to throughout this study as:
1. RCP8.5 run: both RCP8.5 physical forcing and rising atmospheric pCO2, and
2. C-control run: RCP8.5 physical forcing but with a constant atmospheric pCO2.
3 Results
We begin this section by quantifying the integrated Southern Ocean contribution relative to the total (global) ocean uptake of carbon at the beginning and end of the century. We then analyse the zonal mean carbon uptake over the century and use this to introduce two distinct Southern Ocean regions for further analysis. Finally, we examine spatial maps of carbon uptake as decadal-means and changes over the century, and compare these to maps of other relevant processes that contribute to local variability in trends in the carbon uptake in the Southern Ocean over the century. As described in the previous section, our analysis includes comparisons between a RCP8.5 run (in which CO2 rises and ocean physics respond) and a C-Control run (in which ocean physics are the same as the RCP8.5 run, but the atmospheric CO2 level does not increase).
3.1 Southern Ocean contribution to the global ocean carbon sink
Over the century, global ocean uptake of carbon in the RCP8.5 run increases from 2.5 Pg C yr-1 in the decadal mean of the 2010’s to 4.0 Pg C yr-1 by the 2090’s (Table 1). Regionally, the carbon uptake integrated over the Southern Ocean south of 35°S doubles from 1.0 Pg C yr-1 to 2.0 Pg C yr-1. This Southern Ocean contribution represents an increase from 40% of the global annual uptake at the beginning of the century to 50% by the end of the century. The Southern Ocean’s influence on the global ocean carbon uptake is more pronounced when looking at the changes in uptake over the century. The change in the Southern Ocean carbon uptake from the 2010’s to 2090’s (an increase of 1 Pg C yr-1 between the two decadal means) accounts for two thirds of the global increase. These results underscore the importance of understanding how the Southern Ocean carbon uptake will evolve.
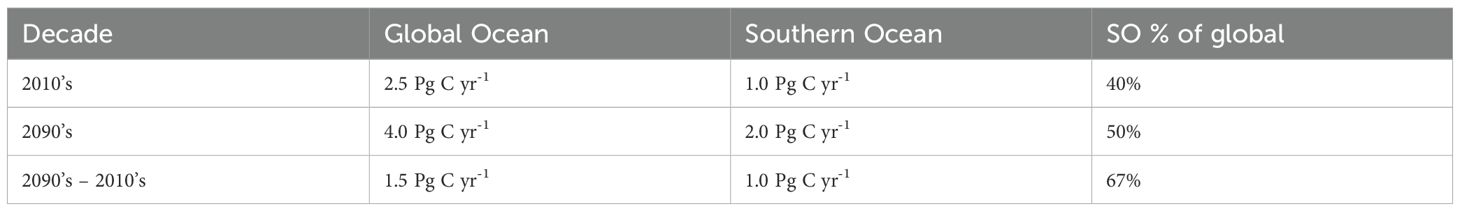
Table 1. Global and Southern Ocean mean annual uptake, as well as the Southern Ocean contribution to the global carbon sink, for the 2010’s and 2090’s and the difference between the decades.
3.2 Meridional and regional-scale perspectives
Gradients of most oceanographic properties across the Southern Ocean sea surface are strongest in the meridional direction (with the exception of those driven by smaller-scale flows such as mesoscale eddies). We therefore present regional-scale analysis of the Southern Ocean carbon uptake over the century through a meridional perspective. Hovmöller plots of zonally- and annually-averaged ocean carbon uptake from 2010 to 2100 (Figure 1) show how it changes over the century in the RCP8.5 and C-Control runs, along with the latitude of maximum zonally-averaged annual mean westerly wind stress (black lines, Figure 1). By construction, the physics in the two runs is identical, so the maximum zonal wind stress is the same for each. The location of the maximum zonal wind stress is closely aligned with the change in the sign of the wind-stress curl, which separates regions of Ekman divergence upwelling to its south from convergence and downwelling to its north. Note that the maximum zonal wind stress moves slightly poleward over the century, but stays within 50-55°S. We use these bounds to distinguish between two regions of the Southern Ocean, defined as the northern (35 to 50°S) and southern (south of 55°S) regions, which exhibit distinct evolutions in carbon uptake over the century, as discussed below.
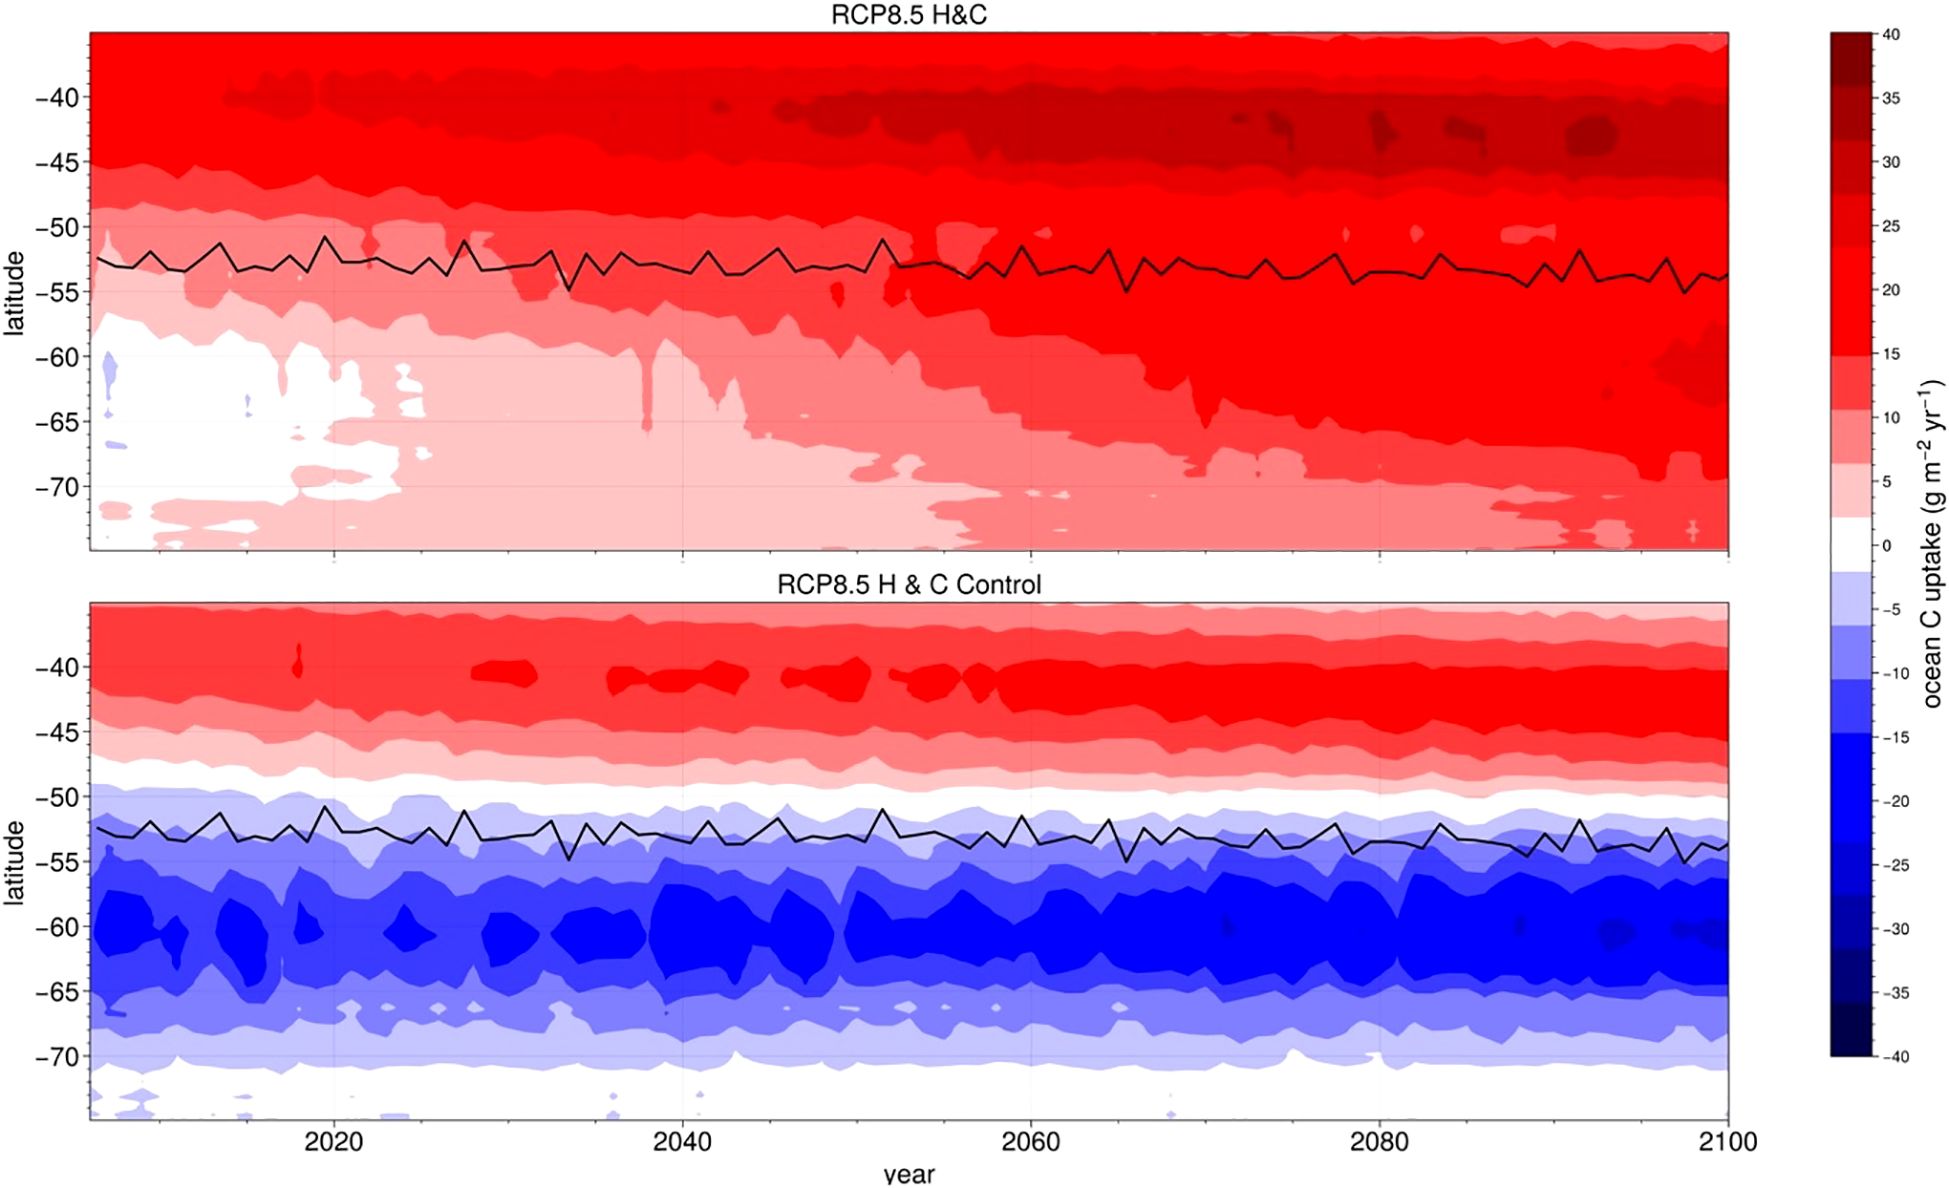
Figure 1. Hovmüller plots of zonal- and annual-mean carbon uptake (positive indicates into the ocean) in g C m-2y-1 in the experiment where atmospheric heat (H) and CO2atm (C) increase according to RCP8.5 scenario (“RCP8.5”; top) and the run with heat increases as in RCP8.5 but CO2atm is kept constant (“C-control”; bottom) from 2010 to 2100. Black lines indicate latitude of maximum zonal wind stress.
In the RCP8.5 experiment (Figure 1, upper panel), the zonally-averaged Southern Ocean shows increased carbon uptake over the century at all latitudes due to rising atmospheric pCO2. The maximum uptake of carbon is centered at 40°S at the beginning and moves southward to 43°S by the end of the century, coincident with the southward track of the maximum zonal wind stress. The C-Control experiment (Figure 1, lower panel) provides information about how the Southern Ocean carbon uptake would change due to physical changes alone. Note that the carbon uptake in the two runs is not the same at the beginning of analysis in 2010 because the atmospheric pCO2 between the two runs begins diverging in 1979, at the beginning of the historical simulation. North of the maximum zonal wind stress, ocean carbon uptake in the C-Control run evolves in a qualitatively similar manner as the RCP8.5 run, but with a lower increase in uptake with time. The region south of the maximum wind stress, however, exhibits an increase in outgassing over the century. The trends for the C-Control experiment, despite a constant atmospheric pCO2, can be attributed to changes in Southern Ocean dynamics, namely, an intensification of the Meridional Overturning Circulation (MOC) upper cell, as discussed below. The opposite signs in the C-Control run for the trend in carbon uptake between the two regions (namely, 35-50°S and south of 55°S), lends support for our choice of these regions for analysis.
The MOC is associated with ventilation in the Southern Ocean through surfacing of Circumpolar Deep Water (CDW) and subduction of surface waters into Antarctic Bottom Water (AABW) to the south and Antarctic Intermediate Water and Sub-Antarctic Mode Water to the north. The tilted isopycnals associated with the Southern Ocean allow pre-industrial waters south of the maximum zonal wind stress to reach the surface. The term “pre-industrial”, in this context, refers to waters that have had not been in contact with the atmosphere since the rise in anthropogenic atmospheric pCO2 circa 1750. The region south of the zonal wind stress is associated with outgassing of CO2 at present (Gray et al., 2018), as the ventilated pre-industrial water is still supersaturated relative to atmospheric pCO2 (due to the addition of carbon by remineralization of organic matter after their last contact with, and equilibration to, the atmosphere). The rates of upwelled and subducted water mass transformations have important implications for ocean carbon uptake (Langlais et al., 2017).
We define the upper cell of the MOC in the Southern Ocean as the maximum (in both depth and latitude) of the mean annual meridional overturning circulation south of 40˚S, expressed in depth coordinates, as:
where y represents latitude, x longitude, z depth, and v meridional velocity. In both runs, the MOC exhibits a relatively steady increase throughout the century from 26 to 29 Sv (11% change overall) from the 2010’s to the end of the 21st century due to an increase in the westerly winds over this time period. The increase in MOC provides an explanation for the regional trends in the C-Control run despite the constant atmospheric pCO2. Namely, the increase in outgassing in the southern region is due to an increased surface supply of CDW, which is supersaturated in carbon relative to the atmosphere. The increased uptake in the northern region is due to the same increased surface supply of CDW moving north. This provides more nutrients for primary productivity (PP) which is also enhanced by a warmer ocean in the future (PP is associated with export production, which is projected to increase by about a third for most of the northern region, see Supplementary Figure S1). Note that changes to the PP are identical in both the C-Control and RCP8.5 runs, as it is dependent on physical and biological processes that are independent of the atmospheric pCO2.
Mapping the correlation between the annual mean MOC (for the upper cell, as defined in the above equation) with the carbon uptake over the C-Control run for each grid cell (Figure 2) illustrates the relationship between the changing Southern Ocean carbon uptake and the changes in the MOC. South of the maximum zonal wind stress, trends in carbon uptake are generally anticorrelated to the increasing MOC (reflecting a negative trend in carbon uptake, or an increase in outgassing). To the north of the maximum zonal wind stress, however, the trend in carbon uptake is generally positively correlated to changes in the MOC north of the maximum zonal wind stress, reflecting an increase in carbon uptake with time. The general meridional structure in this map supports the relationship between the changing MOC and the north/south regional differences in carbon uptake in the C-Control run (Figure 1, lower panel). However, there are notable exceptions to this meridional structure evident in Figure 2, including around Drake Passage, the Weddell Sea, and along the Antarctic continental margins from near the Ross Sea to the West Antarctic Peninsula. These are regions where local dynamics, rather than the large scale MOC, may have a more important influence on the carbon uptake.
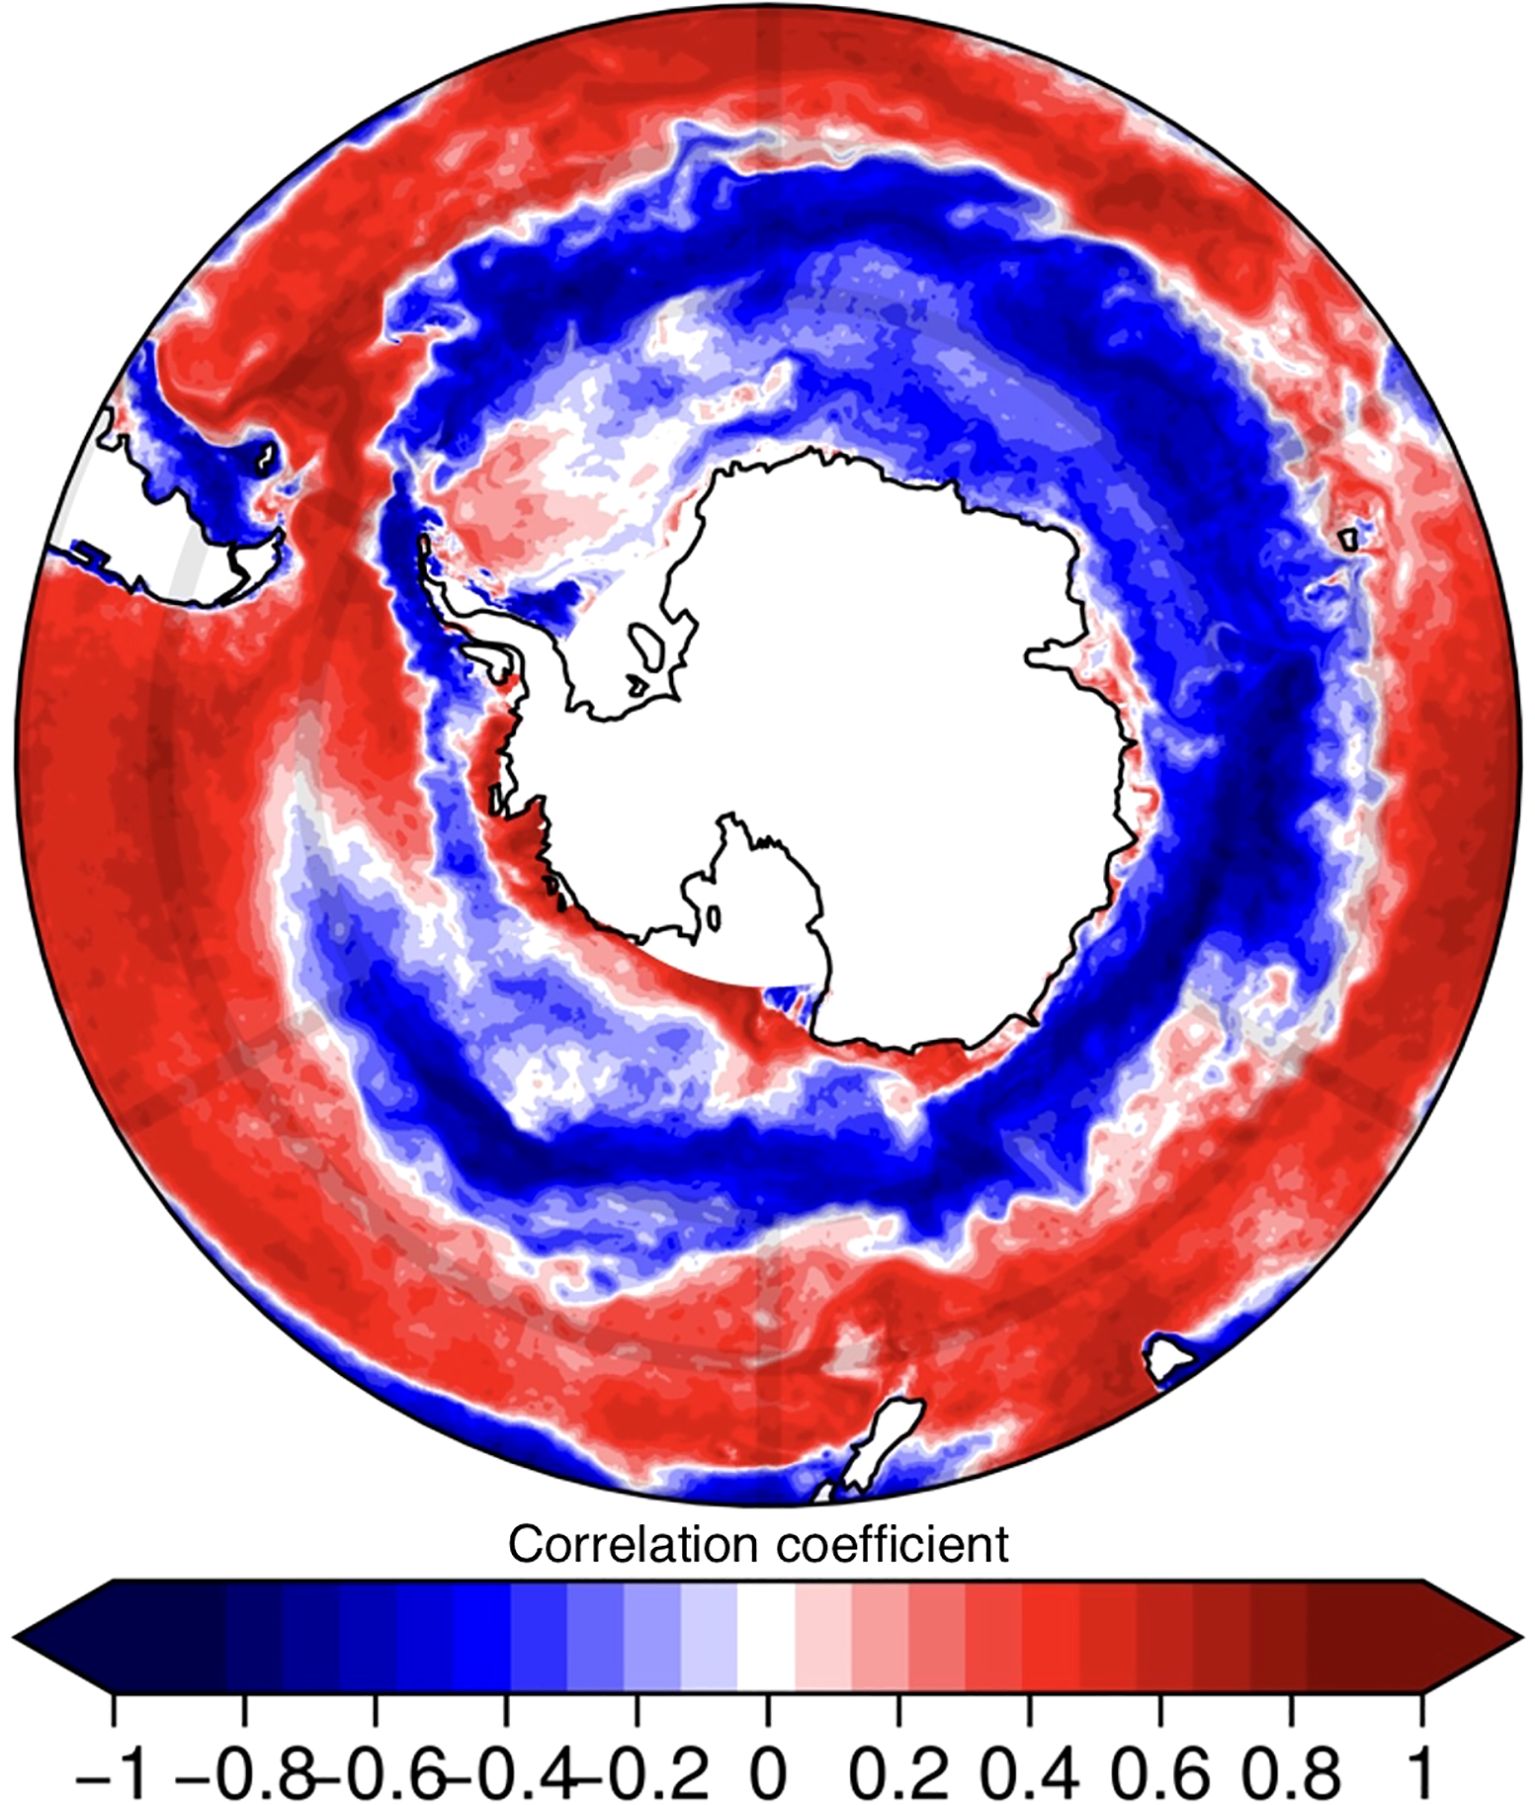
Figure 2. Map of the correlation between changes in upper branch of the MOC in the Southern Ocean (a regional metric) to local changes in ocean carbon uptake (at each grid cell) over the C-Control run.
Returning to the larger scale perspective, the annual regionally-integrated carbon flux is presented in Figure 3a for both the RCP8.5 and C-control runs (solid and dashed lines, respectively) for the northern region (between 35 and 50°S; red) and the southern region (south of 55°S; blue). For the C-Control run, consistent with Figure 1, lower panel, and Figure 2, the southern region has a slight negative trend (i.e., an increase in outgassing) and the northern region an opposing positive trend (increased uptake) of similar magnitude. For the RCP8.5 run, both regions show strong increases in ocean uptake, but with different trajectories by the second half of the century. The southern region shows a near-linear increase over the century, from near 0 to around 0.75 Pg C yr-1. The northern region also increases at about the same rate, from 0.8 to 1.2 Pg C yr-1 from the 2010’s until the 2050’s, but after that it stays relatively constant at around 1.2 Pg C yr-1. The distinct trajectory of the northern region carbon uptake in the RCP8.5 run, namely the steady uptake in the latter half of the century, despite a continuing rise in atmospheric pCO2, is discussed below.
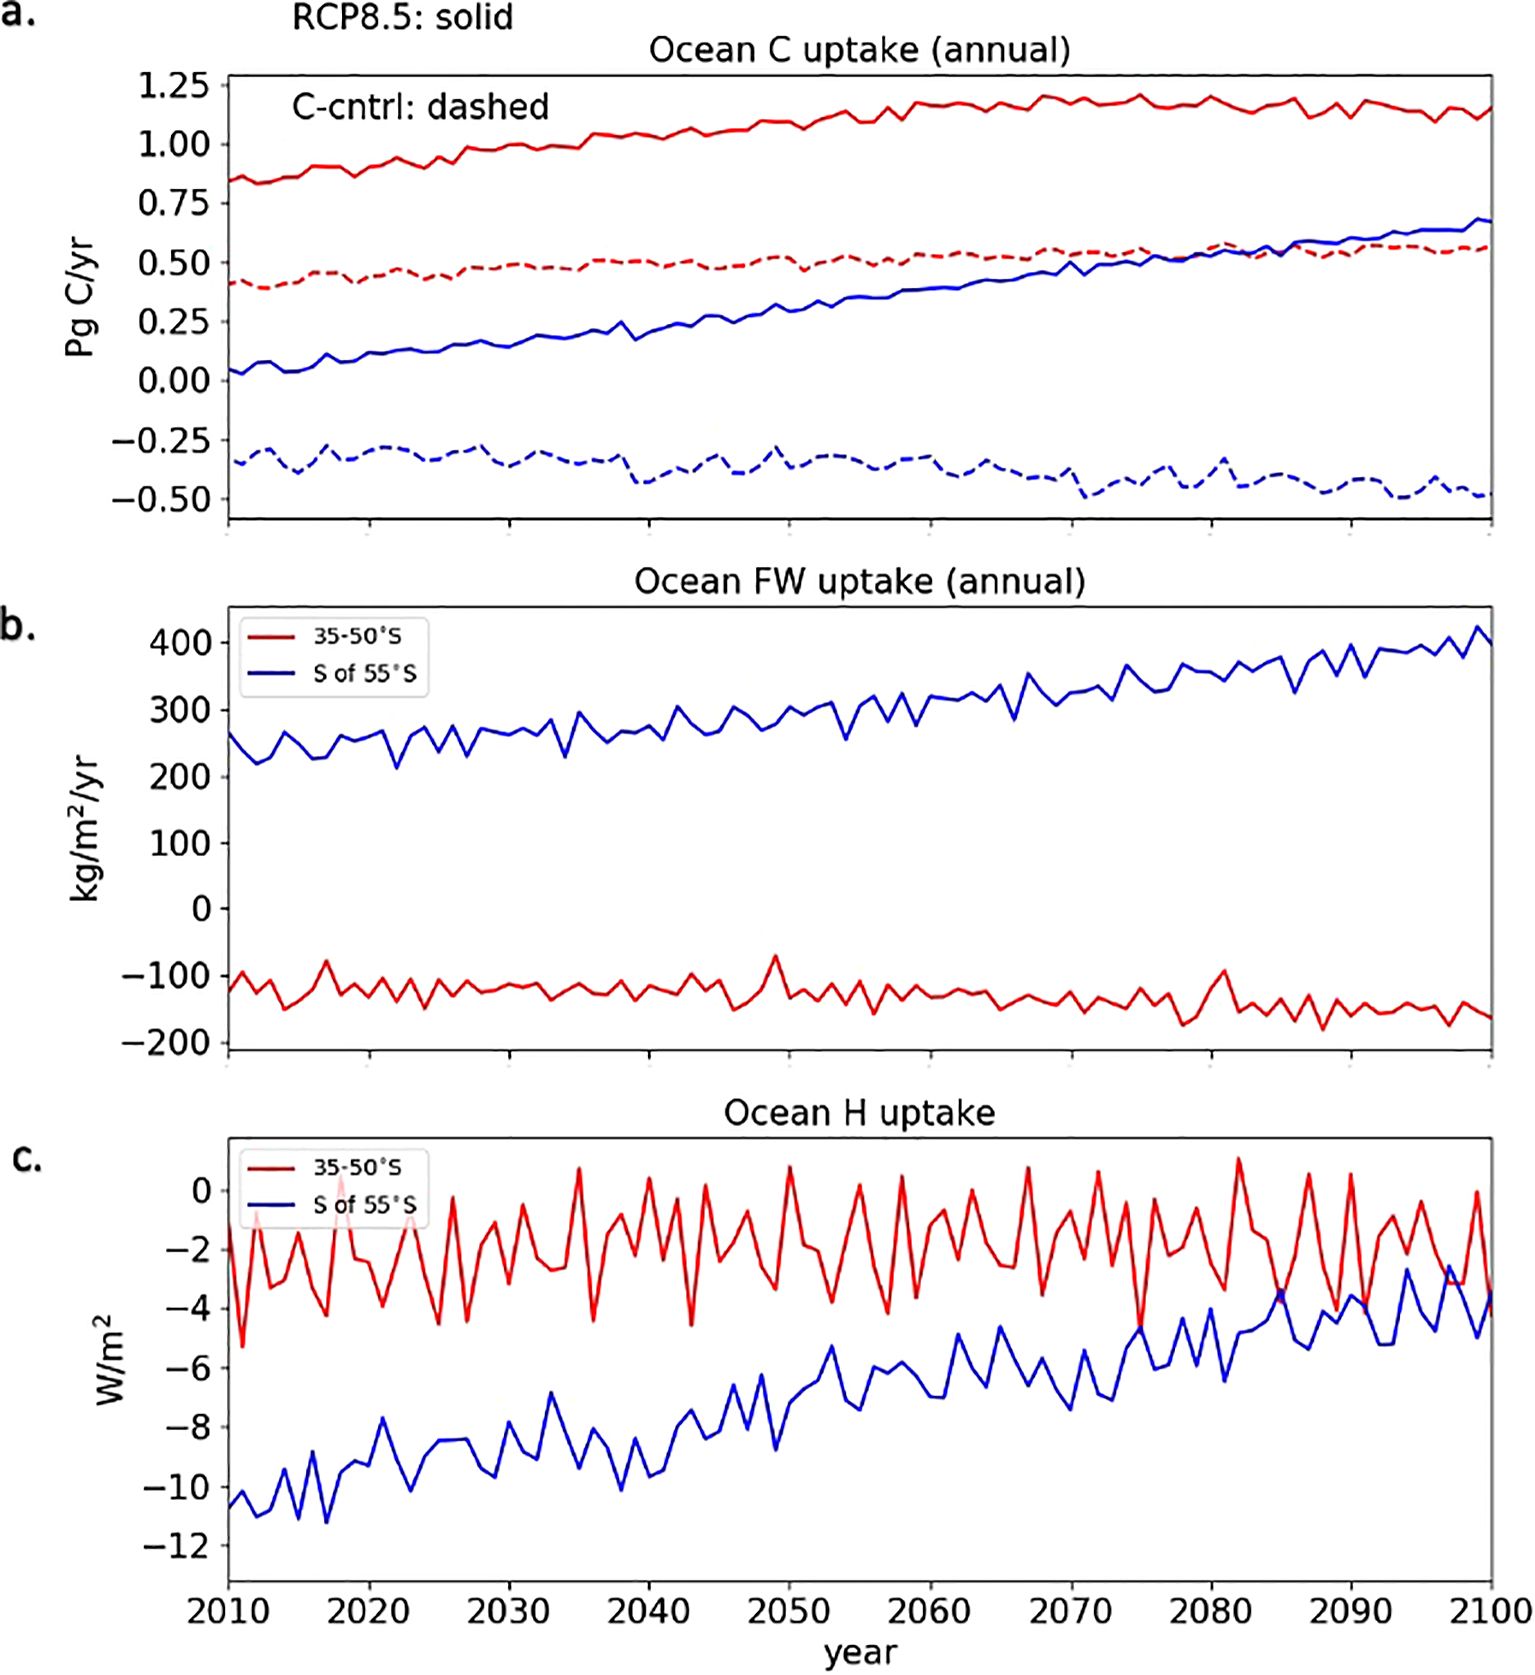
Figure 3. Time series of zonally integrated ocean carbon uptake (positive indicates into the ocean) in the region 35-50°S (red) and south of 55°S (blue) for the RCP8.5 (solid) and C-Control (dashed) experiments (a), of zonal-mean freshwater flux (b), and zonal-mean heat flux (c) for the same regions.
Both the buoyancy forcing due to freshwater and heat uptake (Figures 3b, c) show increases in the region south of the maximum zonal wind stress (blue lines), while remaining relatively constant in the region north of the maximum zonal wind stress (red lines). Waters in the southern region, near the ice shelf where AABW formation occurs, are thus projected to be less dense in the future. However, the increase in carbon uptake (to the north) and outgassing (to the south) in the C-Control run (Figure 3a, dashed lines) imply that the concurrent increase in the magnitude of the zonal wind stress (by about 15%; not shown) and associated momentum flux, has a more pronounced effect on the carbon exchange than do changes to the buoyancy flux.
To illustrate how the processes described above affect carbon pathways in the Southern Ocean for the RCP8.5 run, we present a schematic of the present day, mid-century and end-of-century Southern Ocean in Figure 4. For the present day in the southern region, CDW surfaces and is supersaturated relative to the atmosphere, loses buoyancy and sinks as AABW. To the north, surfaced CDW travels north via Ekman transport and becomes undersaturated due to Bio PP and is then subducted. By mid-century, the increase in MOC, Bio PP, and atmospheric pCO2 all lead to an increase in carbon uptake for the northern region, and the southern region transitions from a modest carbon source to a substantial carbon sink because it becomes undersaturated relative to the higher atmospheric pCO2. By the end of the century, the rate of surfacing CDW accelerates due to a stronger MOC, but becomes further undersaturated relative to the higher atmospheric pCO2 in the future, and the uptake continues to increase linearly with time. To the north, the increased rate of surfacing CDW provides higher nutrients which, along with higher temperature, promotes higher Bio PP as indicated schematically (Figure 3) resulting in increased export production of organic carbon (Supplementary Figure S1). However, the uptake rate in the northern region only accelerates over the first half of the century and levels off by the latter half of the century, despite the continued increase in atmospheric pCO2. The cause of this mid-century change in carbon uptake for the northern region is discussed in the following subsection.
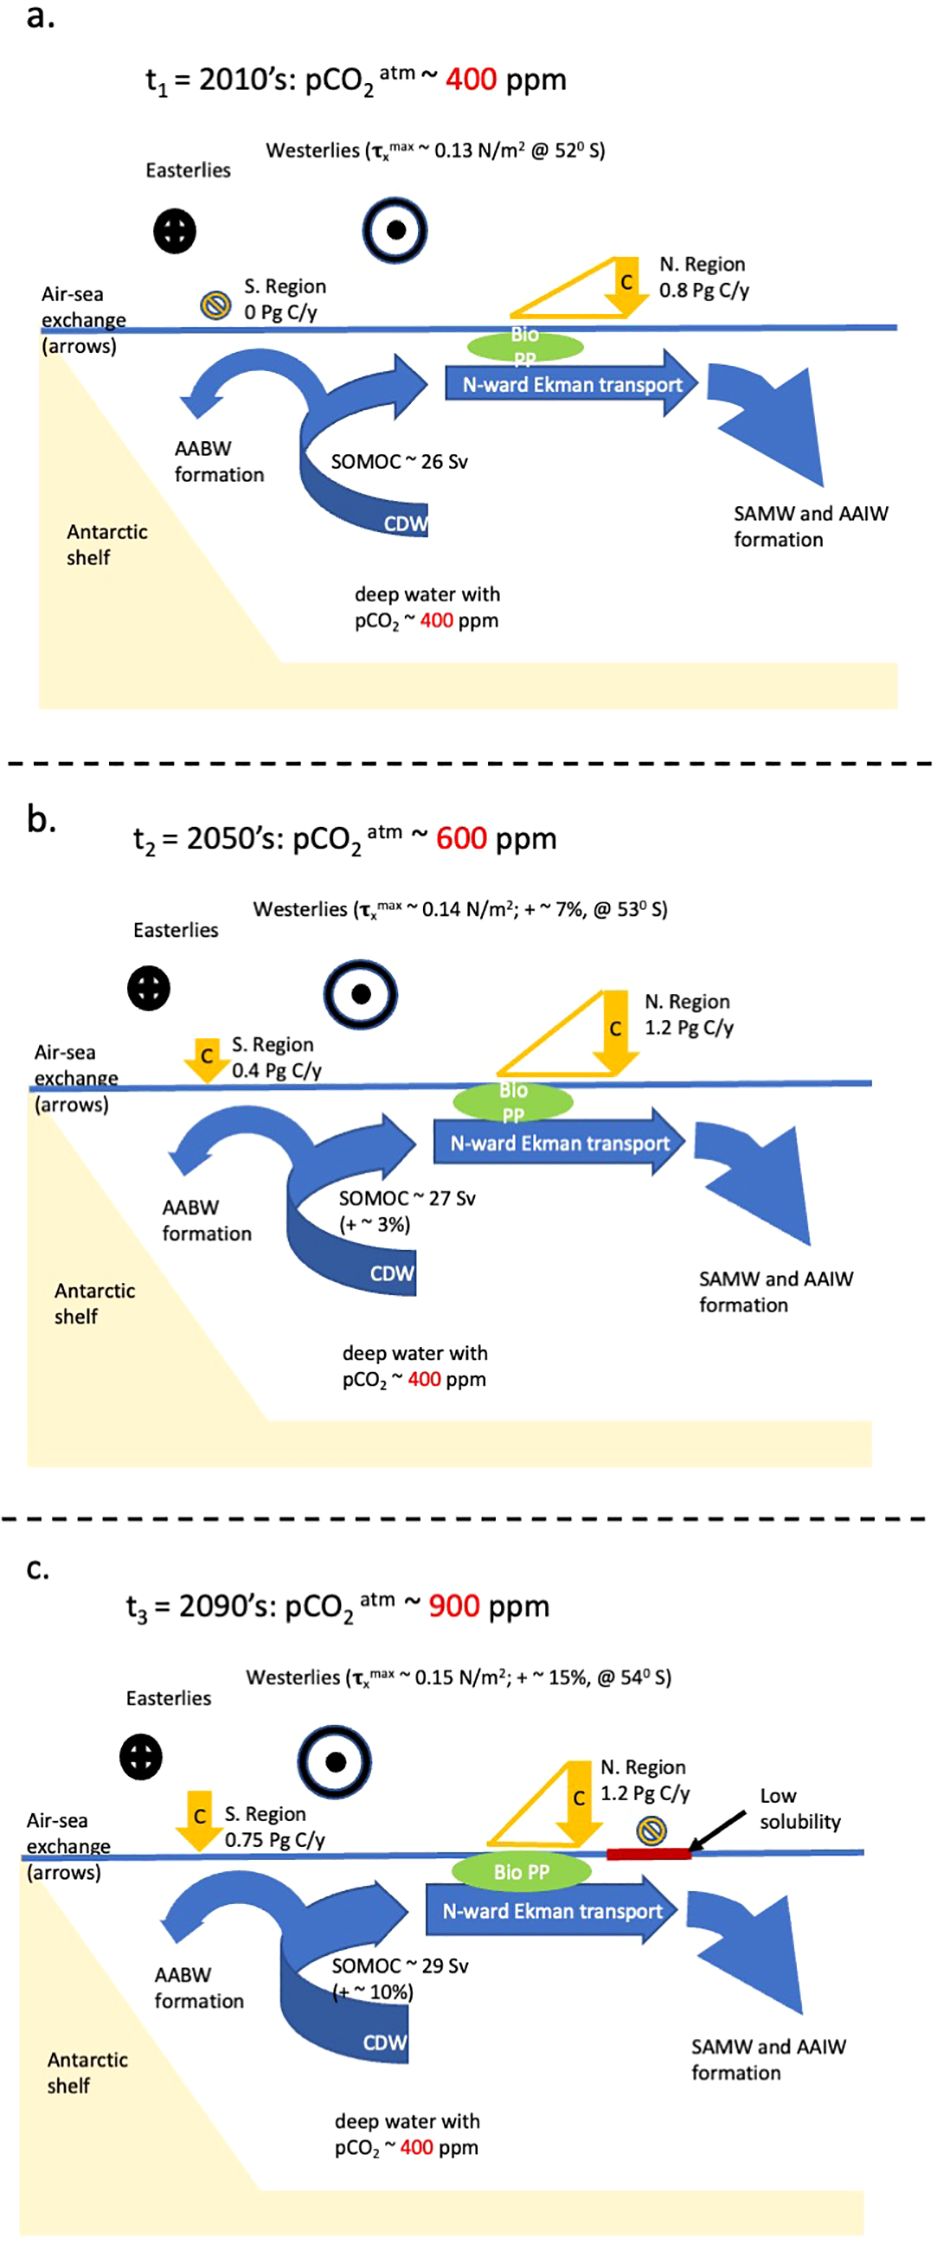
Figure 4. Schematic of the dynamic processes affecting the Southern Ocean air-sea carbon exchange at the beginning (a), middle (b), and end (c) of the 21st century. Upwelling of deep water supplies a reservoir with a relatively constant pCO2 as it reaches the surface, promoting outgassing at the beginning of the century, but increasing uptake by the latter half of the century. The strength of the upwelling associated with the upper branch of the Southern Ocean Meridional Overturning Circulation (SOMOC in the schematic) increases with time.
3.3 Local scale/spatial maps
The processes and the schematic presented above for the entire Southern Ocean and the zonal mean, explain some of the large-scale changes to the Southern Ocean carbon uptake, but they fail to explain the relatively flat trajectory for uptake in the RCP8.5 run in the northern region for the latter half of the century (red solid line, Figure 3, top). In fact, the schematic for the 2090’s implies a continued increase in carbon uptake in the northern region due to increased Bio PP. In order to address this inconsistency, we start by presenting spatial maps of the carbon uptake as decadal means for the 2010’s, 2050’s, and 2090’s for the RCP8.5 run (Figure 5, top), and the difference between each (2050’s minus 2010’s and 2090’s minus 2050’s; Figure 5, bottom). We chose these time periods for the difference plots in order to help explain the distinct early and late century carbon uptake trajectories for the northern region.
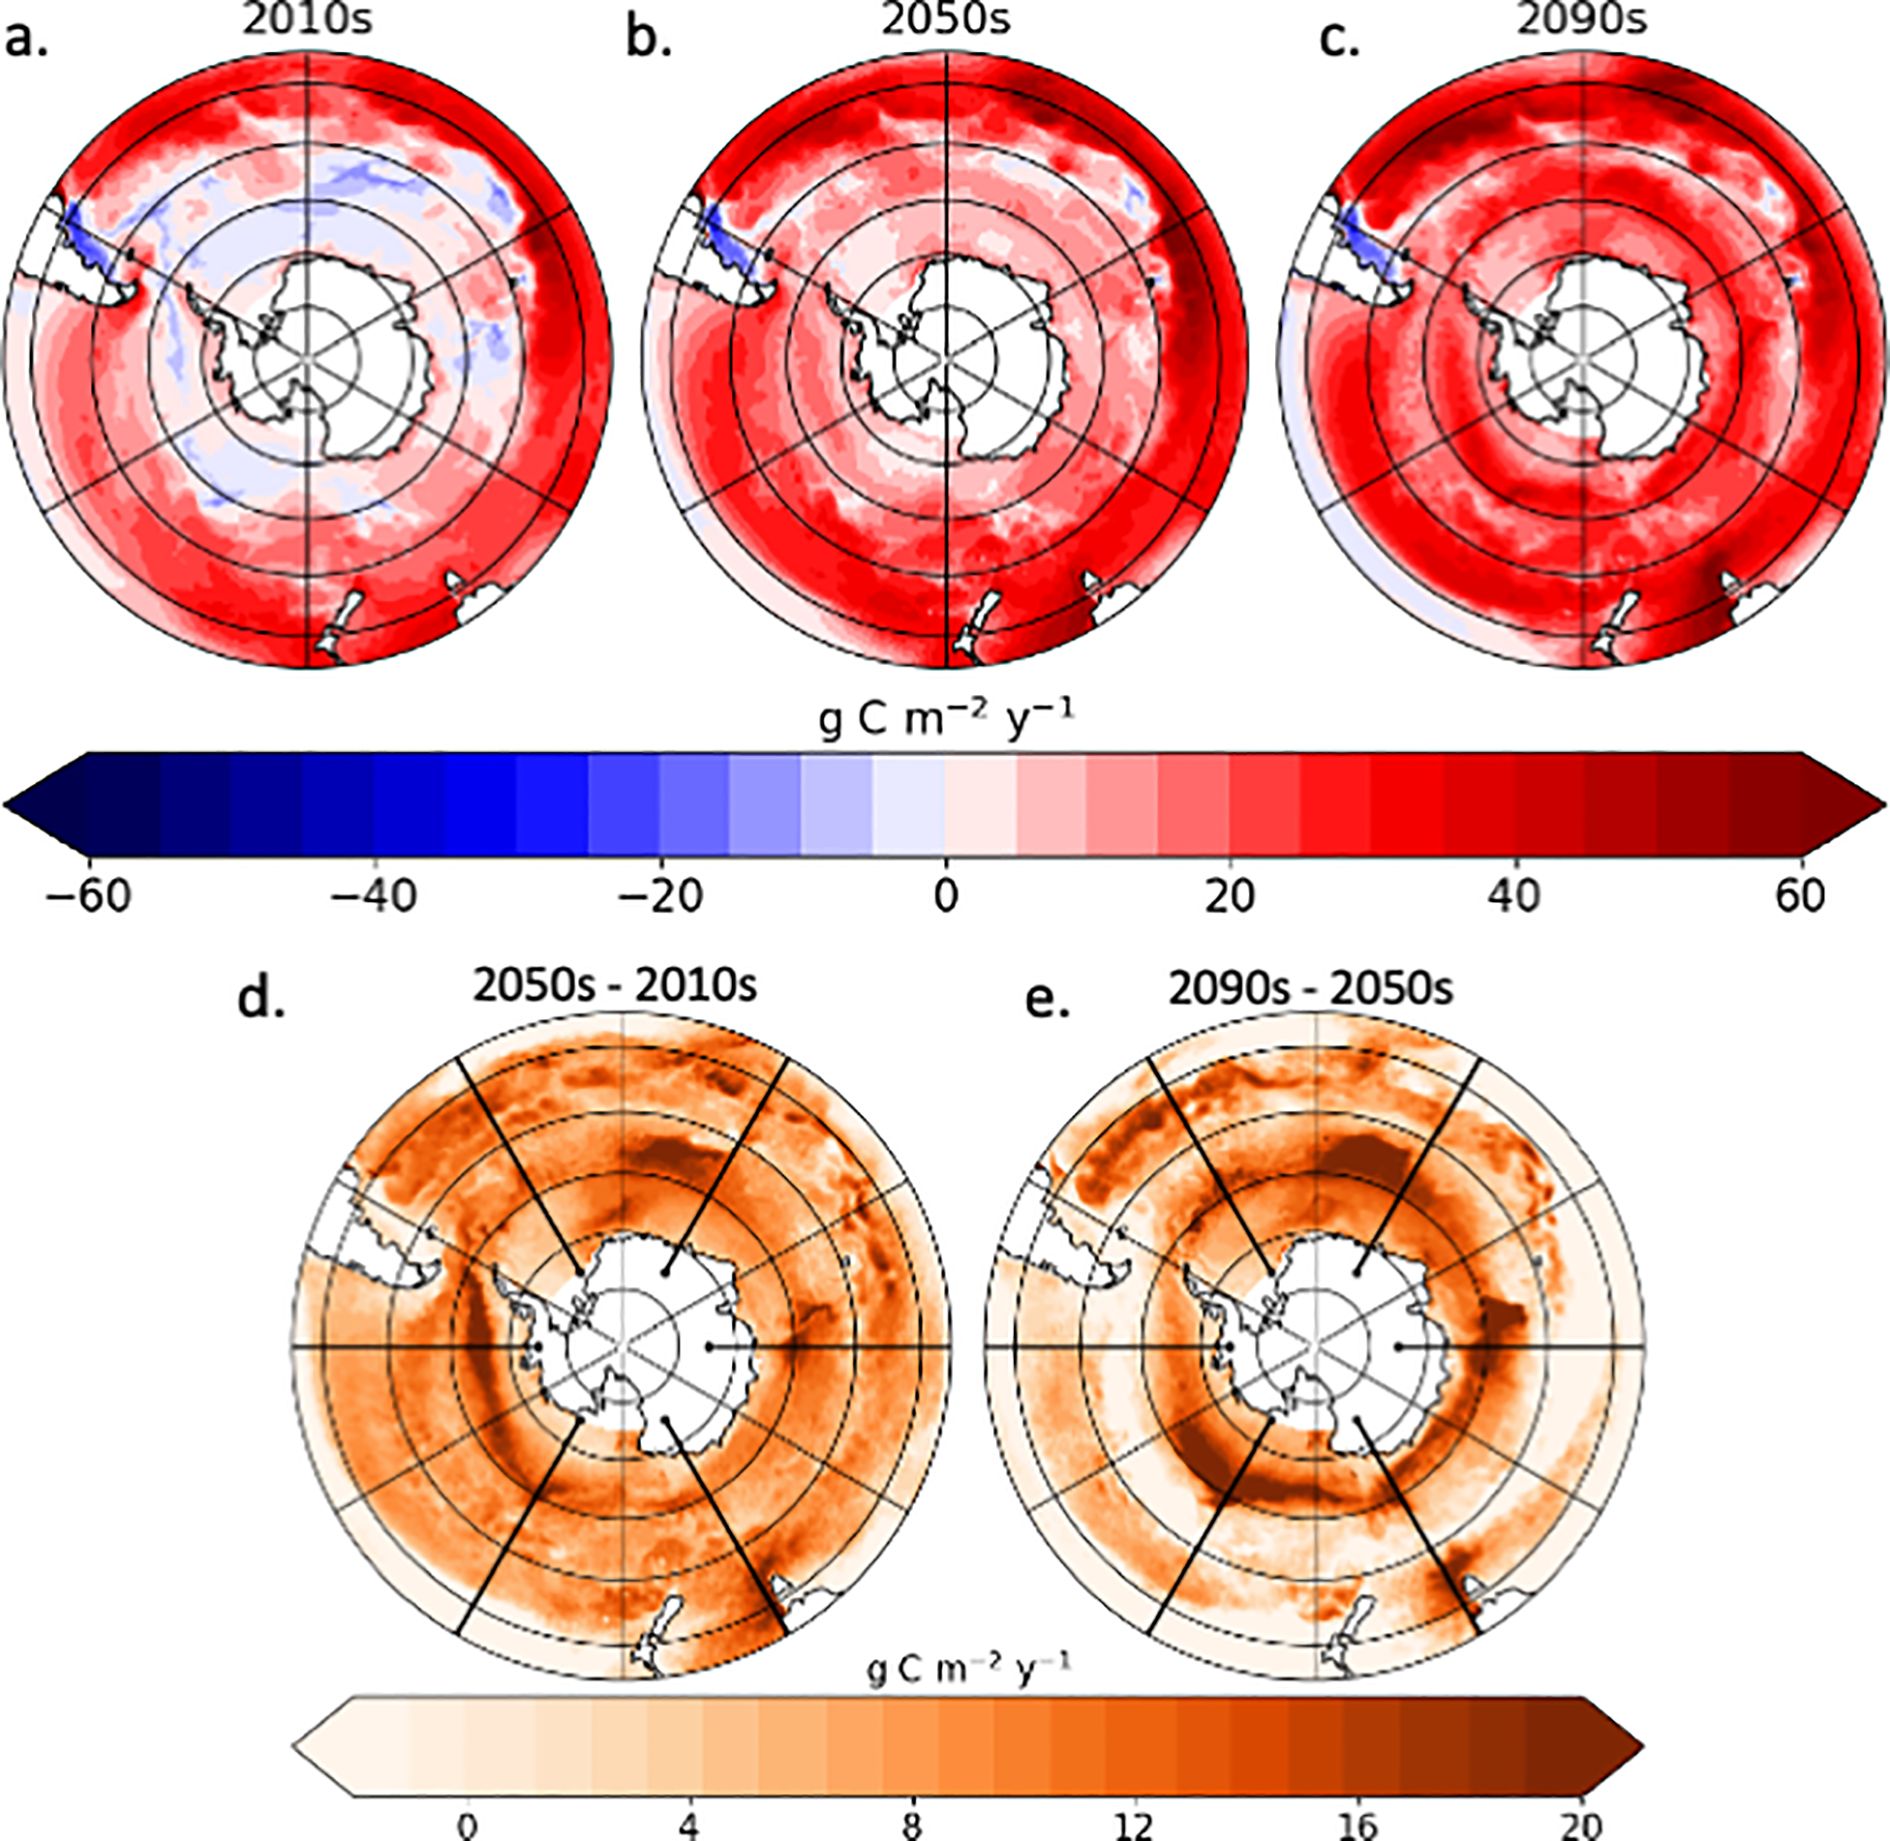
Figure 5. Decadal mean ocean uptake of CO2 at the beginning (a), middle (b), and end (c) of the 21st century and the changes between the 40-year intervals for the beginning and end of the century (d and e, respectively).
The evolution of the projected ocean carbon uptake under RCP8.5 forcing is mapped as decadal means over the 21st century in Figure 5, top. Generally, the 2010’s decadal mean shows a zone of outgassing or minimal exchange south of 60°S; an intermediate zone between 50-60°S, where the core of the ACC shifts progressively southward along its circumpolar path east from Drake Passage, with regions of both uptake and outgassing; and, a northern zone of uptake between 35 and 50°S. By the 2050’s, the regions of outgassing have largely transitioned into regions of uptake, and almost all regions north of 60°S have intensified in uptake. By the 2090’s, intensified uptake continues across the entire Southern Ocean.
The changes in ocean carbon uptake are also mapped in terms of differences between decadal means over 40-year increments throughout the century in Figure 5, bottom. These maps exhibit spatial heterogeneity, with local hotspots of enhanced ocean uptake of carbon over time, overlain by the larger-scale meridional gradients presented above. We will describe the local hotspots and compare them to other relevant physical features that may affect local carbon exchange (namely, bathymetry, maximum/wintertime mixed layer depth, and eddy kinetic energy) as well as solubility via the Revelle factor, and its implications in particular for the northern region of the Southern Ocean in the latter half of the 21st century.
Changes in the first time period (2010’s to 2050’s) show increases in ocean uptake throughout the Southern Ocean, but are punctuated by three distinct hotspots of enhanced carbon uptake. The locations of the hotspots for increasing ocean uptake of carbon in the first 40 years (2010’s to 2050’s) are all regions of pronounced outgassing in the 2010’s decadal-mean (blue regions in Figure 5a). The regions of carbon outgassing in the 2010’s indicate where upwelled water reaches the surface. This upwelled water has a relatively constant effective sea-water CO2 partial pressure (pCO2SW) due to lack of recent atmospheric exposure. When the rising atmospheric pCO2 exceeds the recently-surfaced pCO2SW levels by the 2050’s, these regions switch from sources to ocean carbon sinks by the 2050’s. One of these hotspots in the first 40 years occurs in the Pacific sector west of Drake Passage. This is despite changes in the maximum (winter) mixed layer depth (MLDmax; Supplementary Figure S2), which in this location shoals from around 300-400m in the 2010’s to around 100-200m by the 2050’s and would weaken the ocean carbon uptake (the opposite of our result). The increase in carbon uptake for this region, despite the decrease in MLDmax, implies that volume and carbon solubility of upwelled CDW are stronger influences than the local MLD.
Many regions of enhanced uptake over time in both the beginning and end of the century are located downstream (i.e. down-ACC) of major topographical features of the Southern Ocean (Supplementary Figure S2). Changes to mixing and associated air-sea carbon exchange can be affected downstream of topographical features that interact with the ACC. As discussed in Rintoul et al., 2018, the effect of topography on ocean mixing downstream of the ACC is dependent on the position of the ACC relative to the topography. Meridional steering of the current by topography can lead to cross-frontal exchange, upwelling, and/or enhanced eddy activity, all of which affect air-sea exchange. Changes in the magnitude and meridional location of the ACC near topography can lead to changes in air-sea carbon exchange downstream. The major topographical features in the Southern Ocean are (following the ACC east from Drake Passage): the southern extension of the Mid-Atlantic Ridge, the Kerguélen Plateau, and the Pacific-Antarctic Ridge (seen in Supplementary Figure S3 of Southern Ocean bathymetry). Locations where the increase in ocean uptake of carbon is pronounced occur downstream of these major topographic features in the Southern Ocean. Both the Mid-Atlantic Ridge and the Kerguélen Plateau are adjacent to and upstream of regional hotspots where the trend in ocean uptake of carbon is pronounced throughout the century, and becomes stronger and more widespread in the latter 40-year period (2050’s to 2090’s). In contrast, the increase in carbon uptake in the vicinity and downstream of the Pacific-Antarctic Ridge is only apparent in the latter 40 years.
Changes in the second time period (2050’s to 2090’s) also show regional hotspots of enhanced carbon uptake (Figure 5), as well as a meridional gradient from stronger enhancement in carbon uptake further south to little or no change further north (in line with Figure 3, top, where the northern region exhibited a level uptake rate over the latter half of the century). Note this is despite a continued a continued rise in atmospheric pCO2. The decadal means and coincident changes in the sea-surface Revelle factor (RF; Figure 6) provide an explanation for these regional trajectories in carbon uptake. The Revelle factor is a quantification of seawater CO2 solubility resulting from its chemical dissociation in seawater (into bicarbonate and carbonate anions), also known as carbon buffering capacity, with higher RF equating to weaker CO2 solubility. In the 2010’s, we see a pronounced meridional gradient, with higher RF closer to the Antarctic continent and lower values equator-ward. The same pattern holds by the 2050’s, although with generally higher values, reflected in the spatially homogeneous map of changes from the 2010’s to 2050’s. However, from the 2050’s to the 2090’s, changes to the RF are most pronounced in the northern region. This is due to the longer time of exposure to the atmosphere for the northern branch of surfaced CDW, which allows surface waters to equilibrate with atmospheric pCO2 levels before subducting as mode water, and thus increase in the local northern region uptake rate is limited to the smaller rate at which local biological export production increases. In contrast, the carbon uptake in the southern region is able to steadily increase as the pCO2 difference between ventilating CDW and the atmosphere tracks that of increasing atmospheric pCO2 over the century. In addition, the accelerating MOC over the century is projected to decrease the surface exposure time. The pattern of projected carbon uptake, and changes in that pattern by the end of the century, are quite different from the contemporary uptake in the Southern Ocean. The southern region is projected to transition from a carbon source to a strong carbon sink, and the northern region is unable to maintain the acceleration in carbon uptake by the latter half of the century due to saturation (equilibration with the atmosphere before subduction).
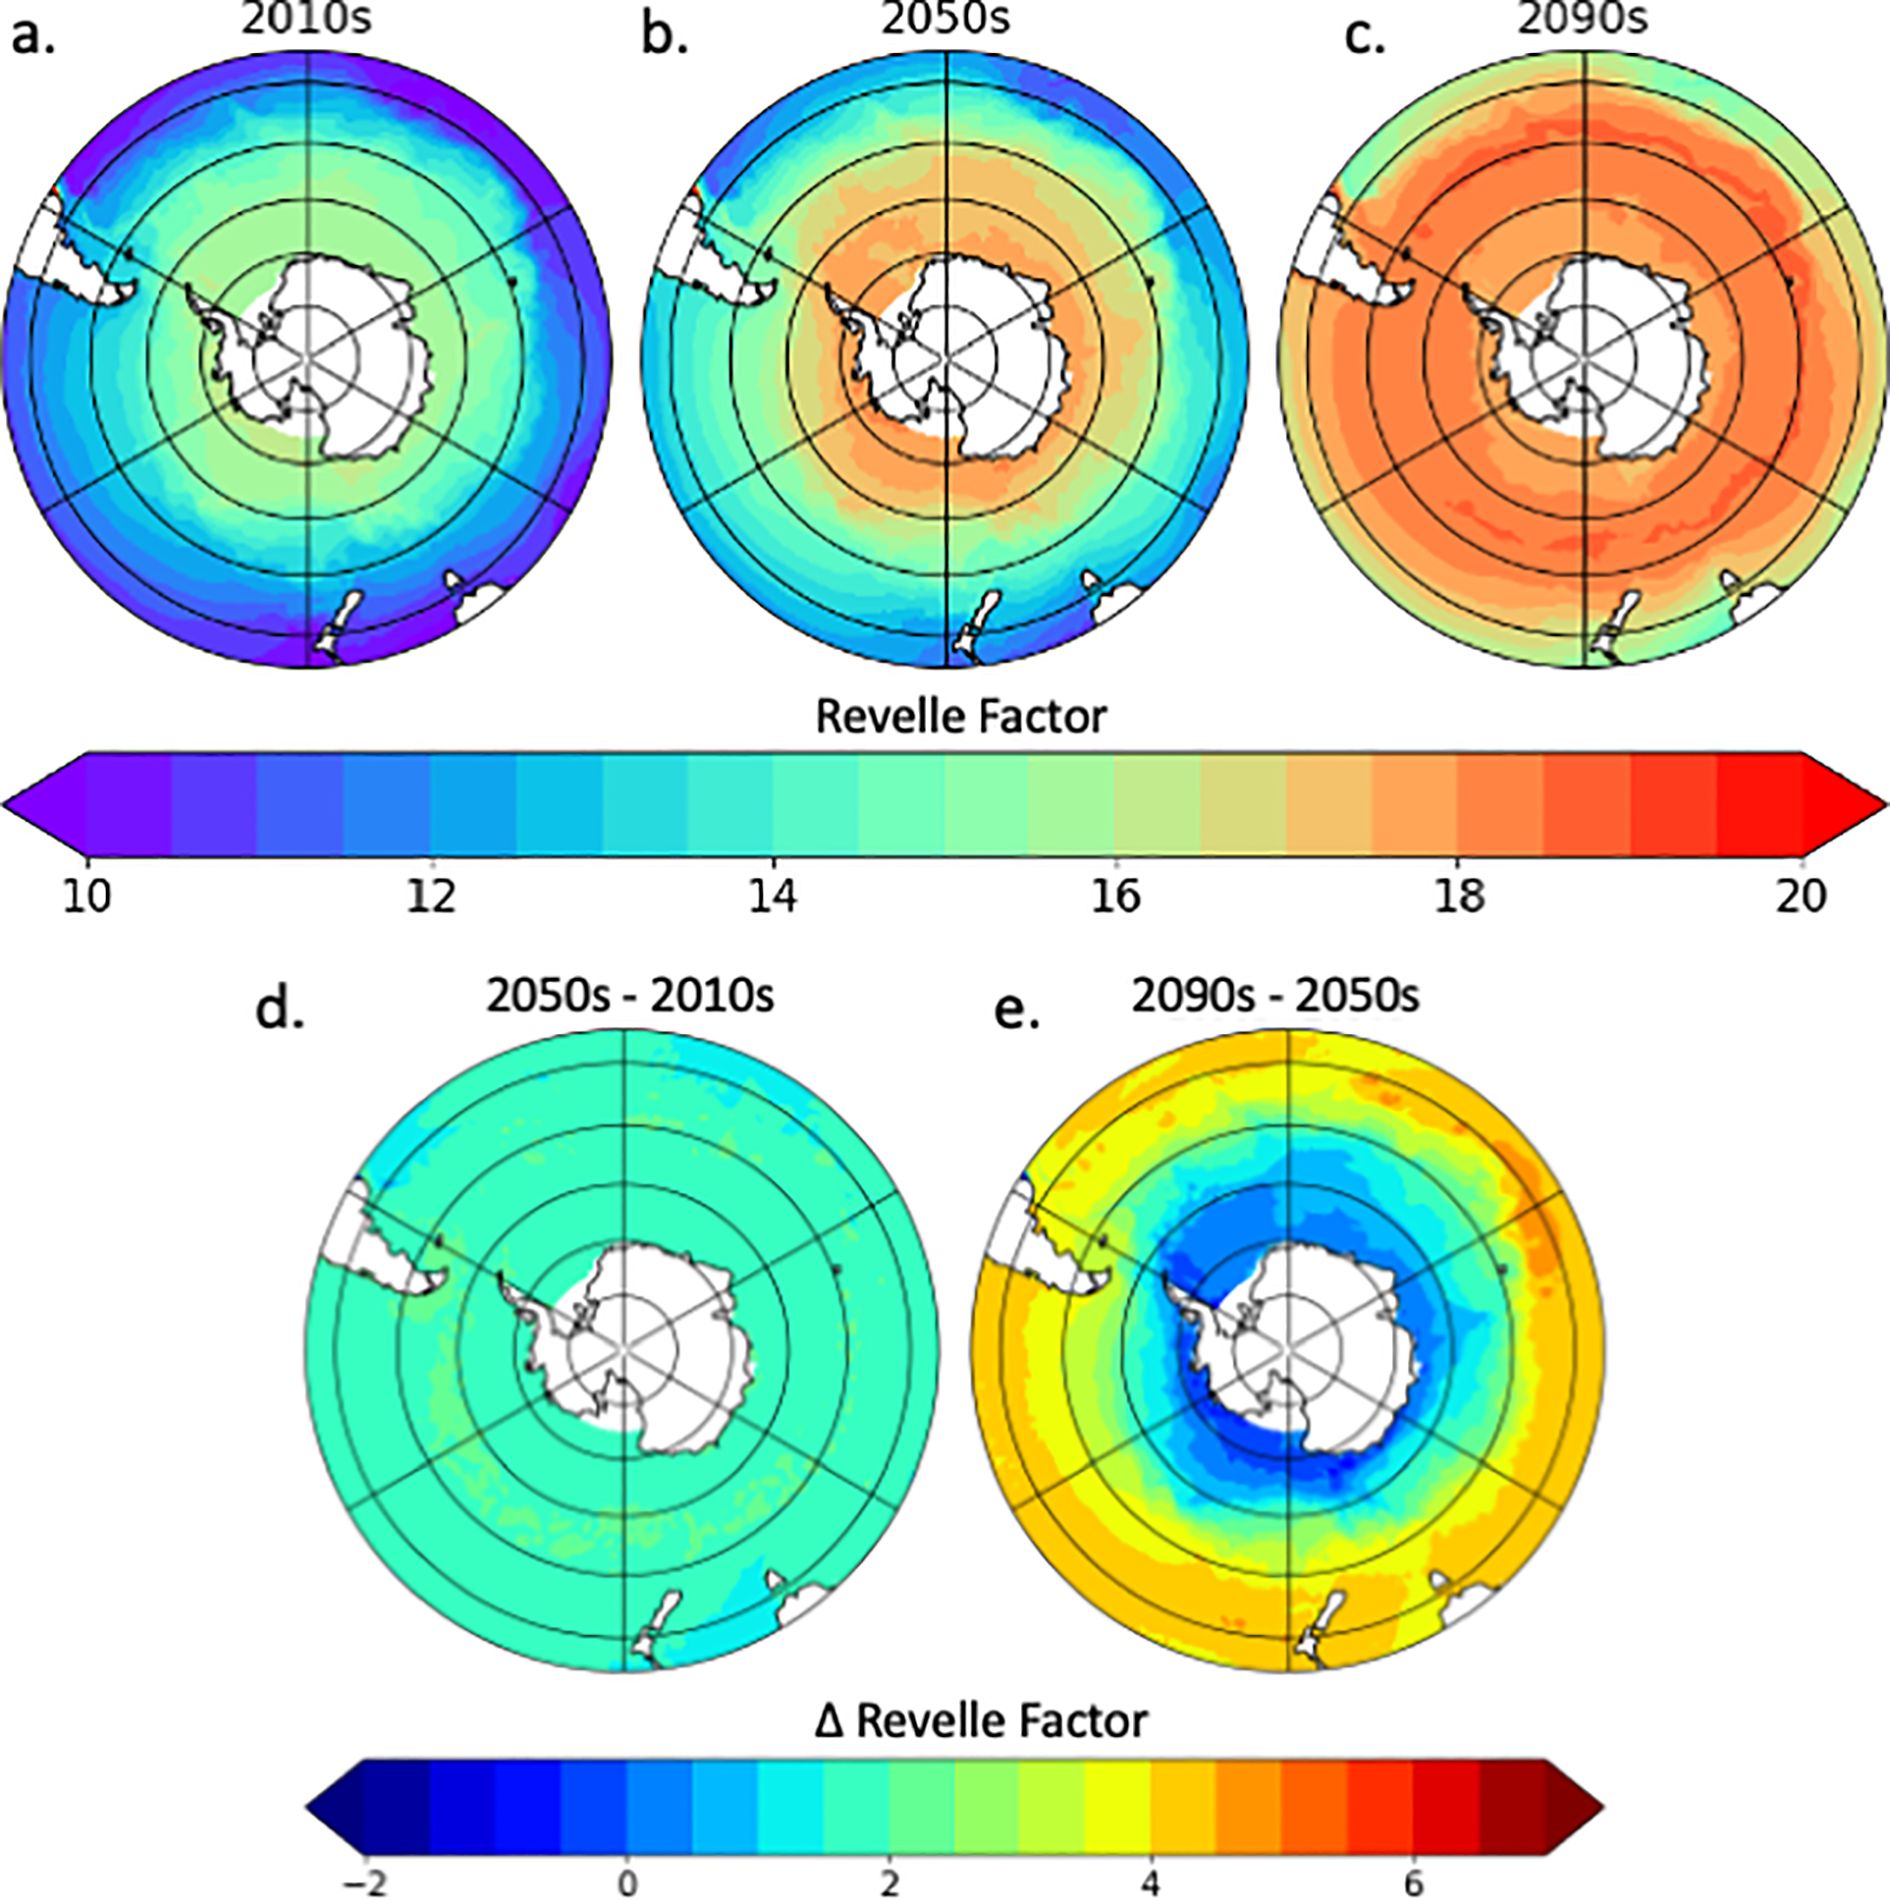
Figure 6. Decadal mean of sea-surface Revelle factor at the beginning (a), middle (b), and end (c) of the 21st century and the changes between the 40-year intervals for the beginning and end of the century (d and e, respectively).
These regional results, namely continued increase in carbon uptake in the southern region and a stagnation in the increase in carbon uptake in the northern region by the latter half of the century, are generally consistent with coarser resolution model projections (Hauck et al., 2015 and Mongwe et al., 2023), but with a different attribution. They suggest that the increase in the southern region is due to a stronger effect of export production on pCO2SW in the future due to higher RF, despite only small changes to the magnitude of Export production in the future. That is, the higher RF leads to a larger pCO2 disequilibrium for a similar DIC decrease by export production, and hence a greater CO2 flux and stronger ocean carbon uptake. While this leads to a greater flux, the subsequent equilibration with the atmosphere would also affect pCO2SW more strongly due to the same reason that the RF is higher than under present conditions. Therefore, the effect of export production and subsequent equilibration would be opposite in terms of changes to DIC and air-sea exchange. The net effect of the higher RF would therefore depend on the equilibration times.
Lastly, the eddy kinetic energy (EKE) field has the potential to affect ocean carbon uptake through local mixing, and observations show EKE activity in the global oceans is increasing (Martínez-Moreno et al., 2021). Most IPCC-style model projections feature resolutions unable to explicitly capture mesoscale processes like EKE, representing them instead through parameterizations (e.g., Gent, 2011). These parameterizations, however, do not capture the evolution of the EKE field due to projected changes in atmospheric forcing over the century under high-emission scenarios. The high-resolution framework of the model presented in this study is able to represent mesoscale processes, and thus provides an opportunity to test the effect of changes in EKE on changes to the carbon uptake. The changes in EKE over the century (Supplementary Figure S4) show enhanced EKE associated with the poleward shift in the zonal wind forcing, but these regions of enhanced EKE are generally not co-located with changes to the ocean carbon uptake. Separating the Southern Ocean into the two regions defined based on the distinct trajectories in carbon uptake (35-50°S and South of 55°S), we find no significant correlation for the changes in either the first (respectively, -0.22 and -0.02) or second (-0.21 and -0.35) half of the century. This result indicates that changes to the EKE field are not explicitly correlated to changes in air-sea exchange of carbon, despite the role of EKE in mixing processes in the Southern Ocean. As a modelling study with a resolution capable of representing mesoscale eddies, which are a dominant component of the Southern Ocean, a key result is that changes in the EKE field do not appear to directly influence changes to the Southern Ocean carbon uptake. However, this does not imply that the EKE is unimportant for regional ocean carbon uptake, as both EKE and air-sea exchange are associated with ocean mixing.
4 Discussion
The Southern Ocean plays a critical role in the global ocean uptake of carbon, accounting for just over 40% of global uptake in the present-day and, in this study, projected to increase to 50% of the global ocean uptake by the end of the century. The projected changes in the carbon uptake for the Southern Ocean dominate global changes over the century, accounting for two thirds of the global ocean increase in carbon uptake by the end of the century.
The processes affecting the carbon uptake in the Southern Ocean span both physical and biogeochemical properties, but these processes affect different regions in different ways. In particular, regions north and south of the maximum zonal wind stress follow distinct, large-scale, trajectories in terms of changes to the projected carbon uptake. The southern region exhibits a near-linear increase in carbon uptake over time. This is due to a steady supply of CDW that is more and more undersaturated relative to the increasing atmospheric pCO2, with the regional carbon uptake increasing from near 0 in the 2010’s to 0.75 Pg C yr-1 by the end of the century under RCP8.5 forcing. The northern region also increases in carbon uptake over the 1st half of the 21st century (from 0.8 to 1.2 Pg C yr-1), but the longer exposure time and decrease in carbon solubility leads to a levelling off in the annual uptake by the latter half of the century. The weaker carbon solubility for this region is supported by spatial distributions of Revelle factor and their changes over the century, which indicate the largest increases in the northern region in the latter half of the century.
Locally, there are exceptions to the zonally averaged structure described above. For example, many hotpots in ocean carbon uptake trends are located downstream of topographic features due to interactions between topography and the ACC. A second important local factor in the first half-century are regions of locally upwelled CDW, identified as regions of outgassing in the first decade (2010’s). These are regions where the ventilated CDW, unexposed to the atmosphere since before the recent rise in atmospheric pCO2, exhibit a relatively constant pCO2 and carbon solubility, both of which make the regions able to absorb more carbon under an atmosphere with increasing pCO2. A third local process with the potential to affect regional carbon uptake is the EKE field, which is explicitly represented in the high-resolution model framework of the present study. However, regions of enhanced change in EKE over the century are not coincident to large changes in air-sea carbon exchange, indicating that mesoscale processes are not explicitly linked to regional changes in carbon uptake. This is particularly relevant for the Southern Ocean, where the EKE field is relatively strong.
5 Conclusion
The trajectories of Southern Ocean carbon uptake presented here are fascinating in their spatial variability and the associated differing controls on future uptake, even within the relatively simple Earth system framework explored in our model. The precision of our estimated changes is of course model dependent, with our small decadal variability and comparisons to coarser model resolutions (not shown). However, additional complexities may emerge in more complete treatments, e.g., in dynamic responses of glacial and sea ice distributions (as opposed to the prescribed fields used here) or changing availability of micro-nutrients and associated biological productivity. The nature of change may also differ beyond 2100. For example, carbon uptake in the southern region may also begin to stagnate beyond 2100, as the Weddell Sea, a major conduit of deep sea subduction of carbon in the region, is projected to abruptly slow down by the end of the 21st century (Nissen et al., 2022). It should also be noted that the scenario analyzed in this study represents a worst-case scenario. RCP8.5 represents the historical trajectory until the mid-2010’s, after which the growth rate of emissions has slowed in response to a transition away from coal (Hausfather and Peters, 2020). Further work using less extreme carbon emission scenario(s) would be a natural next step for this high-resolution study.
This study utilizes a high-resolution biogeochemical ocean model in order to project the Southern Ocean’s contribution to the global ocean carbon sink. We find distinct regional trajectories north and south of the maximum zonal wind stress, with the polar region transitioning to a major carbon sink, and a stagnation of the ocean sink further north. Under this emission scenario the Southern Ocean, as a whole, is projected to become even more important in terms of the global ocean carbon sink.
Data availability statement
The raw data supporting the conclusions of this article will be made available by the authors, without undue reservation.
Author contributions
EM: Conceptualization, Data curation, Formal analysis, Methodology, Writing – original draft, Writing – review & editing. AL: Conceptualization, Writing – review & editing. ES: Conceptualization, Writing – review & editing. TT: Conceptualization, Writing – review & editing. MC: Writing – review & editing. RS: Data curation, Writing – review & editing. XZ: Data curation, Writing – review & editing. RW: Writing – review & editing.
Funding
The author(s) declare that financial support was received for the research and/or publication of this article. This research was supported by the Centre for Southern Hemisphere Oceans Research (CSHOR), a partnership between the Commonwealth Scientific and Industrial Research Organisation (CSIRO) and the Qingdao National Laboratory for Marine Science; and the Australian Antarctic Program Partnership through the Australian Government’s Antarctic Science Collaboration Initiative. This research was carried out in part under the auspices of the Cooperative Institute for Marine and Atmospheric Studies (CIMAS), a Cooperative Institute of the University of Miami and the National Oceanic and Atmospheric Administration, cooperative agreement # NA20OAR4320472.
Acknowledgments
The authors would like to thank the two reviewers as well as the NOAA-AOML internal reviewer, Sang-ki Lee, for their contributions to this study.
Conflict of interest
The authors declare that the research was conducted in the absence of any commercial or financial relationships that could be construed as a potential conflict of interest.
Generative AI statement
The author(s) declare that no Generative AI was used in the creation of this manuscript.
Publisher’s note
All claims expressed in this article are solely those of the authors and do not necessarily represent those of their affiliated organizations, or those of the publisher, the editors and the reviewers. Any product that may be evaluated in this article, or claim that may be made by its manufacturer, is not guaranteed or endorsed by the publisher.
Supplementary material
The Supplementary Material for this article can be found online at: https://www.frontiersin.org/articles/10.3389/fmars.2025.1589735/full#supplementary-material
Supplementary Figure 1 | Decadal mean of the organic carbon export at the beginning (left), middle (center), and end (right) of the 21st century.
Supplementary Figure 2 | Decadal means of maximum (winter-time) mixed layer depth at the beginning (a), middle (b), and end (c) of the 21st century and the changes between the 40-year intervals for the beginning and end of the century (d and e, respectively).
Supplementary Figure 3 | Bathymetry in the Southern Ocean, with major topographic features that interact with the ACC circled.
Supplementary Figure 4 | Decadal-mean total kinetic energy (EKE) in the surface ocean at the beginning (a), middle (b), and end (c) of the 21st century (top) and △EKE between the 40-year intervals for the beginning and end of the century (d and e, respectively).
References
Chapman C. C., Lea M. A., Meyer A., Sallée J. B., and Hindell M. (2020). Defining Southern Ocean fronts and their influence on biological and physical processes in a changing climate. Nat. Clim Chang 10, 209–219. doi: 10.1038/s41558-020-0705-4
Chen H., Haumann F. A., Talley L. D., Johnson K. S., and Sarmiento J. L. (2022). The deep ocean’s carbon exhaust. Global Biogeochemical Cycles 36. doi: 10.1029/2021GB007156
DeVries T. and Primeau F. (2011). Dynamically and observationally constrained estimates of water-mass distributions and ages in the global ocean. J. Phys. Oceanography 41, 2381–2401. doi: 10.1175/JPO-D-10-05011.1
DeVries T., Yamamoto K., Wanninkhof R., Gruber N., Hauck J., Müller J. D., et al. (2023). Magnitude, trends, and variability of the global ocean carbon sink from 1985 to 2018. Global Biogeochemical Cycles 37, e2023GB007780. doi: 10.1029/2023GB007780
Farneti R., Delworth T. L., Rosati A. J., Griffies S. M., and Zeng F. (2010). The role of mesoscale eddies in the rectification of the southern ocean response to climate change. J. Phys. Oceanography 40, 1539–1557. doi: 10.1175/2010JPO4353.1
Friedlingstein P., O’Sullivan M., Jones M. W., Andrew R. M., Hauck J., Landschützer P., et al. (2025). Global carbon budget 2024. Earth Syst. Sci. Data. 17, 965–1039. doi: 10.5194/essd-17-965-2025
Frölicher T. L., Sarmiento J. L., Paynter D. J., Dunne J. P., Krasting J. P., and Winton M. (2015). Dominance of the southern ocean in anthropogenic carbon and heat uptake in CMIP5 models. J. Climate 28, 862–886. doi: 10.1175/JCLI-D-14-00117.1
Gent P. R. (2011). The Gent–McWilliams parameterization: 20/20 hindsight. Ocean Model. 39, 2–9. doi: 10.1016/j.ocemod.2010.08.002
Gray A. R., Johnson K. S., Bushinsky S. M., Riser S. C., Russell J. L., Talley L. D., et al. (2018). Autonomous biogeochemical floats detect significant carbon dioxide outgassing in the high-latitude southern ocean. Geophys Res. Lett. 45, 9049–9057. doi: 10.1029/2018GL078013
Griffies S., Schmidt M., and Herzfeld M. (2009). Elements of MOM4p1. GFDL OCEAN GROUP TECHNICAL REPORT NO 6. (Princeton, NJ: NOAA-GFDL (Geophysical Fluid Dynamics Laboratory) Group Report) 444.
Hauck J.C., Völker D. A., Wolf‐Gladrow C., Laufkötter M., and Vogt O.. “On the Southern Ocean CO2 Uptake and the Role of the Biological Carbon Pump in the 21st Century.” Global Biogeochemical Cycles (2015) 29(9), 1451–70. doi: 10.1002/2015GB005140
Hausfather Z. and Peters G. P. (2020) Emissions – the ‘Business as Usual’ Story Is Misleading.” Nature 577 (7792), 618–20. doi: 10.1038/d41586-020-00177-3
Hayashida H., Matear R. J., Strutton P. G., and Zhang X. (2020). Insights into projected changes in marine heatwaves from a high-resolution ocean circulation model. Nat. Commun. 11, 4352. doi: 10.1038/s41467-020-18241-x
Iversen M.H. “Carbon Export in the Ocean: A Biologist’s Perspective.” Annual Review of Marine Science (2023) 15(1), 357–81. doi: 10.1146/annurev-marine-032122-035153
Khatiwala S., Tanhua T., Mikaloff Fletcher S., Gerber M., Doney S. C., Graven H. D., et al. (2013). Global ocean storage of anthropogenic carbon. Biogeosciences 10, 2169–2191. doi: 10.5194/bg-10-2169-2013
Kobayashi S., Ota Y., Harada Y., Ebita A., Moriya M., Onoda H., et al. (2015). The JRA-55 reanalysis: general specifications and basic characteristics. J. Meteorological Soc. Japan 93, 5–48. doi: 10.2151/jmsj.2015-001
Landschützer P., Gruber N., and Bakker D. C. E. (2016). Decadal variations and trends of the global ocean carbon sink: DECADAL AIR-SEA CO 2 FLUX VARIABILITY. Global Biogeochem Cycles 30, 1396–1417. doi: 10.1002/2015GB005359
Langlais C. E., Lenton A., Matear R., Monselesan D., Legresy B., Cougnon E., et al. (2017). Stationary Rossby waves dominate subduction of anthropogenic carbon in the Southern Ocean. Sci. Rep. 7, 17076. doi: 10.1038/s41598-017-17292-3
Lauderdale J.M., Stephanie D., Richard G., and Michael J. Follows. “Quantifying the Drivers of Ocean‐atmosphere CO2 Fluxes.” Global Biogeochemical Cycles (2016) 30(7), 983–99. doi: 10.1002/2016GB005400
Le Quéré C., Rödenbeck C., Buitenhuis E. T., Conway T. J., Langenfelds R., Gomez A., et al. (2007). Saturation of the Southern Ocean CO2 Sink Due to Recent Climate Change. Science 316(5832), 1735–38. doi: 10.1126/science.1136188
Lovenduski N. S. and Ito T. (2009). The future evolution of the Southern Ocean CO2 sink. J. Mar. Res. 67, 597–617. doi: 10.1357/002224009791218832
Marshall J. and Speer K. (2012). Closure of the meridional overturning circulation through Southern Ocean upwelling. Nat. Geosci 5, 171–180. doi: 10.1038/ngeo1391
Martínez-Moreno J., AMcC H., England M. H., Constantinou N. C., Kiss A. E., and Morrison A. K. (2021). Global changes in oceanic mesoscale currents over the satellite altimetry record. Nat. Clim Chang 11, 397–403. doi: 10.1038/s41558-021-01006-9
Mazloff M. R., Ferrari R., and Schneider T. (2013). The force balance of the southern ocean meridional overturning circulation. J. Phys. Oceanography 43, 1193–1208. doi: 10.1175/JPO-D-12-069.1
Mongwe P., Gregor L., Tjiputra J., Hauck J., Ito T., Danek C., et al. (2023). A shift in the mechanism of CO2 uptake in the Southern Ocean under high emission-scenario. In Rev. 5. doi: 10.21203/rs.3.rs-2849464/v1
Morrison A. K., Waugh D. W., Hogg A., Jones D. C., and Abernathey R. P. (2022). Ventilation of the southern ocean pycnocline. Annu. Rev. Mar. Sci. 14, 405–430. doi: 10.1146/annurev-marine-010419-011012
Mortenson E., Lenton A., Shadwick E. H., Trull T. W., Chamberlain M. A., and Zhang X. (2021). Divergent trajectories of ocean warming and acidification. Environ. Res. Lett. 16, 124063. doi: 10.1088/1748-9326/ac3d57
Nissen C., Timmermann R., Hoppema M., Gürses Ö., and Hauck J. (2022). Abruptly attenuated carbon sequestration with Weddell Sea dense waters by 2100. Nat. Commun. 13, 3402. doi: 10.1038/s41467-022-30671-3
Oke P. R., Griffin D. A., Schiller A., Matear R. J., Fiedler R., Mansbridge J., et al. (2013). Evaluation of a near-global eddy-resolving ocean model. Geosci Model. Dev. 6, 591–615. doi: 10.5194/gmd-6-591-2013
Rintoul S. R. (2018). The global influence of localized dynamics in the Southern Ocean. Nature 558, 209–218. doi: 10.1038/s41586-018-0182-3
Roy T., Sallée J. B., Bopp L., and Metzl N. (2021). Diagnosing CO2 emission-induced feedbacks between the Southern Ocean carbon cycle and the climate system: A multiple Earth System Model analysis using a water mass tracking approach. J. Climate, 1–62. doi: 10.1175/JCLI-D-20-0889.1
Sallée J. B., Matear R. J., Rintoul S. R., and Lenton A. (2012). Localized subduction of anthropogenic carbon dioxide in the Southern Hemisphere oceans. Nat. Geosci 5, 579–584. doi: 10.1038/ngeo1523
Shadwick E. H., Tilbrook B., Cassar N., Trull T. W., and Rintoul S. R. (2015b). Summertime physical and biological controls on O2 and CO2 in the Australian Sector of the Southern Ocean. J. Mar. Syst. 147, 21–28. doi: 10.1016/j.jmarsys.2013.12.008
Shadwick E. H., Trull T. W., Tilbrook B., Sutton A. J., Schulz E., and Sabine C. L. (2015a). Seasonality of biological and physical controls on surface ocean CO2 from hourly observations at the Southern Ocean Time Series site south of Australia. Global Biogeochem Cycles 29, 223–238. doi: 10.1002/2014GB004906
Takahashi T., Sutherland S. C., Wanninkhof R., Sweeney C., Feely R. A., Chipman D. W., et al. (2009). Climatological mean and decadal change in surface ocean pCO2, and net sea–air CO2 flux over the global oceans. Deep Sea Res. Part II: Topical Stud. Oceanography 56, 554–577. doi: 10.1016/j.dsr2.2008.12.009
Takahashi T., Sweeney C., Hales B., Chipman D., Newberger T., Goddard J., et al. (2012). The changing carbon cycle in the southern ocean. oceanog 25, 26–37. doi: 10.5670/oceanog.2012.71
Keywords: Southern Ocean, ocean carbon biogeochemical cycle, ocean model projection, RCP8.5 projections, biogeochemical ocean model
Citation: Mortenson E, Lenton A, Shadwick EH, Trull TW, Chamberlain MA, Patel R, Zhang X and Wanninkhof R (2025) Meridional asymmetry in the evolution of the Southern Ocean carbon sink over the 21st century in a high-resolution model. Front. Mar. Sci. 12:1589735. doi: 10.3389/fmars.2025.1589735
Received: 07 March 2025; Accepted: 11 June 2025;
Published: 11 July 2025.
Edited by:
Selvaraj Kandasamy, Central University of Tamil Nadu, IndiaCopyright © 2025 Mortenson, Lenton, Shadwick, Trull, Chamberlain, Patel, Zhang and Wanninkhof. This is an open-access article distributed under the terms of the Creative Commons Attribution License (CC BY). The use, distribution or reproduction in other forums is permitted, provided the original author(s) and the copyright owner(s) are credited and that the original publication in this journal is cited, in accordance with accepted academic practice. No use, distribution or reproduction is permitted which does not comply with these terms.
*Correspondence: Eric Mortenson, ZXJpY3RoZW1vcnRAZ21haWwuY29t