Abstract
Optics-based sensors, called optodes, for oxygen are used for routine operations on autonomous instrumentation and profiling platforms with great success. Observations of oxygen gradients with high spatial and temporal resolution become increasingly important, while shortcomings still exist, namely, time constant problems, stability issues, or accuracy levels, that limit leveraging their full scientific and operational potential. Here, we demonstrate the utility of a novel, although currently not commercially available optode, the HydroFlash O2. It was manufactured by Kongsberg Maritime Contros GmbH between 2014 and 2019, and peer-reviewed studies illustrate its use until today. Our work comprises its first integrated characterization with data from 13 HydroFlash O2 optodes assessing oxygen, temperature, salinity and hydrostatic pressure dependence, long-term stability and drift, response time, and air-calibration compatibility. We multi-point calibrated this optode up to a root mean square error (RMSE) of <1 µmol L-1 (mean RMSE: 1.79 ± 0.50 µmol L-1), depending on the fit model type. Our laboratory setup yielded a temperature-dependent response time of τ63% = 3.31 ± 0.58 s, showing no significant difference between a weakly turbulent and turbulent flow, and was at least 50 % faster compared to the two most common optodes in oceanography, i.e., 4330 (Aanderaa) and SBE 63 (Sea-Bird Scientific). We assessed its pressure dependence between 0–5797 dbar, yielding an overall factor of 2.372 ± 0.409 % per 1,000 dbar based on three multi-point calibrated, drift-corrected optodes and five CTD (conductivity - temperature - depth) profiles. Ship-underway, mooring, and CTD-cast applications promise high-quality observations, including fast oxygen level changes. The optode revealed a strong sensitivity of the sensor spot, causing erroneous oxygen measurements when exposed to direct solar irradiation during an Argo float test profile. The drift assessment covering a maximum time span of approximately 3 years is based on two optodes and yielded linear (R2 = 0.98) and exponential (τ = 2.35 ± 0.30 yr, 95 % CI) drift behaviors. The HydroFlash O2 is applicable in low to high oxygen, pressure, and temperature conditions, yet we do not call for additional performance studies unless the manufacturer reactivates its production and reduces sensor spot issues. In an ocean affected by climate change, reliable oxygen optodes will contribute crucial information about the global oxygen and carbon budget, e.g., through observations in the mixed layer, thermocline, or deep sea, and require assessments of existing and promising instrumentation.
1 Introduction
Ocean warming severely impacts ocean ventilation, e.g., by changing stratification in the upper ocean, and dissolved oxygen content and distribution in the ocean because it reduces oxygen solubility (Oschlies et al., 2018), which depends on temperature and salinity (Weiss, 1970), or feeds back on the marine biological carbon pump (Frenger et al., 2024). Data show a decrease of more than 2 % in the global ocean since 1960 (Schmidtko et al., 2017), while models predicted a decline of the global oxygen inventory of about 2–12 µmol kg-1 (or 1 %–7 % based on an average ocean O2 concentration of ∼178 µmol kg-1) over the past century, with declines continuing for a thousand years or more into the future (Keeling et al., 2010). Quantifying local and global changes of oxygen levels will improve the understanding of chemical, biological, and physical processes, especially in open ocean Oxygen Minimum Zones (OMZ) characterized by ongoing intensification and spatial expansion (Stramma et al., 2008) or in coastal waters, affecting marine and estuarine fisheries and ecosystems (Breitburg et al., 2018).
To track evident changes of oxygen in the ocean, Gruber et al. (2010) defined very stringent long-term goals for observation: (1) accuracy of ±1 µmol kg-1 (±1 hPa), and (2) precision of ±0.5 µmol kg-1 (±0.5 hPa). Given its role as a direct and indirect indicator of ocean processes, oxygen is declared an Essential Ocean Variable (EOV) within the Global Ocean Observing System (GOOS), allowing one to derive variables, such as Apparent Oxygen Utilization (AOU) or air-sea O2 fluxes when combined with, e.g., temperature, salinity or wind speed. Furthermore, it is a supporting variable for other EOVs, such as nutrients or inorganic carbon. Therefore, integrating sensors with sufficient and known data quality characteristics and measurement uncertainties on ship-based and autonomous platforms, e.g., animals, autonomous surface and underwater vehicles, floats, or moorings, is required to provide observational evidence for these changes that in turn will lead to investigating the underlying processes (Task Team for an Integrated Framework for Sustained Ocean Observing, 2012).
Over the last two decades, the development of optics-based sensors, called optodes, for oxygen has greatly improved and it is now feasible to use these sensors for routine operations on autonomous platforms with great success (Bittig et al., 2018a). Tengberg et al. (2006) were among the first to report on the successful implementation of a new oxygen optode for observations in aquatic environments and to discuss optode performance, including error characteristics from environmental factors, e.g., temperature, salinity, and pressure, or time response. Uchida et al. (2008) and Bittig et al. (2012, 2014, 2015a, 2015b) demonstrated the need for extensive laboratory and field experiments to study response behavior and error characteristics of oxygen optodes, e.g., recording sensor foil coefficients over the optode’s lifetime, validating optode oxygen output against reference values (discrete Winkler titration or saturated air), or determining pressure response with depth. The integration of optodes on autonomous observation platforms such as Biogeochemical-Argo (BGC-Argo) floats serves then as a very powerful tool for in-situ temporal and spatial coverage to monitor changes in oxygen levels (Claustre et al., 2020). For example, Bushinsky et al. (2017a) show the potential of observational oxygen data with high spatial and temporal resolution obtained from Argo floats in order to determine the processes driving air-sea fluxes.
Shortcomings with current optodes are still found in sensor properties such as time constant, stability and drift, accuracy levels, and in-situ calibration capabilities, which limit leveraging the full scientific and operational potential of these sensor observations (Bittig et al., 2018a). Post-corrections for these properties can be applied (Bushinsky and Emerson, 2013; Johnson et al., 2015; Bittig and Körtzinger, 2017). However, information is lost due to the slow response times of optodes when applying inverse filtering (Bittig et al., 2014; Bushinsky et al., 2017b) or in-situ determination of the sensors’ effective response time (Gordon et al., 2020).
Here we present an in-depth characterization of the CONTROS HydroFlash® O2 optode with a fast response time to potentially close this gap. Kongsberg Maritime Contros GmbH (KM Contros) manufactured and commercially distributed this optode from 20141 until its discontinuation for strategic reasons in 2019. The scientific community still utilizes them for marine research, which necessitates their extensive characterization, e.g., Totland et al. (2020) and Sweetman et al. (2024). The HydroFlash O2 optode uses a promising novel optode technology with a faster time response compared to the two most common optodes in oceanography, i.e., 4330 (Aanderaa) and SBE 63 (Sea-Bird Scientific). Moreover, the RINKO FT (JFE Advantech Co., Ltd.) is another promising fast oxygen sensor.
This paper followed the optode characterization approach and the requirements of the ocean oxygen community according to Bittig et al. (2018a), with an extensive performance assessment of the HydroFlash O2. We consider our results an important knowledge input for the community to further advance the field of fast oxygen optodes.
2 Materials and methods
This section comprises the specifications of the optical oxygen sensor CONTROS HydroFlash® O2 and the details of all the experiments and analysis methods relevant to this characterization study. For more information on oxygen optodes, i.e., their technical evolution in oceanography, detailed sensing principle, performance requirements for various applications, or data handling, Bittig et al. (2018a) provided an in-depth review and summarized the existing status quo of the current two most common optode models in ocean observation: 4330 (Aanderaa) and SBE 63 (Sea-Bird Scientific).
2.1 Optode measuring principle and implementation
Similar to other oxygen optodes, the measuring principle of the CONTROS HydroFlash® O2 is based on dynamic luminescence quenching (KM Contros, 2019) of a heavy transition metal complex in the presence of molecular oxygen, while the absence of the quencher yields unaltered luminescence. During its operation, the sensing layer of the HydroFlash O2 optode emits a visible orange-red flash, yet no excitation wavelength is specified in the datasheet from the manufacturer. Wolfbeis (2015, Table 2) summarized several companies offering instrumentation for optical oxygen measurements and, among others, listed PyroScience (Aachen, Germany; https://www.pyroscience.com/), which has supplied oxygen sensor foils for optode applications in marine environments (Fritzsche et al., 2018). According to their REDFLASH technology2, the luminophor is excited at a wavelength between 610–630 nm (approx. 625 nm according to Borisov et al., 2008, Staudinger et al., 2018), while the oxygen-dependent luminescence signal emits in the range of 760–790 nm, thus making this technology a potential candidate for the CONTROS HydroFlash® O2. The exact chemical structure of the luminescence dye (luminophor) is a corporate secret, yet we conclude from several studies by Borisov et al. (2009); Wang and Wolfbeis (2014); Wolfbeis (2015); Staudinger et al. (2018), and Fritzsche et al. (2018) that the luminophor is a platinum(II)3 benzoporphyrin complex embedded in a polymer matrix membrane of either silicone rubber or polystyrene.
The relationship between the amount of quencher molecules and the luminescence intensity or lifetime , respectively, where the index marks the absence of oxygen, is described by the Stern-Volmer equation with as the Stern-Volmer constant and pO2 as the oxygen partial pressure according to
While dynamic luminescence quenching is governed by the O2 concentration within the sensing foil (luminophor-membrane including an optical isolation layer, details in section 2.2) of the optode, pO2 drives the chemical equilibrium between the sensing foil and ambient environment (here: air or water). Dynamic luminescence quenching does not chemically consume molecular oxygen, hence, the response time of optodes to changing oxygen levels is a diffusion-controlled process across the optical isolation layer within the sensing foil and is determined by the temperature and flow of the measurement medium (Bittig et al., 2014; Bushinsky et al., 2017b). One consequence of the immobilization of the luminophore in a sensing foil in optode measurements is that the Stern–Volmer relationship shows a non-linear behavior, resulting in a downward curvature of the Stern–Volmer plot (Bittig et al., 2018a). In this context, Carraway et al. (1991) formulated a two-site model (modified Stern–Volmer equation) based on empirical data.
Luminescence intensity measurements show several disadvantages, as discussed by Klimant et al. (1995); Tengberg et al. (2006), and Bittig et al. (2018a), thus measurements of luminescence lifetime are preferred using a single-frequency phase shift technique (Lakowicz, 2006). In the case of exponential luminescence decay, the lifetime relates to the phase shift and modulation frequency as follows (modified equations from Lakowicz, 2006, chapter 5):
Equations 2, 3 show that luminescence lifetime and phase shift are both mathematically and phenomenologically connected, but not equal. Thus, phase shift cannot be used in the Stern–Volmer Equation 1).
The pO2 response characterization of optodes is calculated by several theoretical models and empirical approaches in the -parameter space (Bittig et al., 2018a). The manufacturer of the HydroFlash O2 applies the functional model approach of Bittig et al. (2018a, Equations 28, 31), which itself is a modification of Uchida et al. (2010):
where the calibration coefficients are derived from calibration data, is the optode temperature in °C, and is the adjusted raw phase shift in degrees compensating for the pressure effect on the luminescence lifetime (if applicable), respectively.
2.2 HydroFlash O2 sensor characteristics and novel aspect
The sensor is composed of a robust, cylinder-shaped titanium housing (23 mm 170 mm) and is operational in water depths up to 6,000 m. The physicochemical quenching process takes place in the sensor spot of the optode. Here, the luminophor dye, along with the polymer membrane and a black isolation layer for the purpose of ambient light protection, is immobilized on a pressure-resistant, convex glass substrate (optical lens), potentially achieving a better immersion in the water and enhanced light yield. The sensor spot sits in a copper ring (anti-biofouling measure) and above a sapphire glass window through which all in-housing components are separated from the ambient. Besides a reference light-emitting diode (LED), a measurement LED excites the luminophor dye using orange-red light via the sapphire glass window and optical lens, whereupon a photodiode detects the oxygen-dependent luminescence signal. Figure 1 provides a general overview of the sensing principle and sensor head.
Figure 1
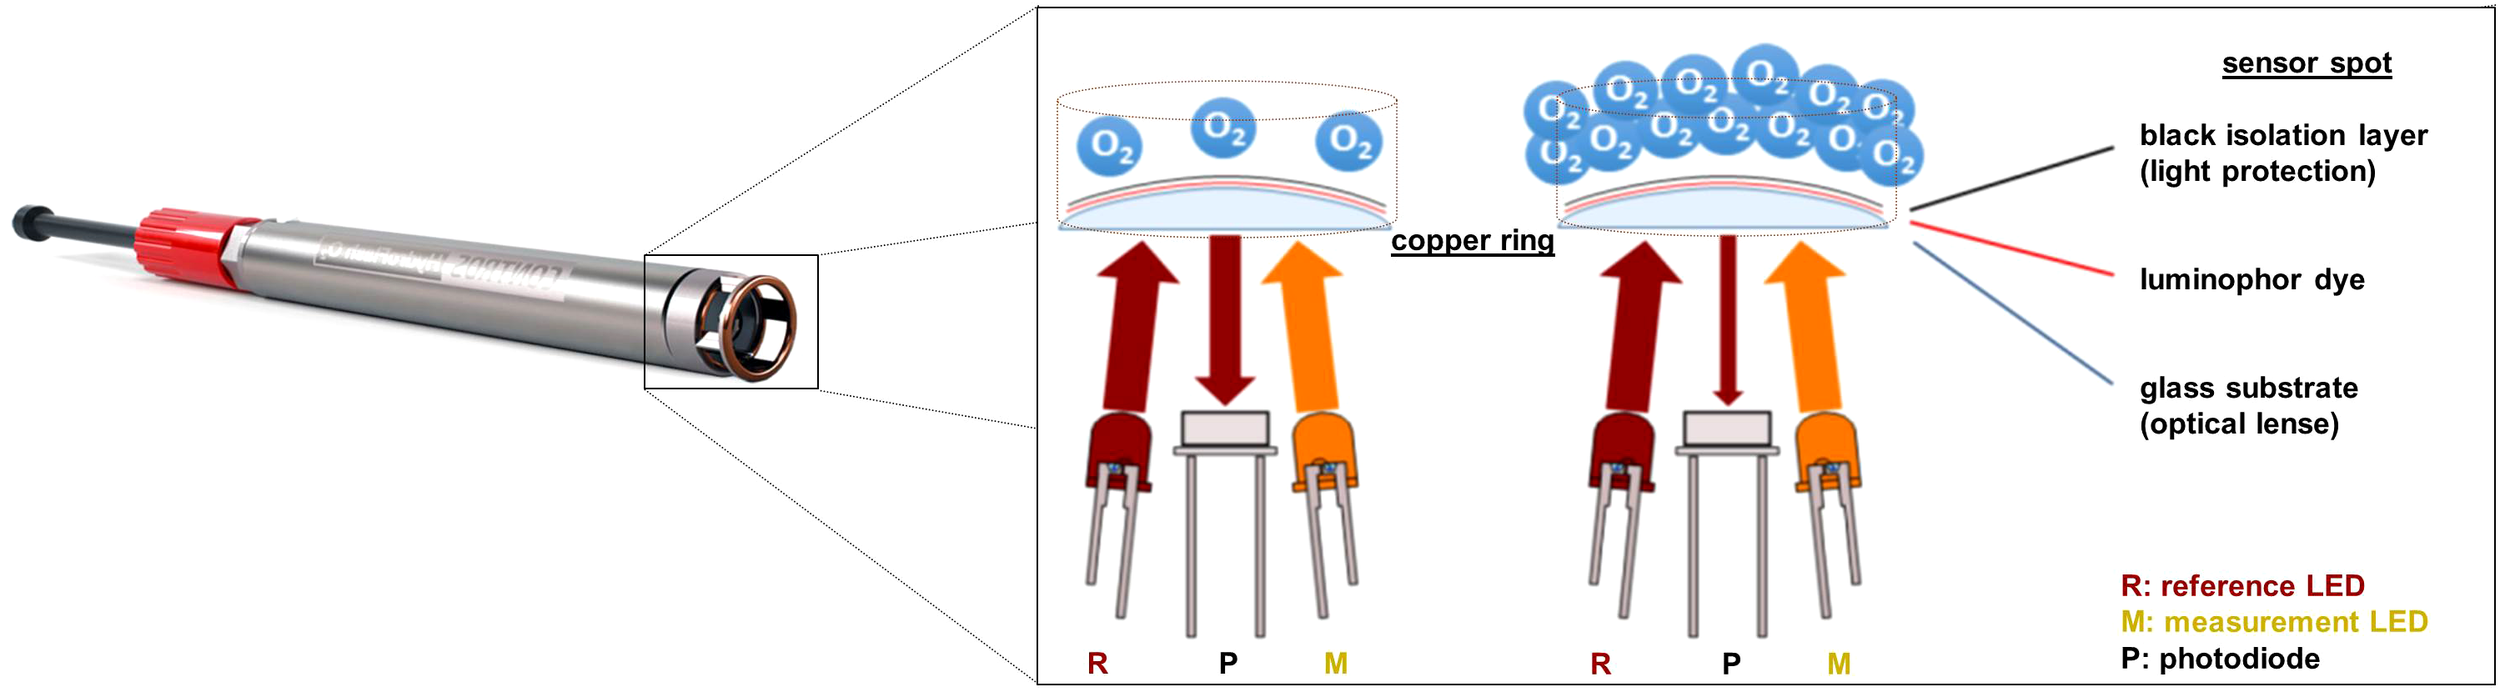
Sensing principle in the sensor spot of the CONTROS HydroFlash® O2 optode (modified from the manufacturer’s manual, KM Contros, 2016).
Besides all the raw and processed sensor output data, the optode also measures ambient temperature approximately 5 mm next to and on the outside of the sensor spot. Early optode versions made use of a Pt100 resistor (with a linear response but slow response time) for recording temperature, while, in later models, a NTC (negative temperature coefficient) thermistor (with faster response time, but non-linear temperature response) was used and embedded in a titanium casing, protruding about 10 mm from the housing. Its measurement ranges of oxygen and temperature cover typical oceanographic regimes, i.e., pO2: 0–300 mbar and : 2 °C–35 °C. According to the manufacturer, the optode is factory-calibrated with an initial accuracy of 1 %. Data can be recorded every 1 second to 24 hours and are saved on an internal data logger. A simultaneous data readout via an RS232 cable is possible by using a terminal program (e.g., TeraTerm or Term2x) or the manufacturer’s own software DETECT. Since the optode is unpumped, its power consumption is solely the sum of the actual measurement (0.1 Ws per sample) and the standby current (0.3 mA). An additional, external battery pack (HydroB® Flash; 2 3.6 V batteries) allows autonomous applications, while an internal, programmable sleep mode further extends the battery lifetime. Supplementary Table S1 summarizes the above and additional properties of the HydroFlash O2 as specified by the manufacturer (KM Contros, 2019).
The novel aspect of the CONTROS HydroFlash® O2 compared to existing optodes for most oceanographic applications is the combination of a different excitation wavelength (potentially using the REDFLASH sensing technology with a different luminophor and higher wavelengths, see section 2.1), composition of the sensor spot (optical lens, type of immobilization, and anti-biofouling copper ring), and integration into a robust underwater housing for deep sea applications up to 6,000 m. Several characteristics could be claimed to result from this setup according to KM Contros (KM Contros, 2019) and PyroScience's REDFLASH technology2:
-
The sensor spot can be exchanged easily through its way of positioning and mounting.
-
Besides high precision and accuracy, low cross-sensitivity, and high reliability, the excitation wavelength avoids interference by autoluminescence of biological systems.
-
The luminophor membrane has high photostability (Borisov et al., 2008, 2009; Wang and Wolfbeis, 2014; Staudinger et al., 2018).
-
The convex, solid glass substrate enhances immersion and light yield for the embedded luminophor.
-
The luminescence signal of the used luminophor is of higher intensity compared to the blue-light excitation, thus the duration and intensity of excitation is reduced, which requires lower power input.
As a consequence of iv) and v), the luminophor-membrane is thinner and shall ensure fast response times of < 3 s. Bittig et al. (2014) presented a boundary layer model to support this general correlation.
2.3 Determining sensor characteristics from laboratory experiments
2.3.1 Optode calibration procedures
For the purpose of O2 calibration and stability analysis, all the HydroFlash O2 optodes used in this study underwent an individual Winkler-based, multi-point laboratory calibration at GEOMAR using the setup of Bittig et al. (2012) at least once during their usage4. The so-obtained calibration data were applied with several fit model types to calculate the root mean square error (RMSE) for each optode (see section 2.5 for details). Modifications of Bittig et al. (2012) included (a) software adaptation in LabVIEW (National Instruments) according to the optodes’ data format readout; (b) the use of a flow-through head custom-designed for this optode; (c) a drift criterion smaller than 0.035 mol L-1 min-1, or 0.009° min-1 over a period of 20 min (single outliers of 0.046 mol L-1 min-1 (multi-point calibration 4) and 0.026° min-1 (multi-point calibration 3) showed no negative effect on the RMSE); (d) referencing with duplicate instead of triplicate Winkler samples by means of discarding the corresponding outlier if the triplicate Winkler samples exceeded a standard deviation of 1.10 mol L-1 for the respective reference points5 (single maximum outlier of 1.30 mol L-1 in multi-point calibration 3 was included); and (e) a reference optode (4330 or SBE 63) for comparison purposes. Winkler sampling in 50 mL Erlenmeyer flasks and subsequent titration were performed according to Hansen (1999). The HydroFlash O2 optodes were not submerged entirely into the water during the 0 O2 saturation calibration points, while additional 100 O2 saturation levels at low temperatures via an aquarium pump and air bubble stone including Winkler referencing were performed at full immersion. Tab water was taken for 100 levels and subsequently corrected for its salinity based on the ion strength given by our municipal water supplier (see Supplementary Tables S3, S4), which resulted in an average value of S = 0.508. Some optodes obtained a reduced laboratory calibration at 0 and 100 at different temperatures (two-point calibration).
2.3.2 Response time experiments
The experiments for response time characterization of the optode were conducted according to Tengberg et al. (2006) and Bittig et al. (2014). In particular, the temperature (target temperatures between 2 °C and 32 °C) and flow dependence of the response time under a thoroughly mixed flow regime of weakly-turbulent conditions, i.e., simulating a slow platform, and turbulent conditions were determined. The fit equation for the exponential response time is given by Bittig et al. (2014) according to
where is the normalized step response curve, the amplitude to match the height of the step during the response signal, the elapsed time, and the time offset from the start of each step. Weak-turbulence conditions were achieved by using two cryostat baths (F25, Julabo GmbH, Seelbach, Germany) with the same temperatures and mixing conditions. We used two steps of oxygen partial pressure, one at 0 (bubbled N2) and 100 (bubbled ambient air). A step was defined as shifting the optodes (logging interval: 1.6 s) between the two reservoirs immediately (about 1 s), i.e., either 0 100 % (rising) or 100 % 0 % (falling). These steps were recorded between 5 and 12 times for each temperature. Both cryostats were switched once to avoid systematic errors through differences in mixing, i.e., 2/17/27 °C at 0 refers to the same cryostat as 7/12/22/32 °C at 100 . Turbulent conditions were simulated by using a magnetic stir bar at 400 rpm within a thermostatically controlled beaker. Two 1 L beakers were used, i.e., 1x DURAN® for 2/12/22 °C (7/17/27/32 °C) at 0 (100 ) and 1x PP for 7/17/27/32 °C (2/12/22 °C) at 100 (0 ). Our setup is pictured in Hahn (2014), which is analogous to experiment 4 in Bittig et al. (2014).
2.4 Determining sensor characteristics from field experiment data
Field experiments were conducted with several HydroFlash O2 optodes to evaluate the performance of this sensor. All the optodes underwent pre- and post-deployment calibrations at GEOMAR (multi-point and/or two-point, see section 2.3), thus, those field studies complemented the extensive characterization and facilitated addressing the information about salinity and hydrostatic pressure dependence, stability assessment during storage and deployment, and time dependence on observation platforms. While Figure 2 represents a geographical overview of all the field applications used for this study, Figure 3 and the inventory in Supplementary Table S2 summarize the time and details of activities with all optodes with respect to the characterization purposes. Calibration data from all the optodes were used for stability assessment (drift evaluation) during the storage and deployment periods. The drift behavior calculations are based on the usage of the original, multi-point calibration coefficients for the subsequent calibrations. The change in oxygen sensitivity (optode - reference) against oxygen concentration is plotted, and the drift rate is determined by the slope of a linear regression.
Figure 2
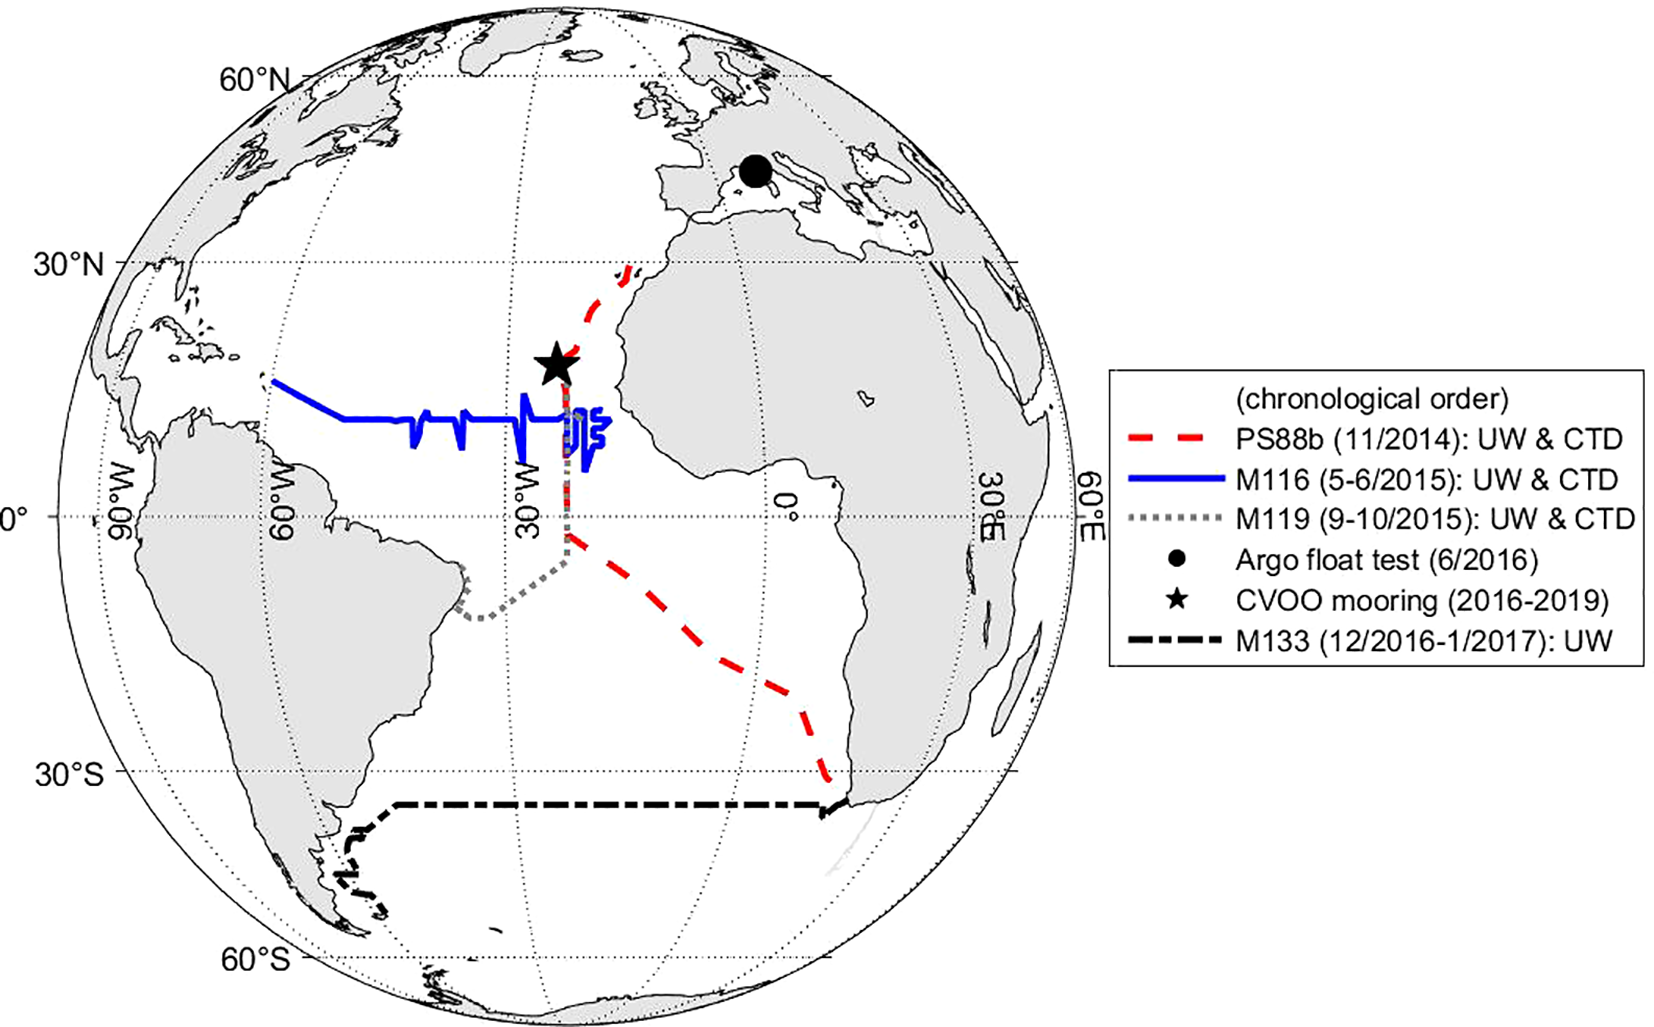
Field applications of the CONTROS HydroFlash® O2 optode over the course of this study showing additional spatial information to complement Figure 3. Details of the experiments and expedition information are given in section 2.4 and the cruise reports, respectively. Legend explanation: UW, underway measurements in a flow-through box; CTD, profiling application on a rosette sampler in the water column; CVOO, mooring application at the Cabo Verde Ocean Observatory.
Figure 3
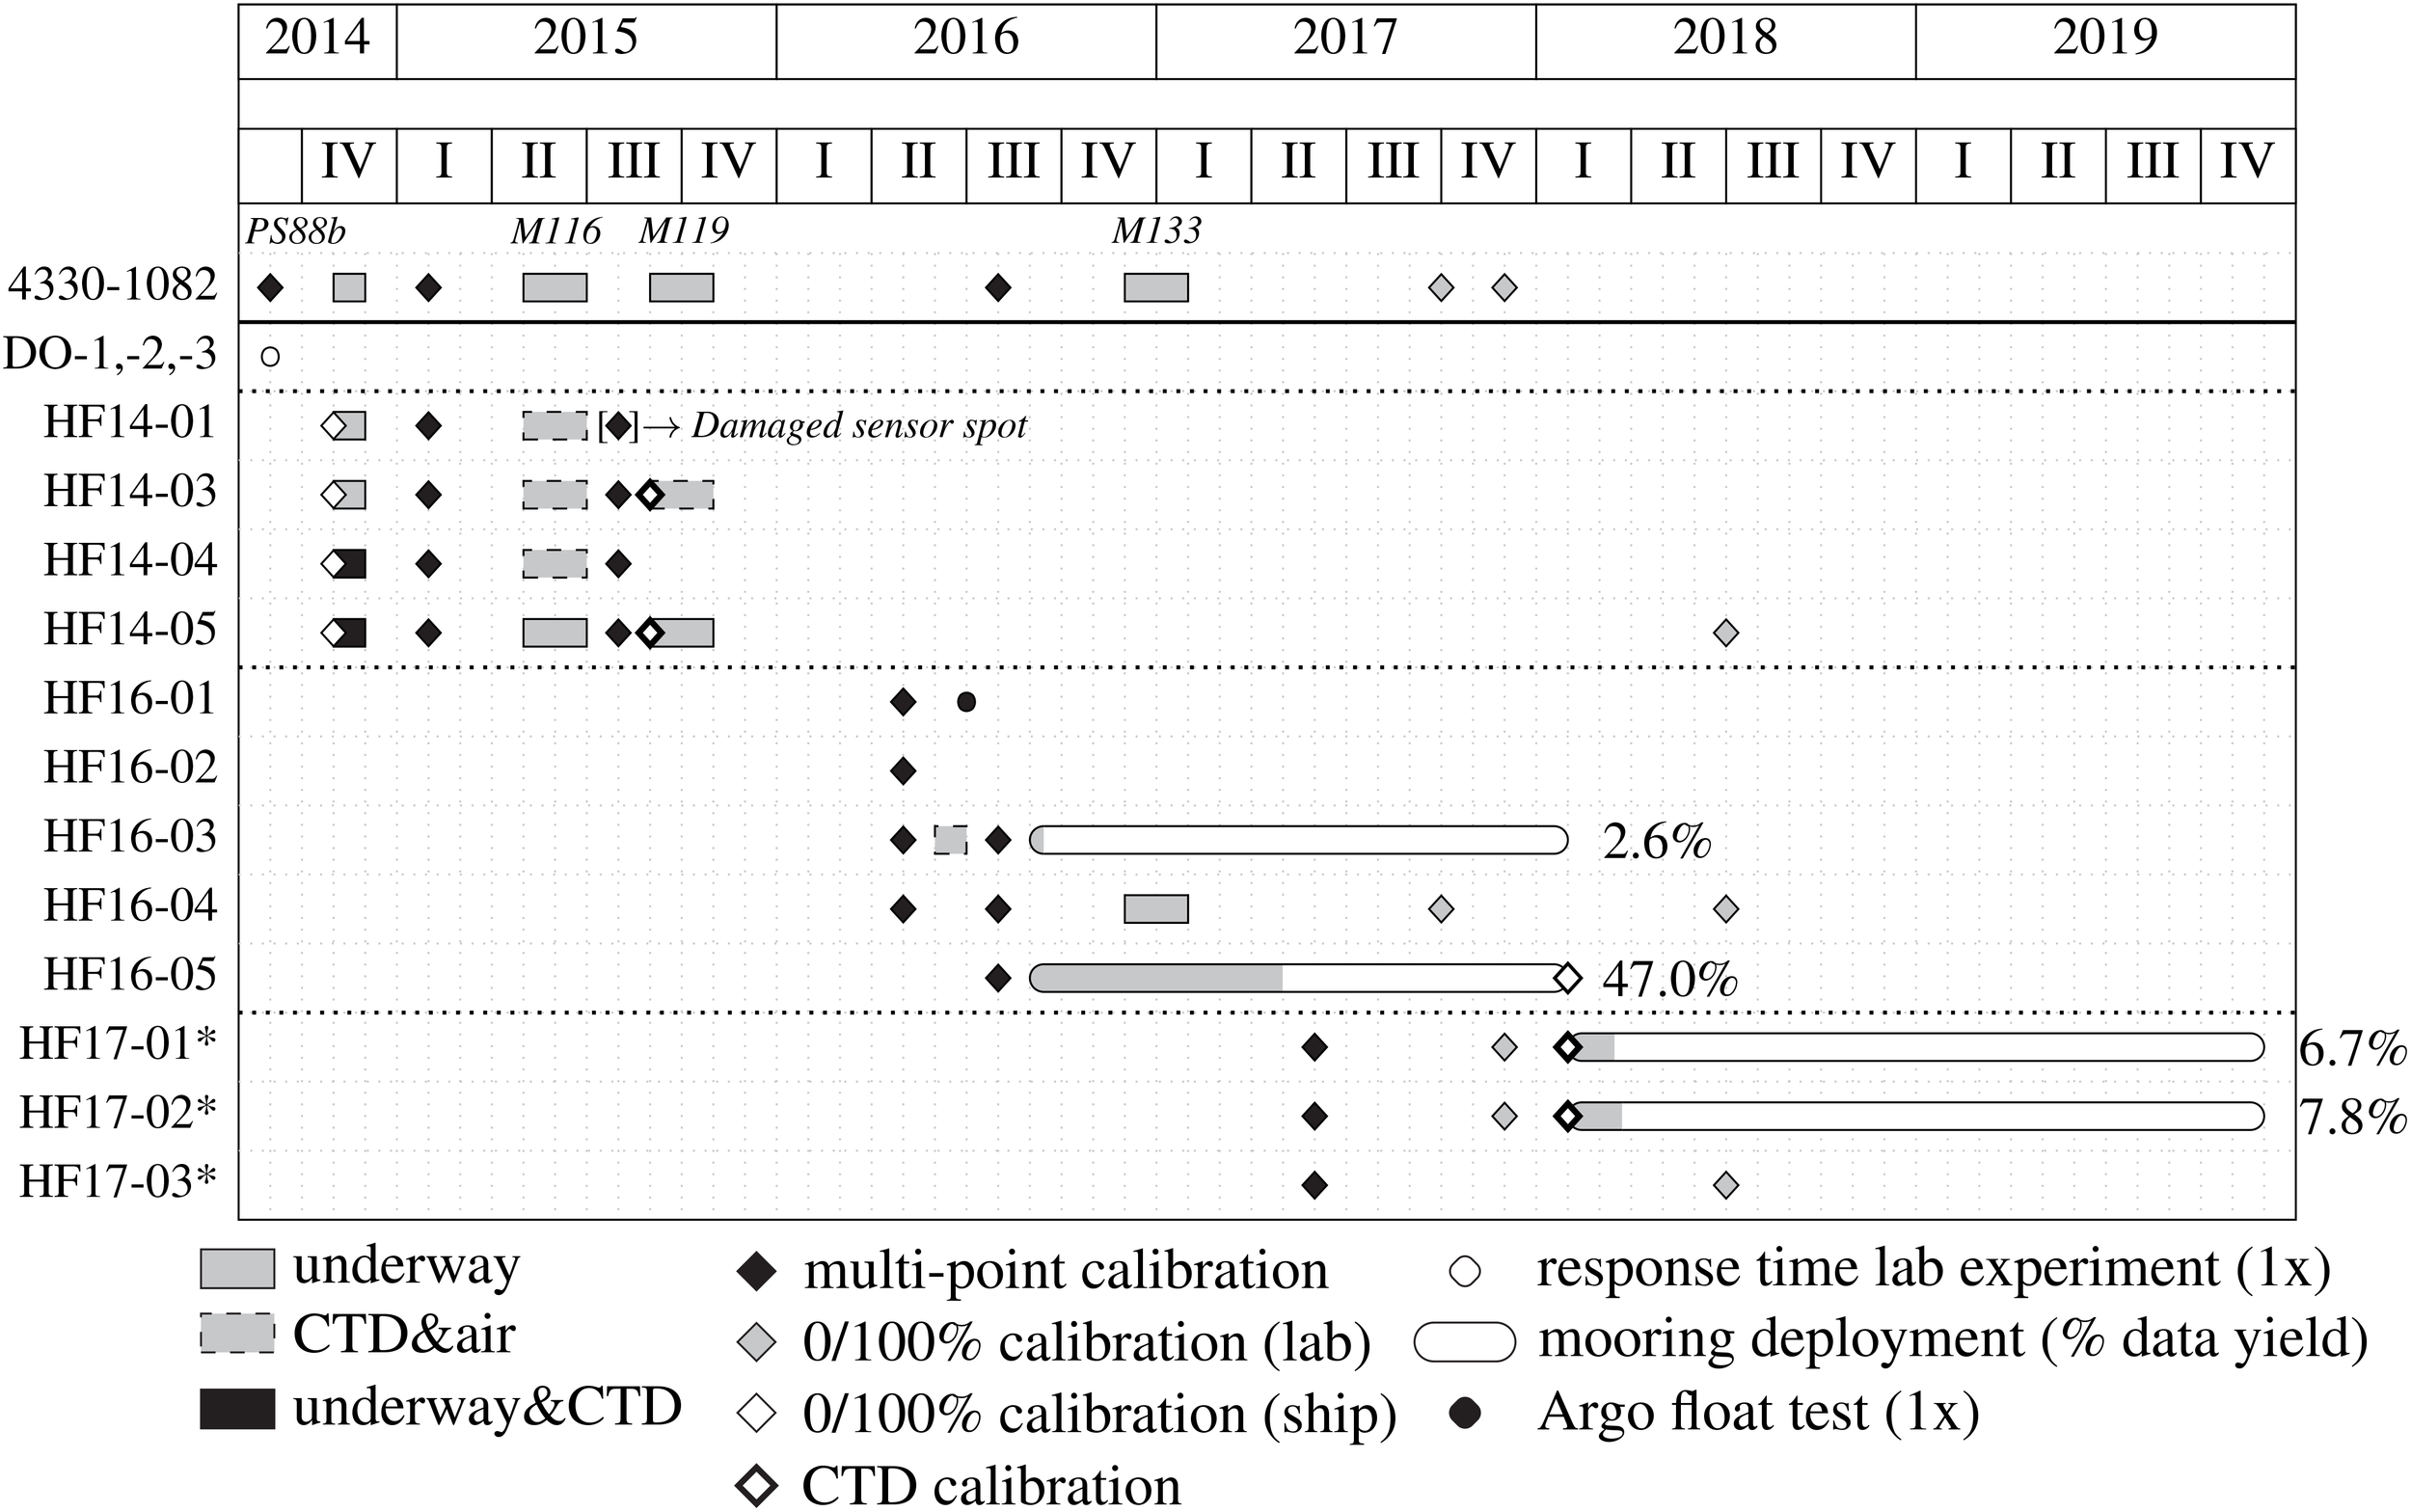
Timeline of all CONTROS HydroFlash® O2 optodes used in our assessment. The asterisks (*) in HF17-01,-02,and -03 note that the calibration coefficients of these three optodes were obtained from a multi-point, factory calibration (and not in our GEOMAR lab). A long-used Aanderaa 4330–1082 served as a reference optode several times throughout the entire period. The inventory in Supplementary Table S2 summarizes all the optodes used in our study with regards to sensor performance characteristics and field applications.
2.4.1 Underway observations
Data from underway (UW) measurements of surface water oxygen concentration are used to illustrate the salinity dependence. For this purpose, oxygen partial pressure, total gas tension, temperature, and salinity were measured in a thermally insulated flow-through box onboard the R/V METEOR cruise M116/1 in the Tropical North Atlantic. A submersible pump supplied a continuous flow of surface water to the underway instruments in the flow-through box and to a bypass for discrete water sampling. Besides the HydroFlash O2 optode HF14-05, the following sensors were deployed and co-located: a) Aanderaa oxygen optode 4330 (S/N 1082, Aanderaa Data Instruments AS, Bergen, Norway), b) GTD gas tension devices (S/N 22-019-06, TDGP S/N 38-511-31, Pro Oceanus Inc., Bridgewater, Canada; turbulent water flow and mixing was ensured through an extra SBE 5T pump), and c) conductivity sensor (model 4319, S/N 772, Aanderaa Data Instruments AS, Bergen, Norway). The measuring interval was set to 60 s. Winkler samples were taken from a bypass to compare and validate oxygen underway measurements, and subsequently measured onboard using the Winkler titration method. Final calibrated reference temperature and salinity were obtained from the shipboard thermosalinograph (Krahmann, 2019). Atmospheric pressure was obtained from the DSHIP data system. More details are given in the cruise report (Visbeck, 2016).
2.4.2 Operating the HydroFlash O2 on a CTD rosette
For the field experiments on hydrostatic pressure and time dependence, the optodes HF14-01, HF14-03, and HF14-04 were attached to deep (near-bottom) profiling casts of a CTD (conductivity - temperature - depth) rosette frame as close as possible to the inlet of the SBE 43 during the R/V METEOR cruise M116/1. Continuous oxygen data from the SBE 43 were used for evaluation, which itself was calibrated against oxygen Winkler concentration values from bottle data during upcasts (Tanhua, 2018). Optode data during each CTD cast were logged internally every 1–2 s using the power supply of the HydroB® Flash battery module. All three optodes were multi-point calibrated beforehand, yet were not re-adjusted directly prior to deployments. Since the time responses of HydroFlash O2 optodes and the SBE 43 are in the same order of magnitude of a few seconds (see section 3.6), a response time correction was not applied. Bittig and Körtzinger (2015) discuss two counteracting effects when optodes measure with increasing hydrostatic pressure: one alters the quenching process (O2 dependent, including temperature dependence), and the other the luminophore itself (O2 independent). Following their sophisticated efforts to disentangle both processes in the laboratory, they also state that a clear distinction is not possible under field conditions. Therefore, we performed a pressure correction based on their recommendations with only one degree of freedom, using a non-linear fit to minimize the offset between the optode and reference (CTD) oxygen data:
The left term accounts for a possible optode drift between calibration and deployment and the right term quantifies the optode dependence in % per 1,000 dbar.
2.4.3 Operations on a mooring
Optode data of one HydroFlash O2 sensor HF16-05 (six optodes were deployed in total during three mooring deployment periods) from a deployment at the Cape Verde Ocean Observatory (CVOO) mooring was used to assess the long-term stability. This optode was deployed at a nominal water depth of 176 m with subsequent in-situ CTD calibration (eight calibration stops) and 0 and 100 oxygen saturation lab calibration following the procedures of Hahn et al. (2014), and compared to reference oxygen optode data from the mooring deployment dataset (Brandt et al., 2025). HydroFlash O2 data during the mooring deployment were recorded internally every 10 min by connecting the manufacturers battery module and readout after recovery.
2.4.4 Implementation on an Argo float
A proof-of-concept implementation of a CONTROS HydroFlash® O2 optode on a PROVOR Argo float was successfully achieved in collaboration with the Laboratoire d’Océanographie de Villefranche-sur-Mer (LOV). The optode was entirely integrated in the top structure, power supply, and data string transmission of the float next to a CTD and 4330 optode. A picture of the schematic setup on the float head is shown in AtlantOS 3.14 deliverable (Obolensky et al., 2019).
2.5 Data analysis
The entire data evaluation, analysis, and plotting were performed with MATLAB® (The MathWorks Inc, 2015). Several MATLAB® codes for the calibration and the fit model type calculation of all optodes were collaboratively shared by Henry Bittig. Fit models were Aanderaa high-order polynomials “3x4b” (Aanderaa Data Instruments AS, 2006, 14 coefficients) and “5x5b” (Aanderaa Data Instruments AS, 2009, 21 coefficients) and the more physical based models "McNeil & D'Asaro (2014)" (McNeil and D’Asaro, 2014), “Uchida et al. (2008)” (Uchida et al., 2008), and “Bittig et al. (2018)” [Bittig et al. (2018a), a modification of Uchida et al. (2010)]. The refit based on two-point calibrations was performed as suggested in Bittig et al. (2018a). Three figures were created using the scientific color toolbox from Crameri (2018) for better visualization (see section Acknowledgments).
3 Results
A total of 13 CONTROS HydroFlash® O2 optodes were utilized throughout this study. Figure 3 illustrates a timeline of the deployment of the optodes in the laboratory and field experiments. This overview contains information on time, cruise number, and all sensor versions, such as serial number, acronym, and type of experiment. We investigated several optode versions from 2014, 2016, and 2017, which underwent development stages for improvement at the manufacturer.
Fieldwork included measurements on the two different research cruises M116/1 (Visbeck, 2016) and M119 (Brandt, 2016) with application on CTD, underway system, and mooring. A previous research cruise (PS88b; Knust and Niessen, 2016) in 2014 served to pre-test the performance during underway and CTD deployments. Full periods between deployments, i.e., mooring and underway (M133; Visbeck et al., 2017), are shown for completeness in order to reconstruct the entire lifecycle of each sensor.
All lab- and ship-based oxygen Winkler measurements were not corrected for the blank concentration, as recommended by Langdon (2010), because the blank determination was not performed, and the devices were only accurate to 0.01 mL. We considered an offset of about 0.23 mol L-1 (based on three calibrations and assumptions) negligible.
3.1 General sensor remarks
The data readout of the HydroFlash O2 contains raw and internally calculated oxygen-derived values. However, we generally advise recalculating oxygen parameters based on the best-available calibration coefficients and environmental variables such as temperature, salinity, and pressure, as recommended in the QC procedures by the SCOR WG 142 (Bittig et al., 2018b).
We experienced an internal reset of time stamp information in the data string after the 3 V battery of the motherboard died, thus resulting in data losses when measuring time-related optode parameters. Therefore, we advise replacing the internal battery regularly, especially prior to deployments with a sole energy supply from the external CONTROS HydroB® Flash battery pack. Otherwise, internal settings (e.g., time stamp or measuring interval) and data are not saved upon power disconnection.
In the earlier versions, the optode temperature was off by a few tenths of a °C, thus we advise to always have an accurate temperature reference at hand for scientific analysis beyond optode specific , especially with environmental data. HF17-versions were delivered with temperature coefficients for recalculation of the temperature output from the thermistor value. We noticed invalid raw values in the data string during our two-point calibration. However, the difference in the output optode temperature was only about 0.0015 °C based on data from subsequent field measurements and was thus close to the best available temperature.
The convex shape of the lenses may have a better utilization of the sensor spot area compared to the total area of the lens, yet we observed flaking of the sensor spots (black isolation layer and luminophor dye). This can be seen visually and is pronounced in the raw and oxygen-derived data, e.g., expressed in the high RMSE of a calibration (see HF14–01 in multi-point calibration 2; Table 1; Supplementary Figure S5). Moreover, we also noticed that air bubbles could sometimes be trapped more easily in our calibration setup compared to 4330 optodes, which use flat foils, thus requiring extra effort to ensure bubble-free conditions.
Table 1
| Optode | Fit model type | Calibration: Multi-point #, Time, Name |
Calibration points n full (3 RMSE criterion) | ||||
|---|---|---|---|---|---|---|---|
| 3x4b | 5x5b | McNeil & D'Asaro (2014) | Uchida et al. (2008) | Bittig et al. (2018) | |||
| RMSE / μmol L-1 | |||||||
| 4330-1082 | 0.95 | 0.77 | 0.94 (0.83) | 1.12 | 0.92 | MP1, Feb 2015, PS88b |
45 (44) |
| HF14-01 | 1.34 | 1.23 (1.01) | 2.63 | 2.67 | 1.60 (1.35) | 45 (44) | |
| HF14-03 | 1.32 | 1.22 (0.97) | 2.37 | 2.88 | 1.60 (1.28) | 45 (44) | |
| HF14-04 | 1.29 | 1.18 | 2.60 | 2.23 | 1.75 | 45 | |
| HF14-05 | 1.05 | 0.97 | 1.66 | 2.16 | 1.46 | 45 | |
| 4330-1277 | 1.42 | 1.10 | 1.55 | 1.61 | 1.38 | MP2, Aug 2015, optodeAGweb |
45 |
| HF14-01* | 6.34* | 5.84* (3.60*) | 13.19* | 8.62* | 7.49* | 45 (43) | |
| HF14-03 | 1.86 | 1.75 (1.311) | 1.99 (1.762) | 2.56 | 1.96 (1.742) | 45 (1:43, 2:44) | |
| HF14-04 | 4.26 (1.751) | 4.01 | 4.56 (2.092) | 4.76 (2.461) | 4.33 (2.181) | 45 (1:42, 2:41) | |
| HF14-05 | 1.82 | 1.71 (1.49) | 1.93 (1.70) | 2.35 | 1.89 | 45 (44) | |
| 4330-2238 | 1.08 | 0.62 | 1.12 | 0.88 | 0.88 | MP3, Apr 2016, HydroLOVfloat |
45 |
| HF16-01 | 2.03 | 1.08 | 3.91 | 5.81 | 3.58 (1.59) | 45 (42) | |
| HF16-02 | 2.53 | 1.17 | 3.94 (1.67) | 5.54 (1.65) | 3.52 (1.65) | 45 (42) | |
| HF16-03 | 1.94 | 1.56 | 2.12 | 2.17 (1.94) | 2.17 (1.94) | 45 (44) | |
| HF16-04** | 2.09 | 0.59 (0.301) | – | 5.01 (2.722) | 2.44 | 25 (1:24, 2:22) | |
| 4330-1082 | 0.97 | 0.41 | 0.97 | 0.94 | 0.93 | MP4, Aug 2016, CVOOandUW |
31 |
| HF16-03 | 0.98 | 0.46 | 1.05 | 1.04 | 0.97 | 31 | |
| HF16-04 | 1.83 | 0.51 | 2.84 | 8.43 | 3.36 (2.94) | 31 (30) | |
| HF16-05 | 1.38 | 0.78 | 2.33 (1.841) | 2.89 (1.462) | 1.90 | 31 (1:30, 2:29) | |
| all 4330criterion | 1.11 0.22 | 0.73 0.29 | 1.12 0.31 | 1.14 0.33 | 1.03 0.24 | ||
| all HFcriterion | 1.66 0.44 | 1.20 0.89 | 2.17 0.72 | 2.88 1.94 | 1.79 0.50 | ||
| refit (c), (d) | Two-point # | full (n=1 at 0%) | |||||
|---|---|---|---|---|---|---|---|
| 4330-1082 | – | – | – | – | 0.54†, 0.57†† | TP1, 0/100%, Sep 2017, M133post |
8 |
| HF16-04 | – | – | – | – | 5.39† (2.92†), 5.17†† (2.67††) |
8 (4) | |
| 4330-1082 | – | – | – | – | 0.68†, 0.70†† | TP2, 0/100%,Dec 2017, CVOO2018 |
7 |
| HF17-01*** | – | – | – | – | 1.03†, 1.03†† | 7 | |
| HF17-02*** | – | – | – | – | 1.08†, 1.08†† | 7 | |
| SBE 63-392 | – | – | – | – | 1.77†, 1.75†† | TP3, 0/100%,Jun 2018, PS114wave |
8 |
| HF14-05 | – | – | – | – | 2.20†, 5.39†† | 8 | |
| HF16-04 | – | – | – | – | 4.61† (4.15†), 4.90†† (4.83††) | 7 (4) | |
| HF17-03*** | – | – | – | – | 1.27 †, 1.28†† | 8 |
Overview of all laboratory CONTROS HydroFlash® O2 optode calibrations performed in this study.
In total, four different multi-point (MP) and three two-point (TP) calibrations in the O2-T--parameter space were conducted. The RMSE (in μmol L-1) of the different fit model types was determined by applying them to the response of each optode. Each run was controlled either by a 4330 or SBE 63 as a reference optode (see Supplementary Figures S1, S2 for examples of calibration reference figures). Fit models were Aanderaa high-order polynomials “3x4b” (Aanderaa Data Instruments AS, 2006) and “5x5b” (Aanderaa Data Instruments AS, 2009) and the more physics-based models “McNeil & D’Asaro (2014)” (McNeil and D’Asaro, 2014), “Uchida et al. (2008)” (Uchida et al., 2008), and “Bittig et al. (2018)” [Bittig et al. (2018a), a modification of Uchida et al. (2010)]. These results are partly illustrated in section 3.2. Respective times and names of each calibration are given for the drift calculations in section 3.5, while the total amount of n calibration points (full and within 3 × RMSE criterion) for each optode and fit model type is given for clarification. Symbols indicate (*) a damaged sensor spot due to flaking of the coating (see HF14-01 in MP2); (**) issues at low temperatures (2 °C and 7 °C, see HF16-04); (***) optodes HF17-01, -02 and -03 which received a multi-point calibration, including coefficients (for T and ) from the manufacturer KM Contros; (†) slope on and [Bittig et al. (2018a), refit equation (c)]; (††) slope on , and offset on [Bittig et al. (2018a), refit equation (d)].
3.2 O2 and temperature dependence and calibration: accuracy and precision
The electrochemical calibration setup used in this study is suitable for calibrating HydroFlash O2 optodes. The 0.02 M NaOH carrier solution (pH = 12.3) does not damage the sensor spot. A maximum of 6–7 reference points per day were taken to ensure a fast calibration time frame within 3–4 weeks, including repetition of erroneous reference points. Details of the calibration setup and optode parameters (e.g., and O2 concentration plots, O2 generator settings) are analogous to those in Bittig et al. (2012). The deviations at zero oxygen levels do not indicate any significant deteriorating effect when the optodes are only submerged into the water partially at the 0 % reference points during our calibrations. However, full submersion of any optode ensuring temperature stabilization is always favored. In total, 12 HydroFlash O2 optodes underwent four different multi-point (MP) and/or three two-point (TP) calibrations in our laboratory. The RMSE varied with the quality of each calibration run, the optode itself, and the mathematical model applied to the optode’s response. Table 1 provides a detailed and quantitative overview of each individual optode. Figure 4 summarizes the mean RMSE values of all HydroFlash O2 optodes for each multi-point calibration. Overall, high-order polynomial models yielded RMSEs of 1.66 ± 0.44 µmol L-1 (“3x4b”, 14 coefficients) and 1.20 ± 0.44 µmol L-1 (“5x5b”, 21 coefficients). In comparison, the mean RMSE from the three more physics-based models (with 6 and 7 coefficients, respectively) was 2.17 ± 0.72 µmol L-1 ("McNeil & D'Asaro (2014)"), 2.88 ± 1.94 µmol L-1 (“Uchida et al. (2008)”) and 1.79 ± 0.50 µmol L-1 (“Bittig et al. (2018)”). The combination of the number of calibration points considered and the model type fit has an effect on the quality of the calibration. The model “5x5b” with 21 polynomials yielded a very low RMSE with a lower number of calibration points, as can be seen in MP4 (n = 31) compared to MP1–MP3 (n = 45), but the model is strictly valid only in the calibrated O2-T-range. Among the physically based models, “Bittig et al. (2018)” yielded the lowest RMSE for the HydroFlash O2 optodes. Our results confirm the statements by Bittig et al. (2018) that physical models with only few coefficients better interpolate and extrapolate the scattered calibration data compared to high-order polynomial mathematical models, and therefore determine the behavior of the optode through a functional model for partial pressure pO2 (see Equation 4) and low RMSE.
Figure 4
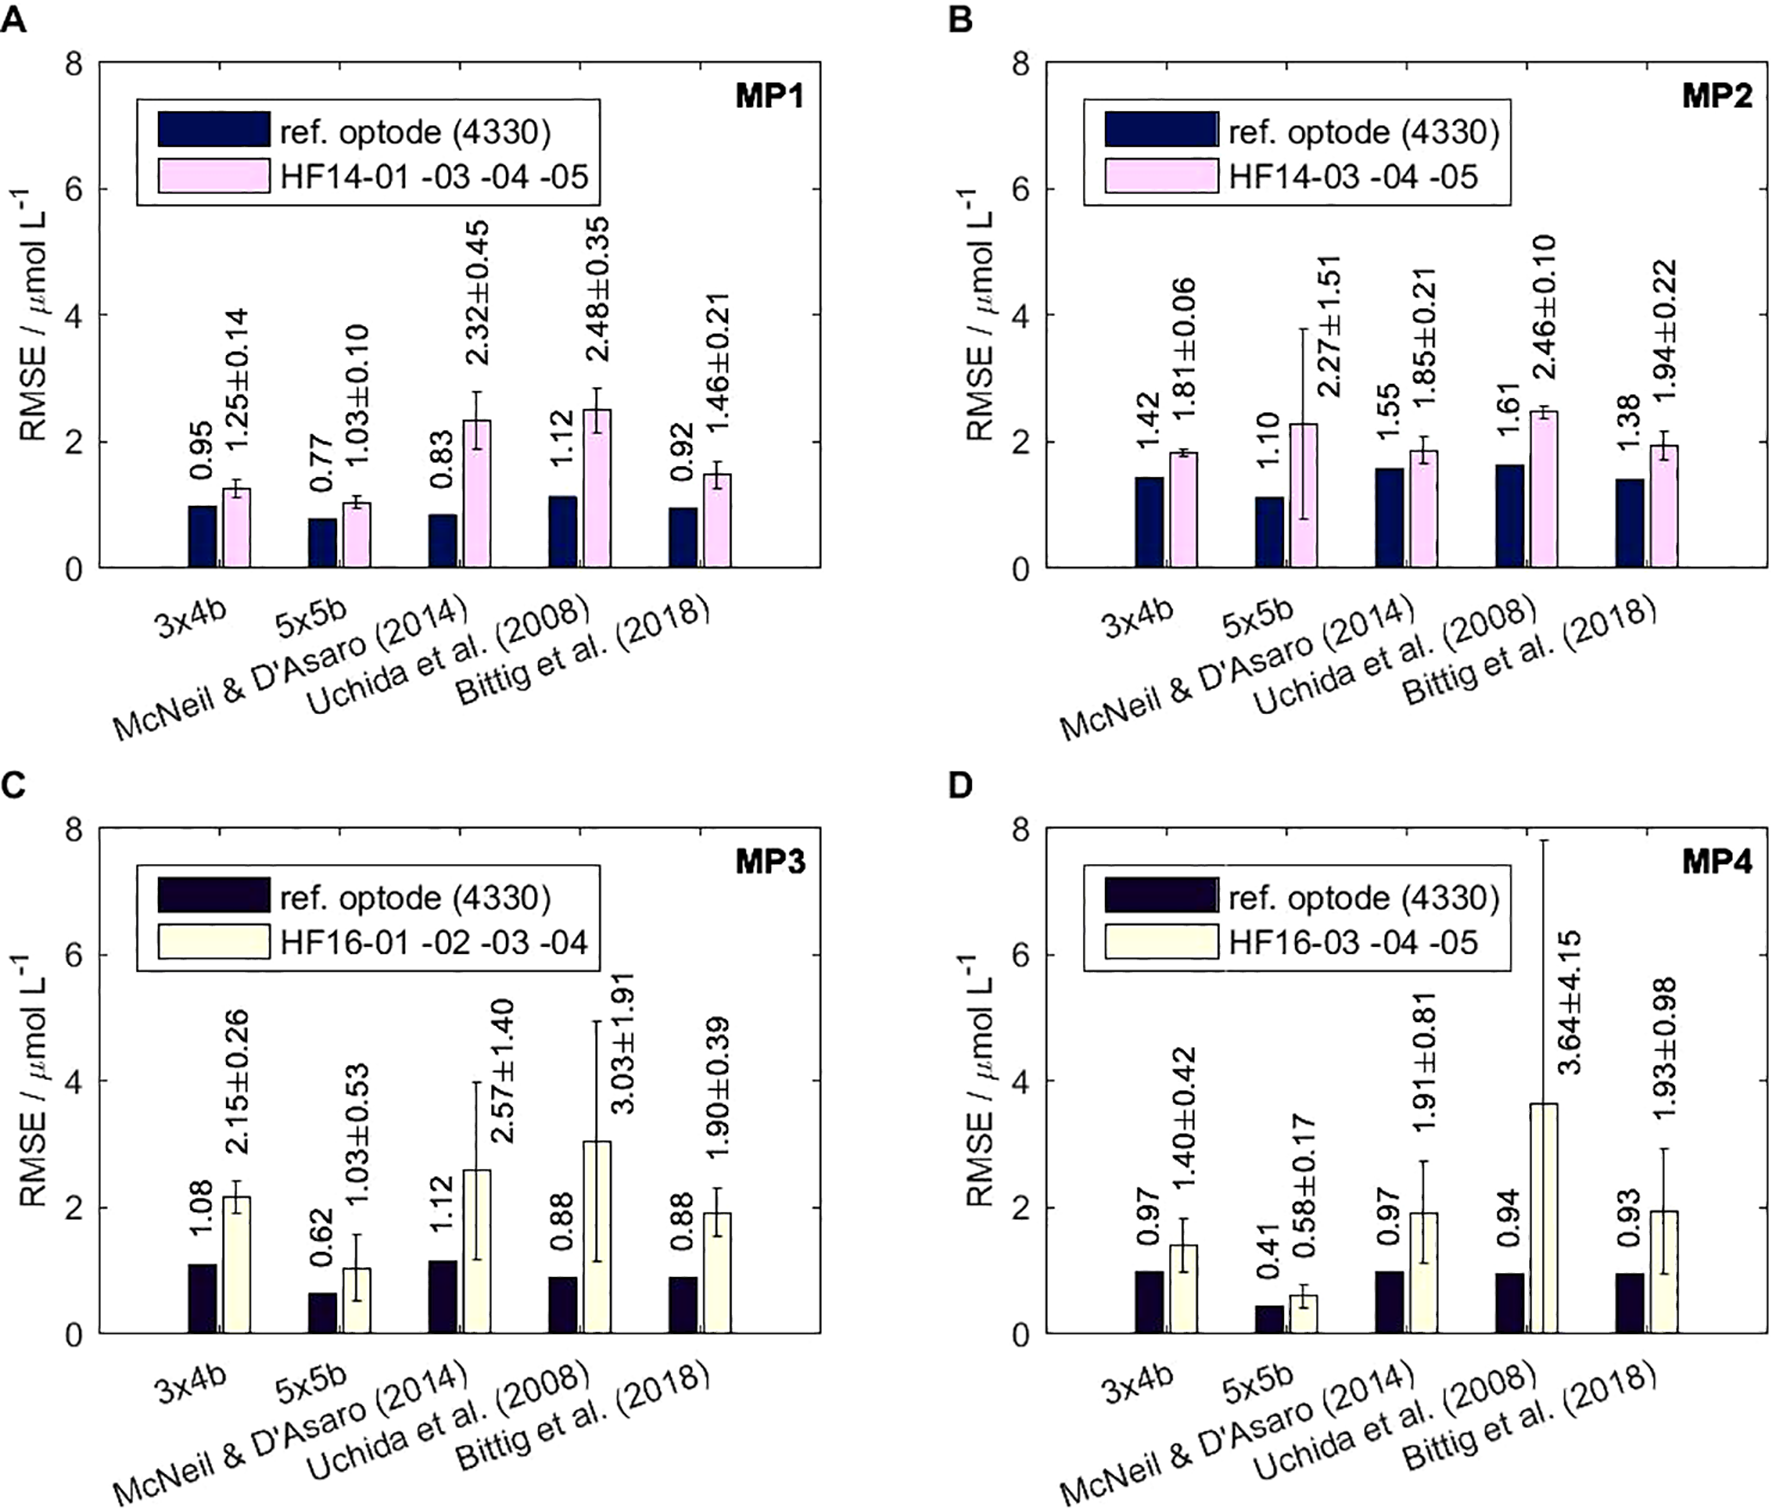
Four different laboratory multi-point calibrations (A–D) were conducted with nine individual CONTROS HydroFlash® O2 optodes in order to find the fit model type with the lowest RMSE. Each panel shows the mean and standard deviation of RMSE (in µmol L-1) of several optodes for five different fit model types during each of the calibration runs, including an additional reference optode (4330 or SBE 63). Only calibration points are considered that lay within the 99 % confidence interval (3 × RMSE criterion) to avoid outliers. Taking all the calibrated HydroFlash O2 optodes into account, the mean RMSE for the respective model types are 1.66 ± 0.44 µmol L-1 for “3x4b” [Aanderaa Data Instruments AS (2006)], 1.20 ± 0.89 µmol L-1 for “5x5b” [Aanderaa Data Instruments AS (2009)], 2.17 ± 0.72 µmol L-1 for "McNeil & D'Asaro (2014)" [McNeil and D’Asaro (2014)], 2.88 ± 1.94 µmol L-1 for “Uchida et al. (2008)” [Uchida et al. (2008)], and 1.79 ± 0.50 µmol L-1 for “Bittig et al. (2018)” [Bittig et al. (2018a), a modification of Uchida et al. (2010)]. Detailed results for each individual optode are given in Table 1, where the effect of a damaged sensor spot on the RMSE is quantified for optode HF14-01 in MP2 and was therefore considered invalid.
Individual optode calibrations are necessary to obtain high-quality measurements. All model fits of the reference optodes (see Supplementary Figures S1, S2 for examples of reference calibration figures) yielded lower RMSE independent of the model used, compared to all HydroFlash O2 optodes. However, the fit results still differ due to the quality of the respective multi-point calibration, which yielded 1.02 ± 0.29 µmol L-1 over all the models of the reference optodes. MP2, in particular, yielded a higher RMSE because the oxygen generator was subject to oscillations at very high O2, with difficulties in reaching stable sampling conditions. The standard deviations of all the HydroFlash O2 optodes within each calibration run exceeded ±1 µmol L-1 in 4 out of 20 (→20 %) of all cases. In the model “Uchida et al. (2008)” of MP4, the standard deviation was even higher than the mean. Nevertheless, our results show that HydroFlash O2 optodes can be calibrated in a reproducible manner.
Figure 5 illustrates a calibration result of the HydroFlash O2 optode HF16–03 from MP4 and based on the fit model type “Bittig et al. (2018)”. The optode was calibrated to a RMSE of 0.97 µmol L-1 based on 31 reference points. This was the lowest RMSE we achieved throughout all the multi-point calibrations. The fitted surface is valid for oceanic applications, i.e., 2 °C–32 °C, 0–377 µmol L-1 (0–275 mbar, 0 – approx. 136 % O2 saturation). The phase shift (response signal) within the O2-T-parameter space showed non-linear Stern–Volmer behavior. However, we detected two distinctive features in optode model versions HF14 and H16. For HF14, elevated deviations occurred at low temperatures (2 °C–7 °C) and high O2 concentrations, which we did not observe in the latter optode versions (see Supplementary Figures S3, S4 for clarification). Besides HF16-03, all the other calibrated HF16-optodes in this study showed a diverging response towards higher at 0 % O2 and with decreasing temperatures from 22 °C downwards (see Figure 6). Both features affect the adjacent reference points and the overall RMSE. This leads to a violation of the 3 × RMSE criterion (99~% confidence interval), thus, we calculated the fitted surface and RMSE iteratively until the criterion was fulfilled. Two examples are given to explain the effect of the diverging response on the RMSE. In MP3, optode HF16-04 yielded 2.44 µmol L-1 at all available points, including 0 %, while it yielded 1.26 µmol L-1 with only one reference point at 0 %. The improvement was more evident in MP4 for the same optode, with 2.94 µmol L-1 at full calibration (within the 3 × RMSE criterion) and 1.05 µmol L-1 with one 0 % reference point.
Figure 5
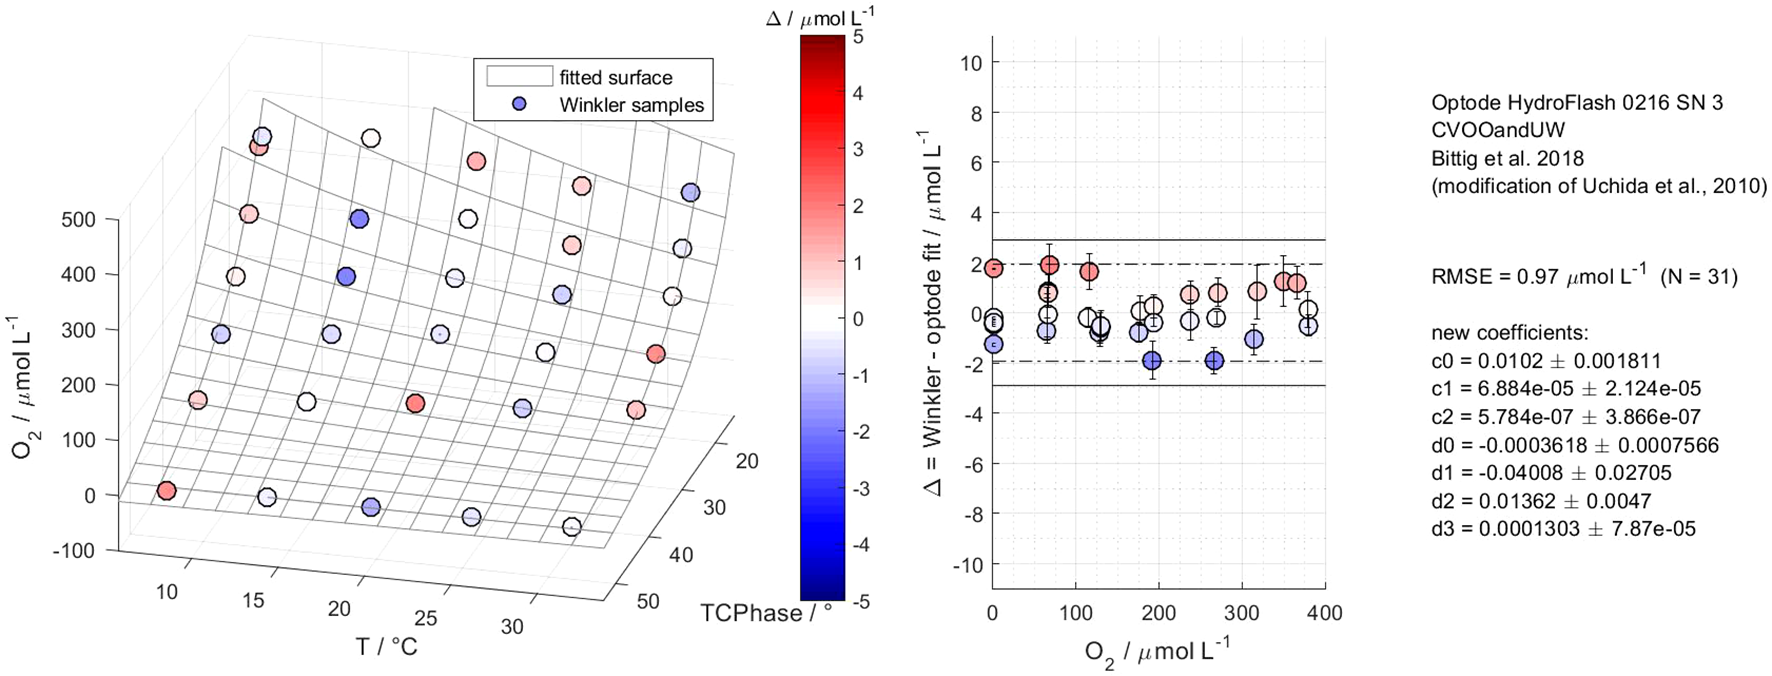
Calibration results of the CONTROS HydroFlash® O2 optode HF16-03 from multi-point calibration 4 based on fit model type “Bittig et al. (2018)”. The left panel illustrates the fitted surface of the optode and residuals of reference Winkler samples in the O2-T--parameter space, covering 2 °C–32 °C, 0–377 μmol L-1 (0–275 mbar, 0 %–136 % O2 saturation), and 31 reference points. The middle panel shows these residuals as a function of oxygen concentration and within the 2 × RMSE (95 % confidence interval, dashed line) and 3 × RMSE (99 % confidence interval, solid line) criteria. The fitted surface in this model type shows the typical non-linear Stern–Volmer behavior with no dependence of the residuals on oxygen concentration. The right panel displays all relevant optode information of the respective calibration run, fit model type, RMSE, and calibration coefficients, including the accuracy of the Winkler and optode measurements as the sum of their standard deviations.
Figure 6
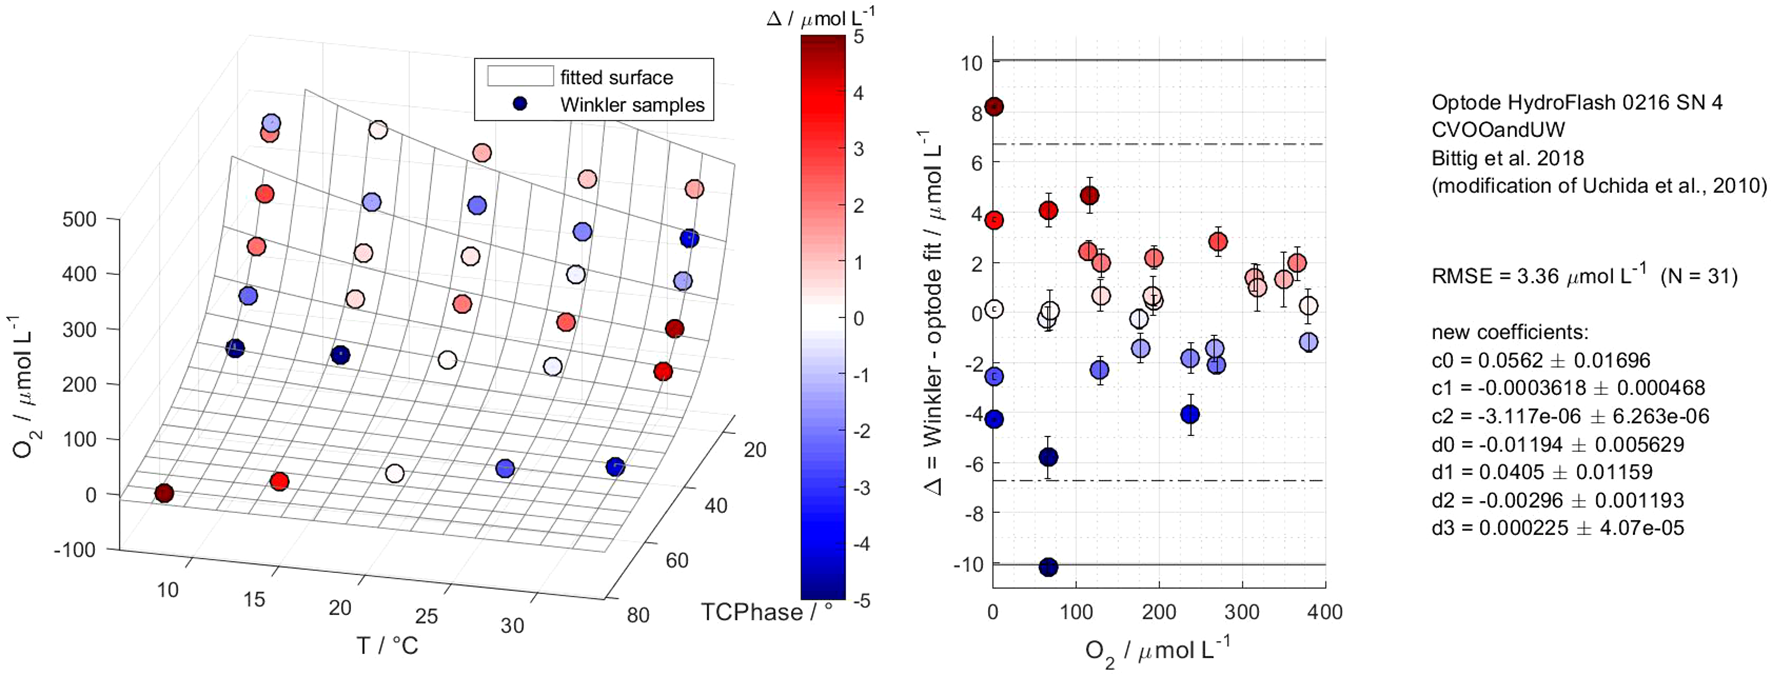
Calibration results of the CONTROS HydroFlash® O2 optode HF16-04 from multi-point calibration 4 based on fit model type “Bittig et al. (2018)”. Except for HF16-03, all the other calibrated HF16-optodes in this study (here: HF16-04) show a diverging response towards higher at 0 % O2 and with decreasing temperatures. This affects the adjacent reference points and RMSE, i.e., a potential violation of the 3 × RMSE criterion (99 % confidence interval, solid line; see middle panel) occurred. Hence, the fitted surface and RMSE were recalculated iteratively until the criterion was fulfilled.
Data from all multi-point calibrations confirm the non-linear Stern–Volmer against O2 behavior of the HydroFlash O2 optode (see Figure 7). The chemical environment of the luminphor makes the Stern–Volmer ratio in the HF16-versions (A, upper branch) more sensitive towards changes in levels than the HF14-versions (A, lower branch). Especially between zero to low O2 levels, the change in lifetime was relatively large and indicated high oxygen sensitivity.
Figure 7
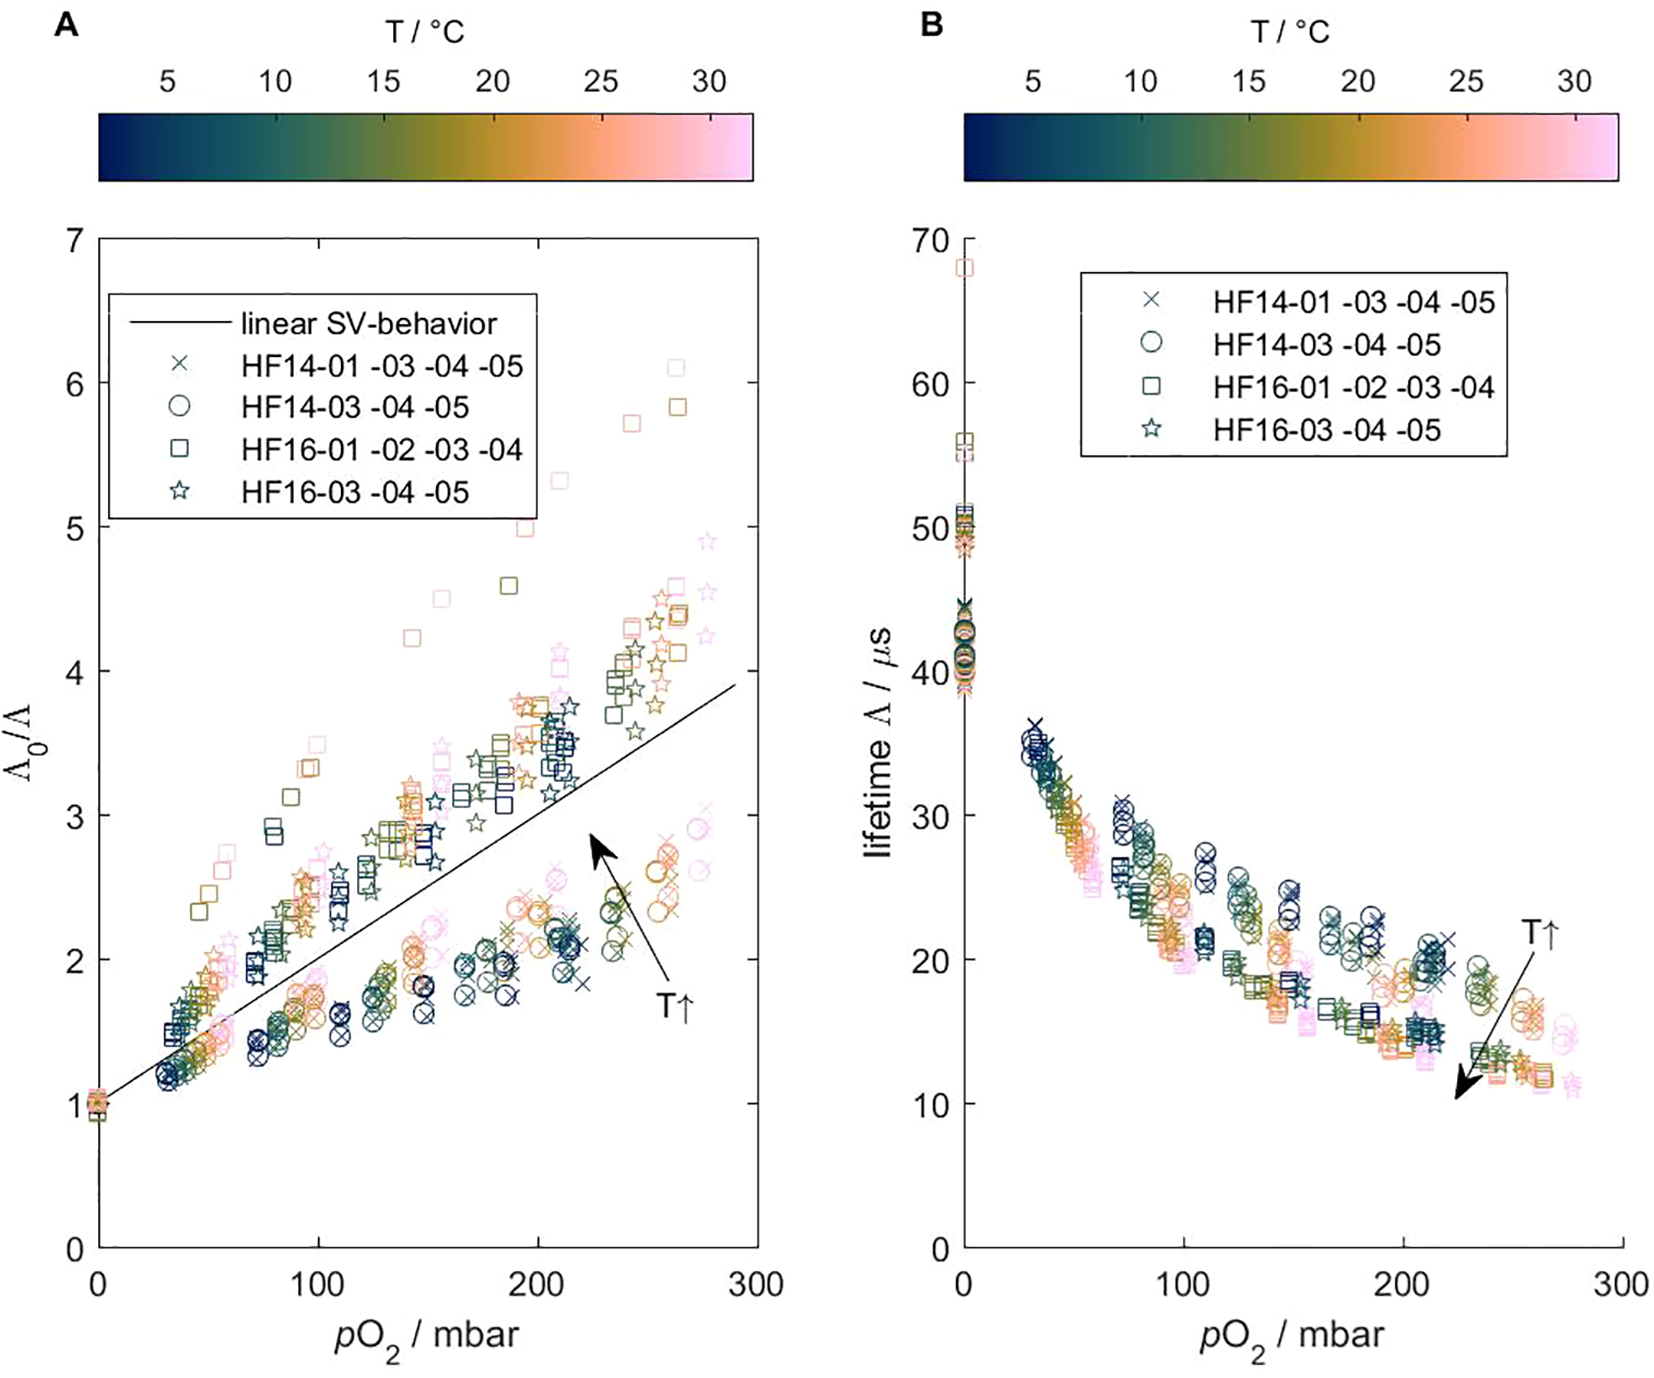
Stern–Volmer ratio Λ0/Λ (A) and lifetime(B) vs. partial pressure () of the CONTROS HydroFlash® O2 optode from data from all multi-point calibration data. These plots are based on the conceptual illustrations of Bittig et al. (2018a) and confirm the non-linear behavior of this optode (lifetime Λ always is). Obvious characteristics are (1) the opposite, non-linear patterns of HF14- and HF16-versions (A), and (2) the effect of temperature (A, B). See section 2.1 for more information about the chemical environment of the luminophor.
Regarding the refit based on two-point calibrations, there was no clear evidence which of the two refit equations (c) (slope factor on both phase and ) or (d) (slope factor on , offset on ) after Bittig et al. (2018) works better for the optode versions before HF17. HF14-05 (TP3) could be refitted to 2.20 µmol L-1 using refit (c), whereas HF16-04 yielded equivocal results. A higher RMSE may occur due to its diverging behavior at 0 %, yielding at best 4.15 µmol L-1 in TP3 and 2.67 µmol L-1 in TP1. In the newer HF17-versions, similar RMSE values were yielded independent of refit (c) or (d) and were between 1.03 and 1.28 µmol L-1. These results were based on the calibration coefficients from the manufacturer for fit model type “Bittig et al. (2018)”, temperature ranges between 5 °C and 35 °C, and O2 partial pressure between 0 and 300 mbar.
For the HF16-models, we found that re-adjustments performed outside from the O2---parameter space from the original calibrations yielded higher RMSE (see Supplementary Figures S9, S10), especially if the optode drifted over time (for drift behavior, see section 3.5). Re-adjustments of three HF17-optodes did not show a diverging response towards higher at 0 % O2 and with decreasing temperatures compared to HF16-optodes (except for HF16-03), thus indicating higher reproducibility among the same model version (see Supplementary Figures S6–S8).
3.3 Salinity dependence
Figure 8 shows the salinity dependence of the O2 concentration based on our field data. It covers 1 month of optode data from the HydroFlash O2 HF14–05 and a 4330 for comparison. The HydroFlash O2 optode responses to were as expected by the theory. The conversion to O2 concentration requires the consideration of in-situ salinity, which then matches with the RMSE of this optode, i.e., 1.46 µmol L-1, with both reference Winkler samples and 4330 optode data.
Figure 8
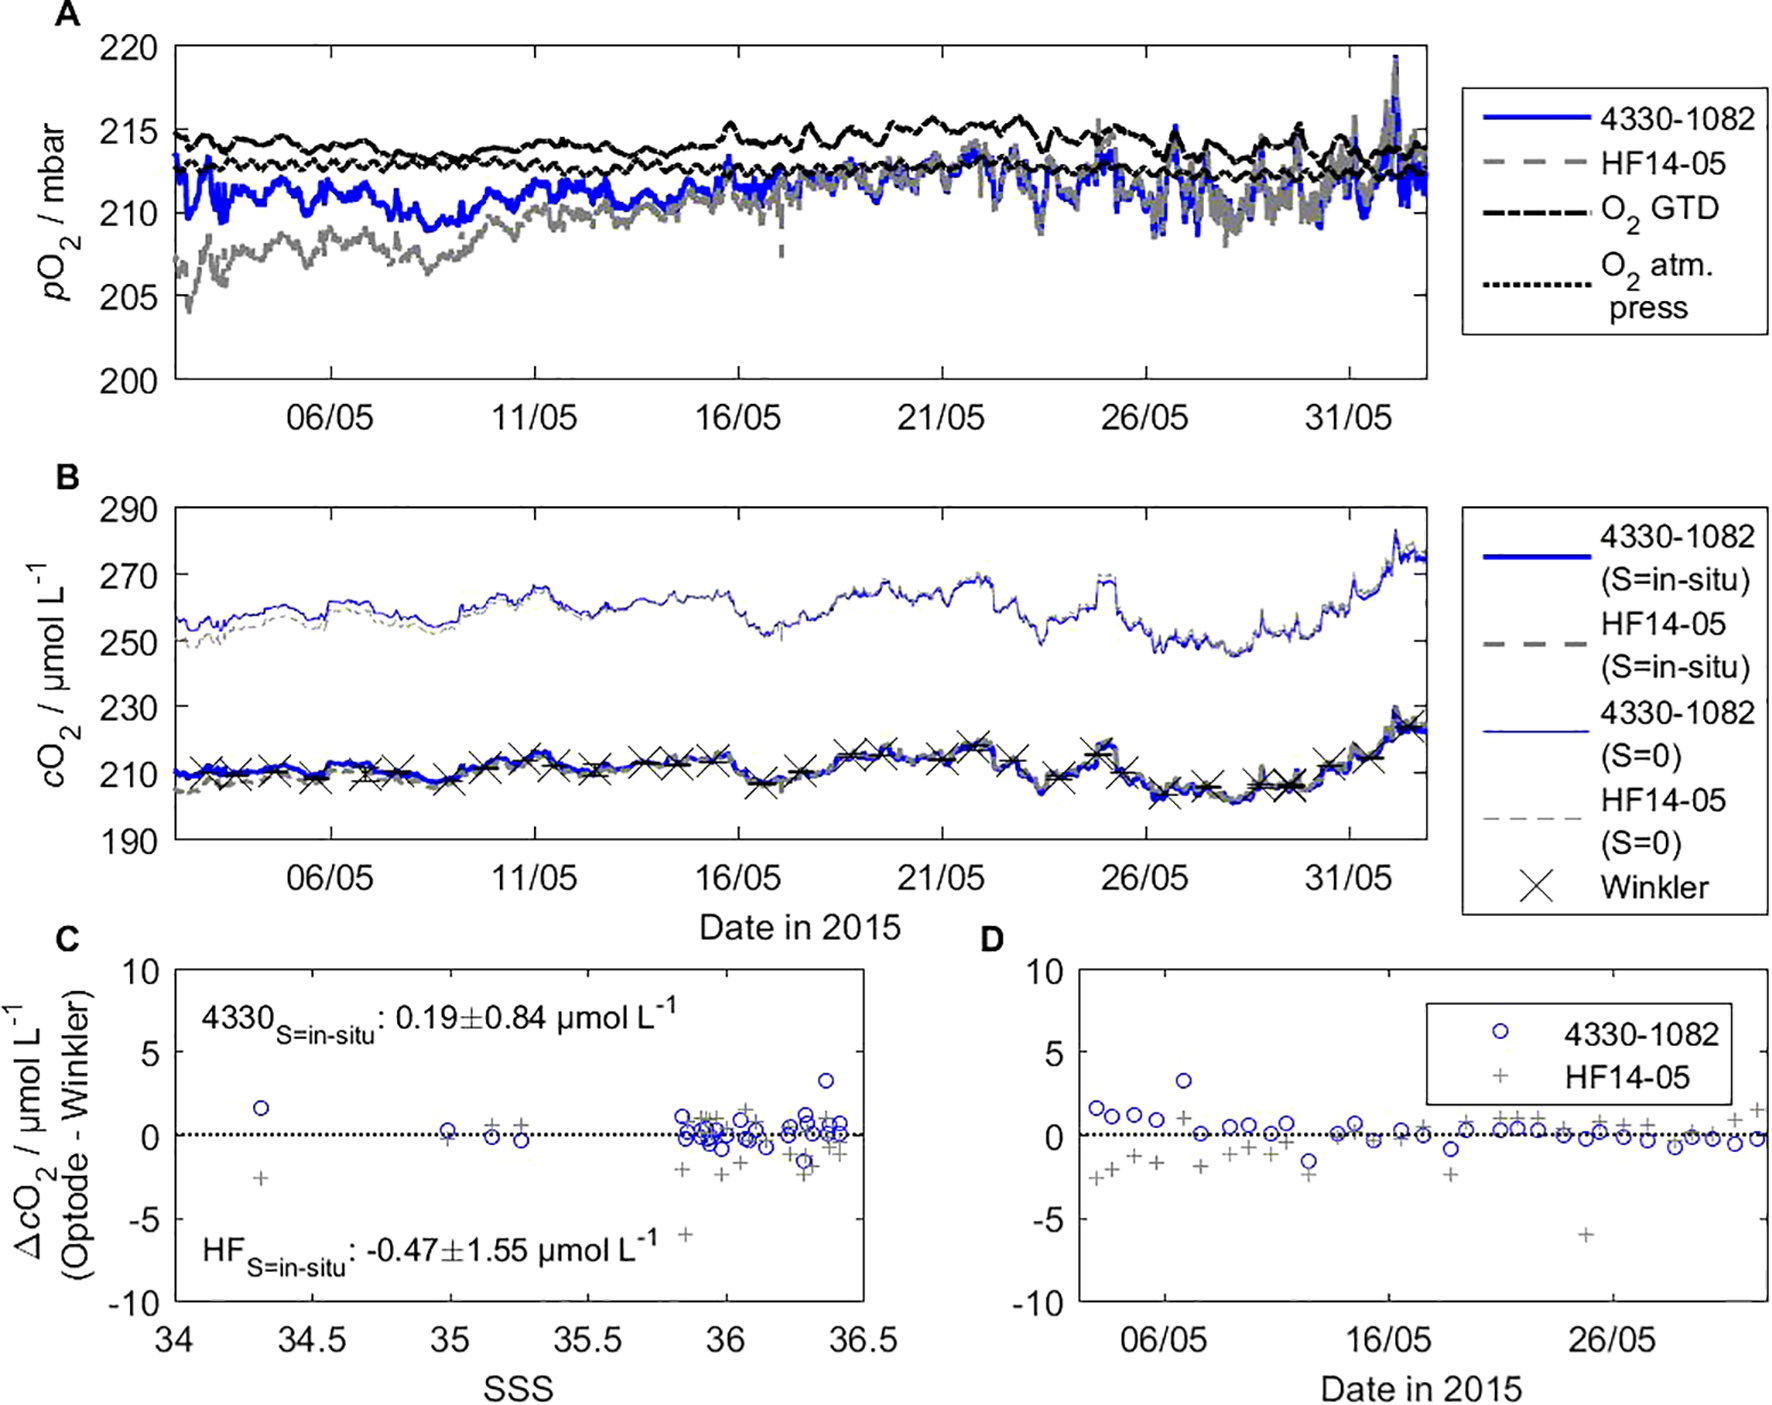
Salinity dependence of the O2 concentration is shown with field data that cover 1 month of optode data of the CONTROS HydroFlash® O2 HF14-05 and a 4330 for comparison. Calibrated pO2 data (A) is converted to oxygen concentration (B) with consideration of in-situ salinity from the shipboard thermosalinograph (TSG) and zero salinity. Ancillary data include O2 from in-situ total gas tension measurements (underway box), atmospheric pressure (DSHIP data), and regular Winkler samples (n = 32, mean of duplicates or triplicates) for reference. The quality of both sensors as well as the effect of salinity correction is given as a function of ΔpO2 between the optode and Winkler data over sea surface salinity (C) and time (D).
During our lab calibrations at 100 % O2 saturation levels using tab water, the RMSE improved by a few tenths of a µmol L-1 based on the calculated O2 concentration when applying a salinity value above (instead of) S = 0. On a side note, we recognized a small difference in salinity of 0.1–0.2 using ionic strength (based on the average tab water composition, see Supplementary Tables S3, S4) compared to our own conductivity measurements from random sampling, thus we advise using distilled water at 100 % saturation levels in order to avoid such small uncertainty.
Optodes HF14-01, HF14-03, and HF14-04 were used to investigate the hydrostatic pressure dependence (see section 3.4) and HF16-05 was used for the mooring deployment (see section 3.5.2), yet these can be considered as another set of field data for the valid salinity dependence of the O2 concentration calculated from which is measured by the optode.
3.4 Hydrostatic pressure dependence
Three HydroFlash O2 optodes measured successfully at a maximum pressure of 5,797 dbar during a total of five near-bottom CTD downcasts. We aimed for more profiles, however, problems with data logging occurred during the casts between profiles 32 and 38 (optodes HF14-03 and -04) because the cold temperature at depth decreased the power supply of the battery module below the necessary threshold. Figure 9 shows the vertical profiles of dissolved oxygen, temperature, and salinity that served as the data basis for our pressure correction assessment (A–C, all calibrated). The difference between the optode and the SBE 43 reference against pressure and oxygen concentration is given before and after the pressure correction (D–F). Note that only data below 100 dbar was considered for this assessment to exclude high variability in the mixed layer above.
Figure 9
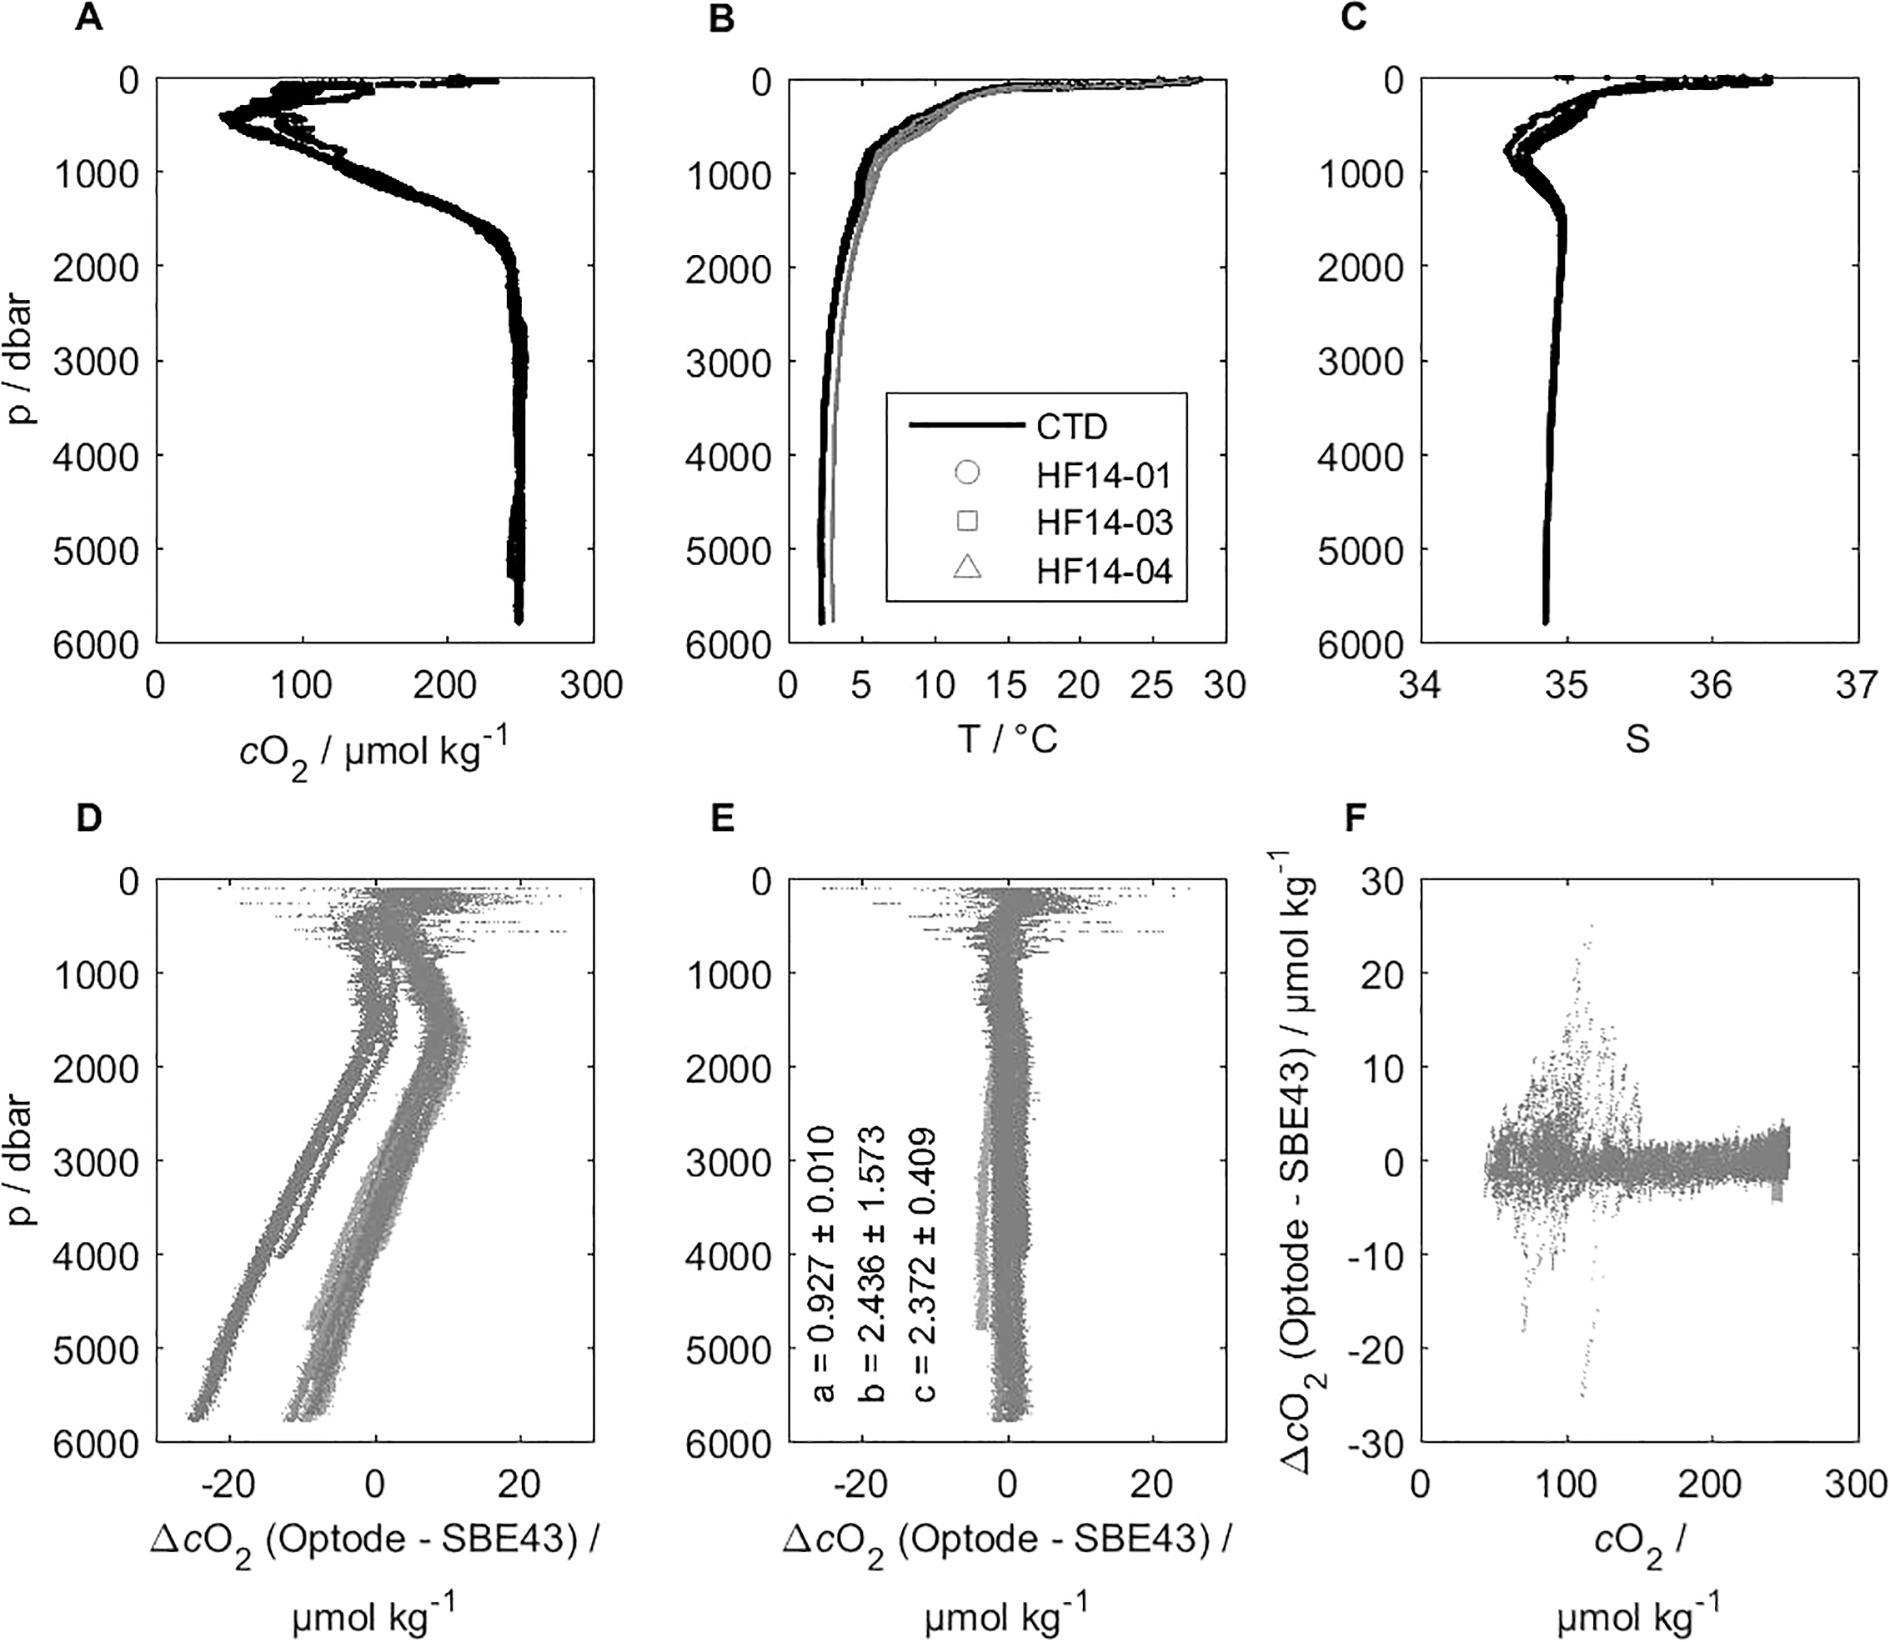
Hydrostatic pressure dependence of three CONTROS HydroFlash® O2 optodes and a SBE 43 for comparison, shown as O2 concentration from deep CTD downcast profiles during the M116/1 field campaign. Vertical profiles of calibrated dissolved oxygen (A), temperature (B), and salinity (C) served as the data basis for our pressure correction assessment. The difference between optode and SBE 43 reference against pressure (D, E) and oxygen concentration (F) is shown before (D) and after (E, F) pressure correction. Note that only data below 100 dbar (D–F) is considered for this assessment to exclude high variability in the mixed layer above.
Individual optode data that are shown before pressure correction are derived from pO2 and include salinity correction. Given the nature of this field experiment, we could not distinguish between the two opposing effects (oxygen-dependent and oxygen-independent) described in Bittig et al. (2015b). Clearly, all optodes detect an apparent decrease in oxygen concentration at constant oxygen with increasing pressure. While we observed individual responses among the optodes, the general behavior pattern was reproducible.
After applying the pressure correction (see Equation 6), the oxygen data were free from pressure dependence over the entire pressure and oxygen concentration range. We show the oxygen concentration in µmol kg-1, yet same applies for µmol L-1. Based on our correction, we found two effects that drove the responses with increasing depth. First, we observed an overall pressure dependence (variable c) for HydroFlash O2 optodes that amounted to 2.372 ± 0.409 % per 1,000 dbar (for comparison: about ±0.3 % variability in the pressure factor has been found in PreSens foils with Aanderaa or SBE optodes). Second, the calibration artifact resulting from the optode drift changed responses of the optodes. Specifically, the slope for pO2 (variable a) was very similar among the three optodes, whereas the offset (variable b) differed among these. Overall, b and c indicate an individual correction for each optode, yet it was necessary to correct with variable a (individual here) to derive valid oxygen concentrations (see section 3.5 for the optode stability results). Correction without variable b yielded results for variables a and c that were very similar. The final mean offsets (optode - SBE 43) for the three optodes were 2.63 µmol kg-1 (HF14-01), 2.49 µmol kg-1 (HF14-03), and 3.03 µmol kg-1 (HF14-04) based on all deep profiles for depths below 100 m.
For example, at 5,713 dbar, the 0.409 % uncertainty of pressure factor c (lower limit: 1.963 % per 1,000 dbar, upper limit: 2.781 % per 1,000 dbar) translates into an oxygen concentration uncertainty of ±10.45 µmol kg-1 (absolute oxygen concentration range: 248.77–259.23 µmol kg-1 at 100 % oxygen saturation, T = 2.2658 °C and S = 34.8565).
When using Winkler samples for referencing instead of SBE 43 data (actually based on Winkler values), we obtained a slightly lower mean value for variable c (see Supplementary Figure S11). However, the pressure correction yielded higher differences. Here, the mean offsets (optode - Winkler) were 4.54 µmol kg-1 (HF14-01), 2.98 µmol kg-1 (HF14-03), and 3.16 µmol kg-1 (HF14-04) based on all deep profiles for depths below 100 m. The higher difference based on Winkler samples may be caused by a smaller number of reference points that underlie possible errors during sampling and handling. The difference (between SBE 43 and Winkler) is in the expected range from potential outliers and standard deviations with wet-chemical analysis of oxygen samples. Moreover, the “bow” (see Supplementary Figure S11) in the Winkler-corrected optode data remains unclear. It could be caused by an insufficient fit due to the unequal distribution of the Winkler reference values. These are significantly denser and more frequent at shallower than at greater depths, leading to a focus on the oxycline and its variability instead of constant oxygen using a deep pressure correction.
When including the upper 100 m depth, we found an offset cluster of data points (optode - SBE 43) of about -12 µmol kg-1 at 200 µmol kg-1 absolute oxygen concentration. We ruled out that this arose from a single station from the SBE 43, and the first station of the optodes when receiving high pressure. The cluster was also more apparent with the SBE 43 as a reference compared to the Winkler samples. We decided to exclude the upper 100 m, but cannot conclude with full certainty whether it came from a calibration error of the optodes at the observed temperature, the different lowering/lifting speed (0.5 m s-1) compared to the rest of the profile (1 m s-1), or other reasons. Given the in-situ character of the experiment and the unclear optode behavior in the upper 100 m, we cannot fully exclude whether the optode experiences pressure hysteresis. This may be supported by the curvature of the deep oxygen optode profiles, as shown in Supplementary Figure S12, displaying the oxygen concentration difference between the downcast and upcast.
3.5 Stability assessment
The number and functionality of oxygen optodes available for our study were limited and prone to updates by the manufacturer. This impeded a large systematic stability assessment with high statistical certainty. Nevertheless, the characterization shown here is quite comprehensive for a new sensor. We exploited data from all types of calibrations to derive the sensor’s O2 response drift behavior over time, covering intervals from a few months to almost 3.5 years, and typical user scenarios (storage, short-term, and long-term in-situ deployment).
3.5.1 During storage and use
An exemplar plot for the stability assessment during storage and use of an optode is illustrated in Figure 10 (top left). Supplementary Figure S13 summarizes the plots of all the optodes, which are used for the stability assessment over time in Figure 10 (top right). Optode HF16-04 received four calibrations within 790 days and showed a linear decrease in oxygen sensitivity (oxygen dependent) and a positive intercept (oxygen independent) at zero oxygen. The linear drift character was also observed in the other optodes’ drift behavior plots in Supplementary Figure S13, supporting the mechanistic explanation of reduced quenching of the luminophor, i.e., a reduced O2 sensitivity, thus a factor on O2, and a counteracting destabilizing effect on the luminophor itself, i.e., a positive intercept at zero O2 for most optodes.
Figure 10
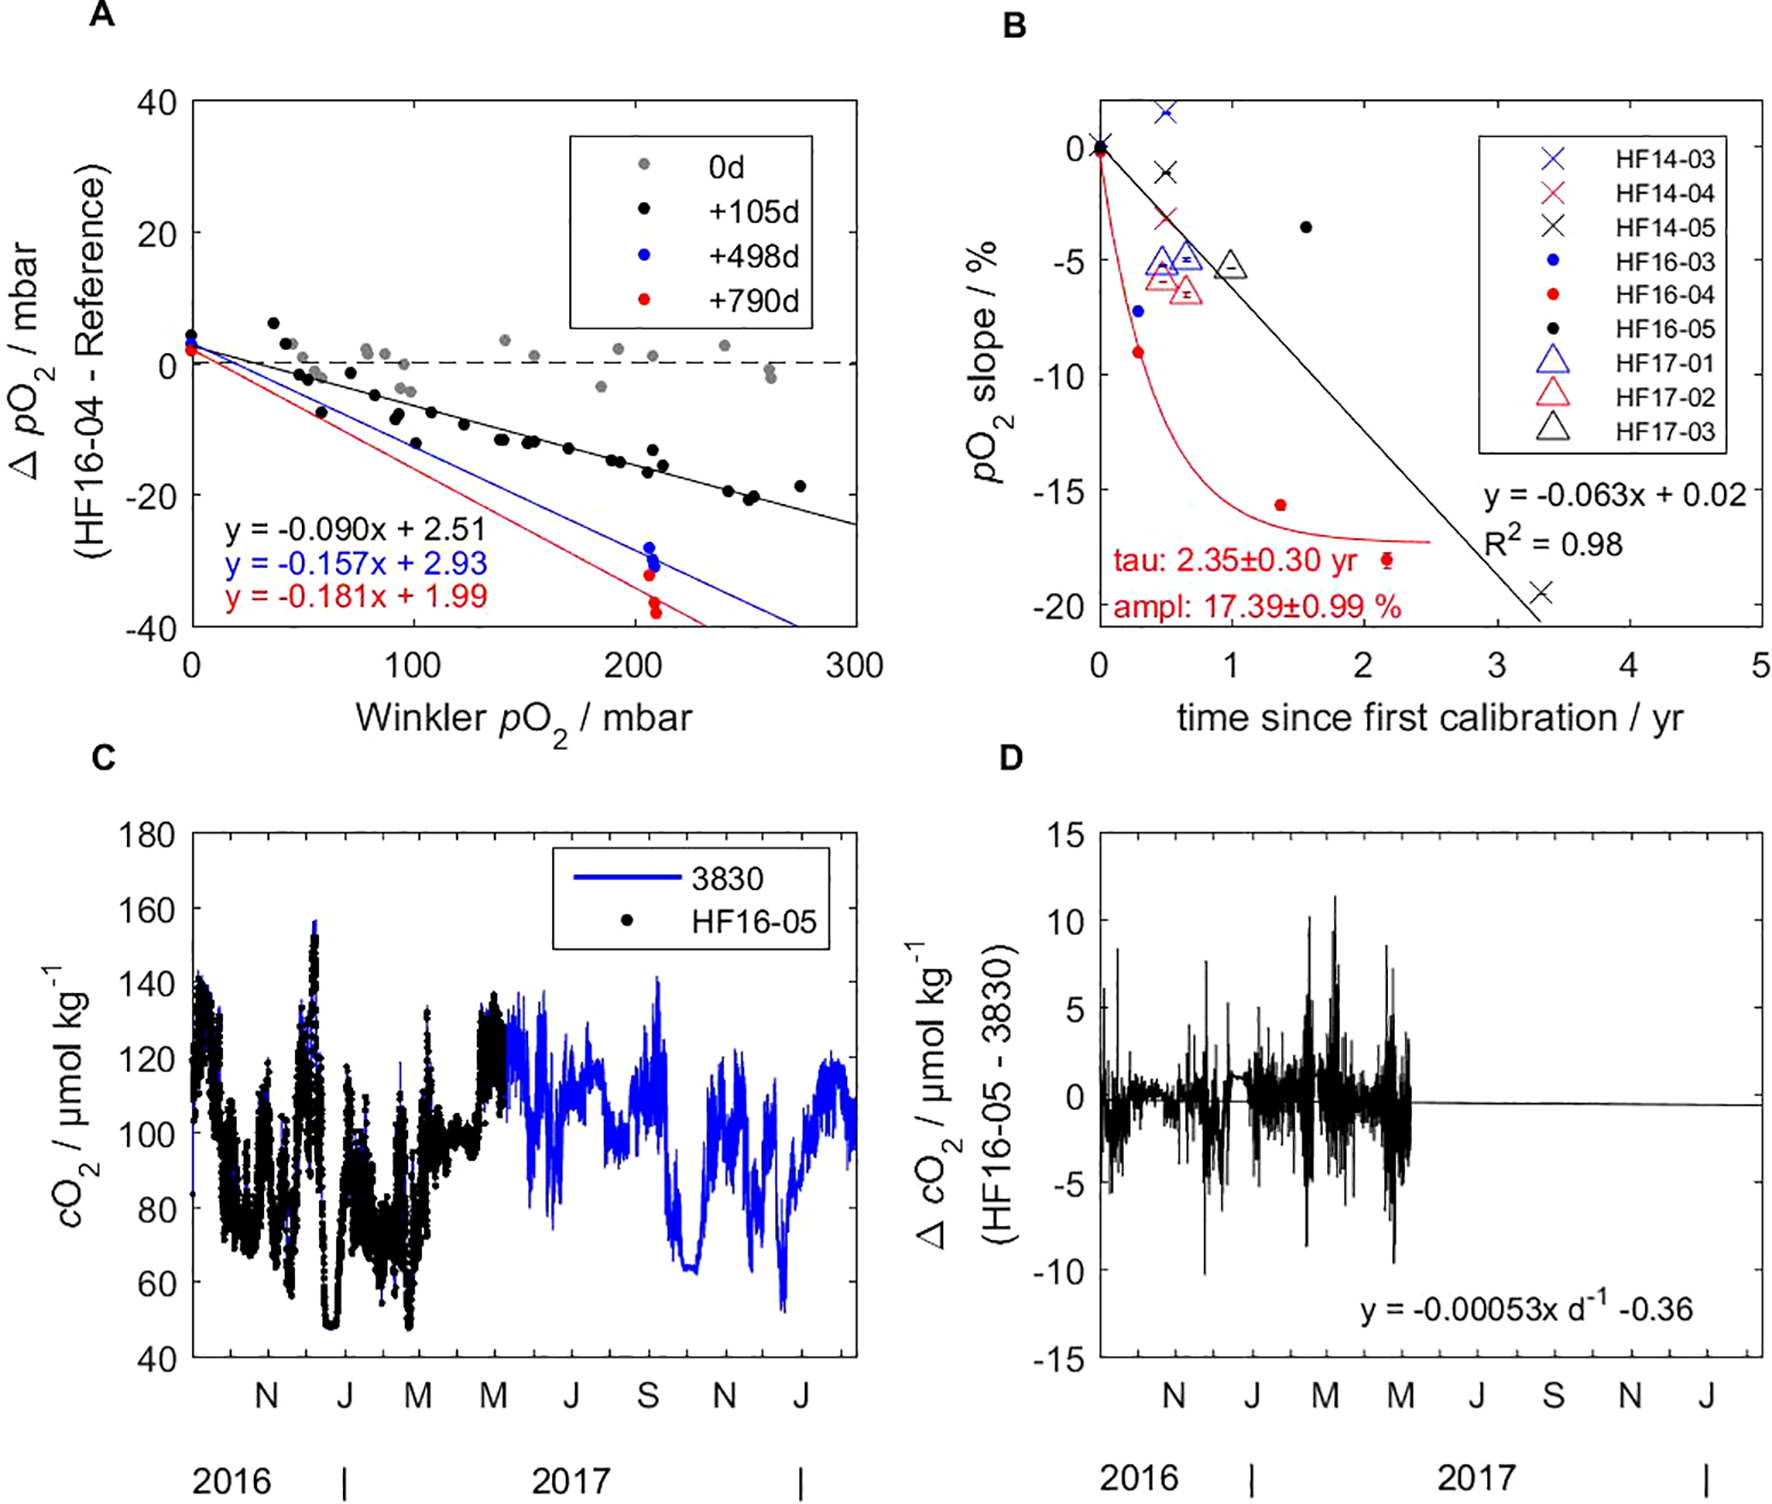
Stability assessment of HF16-04 over pO2 (A; see Supplementary Figure S13 for all optodes) and of all CONTROS HydroFlash® O2 optodes over time (B). While a linear drift was assumed for HF16-05 based on our data, other optodes such as HF16-04 indicate a rather exponential decrease in sensitivity (pO2 slope) over several years, presumably depending on the conditions of storage, deployment, and number of measurements with the sensor spot. HF16-05 also served for drift behavior analysis during an in-situ mooring deployment, showing absolute (C) and relative (D) concentrations compared to the AADI 3830 optode after drift correction. For the mooring deployment, the overall error, i.e., propagation of uncertainty, of AADI 3830 is indicated with 4.39 µmol kg-1, of HF16-05 sums up to 4.74 µmol L-1, yet can be drift corrected.
However, only two optodes (HF14-05 and HF16-04) were considered for drift time evolution of the pO2 slope, i.e., the loss in O2 sensitivity. While HF14-05 showed a linear drift (R2 = 0.98), HF16-04, based on four time points, clearly drifted exponentially in the pO2 slope, yielding a time constant of 0.30 yr (with 95 % CI) and a drift amplitude of 17.395 0.99 %. When comparing HF16-03 to HF16-04, both received a multi-point calibration at the same time, we assume a similar exponential drift behavior. The drift amplitude looks different for every optode despite their unifying behavior of decreasing exponentially in their response at 100 % O2 saturation.
In contrast, HF16-05 appeared to drift linearly over a longer period of time since the first calibration, as it was based only on two time points. This optode was deployed in-situ at a mooring for about 1.5 years (see section 3.5.2).
3.5.2 During deployment
In total, six HydroFlash O2 optodes were successfully deployed at the Cape Verde Ocean Observatory (CVOO) mooring for more than 1 year each. While a first mooring deployment (2015–2016) of two optodes served as a proof-of-concept approach and data recording issues were encountered, a second deployment (2016–2018) of optodes HF16-03 and HF16-05 provided a more successful dataset, yielding a data coverage of 47 % of the deployment time for HF16-05. The duration was determined by the available battery capacity and the comparatively fast measuring frequency of one measurement every 10 minutes. During a third deployment (2018–2019) of two optodes, HF17-01 and HF17-02, the interval was set at one measurement every 2 hours to last for a duration of 22 months, yet we again faced power supply issues and only obtained a data coverage of 6.7 % and 7.8 %, respectively.
Thus, we could consider only optode HF16-05 in the drift analysis during an in-situ deployment longer than about 1 month. While Winkler measurements were used as a reference during shorter deployments, such as an underway box, we used a well-established Aanderaa 3830 deployed at the same depth at CVOO for comparison and referencing. Based on calibration data for both optodes, the overall error (propagation of uncertainty) for optode 3830 was 4.39 µmol kg-1, and for HF16-05 it was 4.74 µmol L-1, yet the significant drift could be corrected for (see Supplementary Figure S9). Assuming HF16-05 drifted linearly, the optode was generally in good agreement with the reference optode after the correction, as shown in Figure 10 (bottom left and right).
Our stability assessment for all optodes showed that it is necessary to cover a time period of at least 2 years and include at least one multi-point calibration, preferably at the beginning, and two more reduced, two-point calibrations at 0 % and 100 %. This way, a more extensive drift analysis and correction for a single optode can be performed.
3.6 Time dependence
3.6.1 Evidence from laboratory studies
A detailed overview of the temperature-dependent time responses is given in Figure 11. The laboratory step experiments (see section 2.3.2, Equation 5) simulating weakly-turbulent conditions yielded a mean time constant of τ63% = 3.2 ± 0.5 s (optode DO-1: τ63% = 3.5 ± 0.9 s, optode DO-2: τ63% = 2.8 ± 0.6 s) between 2 °C and 32 °C. The time responses during rising (0 % → 100 %) were in almost all cases faster than during falling (100 % → 0 %). This feature was caused by the experimental design. When shifting from the 0 % to 100 % reservoir, each optode encounters oxygen from ambient air and starts re-equilibration. Nevertheless, the standard deviations showed the reproducibility of the experiment. The response time increases over the whole temperature range from 64.4 % (2.15 % per °C), which is due to faster molecular diffusion of oxygen from the medium into the sensor spot to reach equilibrium.
Figure 11
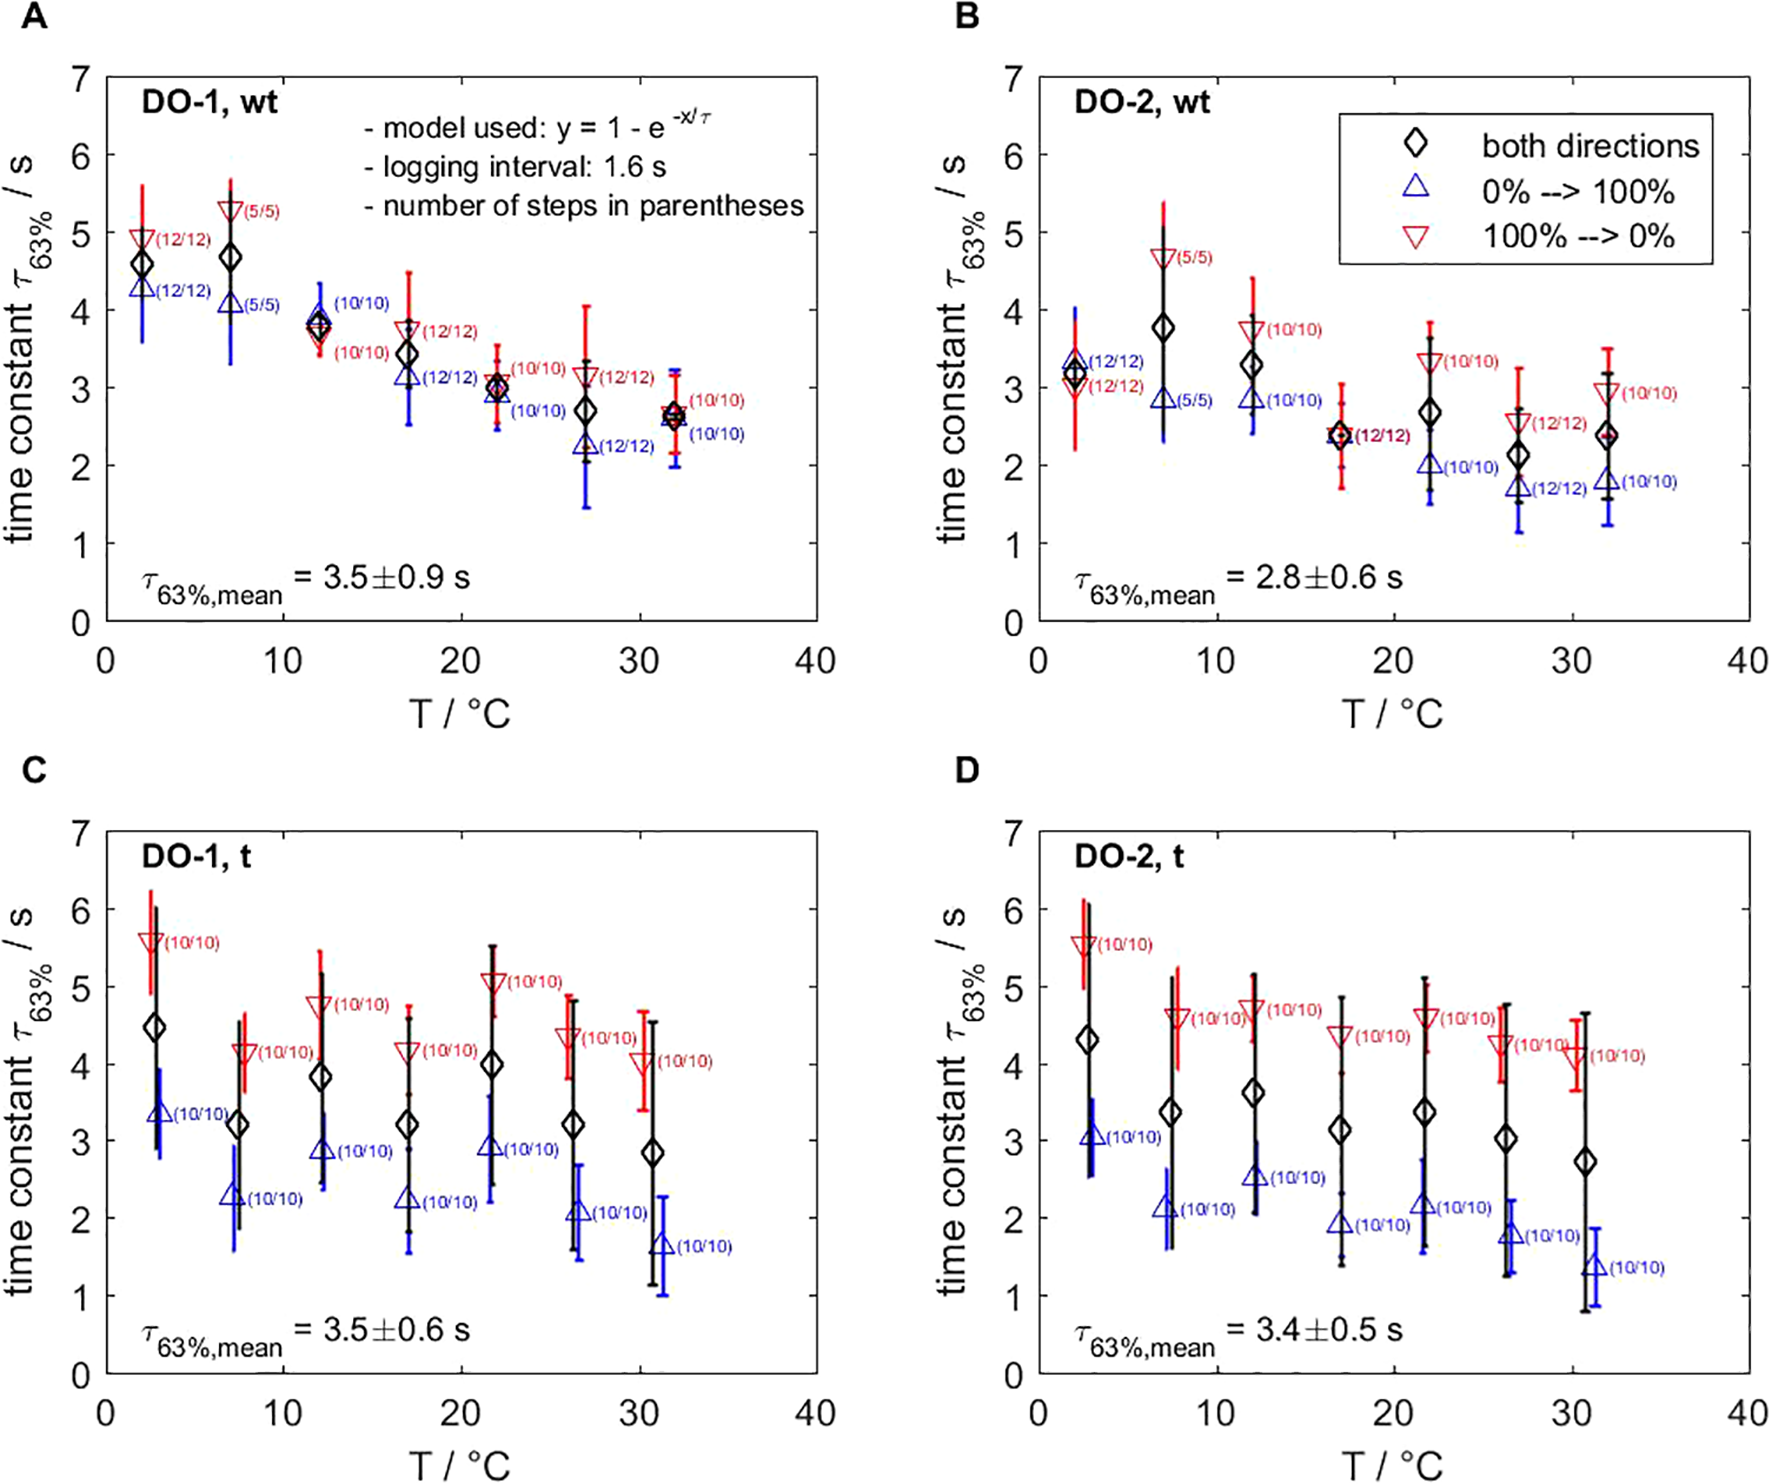
Results from laboratory step experiments for optodes DO-1 (A, C) and DO-2 (B, D) show the time constant of the CONTROS HydroFlash® O2 optode depending on the temperature and flow. The mean time constant for weakly-turbulent (wt) conditions (A, B) yielded 63% = 3.2 0.5 s (response time increase is 2.15 per °C), while it is 63% = 3.4 0.1 s (response time increase is 2.27 % per °C) for turbulent (t) mixing (C, D). Our lab experiments provide evidence that the optode’s response time is not flow dependent. The experimental setup causes higher standard deviations in turbulent conditions. Section 2.3 provides details and section 3.6 discusses the systematic bias of the setup, respectively.
In turbulent conditions, the time constants and the response time increase with temperature (63.6 % or 2.27 % per °C) were very similar to weakly-turbulent conditions. We determined a mean time constant of τ63% = 3.4 ± 0.1 s (optode DO-1: τ63% = 3.5 ± 0.6 s, optode DO-2: τ63% = 3.4 ± 0.5 s). We observed small temperature offsets between the two reservoirs due to the different materials of the two 1 L beakers. Furthermore, the time constants recorded during falling (τ63%,t,falling = 4.6 s) were 1.1 s higher than the weakly-turbulent conditions (τ63%,wt,falling = 3.5 s). This may have been caused by the oxygen input effect into oxygen-free water by thorough mixing in the beaker due to the small water volume (1 L beaker vs. 4.5 L cryostat). Thus, disturbed, homogeneous conditions delayed the equilibration time, which overall accounts for the higher standard deviations in the meantime constants at each temperature.
Overall, the response times in both conditions were very similar, thus yielding a mean time constant of τ63% = 3.31 ± 0.58 s. Our results suggests that the diffusion process through the membrane material of the sensor spot is dominated by the temperature.
3.6.2 Evidence from field studies
We found good agreement in the oxygen profiles of the CTD-cast field measurements (see Figure 9) between the polarographic membrane sensor SBE 43 (pumped, 0.5 mm membrane) and this novel optode (turbulent) without applying a time correction. The time constants within the temperature range of 2 °C– 32 °C were very similar, i.e., 63% at 3.5 s (SBE 43, average of 2–5 s, Sea-Bird Scientific, 2022) and 3.4 s (CONTROS HydroFlash® O2), t95% (3 x 63%) at 9.9 s and 10.2 s, respectively, and the sensor response time t99% (5 x 63%) at 16.5 s and 17 s, respectively.
We hypothesize that the deep profiles of both sensors can be compared directly, yet we cannot conclude whether this generally applies between both sensors even though our aforementioned results using the e-function suggest such an assumption. Thus, we did not apply a response time correction as described in Bittig et al. (2014).
3.7 Other evidence from experiments
In collaboration with the LOV, a proof-of-concept implementation of a CONTROS HydroFlash® O2 on a PROVOR Argo float was successfully achieved. This step was necessary as a precursor for planned fieldwork on optodes from the manufacturer at that time, as those were meant to be based on the same instrument type. This dual-oxygen float was deployed in the morning of 7 June 2016 in the Mediterranean Sea off the coast of Villefranche-sur-Mer. This test profile yielded data for pressure, temperature, number of measurements, the optodes’ phase shift, signal intensity, and ambient light. Generally, data points were obtained for four different phases of the float cycle, i.e., pre-descent, descent, ascent, and surfacing. While all measurements showed normal behavior before the float’s full ascent, the optode revealed strong sensor spot sensitivity when exposed to direct solar irradiation at the surface at about 12:00 pm. The full float profile is shown in Supplementary Figure S14. Further field tests could not be carried out, even though it was of high interest to gain more information on air-calibration compatibility and profiling performance.
At this point, it remains unclear what caused these disturbances, e.g., issues in the fiber optic or optical effects on the sensor spot. We have also observed this high sensitivity at overly high ambient light signals when exposed to strong sunlight during air measurements on the top deck during cruise M116/1.
The optode sensor spots may suffer from flaking of the coating (black isolation layer and luminophor dye) and we do not consider them to be as robust as optode sensor spots by Aanderaa or Sea-Bird Scientific. We always handled the sensor spot with caution, and advise only rinsing and never applying mechanical force or pressure on its surface.
4 Discussion
Our study presents the first comprehensive characterization and assessment of the CONTROS HydroFlash® O2 optode. We report on key sensor performance aspects, e.g., on its hydrostatic pressure dependence and corresponding correction, which has previously been used in Sweetman et al. (2024). However, this information was not yet publicly available. Peer-reviewed articles (Bittig et al., 2018a) and white papers (Bushinsky et al., 2017b; López-García et al., 2022) mentioned the existence and potential of the HydroFlash O2, while its applicability for ocean observing platforms remained unclear. According to the manufacturer (N. Kinski/formerly KM Contros, pers. comm.), 85 HydroFlash O2 optodes have been sold6 (including the ones in our study) and a fraction of these might still be in use despite not being currently commercially available. The community still uses HydroFlash O2 optodes, e.g., for offshore gas leakage detection (Totland et al., 2020), air-sea gas exchange measurements (Canning et al., 2021b), aquaculture monitoring (Alver et al., 2022), geological carbon storage assessment (Totland et al., 2023), or deep-sea research (Cecchetto et al., 2023), although previously lacking an in-depth understanding of this optode type (see Table 2 for an overview). Hence, the best practice approach in marine sciences called for closing this knowledge gap by providing open-access information, following ethical recommendations for ocean observation (Barbier et al., 2018).
Table 2
| Regime | Region | Realm | Experiment type | Reference |
|---|---|---|---|---|
| Limnic, brackish, oceanic | Danube (Delta), Baltic Sea, Atlantic Ocean |
Air-sea gas exchange | Underway | Canning et al. (2021a); Canning et al. (2021b) |
| Oceanic | Oslo Fjord | Offshore gas leakage detection | AUV | Totland et al. (2020) |
| Oceanic | Atlantic Ocean | Aquaculture monitoring | Ocean farm test cages | Alver et al. (2022) |
| Oceanic | Norwegian Sea | Geological carbon storage assessment |
AUV | Totland et al. (2023) |
| Oceanic | Pacific Ocean | Deep-sea research | In-situ benthic-lander |
Cecchetto et al. (2023), Sweetman et al. (2024) |
| Oceanic | Atlantic Ocean | Sensor characterization and assessment | Underway, mooring, CTD, Argo float | This study |
Field applications of the CONTROS HydroFlash® O2 as mentioned in peer-reviewed publications (as of December 2024), although this optode type previously lacked an in-depth understanding.
This study presents the first comprehensive characterization and assessment of this optode type.
We conclude that one multi-point calibration per optode-sensor spot combination is sufficient, preferably at the beginning of its lifetime and covering the entire temperature and oxygen concentration range at which the optode will be used in the field. Our results show that the HydroFlash O2 meets the very stringent long-term goal for observation accuracy of ±1 µmol kg-1 (±1 hPa), similar to the most common oxygen optodes, 4330 and SBE 63, as shown in Bittig et al. (2018a). However, we yielded a mean accuracy of 1.79 ± 0.50 µmol L-1, depending on the optode version and fit model type. The latter optode version (HF17) showed a lower RMSE (thus higher accuracies) and uniform sensor responses towards higher at 0 % O2 and with decreasing temperatures compared to previous optode versions. We opted for the Bittig et al. (2018a) model, which provided the best model fit following physical relationships for optode lifetime. The HydroFlash O2 optode temperature measurements could be off by a few tenths of °C in the early versions, which improved with the latest HF17-models, presumably through the usage of the NTC thermistor. However, we recommend always using the best available reference temperature.
Subsequent drift occurred for every HydroFlash O2 optode we analyzed, which can be accounted for by performing a 0 % and 100 % calibration at multiple temperatures shortly prior to and after each deployment (1–2 days). We generally found lower RMSE (thus higher accuracies) if this re-adjustment was performed within (rather than outside) the O2---parameter space of the original multi-point calibration. Based on our limited data set, HydroFlash O2 optodes can drift both linearly or exponentially, while 4330 and SBE 63 optodes tend to drift exponentionally, as summarized in Bittig et al. (2018a). Their drift7 behavior may differ because their sensor spot is composed differently, i.e., convex, solid glass substrate holding the luminophor (HydroFlash O2) vs. silicone-based sensing membrane (4330 and SBE 63 optodes). Hence, drift control through 0 % and 100 % calibrations is crucial to precisely determine the optodes’ change in response over time. We did not perform explicit optode-sensor spot pre-aging in our assessment because we faced logistical challenges, e.g., lacking sufficient optodes (3–5 of the same optode version) at one time in order to conduct a meaningful experiment, yet Tengberg and Hovdenes (2014) have shown reduced drift after a burn-in procedure of several million measurements before an optode’s initial multi-point calibration. However, HydroFlash O2 optodes provide the number of measurement value in the data string, therefore allowing such assessment in the future, e.g., under controlled laboratory conditions, to rule out the effects of storage, transport, or the environment during field deployments.
As found for other optodes, this study confirms that the HydroFlash O2 response to pO2 is independent of salinity. Independent of that, the sensor readings need to be corrected to in-situ salinity, taking into account the salinity-dependent O2 solubility in seawater when converting to oxygen concentration. Even though our data showcases the optode’s salinity correction only for open ocean salinities (the Tropical North Atlantic), this correction follows marine oxygen thermodynamics and is therefore also valid in less saline water, e.g., in coastal or limnic areas, as shown by Canning et al. (2021a, b). We recommend measuring salinity to at least one tenth of the salinity value for subsequent oxygen concentration calculations.
Our study is the first to derive an individual overall pressure correction factor for the CONTROS HydroFlash® O2 applicable to deep profiles up to 5,797 dbar. This factor differs roughly by a factor of 1.8, including a higher uncertainty when compared to the revised approach for the 4330 and SBE 63 optodes (see Table 3). We assume the chemical environment of the sensor spot to be the reason, but are only able to speculate due to limited information about the exact sensor spot material from the literature (see section 2.2). Our field data were limited and revealed that the hydrostatic pressure dependence varied slightly between the different optodes, being the sum of the overall pressure effect and calibration artifact (offset of pO2), and between the downcast and upcast, potentially pointing towards a small pressure hysteresis effect. Despite these shortcomings, we do not recommend additional pressure tests at this point in time due to the optode not currently being commercially available. If needed in the future, a tedious pressure tank experiment, as performed by Bittig et al. (2015b), would clarify corrections on the “true” pO2 with increasing depth (i.e., natural increase through the outgassing tendency) and the “actual” optode measurement of pO2 allowing us to differentiate between the oxygen-independent and oxygen-dependent effect.
Table 3
| z per 1,000 dbar | f / % per 1,000 dbar | f U / % per 1,000 dbar | |
|---|---|---|---|
| Classical approach | |||
| Aanderaa | 0° | 3.28 + 0.025 | 0.3 |
| SBE 63 | 0 µs | 3.07 + 0.016 | 0.3 |
| Revised approach | |||
| Aanderaa | 0.100° | 4.19 + 0.022 | 0.3 |
| SBE 63 | 0.115 µs | 4.19 + 0.022 | 0.3 |
| This study | |||
| CONTROS HydroFlash® O2 | 0° | 2.372 + 0 | 0.409 |
Pressure response parameterizations for Aanderaa and Sea-Bird Scientific optodes (from Bittig et al. (2015b), both classical and revised approach) and the CONTROS HydroFlash® O2 optode (this study).
The overall uncertainty U of the optode pressure corrections are estimated and caused by the variability between the sensors. The overall pressure factor of the HydroFlash O2 sensor was assessed from three multi-point calibrated, drift-corrected optodes down to 5,797 dbar and a total number of five CTD profiles.
The mean response time of the HydroFlash O2 of 63% = 3.31 ± 0.58 s is in agreement with the manufacturer’s specification (see Supplementary Table S1). Bittig et al. (2018a) indicate that response times for Aanderaa optodes range between 8 and 140 s depending on the type of application, e.g., CTD or profiling float, thus on flow, temperature, and the foil type (normal vs. fast-response). Pumped SBE 63 optodes range between 6 and 40 s, depending on the temperature and type of application. However, such wide ranges do not exist for the HydroFlash O2 optode. Thanks to its coherence, its response time is less variable and much more predictable than for the Aanderaa or SBE optodes, which strongly facilitates the application of a time response correction if deemed necessary.
In principle, its small dimensions, fast response time, and well-characterized sensor performance aspects predestines the CONTROS HydroFlash® O2 for slowly profiling observing platforms. Our data shows a lack of in-air measurement capability for drift control, meaning this optode is not yet ready for long-term deployments on two very important autonomous observing platforms in oceanography, namely Argo floats and gliders, unlike the 4330 and SBE 63 optodes, which are both widely in use. Besides, the sensor spot of the HydroFlash O2 appears to be prone to unwanted flaking, yet to our knowledge, the convex, solid glass substrate of the HydroFlash O2 is a unique feature for optodes, potentially enhancing immersion and light yield for the embedded luminophore dye. Shortcomings such as the battery supply can probably be resolved through little engineering efforts, and we encourage including an energy safety margin for long-term deployments. However, the study by Sweetman et al. (2024) showcases this optode’s readiness for deep-sea lander systems, while our study proves its applicability for moored fixed-point observations and ship-based underway measurements. The effectiveness of this optode’s copper ring for long-term deployments to prevent biofouling in the upper sunlit mixed layer remains unclear. Although we noticed qualitatively little biofouling during our mooring deployments, its biofouling resistance could be further investigated.
The CONTROS HydroFlash® O2 could be a reliable oxygen optode sensor alongside the 4330 and SBE 63 optodes if the manufacturer revives its production and reduces the high sensitivity of the sensor spot during in-air measurements. Our results provide information for the existing optode users in the community and potential advancements in the field of oxygen observation, such as other optode type assessments. This may further stimulate discussion about resuming its production.
Currently, an interesting alternative for Argo floats could be the umpumped RINKO FT optode (JFE Advantech Co., Ltd.), as highlighted in a technical note8 of the manufacturer (JFE Advantech Co. Ltd., 2020). The optode is advertised with response times 63% less than 1 s in water at 1 atm and 25 °C and is claimed to be long-term stable, which is promising for profiling applications, while its hydrostatic pressure response needs to be investigated. The fast variant (1s ) RBRcoda3 T.ODO temperature and dissolved oxygen sensor (RBR Ltd.) could also be a promising candidate. Moreover, microelectrode SST-sensors and compact optodes exist for open ocean and coastal applications at shallower depths, e.g., to measure biogeochemical parameters such as dissolved oxygen, pH, and carbon dioxide (Müller et al., 2015; Lehner et al., 2015; Fritzsche et al., 2018). As Byrne (2014) have discussed for new technologies in ocean chemistry, sensor requirements such as (i) low production cost; (ii) low power consumption and long-term autonomous operation; (iii) small size for easy handling and integration into different platforms; (iv) characterization of and robustness against pressure, salinity and temperature changes, and biofouling; and (v) no or low drift throughout long-term deployments need to be considered and fulfilled by oxygen optode manufacturers such as Aanderaa Data Instruments AS, PyroScience GmbH, OxyGuard International A/S, Sea-Bird Scientific, Sea & Sun Technology GmbH, or Unisense.
Well-functioning oxygen optode sensors help to improve the quantification and our understanding of biological, chemical, and physical processes in the ocean, allowing for more detailed future predictions about the ocean’s biogeochemistry. As such, deep oxygen profiles on biogeochemical Argo floats lack in the amount of sampling and could help us understanding processes in ocean deoxygenation (Johnson et al., 2013; Riser et al., 2016). Additionally, derived products of apparent oxygen utilization, air-sea oxygen fluxes, net carbon export flux, net community production (NCP), and ocean oxygen inventories contribute to the IOC-UNESCO Global Ocean Oxygen Network (GO2NE) and Global Ocean Observing System (GOOS).
5 Conclusions
Oxygen optodes have become powerful sensors on autonomous, profiling ocean observing platforms over the past two decades. Various optode types from different manufacturers exist, yet to our knowledge, there is no model fitting all marine and coastal applications equally well, e.g., due to varying time constants and insufficient stabilities. However, the novel CONTROS HydroFlash® O2 optode has been a promising candidate for more than 10 years since it was launched to overcome these shortcomings. Although this optode is currently not commercially available, it is still in use by the community.
Our study characterizes and assesses key performance aspects of the HydroFlash O2, which eventually allows for a comparison of this optode with the two most common and well-studied oxygen optodes in oceanography, i.e., 4330 and SBE 63. For example, adequate calibration efforts ensure similar measurement accuracies, and its hydrostatic pressure dependence is now quantified. While its fast response time is advantageous for profiling applications, e.g., CTD and deep-sea lander, the HydroFlash O2 is not ready for long-term deployments on autonomous platforms such as Argo floats and gliders because it primarily lacks an air-calibration capability for remote drift control. Based on our experience and other studies, this optode is robust (yet prone to sensor spot flaking) and can be used in different ocean and coastal regimes ranging from tropical to polar regions, and low to high oxygen, pressure, and temperature conditions. We do not call for further studies on this optode unless the manufacturer reactivates its production and reduces the high sensitivity of the sensor spot during in-air measurements.
Our results contribute to the knowledge base of promising, existing, or possibly upcoming oxygen optode sensors. Moreover, they enabled and may enable future ocean research such as the study by Sweetman et al. (2024). Here, ship-based ocean observation using autonomous sensors such as the HydroFlash O2 oxygen optode was only possible through our preliminary results. We advocate for continuing and publishing similar assessments supporting basic and applied research on marine sensors, which are our eyes to observe ocean processes.
Statements
Data availability statement
The datasets presented in this study can be found in online repositories. All data supporting the findings of this optode study are publicly available as referenced within this paper. Analyzed HydroFlash O2 data from the Argo float test profile, calibrations, hydrostatic pressure dependence, time dependence, operation on the CVOO mooring, and underway measurements are available in the PANGAEA repository at https://doi.pangaea.de/10.1594/PANGAEA.978166. All other optode raw data from the calibration runs used in this study will be freely available, for scientific use only, upon request. Anyone interested in the processing workflows for scientific research should contact the corresponding author via email.
Author contributions
TH: Conceptualization, Data curation, Formal analysis, Investigation, Methodology, Validation, Visualization, Writing – original draft, Writing – review & editing, Project administration. AK: Conceptualization, Funding acquisition, Project administration, Resources, Supervision, Validation, Writing – review & editing.
Funding
The author(s) declare that financial support was received for the research and/or publication of this article. This study has received funding from the European Union’s Horizon 2020 Research and Innovation Program under the grant agreement no: 2014-633211 (AtlantOS). Ship times of METEOR were provided by the German Science Foundation (DFG) within the core program METEOR/MERIAN. The work carried out during all expeditions in the Tropical Atlantic Ocean were part of the SFB754 (“Climate-Biogeochemistry Interactions in the Tropical Ocean”) funded by the DFG. Open access funding was provided by GEOMAR Helmholtz Centre for Ocean Research Kiel.
Acknowledgments
We thank captain/chief scientist Thomas Wunderlich/Frank Niessen (R/V POLARSTERN, PS88b), Rainer Hammacher/Martin Visbeck (R/V METEOR, M116/1 and M133), Michael Schneider/Peter Brandt (R/V METEOR, M119), and Detlef Korte/Peter Brandt and Rebecca Hummels (R/V METEOR, M145) as well as their entire crew for supporting our optode measurements during underway, CTD, and mooring deployments and recoveries. Exceptional thanks go to GEOMAR’s Physical Oceanography department and TLZ regarding the CVOO mooring site, infrastructure, and all people involved, especially Johannes Karstensen and Björn Fiedler, and Gerd Krahmann9 for providing the final DSHIP and CTD datasets. We appreciate the support by Frank Malien for his Winkler expertise and Boie Bogner for the optode readout adaptations in LabVIEW used to run our calibrations. We gratefully acknowledge the work on optodes by Henry Bittig and Johannes Hahn for providing the tools for data analysis, and for their advancing discussions about the hydrostatic pressure dependence and mooring sensor performance. We thank the LOV team, especially Christophe Penkerc’h, Edouard Leymarie, and Hervé Claustre, for collaborating on the Argo float test profile. We value the open cooperation and discussion with the optode manufacturer’s team at Kongsberg Maritime CONTROS GmbH, with special thanks to Peer Fietzek and Carsten Frank. The authors thank the reviewers for their time, comments, and suggestions that helped improving the manuscript — we are fully aware of the additional work involved.10 We appreciate the scientific color toolbox from Crameri (2018) that helped us creating Figures 4, 7, and Supplementary Figure S12 for better visualization.
Conflict of interest
The authors declare that the research was conducted in the absence of any commercial or financial relationships that could be construed as a potential conflict of interest.
Generative AI statement
The author(s) declare that no Generative AI was used in the creation of this manuscript.
Publisher’s note
All claims expressed in this article are solely those of the authors and do not necessarily represent those of their affiliated organizations, or those of the publisher, the editors and the reviewers. Any product that may be evaluated in this article, or claim that may be made by its manufacturer, is not guaranteed or endorsed by the publisher.
Supplementary material
The Supplementary Material for this article can be found online at: https://www.frontiersin.org/articles/10.3389/fmars.2025.1589920/full#supplementary-material
Footnotes
1.^During the years 2014 – 2015, the company was called Contros Systems and Solutions GmbH.
2.^Information on this selective detection technique is available on the company’s website: https://www.pyroscience.com/en/products/theory/optical-oxygen-sensors
3.^The palladium(II) analog is typically used for low to trace level oxygen concentrations (Quaranta et al., 2012; Wang and Wolfbeis, 2014; Lehner et al., 2015).
4.^Most optodes in our study had not undergone a factory calibration, which was later a standard feature offered by the manufacturer.
5.^The reference point with duplicate Winkler samples above this threshold was not considered and, if possible, repeated at a later stage during the calibration.
6.^We have no information on how many optodes of each model version were sold.
7.^Optode drift occurs when energy from luminescence quenching and UV light disseminates in and therefore changes the sensor spot matrix, i.e., the luminophor embedded in a chemical environment. In our study, drift may further depend on the model version due to improvements during optode development stages.
8.^Here, results from our underway measurement with a RINKO FT during M133 were requested and also taken up by the manufacturer.
9.^Rest In Peace.
10.^As Ryan Abernathey commented: "It’s overwhelming to new people entering science to have literally thousands of papers to study and cite. And the process of generating papers involves a ton of effort, not only by the authors but by journal editors and reviewers, who are expected to provide their services for free on a volunteer basis" (https://medium.com/@rabernat/i-got-tenure-but-science-is-still-broken-db7a6d69e925).
References
1
Aanderaa Data Instruments AS (2006). TD 218 Operating Manual Oxygen Optode 3830, 3930, 3975, 3835, 4130 and 4175. Bergen, Norway: Aanderaa Data Instruments AS.
2
Aanderaa Data Instruments AS (2009). TD 269 Operating Manual Oxygen Optode 4330, 3835. Bergen, Norway: Aanderaa Data Instruments AS.
3
Alver M. O. Føre M. Alfredsen J. A. (2022). Predicting oxygen levels in Atlantic salmon (Salmo salar) sea cages. Aquaculture548, 737720. doi: 10.1016/j.aquaculture.2021.737720
4
Barbier M. Reitz A. Pabortsava K. Wölfl A.-C. Hahn T. Whoriskey F. (2018). Ethical recommendations for ocean observation. Adv. Geosci.45. doi: 10.5194/adgeo-45-343-2018
5
Bittig H. C. Fiedler B. Fietzek P. Körtzinger A. (2015b). Pressure response of Aanderaa and Sea-Bird oxygen optodes. J. Atmospheric Oceanic Technol.32, 2305–2317. doi: 10.1175/JTECH-D-15-0108.1
6
Bittig H. C. Fiedler B. Scholz R. Krahmann G. Körtzinger A. (2014). Time response of oxygen optodes on profiling platforms and its dependence on flow speed and temperature. Limnol. Oceanogr.: Methods12, 617–636. doi: 10.4319/lom.2014.12.617
7
Bittig H. C. Fiedler B. Steinhoff T. Körtzinger A. (2012). A novel electrochemical calibration setup for oxygen sensors and its use for the stability assessment of Aanderaa optodes. Limnol. Oceanogr.: Methods10, 921–933. doi: 10.4319/lom.2012.10.921
8
Bittig H. C. Körtzinger A. (2015a). Tackling oxygen optode drift: Near-surface and in-air oxygen optode measurements on a float provide an accurate in situ reference. J. Atmospheric Oceanic Technol.32, 1536–1543. doi: 10.1175/JTECH-D-14-00162.1
9
Bittig H. C. Körtzinger A. (2017). Technical note: Update on response times, in-air measurements, and in situ drift for oxygen optodes on profiling platforms. Ocean Sci.13, 1–11. doi: 10.5194/os-13-1-2017
10
Bittig H. C. Körtzinger A. Johnson K. S. Claustre H. Emerson S. Fennel K. et al (2018b). SCOR WG 142: Quality control procedures for oxygen and other biogeochemical sensors on floats and gliders. Recommendations on the conversion between oxygen quantities for Bio-Argo Floats and other autonomous sensor platforms. Ifremer. doi: 10.13155/45915
11
Bittig H. C. Körtzinger A. Neill C. van Ooijen E. Plant J. N. Hahn J. et al . (2018a). Oxygen optode sensors: principle, characterization, calibration, and application in the ocean. Front. Marine Sci.4. doi: 10.3389/fmars.2017.00429
12
Borisov S. M. Nuss G. Haas W. Saf R. Schmuck M. Klimant I. (2009). New NIR-emitting complexes of platinum(II) and palladium(II) with fluorinated benzoporphyrins. J. Photochem. Photobiol. A: Chem.201, 128–135. doi: 10.1016/j.jphotochem.2008.10.003
13
Borisov S. M. Nuss G. Klimant I. (2008). Red Light-Excitable Oxygen Sensing Materials Based on Platinum(II) and Palladium(II) Benzoporphyrins. Anal. Chem.80, 9435–9442. doi: 10.1021/ac801521v
14
Brandt P. (2016). Oxygen variability and tropical Atlantic circulation - Cruise No. M119 - September 8 - October 12, 2015 - Mindelo (Cape Verde) - Recife (Brazil). In METEOR-Berichte (Vol. M119, pp. 1–45) (DFG-Senatskommission für Ozeanographie, Bremen, Germany). doi: 10.2312/cr_m119
15
Brandt P. Hummels R. Hahn J. Krahmann G. (2025). Physical oceanography from mooring KPO_1179. PANGAEA. Available at: https://doi.pangaea.de/10.1594/PANGAEA.977789.
16
Breitburg D. Levin L. A. Oschlies A. Grégoire M. Chavez F. P. Conley D. J. et al . (2018). Declining oxygen in the global ocean and coastal waters. Science359, eaam7240. doi: 10.1126/science.aam7240
17
Bushinsky S. M. Emerson S. (2013). A method for in-situ calibration of Aanderaa oxygen sensors on surface moorings. Marine Chem.155, 22–28. doi: 10.1016/j.marchem.2013.05.001
18
Bushinsky S. M. Gray A. R. Johnson K. S. Sarmiento J. L. (2017a). Oxygen in the Southern Ocean from Argo floats: Determination of processes driving air-sea fluxes. J. Geophysical Res.: Oceans122, 8661–8682. doi: 10.1002/2017JC012923
19
Bushinsky S. M. Hamme R. C. Nicholson D. P. Johnson K. S. (2017b). Oxygen Measurements from Autonomous Vehicles: Applications and Challenges (White Paper). ALPS II Workshop on Autonomous and Lagrangian Platforms and Sensors, La Jolla, California.
20
Byrne R. H. (2014). Measuring ocean acidification: New technology for a new era of ocean chemistry. Environ. Sci. Technol.48, 5352–5360. doi: 10.1021/es405819p
21
Canning A. R. Fietzek P. Rehder G. Körtzinger A. (2021a). Technical note: Seamless gas measurements across the land–ocean aquatic continuum – corrections and evaluation of sensor data for CO2, CH4 and O2 from field deployments in contrasting environments. Biogeosciences18, 1351–1373. doi: 10.5194/bg-18-1351-2021
22
Canning A. R. Wehrli B. Körtzinger A. (2021b). Methane in the Danube Delta: the importance of spatial patterns and diel cycles for atmospheric emission estimates. Biogeosciences18, 3961–3979. doi: 10.5194/bg-18-3961-2021
23
Carraway E. R. Demas J. N. DeGraff B. A. Bacon J. R. (1991). Photophysics and photochemistry of oxygen sensors based on luminescent transition-metal complexes. Anal. Chem.63, 337–342. doi: 10.1021/ac00004a007
24
Cecchetto M. M. Moser A. Smith C. R. van Oevelen D. Sweetman A. K. (2023). Abyssal seafloor response to fresh phytodetrital input in three areas of particular environmental interest (APEIs) in the western clarion-clipperton zone (CCZ). Deep Sea Res. Part I: Oceanographic Res. Pap.195, 103970. doi: 10.1016/j.dsr.2023.103970
25
Claustre H. Johnson K. S. Takeshita Y. (2020). Observing the Global Ocean with Biogeochemical-Argo. Annu. Rev. Marine Sci.12, 23–48. doi: 10.1146/annurev-marine-010419-010956
26
Crameri F. (2018). Scientific colour maps (4.0.0). Zenodo. doi: 10.5281/zenodo.2649252
27
Frenger I. Landolfi A. Kvale K. Somes C. J. Oschlies A. Yao W. et al . (2024). Misconceptions of the marine biological carbon pump in a changing climate: Thinking outside the “export” box. Global Change Biol.30, e17124. doi: 10.1111/gcb.17124
28
Fritzsche E. Staudinger C. Fischer J. P. Thar R. Jannasch H. W. Plant J. N. et al . (2018). A validation and comparison study of new, compact, versatile optodes for oxygen, pH and carbon dioxide in marine environments. Marine Chem.207, 63–76. doi: 10.1016/j.marchem.2018.10.009
29
Gordon C. Fennel K. Richards C. Shay L. K. Brewster J. K. (2020). Can ocean community production and respiration be determined by measuring high-frequency oxygen profiles from autonomous floats? Biogeosciences17, 4119–4134. doi: 10.5194/bg-17-4119-2020
30
Gruber N. Doney S. C. Emerson S. R. Gilbert D. Kobayashi T. Körtzinger A. et al . (2010). Adding Oxygen to Argo: Developing a Global In Situ Observatory for Ocean Deoxygenation and Biogeochemistry. In: Proceedings of OceanObs‘09: Sustained Ocean Observations and Information for Society, Vol. 2, Venice, Italy, 21-25 September 2009, Eds. HallJ.HarrisonD.StammerD.. Paris, France, European Space Agency, 12pp. (ESA Publication WPP-306). doi: 10.5270/OceanObs09.cwp.39
31
Hahn T. (2014). Untersuchungen zur Kalibrierung und Charakterisierung einer neuartigen Sauerstoffoptode in Labor und Feld. Master's thesis, Kiel University. Kiel, Germany.
32
Hahn J. Brandt P. Greatbach R. J. Krahmann G. Körtzinger A. (2014). Oxygen variance and meridional oxygen supply in the Tropical North East Atlantic oxygen minimum zone. Climate Dynamics43, 2999–3024. doi: 10.1007/s00382-014-2065-0
33
Hansen H. P. (1999). Determination of oxygen. In Methods of Seawater Analysis. eds GrasshoffK.KremlingK.EhrhardtM.. Wiley-VCH Verlag GmbH, chap. 4. 75–89. doi: 10.1002/9783527613984.ch4
34
JFE Advantech Co. Ltd . (2020). Performance of the RINKO FT optical dissolved oxygen sensors attached to Argo floats and other platforms. Tech. rep., JFE Advantech Co. Ltd., Nishinomiya, Hyogo, Japan.
35
Johnson K. S. Coletti L. J. Jannasch H. W. Sakamoto C. M. Swift D. D. Riser S. C. (2013). Long-Term Nitrate Measurements in the Ocean Using the in situ Ultraviolet Spectrophotometer: Sensor Integration into the APEX Profiling Float. J. Atmospheric Oceanic Technol.30, 1854–1866. doi: 10.1175/JTECH-D-12-00221.1
36
Johnson K. S. Plant J. N. Riser S. C. Gilbert D. (2015). Air Oxygen Calibration of Oxygen Optodes on a Profiling Float Array. J. Atmospheric Oceanic Technol.32, 2160–2172. doi: 10.1175/JTECH-D-15-0101.1
37
Keeling R. F. Körtzinger A. Gruber N. (2010). Ocean Deoxygenation in a Warming World. Annu. Rev. Marine Sci.2, 199–229. doi: 10.1146/annurev.marine.010908.163855
38
Klimant I. Meyer V. Kühl M. (1995). Fiber-optic oxygen microsensors, a new tool in aquatic biology. Limnol. Oceanogr.40, 1159–1165. doi: 10.4319/lo.1995.40.6.1159
39
Knust R. Niessen F. (2016). The Expedition PS88 of the Research Vessel POLARSTERN to the Atlantic Ocean in 2014. In Berichte zur Polar- und Meeresforschung = Reports on Polar and Marine Research (Vol. 696, pp. 1–54). Alfred-Wegener-Institut, Helmholtz-Zentrum für Polar- und Meeresforschung, Bremerhaven, Germany. doi: 10.2312/BzPM_0696_2016
40
KM Contros (2016). User manual: CONTROS HydroFlash® O2 Sensor for dissolved oxygen (O2). Kongsberg Maritime Contros GmbH, Kiel, Germany.
41
KM Contros (2019). CONTROS HydroFlash Datasheet. Kongsberg Maritime Contros GmbH, Kiel, Germany.
42
Krahmann G. (2019). Surface oceanographic data (TSG) during METEOR cruise M116/1 [dataset]. PANGAEA. doi: 10.1594/PANGAEA.907764
43
Lakowicz J. R. (ed.) (2006). Principles of Fluorescence Spectroscopy. Boston, MA: Springer. 3rd edn. doi: 10.1007/978-0-387-46312-4
44
Langdon C. (2010). Determination of Dissolved Oxygen in Seaweater By Winkler Titration using Amperometric Technique. In: The GO-SHIP Repeat Hydrography Manual: A Collection of Expert Reports and Guidelines, version 1. Eds. HoodE. M.SabineC. L.SloyanB. M. (IOCCP Report Number 14; ICPO Publication Series Number 134). doi: 10.25607/OBP-1350.
45
Lehner P. Larndorfer C. Garcia-Robledo E. Larsen M. Borisov S. M. Revsbech N.-P. et al . (2015). LUMOS - A Sensitive and Reliable Optode System for Measuring Dissolved Oxygen in the Nanomolar Range. PLoS ONE10(6), e0128125. doi: 10.1371/journal.pone.0128125
46
López-García P. Hull T. Thomsen S. Hahn J. Queste B. Y. Krahmann G. et al . (2022). OceanGliders Oxygen SOP, Version 1.0.0. OceanGliders, 55pp. doi: 10.25607/OBP-1756
47
McNeil C. L. D’Asaro E. A. (2014). A calibration equation for oxygen optodes based on physical properties of the sensing foil. Limnol. Oceanogr.: Methods12, 139–154. doi: 10.4319/lom.2014.12.139
48
Müller B. J. Burger T. Borisov S. M. Klimant I. (2015). High performance optical trace oxygen sensors based on NIR-emitting benzoporphyrins covalently coupled to silicone matrixes. Sensors and Actuators B: Chem.216, 527–534. doi: 10.1016/j.snb.2015.04.067
49
Obolensky G. Claustre H. Thierry V. Körtzinger A. (2019). Enhancement of the Argo core mission: Deployment of Bio-Argo and O2-deep floats and improvement of the network capabilities. AtlantOS Deliverable, D3.14. AtlantOS, 28 pp. doi: 10.3289/atlantos_d3.14
50
Oschlies A. Brandt P. Stramma L. Schmidtko S. (2018). Drivers and mechanisms of ocean deoxygenation. Nat. Geosci.11, 467–473. doi: 10.1038/s41561-018-0152-2
51
Quaranta M. Borisov S. M. Klimant I. (2012). Indicators for optical oxygen sensors. Bioanalytical Rev.4, 115–157. doi: 10.1007/s12566-012-0032-y
52
Riser S. C. Freeland H. J. Roemmich D. Wijffels S. Troisi A. Belbéoch M. et al . (2016). Fifteen years of ocean observations with the global Argo array. Nat. Climate Change6, 145–153. doi: 10.1038/nclimate2872
53
Schmidtko S. Stramma L. Visbeck M. (2017). Decline in global oceanic oxygen content during the past five decades. Nature542, 335. doi: 10.1038/nature21399
54
Sea-Bird Scientific (2022). Datasheet SBE 43 Dissolved Oxygen Sensor. Sea-Bird Electronics, Inc. (SBE), Bellevue, WA, USA.
55
Staudinger C. Strobl M. Fischer J. P. Thar R. Mayr T. Aigner D. et al . (2018). A versatile optode system for oxygen, carbon dioxide, and pH measurements in seawater with integrated battery and logger. Limnol. Oceanogr.: Methods16, 459–473. doi: 10.1002/lom3.10260
56
Stramma L. Johnson G. C. Sprintall J. Mohrholz V. (2008). Expanding Oxygen-Minimum Zones in the Tropical Oceans. Science320, 655–658. doi: 10.1126/science.1153847
57
Sweetman A. K. Smith A. J. de Jonge D. S. W. Hahn T. Schroedl P. Silverstein M. et al . (2024). Evidence of dark oxygen production at the abyssal seafloor. Nat. Geosci.17, 737–739. doi: 10.1038/s41561-024-01480-8
58
Tanhua T. (2018). Hydrochemistry of water samples during METEOR cruise M116/1 [dataset]. PANGAEA. doi: 10.1594/PANGAEA.886191
59
Task Team for an Integrated Framework for Sustained Ocean Observing (2012). A Framework for Ocean Observing (by Lindstrom, E., Gunn, J., Fischer, A., McCurdy, A., & Glover, L. K. et al.,). (Paris, France: UNESCO, 25pp (IOC Information Document 1284, Rev. 2)). doi: 10.5270/OceanObs09-FOO
60
Tengberg A. Hovdenes J. (2014). Information on long-term stability and accuracy of Aanderaa oxygen optodes. Information about multipoint calibration system and sensor option overview. Available online at: http://www.aanderaa.com/media/pdfs/2014-04-O2-optode-and-calibration.pdf (Accessed June 9, 2025).
61
Tengberg A. Hovdenes J. Andersson H. J. Brocandel O. Diaz R. Hebert D. et al . (2006). Evaluation of a lifetime-based optode to measure oxygen in aquatic systems. Limnol. Oceanogr.: Methods4, 7–17. doi: 10.4319/lom.2006.4.7
62
Totland C. Eek E. Blomberg A. E. Waarum I.-K. Fietzek P. Walta A. (2020). The correlation between pO2 and pCO2 as a chemical marker for detection of offshore CO2 leakage. Int. J. Greenhouse Gas Control99, 103085. doi: 10.1016/j.ijggc.2020.103085
63
Totland C. Eek E. Wolf R. Waarum I.-K. Blomberg A. E. A. (2023). Effects of abiotic processes on the correlation between pH and pO2 in the Norwegian Sea: Implications for GCS monitoring. Int. J. Greenhouse Gas Control125, 103879. doi: 10.1016/j.ijggc.2023.103879
64
Uchida H. Johnson G. McTaggart K. (2010). CTD Oxygen Sensor Calibration Procedures. In: The GO-SHIP Repeat Hydrography Manual: A Collection of Expert Reports and Guidelines. Eds. HoodE. M.SabineC. L.SloyanB. M. (IOCCP Report Number 14. ICPO Publication Series Number 134).
65
Uchida H. Kawano T. Kaneko I. Fukasawa M. (2008). In Situ Calibration of Optode-Based Oxygen Sensors. J. Atmospheric Oceanic Technol.25, 2271–2281. doi: 10.1175/2008JTECHO549.1
66
Visbeck M. (2016). Oxygen in the Tropical Atlantic OSTRE Third Tracer Survey - Cruise No. M116/1 - May 1 - June 3, 2015 - Pointe-a-Pitre (Guadeloupe) - Mindelo (Cape Verde). In METEOR-Berichte (M116/1, pp. 1–43). DFG-Senatskommission für Ozeanographie, Bremen, Germany. doi: 10.2312/cr_m116_1
67
Visbeck M. Siccha M. Handmann P. Falk C. Hahn T. Trassierra J. et al . (2017). South Atlantic Crossing (SACROSS), Cruise No. M133, 15.12.2016 - 13.01.2017, Cape Town (South Africa) - Stanley (Falklands). In METEOR-Berichte (Vol. M133, pp. 1–71). Gutachterpanel Forschungsschiffe, Bonn, Germany. doi: 10.2312/cr_m133
68
Wang X.-D. Wolfbeis O. S. (2014). Optical methods for sensing and imaging oxygen: materials, spectroscopies and applications. Chem. Soc Rev.43, 3666–3761. doi: 10.1039/C4CS00039K
69
Weiss R. F. (1970). The solubility of nitrogen, oxygen and argon in water and seawater. Deep Sea Res. Oceanographic Abstracts17, 721–735. doi: 10.1016/0011-7471(70)90037-9
70
Wolfbeis O. S. (2015). Luminescent sensing and imaging of oxygen: Fierce competition to the clark electrode. BioEssays37, 921–928. doi: 10.1002/bies.201500002
Summary
Keywords
dissolved oxygen (DO), optode sensor, fast response time, ocean observing, operational oceanography, biogeochemical floats, marine technology, H2020 AtlantOS project
Citation
Hahn T and Körtzinger A (2025) Novel oxygen optode sensor with fast response time: an in-depth characterization and assessment of the HydroFlash O2, applicable for several ocean observing platforms. Front. Mar. Sci. 12:1589920. doi: 10.3389/fmars.2025.1589920
Received
08 March 2025
Accepted
14 May 2025
Published
31 July 2025
Volume
12 - 2025
Edited by
Pierre Yves Le Traon, Mercator Ocean, France
Reviewed by
Kenneth S. Johnson, Monterey Bay Aquarium Research Institute (MBARI), United States
Laurent Coppola, UMR7093 Laboratoire d’océanographie de Villefranche (LOV), France
Updates
Copyright
© 2025 Hahn and Körtzinger.
This is an open-access article distributed under the terms of the Creative Commons Attribution License (CC BY). The use, distribution or reproduction in other forums is permitted, provided the original author(s) and the copyright owner(s) are credited and that the original publication in this journal is cited, in accordance with accepted academic practice. No use, distribution or reproduction is permitted which does not comply with these terms.
*Correspondence: Tobias Hahn, thahn@geomar.de
Disclaimer
All claims expressed in this article are solely those of the authors and do not necessarily represent those of their affiliated organizations, or those of the publisher, the editors and the reviewers. Any product that may be evaluated in this article or claim that may be made by its manufacturer is not guaranteed or endorsed by the publisher.