Abstract
Black sea bass (Centropristis striata) is an abundant fishery species that occupies continental shelf waters from the Gulf of Mexico to the Gulf of Maine. There has been a rapid northward shift in its center of biomass, contributing to an increase in fishing activity within the northern stock. Several research priorities have been identified for the species, including the need for a better understanding of the size of commercially caught fish, especially discards, and the catchability of black sea bass in different gear types to reduce uncertainty in the stock assessment. Here, we utilize fishery-dependent data collected by the Commercial Fisheries Research Foundation and Rhode Island Department of Environmental Management Black Sea Bass Research Fleet to address these needs. Throughout the Southern New England and Mid-Atlantic regions, 2,433 sampling sessions were completed over seven years by commercial fishermen using five gear types (trawl, gillnet, lobster-crab trap, fish pot, commercial rod and reel). Kruskal-Wallis and Kolmogorov-Smirnov tests and generalized additive models were applied to investigate differences in size composition among gear types and disposition, as well as temporal trends of landed, retained, and discarded fish. Results suggest that the size composition of black sea bass significantly differed among gear types and disposition. Depending on the gear type, a large proportion (25%-100%) of discarded fish were above the federal minimum commercial size limit. In addition, beyond the expected interannual variation in the size of black sea bass, there were no apparent positive or negative trends. The study’s results highlight the value of this cost-effective approach to quickly address data gaps for use in stock assessments while also engaging members of the fishing community.
Introduction
Black sea bass (Centropristis striata) is an abundant bottom-dwelling fish that occupies northwestern Atlantic continental shelf waters ranging from the Gulf of Mexico to the Gulf of Maine (Miller, 1959; Mercer, 1989; Fabrizio et al., 2013). The species is important ecologically as generalist predators that feed on a wide variety of species and economically, as black sea bass supports substantial commercial and recreational fisheries (Sedberry, 1988; Huntsman, 1976; Mercer, 1989; Low, 1981). Black sea bass in the Northwest Atlantic Ocean is managed as two distinct stocks. The south Atlantic stock ranges from Florida to Cape Hatteras, North Carolina, and the north Atlantic stock ranges from Cape Hatteras to Maine (encompassing both the mid-Atlantic and New England regions) (Mercer, 1978). In recent decades, black sea bass has demonstrated a rapid northward shift in its center of biomass, which is partially attributed to changes in water temperature due to climate change (Bell et al., 2015). As a result of this change in biomass distribution, the dynamics of the Atlantic black sea bass fishery have experienced rapid changes over a large spatial scale, with the fishery becoming increasingly active in the northern stock.
For abundant species such as northern black sea bass, fishermen will oftentimes catch more large fish than they are allowed to land and will be required to discard legal-size and marketable products due to these quota constraints (commonly referred to as a regulatory discard). For example, until recently, state quotas for black sea bass were calculated based on historical statewide landings of the species up until only 2001. However, the northward shift in the biomass of black sea bass resulted in low quotas in states within the northern range of the stock compared to the abundance of black sea bass, which led to a high rate of regulatory discarding in these areas (Atlantic States Marine Fisheries Commission [ASMFC], 2021). As a result, the MAFMC and the ASMFC revised black sea bass commercial state allocations based on the observed changes in stock distribution, which effectively increased quotas for more northern states (Atlantic States Marine Fisheries Commission [ASMFC], 2021). This significant impact to the management of northern black sea bass demonstrates an important step towards more effective management of the stock. However, there is still a lack of available discard data for black sea bass, which may not only lead to uncertainty in stock assessment models, but also unnecessary mortality within the stock and economic losses for fishermen (Bellido et al., 2011; Suuronen and Gilman, 2020). Additional data is needed on the composition of fish landed versus discarded in multiple fisheries that interact with black sea bass to help fill in these gaps.
Several specific research priorities have been identified for black sea bass, including the need for a better understanding of the size of commercially caught fish, especially discards (Miller et al., 2009) and catchability in different gear types (Northeast Fisheries Science Center [NEFSC], 2017). Gear specific catch data is important because the design of each fishing gear type results in a process of selectivity bias, where each gear type can select for certain fish within a defined length range (Sathianandan, 2017). Furthermore, the northern black sea bass stock assessment is heavily reliant on data generated by trawl-based surveys, such as the NEFSC bottom trawl survey (Northeast Fisheries Science Center [NEFSC], 2023). The limited coverage of optimal habitat for black sea bass, which are structure-associated, and semi-seasonal sampling schedule of the NEFSC trawl survey may limit the suitability of the survey data for the stock assessment for this species. Furthermore, while trawl gear accounts for 45% of black sea bass commercial landings, fish pots and traps combined represent 41% in addition to the 15% represented by commercial rod and reel and other gear types (Curti et al., 2023). As these non-trawl gear types represent a significant portion of commercial landings, more size information from less-sampled gear types may provide the basis for more detailed models and/or support the development of stronger age-length keys within the stock assessment. Cost-effective fishery-dependent data collection methods are useful to rapidly fulfill research priorities in such cases and are critical in the development of effective fishery management practices (Bradley et al., 2019).
To help meet these needs and increase the ability to characterize the composition of black sea bass landed and discarded in multiple fisheries, the Commercial Fisheries Research Foundation and Rhode Island Department of Environmental Management established the Black Sea Bass Research Fleet (hereafter ‘Research Fleet’) in 2016. The Research Fleet is composed of commercial fishermen who collect fishery and biological data on black sea bass during their typical fishing activities, with representatives from trawl, pot and trap, rod and reel, and gillnet fisheries. For a full introduction on the Research Fleet approach and a summary of the data collected, please see Heimann et al. (2023).
In 2023, the Black Sea Bass Research Track Stock Assessment included, for the first time, size data collected from the Research Fleet to improve gear-specific discards-at-length estimations (Northeast Fisheries Science Center [NEFSC], 2023). Prior to inclusion in the assessment, the Research Fleet data underwent an in-depth evaluation by the assessment working group to assess data quality and applicability. Specifically, to ensure the data collected by the Research Fleet participants were representative of the fishery and comparable to other fishery-dependent data sources that did not rely on fishermen for data collection, the length data of discarded and landed black sea bass collected by the Research Fleet were compared to those collected by the Northeast Fisheries Science Center Observer Program (Verkamp et al., 2023). That comparison demonstrated gear-specific similarities in the size frequency distributions between the Research Fleet and federal observer datasets, and the Research Fleet is now a vetted source of year-round fishery-dependent data for black sea bass assessment (Verkamp et al., 2023). However, that work did not include statistical evaluations of how the data differed within the Research Fleet based on factors such as gear type and disposition.
Here, we dive deeper into the data collected by the Research Fleet to answer the following questions: 1) Does the size composition of black sea bass differ between commercial gear types? 2) Does the size composition of discarded and landed black sea bass differ within each gear type? and 3) Has the size composition of black sea bass caught, discarded, and landed within gear types changed throughout seven years of Research Fleet data collection?
Materials and methods
Data were opportunistically collected by participant Research Fleet fishermen using a Samsung Tab A tablet from November 2016 through December 2023. The tablets were equipped with the On Deck Data application, which was designed specifically for the Commercial Fisheries Research Foundation’s Research Fleets (Mercer et al., 2018) and modified for use by the Black Sea Bass Research Fleet (Heimann et al., 2023). The application records and stores data at sea and uploads it to an online database owned and managed by the Commercial Fisheries Research Foundation via Wi-Fi. Research Fleet participants were asked to collect data on three sampling sessions and 150 individual black sea bass per month; however, due to the fishery’s seasonality and opportunistic data collection, actual numbers of sessions and samples recorded by each participant per month varied widely. In addition, as the project originated in Rhode Island, the majority of vessels that participated in data collection are homeported in Rhode Island.
When participants chose to sample black sea bass from their commercial catch, they initialized On Deck Data while at-sea and began a sampling session, which is defined as hauling a set of gear or conducting a tow in one location. For each sampling session, the internal tablet GPS and calendar automatically recorded the sampling date, time, and location. The application then prompted participants to enter the NOAA statistical area, depth, habitat type (soft, hard, or structure), target species, gear type, and gear-specific effort parameters (Appendix 1). Participants then opportunistically sampled individual black sea bass. Each fish that was sampled was measured for total length (TL) to the nearest cm, visually identified for sex (male, female, or unknown), and the disposition of the fish (retained or discarded) was recorded. Finally, participants recorded the total number or pounds of black sea bass caught. Research Fleet participants later uploaded data to a SQL database which was regularly audited for quality assurance and control, and any identified potential data errors were discussed with participants, as described in Mercer et al. (2018).
Statistical analyses were conducted in R (R Core Team, 2024) with alpha values set at 0.05. To characterize the size composition of black sea bass caught for each gear type (trawl, gillnet, lobster-crab trap, fish pots, and commercial rod and reel), a Kruskal-Wallis test followed by Dunn’s post hoc test with Bonferroni corrections was used to compare the median length of all fish sampled by each gear type. The addition of Bonferroni corrections was chosen despite the risk of a type II statistical error occurrence because the detection of fine-scale significant effect of gear type on black sea bass size composition was deemed unnecessary for initial exploration. The length frequency distributions of all black sea bass sampled by each gear type were also compared using pairwise two-sample, two-sided Kolmogorov-Smirnov (K-S) tests, in which the test statistic critical value was calculated using the number of independent sampling sessions as the sample size. This approach helps mitigate spatial biases and decreases the likelihood of type I statistical errors that could result from the clustered nature of fisheries data collection (Bethoney and Stokesbury, 2019; Bethoney et al., 2014; Nelson, 2014; Neumann and Allen, 2007).
Size data were then separated by gear type, and the size frequency distributions of discarded versus retained black sea bass were compared for each gear type separately. Empirical cumulative distribution functions were fitted to the data for each gear type and two-sample, two-sided K-S tests utilizing the same method to calculate the test statistic critical value as described above were used to evaluate statistical differences in the distributions.
Research Fleet sampling began in late November 2016, so data collected in 2016 were excluded from analyses that included year as a factor. To visually explore overall trends in the relative frequency of black sea bass size classes sampled over time, length data were grouped into 5 cm size bins, and the percentage of fish sampled within each bin was plotted by year. In addition, size data were plotted into histograms by year. Due to the opportunistic nature of Research Fleet participation and sampling, only three gear types (lobster-crab traps, fish pots, and trawl) had data collected each year from 2017 through 2023; therefore, only these gear types were considered further to evaluate trends in size composition over time. Generalized additive models (GAMs) were used to assess yearly variation in the size of fish caught, landed, and discarded for each of these gear types [Total Length (Y) ~ Year (X)]. The ‘mgcv’ package (Wood, 2011) was used with the basis dimension set at k = 7 and the gamma parameter set at 1.4 to appropriately reflect the estimated degrees of freedom and prevent overfitting of the data (Wood, 2017). In addition, a Tweedie error distribution was used due to the skewed and non-negative nature of the data. Model diagnostic plots were generated using the ‘gratia’ package (Simpson, 2022) and are provided for all models in the Supplementary Materials. Model outputs of deviance explained were used to assess the goodness of fit given the non-normal distribution of the data (Wood, 2017).
Results
From November 2016 through December 2023, the Research Fleet sampled 48,766 individual black sea bass from 2,433 sampling sessions using five commercial gear types throughout the southern New England and Mid-Atlantic regions (Figure 1). As the majority of participant vessels were homeported in Rhode Island, there was much more concentrated sampling in and around Rhode Island and the broader southern New England region compared to the Mid-Atlantic. Within this timeframe, 1,228 sampling sessions were completed using lobster-crab traps, 742 sessions using fish pots, 300 sessions using trawl gear, 135 sessions using gillnets, and 28 sessions using commercial rod and reel. As described, individual sampling frequency varied widely based on seasonality of the different fisheries and due to the opportunistic nature of sampling; for sampling rates and associated discussion for the first four years of the Research Fleet, please see Heimann et al. (2023).
Figure 1
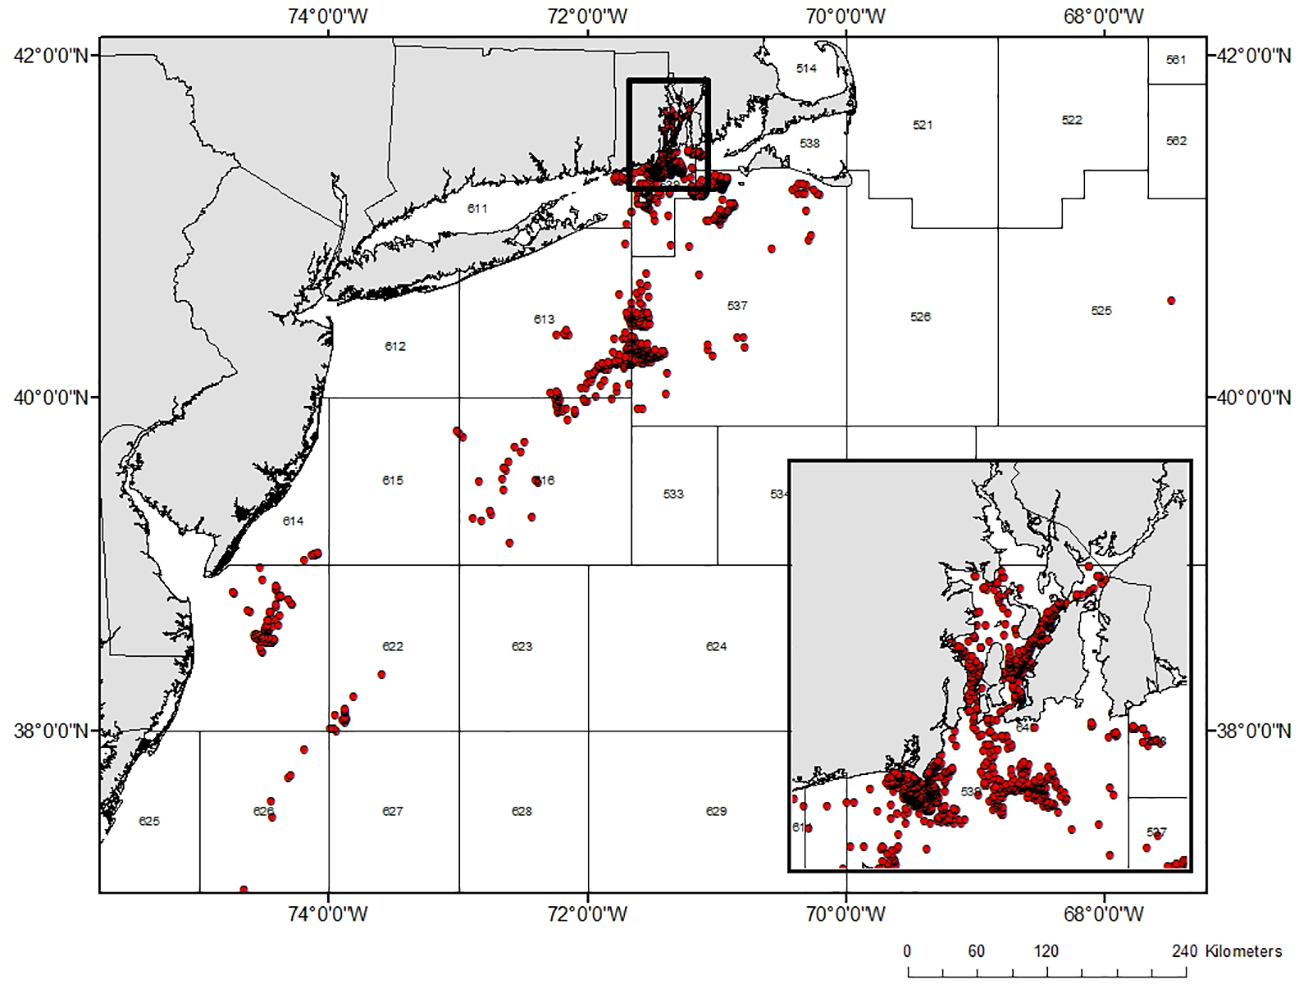
Map showing the spatial coverage of Black Sea Bass Research Fleet sampling activity in the southern New England and Mid-Atlantic regions across NOAA fishing statistical areas (n=2,433 sampling sessions). Red circles indicate the location of a sampling session. Inset shows a magnified view of sessions conducted in Rhode Island and surrounding waters.
Individual fish sizes ranged from 2 cm to 68 cm, with an overall average total length (± 1 standard deviation (SD)) of 30.2 ± 10.4 cm (Figure 2). The median length of black sea bass significantly varied among all gear types (Table 1), with gillnets generally catching the largest fish (50 cm median TL) and lobster-crab traps catching the smallest (27 cm median TL) (Figure 3). The overall length frequency distributions of fish also significantly differed among all gear type pairwise comparisons, except for fish sampled by fish pots and rod and reel, which did not significantly differ (Table 2).
Figure 2
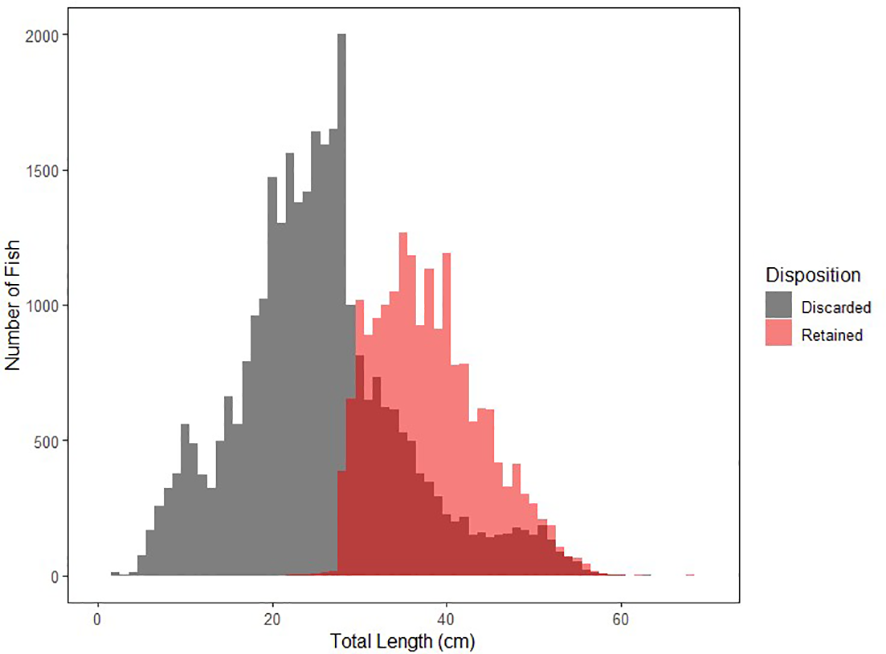
Overall size composition for discarded (n=30,388) versus retained (n=8,378) black sea bass.
Table 1
| Gear type pairwise comparisons | Test statistic (Z) | p-value |
|---|---|---|
| Commercial Rod & Reel - Gillnet | -32.20 | p < 0.001 |
| Commercial Rod & Reel - Pots | 8.95 | p < 0.001 |
| Gillnet - Pots | 60.53 | p < 0.001 |
| Commercial Rod & Reel - Traps | 19.51 | p < 0.001 |
| Gillnet - Traps | 72.33 | p < 0.001 |
| Pots - Traps | 30.23 | p < 0.001 |
| Commercial Rod & Reel - Trawl | 19.96 | p < 0.001 |
| Gillnet - Trawl | 71.10 | p < 0.001 |
| Pots - Trawl | 28.11 | p < 0.001 |
| Traps - Trawl | 2.01 | p < 0.001 |
Results of Dunn’s multiple comparisons test with Bonferroni correction comparing the median size of fish sampled by each gear type.
Figure 3
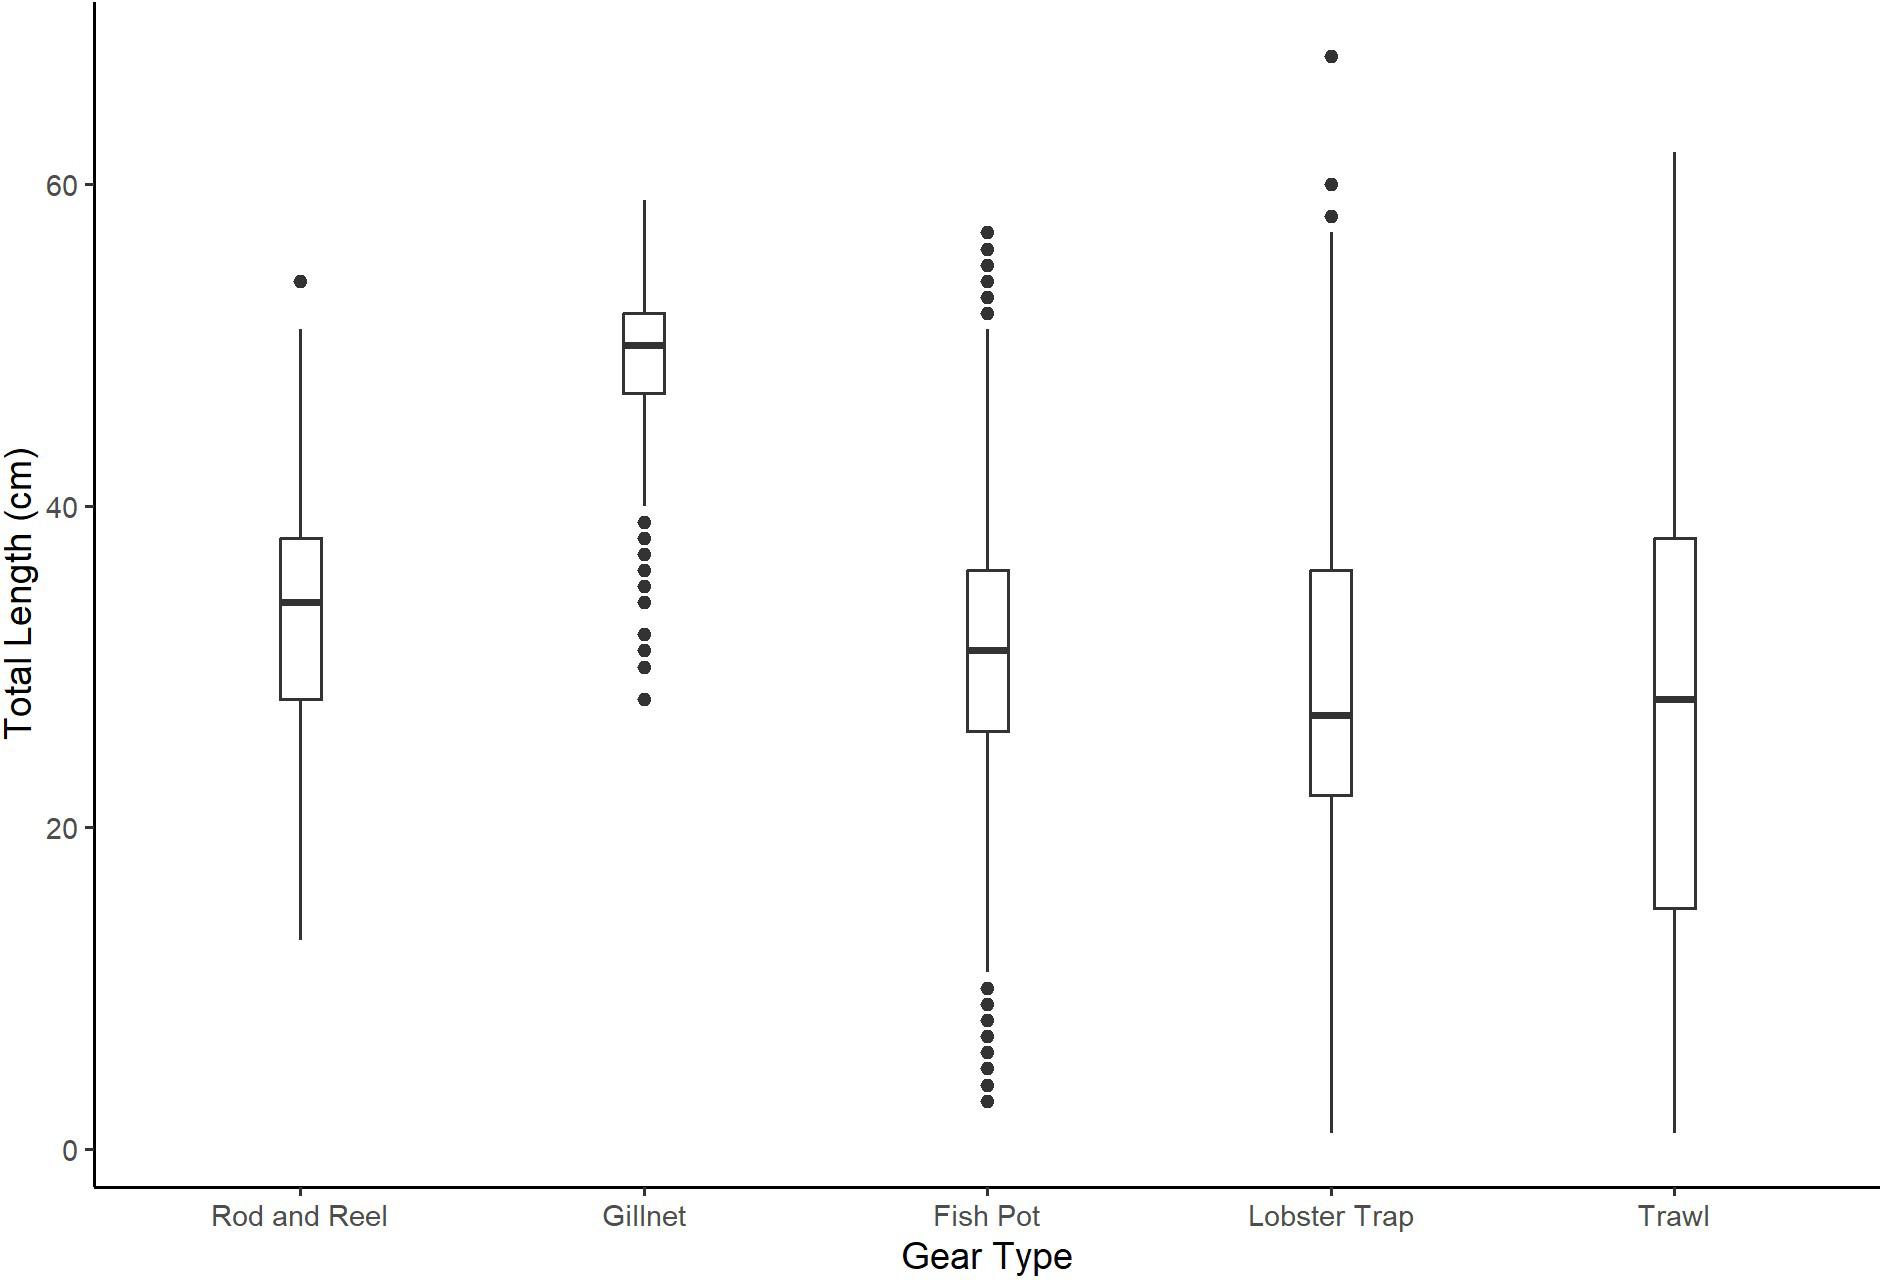
Boxplots of black sea bass sampled from each gear type.
Table 2
| Gear 1 | Gear 2 | Test Statistic (D) |
|---|---|---|
| Trawl | Gillnet | D300,135 = 0.85* |
| Trawl | Fish Pots | D300,742 = 0.28* |
| Trawl | Lobster-Crab Traps | D300,1228 = 0.18* |
| Trawl | Commercial Rod & Reel | D300,28 = 0.36* |
| Gillnet | Fish Pots | D135,742 = 0.87* |
| Gillnet | Lobster-Crab Traps | D135,1228 = 0.85* |
| Gillnet | Commercial Rod & Reel | D135,28 = 0.84* |
| Fish Pots | Lobster-Crab Traps | D742,1228 = 0.23* |
| Fish Pots | Commercial Rod & Reel | D742,28 = 0.16 |
| Lobster-Crab Traps | Commercial Rod & Reel | D1228,28 = 0.33* |
Results from Kolmogorov-Smirnov tests comparing size composition of black sea bass amongst gear type.
*Indicates significance.
Overall, 38% (n = 18,378) and 62% (n = 30,388) of sampled fish were retained for harvest versus discarded, respectively. Retained fish had an overall mean TL of 38.0 ± 6.2 cm, while discarded fish were 25.4 ± 9.5 cm on average; as expected, the overall size compositions of retained versus discarded fish significantly differed (Table 3; Figure 4). There were gear-specific trends in the proportions and size compositions of retained and discarded fish (Figure 4, Table 4). For example, all (n = 1,081) discarded fish sampled by gillnet were larger than the federal commercial minimum legal size (11 inches, ~ 28 cm; NOAA 2024). Of the discarded fish sampled by commercial rod and reel and fish pots, 56% (n = 307) and 43% (n = 5,343) were over the federal minimum legal size, respectively. Trends of fish discarded by lobster-crab traps and trawl were similar, where 25% (n = 2,480) and 27% (n = 1,713) were over the federal minimum legal size, respectively. Within each gear type, the length frequency distributions of retained and discarded fish significantly differed, except for gillnets, for which retained and discarded fish had the same distributions (Table 3; Figure 5).
Table 3
| Gear Type | Test Statistic (D) |
|---|---|
| All | D2105,1259 = 0.68* |
| Trawl | D223,180 = 0.72* |
| Gillnet | D79,71 = 0.04 |
| Fish Pots | D678,462 = 0.65* |
| Lobster-Crab Traps | D1098,523 = 0.79* |
| Commercial Rod & Reel | D27,23 = 0.65* |
Results from Kolmogorov-Smirnov tests comparing size composition of black sea bass disposition (discarded vs. retained) amongst gear types.
*Indicates significance.
Figure 4
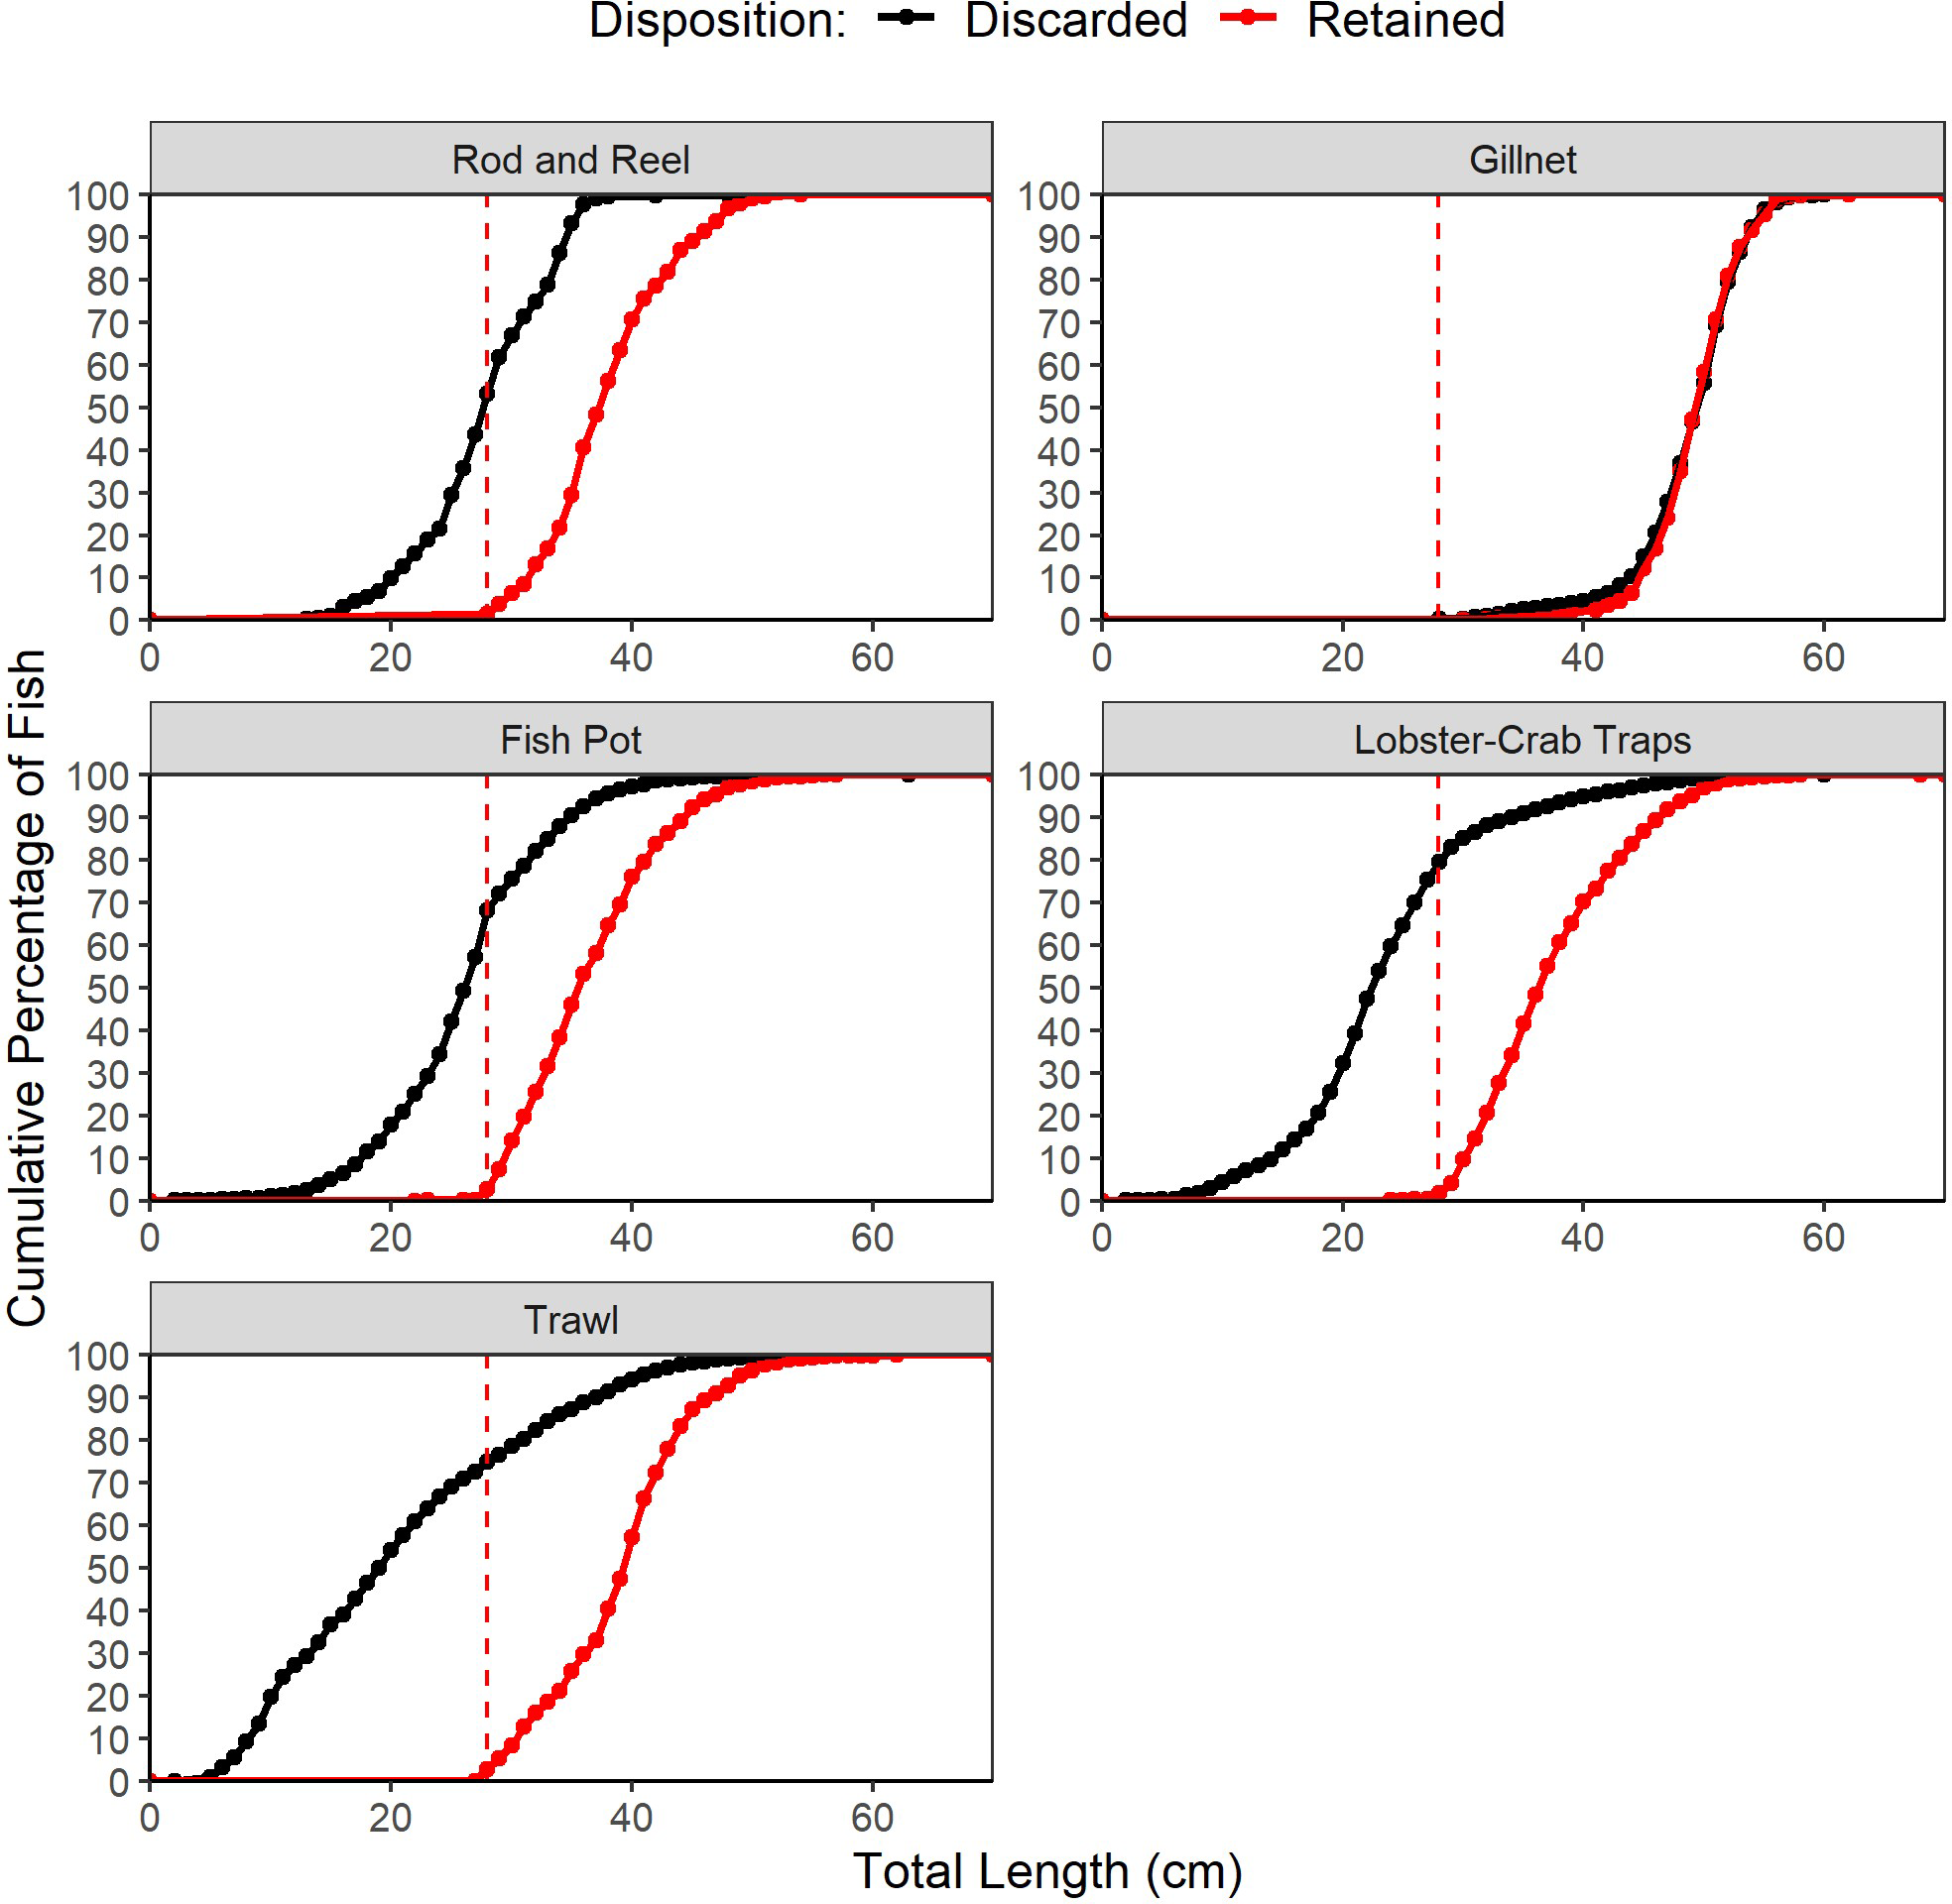
Empirical cumulative distribution function (ECDF) plot displaying the cumulative percentage of black sea bass discarded and retained at different total lengths for each gear type. The vertical red line indicates the federal minimum commercial size limit (27.94 cm).
Table 4
| Gear type | Action | N | Median total length (cm) | Average total length (± standard deviation) (cm) |
|---|---|---|---|---|
| Lobster-Crab Traps | Retained | 4,299 | 37 | 37.8 (± 6.1) |
| Discarded | 10,050 | 23 | 23.9 (± 8.2) | |
| All | 14,349 | 27 | 28.1 (± 9.9) | |
| Gillnet | Retained | 757 | 50 | 49.6 (± 3.8) |
| Discarded | 1,081 | 50 | 49.2 (± 4.6) | |
| All | 1,838 | 50 | 49.3 (± 4.3) | |
| Commercial Rod and Reel | Retained | 636 | 38 | 38.3 (± 5.2) |
| Discarded | 544 | 28 | 28.1 (± 5.4) | |
| All | 1,180 | 34 | 33.6 (± 7.3) | |
| Trawl | Retained | 2,818 | 40 | 39.4 (± 5.9) |
| Discarded | 6,233 | 19 | 21.1 (± 10.7) | |
| All | 9,051 | 28 | 26.8 (± 12.7) | |
| Fish Pots | Retained | 9,868 | 36 | 36.8 (± 5.6) |
| Discarded | 12,480 | 27 | 26.6 (± 6.7) | |
| All | 22,348 | 31 | 31.1 (± 8.1) |
Summary of the sample size (N) and average total length (TL) of sampled fish retained for harvest, discarded, and overall for each gear type.
Figure 5
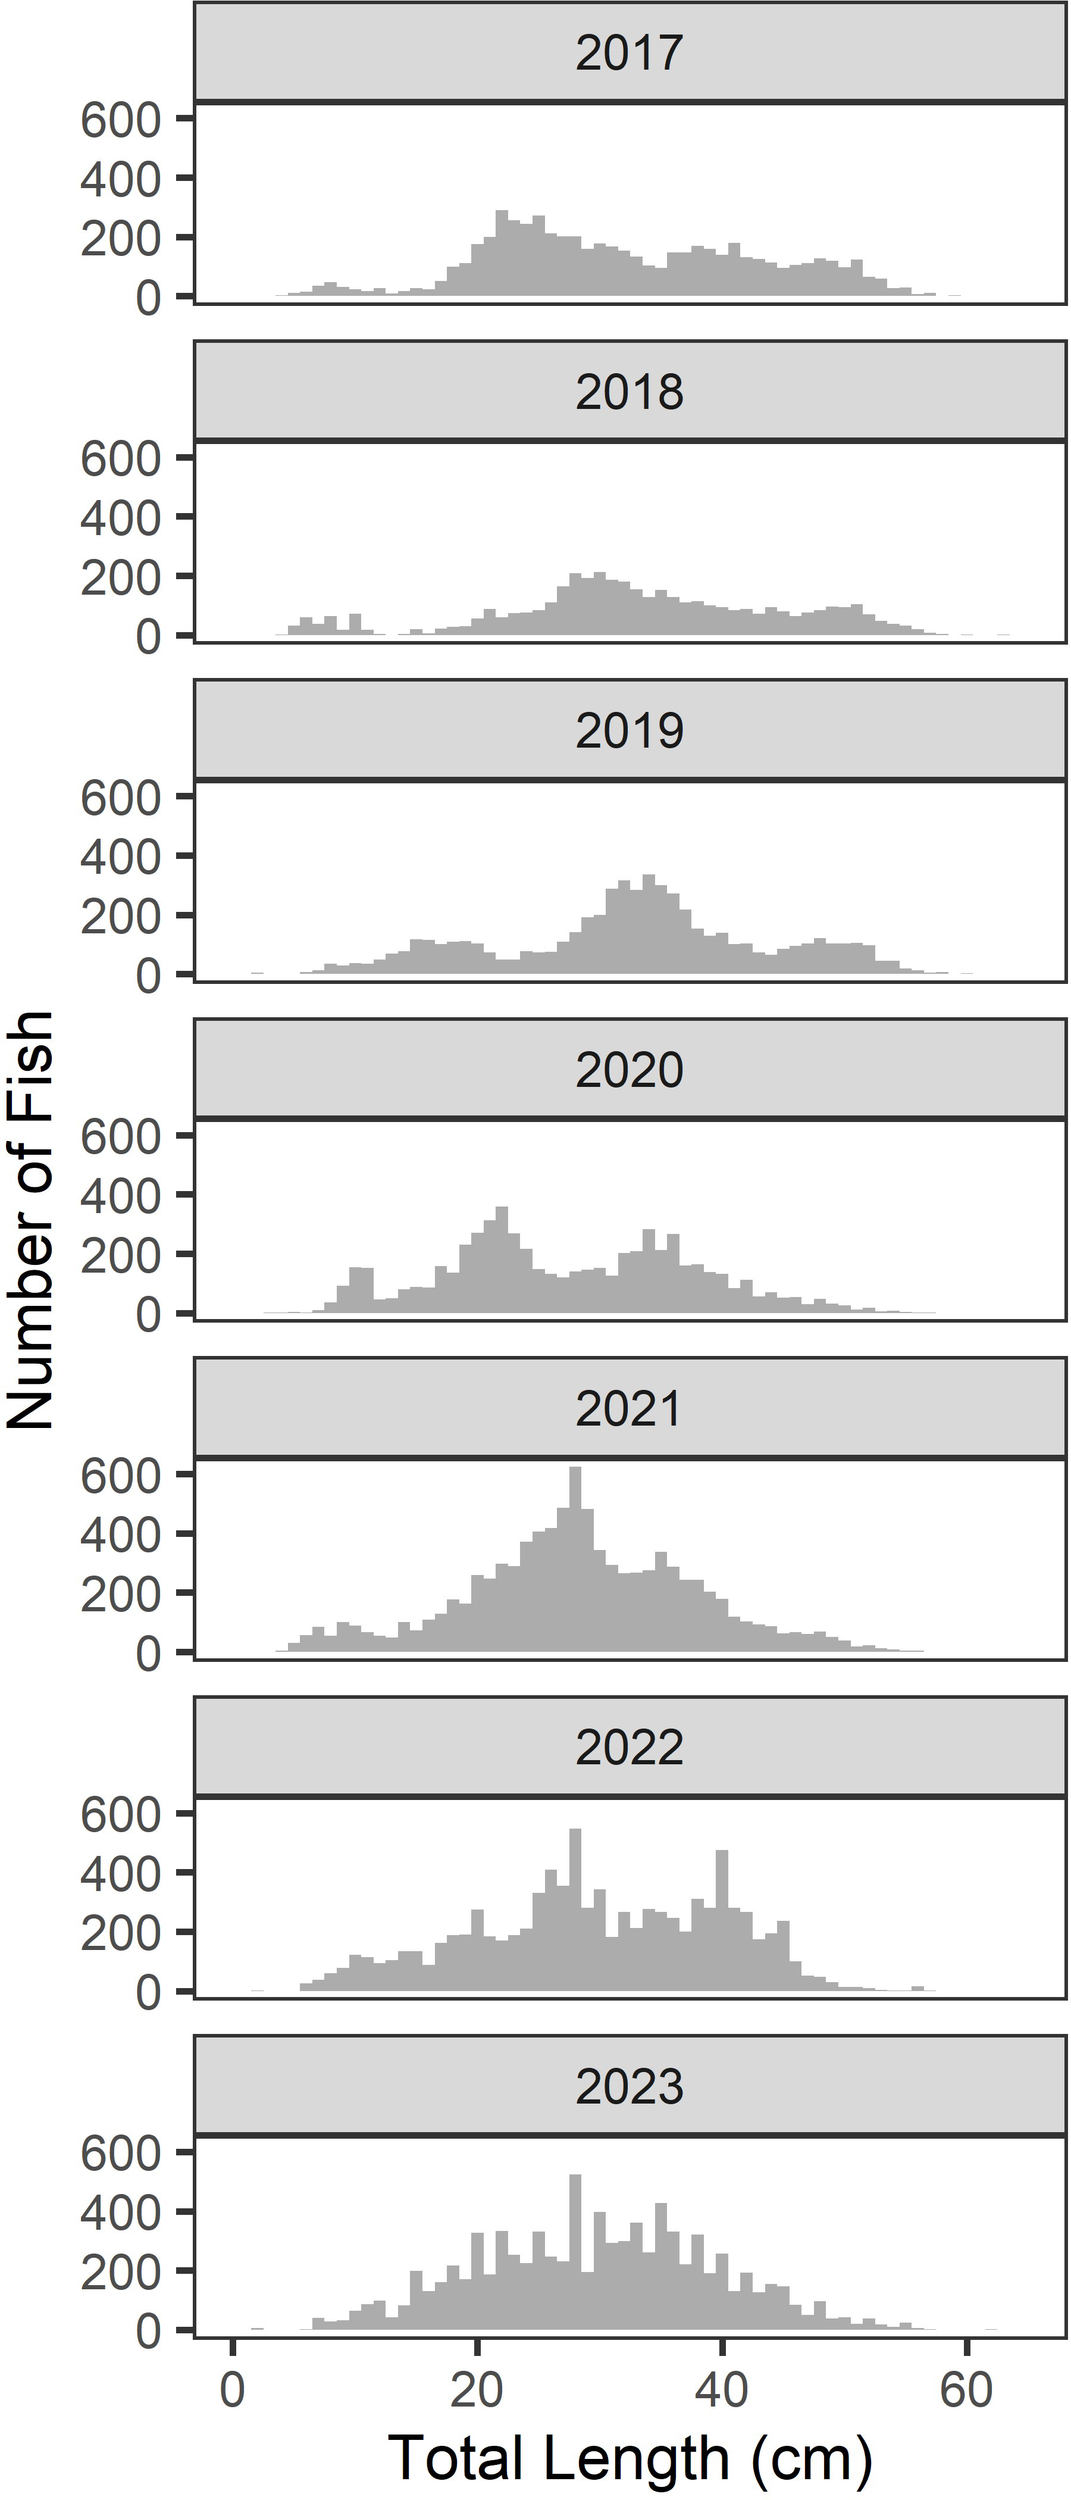
Size histograms of black sea bass sampled each year by the Research Fleet for all gear types combined.
The overall and relative size frequency of sampled black sea bass varied from year to year (Figure 5). Despite a relatively short time series, multiple year classes were presumably apparent, with yearly histograms generally displaying bi- or tri-modal distributions. (Figure 5). Visual examination illustrated the ability to begin to track cohorts over time, though more data over a longer time period is warranted to draw conclusions (Figure 5).
Further exploration of temporal trends showed that variations in black sea bass sizes over time depended on gear type and disposition. For example, the GAMs indicated the length of black sea bass caught, discarded, and retained from lobster-crab traps significantly differed by year (p < 0.001); however, the models only explained 5.31%, 5.42%, and 2.25%, of the deviance in total length respectively, and 95% confidence intervals were marginal (Figure 6; Appendix 2). There appeared to be a slight increase in the size of fish caught overall and discarded by lobster-crab traps around 2018, however, sizes then decreased again and the size of fish for all dispositions in 2023 was similar to those in 2017.
Figure 6
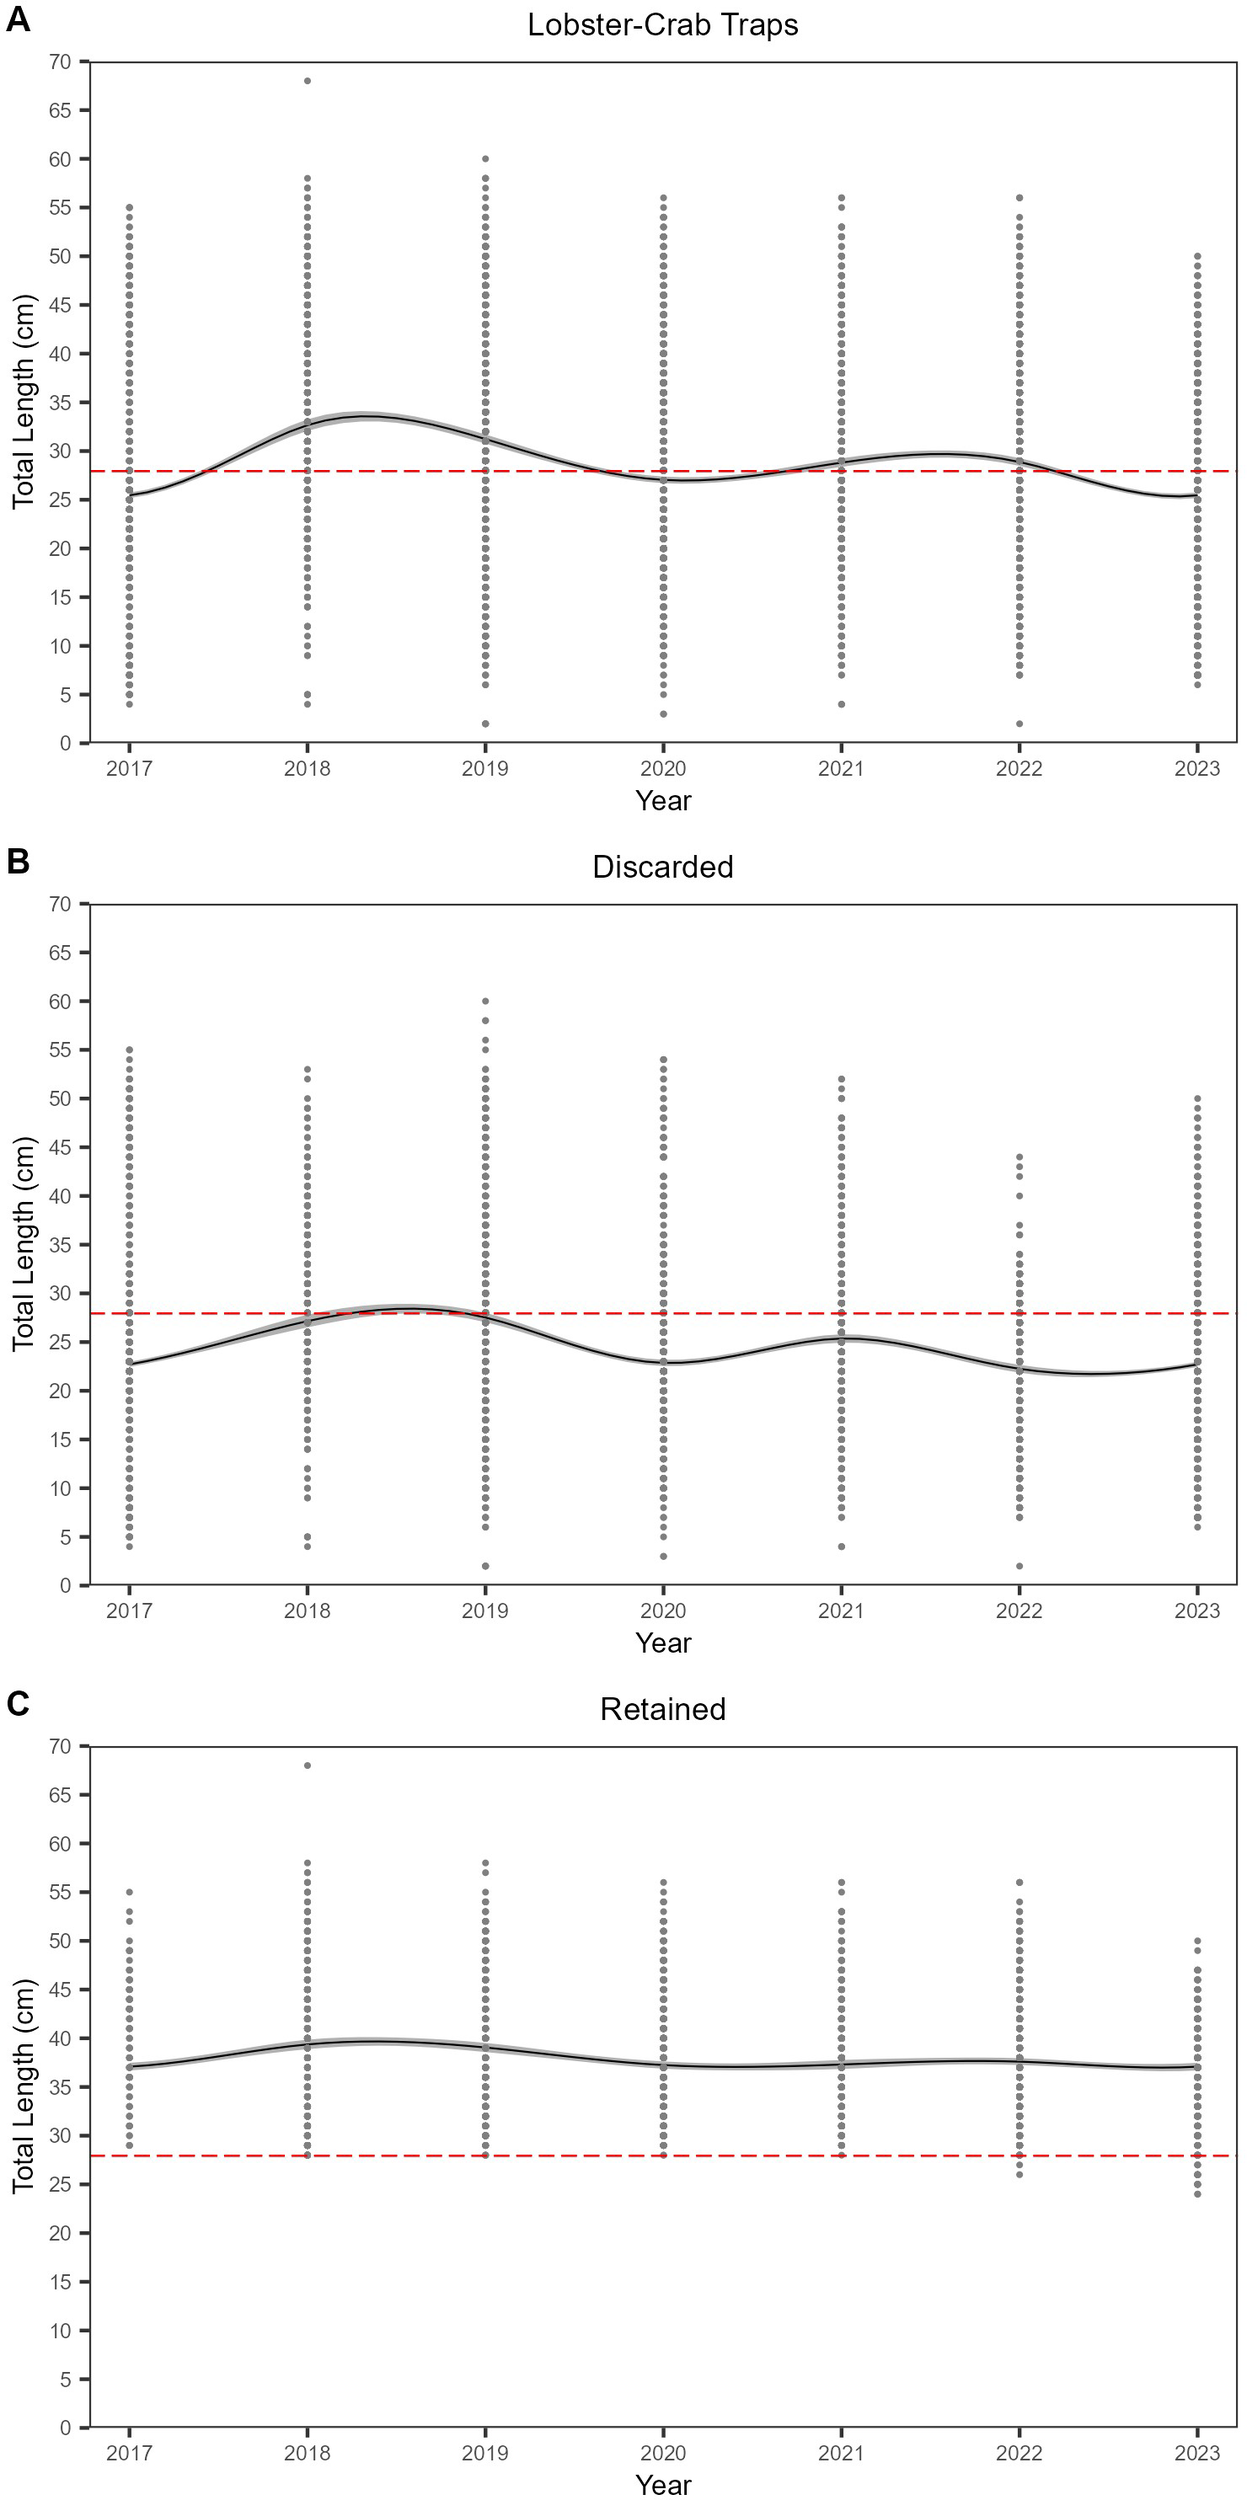
Generalized additive model results showing the yearly trends of black sea bass size composition of (A) all sampled fish (n=14,349), (B) discarded fish (n=10,050), and (C) retained fish (n=4,299) from lobster-crab traps. Individual points represent individual fish lengths, while the line represents the model fit with a 95% confidence interval. The horizontal red line indicates the federal minimum commercial size limit (27.94 cm).
Similarly, the length of black sea bass caught, discarded, and retained from trawl gear significantly differed over time year (p < 0.001), yet the GAMs only explained 11.6%, 8.69%, and 24.5% of the deviance in the size of fish of each disposition, respectively (Figure 7; Appendix 2). There appeared to be a decrease in the size of fish of all dispositions from 2017 until 2019; sizes then increased before returning to a similar size in 2023 as seen in 2017.
Figure 7
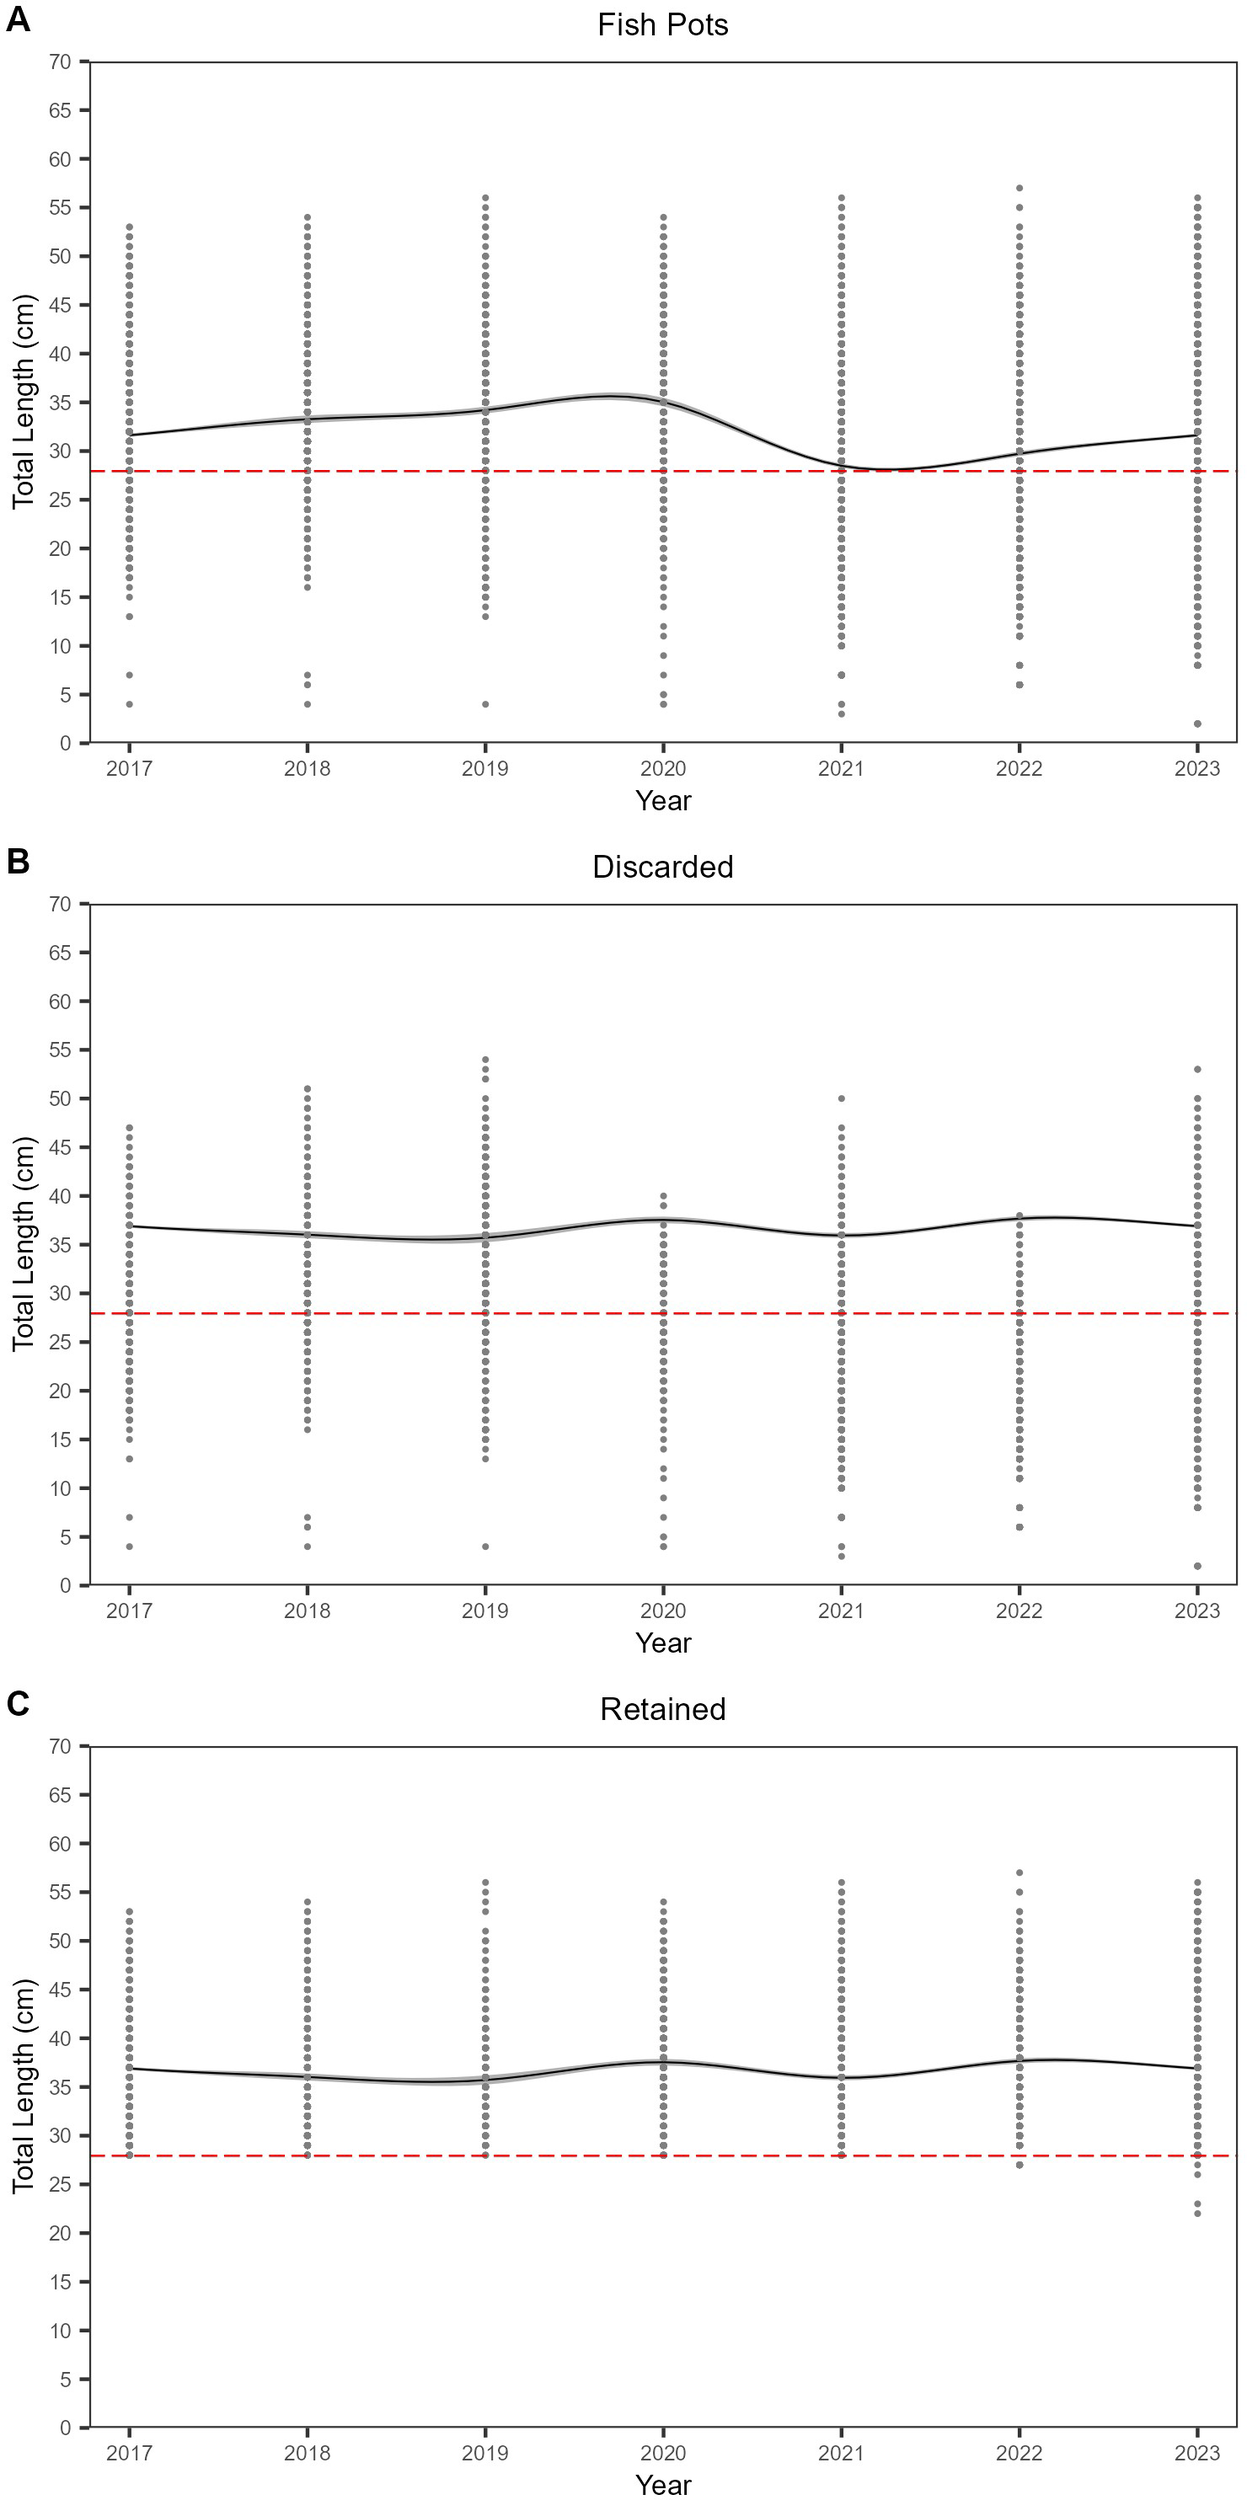
Generalized additive model results showing the yearly trends of black sea bass size composition of (A) all sampled fish (n=22,348), (B) discarded fish (n=12,480), and (C) retained fish (n=9,868) from fish pots. Individual points represent individual fish lengths, while the line represents the model fit with a 95% confidence interval. The horizontal red line indicates the federal minimum commercial size limit (27.94 cm).
Finally, the size of black sea bass caught, discarded, and retained from fish pots significantly differed by year (p < 0.001); the GAMS explained 6.26%, 24%, and 1.54% of the deviance in size of fish caught, discarded, and retained, and once again 95% confidence intervals were small (Figure 8; Appendix 2). Similar to lobster-crab traps, there initially appeared to be slight increases in the size of fish caught and discarded by fish pots, however, by 2023 sizes once again decreased to similar values to those observed in 2017.
Figure 8
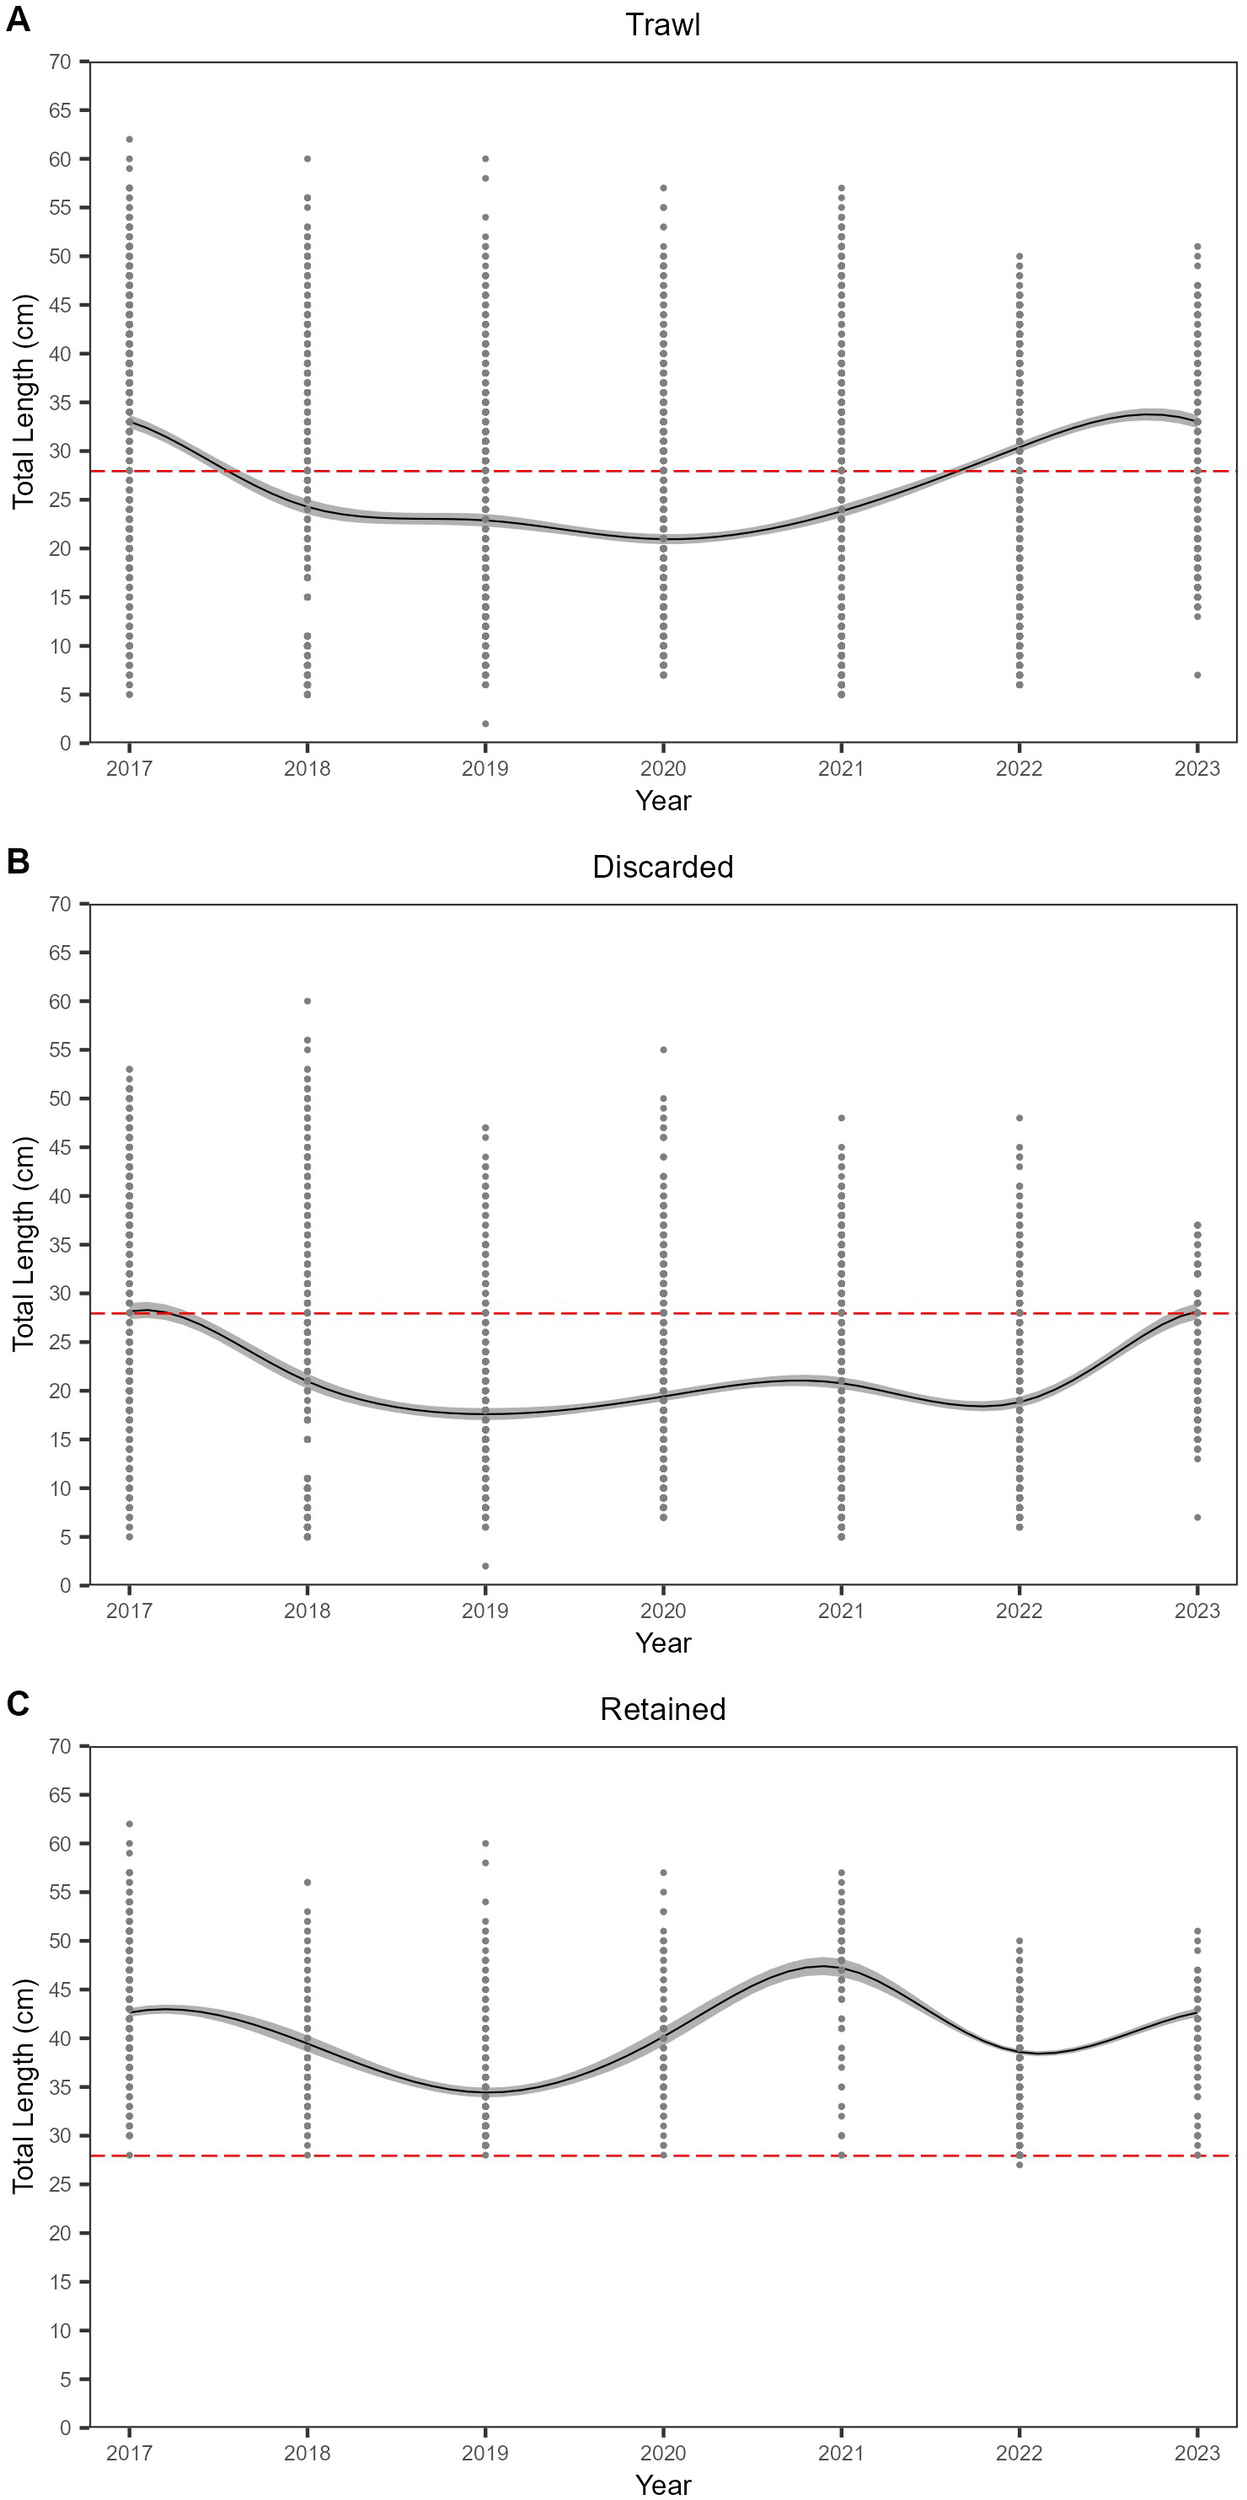
Generalized additive model results showing the yearly trends of black sea bass size composition of (A) all sampled fish (n=9,051), (B) discarded fish (n=6,233), and (C) retained fish (n=2,818) from trawl gear. Individual points represent individual fish lengths, while the line represents the model fit with a 95% confidence interval. The horizontal red line indicates the federal minimum commercial size limit (27.94 cm).
Discussion
This study used fishery-dependent data collected from five commercial fisheries over seven years to characterize the size composition of black sea bass catch across gear types, disposition, and time. Through this investigation, we found that the size composition of black sea bass significantly differed depending on the commercial gear type and between discarded and landed individuals for most gear types. Regardless of the gear type, many of the fish discarded by participants were of legal, marketable size. In addition, the size composition of caught, landed, and discarded black sea bass significantly differed over time within each gear type; however, the effect sizes were minimal and there were no consistent trends in either direction over time. Overall, the results of this study are consistent with our understanding of differences in gear selectivity and align with the stock assessment’s findings that the northern black sea bass population is stable and not experiencing overfishing. Further, the results support the observations of frequent regulatory discarding of black sea bass across fisheries.
In this study, the median size as well as overall length frequency distribution of black sea bass significantly differed among gear types, demonstrating a sizeable difference between the largest and smallest fish sampled. In addition, as expected, the length frequency distributions of black sea bass significantly differed depending on disposition within nearly all gear types, except for fish sampled by gillnets. These results were expected considering black sea bass interact with many different fisheries targeting a variety of species, and for which black sea bass are not always the primary intended catch. For example, despite often being landed and sold in the fishery, lobster-crab traps are not designed to target black sea bass. This gear type features the smallest mesh size of the gear types studied and, thus, unsurprisingly, caught the smallest fish and retained smaller-sized fish overall, likely caught as bycatch (Nulk, 1978). Alternatively, gillnets have the largest mesh size of the gear types studied (5.9 inches +/- 1.6 standard deviation) and are typically designed to catch larger species (He, 2006). As a result, they generally caught a larger proportion of large-sized fish compared to other gear types and, as a result, discarded larger fish overall. On the other hand, trawls generally retained the second-largest fish with a median TL of 40 cm, while discarding the smallest fish with a median TL of 19 cm. The large range of sizes of fish caught by trawl gear reflects the fact that trawl gear is designed to target a mix of species of varying sizes, which often occupy the same habitat type (Roda et al., 2019). The length distributions of fish sampled by fish pots and commercial rod and reel did not significantly differ. Unlike trawl, gillnet, and lobster-crab traps, commercial rod and reel and fish pot length distributions were distinctly bi-modal, with peaks occurring at similar length frequencies. This is likely because these gear types are often used to target similar bottom-dwelling fish species such as black sea bass or scup (Stenotomus chrysops).
Over time, the northern black sea bass stock assessment has evaluated and, if necessary, altered its methodology to best estimate population and fishery trends, selecting for a single-fleet or multi-fleet approach based on available data and limitations (Northeast Fisheries Science Center [NEFSC], 2017, 2023). Given the differences in gear design and size of black sea bass caught, discarded, and landed among gear types, our study’s results support the stock assessment’s current approach of accounting for gear type within assessment models. While it is beyond the scope of this study due to the opportunistic nature of data collection, future investigations that systematically utilize a variety of configurations and mesh sizes for different fishing gears to create gear-specific selectivity curves may shed more light on how the selective properties of different gears influence catch-at-age models and could be used to inform management practices that minimize discards. These results also highlight the importance of increasing the sample size of under-sampled non-trawl gear types to provide future opportunities for developing more detailed population models as well as the importance of including discard data from a wide range of gear types within stock assessments. Discard composition data is critical to understanding fisheries stocks, as it is used to inform and develop sustainable regulatory practices. As previously mentioned, the most recent black sea bass stock assessment utilized some of the same Research Fleet discard data included in this study to improve gear-specific discards-at-length estimates, which demonstrates that the inclusion of gear-specific discard data can aid in developing more accurate and reliable assessments (Northeast Fisheries Science Center [NEFSC], 2023; Suuronen and Gilman, 2020).
Nearly a third of fish discarded were larger than the federal commercial minimum legal size. While the Research Fleet’s data collection methods do not allow us to ascertain why participants discarded legal-size and marketable catch, feedback from participants emphasized a discrepancy between state-allocated quota and the abundance of black sea bass available to be caught. At the beginning of the Research Fleet in 2016, states’ allocations of commercial black sea bass quotas were still reflective of historical landing calculations through 2001. As described previously, updated state allocations were adopted in 2022 to account for changes in black sea bass biomass distribution, which resulted in increased quota percentages for Rhode Island and New Jersey, where Research Fleet vessels land black sea bass (Atlantic States Marine Fisheries Commission [ASMFC], 2021; Heimann et al., 2023). Such circumstances could lead to practices such as regulatory discarding or purposefully discarding legal size, but less valuable fish, to allow for the opportunity to potentially land larger and more valuable individuals without exceeding the allotted quota. Further, it is possible that the market for black sea bass has not kept up with increasing quotas, therefore potentially contributing to the need to discard legal sized fish. Continued sampling by the Research Fleet could be leveraged to evaluate the impact of quota regulation changes on black sea bass size composition over time, especially for discarded fish. These trends could assist in determining if revised state quota allocations have been beneficial in reducing the number of legal-sized discards, which lends to the value of the Research Fleet’s long and continued time series. In addition, future social science research could aim to understand the factors underlying fishermen’s decisions when discarding legal sized catch. Results from such studies could help further inform management decisions, such as updated quota allocations, minimum size thresholds, or gear specifications, to reduce legal-sized discards and improve fishery efficiency. In the current study, while we did observe interannual variation in the size of black sea bass caught, discarded, and landed, there were no apparent positive or negative linear trends. Within the study’s timeframe, there was some evidence of multiple year-classes moving through time, and interannual variation in fish size is expected, as changes in population structure and year-class strength vary over time due to fluctuating environmental conditions and fishing pressures (Thayer et al., 2021; Tu et al., 2018). In addition, the lack of distinct temporal trends could result from insufficient temporal resolution or statistical power to detect such trends, or could simply reflect a relatively stable stock and fishery. Furthermore, potential data noise and poor fit to the predicted trend lines (<10% deviance explained in many cases) may suggest other unmodeled covariates, such as fishery or environmental factors, spatial information, or recruitment and year class strength, should be considered as potential predictors of changes in black sea bass size composition to improve the explanatory power of the models. Further investigation would be beneficial to determine the drivers behind interannual variation in black sea bass size composition. Overall, a longer time series is needed to properly track size cohorts as well as uncover potential population trends, including further investigation to reveal more distinct and gear-specific trends in black sea bass size composition over time.
Long time series composed of consistent and adequate sampling are critical to identifying changes in a stock as well as making well-founded management decisions (Schijns and Pauly, 2021). Many fisheries stock assessments are highly dependent on long-running surveys that provide a continuous time series to characterize stock status, such as the NEFSC and NEAMAP trawl surveys, which are used in the northern black sea bass stock assessment and provide over 60 years of data used to develop population models (Atlantic States Marine Fisheries Commission [ASMFC], 2024; Northeast Fisheries Science Center [NEFSC], 2023). As described, black sea bass has undergone a rapid range expansion northward, becoming more abundant in regions such as southern New England and the Gulf of Maine, leading to significant data gaps, short time series for biological, catch, and discard data in this region, and the larger challenge of making management decisions that match the rate of the biomass distribution shift (McMahan et al., 2020). While the timeframe reflected in this study was likely too short to capture changes in black sea bass size composition, the results nonetheless highlight the importance of continuing to track changes in black sea bass size to fill data gaps and create longer time series to ensure the continued sustainable management of the stock.
The Black Sea Bass Research Fleet provides a cost-effective approach for rapidly collecting large amounts of vetted data through the regular commercial fishing activities of fishermen (Heimann et al., 2023; Verkamp et al., 2023). The results of the study highlight the value of this approach to address data gaps for use in stock assessments while also engaging members of the fishing community. In this study, we leveraged the Research Fleet’s sampling efforts to discern significant differences in black sea bass size composition amongst different gear types and dispositions over time. Our results highlight the selective nature of fishing gear as well as the benefit of including information on fishing discards and long time series in stock assessment analyses, which may help contribute to more effective downstream management of a stock through more specific population models.
It is important to acknowledge that the data collected by Research Fleet participants is non-random and opportunistic. Fishery-dependent data sources, such as the Research Fleet, result in inherent spatial and temporal sampling biases, as fishermen target areas where they believe they will catch a certain species within a designated timeframe (Howard et al., 2023). In addition, due to the location of the project (Rhode Island) there is considerable sampling coverage in and around Rhode Island state waters and southern New England, while data is comparatively more limited within the Mid-Atlantic region (Figure 1). While this unevenness is certainly a limitation of the current study, the Research Fleet data were previously found to be comparable to NOAA Observer data, and we therefore conclude that despite the spatial biases, the data are representative of the black sea bass fleet at large (Verkamp et al., 2023). In the future, expanding the Research Fleet to more evenly sample different regions will ensure the data are even more representative of the fleet and will allow for the investigation of potential spatial trends in the size composition of black sea bass in different fisheries. Another limitation of the current study is that the Research Fleet dataset represents a relatively short time series compared to many state and federal data sources, which likely influenced our ability to detect changes in size composition over time. The Research Fleet is currently on track to continue sampling until at least 2030, and we anticipate this longer time series will allow a much more thorough and statistically powerful evaluation of gear-specific temporal trends in black sea bass size compositions.
Despite these limitations, the benefits of fishery-dependent data sources, such as the Research Fleet, include cost-effective, increased year-round sampling coverage and the ability to simultaneously collect data from multiple gear types that interact with the species. Considering stock assessment data sources are limited by available funding and time, the Research Fleet is a valuable resource that can be leveraged to bolster current black sea bass datasets with continued sampling over time (Howard et al., 2023; Pennino et al., 2016). The Research Fleet has improved and will continue to improve stock assessment models by contributing discards-at-length data (Verkamp et al., 2023). Given the differences found in black sea bass size composition among gear types, a future study may aim to develop gear-specific size-selectivity curves to further investigate the mechanisms behind these trends, or by exploring methods to enable catch and effort data collection to develop gear-specific commercial catch-per-unit-effort indices. In addition, ongoing and future efforts by the Commercial Fisheries Research Foundation to increase the usefulness of the Research Fleet to assessment and management include expanding the number of participants for increased spatial coverage, particularly within the Gulf of Maine and Mid-Atlantic regions, and validating and collecting additional data parameters, such as the market category designations of landed fish (Northeast Fisheries Science Center [NEFSC], 2023).
Statements
Data availability statement
Data from this study are available through the Atlantic Coastal Cooperative Statistics Program Data Warehouse (https://www.accsp.org/). Specific data requests can be made to the corresponding author.
Ethics statement
Ethical approval was not required for the study involving animals in accordance with the local legislation and institutional requirements because the CFRF is an independent organization. Data were collected on fish that were caught under commercial fishing licenses.
Author contributions
HV: Conceptualization, Data curation, Formal analysis, Investigation, Methodology, Project administration, Visualization, Writing – original draft, Writing – review & editing. ES: Data curation, Formal analysis, Methodology, Visualization, Writing – original draft. NB: Conceptualization, Funding acquisition, Investigation, Methodology, Project administration, Supervision, Writing – review & editing.
Funding
The author(s) declare that financial support was received for the research and/or publication of this article. This study was funded by the Atlantic Coastal Cooperative Statistics Program (NOAA Award Numbers #NA16NMF4740182 and #NA20NMF4740181).
Acknowledgments
We thank Anna Mercer, Jason McNamee, and Thomas Heimann for securing funding to establish the Black Sea Bass Research Fleet and their invaluable early work on this project. We are also deeply grateful to the Research Fleet participant captains and their crew members who collected data for this study.
Conflict of interest
The authors declare that the research was conducted in the absence of any commercial or financial relationships that could be construed as a potential conflict of interest.
Generative AI statement
The author(s) declare that no Generative AI was used in the creation of this manuscript.
Publisher’s note
All claims expressed in this article are solely those of the authors and do not necessarily represent those of their affiliated organizations, or those of the publisher, the editors and the reviewers. Any product that may be evaluated in this article, or claim that may be made by its manufacturer, is not guaranteed or endorsed by the publisher.
Supplementary material
The Supplementary Material for this article can be found online at: https://www.frontiersin.org/articles/10.3389/fmars.2025.1591225/full#supplementary-material
References
1
Atlantic States Marine Fisheries Commission [ASMFC] (2021). Addendum XXXIII to the summer flounder, scup, and black sea bass fishery management plan, black sea bass commercial allocation. Available online at: https://asmfc.org/wp-content/uploads/2025/01/BSB_AddendumXXXIII_Revised_Aug_2021.pdf (Accessed 4 March 2025).
2
Atlantic States Marine Fisheries Commission [ASMFC] (2024). The Northeast Area Monitoring and Assessment Program (NEAMAP) principles. Available online at: https://asmfc.org/wp-content/uploads/2025/01/NEAMAP_Principles_2024.pdf (Accessed 4 March 2025).
3
Bell R. J. Richardson D. E. Hare J. A. Lynch P. D. Fratantoni P. S. (2015). Disentangling the effects of climate, abundance, and size on the distribution of marine fish: an example based on four stocks from the Northeast US shelf. ICES J. Mar. Sci.72, 1311–1322. doi: 10.1093/icesjms/fsu217
4
Bellido J. M. Santos M. B. Pennino M. G. Valeiras X. Pierce G. J. (2011). Fishery discards and bycatch: solutions for an ecosystem approach to fisheries management? Hydrobiologia670, 317–333. doi: 10.1007/s10750-011-0721-5
5
Bethoney N. D. Stokesbury K. D. E. (2019). Implications of extremely high recruitment: crowding and reduced growth within spatial closures. Mar. Ecol. Prog. Ser.611, 157–165. doi: 10.3354/meps12873
6
Bethoney N. D. Stokesbury K. D. Schondelmeier B. P. Hoffman W. S. Armstrong M. P. (2014). Characterization of river herring bycatch in the northwest Atlantic midwater trawl fisheries. N. Am. J. Fish. Manage.34, 828–838. doi: 10.1080/02755947.2014.920736
7
Bradley D. Merrifield M. Miller K. M. Lomonico S. Wilson J. R. Gleason M. G. (2019). Opportunities to improve fisheries management through innovative technology and advanced data systems. Fish. Fish.20, 564–583. doi: 10.1111/faf.12361
8
Curti K. Truesdell S. Jones A. (2023). Black Sea Bass Commercial Catch. 2023 Black Sea Bass Research Track Stock Assessment Working Paper. (NEFSC, Woods Hole, MA). Available at: https://apps-nefsc.fisheries.noaa.gov/saw/sasi.php (Accessed March 6, 2025).
9
Fabrizio M. C. Manderson J. P. Pessutti J. P. (2013). Habitat associations and dispersal of black sea bass from a mid-Atlantic Bight reef. Mar. Ecol. Prog. Ser.482, 241–253. doi: 10.3354/meps10302
10
He P. (2006). Gillnets: Gear design, fishing performance and conservation challenges. Mar. Technol. Soc J.40, 12–19. doi: 10.4031/002533206787353187
11
Heimann T. Verkamp H. McNamee J. Bethoney N. D. (2023). Mobilizing the fishing industry to address data gaps created by shifting species distribution. Front. Mar. Sci.10. doi: 10.3389/fmars.2023.1043676
12
Howard R. A. Ciannelli L. Wakefield W. W. Haltuch M. A. (2023). Comparing fishery-independent and fishery-dependent data for analysis of the distributions of Oregon shelf groundfishes. Fish. Res.258, 106553. doi: 10.1016/j.fishres.2022.106553
13
Huntsman G. R. (1976). Offshore headboat fishing in North Carolina and South Carolina. Mar. Fish. Rev.38, 13–23.
14
Low R. A. Jr. (1981). Mortality rates and management strategies for black sea bass off the southeast coast of the United States. N. Am. J. Fish. Manage.1, 93–103. doi: 10.1577/1548-8659(1981)1<93:MRAMSF>2.0.CO;2
15
McMahan M. D. Sherwood G. D. Grabowski J. H. (2020). Geographic variation in life-history traits of black sea bass (Centropristis striata) during a rapid range expansion. Front. Mar. Sci.7. doi: 10.3389/fmars.2020.567758
16
Mercer L. P. (1978). The reproductive biology and population dynamics of black sea bass, Centropristis striata (Williamsburg (VA: Coll. William and Mary).
17
Mercer L. P. (1989). Species profiles: life histories and environmental requirements of coastal fisheries and invertebrates (south Atlantic): black sea bass. U.S. Fish. Wildl. Serv. Biol. Rep.82, 16. Available at: https://sedarweb.org/documents/s25rd15-species-profiles-life-histories-and-environmental-requirements-of-coastal-fishes-and-invertebrates-south-atlantic-black-sea-bass/ (Accessed November 25, 2024).
18
Mercer A. M. Ellertson A. Spencer D. Heimann T. (2018). Fishers fill data gaps for American lobster (Homarus americanus) and Jonah crab (Cancer borealis) in the northeast USA. Bull. Mar. Sci.94, 1121–1135. doi: 10.5343/bms.2017.1105
19
Miller R. J. (1959). A review of the seabasses of the genus Centropristis (Serranidae). Tulane Stud. Zool.7, 35–68.
20
Miller T. Muller R. O’Boyle B. Rosenberg A. (2009). Report by the Peer Review Panel for the Northeast Data Poor Stocks Working Group. US Department of Commerce, Northeast Fisheries Science Center Reference Document (Woods Hole, MA: National Marine Fisheries Service).
21
Nelson G. A. (2014). Cluster sampling: a pervasive, yet little recognized survey design in fisheries research. Trans. Am. Fish. Soc143, 926–938. doi: 10.1080/00028487.2014.901252
22
Neumann R. M. Allen M. S. (2007). “Size structure,” in Analysis and Interpretation of Freshwater Fisheries Data. Eds. GuyC. S.BrownM. L. (American Fisheries Society, Bethesda, MD), 375–421.
23
Northeast Fisheries Science Center [NEFSC] (2017). 62nd Northeast Regional Stock Assessment Workshop (62nd SAW) Assessment Report. US Department of Commerce, Northeast Fisheries Science Center Reference Document (Woods Hole, MA: National Marine Fisheries Service). doi: 10.7289/V5/RD-NEFSC-17-03
24
Northeast Fisheries Science Center [NEFSC] (2023). Report of the Black Sea Bass (Centropristis striata) Research Track Stock Assessment Working Group. US Department of Commerce, Northeast Fisheries Science Center Reference Document (Woods Hole, MA: National Marine Fisheries Service). Available online at: https://apps-nefsc.fisheries.noaa.gov/saw/sasi_files.php?year=2023&species_id=33&stock_id=6&review_type_id=5&info_type_id=-1&map_type_id=&filename=2023_BSB_UNIT_RTWG_Report_V2_12_2_2023.pdf.
25
Nulk V. E. (1978). The effects of different escape vents on the selectivity of lobster traps. Mar. Fish. Rev.40, 50–58. Available at: https://spo.nmfs.noaa.gov/sites/default/files/pdf-content/MFR/mfr405-6/mfr405-64.pdf (Accessed March 5, 2025).
26
Pennino M. G. Conesa D. López-Quílez A. Munoz F. Fernández A. Bellido J. M. (2016). Fishery-dependent and-independent data lead to consistent estimations of essential habitats. ICES J. Mar. Sci.73, 2302–2310. doi: 10.1093/icesjms/fsw062
27
R Core Team (2024). A Language and Environment for Statistical Computing (Vienna: R Foundation for Statistical Computing).
28
Roda P. Gilman E. Huntington T. Kennelly S. J. Suuronen P. Chaloupka M. et al . (2019). A Third Assessment of Global Marine Fisheries Discards (Rome, ITL: FAO). Available online at: http://www.fao.org/3/CA2905EN/ca2905en.pdf.
29
Sathianandan T. V. (2017). “Gear selectivity,” in Course Manual Summer School on Advanced Methods for Fish Stock Assessment and Fisheries Management, Lecture Note Series No. 2/2017 (CMFRI, Kochi), 258–261. Available at: http://eprints.cmfri.org.in/id/eprint/12185.
30
Schijns R. Pauly D. (2021). Management implications of shifting baselines in fish stock assessments. Fish. Manage. Ecol.29, 183–195. doi: 10.1111/fme.12511
31
Sedberry G. R. (1988). Food and feeding of black sea bass, Centropristis striata, in live bottom habitats in the South Atlantic Bight. J. Elisha Mitchell Sci. Soc.104, 35–50. Available at: https://www.jstor.org/stable/24333362 (Accessed November 25, 2024).
32
Simpson G. L. (2022). Graceful ‘ggplot’-Based Graphics and Other Functions for GAMs Fitted Using “mgcv”. R package version 0.7, 2. doi: 10.32614/CRAN.package.gratia
33
Suuronen P. Gilman E. (2020). Monitoring and managing fisheries discards: New technologies and approaches. Mar. Policy116, 103554. doi: 10.1016/j.marpol.2019.103554
34
Thayer J. A. Burr Z. Field J. C. Carle R. D. Warzybok P. (2021). Inter-annual variability in forage fish population size structure: Comparison of selectivity of traditional vs. non-traditional sampling devices. Fish. Res.234, 105801. doi: 10.1016/j.fishres.2020.105801
35
Tu C.-Y. Chen K.-T. Hsieh C.-h. (2018). Fishing and temperature effects on the size structure of exploited fish stocks. Sci. Rep.8, 7132. doi: 10.1038/s41598-018-25403-x
36
Verkamp H. Heimann T. McNamee J. Jones A. Bethoney N. D. (2023). An overview of the Commercial Fisheries Research Foundation and Rhode Island Department of Environmental Management Black Sea Bass Research Fleet. 2023 Black Sea Bass Research Track Stock Assessment Working Paper. Available online at: https://apps-nefsc.fisheries.noaa.gov/saw/sasi.php (Accessed 6 March 2025).
37
Wood S. N. (2011). Fast stable restricted maximum likelihood and marginal likelihood estimation of semiparametric generalized linear models. J. R. Stat. Soc Seri. B.73, 3–36. doi: 10.1111/j.1467-9868.2010.00749.x
38
Wood S. N. (2017). Generalized Additive Models: An Introduction with R. 2nd ed. (Boca Raton, FL: CRC Press).
Appendices
Appendix 1
| Gear type | |||||
|---|---|---|---|---|---|
| Trawl | Gillnet | Commercial rod & reel | Lobster-crab traps | Fish pots | |
| Effort Parameters Recorded | Mesh Size (inches) | Number of Net Panels Per String | Time Spent Fishing (hours) | Soak Time (days) | Soak Time (hours) |
| Tow Time (hours.decimal) | Length of Net Panels (feet) | Number of Rods Fished | Number of Traps | Number of Traps | |
| Sweep Length (feet) |
Mesh Size (inches) | Number of Hooks Used | Escape Vent Size (inches) | Escape Vent Size (inches) | |
| Soak Time (days) | Escape Vent Shape | Entrance Size (inches) | |||
| Net Height (feet) | |||||
| Tie Downs (inches) | |||||
Gear-specific effort parameters recorded as part of the Black Sea Bass Research Fleet at-sea data collection.
Appendix 2
| Gear type | Action | Generalized additive model p-value | Deviance explained (%) |
|---|---|---|---|
| Lobster-Crab Traps | Overall | p < 0.001 | 5.31% |
| Discarded | p < 0.001 | 5.42% | |
| Retained | p < 0.001 | 2.25% | |
| Trawl | Overall | p < 0.001 | 11.6% |
| Discarded | p < 0.001 | 8.69% | |
| Retained | p < 0.001 | 24.5% | |
| Fish Pots | Overall | p < 0.001 | 6.26% |
| Discarded | p < 0.001 | 24% | |
| Retained | p < 0.001 | 1.54% |
Results from generalized additive models evaluating the differences in black sea bass size over time for all fish combined, discarded fish, and retained fish sampled by each gear type.
Summary
Keywords
black sea bass, fishery-dependent data, stock assessment, discards, size composition
Citation
Verkamp HJ, Soranno EA and Bethoney ND (2025) Characterizing the composition of commercial black sea bass (Centropristis striata) catch and discards in the Mid-Atlantic and southern New England regions. Front. Mar. Sci. 12:1591225. doi: 10.3389/fmars.2025.1591225
Received
10 March 2025
Accepted
16 June 2025
Published
08 July 2025
Volume
12 - 2025
Edited by
Howard Townsend, National Marine Fisheries Service (NOAA), United States
Reviewed by
Taner Yildiz, Istanbul University, Türkiye
Xu Youwei, Chinese Academy of Fishery Sciences (CAFS), China
Updates
Copyright
© 2025 Verkamp, Soranno and Bethoney.
This is an open-access article distributed under the terms of the Creative Commons Attribution License (CC BY). The use, distribution or reproduction in other forums is permitted, provided the original author(s) and the copyright owner(s) are credited and that the original publication in this journal is cited, in accordance with accepted academic practice. No use, distribution or reproduction is permitted which does not comply with these terms.
*Correspondence: Hannah J. Verkamp, hverkamp@cfrfoundation.org
Disclaimer
All claims expressed in this article are solely those of the authors and do not necessarily represent those of their affiliated organizations, or those of the publisher, the editors and the reviewers. Any product that may be evaluated in this article or claim that may be made by its manufacturer is not guaranteed or endorsed by the publisher.