Abstract
Extracting tidal constituents in coastal regions remains a major challenge due to complex bathymetry, nonlinear shallow-water effects, and land contamination in satellite altimetry measurements. While tide gauges provide high-precision tidal observations, their sparse spatial coverage limits their utility for global coastal studies. Global tidal models, though improved by data assimilation, often suffer from reduced accuracy in coastal zones due to limited spatial resolution and insufficient nearshore constraints. To address these limitations, we utilize the newly released International Altimetry Service 2024 (IAS2024) dataset, which is derived from reprocessed Jason-1/2/3 satellite altimetry data covering the period 2002–2022. We extract ten primary tidal constituents (Q1, O1, P1, K1, N2, M2, S2, K2, Sa, and Ssa) in global coastal waters using this dataset. The accuracy of IAS2024 tidal extractions is assessed through comparative analysis with four state-of-the-art global tidal models (DTU16, EOT20, FES2014, and FES2022) and 164 tide gauge records. IAS2024 achieves accuracy levels comparable to EOT20 and superior to FES2014 and FES2022, with performance closely matching that of DTU16. For the eight major tidal constituents, the root sum square error of IAS2024 is 11.26 cm, aligning closely with DTU16 (11.23 cm), EOT20 (11.68 cm), and FES2022 (11.26 cm). Relative errors against tide gauge records are 14.16% (O1), 16.6% (M2), 15.4% (K1), and 17.7% (S2), demonstrating competitive accuracy. Notably, IAS2024 significantly outperforms traditional models in resolving long-period constituents, with amplitude correlation coefficients of 0.924 for Sa and 0.701 for Ssa, markedly surpassing EOT20 and FES2022. IAS2024 shows strong performance within 10 km of the coast—where conventional altimetry is often unreliable—highlighting its potential for coastal applications. Its enhanced ability to resolve long-period tidal variations makes it particularly valuable for coastal sea level research, tidal energy assessments, and hydrodynamic modeling. These findings underscore the strengths of IAS2024 in nearshore tidal extraction and its importance as a dataset for advancing both global and regional tidal studies.
1 Introduction
Coastal regions are vital hubs of human activity, playing essential roles in economic development, social well-being, and ecological sustainability. An accurate understanding of coastal tidal characteristics is crucial for coastal management, port operations, and disaster prevention and mitigation. With the advancement of satellite altimetry technology—particularly the availability of long-term observations from the TOPEX/Poseidon (T/P) and Jason series satellite—continuous sea surface height measurements have provided valuable datasets for coastal tidal research (Piccioni et al., 2018; Seifi and Filmer, 2023; Shum et al., 1997). However, despite these advancements, accurately extracting tidal constituents from satellite altimetry data in coastal regions remains a significant challenge due to complex bathymetry, nonlinear shallow-water effects, and land contamination (Ray et al., 2011; Guarneri et al., 2023). Refining the precision of tidal constituent retrieval from satellite observations remains a key research priority, as it essential for improving global and regional tidal modeling, coastal sea level studies, and oceanographic applications.
As a traditional method for measuring sea level, tide gauge observations offer high temporal resolution and long-term records, making them one of the most direct and reliable sources of tidal information. However, the sparse spatial distribution of tide gauges limits their ability to provide comprehensive monitoring and analysis of global tidal variations (Bij de Vaate et al., 2022). To address this limitation, the continuous development of tidal models has played a crucial role in both retrieving tidal information and predicting its spatial distribution (Egbert and Erofeeva, 2002; Ray, 1999). By refining the governing fluid dynamic equations and the expanding the number of tidal constituents included, those models have become essential tools for studying large-scale oceanic tidal variations.
Nevertheless, significant challenges remain. Hydrodynamic models, such as the Finite Element Solution (FES) and TPXO series, rely on high-accuracy bathymetry and coastline data, making it difficult to improve their accuracy in nearshore regions where these datasets are often less precise. Conversely, empirical models, such as the Empirical Ocean Tide (EOT) and Technical University of Denmark (DTU) series, achieve high accuracy in regions with dense tidal observations by assimilating satellite altimetry and tide gauge data. However, their precision declined in data-sparse areas, and their reliability is highly dependent on the quality of the assimilated tide gauge and satellite-derived sea level data. In particular, within 10 km of the coast, the accuracy of existing tidal models is significantly constrained by the inherent limitations of satellite altimetry, making this a critical technological bottleneck in current tidal research (Gommenginger et al., 2011; Vignudelli et al., 2019).
Moreover, most contemporary tidal models focus on enhancing the resolution and accuracy of short-period tidal constituents, while long-period tidal constituents remain largely underrepresented. For instance, in the FES series model, the Sa and Ssa constituents are purely hydrodynamic simulations with near-zero amplitude, rendering them practically unusable (Xu et al., 2024). Additionally, the DTU model do not provide any estimates for long-period tidal constituents. This limitation poses significant challenges for applications such as the construction of marine depth datum surfaces and other oceanographic studies.
In coastal regions, satellite altimetry data face numerous challenges, including waveform distortion (Passaro et al., 2014), land interference (Gommenginger et al., 2011), and complex coastal environmental effects (Andersen and Piccioni, 2016), all of which complicate the extraction of tidal signals. Addressing these limitations is crucial for improving the accuracy of coastal tidal estimates and advancing research on long-period tidal constituents. Enhancing existing models and datasets is therefore of paramount importance. In recent years, significant advancements in satellite altimetry processing techniques have facilitated more reliable sea level retrievals in coastal regions. Improved waveform retracking methods now enable observations as close as 3 km from the coastline (Passaro et al., 2014). Additionally, the TOPEX/Jason series has accumulated over 30 years of continuous data, which, when integrated with complementary satellite systems on diverse orbits, has significantly improved the accuracy of tidal models (Hart-Davis et al., 2023). In coastal areas, innovative processing techniques, such as Fully Focused Synthetic Aperture Radar (Schlembach et al., 2023), have further refined the along-track resolution of satellite altimetry to the meter scale, offering unprecedented detail in coastal sea level measurements (Hart-Davis et al., 2024). To improve the accuracy of altimetry-derived tidal information within 10 km of the coastline, new datasets such as IAS2024 have emerged (Peng et al., 2024). Leveraging advanced waveform retracking algorithms and high-resolution reprocessing techniques, IAS2024 demonstrates significant potential for improving tidal constituent extraction in nearshore regions. These advancements underscore the critical role of continued innovation in data processing and model refinement in enhancing coastal tide studies and facilitating research on long-period tidal constituents.
Therefore, this study utilizes the IAS2024 dataset to conduct, for the first time, a comprehensive investigation into the extraction of tidal information in global nearshore regions, with a particular focus on assessing the dataset’s capability in resolving long-period tidal constituents in high-latitude areas. The paper is organized as follows: Section 2 outlines the data and methodology for deriving tidal information from satellite altimetry. Section 3 presents the evaluation of IAS2024 against tidal models and tide gauge observation, with a specific emphasis on long-period tidal constituents. Section 4 discusses the precision in high latitude areas, while Section 5 summarizes the key conclusions drawn from this research.
2 Data and methods
2.1 Satellite altimetry and tide gauge observations
The International Altimetry Service 2024 (IAS2024) dataset, as described by Peng et al. (2024; https://doi.org/10.5281/zenodo.13208305), represents a novel and high-precision resource for monitoring coastal sea level dynamics. This dataset addresses key limitations inherent in conventional coastal altimeter through the implementation of advanced reprocessing methodologies, particularly the Seamless Combination of Multiple Retrackers (SCMR) algorithm. The SCMR algorithm significantly improves waveform retracking in nearshore regions, where traditional altimetry data are often compromised by land contamination and complex sea surface conditions. By reanalyzing Jason-1/2/3 satellite altimeter records spanning January 2002 to April 2022, IAS2024 achieves substantial improvement in data availability and reliability within the 0–20 km coastal zone, outperforming previous datasets such as ESA CCI v2.3.
To further enhance the extraction of fine-scale coastal tidal features, IAS2024 incorporates virtual altimeter stations at three distinct coastal distance ranges: 0–10 km, 5–15 km, and 10–20 km from the shoreline. These stations facilitate the retrieval of tidal amplitudes and phases with minimal land-induced interference, thereby improving the resolution of nearshore tidal variability. Notably, IAS2024 observations reveal that, in most regions, there is no significant linear sea level trend gradient from offshore to the coastline, underscoring the dataset’s effectiveness in isolating tidal signals from long-term sea level trends. This study leverages the high-quality nearshore data and consistent spatiotemporal coverage of IAS2024 to extract and analyze oceanic tidal constituents from satellite altimetry in coastal waters.
For validation, tide gauge observations distributed along global coastlines serve as a critical reference for comparison with IAS2024-derived tidal constituents. These observations are obtained from TICON-3 (Hart-Davis et al., 2022), a dataset providing harmonic constants for 40 tidal constituents across 5,119 tide gauge stations on a quasi-global scale. As documented by Woodworth et al. (2016) and Haigh et al. (2023), the TICON-3 tidal estimates are derived from publicly available sea level records compiled by the Global Extreme Sea Level Analysis (GESLA) project. This dataset represents the most up-to-date and comprehensive collection of high-frequency tide gauge observations, integrating data from 33 international agencies. The harmonic analysis used to derive the tidal constants is based on GESLA-3 time series, ensuring robust data quality. Furthermore, all records undergo a rigorous screening process to exclude unreliable measurements, with only time series spanning at least one year being retained for analysis.
2.2 Tidal harmonic analysis and key metrics
The Jason series satellite provides critical sea surface height (SSH) anomaly data with a repeat cycle of approximately 9.9156 days. This temporal resolution introduces aliasing effects in tidal constituent analysis. For example, the dominant M2 tidal constituent is aliased to a period of 62.1 days, as determined by the Nyquist frequency. To accurately resolve closely spaced tidal constituents, such as Ssa (solar semiannual) and K1 (lunisolar diurnal), the Rayleigh criterion requires a minimum observational record length of 9.19 years to ensure complete spectral separation.
This study utilizes the IAS2024 dataset, derived from Jason-1/2/3 satellite altimetry records spanning January 2002 to April 2022. The dataset provides near-global SSH anomaly coverage (66°S–66°N) and includes essential geophysical corrections. Over this 20-year observation period, harmonic analysis was conducted following established methodologies (e.g., Pugh and Woodworth, 2014) to extract ten tidal constituents, including eight diurnal and semidiurnal tides (Q1, O1, P1, K1, N2, M2, S2, K2) and two long-period tides (Sa and Ssa). The extended temporal baseline ensures robust separation of these tidal constituents, even in coastal regions, where satellite altimetry data are often affected by land contamination and reduced spatiotemporal coverage.
To assess the accuracy of IAS2024-derived tidal constituents, we employ the Root Mean square (RMS) error to evaluate the precision of individual tidal constituents and the Root Sum Square (RSS) error to quantify the combined error of multiple tidal constituents. The RMS error is calculated using the Equation 1:
where N is the number of points used, H0and G0are amplitude and phase obtained from IAS2024. Similarly, Hmand Gmare the corresponding amplitude and phase provided by tide models or tide gauge observations for the same tidal constituent.
The RSS for the eight constituents was calculated by the Equation 2:
where M is the eight tidal constituents mentioned above. It is important to note that all phases in this study are referred to as Greenwich Meridian Time (GMT).
In addition to absolute error metrics, this study introduces Relative Error (RE) to quantify discrepancies between tide models, IAS2024-derived tidal constituents, and tide gauge observations. The RE metric effectively eliminates biases related to differences in dimensionality and magnitude, providing a standardized assessment of model accuracy across diverse tidal environments.
RE is defined as the ratio of the absolute error to the absolute value of the reference (true) value, expressed as Equation 3:
Where represents the true amplitude or phase lags derived from tide gauge observations, denotes the corresponding extracted or modeled value obtained from IAS2024 or tidal models. It is important to note that when the true value is zero, RE becomes undefined. To ensure meaningful accuracy assessments, a threshold criterion is applied—such as excluding values below 1 cm—to prevent misinterpretations caused by near-zero reference values.
Tidal phenomena exhibit significant spatial heterogeneity, with tidal ranges varying by several orders of magnitude between coastal and deep-sea regions. Relying solely on absolute error may lead to underestimation of errors in low-tide regions or overestimation in high-tide regions. RE provides a scale-independent metric, facilitating direct performance comparisons across different regions and tidal types. For instance, a 0.5-meter error corresponds to only 5% deviation in a region with a 10-meter tidal range but translates to 50% deviation in a region with a 1-meter tidal range. Such normalization enhances the ability to detect model weaknesses in specific tidal environments. Additionally, RE is particularly useful for assessing tidal phase lag accuracy. The physical impact of phase lag errors depends on the tidal period; for example, a ±10° deviation may have vastly different effects in semidiurnal versus diurnal tides. By converting phase errors into a percentage of the tidal period, RE provides a consistent, interpretable metric, minimizing misinterpretations arising from varying tidal cycle lengths.
By combining absolute error metrics with RE, this approach enables a more holistic evaluation of model performance, particularly in regions with complex coastal topography or mixed tidal regimes. The spatiotemporal adaptability and reliability of IAS2024 and other tidal models can thus be quantitatively assessed, providing deeper insights into their applicability for global and regional tidal studies.
3 Results
3.1 Evaluation with tidal models
The accuracy of tidal constituent extraction depends directly on the quality of SSH time series derived from satellite altimetry. The IAS2024 dataset provides SSH records for 460,388 along-track points within 100 km of the coastline, enabling high-resolution tidal analysis in coastal regions, where tidal dynamics exhibit strong spatial variability.
Figure 1a illustrates the spatial distribution of along-track SSH points relative to the coastline. Notably, 10.71% of points lie within 10 km of the coast, 62.77% fall within 50 km, ensuring robust nearshore coverage. This dense spatial distribution underscores the dataset’s capability to resolve fine-scale tidal features in coastal environments, addressing the limitations of traditional satellite altimetry datasets.
Figure 1
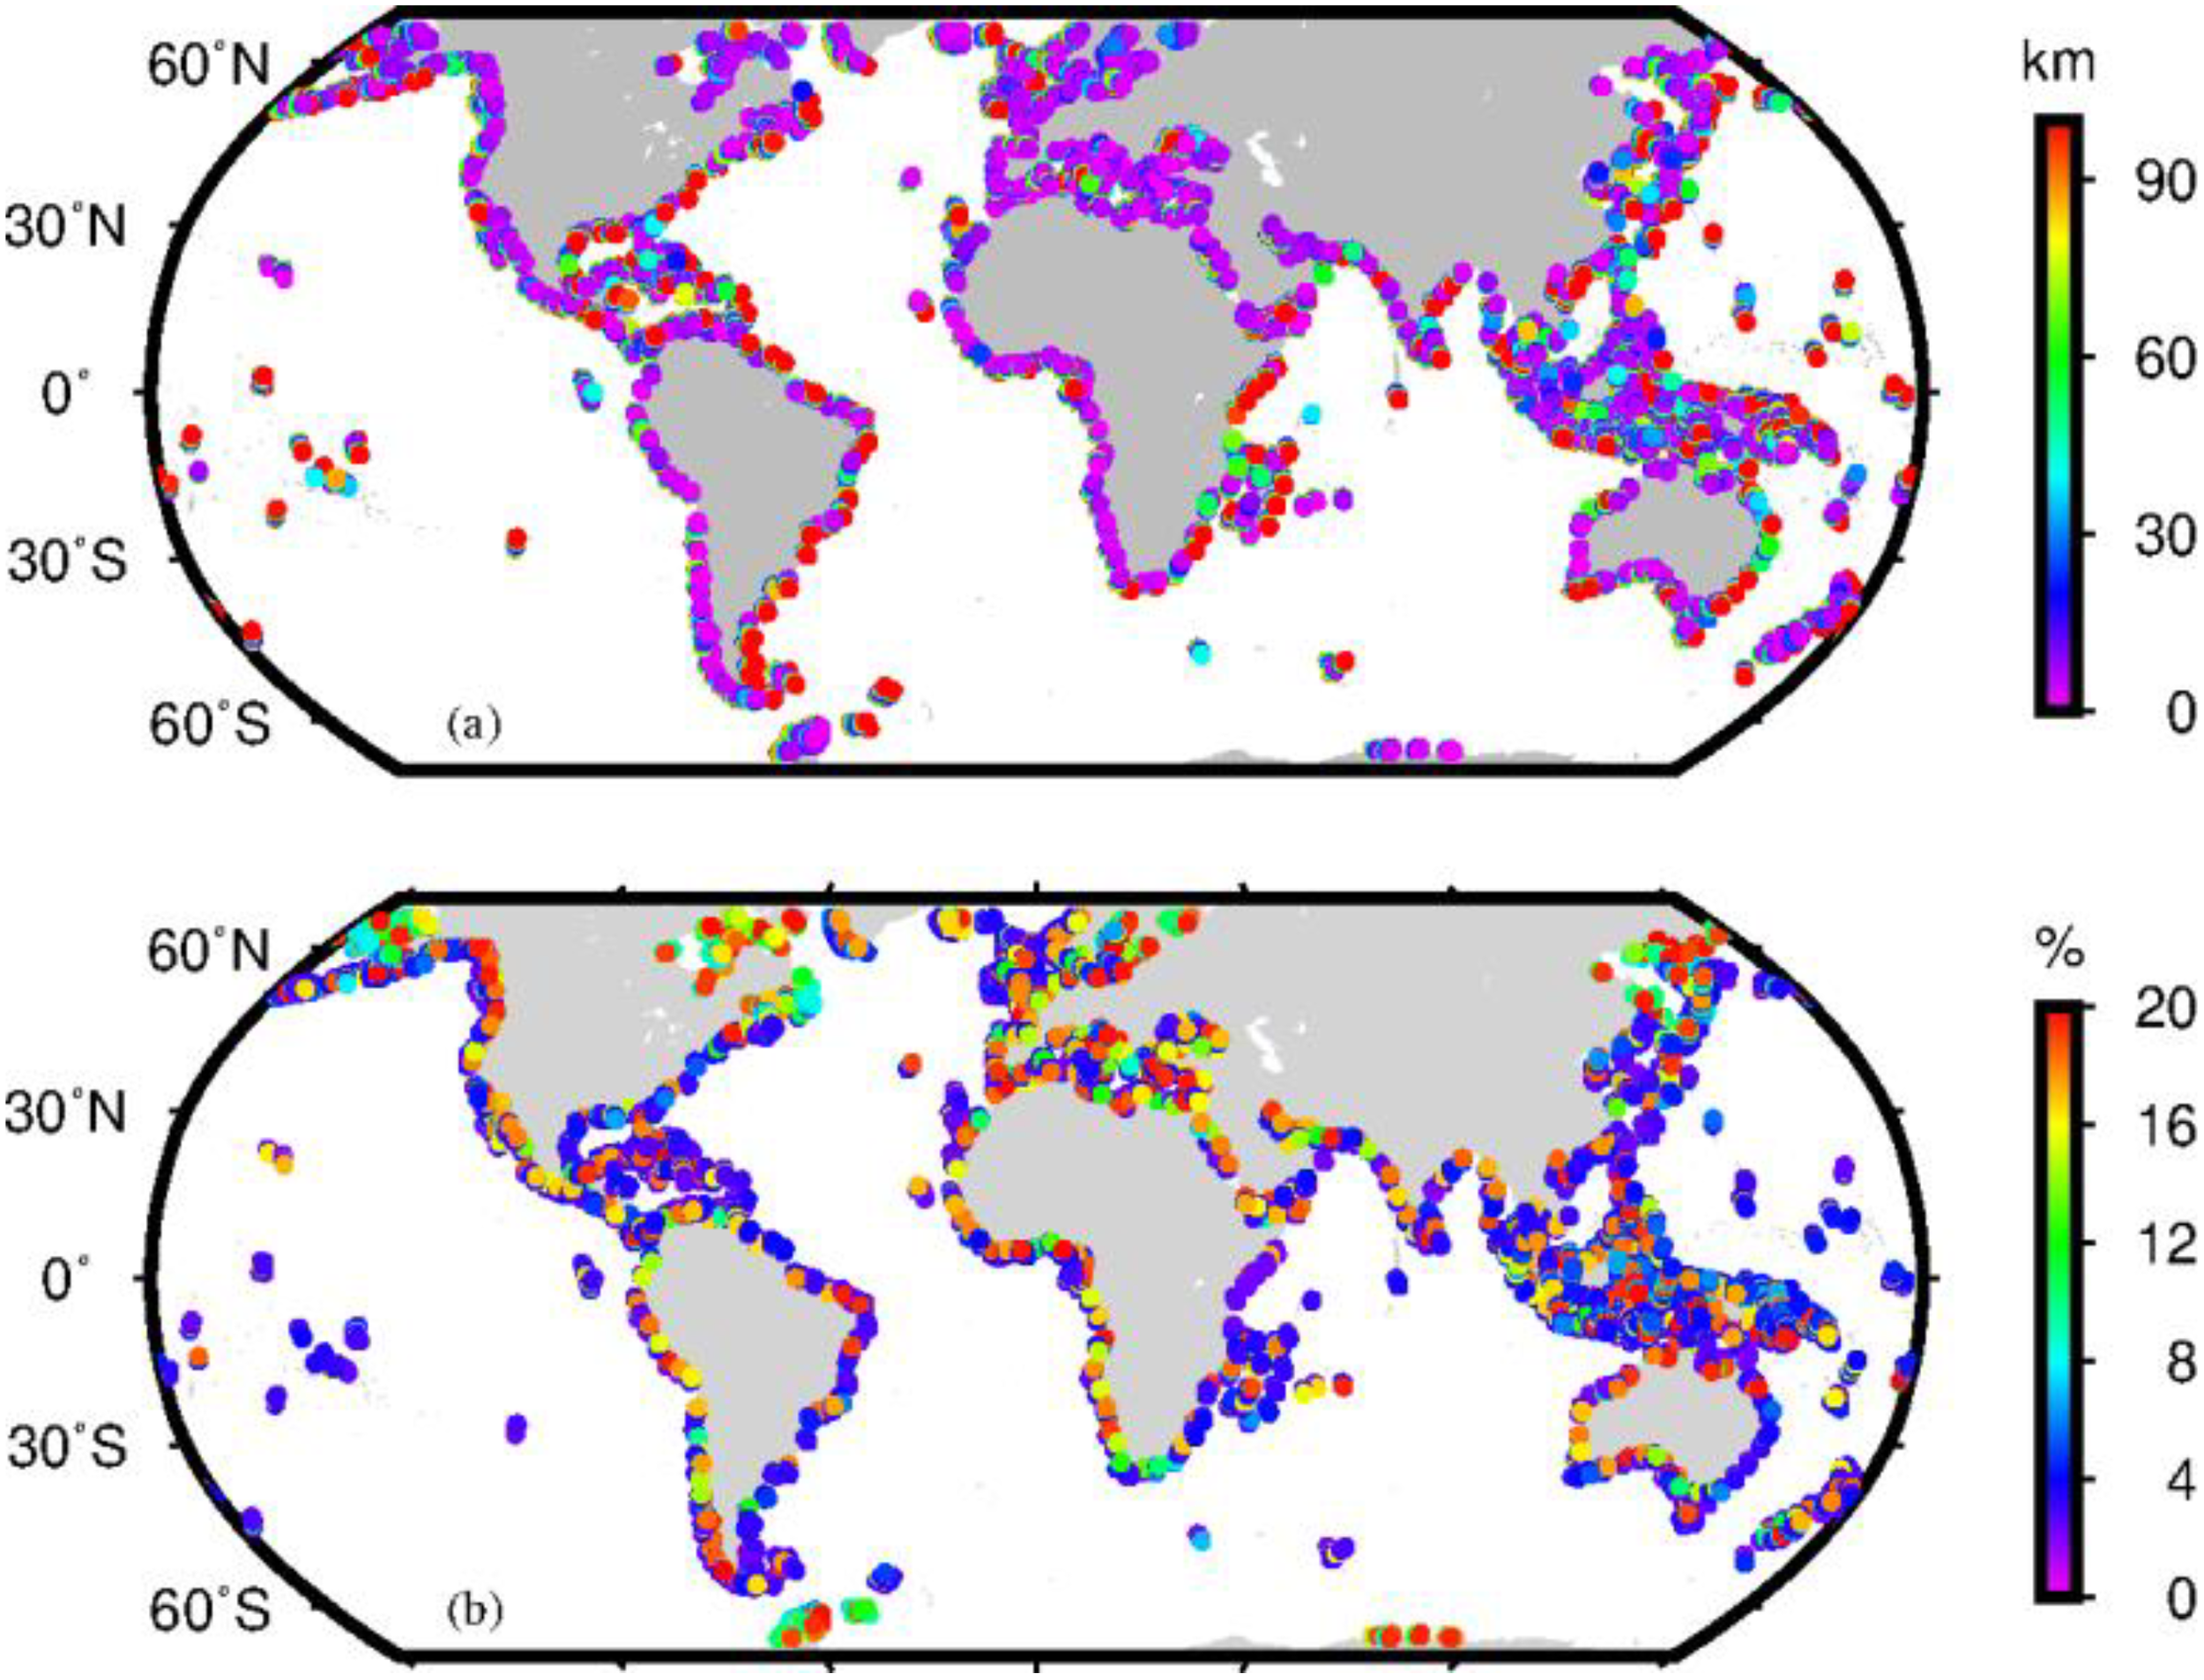
Distribution of (a) the distance between satellite altimetry along-track points and the coastline, and (b) the missing data rates at these points.
A continuous and reliable SSH time series is essential for accurate harmonic analysis. Figure 1b presents the distribution of missing data rates across along-track points: 92.83% of points exhibit<10% missing data, while 77.80% have rates below 5%. Even at 10 km from shore, 68.32% of points maintain missing data rates under 10%, demonstrating strong near-coastal performance. Although some locations experience missing data rates up to 20%, this equates to approximately 4 years of missing records over a 20-year period, leaving 16 years of continuous observations—sufficient to meet the Rayleigh criterion for extracting multi-constituent tidal information.
Despite increasing data gaps near shore due to land contamination and signal interference, the IAS2024 dataset maintains high data integrity in nearshore environments. The low missing data rates, even within 10 km of the coastline, make it well-suited for high-precision tidal studies, particularly in regions where traditional altimetry suffers from higher data loss. This robust dataset enhances the ability to capture complex coastal tidal dynamics, facilitating improved tidal modeling, forecasting, and long-period tidal studies.
To minimize errors introduced by data gaps, we applied a classical harmonic analysis method to the IAS2024 time series. The procedure involved:
-
Initial Harmonic Extraction – Computing the harmonic constants of major tidal constituents from the available data.
-
Predictive Gap Filling – Using these harmonic constants to estimate missing values and iteratively replacing data gaps with predicted values.
-
Convergence Check – Repeating the process until the harmonic constants stabilized, ensuring consistency and accuracy.
Through this approach, we extracted harmonic constants for eight major tidal constituents (Q1, O1, P1, K1, N2, M2, S2, K2) and two long-period constituents (Sa, Ssa) across global coastal regions. Figure 2 presents the spatial distribution of amplitudes and phase lags for two primary diurnal constituents (O1 and K1) and two principal semidiurnal constituents (M2 and S2). These visualizations highlight the regional variations in tidal dynamics and serve as a foundation for evaluating the performance of the IAS2024 dataset in resolving coastal tidal features.
Figure 2
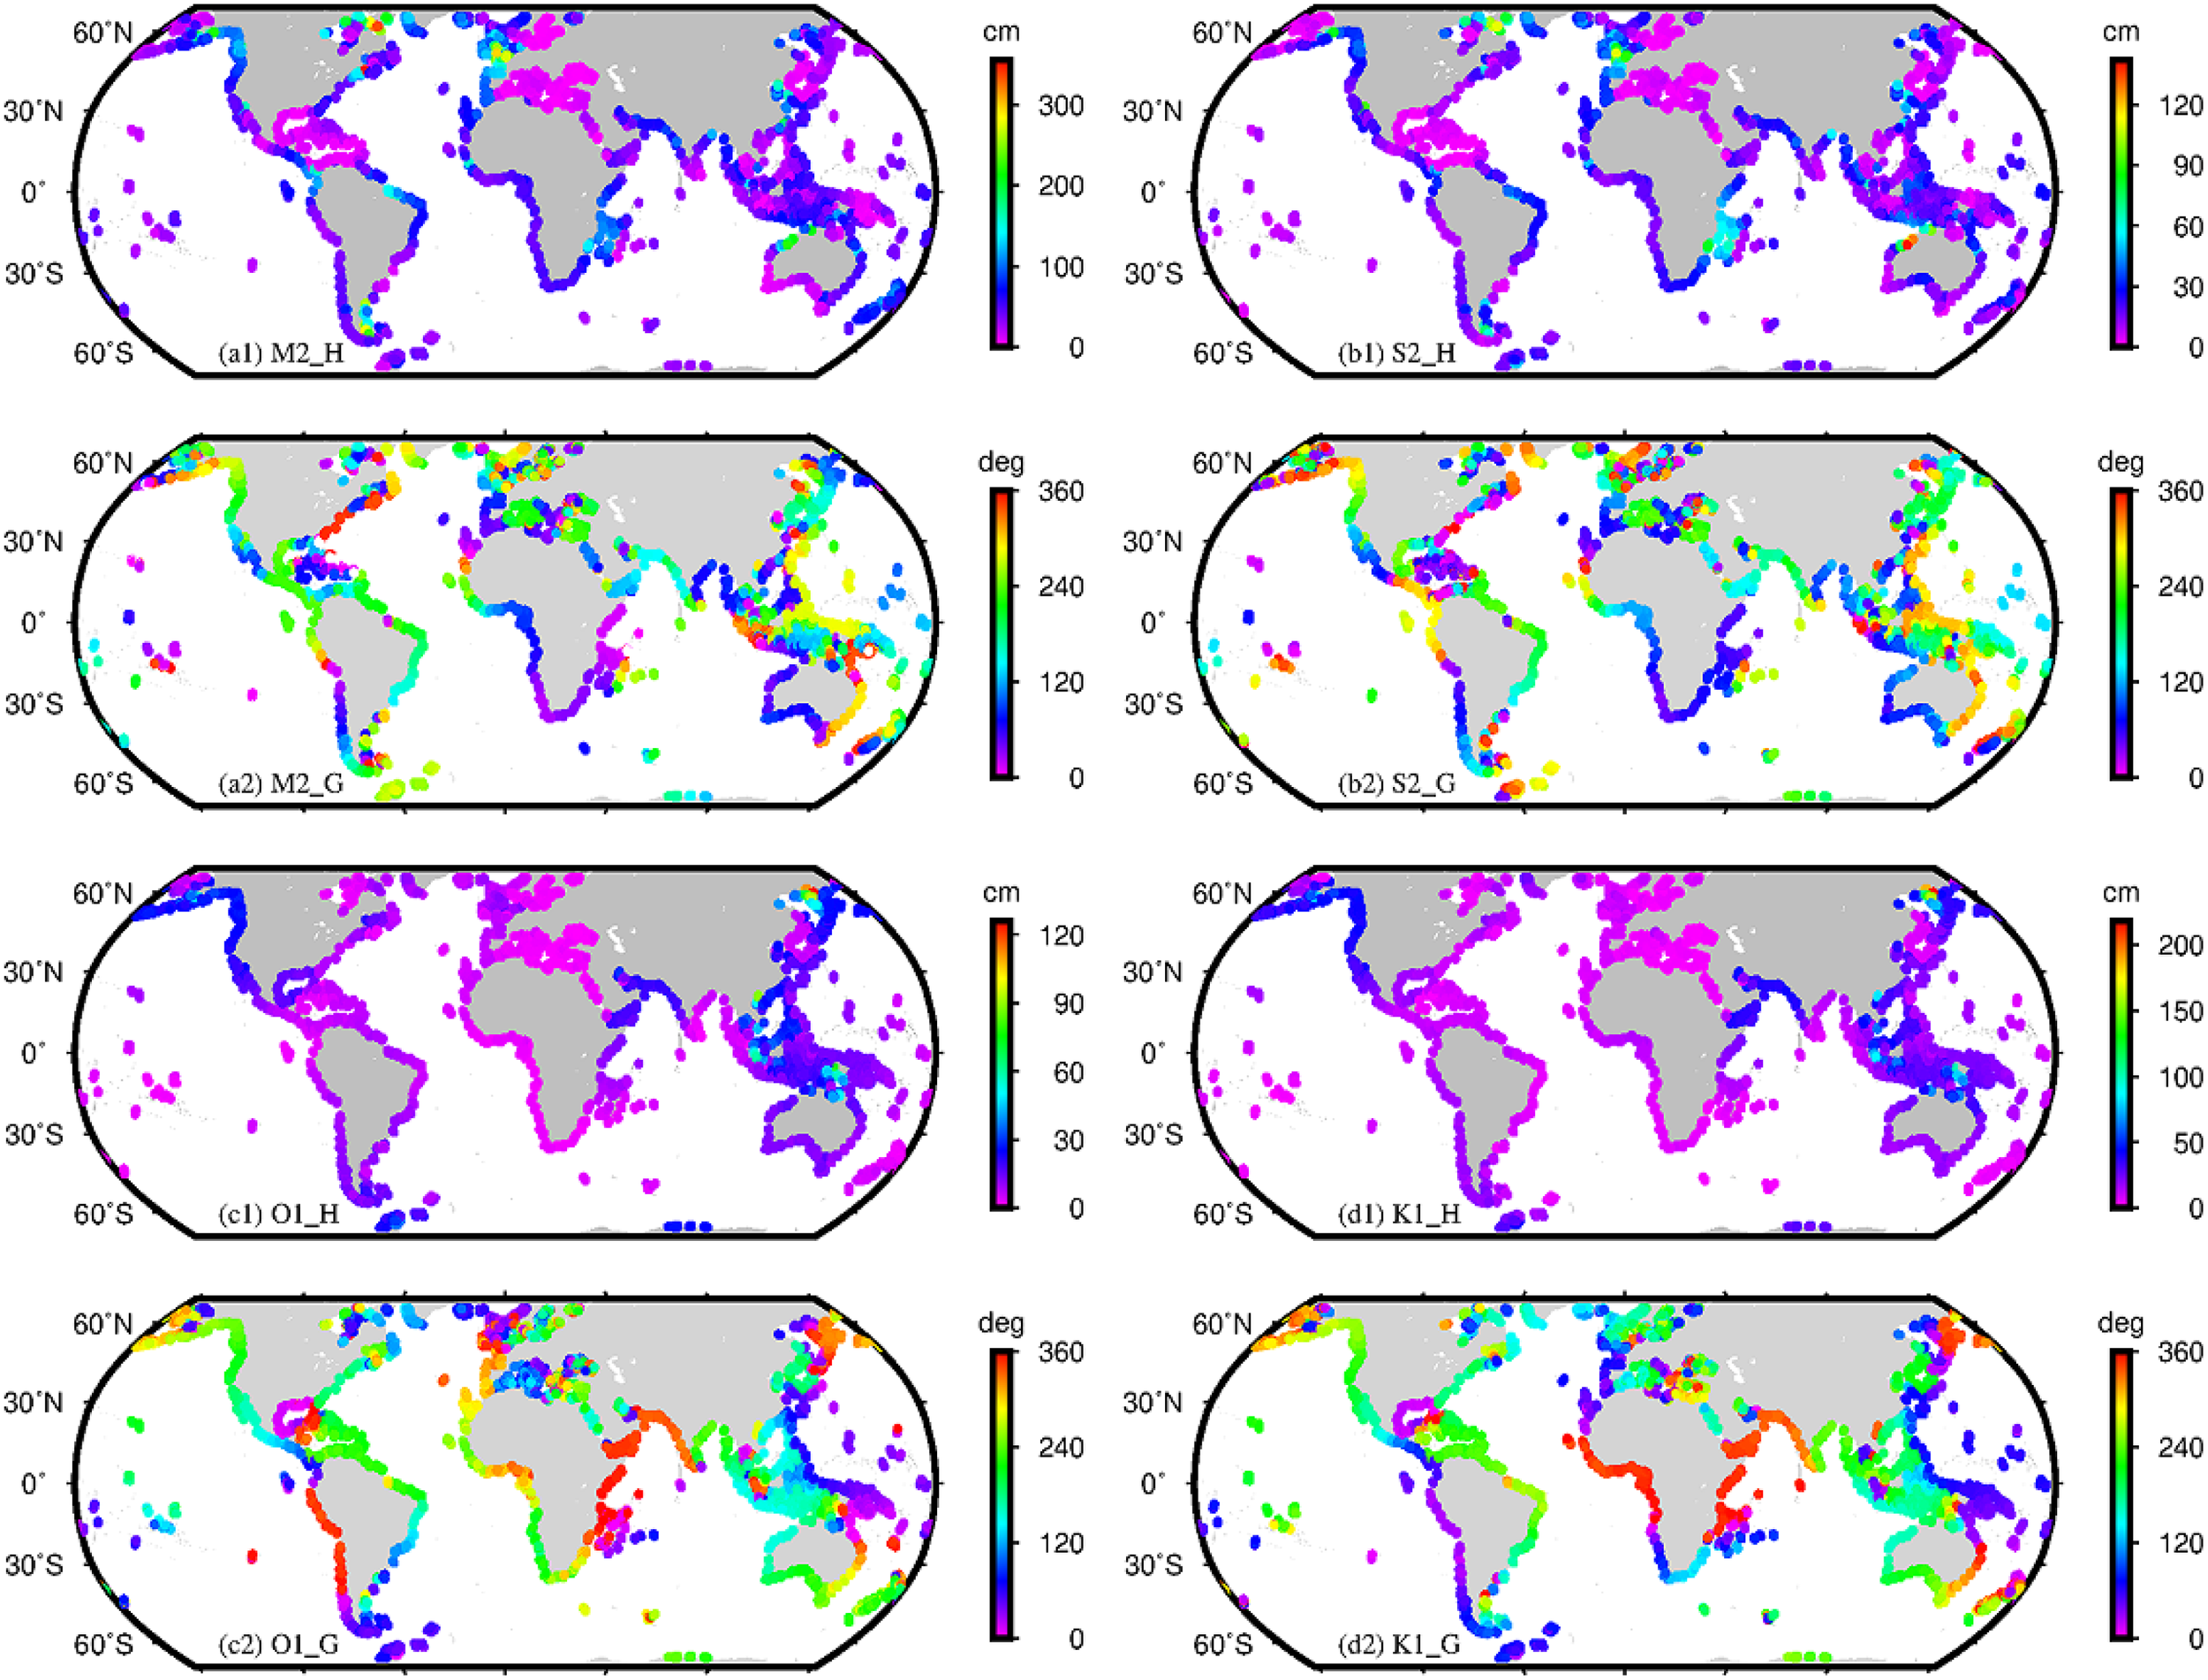
Amplitude (cm) and phase lag (deg) distribution of major tidal constituents extracted from satellite altimetry.
Accurate tidal information in coastal regions is essential for understanding local tidal dynamics and supporting various oceanographic applications. To ensure the reliability of such information, it is crucial to validate the results using multiple approaches, including comparisons with tidal models and tide gauge observations. In this study, we assess the potential of IAS2024 for tidal research by comparing it with four state-of-the-art tidal models: DTU16 (Cheng and Andersen, 2011), EOT20 (Hart-Davis et al., 2023), FES2014b, and FES2022 (Lyard et al., 2021).
These models provide highly accurate tidal estimations in certain coastal regions, such as the waters surrounding the UK and mainland Europe. However, their spatial resolutions—1/16°for FES2014b, 1/30°for FES2022, and 1/8°for DTU16 and EOT-NECS—are often insufficient to capture the fine-scale tidal variability in more complex coastal environments. A common approach to incorporating tidal model outputs into satellite altimetry corrections is linear interpolation, which enables the extraction of tidal information in such regions. While this method can be a reasonable solution, particularly in cases where in situ data are sparse, its effectiveness requires careful evaluation.
Given the varying spatial resolutions of the tidal models and the significant impact of interpolation methods on the results, we adopted a strategy to minimize error accumulation. Specifically, we selected the nearest valid grid point within a 0.5-degree radius centered on each satellite altimetry station as the model output. During data processing, we identified substantial errors in certain tidal model results. For example, the EOT20 model exhibited anomalous values at (140°W, 59.75°N), where the amplitude and phase lag of the M2 constituent were 1.00 cm and 31.21°, respectively. In contrast, surrounding points showed consistent values of approximately 110.40 cm and -78.53°. To mitigate such discrepancies, it is essential to assess inter-model consistency and identify locations with significant spatial gradients. Neglecting these variations could severely impact the accuracy of comparative analyses.
In this study, we employed the RMS error for single-constituent predictions and the RSS error for multi-constituent predictions to evaluate the accuracy of four principal diurnal constituents (Q1, O1, P1, and K1) and four principal semidiurnal constituents (N2, M2, S2, and K2). Table 1 presents the RMS and RSS values for these eight constituents across the four tidal models. The results indicate that the models exhibit overall consistency with satellite altimetry data, with DTU16 demonstrating the highest agreement, achieving an RSS value of 11.23 cm. These findings confirm that the tidal information extracted for the eight major constituents from the IAS2024 dataset aligns well with the accuracy of the tidal models, underscoring the reliability of near-coastal tidal data derived from IAS2024.
Table 1
| Tide model | Q1 | O1 | P1 | K1 | N2 | M2 | S2 | K2 | RSS |
|---|---|---|---|---|---|---|---|---|---|
| DTU16 | 0.77 | 1.48 | 1.21 | 2.19 | 2.14 | 9.80 | 3.86 | 1.20 | 11.23 |
| EOT20 | 0.76 | 1.43 | 1.08 | 2.26 | 2.21 | 10.25 | 4.02 | 1.22 | 11.68 |
| FES2014 | 0.76 | 1.45 | 1.01 | 2.21 | 2.14 | 9.86 | 3.88 | 1.17 | 11.26 |
| FES2022 | 0.76 | 1.41 | 1.01 | 2.16 | 2.14 | 9.87 | 3.90 | 1.19 | 11.26 |
Statistics of RMS and RSS values (cm) for tidal models and satellite altimetry at tidal constituents.
Figure 3 illustrates the spatial distribution of amplitude differences for the M2 constituent between the tidal models and IAS2024. As the tidal constituent with the largest amplitude, M2 can reach values of up to 350 cm. In the comparison between satellite altimetry-derived results and the four tidal models, the amplitude differences of M2 exhibit a consistent spatial pattern, ranging from -33.61 cm to 33.37 cm, with over 95% of the points falling within ±5 cm. Notably, the majority of points where the differences exceed 10 cm are concentrated in high-latitude regions. While the comparison between tidal models and satellite altimetry data does not serve as a direct validation of the altimetry-derived tidal signals, the strong agreement observed between the two datasets underscores the robustness of the results. This consistency is particularly valuable for enhancing the accuracy of tidal models in coastal and nearshore regions.
Figure 3
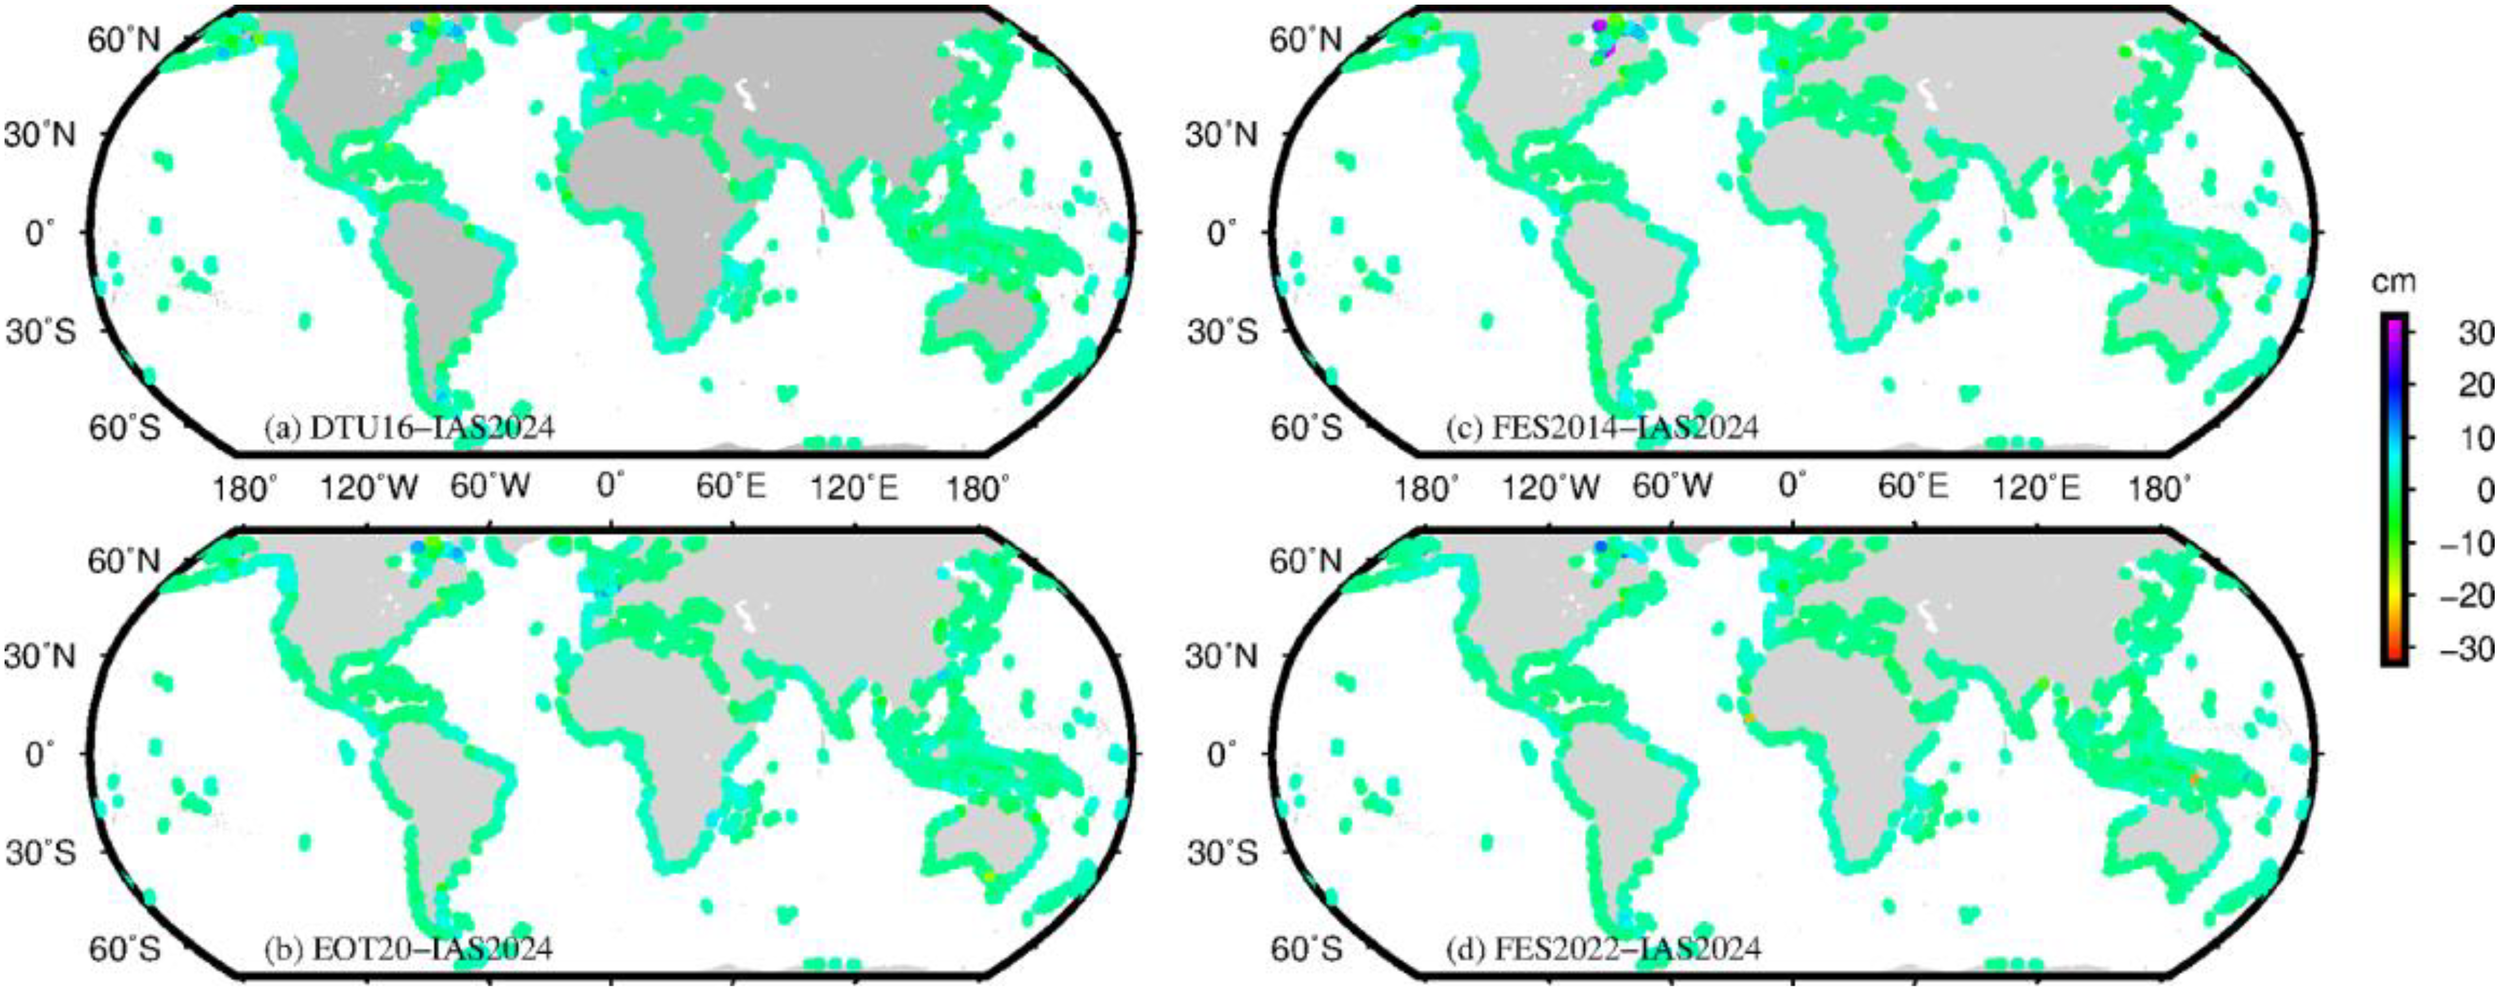
Spatial distribution of amplitude differences for the M2 constituent between tidal models and satellite altimetry.
3.2 Evaluation with tide gauge observations
Tide gauge data, as independent observational datasets, provide an effective means of evaluating the accuracy of satellite altimetry-derived tidal signals. Given that tide gauge stations are discretely distributed along coastlines, while satellite altimetry data are organized along tracks, we established a systematic selection criterion for tide gauge stations. Specifically, we selected stations worldwide based on the requirement that the nearest satellite altimetry point must be within 20 kilometers, resulting in a total of 164 tide gauge stations. Using traditional harmonic analysis, we extracted harmonic constants for the 10 major tidal constituents from the tide gauge records. For consistency, tidal model outputs were processed using the same methodology as described earlier in their comparison with tide gauge observations.
Figure 4 presents the distribution of RSS values between IAS2024-derived tidal constituents and tide gauge observations for the eight diurnal and semidiurnal constituents. Taking the DTU16 model as an example, although the RSS values range from 1.62 cm to 55.69 cm, 64.6% of the stations exhibit RSS values within 10 cm, and 89.6% fall within 20 cm. Among the eight stations where the RSS values exceed 30 cm, two correspond to the harmonic constant statistics listed as points 3 and 4 in Table 2, while the remaining six stations are located north of 50°N.
Figure 4
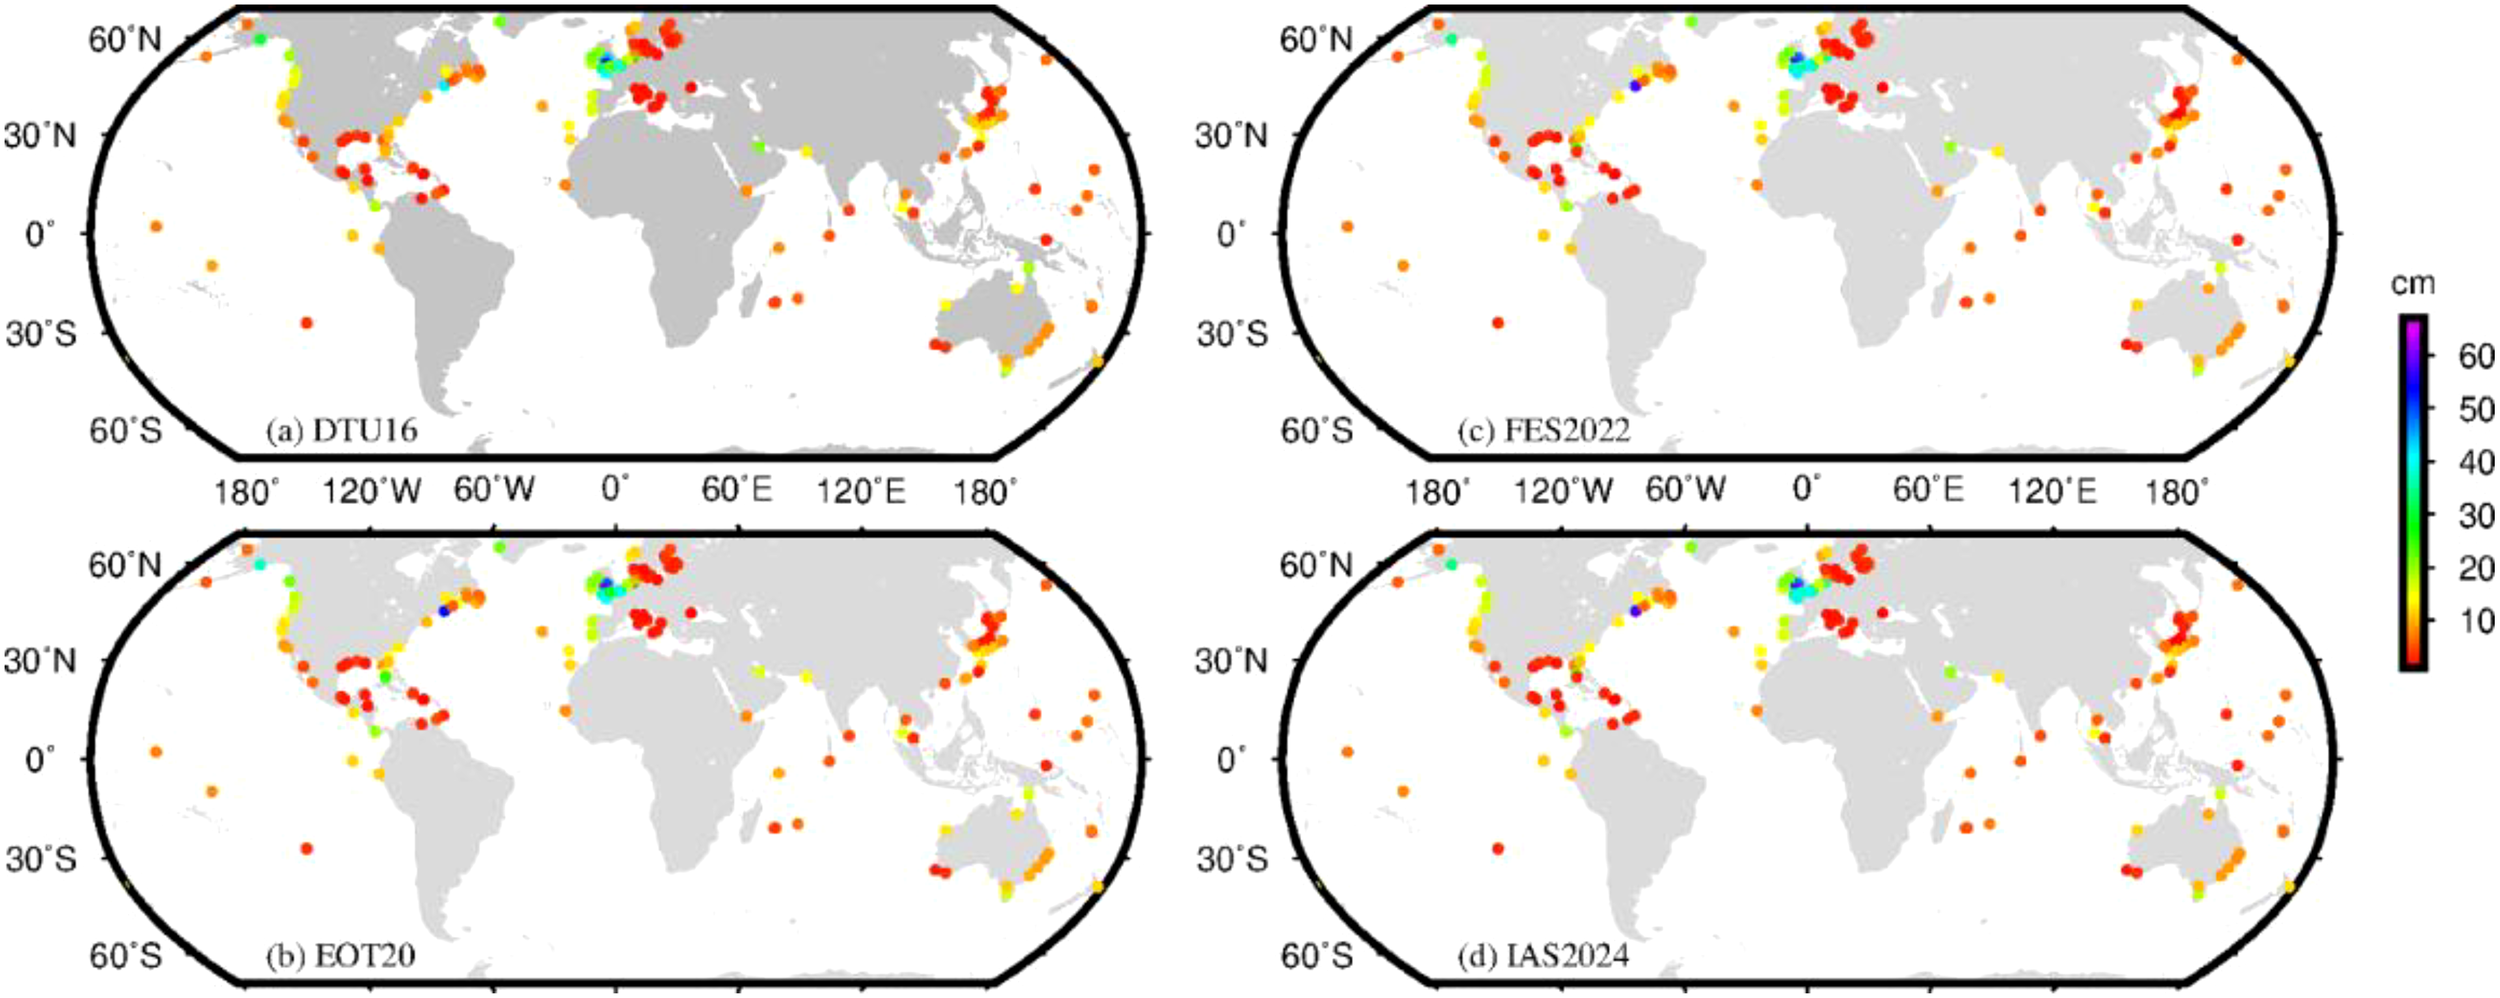
Distribution of RSS values (cm) for eight tidal constituents between satellite altimetry results and tide gauge observations.
Table 2
| No | Location | Tidal Constant | DTU16 | EOT20 | FES2022 | IAS2024 | Tide gauge |
|---|---|---|---|---|---|---|---|
| 1 | 36.62°N | H (cm) | 5.58 | 5.79 | 5.69 | 5.78 | 5.00 |
| 136.60°E | G (°) | 158.38 | 164.17 | 161.77 | 163.18 | 160.16 | |
| RE_H | 12% | 16% | 14% | 16% | — | ||
| RE_G | 1% | 3% | 1% | 2% | — | ||
| RMS | 0.43 | 0.62 | 0.50 | 0.59 | — | ||
| 2 | 64.5°N | H (cm) | 10.77 | 8.73 | 11.22 | 11.40 | 10.92 |
| 165.44°W | G (°) | 34.39 | 43.97 | 42.07 | 38.93 | 29.18 | |
| RE_H | 1% | 20% | 3% | 4% | — | ||
| RE_G | 18% | 51% | 44% | 33% | — | ||
| RMS | 0.71 | 2.36 | 1.77 | 1.38 | — | ||
| 3 | 48.72°N | H (cm) | 267.03 | 265.96 | 269.11 | 269.42 | 256.36 |
| 3.97°S | G (°) | 140.12 | 140.54 | 140.46 | 142.08 | 128.95 | |
| RE_H | 4% | 4% | 5% | 5% | — | ||
| RE_G | 9% | 9% | 9% | 10% | — | ||
| RMS | 36.80 | 37.90 | 38.33 | 43.49 | — | ||
| 4 | 44.80°N | H (cm) | 330.07 | 339.84 | 326.91 | 336.12 | 350.43 |
| 65.53°W | G (°) | 87.97 | 90.68 | 91.49 | 89.60 | 78.96 | |
| RE_H | 6% | 3% | 7% | 4% | — | ||
| RE_G | 11% | 15% | 16% | 13% | — | ||
| RMS | 40.45 | 50.41 | 54.84 | 46.16 | — | ||
Relative errors and RMS statistics for the M2 constituent of extracted amplitude and phase lags at selected stations.
For instance, in regions with large tidal ranges, tidal models may exhibit higher absolute errors; however, when considered relative to the tidal range, these errors may be proportionally small. In such cases, the RE provides a more accurate assessment of model performance. Conversely, in regions with small tidal ranges, absolute errors might appear minor, yet the RE could be significantly high, indicating areas where model improvement is necessary. This normalized metric facilitates a more comprehensive evaluation of the model’s applicability across diverse tidal environments.
When the amplitude of a tidal constituent is small, the RMS error also tends to be small, regardless of variations in phase lag, due to the influence of trigonometric functions in its calculation. This effect is exemplified by points 1 and 2 in Table 2. However, when the amplitude of a tidal constituent is large, even small variations in phase lag can have a pronounced impact on the RMS value, as observed at points 3 and 4 in Table 2. In such cases, RMS becomes less reliable as an evaluation metric, whereas RE proves advantageous in providing a more robust assessment of model accuracy.
DTU16 and EOT20 are empirical tidal models that incorporate extensive tide gauge data and along-track satellite altimetry observations during their construction. Consequently, these models inherently exhibit higher accuracy when evaluated against tide gauge observations. This advantage is evident in Table 2, where DTU16 and EOT20 demonstrate significantly better agreement with tide gauge data compared to FES2022. In contrast, the accuracy of FES2022 aligns closely with the results obtained in this study, underscoring the effectiveness of the IAS2024 dataset in extracting tidal information in nearshore regions.
The discrepancies between satellite altimetry-derived tidal constituents and tide gauge observations in this study primarily stem from one key factor. It is important to note that the selection of tide gauge stations was based on a 20 km proximity criterion, under the assumption that tidal characteristics remain consistent within this range. However, in regions with steep tidal gradients, harmonic constants can vary significantly over short distances. This variation introduces additional uncertainties in the comparison, further complicating the alignment between the two datasets.
To quantitatively assess the consistency between tidal models and tide gauge observations, this study presents the RE distribution plots for four models—DTU16, EOT20, FES2022, and IAS2024—compared against tide gauge data (Figure 5). These plots integrate histograms with kernel density estimation (KDE) curves to provide a comprehensive representation of error distribution. The histograms depict the probability density distribution of relative errors, excluding data points where the true values are less than 1 cm in absolute magnitude. The bar heights reflect the frequency of errors within each interval, while the KDE curves offer a smoothed visualization of the distribution trends. Each model is color-coded (black: DTU16, red: EOT20, blue: FES2022, green: IAS2024), with the filtered mean (mean) and standard deviation (std) annotated on the plots.
Figure 5
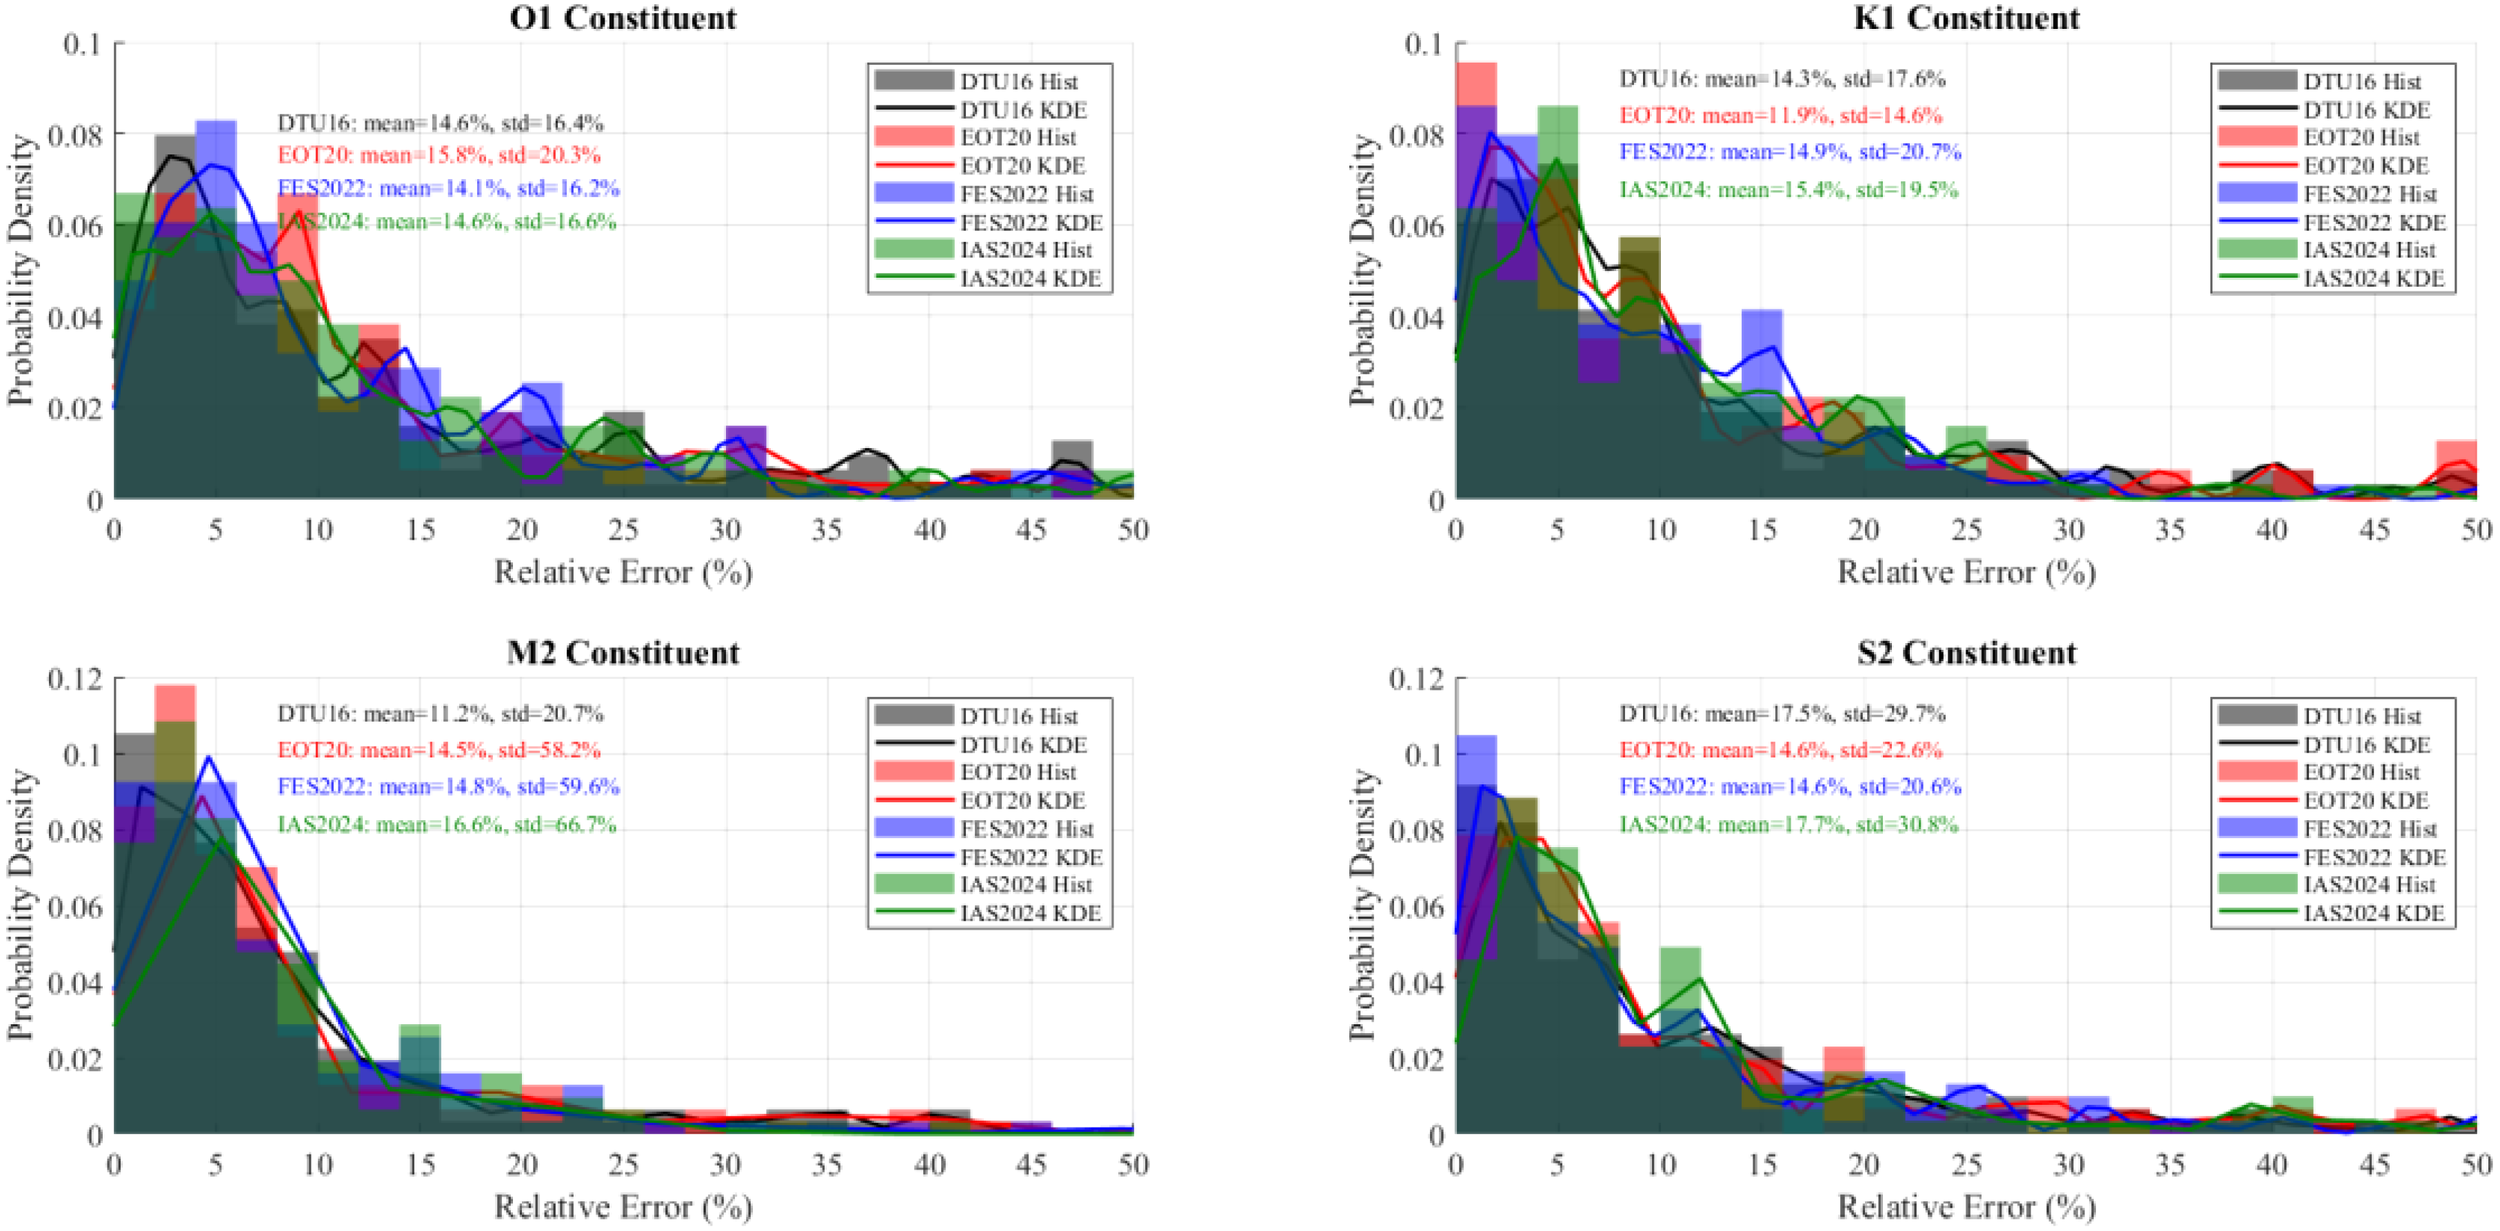
Relative error distribution plots for four models (DTU16, EOT20, FES2022, and IAS2024) compared to tide gauge observations.
The results reveal notable differences in the mean and standard deviation of REs across the four models for each tidal constituent, despite the overall similarity in distribution shapes. For instance, for the O1 constituent, the mean REs for DTU16, EOT20, FES2022, and IAS2024 are 14.6%, 15.8%, 14.1%, and 14.16%, respectively, with corresponding standard deviations of 16.4%, 20.3%, 16.2%, and 16.6%.
The RE results indicate that the IAS2024 model exhibits a balance between accuracy and distribution consistency compared to the other models across the four tidal constituents. For the O1 constituent, the mean RE of IAS2024 (14.16%) is slightly lower than that of DTU16 (14.6%) and EOT20 (15.8%), while its standard deviation (16.6%) is comparable to those of DTU16 (16.4%) and FES2022 (16.2%). This suggests that IAS2024 achieves a level of precision and stability for diurnal constituents similar to the other models.
In contrast, for the M2 constituent, IAS2024 exhibits a higher mean relative error (16.6%) compared to DTU16 (11.2%) and EOT20 (14.5%), with a notably larger standard deviation (66.7%) than the other models (DTU16: 20.7%, EOT20: 58.2%). This indicates greater variability in semidiurnal constituent errors, likely due to resolution limitations in nearshore regions with complex topography.
For the K1 constituent, the mean RE of IAS2024 (15.4%) is comparable to that of FES2022 (14.9%), while its standard deviation (19.5%) is slightly lower than that of FES2022 (20.7%), highlighting a relative advantage in stability for diurnal constituents. In the case of the S2 constituent, IAS2024 exhibits both a higher mean RE (17.7%) and standard deviation (30.8%) than the other models. However, its error distribution range (e.g., histogram span) overlaps significantly with DTU16 (17.5% ± 29.7%) and EOT20 (14.6% ± 22.6%), indicating that its accuracy for semidiurnal constituents remains within an acceptable range.
Overall, while IAS2024 exhibits higher mean errors and greater dispersion for certain constituents (e.g., M2 and S2), its error distribution patterns are generally consistent with those of the other models, supporting its reliability for applications in nearshore regions.
3.3 Performance in long-period constituents
The annual tidal constituent (Sa) and the semi-annual tidal constituent (Ssa) play a crucial role in the determination of chart datums in China. However, most global tidal models do not currently provide estimates for these long-period tidal constituents. Moreover, research has largely focused on the precise extraction of major short-period tidal constituents, improvements in spatial resolution, and tidal inversion in polar regions, while relatively little attention has been given to the spatiotemporal characteristics of long-period constituents.
Figure 6 presents the global distribution of amplitudes and phase lags for the Sa and Ssa constituents within the latitudinal range of 66°S to 66°N. The maximum amplitude of the Sa constituent reaches 38.22 cm, though 80.67% of the data points exhibit amplitudes below 10 cm, with the highest values observed in the Arafura Sea off northern Australia. For the Ssa constituent, the maximum amplitude is 15.17 cm, with 89.39% of the data points registering amplitudes below 5 cm. The harmonic constants of these long-period constituents, particularly the phase lag of Ssa, exhibit smooth and regular spatial distributions, with relatively small gradients of variation over large spatial scales.
Figure 6
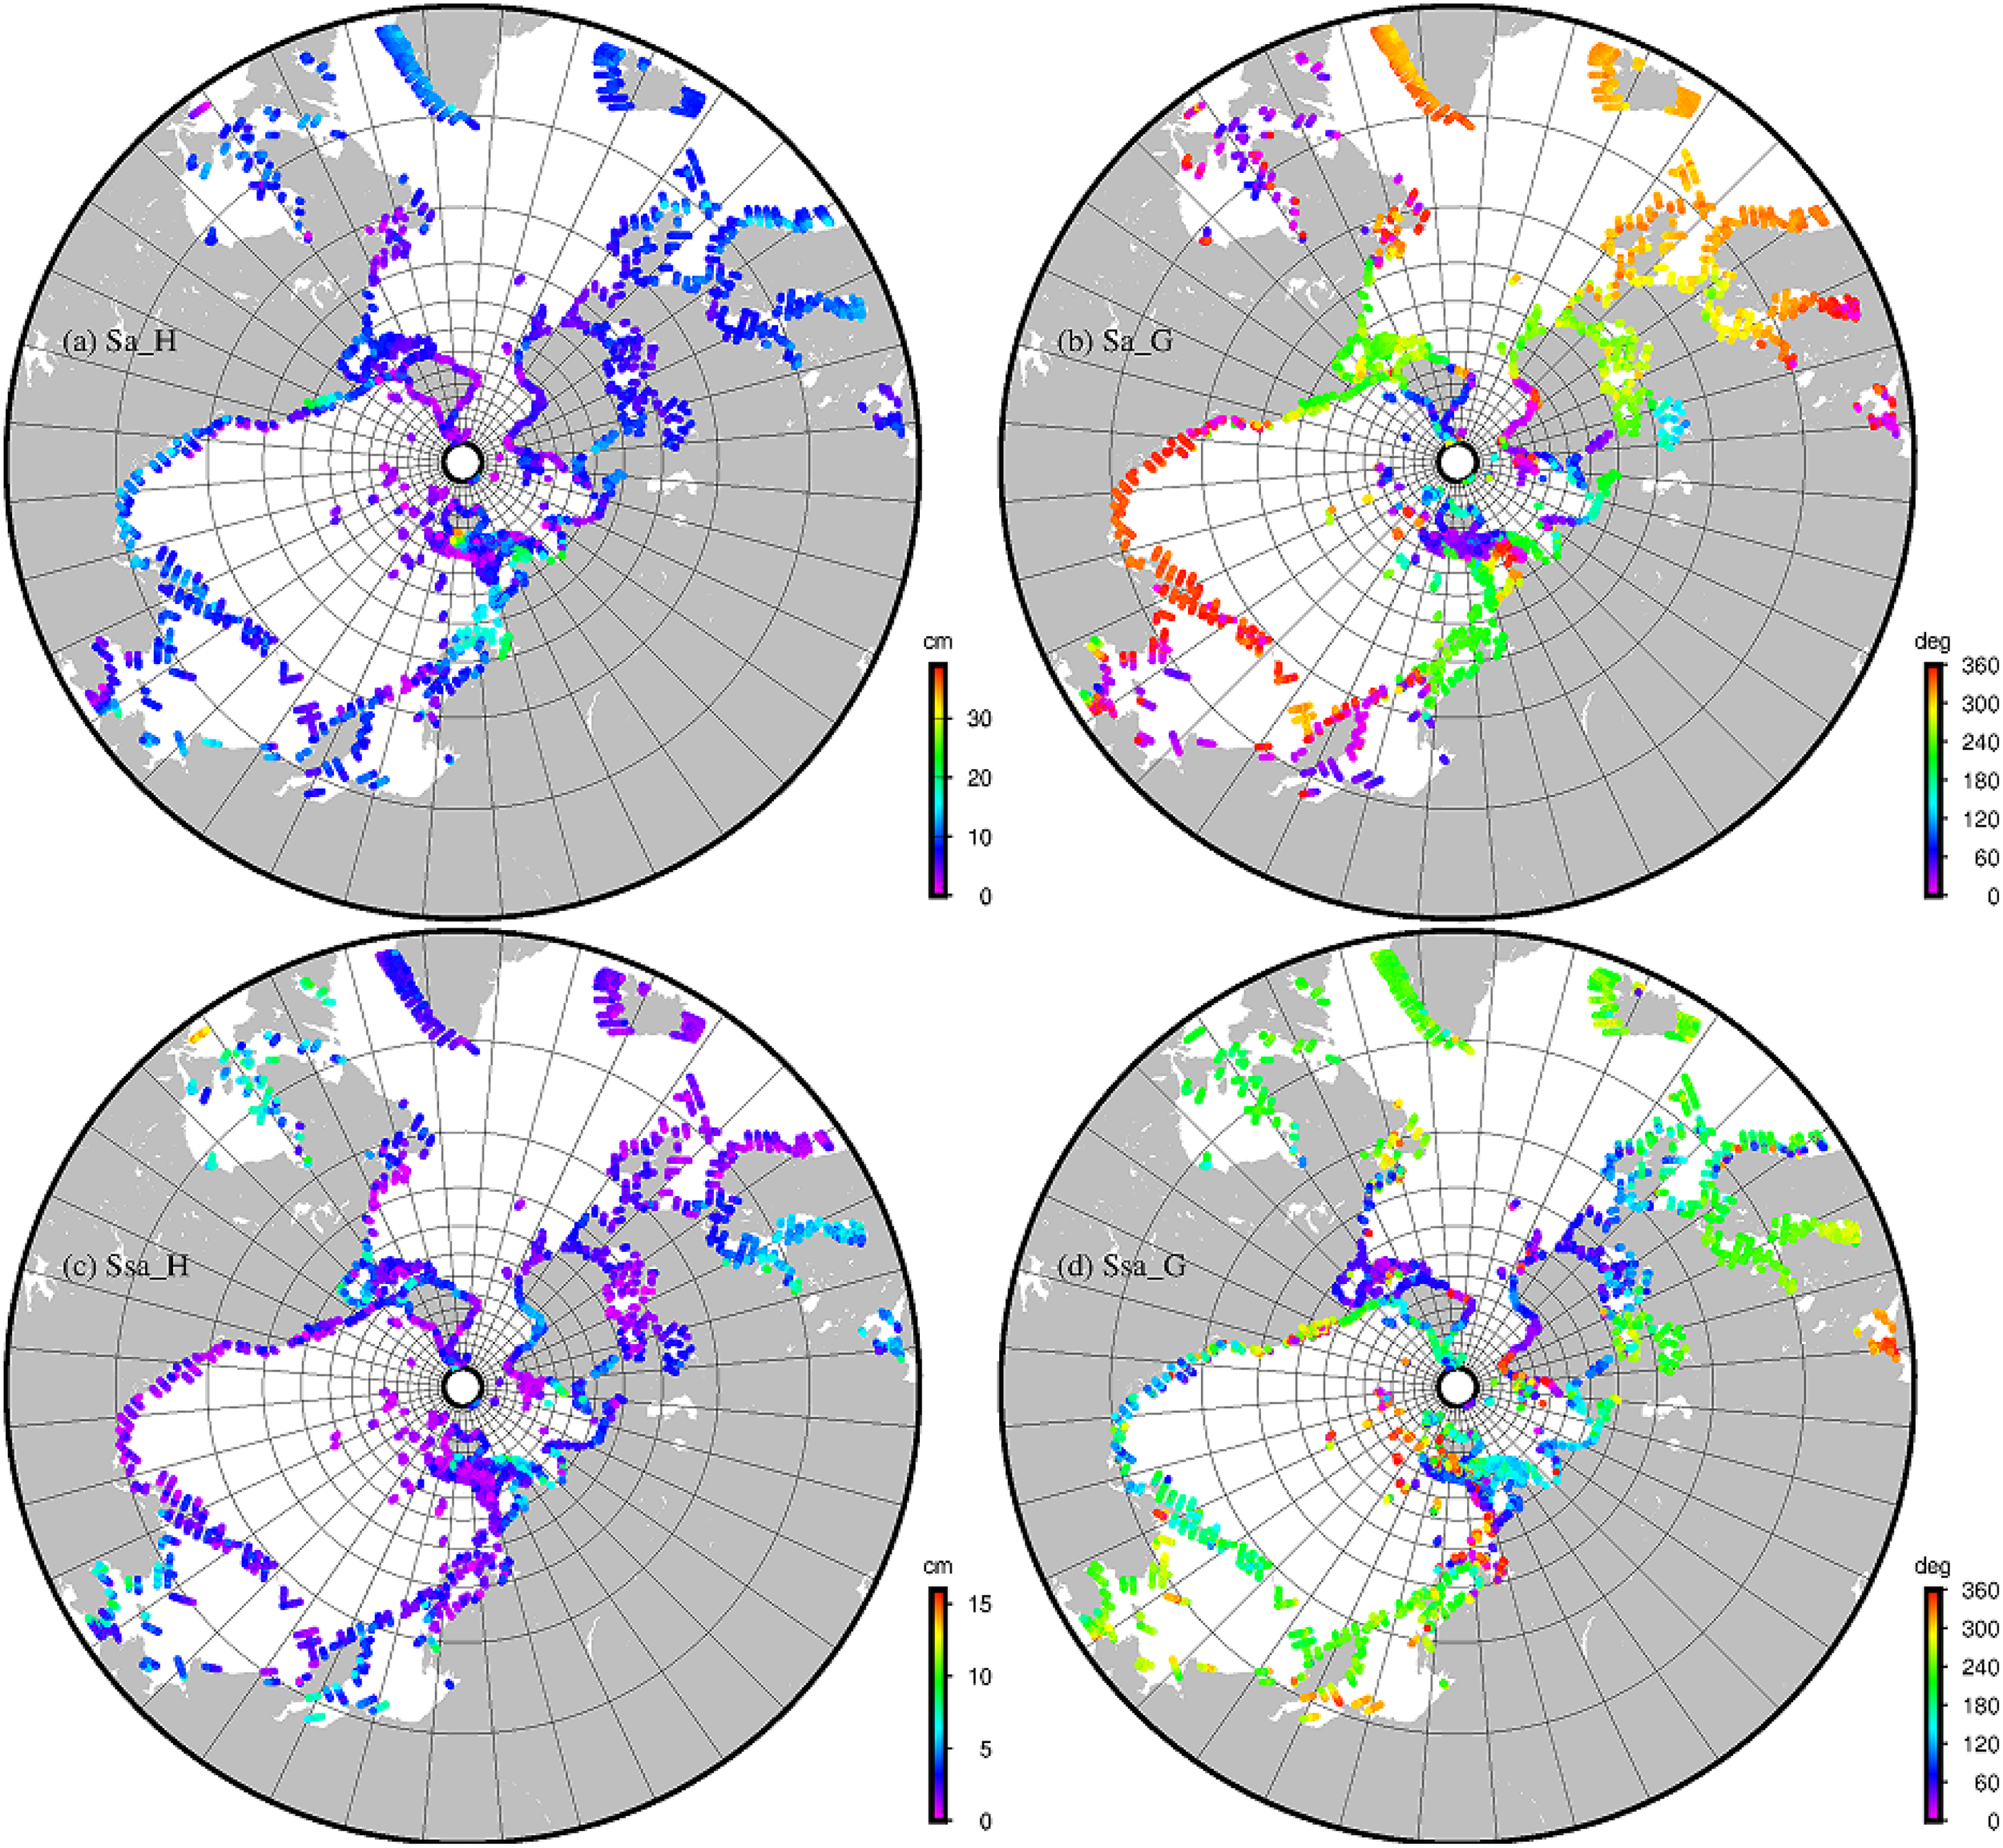
Global coastal distribution of amplitudes (cm) and phase lags (deg) for the Sa and Ssa tidal constituents.
Additionally, we extracted the Sa and Ssa tidal constituent estimates from the EOT20 and FES2022 models at tide gauge stations and compared them, along with the IAS2024 results, against tide gauge observations. Figure 7 presents the corresponding results from the three datasets, with tide gauge observations plotted on the horizontal axis.
Figure 7
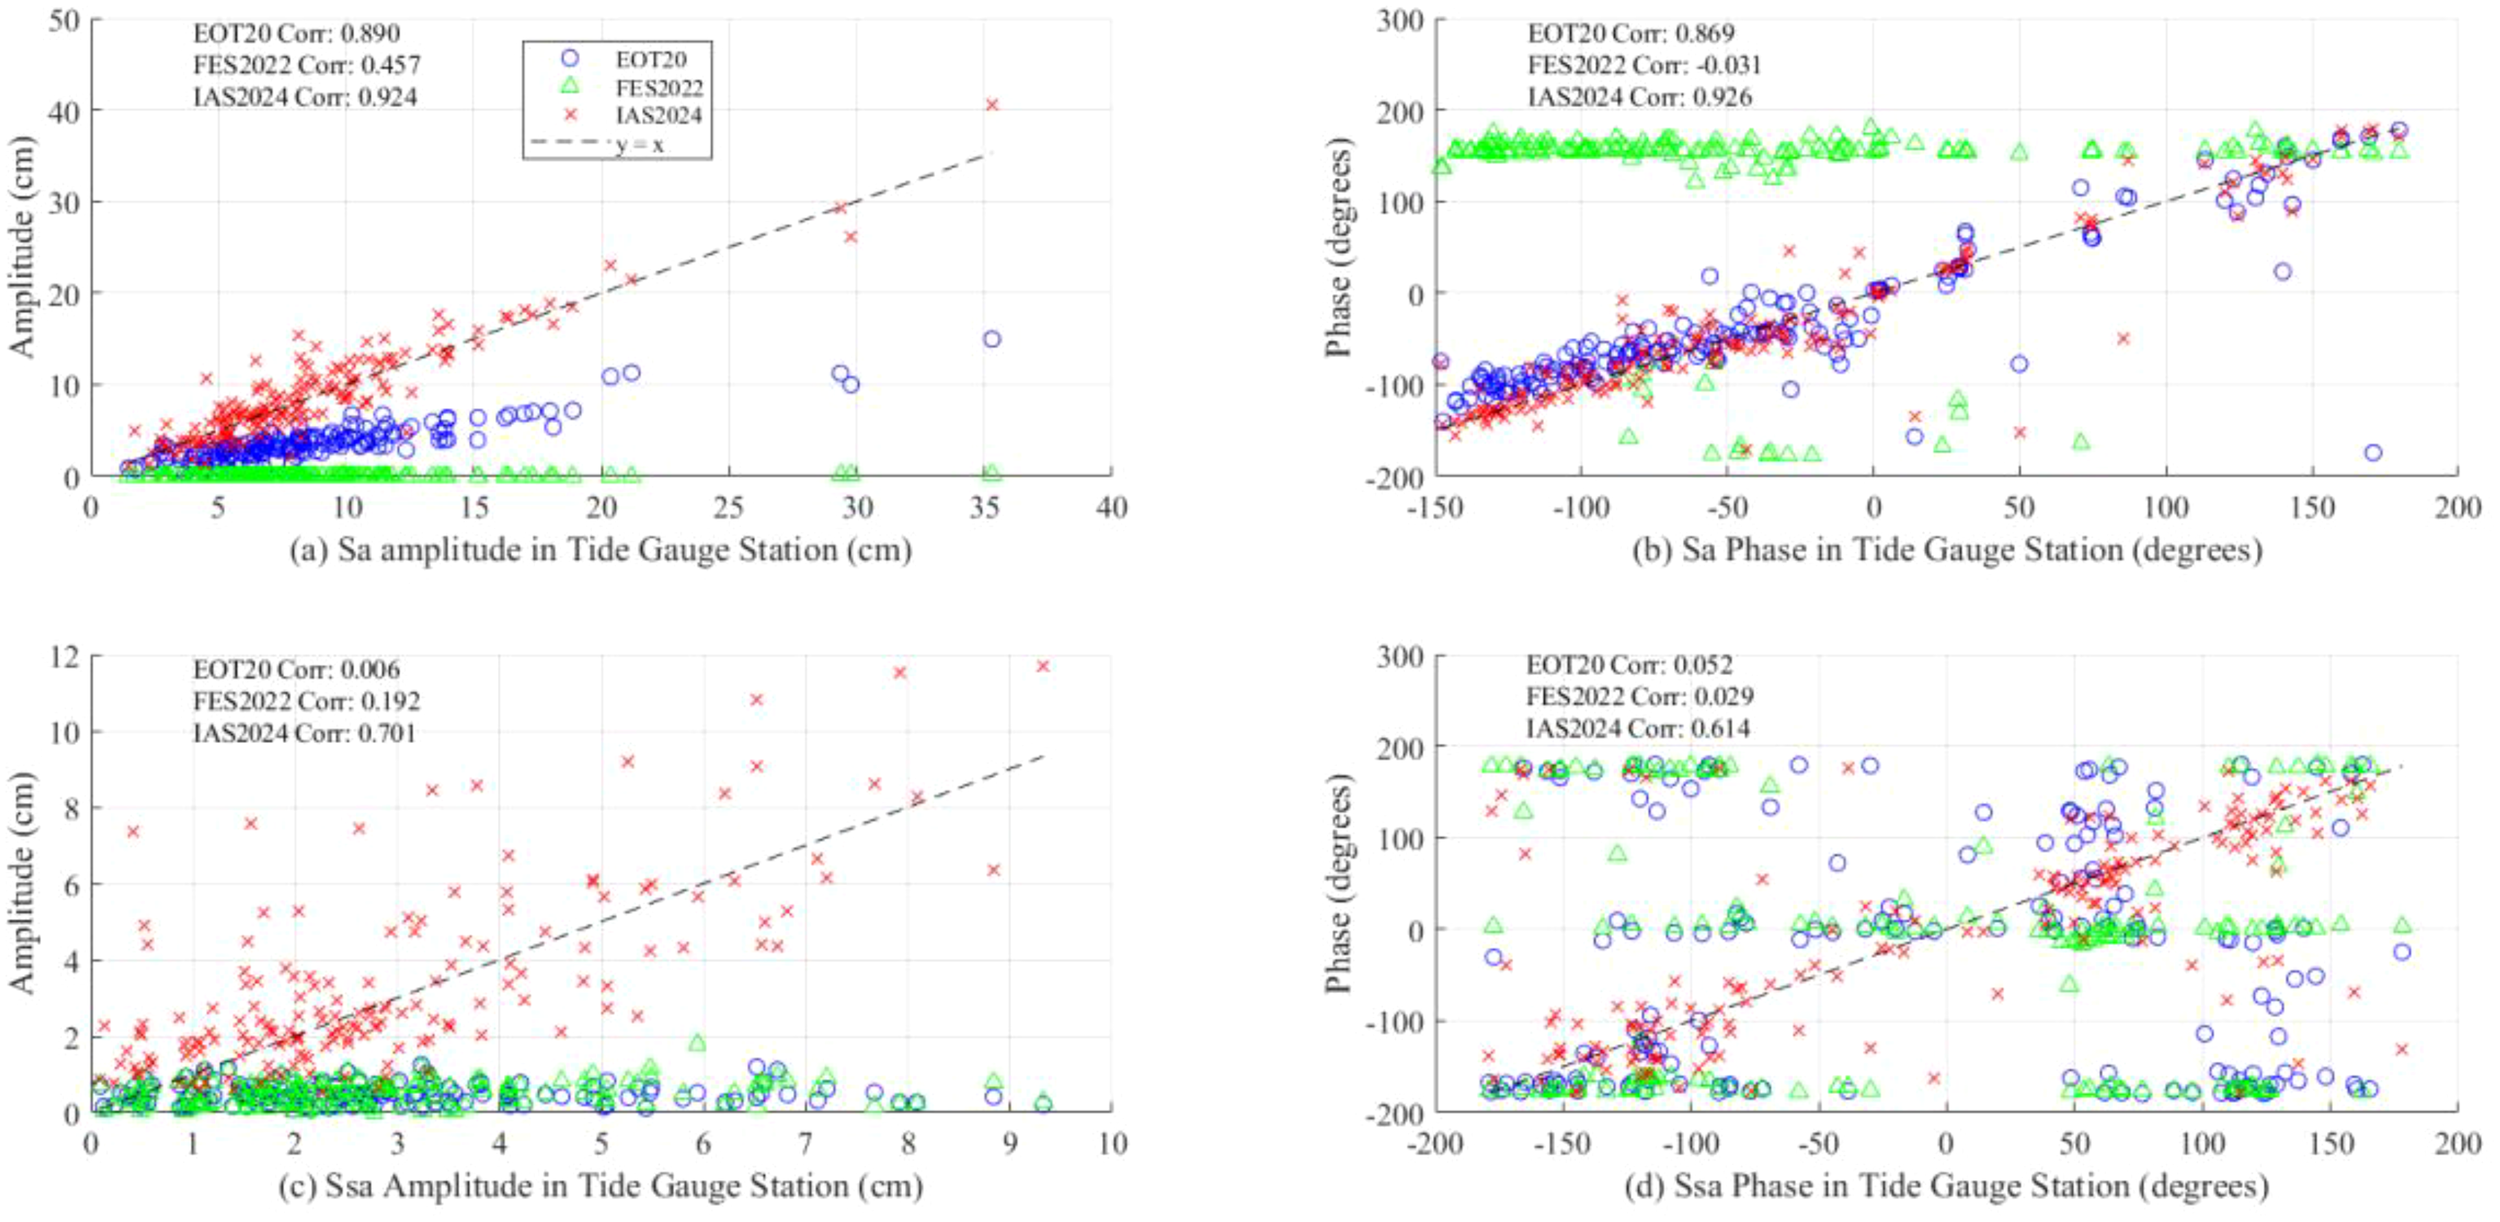
Comparison of Sa and Ssa tidal constituent results from EOT20, FES2022, and IAS2024 against tide gauge observations (cm).
The IAS2024 dataset demonstrates significant advantages in extracting the Sa and Ssa tidal constituents, particularly excelling in the accurate inversion of long-period tidal signals. For the Sa constituent, IAS2024 exhibits a high amplitude correlation coefficient of 0.924 with tide gauge observations, outperforming EOT20 (0.890) and significantly surpassing FES2022 (0.457). Moreover, IAS2024 achieves superior bias statistics, with a mean amplitude bias of 0.27 cm and a standard deviation of 2.06 cm, compared to EOT20’s mean bias of -4.93 cm and standard deviation of 3.26 cm (Figure 7a). In terms of phase consistency, IAS2024 also demonstrates strong agreement with tide gauge data, achieving a correlation coefficient of 0.926, in contrast to FES2022’s weak correlation of -0.031. Although EOT20 attains a relatively high phase correlation coefficient (0.869), its systematic bias may be attributed to phase delays caused by the simplified representation of nearshore topography in the model (Figure 7b).
For the Ssa constituent, IAS2024 further improves its amplitude correlation coefficient to 0.701, significantly outperforming EOT20 (0.006) and FES2022 (0.192), with further optimized bias statistics (mean bias: 0.397 cm, standard deviation: 1.66 cm). In terms of phase, IAS2024 achieves a correlation coefficient of 0.614, which, while lower than that for Sa, still surpasses traditional models (EOT20: 0.052; FES2022: 0.029) (Figures 7c, d). These results indicate that IAS2024, through its advanced data processing techniques, effectively extracts amplitude and phase information for long-period tidal constituents, providing a reliable data foundation for studying the spatial distribution of long-period tides, particularly in regions with sparse tide gauge coverage.
The superiority of IAS2024 can primarily be attributed to its deep optimization of Jason-series satellite altimetry data and the application of advanced nearshore signal correction techniques. Traditional tidal models, such as EOT20 and FES2022, rely on the assimilation of global satellite altimetry data during their construction. However, their relatively coarse grid resolutions (e.g., 1/16°for FES2022) are insufficient to resolve complex nearshore topography, leading to energy leakage from shallow-water nonlinear tides (e.g., M4) into long-period constituents. Additionally, the inadequate correction of land contamination in nearshore regions exacerbates the inversion errors for long-period constituents.
In contrast, IAS2024 significantly mitigates the impact of land contamination on altimetry signals through improved waveform retracking algorithms and high-density sampling strategies, particularly in the critical 0–5 km nearshore zone, where data quality is markedly enhanced. Moreover, IAS2024 benefits from long-term observations from Jason-series satellites, effectively addressing the aliasing issues between long-period constituents (e.g., Ssa) and climatic signals, thereby enabling the precise separation of low-frequency tidal components.
However, the residual errors in the Ssa tidal constituent (such as low phase correlation) suggest that reliance solely on Jason-series data still has certain limitations. In the future, further integration of multi-mission altimetry data (e.g., non-synchronous orbit data from Sentinel-3A/B) will help extend the effective observation period, while the combination of wide-swath interferometric altimetry data (e.g., from the SWOT mission) will enhance spatial sampling rates (Hart-Davis et al., 2024). This will enable a more comprehensive capture of the spatial distribution characteristics of long-period tidal constituents. Additionally, constructing a joint inversion framework that incorporates tide gauge time series will further address the challenge of separating interannual signals from climatic noise, providing more accurate tidal modulation information for global sea-level change research.
4 Discussion
Tidal signals in high-latitude regions are strongly influenced by topography and ice sheets, making the analysis of tidal information in these areas using satellite altimetry data a critical focus in the field. We performed a detailed accuracy validation of the tidal information extracted from the IAS2024 dataset between 50° and 66° latitude in both the Northern and Southern Hemispheres. Figure 8 illustrates the distribution of REs in the amplitude of the M2 tidal constituent in high-latitude seas of both hemispheres. The analysis encompassed a total of 101,543 stations in the Northern Hemisphere and 23,006 stations in the Southern Hemisphere, providing robust data to effectively improve the accuracy of tidal models in these high-latitude regions.
Figure 8
Distribution of relative errors in M2 tidal constituent amplitude in high-latitude seas of the northern and southern hemispheres (cm).
The IAS2024 dataset provides tidal information for along-track points within 100 km of the coastline. In this study, these points are divided into four distance ranges: 0–10 km, 10–30 km, 30–50 km, and 50–100 km, with the number of along-track points being 13,795, 40,209, 26,056, and 44,489, respectively. Figure 9 presents the spatial variation of the RSS values between IAS2024 tidal information and DTU16 for eight tidal constituents as a function of distance from the coastline. As shown in Figure 9a, although there are still some points with large RSS values within each distance range, the analysis indicates that this is primarily due to the larger amplitude of the M2 constituent at certain points. However, the overall RSS values show a gradual decreasing trend with increasing distance from the coastline. The reduction in RSS values as distance increases suggests that altimetry data in nearshore regions are influenced by more complex environmental factors. As the distance from the coast increases, the extraction of tidal signals becomes more stable.
Figure 9
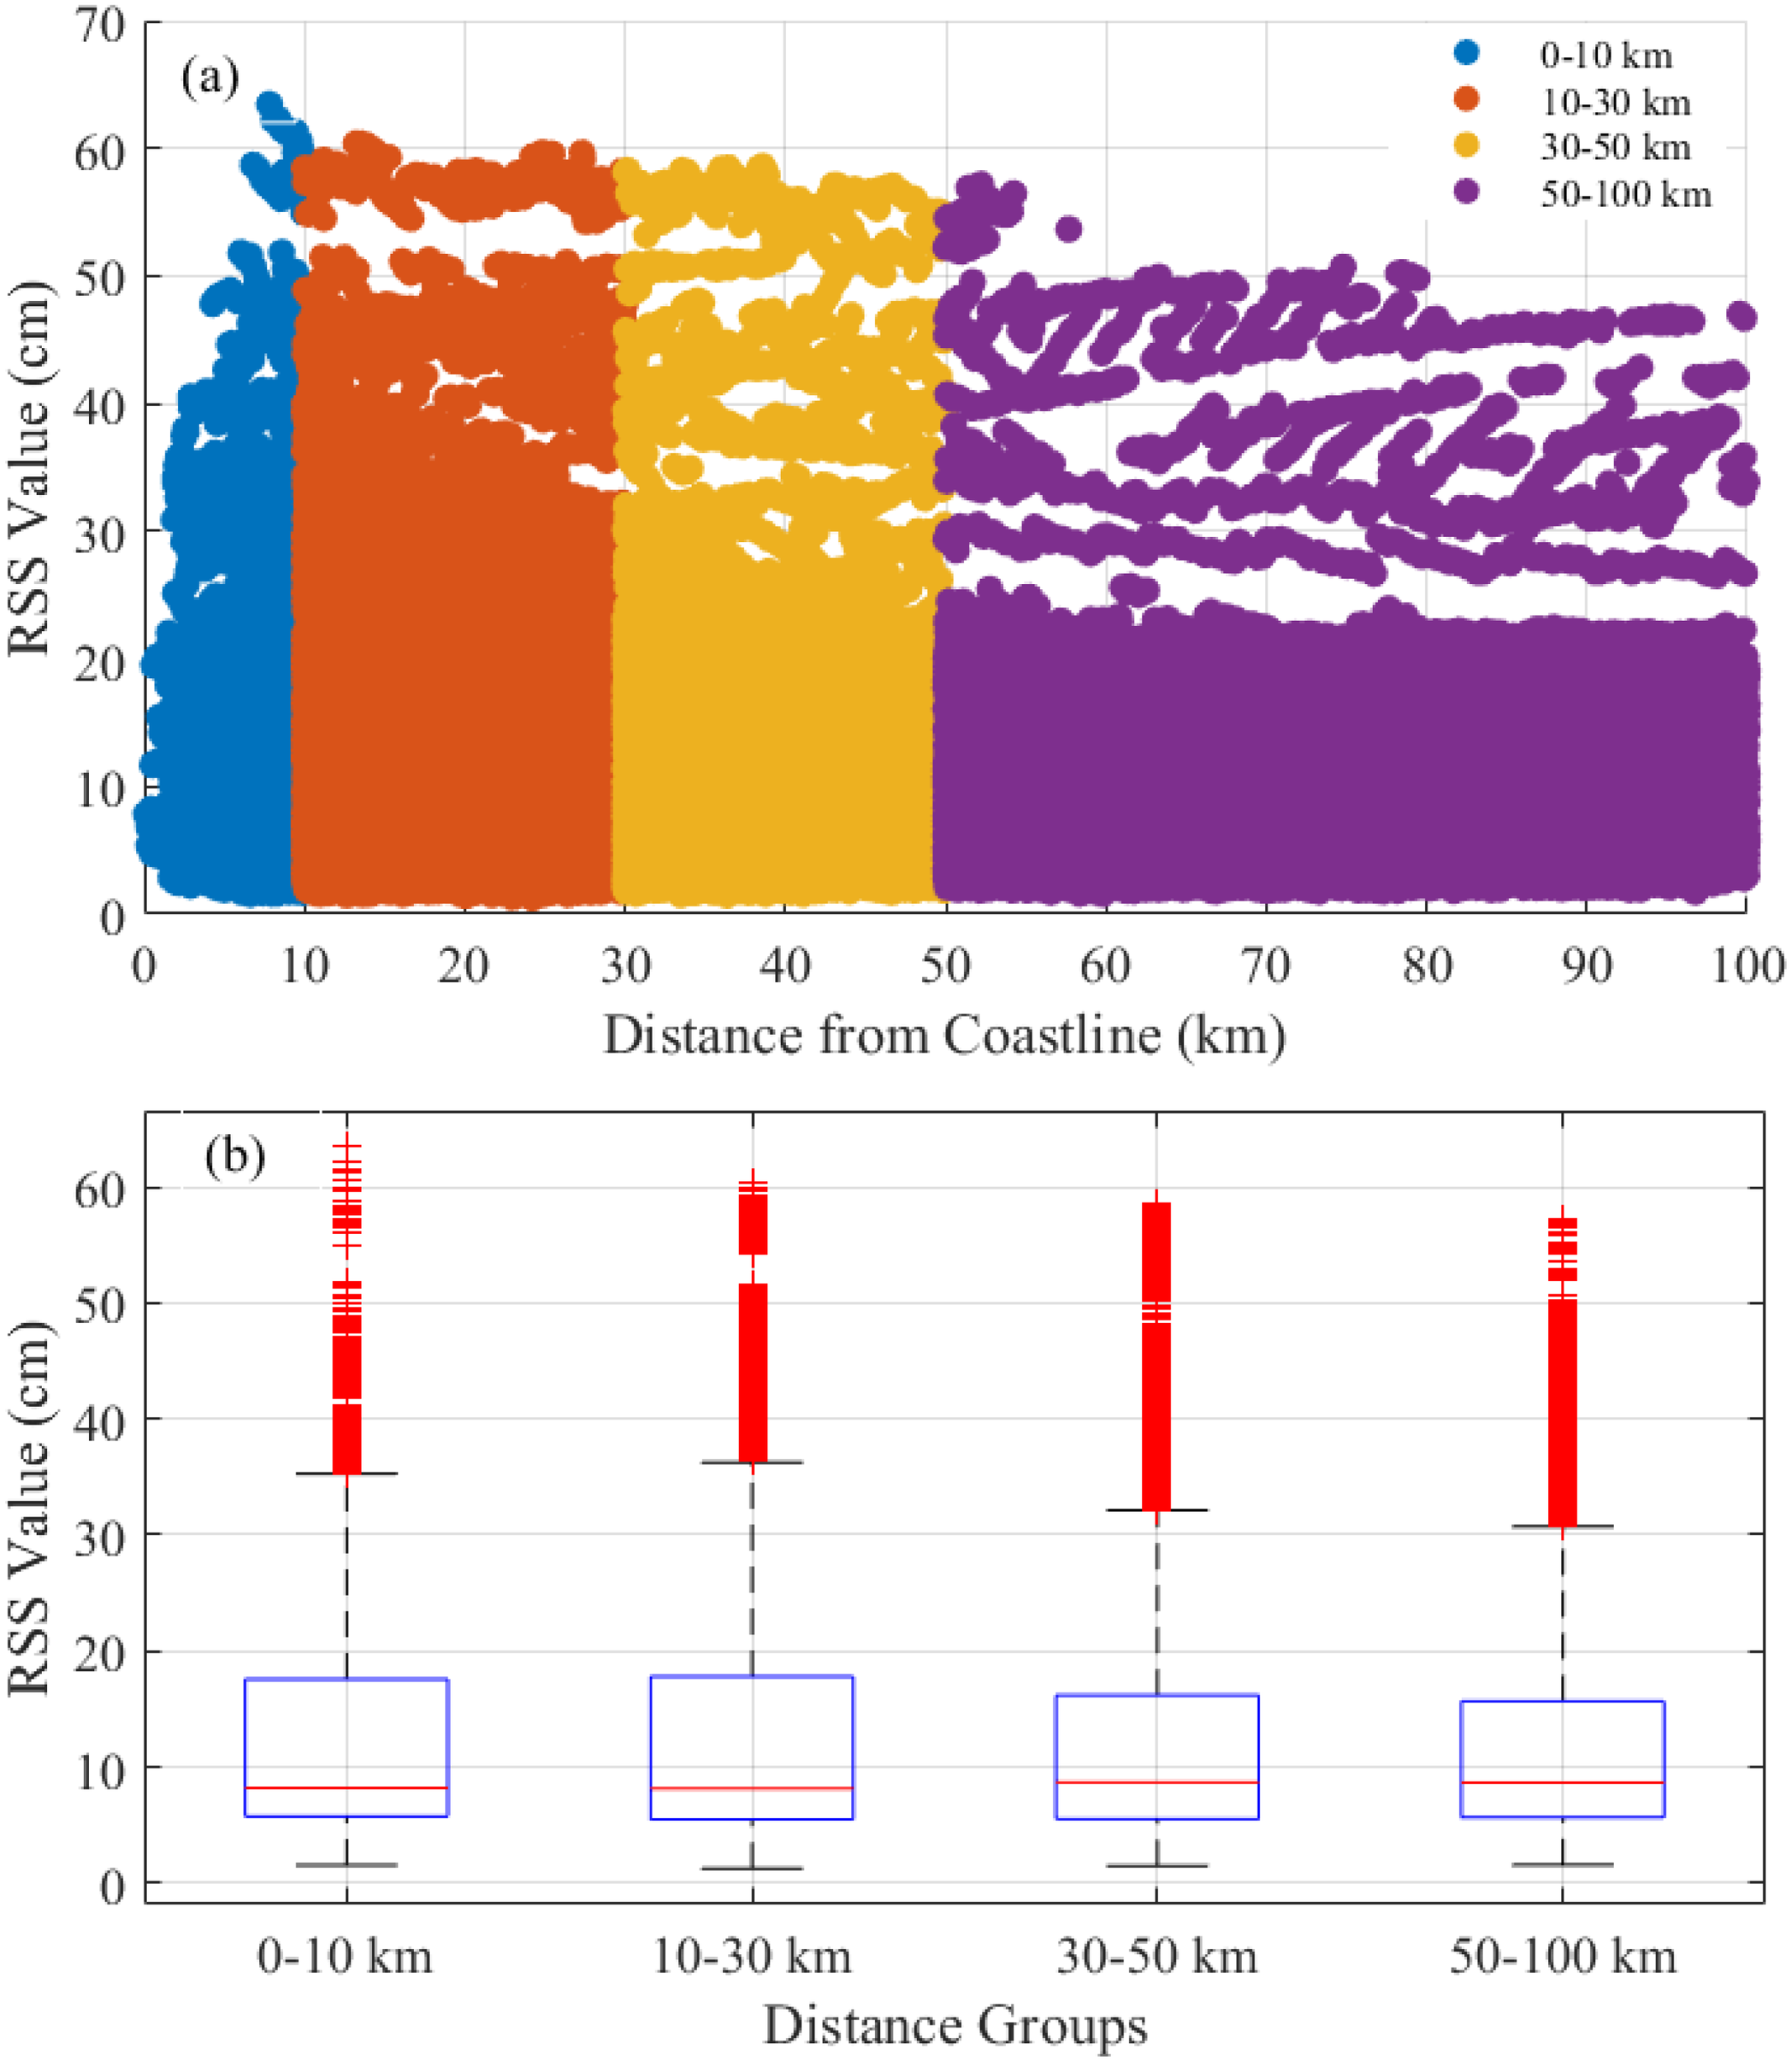
Spatial variation of RSS values between IAS2024 tidal information and DTU16 for eight tidal constituents as a function of distance from the coastline (km), with (a) RSS trends across different distance ranges and (b) boxplot analysis of RSS value distributions.
As shown in Figure 9b, the analysis based on boxplots reveals significant differences in the distribution characteristics of values across the different distance ranges. Within the 0–10 km range, the median of the data is relatively low, and the box height is small, indicating a concentrated and stable distribution. The interquartile range (IQR) is narrow, with 25%-75% of the data clustered within a compact interval. Although there are a few outliers, the overall distribution shows weak skewness, suggesting high stability within this range. In contrast, for the 10–30 km and 30–50 km ranges, the median gradually increases, and the box height expands, indicating a broader distribution and greater data dispersion as the distance from the coastline increases. However, the number of outliers remains relatively low, maintaining some degree of regularity. Notably, the data distribution in the 50–100 km range shows considerable heterogeneity, with the largest box length and a significant increase in the number of outliers, reflecting extreme variability and uncertainty in this distant region.
From the distribution characteristics of the outliers, both the 0–10 km and 50–100 km ranges exhibit outliers, but their causes appear fundamentally different. In the 0–10 km range, outliers are concentrated near the lower edge of the box, which could be related to localized disturbances in environmental factors, such as nearshore hydrological conditions. In contrast, outliers in the 50–100 km range are primarily distributed near the upper edge of the box, suggesting the possibility of systematic interference in distant regions, such as instrumental errors or complex topographic effects.
A synergistic analysis of the central tendency and dispersion of the data reveals a distinctive pattern: low median values and high concentration in the 0–10 km range. Despite the lower absolute values in this region, the smaller IQR and limited outlier range imply predictable and repeatable data distribution characteristics. In comparison, the higher median values in the 50–100 km range, coupled with greater data dispersion, introduce significantly more uncertainty in statistical inference. This paradox suggests that while the higher mean values in distant regions may reflect broader environmental influences, they come at the cost of stability, whereas the lower mean values in the 0–10 km range indicate more robust and reliable measurements.
Overall, the data within the 0–10 km range show significant advantages: its compact box structure, limited outlier distribution, and stable median position collectively indicate high reliability in measurements within this region. This characteristic may result from the relative uniformity of physical parameters in nearshore environments or the optimized adaptability of monitoring technologies in this distance range.
5 Conclusions
This study utilizes the IAS2024 dataset for the first time to systematically extract tidal constituents within 100 km of global coastlines, enhancing the accuracy of tidal information in nearshore regions. The accuracy of the extracted tidal data is evaluated against four global tidal models (DTU16, EOT20, FES2014b, and FES2022). Results show that IAS2024 exhibits the highest agreement with the DTU16 model, with the lowest RSS error of 11.23 cm across eight major tidal constituents (Q1, O1, P1, K1, N2, M2, S2, and K2). Additionally, when compared to 164 tide gauge stations within 20 km of satellite altimetry tracks, 89.6% of stations exhibit errors below 20 cm, demonstrating strong consistency between IAS2024 and in situ observations.
For long-period constituents, the IAS2024 dataset successfully extracts the Sa and Ssa tidal constituents within the latitude range of 66°S–66°N and analyzes their spatial distributions in terms of amplitude and phase lag. The results show that the maximum amplitude for Sa is 38.22 cm, while for Ssa it is 15.17 cm, with both constituents displaying smooth spatial variations and small gradients over large scales. A comparison with EOT20 and FES2022 at tide gauge locations further confirms that IAS2024 outperforms traditional tidal models in both amplitude and phase accuracy, validating its advantage in extracting long-period tidal signals.
In high-latitude regions, this study evaluates the variation of REs in the M2 tidal constituent amplitude relative to the distance from the coastline. The results indicate that satellite altimetry data within 0–10 km of the shore provide the most accurate tidal information. The overall RSS error decreases with increasing distance from the coast, suggesting that nearshore environmental complexity significantly influences tidal extraction accuracy. The high-density data distribution in IAS2024 within nearshore zones contributes to more stable tidal signal retrieval.
Overall, the IAS2024 dataset demonstrates superior performance in global nearshore tidal information extraction, particularly for coastal areas, long-period tidal inversion, and high-latitude tidal analysis. Future research should incorporate multi-mission satellite altimetry data (e.g., Sentinel-3A/B, SWOT) to further optimize tidal inversion accuracy. Additionally, integrating tide gauge observations will improve the ability to resolve climate-related long-period tidal components, providing more precise tidal data to support global sea level change studies.
Statements
Data availability statement
The original contributions presented in the study are included in the article/Supplementary Material. Further inquiries can be directed to the corresponding author.
Author contributions
YF: Software, Writing – original draft, Data curation, Validation. PW: Validation, Writing – review & editing. FP: Supervision, Methodology, Resources, Writing – review & editing. YFE: Software, Validation, Writing – review & editing. MK: Validation, Writing – review & editing, Software. XM: Software, Writing – review & editing, Validation.
Funding
The author(s) declare that financial support was received for the research and/or publication of this article. This research is funded by the Basic Scientific Fund for National Public Research Institutes of China (No. 2023Q05); the National Natural Science Foundation of China (No. 42376185, 42404052, and 42104035); the Shandong Provincial Natural Science Foundation of China (ZR2023MD073).
Acknowledgments
The authors would like to express their gratitude to the organizations that provided valuable data for this work, including the providers of the global tidal models and the TICON dataset for the harmonic constants. Additionally, we acknowledge the support of GESLA Version 3 (https://www.bodc.ac.uk/data/published_data_library/catalogue/10.5285/d21a496a-a48e-1f21-e053-6c86abc08512) for the steric data, which was crucial for this study.
Conflict of interest
The authors declare that the research was conducted in the absence of any commercial or financial relationships that could be construed as a potential conflict of interest.
Generative AI statement
The author(s) declare that no Generative AI was used in the creation of this manuscript.
Publisher’s note
All claims expressed in this article are solely those of the authors and do not necessarily represent those of their affiliated organizations, or those of the publisher, the editors and the reviewers. Any product that may be evaluated in this article, or claim that may be made by its manufacturer, is not guaranteed or endorsed by the publisher.
References
1
Andersen O. B. Piccioni G. (2016). Recent Arctic Sea level variations from satellites. Front. Mar. Sci.3, 76. doi: 10.3389/fmars.2016.00076
2
Bij de Vaate I. Slobbe D. C. Verlaan M. (2022). Secular trends in global tides derived from satellite radar altimetry. J. Geophys. Res. Ocean.127, 2022–018845. doi: 10.1029/2022JC018845
3
Cheng Y. Andersen O. B. (2011). Multimission empirical ocean tide modeling for shallow waters and polar seas. J. Geophy. Res. Ocean.116, C11001. doi: 10.1029/2011JC007172
4
Egbert G. D. Erofeeva S. Y. (2002). Efficient inverse modeling of barotropic ocean tides. J. Atmos. Ocean. Tech.19, 183–204. doi: 10.1175/1520-0426(2002)019(0183:EIMOBO)2.0.CO;2
5
Gommenginger C. Thibaut P. Fenoglio-Marc L. Quartly G. Deng X. Gómez-Enri J. et al . (2011). “Retracking altimeter waveforms near the coasts,” in Coastal altimetry. Eds. VignudelliS.KostianoyA. G.CipolliniP.BenvenisteJ. (Springer, Berlin/Heidelberg, Germany), 61–101.
6
Guarneri H. Verlaan M. Slobbe D. C. Veenstra J. Zijl F. Pietrzak J. et al . (2023). The impact of nonlinear tide–surge interaction on satellite radar altimeter-derived tides. Mar. Geod.46, 251–270. doi: 10.1080/01490419.2023.2175084
7
Haigh I. D. Marcos M. Talke S. A. Woodworth P. L. Hunter J. R. Hague B. S. et al . (2023). GESLA Version 3: A major update to the global higher-frequency sea-level dataset. Geosci. Data J.10, 293–314. doi: 10.1002/gdj3.174
8
Hart-Davis M. G. Andersen O. B. Ray R. D. Zaron E. D. Schwatke C. Arildsen R. L. et al . (2024). Tides in complex coastal regions: early case studies from wide-swath SWOT measurements. Geophy. Res. Lett.51, e2024GL109983. doi: 10.1029/2024GL109983
9
Hart-Davis M. G. Dettmering D. Seitz F. (2022). TICON-3: Tidal constants based on GESLA-3 sea-level records from globally distributed tide gauges including gauge type information (data). Deutsches Geodätisches Forschungsinstitut. doi: 10.1594/PANGAEA.946889
10
Hart-Davis M. G. Laan S. Schwatke C. Backeberg B. Dettmering D. Zijl F. et al . (2023). Altimetry-derived tide model for improved tide and water level forecasting along the European continental shelf. Ocean Dynamics73, 475–491. doi: 10.1007/s10236-023-01560-0
11
Lyard F. H. Allain D. J. Cancet M. Carrère L. Picot N. (2021). FES2014 global ocean tide atlas: Design and performance. Ocean Sci.17, 615–649. doi: 10.5194/os-17-615-2021
12
Passaro M. Cipollini P. Vignudelli S. Quartly G. D. Snaith H. M. (2014). ALES: A multi-mission adaptive subwaveform retracker for coastal and open ocean altimetry. Remote Sens. Environ.145, 173–189. doi: 10.1016/j.rse.2014.02.008
13
Peng F. K. Deng X. L. Shen Y. Z. Cheng X. (2024). The IAS2024 coastal sea level dataset and first evaluations. Zenodo. doi: 10.5281/zenodo.13208305
14
Piccioni G. Dettmering D. Passaro M. Schwatke C. Bosch W. Seitz F. (2018). Coastal improvements for tide models: the impact of ALES retracker. Remote Sens.10, 700. doi: 10.3390/rs10050700
15
Pugh D. Woodworth P. (2014). Sea-level science: Understanding tides, surges, tsunamis and mean sea-level changes (Cambridge: Cambridge University Press). doi: 10.1017/cbo9781139235778
16
Ray R. D. (1999). “A global ocean tide model from TOPEX/POSEIDON altimetry: GOT99.2,” in Technical report, Goddard Space Flight Center, Greenbelt. NASA Tech. Memo 209478, 58.
17
Ray R. D. Egbert G. D. Erofeeva S. Y. (2011). Tide predictions in shelf and coastal waters: status and prospects; In Coastal Altimetry (Eds: VignudelliS.et al.) Springer-Verlag, pp. 191–216.
18
Schlembach F. Ehlers F. Kleinherenbrink M. Passaro M. Dettmering D. Seitz F. et al . (2023). Benefits of fully focused SAR altimetry to coastal wave height estimates: A case study in the North Sea. Remote Sens. Environ.289, 113517. doi: 10.1016/j.rse.2023.113517
19
Seifi F. Filmer M. (2023). Residual M2 and S2 ocean tide signals in complex coastal zones identified by X-Track reprocessed altimetry data. Continental Shelf Res.261, 105013. doi: 10.1016/j.csr.2023.105013
20
Shum C. K. Woodworth P. L. Andersen O. B. Egbert G. D. Francis O. King C. et al . (1997). Accuracy assessment of recent ocean tide models. J. Geophys. Res.102, 25173–25194. doi: 10.1029/97JC00445
21
Vignudelli S. Birol F. Benveniste J. Fu L.-L. Picot N. Raynal M. et al . (2019). Satellite altimetry measurements of sea level in the coastal zone. Surv. Geophys.40, 1319–1349. doi: 10.1007/s10712-019-09569-1
22
Woodworth P. L. Hunter J. R. Marcos M. Caldwell P. Menendez M. Haigh. I. (2016). Towards a global higher-frequency sea level dataset. Geosci. Data J.3, 50–59. doi: 10.1002/gdj3.42
23
Xu X. Pan H. Teng F. Wei. Z. (2024). A comparison of global and regional ocean tide models with tide gauges in the East Asian marginal seas. J. Sea Res.201, 102527. doi: 10.1016/j.seares.2024.102527
Summary
Keywords
coastal tides, satellite altimetry, IAS2024, tidal models, long-period tides
Citation
Fu Y, Wang P, Peng F, Feng Y, Khaki M and Mi X (2025) Accurate extraction of ocean tidal constituents from coastal satellite altimeter records. Front. Mar. Sci. 12:1592765. doi: 10.3389/fmars.2025.1592765
Received
13 March 2025
Accepted
09 May 2025
Published
29 May 2025
Volume
12 - 2025
Edited by
Li Yineng, Chinese Academy of Sciences (CAS), China
Reviewed by
Peter Tian-Yuan Shih, National Yang Ming Chiao Tung University, Taiwan
Zhen Guo, University of British Columbia, Canada
Updates
Copyright
© 2025 Fu, Wang, Peng, Feng, Khaki and Mi.
This is an open-access article distributed under the terms of the Creative Commons Attribution License (CC BY). The use, distribution or reproduction in other forums is permitted, provided the original author(s) and the copyright owner(s) are credited and that the original publication in this journal is cited, in accordance with accepted academic practice. No use, distribution or reproduction is permitted which does not comply with these terms.
*Correspondence: Yikai Feng, ykfeng@fio.org.cn
Disclaimer
All claims expressed in this article are solely those of the authors and do not necessarily represent those of their affiliated organizations, or those of the publisher, the editors and the reviewers. Any product that may be evaluated in this article or claim that may be made by its manufacturer is not guaranteed or endorsed by the publisher.