 Yinjie Zhang1,2,3,4†
 Haitao Ma2,3,4,5,6,7†
 Chenghui Han2,3,4,5,6,7Zhen Zhao1,2,3,4Zonglu Wei1,2,3,4Xixi Duan2,3,4,5,6,7
 Jiangwei Li1,2,3,4
 Yanping Qin2,3,4,5,6,7
 Jun Li2,3,4,5,6,7
 Ziniu Yu2,3,4,5,6,7
 Ying Pan1*
 Yuehuan Zhang2,3,4,5,6,7*
- 1College of Animal Science and Technology, Guangxi University, Nanning, China
- 2Key Laboratory of Tropical Marine Bio-resources and Ecology (CAS), Guangdong Provincial Key Laboratory of Applied Marine Biology, South China Sea Institute of Oceanology, Guangzhou, China
- 3Daya Bay Marine Biology Research Station, Chinese Academy of Sciences, Shenzhen, China
- 4Innovation Academy of South China Sea Ecology and Environmental Engineering, Chinese Academy of Sciences, Guangzhou, China
- 5Hainan Provincial Key Laboratory of Tropical Marine Biology Technology, Marine Eco-environment Engineering Research Institute, Tropical Marine Biological Research Station in Hainan, Chinese Academy of Sciences, Sanya, China
- 6Agro-Tech Extension Center of Guangdong Province, Guangzhou, China
- 7Shenzhen Institute of Guangdong Ocean University, Shenzhen, China
Saccostrea mordax is an ecologically important bivalve species and a potential genetic resource for oyster breeding that inhabit in the Indo-Western Pacific region, characterized by three distinct lineages: A, B, and C. However, limited information is available about its genetic variation and genetic structure. The present study was conducted to study genetic diversity and population structure of S. mordax lineages A, B, and C based on mitochondrial COI gene data across the South China Sea and Celebes Sea. The UPGMA phylogenetic tree among populations, BI phylogenetic tree among individuals and median network revealed three main clusters, corresponding to S. mordax lineages A, B, and C. The results of K2P sequence divergence, pairwise Φst, gene flow and AMOVA indicated clear genetic differences among the lineages, combined with sympatric in all 7 geographical populations, these suggests lineages A and B are transitional periods of new species formation. Moreover, different patterns of population subdivision were found within lineages A, B and C. In lineage A, significant genetic differentiation was only observed between YM (Celebes Sea) and other populations (South China Sea), with a significant correlation between geographical distance and genetic distance among populations. In lineages B and C, there was no genetic differentiation between YM (Celebes Sea) and other populations (South China Sea), and no significant correlation between genetic distance and geographical distance among populations. The population history analyses indicated that populations of lineage A have experienced a recent sudden expansion, while populations of lineages B and C were large stable. These findings are essential for the conservation, sustainable utilization, and ecological restoration of S. mordax.
1 Introduction
Oysters are of considerable economic value and play a pivotal role in the global aquaculture industry. In addition, they possess significant ecological importance (Klinbunga et al., 2003). Many oysters are important in aquaculture, with notable examples including the Hong Kong oyster (Crassostrea hongkongensis) (Langdon et al., 2003) and the Pacific oyster (Crassostrea gigas) (Hubert et al., 2009). As sessile organisms inhabiting estuarine and intertidal habitats, oysters play an integral role in the ecological dynamics of the shoreline. They offer a range of ecological benefits, including providing shelter, contributing to fisheries, facilitating water filtration, stabilizing shorelines, and acting as a coastal defence mechanism (Council, 2010). However, due to overfishing and human-induced habitat degradation, oyster populations have experienced significant declines worldwide (Beck et al., 2009). As a result, oyster reef ecosystems are considered among the most endangered and threatened marine ecosystems globally (Gillies et al., 2020).
Saccostrea mordax is a unique oyster species, characterized by three distinct lineages A, B and C (Lam and Morton, 2006; Sekino and Yamashita, 2013, 2016). Recent study suggests that lineage A and lineage B belong to the confirmed species S. mordax, while lineage C represents a new species of Saccostrea (Cui et al., 2021). S. mordax is widespread in the Indo-Western Pacific region, especially in southern China (Hainan, Guangxi, and Guangdong) and the intertidal and upper intertidal zones of rocky reefs in tropical Pacific island nations (Cui et al., 2021; Lu et al., 2024). It exhibits strong environmental tolerance, such as resistance to heat and desiccation, and can adapt well to oligotrophic environments. Despite its potential, S. mordax is not widely used in fisheries due to its small size, slow growth, and limited commercial value. Nevertheless, it holds significant aquaculture potential and ecological importance as a bivalve shellfish (Guo et al., 2024). Moreover, it is highly adaptable to island environments and is an important reef-building species for the protection of island coastlines.
Research on S. mordax remains limited. Some studies have preliminary clarified the confusing taxonomic status of Saccostrea oysters, providing a foundation for biodiversity surveys, conservation, ecological research, and aquaculture (Cui et al., 2021; Ghaffari et al., 2022; Lu et al., 2011). Research on the karyotype and chromosomal localization of its nuclear acid and major rRNA genes has also been conducted (Lu et al., 2011), and bidirectional sex change in S. mordax has been studied as well (Yasuoka and Yusa, 2017). Our team developed an artificial seedling technology using a one-step salinity reduction method and successfully achieved the first artificial breeding of S. mordax. To date, in S. mordax, the application of the mitochondrial COI gene has primarily focus on phylogeny studies and species identification. However, no information is available on the application of the mitochondrial COI gene in the genetic diversity and population structure of S. mordax. In fact, no molecular markers have been developed and used in the population genetics of wild S. mordax populations across South China Sea and Celebes Sea.
Studies of genetic diversity and population structure are important for evaluating the breeding potential and ecological restoration status of an organism. The mitochondrial DNA (mtDNA) genetic marker offers several advantages, including a fast evolutionary rate, maternal inheritance, and significant intraspecific polymorphism compared to other genetic markers (Avise et al., 1987). These features make mtDNA a valuable tool in studies analyzing population genetic structure (Emelianova et al., 2022; Liu et al., 2021; Sultana et al., 2022; Wei et al., 2023; Zhang et al., 2022). As more researchers use mitochondrial genes to study the population genetics of Saccostrea species, our understanding of these species continues to expand. For instance, based on the data from mitochondrial COI and SNP analysis, Nowland et al. (2019) found a widespread distribution of S. echinata in the tropical Indian-Pacific region and the existence of genetically distinct populations. In et al. (2016) concluded that after several generations of mass selection in S. glomerata using COI and microsatellite markers, there was a significant decline in genetic diversity across four distinct lines, although the combined genetic diversity across multiple mass selection lines may still converge with that of the wild population or ancestral line.
In the present study, we used mitochondrial COI gene to perform a comprehensive investigation of genetic diversity and population structure of S. mordax lineages A, B, and C across the South China Sea and Celebes Sea. The findings of this research provide baseline information for the sustainable utilization, ecological restoration, and conservation of S. mordax in this region.
2 Materials and methods
2.1 Population sampling and DNA extraction
S. mordax speciments were randomly obtained from seven wild populations: Nanao, Shantou (SN), Dongchong, Shenzhen (SD), Wanshan Island, Zhuhai (ZW), Luhuitou, Sanya (SL), Yongxing Island, Xisha (XY), Meiji Reef, Nansha (NM), and Menado, Indonesia (YM) (Table 1, Figure 1). A total of 244 oyster samples (SL: 48, SD: 40, SN: 37, NM: 25, XY: 39, ZW: 33, YM: 22) were sequenced to detect the COI gene. All samples used in this study were divided into three lineages (A, B and C) of the S. mordax branch using COI as described by (Cui et al., 2021). The adductor muscles of fresh oysters were dissected and preserved in 75% ethanol at -20°C for future use. Genomic DNA was extracted from muscle tissue using the phenol-chloroform method (Li et al., 2006). DNA concentration and purity were determined using a NanoDrop2000 UV spectrophotometer, and DNA integrity was assessed by 1.0% agarose gel electrophoresis before storing at -20°C.
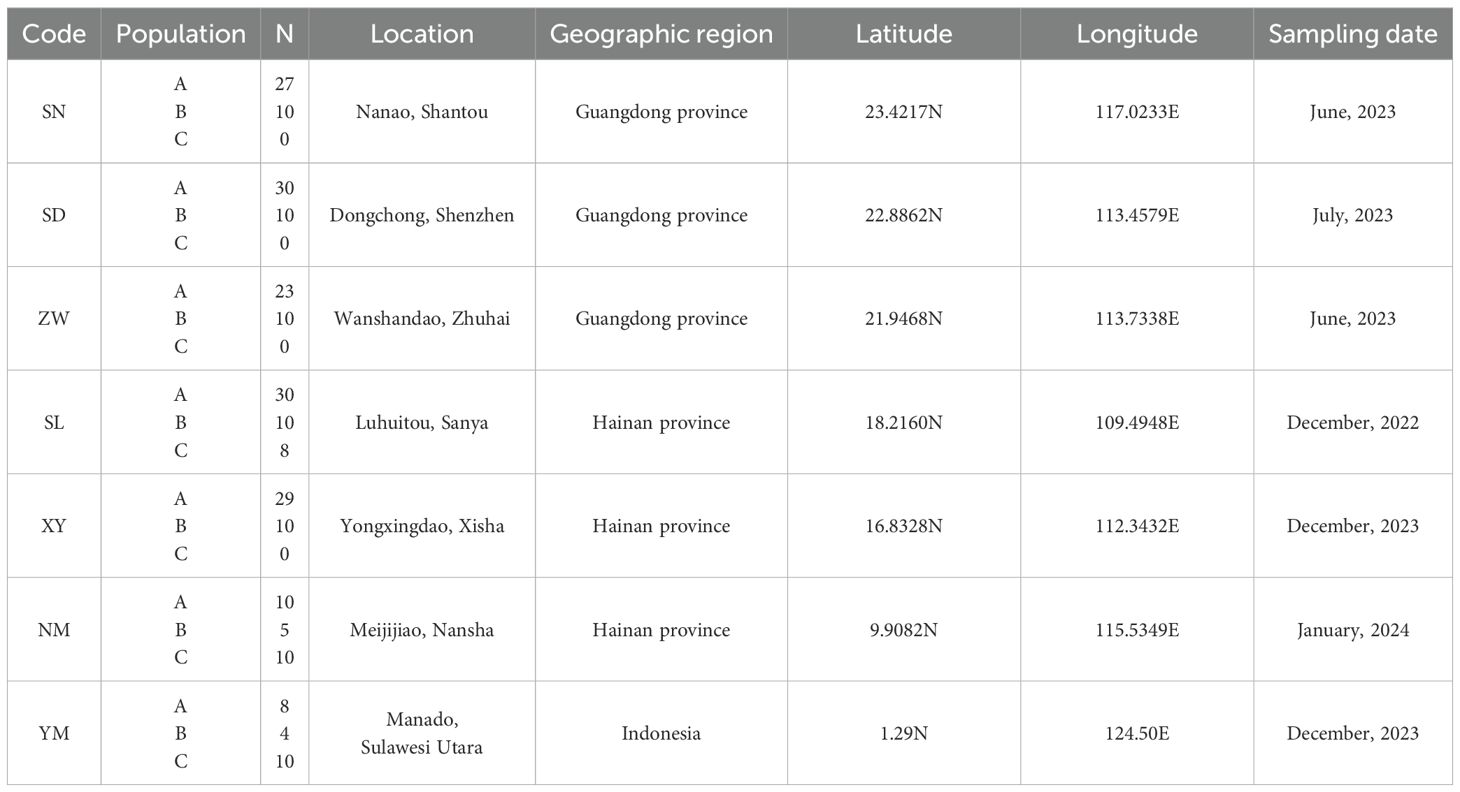
Table 1. Saccostrea mordax sampling information, including geographic region, GPS positions and date, population code and sample size.
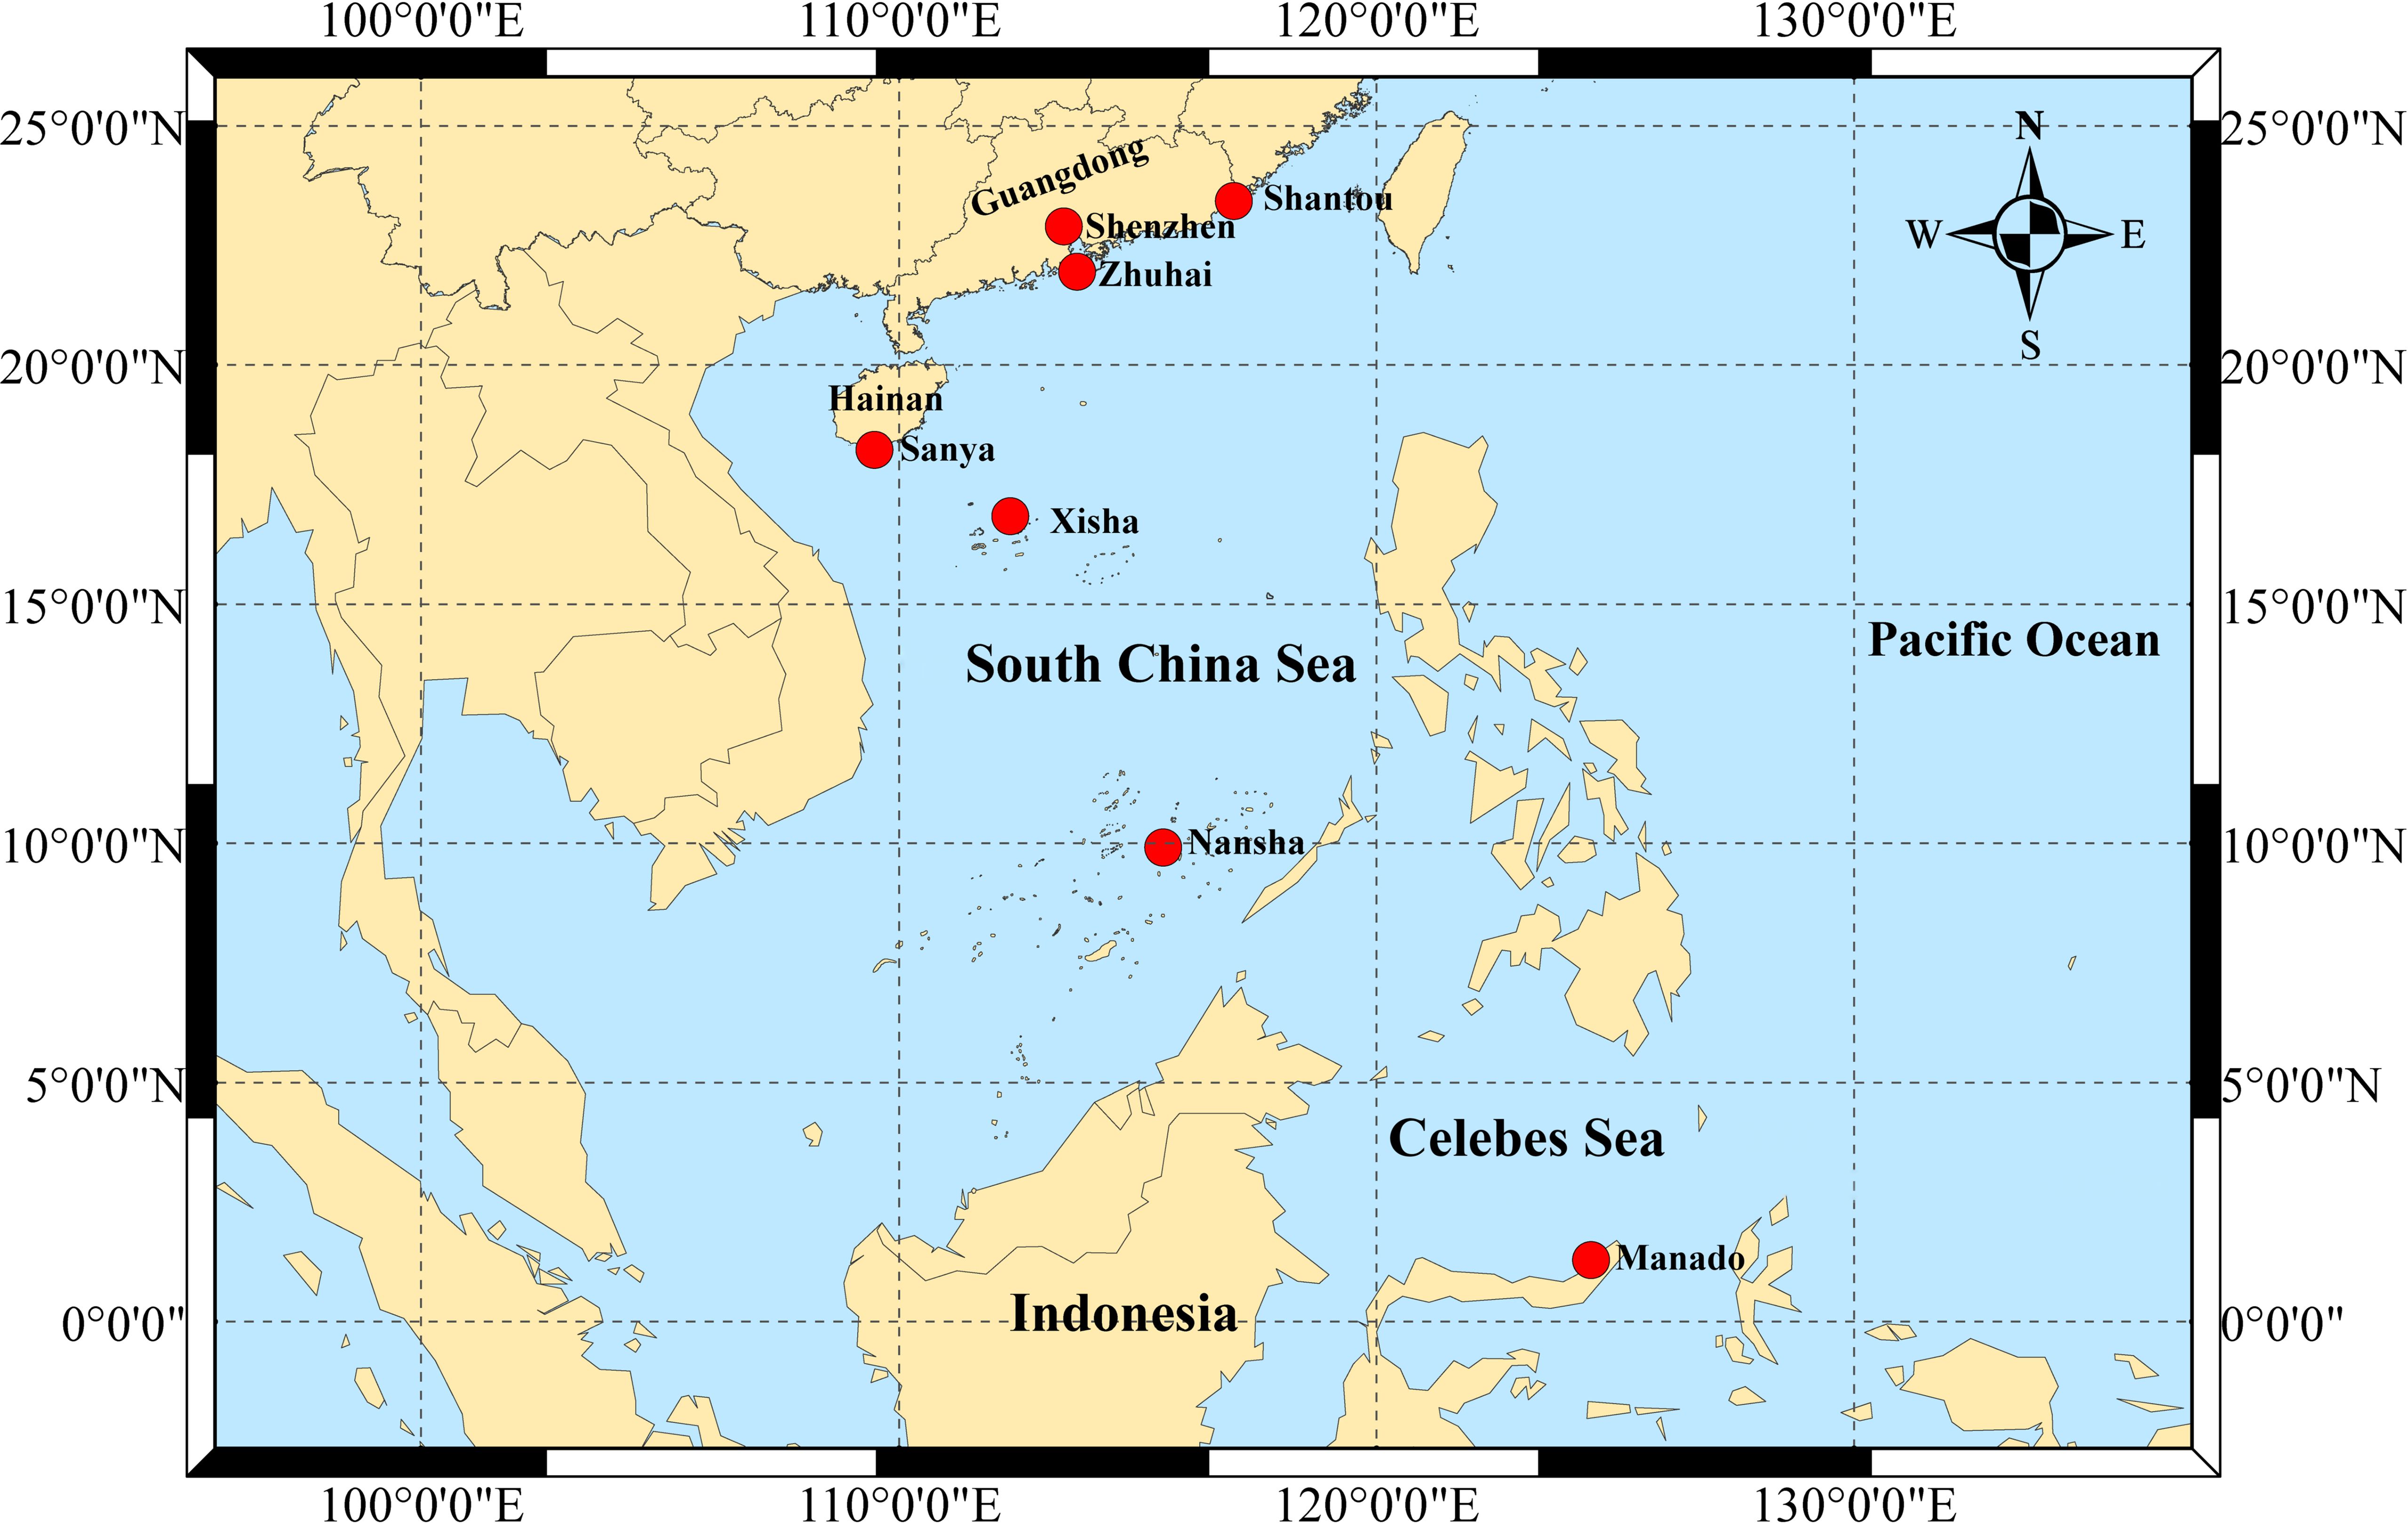
Figure 1. Map of sampling sites of Saccostrea mordax across South China Sea and Celebes Sea.
2.2 COI gene amplification and genotyping
Amplification of the COI gene segment was performed using the following primer pair: CF (COI) F/CF (COI) R: 5’-CGTCAGGATTTATAGAGTTTATAGATGCC-3’/5’GAAGAATTAGCACATATACCTCAGGATG3’, designed by primer 3, sequences were obtained from GenBank. PCR amplification was performed in a Veriti™ Thermal Cycler (Applied Biosystems, USA) with a 50 µL reaction volume. The PCR reaction mixture consisted of 2.0 mM MgCl2, 1.5 µl of template DNA, 0.5 µM of each primer, 200 µM of each dNTP, 0.03 U/µl 2×Taq PCR StarMix (Dye) (Genstar, China). The PCR amplification was conducted using a 96-well thermal cycler under the following conditions: initial denaturation at 94°C for 5 min, followed by 35 cycles of 30 s at 94°C for denaturation, 30 s at 55°C for annealing, and 1 min at 72°C for extension, with a final 10 min extension at 72°C. The PCR products were analysed via 1% agarose gel electrophoresis and sequenced using the ABI3730xl DNA Analyzer sequencer (Invitrogen Biotechnology Co., Ltd, USA) in both forward and reverse directions. All sequences were confirmed through comparison with known GenBank sequences and manually checked.
2.3 Analysis of genetic diversity and population genetic structure
Nucleotide sequences were aligned using ClustalX 2.0 (Larkin et al., 2007) and manually adjusted Sequences were trimmed using BioEdit (Hall, 1999) Version software to remove ambiguous or missing data, yielding a final fragment of 561 bp. The COI gene segment was validated through MEGA v11.0 software (Tamura et al., 2021). Haplotype diversity (Hd) and nucleotide diversity (π) were calculated using DnaSP (Librado and Rozas, 2009), while genetic differentiation between populations was assessed using pairwise Φst in Arlequin v3.5 (Excoffier and Lischer, 2010). The probability values were calculated using 10,000 random permutations. To access differentiation between geographical groups, analysis of molecular variance (AMOVA) was conducted in Arlequin v3.5. The relationship between genetic distance and geographical distance was tested using a Mantel test to confirm isolation by distance (IBD) (Mantel, 1967). Geographical distances were estimated as the shortest sea routes between locations, determined via Google Earth. The haplotype sequences have been submitted to GenBank under accession number PP989682-PP989794.
2.4 Neutral experiments and phylogenetic analyses
Historical demographic and spatial expansions were analysed using two statistical approaches in Arlequin v3.5. Specifically, Fu’s Fs (Fu, 1997) and Tajima’s D (Tajima, 1989a, 1989) tests were used to assess deviations from neutrality. Fu’s Fs test, which is highly sensitive to population demographic expansion, yielded strong negative Fs values, suggested that the possibility of demographic growth. Additionally, the negative Tajima’s D value, coupled with significant P values further supporting that the hypothesis of sudden population expansion could not be rejected. Moreover, the statistical analyses of mismatch distribution were also performed by Arlequin v3.5 with 10,000 permutations.
We used the Kimura (Kimura, 1980) two-parameter (K2P) model to calculate distances between populations and individuals. The phylogenetic relationship among individuals was examined by constructing a phylogenetic tree based on Bayesian inference (BI) in MrBayes with 1,000,000 Markov Chain Monte Carlo (MCMC) generations (Ronquist et al., 2012). A UPGMA phylogenetic tree among populations was constructed using K2P distances (Nei and Kumar, 2000). A median joining haplotype network was constructed from the mitochondrial COI sequence data using the PopART (Bandelt et al., 1999; Leigh et al., 2015) with the default settings.
3 Results
3.1 Genetic diversity analysis
A total of 118 polymorphic sites and 113 haplotypes were detected from the 561 bp COI sequences of 244 specimens (Table 2). Haplotypes 1–41 were found exclusively in the S. mordax lineage B, haplotypes 42–98 were found exclusively in lineage A, and the remaining haplotypes 99–113 were discovered in lineage C. There were no shared haplotypes among the three genetic lineages (A, B, and C). Of the 113 unique haplotypes, only 19 (16.8%) were shared among more than one population, while the majority were population-specific. In lineage A, H44 was the most widely distributed, found in all seven populations, H64 was present in five populations, while H43, H76, and H92 were distributed in three populations. In lineage B, H11 and H18 were found in four populations, while H16 was distributed in three populations. In lineage C, H99 and H107 were shared among all populations, while H104 was found in two populations. Furthermore, the number of polymorphic loci ranged from 7 to 24, with lineage B across seven geographic locations exhibiting highest levels of polymorphic loci.
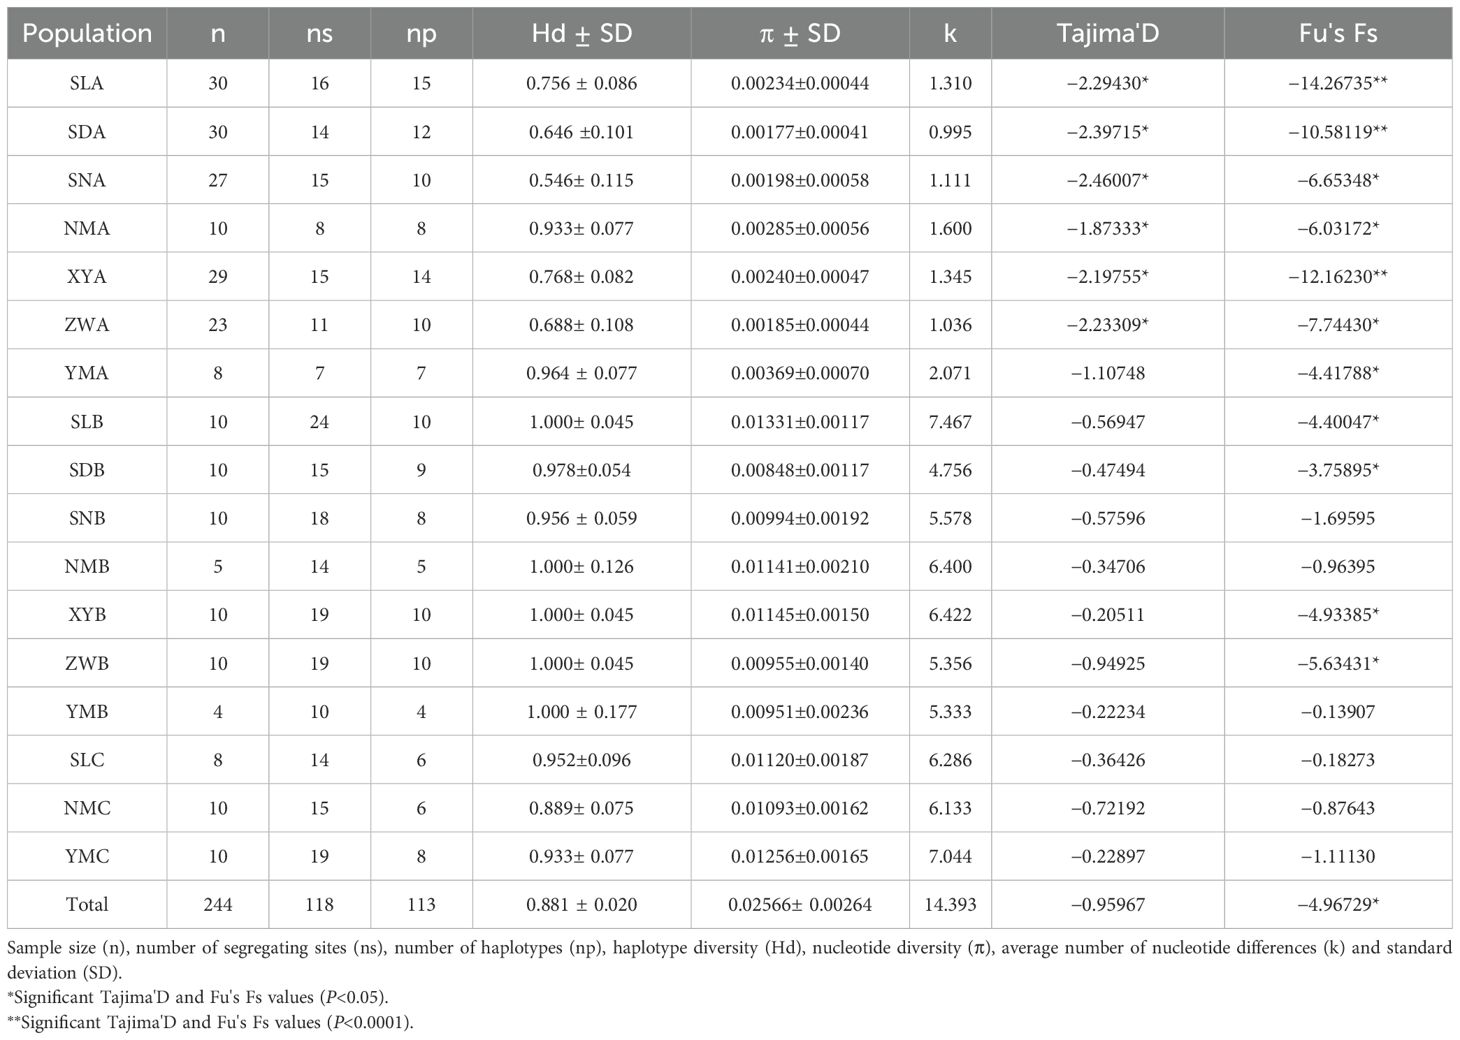
Table 2. Genetic diversity for populations of Saccostrea mordax obtained from mitochondrial cox1 gene.
The haplotype diversity (Hd) and nucleotide diversity (π) across all populations were 0.881 and 0.02566, respectively (Table 2). The haplotype diversity and nucleotide diversity in lineage B (Hd = 0.991, π = 0.01052) and lineage C (Hd = 0.925, π = 0.01156) were significantly higher than that in lineage A (Hd = 0.757, π = 0.00241). Moreover, the haplotype diversity and nucleotide diversity in lineages B and C ranged from 0.956 (SNB) to 1.000 (SLB, NMB, XYB, ZWB, YMB) and from 0.00848 (SDB) to 0.01331 (SLB), from 0.889 (NMC) to 0.952 (SLC) and from 0.01093 (NMC) to 0.01256 (YMC), respectively. The haplotype diversity and nucleotide diversity in the lineage A ranged from 0.546 (SNA) to 0.964 (YMA) and from 0.00177 (SDA) to 0.00369 (YMA).
3.2 Population structure
The variation in Φst values among populations was substantial, ranging from -0.1159 to 0.9797 (Table 3). Overall, populations of S. mordax lineages A, B, and C not only showed extremely significant differentiation but also exhibited a wide range of Φst values. In lineage A, significant genetic differentiation was found between YM (Celebes Sea) and other populations (South China Sea), while no genetic differentiation was observed among the other populations. In lineage B, significant genetic differentiation was found only between the SD and SN, SN and ZW populations, with no genetic differentiation among other populations. In lineage C, there was no genetic differentiation among three populations. Correspondingly, the results of gene flow among populations also confirmed the differentiation among populations.
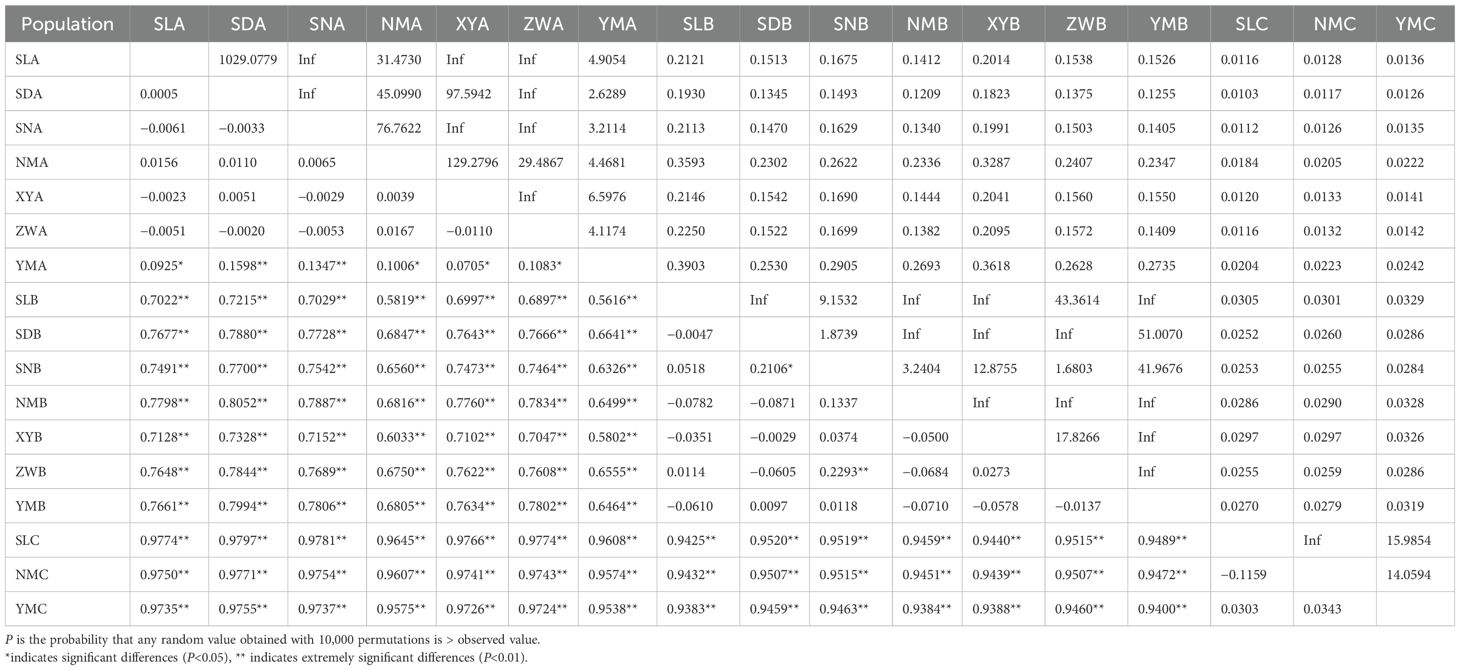
Table 3. The pairwise Φst (below the diagonal) and gene flow (above the diagonal) between populations of Saccostrea mordax..
The gene flow between lineages A, B, and C was less than 0.4. In lineage A, the gene flow between YM and other populations ranged from 2.6289-6.5976, while the gene flow among other populations ranged from 29.4867 to infinity. In lineage B, the gene flow between SD and SN populations, and SN and ZW populations, was 1.8739 and 1.6803, respectively, while the gene flow among other populations ranged from 3.2404 to infinity. In lineage C, the gene flow among three populations ranged from 14.0594 to infinity. The results of the AMOVA analysis on the sample groups (Table 4) indicate a high genetic variation between the three groups (88.05%), whereas the variation within the populations is lower at 11.45%. The result showed highly significant differences among groups (FCT = 0.8805, P = 0.0000) and within subpopulations relative to the total population (FST = 0.8855, P = 0.0000), but no differences among subpopulations relative to the groups (FSC = 0.0419, P = 0.1975).
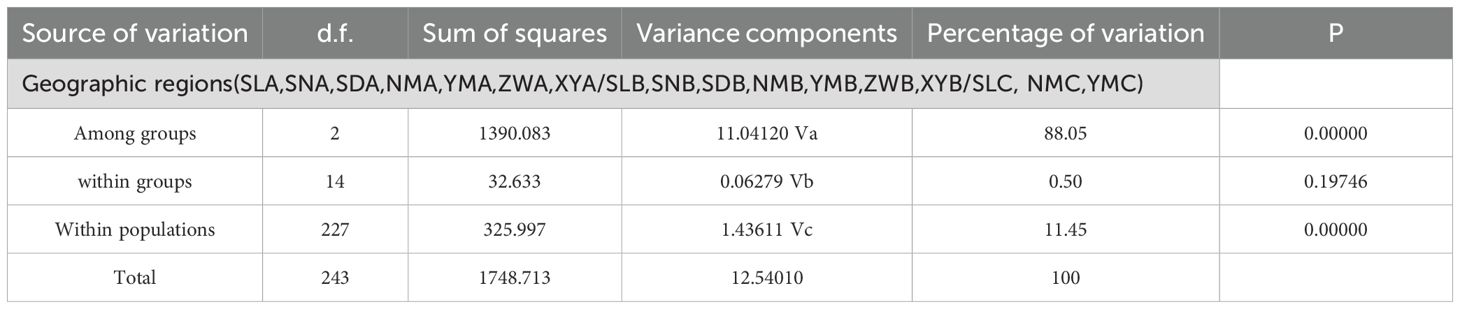
Table 4. Results of the analysis of molecular variance (AMOVA) for Saccostrea mordax populations.
The Mantel test revealed a significant correlation between genetic distance and geographical distance among populations of lineage A (r = 0.8807, P = 0.0016), but there was no significant correlation among populations of lineage B (r = -0.3012, P = 0.8935) and C (r = 0.6188, P = 0.1708).
3.3 Neutrality tests and phylogenetic analysis
Tajima’s D, which measures the difference between the number of segregating sites and pairwise genetic distances, produced negative values for all populations combined. Tajima’s D is significantly negative in all populations except YM of lineage A, but no significantly in all populations of lineages B and C. Fu’s Fs statistic was significantly negative for 11 of the 17 populations (Table 2), indicating non-equilibrium dynamics. Among them, all populations of lineage A were found to be significant, as were same populations (SL, SD, XY, and ZW) of lineage B. However, all populations of lineage C and the remaining populations (SN, NM and YM) of lineage B were not significant. Correspondingly, the mismatch distribution of lineage A was unimodal, supporting the hypothesis of the recent sudden expansion model. The mismatch distribution of lineage B was unimodal of normal distribution, supporting the hypothesis of the large stable after expansion in history. And, the mismatch distribution of lineage C was bimodal, supporting the hypothesis of the large stable population (Figure 2).
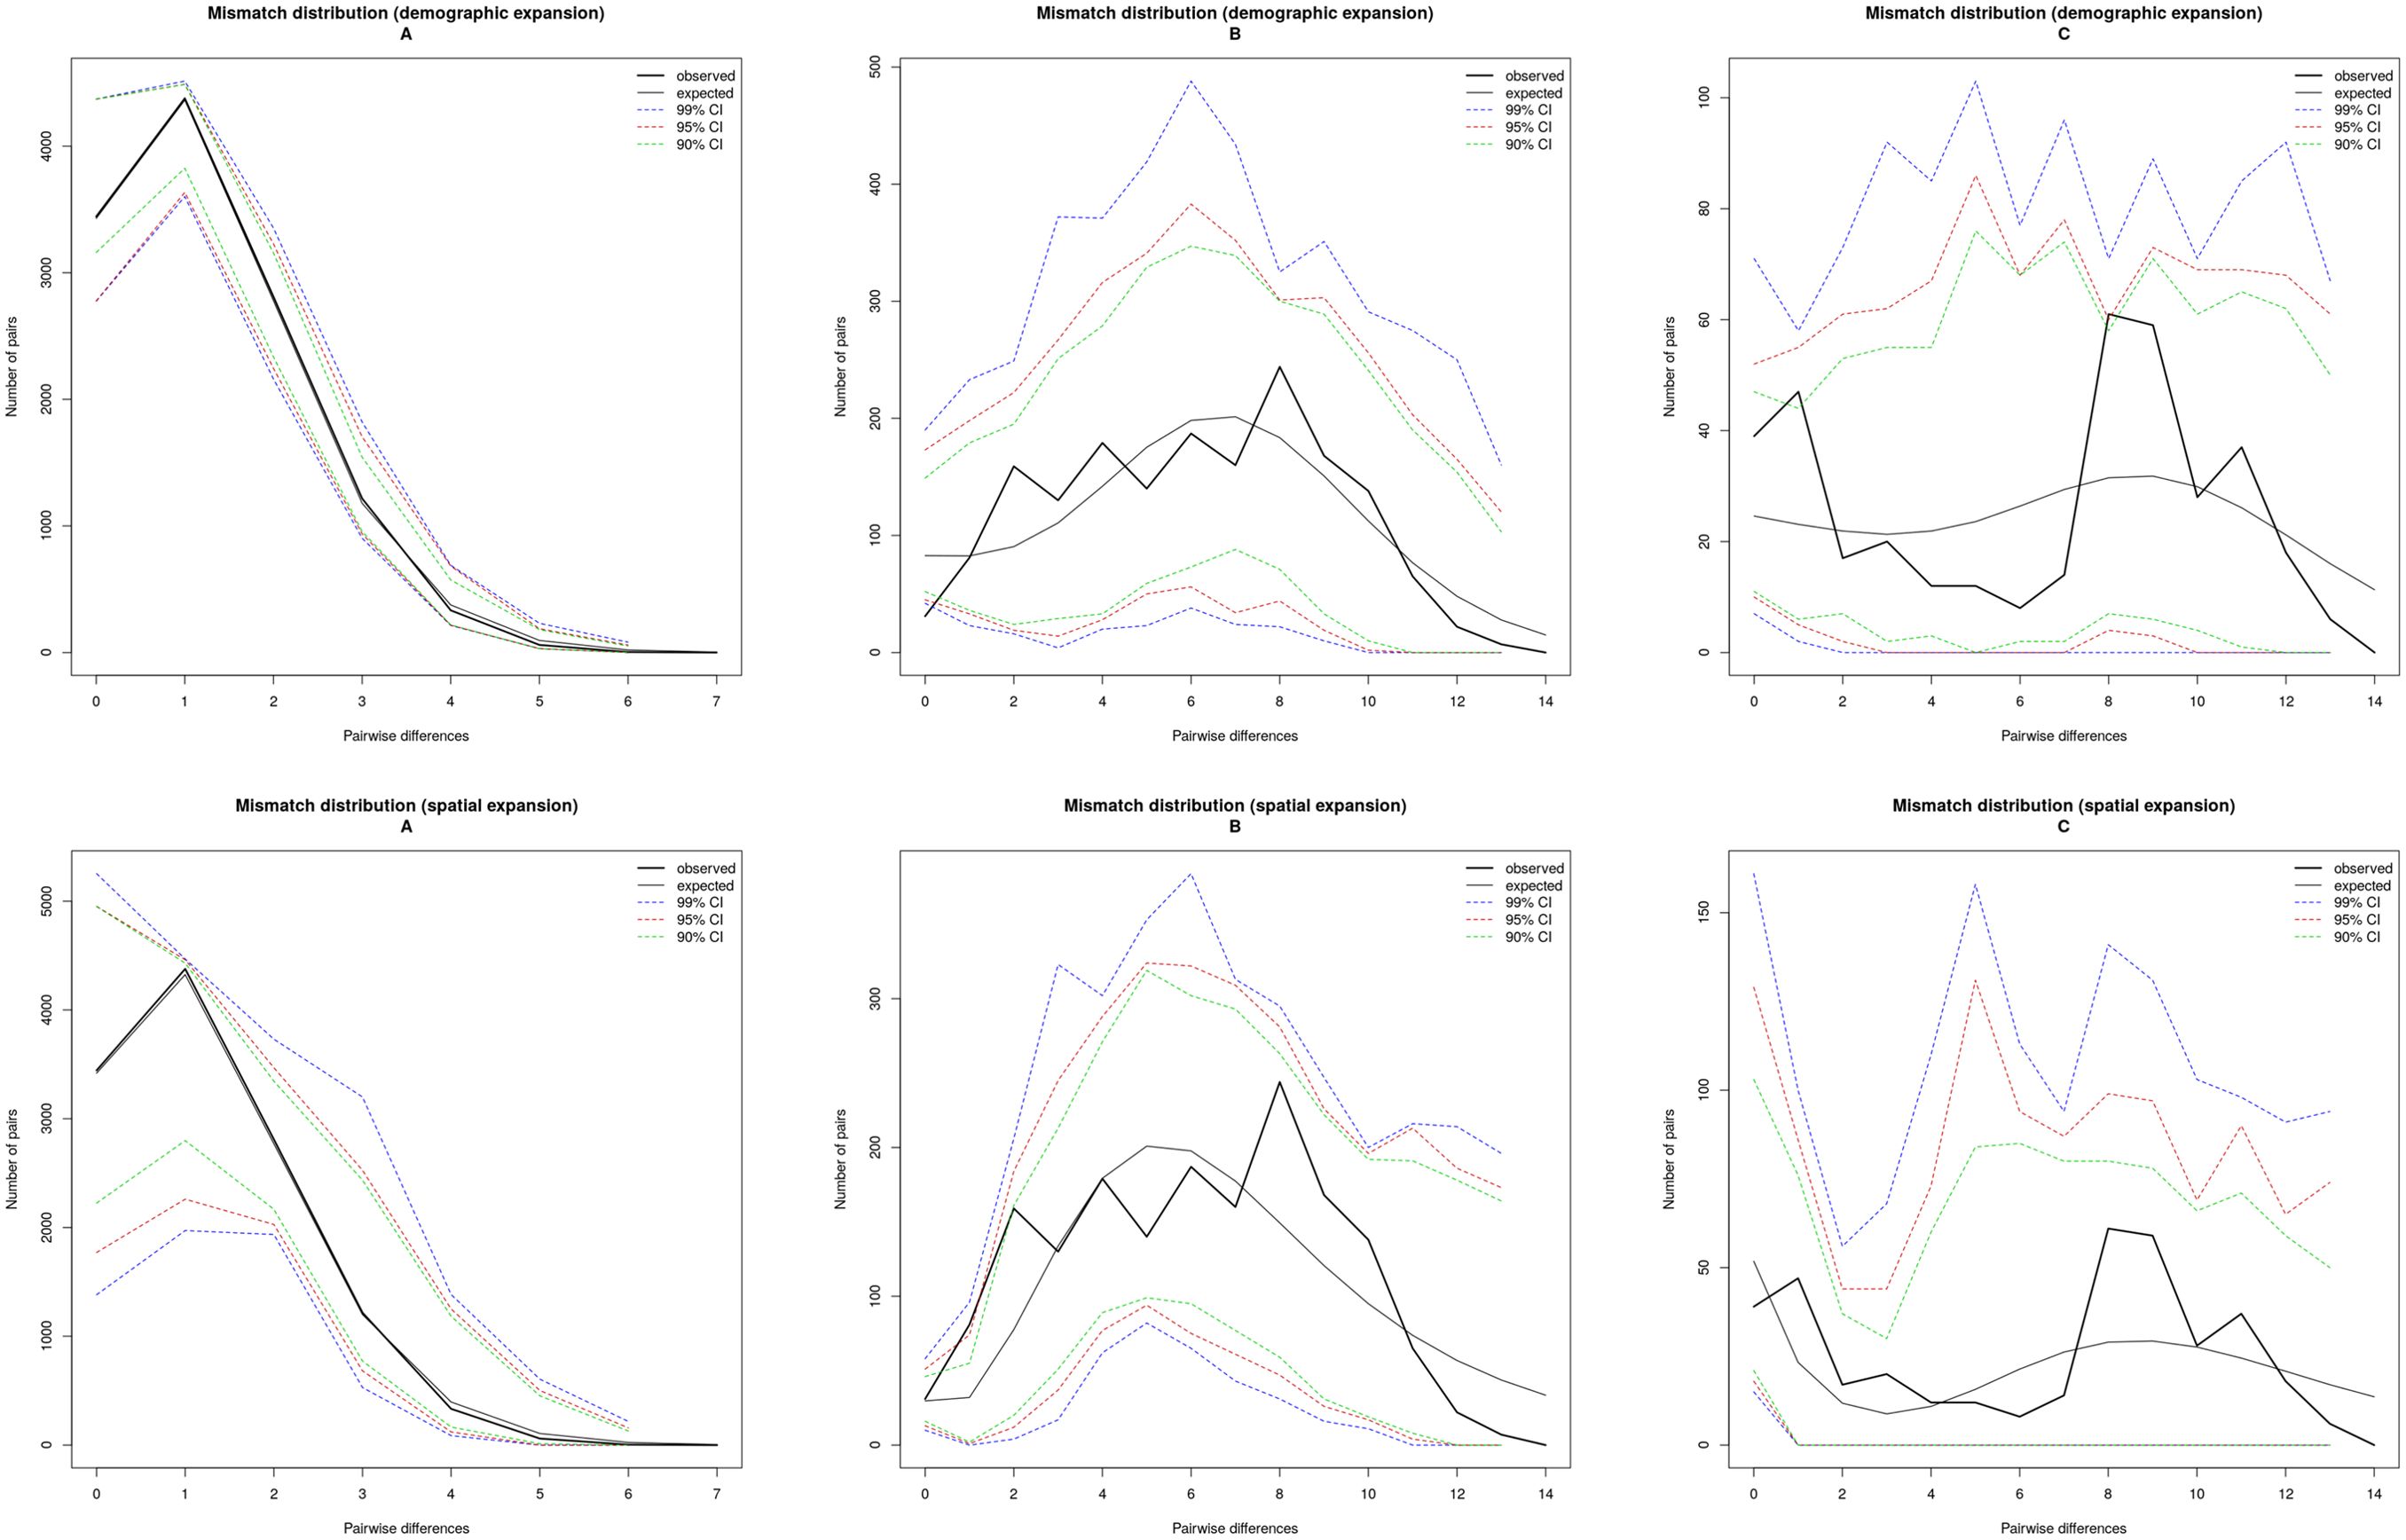
Figure 2. Mismatch distribution for Saccostrea mordax lineages (A–C).
The UPGMA phylogenetic tree revealed that the 17 populations clustered into three main branches, corresponding to S. mordax lineages A, B, and C (Figure 3). All seven populations of lineage B formed a sister branch with the populations of lineage A, while the three populations of lineage C formed a single branch. Within branches A and C, the populations of the South China Sea grouped together first, and then with the YM population of the Celebes Sea. The mean sequence divergence between lineages A and B was 2.0%, with pairwise divergence between their haplotypes ranging from 1.1% to 2.7%. Within lineage A, haplotype divergence ranged from 0.2% to 1.1%, while in lineage B, it ranged from 0.2% to 2.4%. Furthermore, the mean sequence divergence between lineage C and the other lineages was 9.8% and 10.4%, exceeding the divergence typically seen between two oyster species (Supplementary Table S1) (Guo et al., 2018).
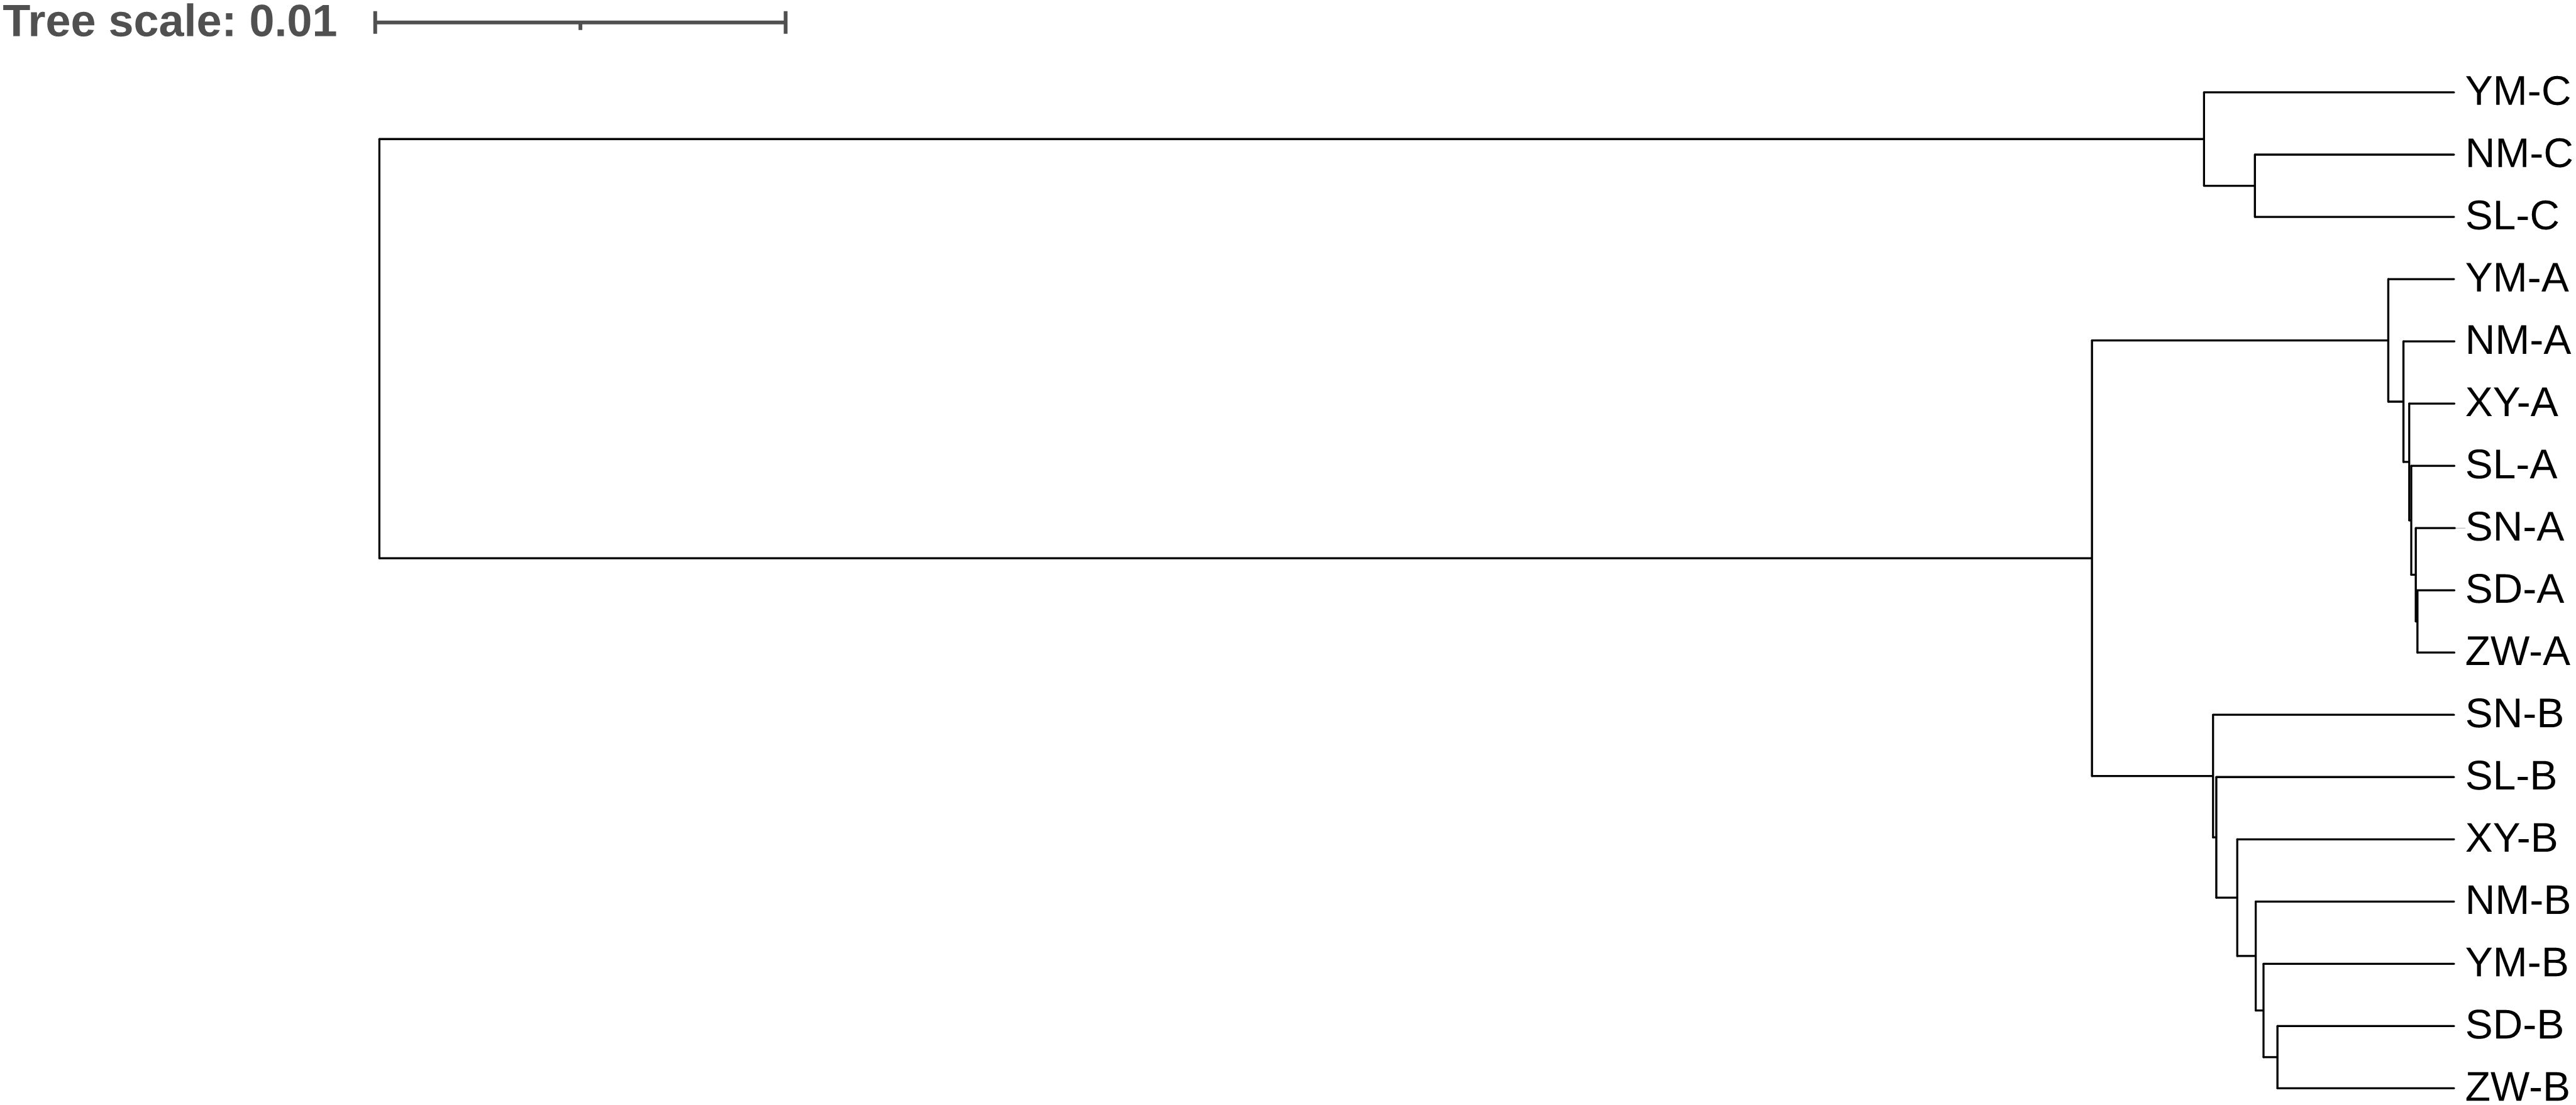
Figure 3. UPGMA phylogenetic tree among 17 populations of Saccostrea mordax based on K2P distances matrix of mitochondrial COI sequences.
The median network based on nucleotide divergences among the haplotypes reveals distinct phylogenetic structures among populations, forming three main haplotype clusters (Figure 4). Dominant haplotypes such as H44, H18, H99, and H107 were identified, with H44 serving as the central radiation point within lineage A, radiating numerous haplotypes in a star-like pattern and separating from the other two lineages. H18 is a shared haplotype among SDB, SNB, NMB, and XYB populations, while haplotypes H107 and H99 are shared among SL, NM, and YM of lineage C. Haplotypes within lineage A are more clustered, whereas those in lineages B and C are more dispersed, with minimal overlap between C- and B-type radiations, consistent with the clustering pattern observed in the individual clustering diagram (Figure 5).
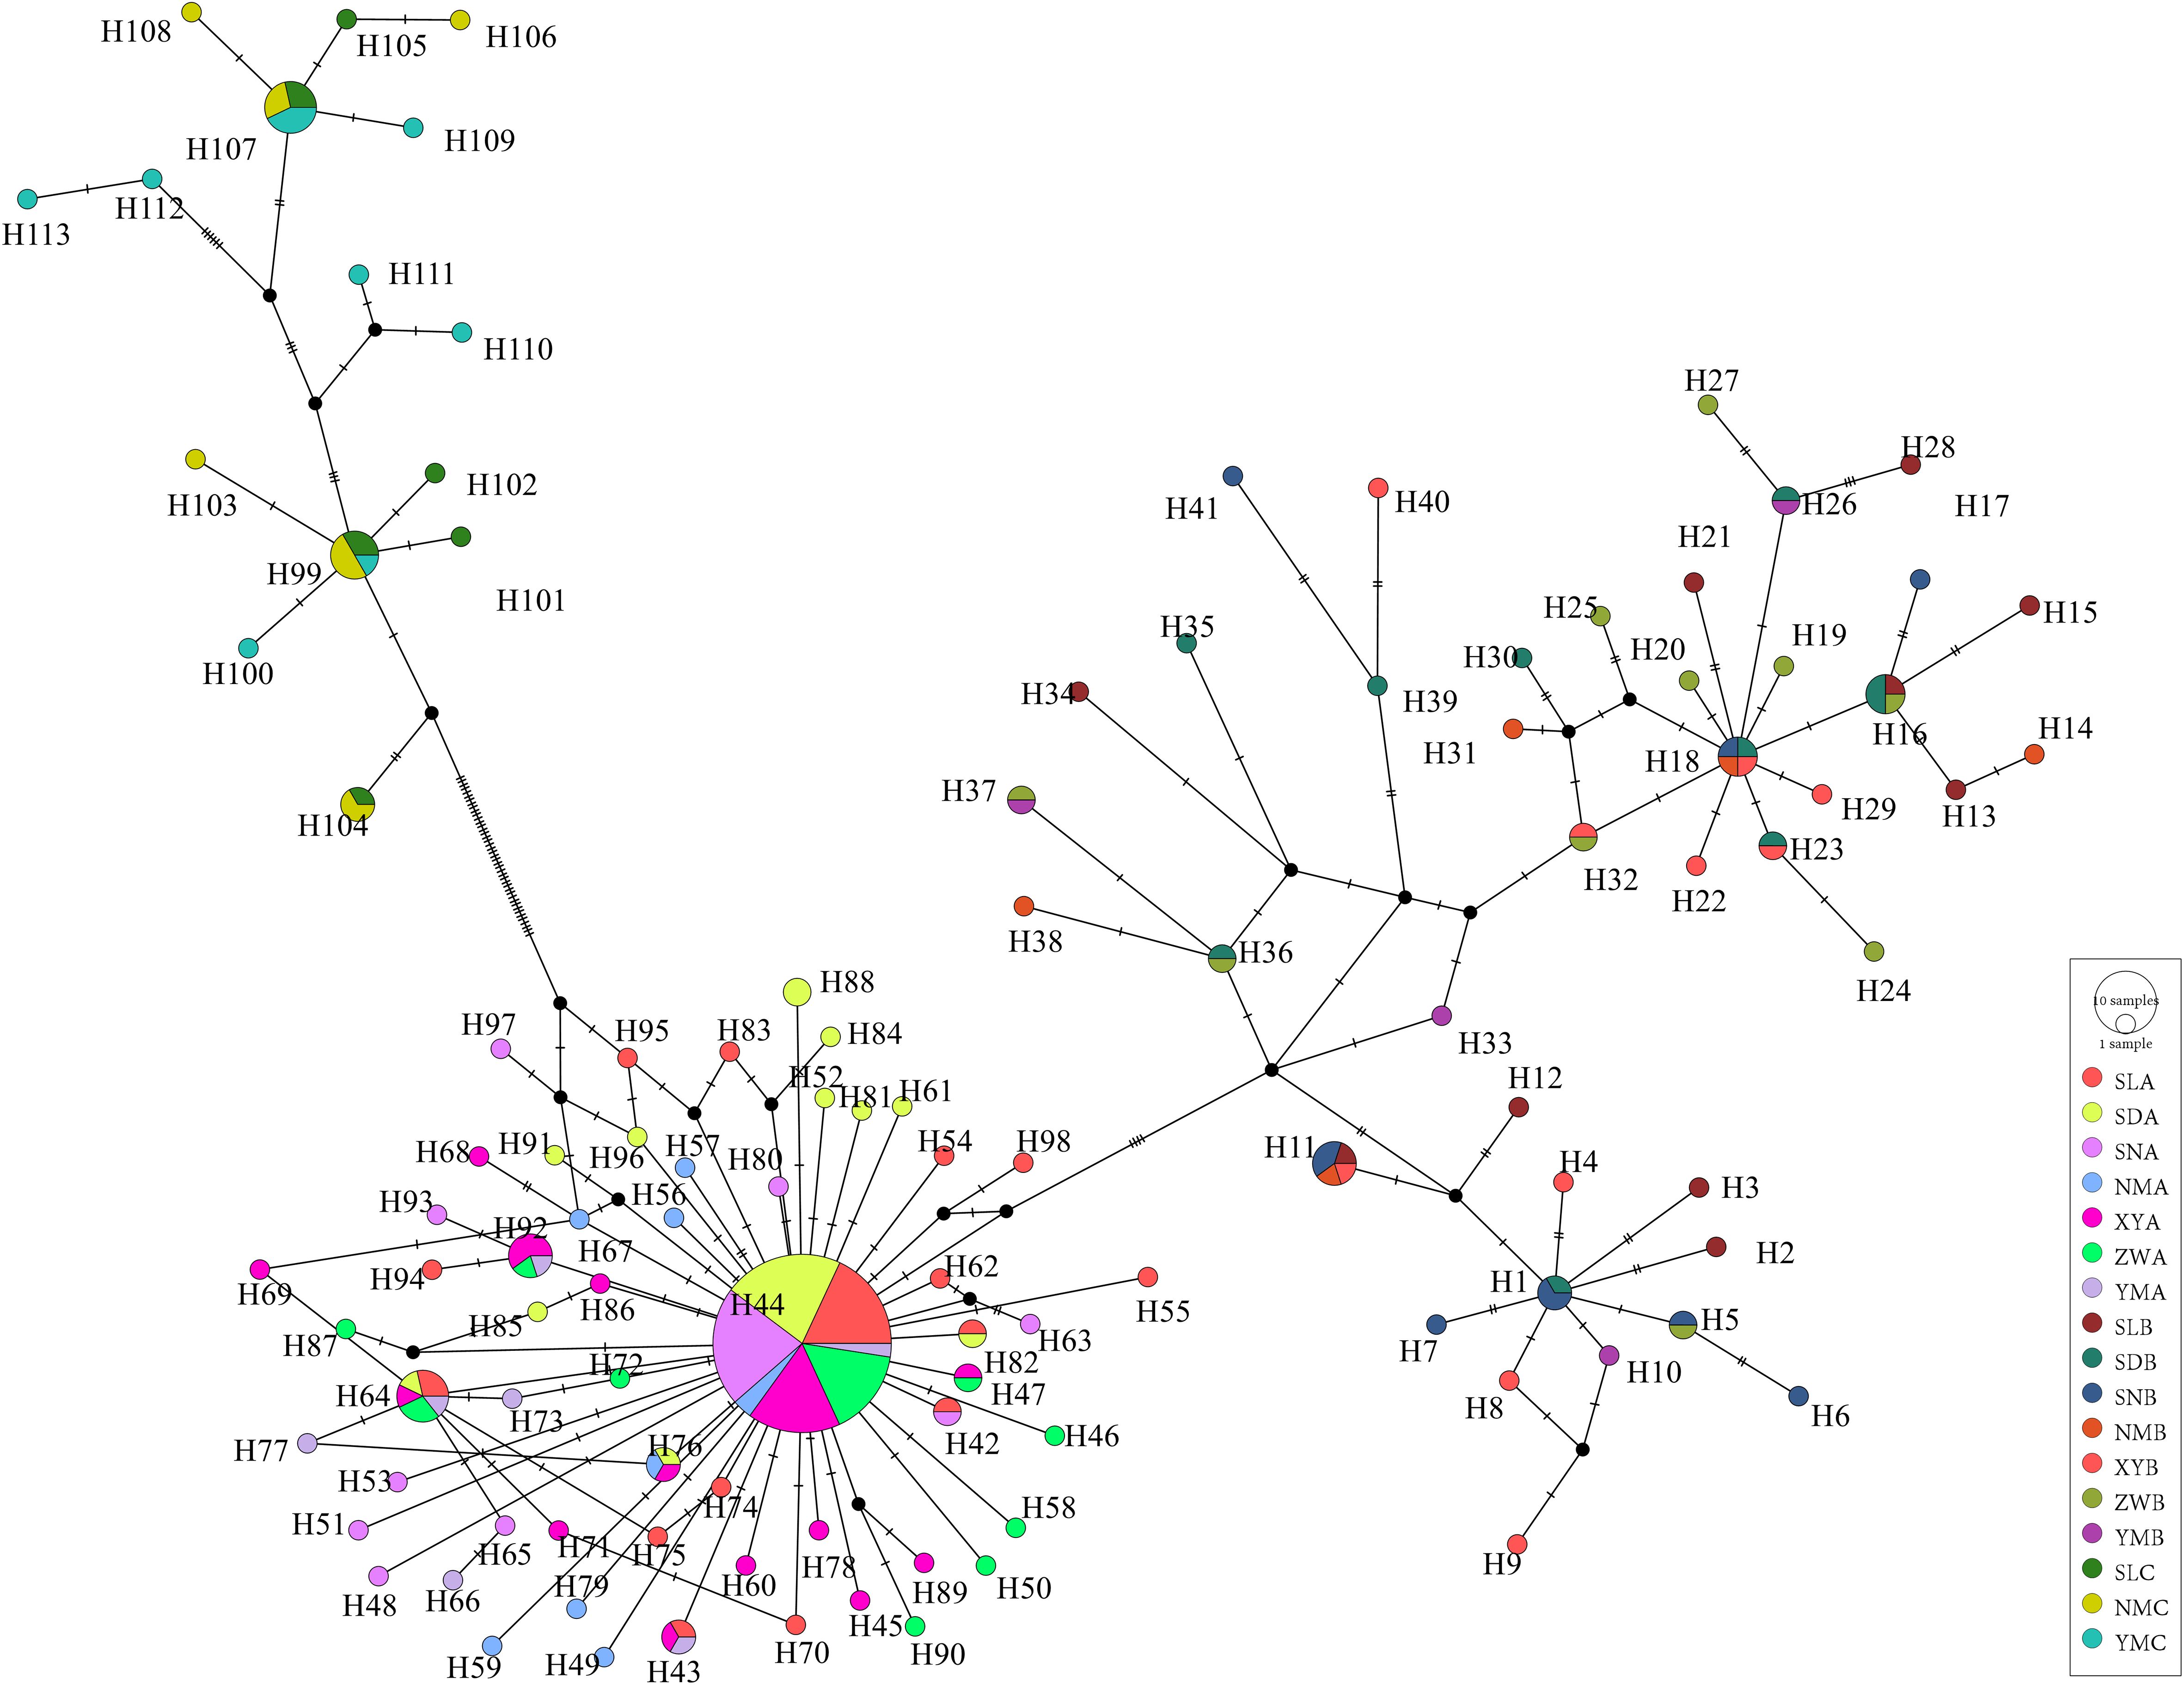
Figure 4. A median joining haplotype network of Saccostrea mordax mitochondrial COI sequence data. Each bar on the branch corresponds to a single nucleotide substitution. Larger circles contain specific frequency size.
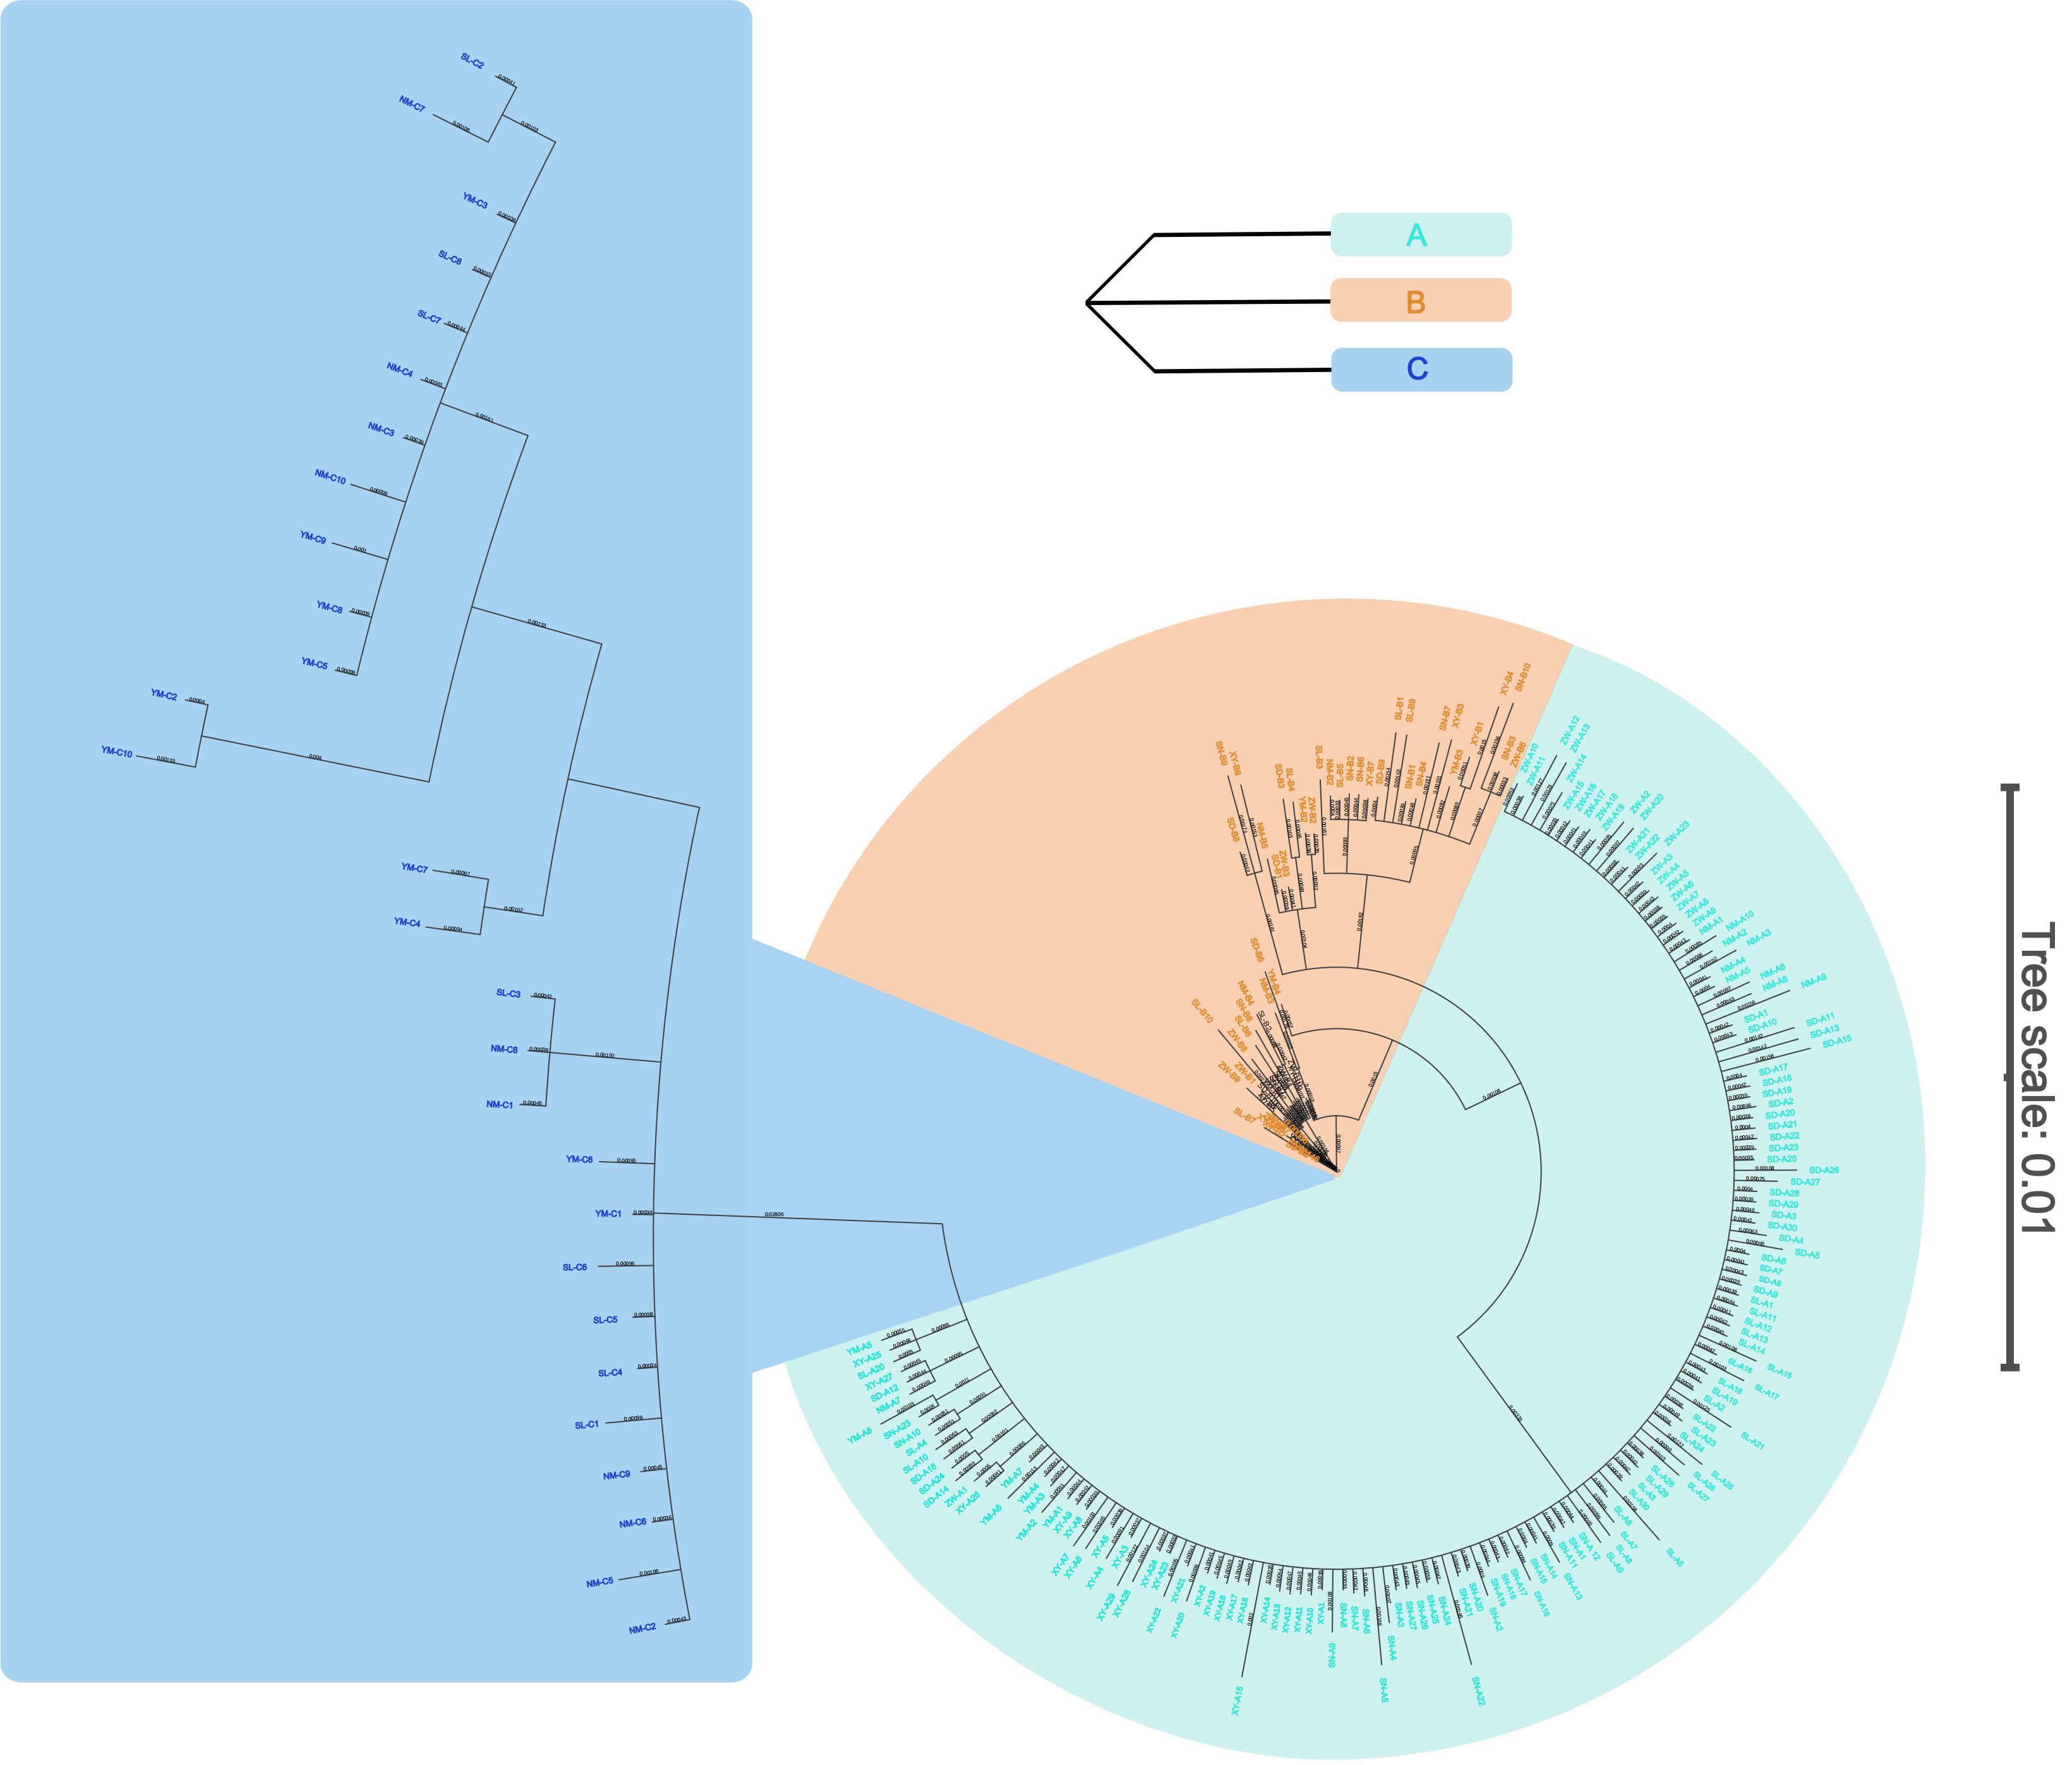
Figure 5. Phylogenetic tree among individuals of Saccostrea mordax based on Bayesian inference.
4 Discussion
Genetic confirmation of the geographic range and distinct lineages of S. mordax is important for conservation, sustainable utilization, and ecological restoration. This is particularly relevant for artificial breeding in aquaculture, as different species require different culture conditions and techniques (Jobling, 2012). Through COI analysis and identification in this study, it was found that S. mordax lineages A and B were widely distributed in the South China Sea and Celebes Sea. This result is consistent with those of (Cui et al., 2021; Morton, 2004), which support a broad distribution across the tropical and subtropical regions of the Western Pacific, spanning both the Northern and Southern Hemispheres. Prior to this study, the S. mordax lineages C was only known to be naturally distributed in Haitang Wan, Sanya, Hainan of China (Cui et al., 2021) and Okinawa Island, Yakata of Japan (Sekino and Yamashita, 2013). In this study, S. mordax lineage C has been newly discovered in Luhuitou, Sanya and Meijijiao, Nansha, Hainan of China, as well as Manado, Sulawesi Utara of Indonesia, significantly expanding the known natural distribution area of S. mordax lineages C. In addition, the proportion of lineage C individuals increased significantly from north to south (SLC = 13%, NMC = 55%, YMC = 71%). Other studies have utilized genetic data to explore the distribution patterns of tropical oyster species within the Pacific region, including S. echinata (Nowland et al., 2019) and C. iredalei (Zainal Abidin et al., 2016).
Genetic diversity forms the foundation of a species’ ability to adapt and evolve. There is a positive linear relationship exists between genetic diversity within a species and its capacity to adapt to environmental changes (Cruz et al., 2013). In this study, completely different patterns of genetic diversity were observed between lineage A and lineage B/C. Populations of lineage A exhibited low nucleotide diversity and high haplotype diversity, which was concordant with previous reports for oyster species, such as C. hongkongensis (Hd = 0.814, π = 0.00236) (Li et al., 2013). However, populations of lineages B and C exhibited both high nucleotide diversity and haplotype diversity, similar to findings for S. echinata (Hd = 0.949, π = 0. 006) (Nowland et al., 2019). Previous studies on C. sikamea, reported a genetic diversity pattern where Japanese populations showed high haplotype diversity and low nucleotide diversity, while Chinese populations exhibited high haplotype and nucleotide diversities (Hu et al., 2018). It was speculated that the observed pattern may be attributed to population instability, habitat discontinuities, and evolutionary forces. With evolutionary forces likely being the primary factor in this study.
It has been suggested that the population history of marine species can be divided into four groups based on different values of haplotype diversity and nucleotide diversity derived from mitochondrial gene sequences (Grant and Bowen, 1998). The populations of lineage A belong to the second group (high Hd, low π), indicating a recent population expansion from a small effective population size in their histories. The significant negative values of Fu’s Fs/Tajima’s D and mismatch distribution further support the occurrence of recent population expansion in lineage A populations. It is suggested that populations of lineage A might have experienced a population bottleneck and expansion caused by climatic oscillations during the Pleistocene period (Arnaud et al., 2000; Dynesius and Jansson, 2000). In comparison, populations of lineages B and C belong to the fourth group (high Hd, high π), which suggests either a large stable population with a long evolutionary history or the result of secondary contact between differentiated lineages. This is also supported by the lack of significant negative Tajima’s D values and mismatch distribution.
Current studies on the genetic structure and differentiation of S. mordax populations clearly reveal the present of three genetically distinct clusters, which include lineage A (SLA, SDA, SNA, NMA, XYA, ZWA), lineage B (SLB, SDB, SNB, NMB, XYB, ZWB) and lineage C (SLC, NMC, YMC). This pattern of genetic structure aligns well with the distribution of S. mordax lineage A, S. mordax lineage B, and S. mordoides sp. nov, as suggested by previous study (Cui et al., 2021). Previous study also found that the level of divergence between lineages A and B was considered intraspecific or at subspecies levels using K2P sequence divergence (Cui et al., 2021). In this study, the average K2P sequence divergence between lineages A and B was also 2.0% in COI, consistent with (Cui et al., 2021). This value was higher than the intraspecific divergence of most species (Guo et al., 2018; Wang et al., 2010). Meanwhile, the pairwise sequence divergences between haplotypes of lineages A and B were higher (1.1%-2.7%) than those within lineage A (0.2%-1.1%). Moreover, pair-wise Φst values between populations of lineages A and B not only showed extremely significant differentiation, but also exhibited a high degree (0.5616-0.8052), and gene flow between populations of lineages A and B was less than 0.4. Combined with the results of AMOVA and sympatric in all 7 geographical populations, this suggests lineages A and B are transitional periods of new species formation.
The hypothesis suggests that the high dispersal capacities of marine bivalves within extended larval stages should result in widespread distribution across large geographical areas. The interaction between their biological traits and ocean currents is expected to lead to low geographical differentiation (Arnaud et al., 2000). Some studies on bivalve population differentiation (Kusnadi et al., 2022; Vadopalas et al., 2004) support this idea; however, other research contradicts this hypothesis (Nowland et al., 2019; Zhan et al., 2009), indicating that additional factors may influence population structure and dispersal. In this study, different types of population subdivision within lineages A, B and C were found across the South China Sea and Celebes Sea. In lineage A, significant genetic differentiation was only observed between YM (Celebes Sea) and other populations (South China Sea), with a significant correlation between geographical distance and genetic distance among populations. This population subdivision was mainly caused by ocean currents (McManus, 1994), geographic distance, and climatic oscillations during the Pleistocene period. The lack of genetic differentiation among populations in the South China Sea could be attributed to ocean currents (Fang et al., 2012) and the long planktonic larvae stage (Ma et al., 2021). In lineages B and C, there was no genetic differentiation between YM (Celebes Sea) and other populations (South China Sea), and no significant correlation between genetic distance and geographical distance among populations of lineages B and C. Moreover, the SD and SN, SN and ZW populations in lineage B also exhibited significant genetic differentiation, possibly due to complex hydrology factors, including numerous bays, vortices, and runoff of the Pearl River.
5 Conclusion
Current studies performed a comprehensive investigation of genetic diversity and population structure of S. mordax lineages A, B, and C across the South China Sea and Celebes Sea. The UPGMA phylogenetic tree among populations, BI phylogenetic tree among individuals and median network revealed three main clusters, corresponding to S. mordax lineages A, B, and C. The results of K2P sequence divergence, pairwise Φst, gene flow and AMOVA indicate clear genetic differences among the lineages, combined with sympatric in all 7 geographical populations, these suggests lineages A and B are transitional periods of new species formation. Moreover, different patterns of population subdivision were found within lineages A, B and C across the South China Sea and Celebes Sea. The population history analyses indicated that populations of lineage A have experienced a recent sudden expansion, while populations of lineages B and C were large stable. In the future, it is necessary to collect more geographical populations of S. mordax lineages A, B and C to verify the results of this study. Since only one genetic marker was used in this study, further analysis using more advanced genomic markers, such as SNPs detected through genome scans, would be beneficial to support our findings. Furthermore, this study significantly expanded the known natural distribution area and the proportion of individuals in each geographical population of S. mordax lineages A, B and C. This information is essential for the conservation, sustainable utilization, and ecological restoration of S. mordax.
Data availability statement
The haplotype sequences were submitted to the NCBI, with the accession number PP989682-PP989794.
Author contributions
YJZ: Software, Formal analysis, Writing – original draft, Data curation, Visualization. HM: Data curation, Validation, Project administration, Conceptualization, Writing – review & editing. CH: Formal analysis, Writing – original draft, Resources. ZZ: Resources, Writing – original draft, Visualization. ZW: Writing – original draft, Investigation, Formal analysis. XD: Software, Writing – original draft. JWL: Writing – original draft, Data curation, Validation. YQ: Writing – original draft, Resources, Project administration. JuL: Project administration, Writing – original draft, Validation. ZY: Conceptualization, Writing – original draft, Validation. YP: Supervision, Project administration, Conceptualization, Writing – review & editing. YHZ: Methodology, Conceptualization, Resources, Writing – review & editing.
Funding
The author(s) declare that financial support was received for the research and/or publication of this article. This research was supported by National Natural Science Foundation of China (32260914); Guangdong Basic and Applied Basic Research Foundation (2023A1515010944; 2021A1515011181; 2022A1515010203); the Open Foundation of the State Key Laboratory of Loess and Quaternary Geology (SKLLQG2213); National Key Research and Development Program of China (2022YFD2400305; 2022YFC3103403; 2022YFC3102002; 2021YFC3100504); Guangdong Provincial Key Research and Development Program (2021B0202020003); Guangzhou Science and Technology Project (202206010133); the National Science Foundation of China (32002387); the Project of Sanya Yazhou Bay Science and Technology City; Science and Technology Project of Guangdong Provincial Department of Natural Resources (GDNRC(2022)40); National Marine Genetic Resource Center; the earmarked fund for CARS-49; Science and Technology Planning Project of Guangdong Province, China (2020B1212060058); and Research on breeding technology of candidate species for Guangdong modern marine ranching (2024-MRB-00-001).
Conflict of interest
The authors declare that the research was conducted in the absence of any commercial or financial relationships that could be construed as a potential conflict of interest.
Generative AI statement
The author(s) declare that no Generative AI was used in the creation of this manuscript.
Publisher’s note
All claims expressed in this article are solely those of the authors and do not necessarily represent those of their affiliated organizations, or those of the publisher, the editors and the reviewers. Any product that may be evaluated in this article, or claim that may be made by its manufacturer, is not guaranteed or endorsed by the publisher.
Supplementary material
The Supplementary Material for this article can be found online at: https://www.frontiersin.org/articles/10.3389/fmars.2025.1593382/full#supplementary-material
References
Arnaud S., Monteforte M., Galtier N., Bonhomme F., and Blanc F. (2000). Population structure and genetic variability of pearl oyster Pinctada mazatlanica along Pacific coasts from Mexico to Panama. Conserv Genet. 1, 299–308. doi: 10.1023/A:1011575722481
Avise J. C., Arnold J., Ball R. M., Bermingham E., Lamb T., Neigel J. E., et al. (1987). Intraspecific phylogeography: the mitochondrial DNA bridge between population genetics and systematics. Annu. Rev. Ecol. Systematics 18, 489–522. doi: 10.1146/annurev.es.18.110187.002421
Bandelt H. J., Forster P., and Röhl A. (1999). Median-joining networks for inferring intraspecific phylogenies. Mol. Biol. Evol. 16, 37–48. doi: 10.1093/oxfordjournals.molbev.a026036
Beck M., Brumbaugh R., Airoldi L., Carranza A., Coen L., Crawford C., et al. (2009). Shellfish reefs at risk: a global analysis of problems and solutions. Arlington: Nat. concervancy.
Council N. R. (2010). Ecosystem Concepts for Sustainable Bivalve Mariculture (Washington, DC: The National Academies Press).
Cruz V. M. V., Kilian A., and Dierig D. A. (2013). Development of DArT marker platforms and genetic diversity assessment of the U.S. collection of the new oilseed crop lesquerella and related species. PloS One 8, e64062. doi: 10.1371/journal.pone.0064062
Cui Z., Hu L., Li C., Zhang Z., Guo X., and Wang H. (2021). Identification of Saccostrea mordax and a New Species Saccostrea mordoides sp. nov. (Bivalvia: Ostreidae) from China. J. Shellfish Res. 40, 63–75. doi: 10.2983/035.040.0107
Dynesius M. and Jansson R. (2000). Evolutionary consequences of changes in species’ geographical distributions driven by Milankovitch climate oscillations. Proc. Natl. Acad. Sci. 97, 9115–9120. doi: 10.1073/pnas.97.16.9115
Emelianova O. R., Grigorov I. V., Orlov A. M., and Orlova S. Y. (2022). Polymorphism of mtDNA gene Cyt b of the Chukchi Sea polar cod, Boreogadus saida (Gadidae, Gadiformes). Deep-Sea Res. Pt II: Topical Stud. Oceanography 206, 105212. doi: 10.1016/j.dsr2.2022.105212
Excoffier L. and Lischer H. E. L. (2010). Arlequin suite ver 3.5: a new series of programs to perform population genetics analyses under Linux and Windows. Mol. Ecol. Resour 10, 564–567. doi: 10.1111/j.1755-0998.2010.02847.x
Fang G., Wang G., Fang Y., and Fang W. (2012). A review on the South China Sea western boundary current. Acta Oceanol Sin. 31, 1–10. doi: 10.1007/s13131-012-0231-y
Fu Y.-X. (1997). Statistical tests of neutrality of mutations against population growth, hitchhiking and background selection. Genetics 147, 915–925. doi: 10.1093/genetics/147.2.915
Ghaffari H., Ahmadzadeh F., Saberi-Pirooz R., and Abtahi B. (2022). A molecular phylogeny of the Persian Gulf and the Gulf of Oman oyster species. Biol. J. Linn Soc. 137, 626–641. doi: 10.1093/biolinnean/blac112
Gillies C. L., Castine S. A., Alleway H. K., Crawford C., Fitzsimons J. A., Hancock B., et al. (2020). Conservation status of the oyster reef ecosystem of southern and eastern Australia. Glob Ecol. Conserv 22, e00988. doi: 10.1016/j.gecco.2020.e00988
Grant W. and Bowen B. (1998). Shallow population histories in deep evolutionary lineages of marine fishes: insights from sardines and anchovies and lessons for conservation. J. Hered 89, 415–426. doi: 10.1093/jhered/89.5.415
Guo X., li C., Wang H., and Xu Z. (2018). Diversity and evolution of living oysters. J. Shellfish Res. 37, 755–771. doi: 10.2983/035.037.0407
Guo S., Li J., Yang X., Qin Y., Zhao Y., Wei J., et al. (2024). Resistance of an intertidal oyster (Saccostrea mordax) to marine heatwaves and the implication for reef building. Sci. Total Environ. 928, 172474. doi: 10.1016/j.scitotenv.2024.172474
Hall T. A. (1999). BioEdit: a user-friendly biological sequence alignment editor and analysis program for Windows 95/98/NT. Nucleic Acids symposium Ser. 41, 95–98.
Hu L., Zhang Z., Wang H., and Zhang T. (2018). Molecular phylogeography and population history of Crassostrea sikamea (Amemiya 1928) based on mitochondrial DNA. J. Exp. Mar Biol. Ecol. 503, 23–30. doi: 10.1016/j.jembe.2017.11.004
Hubert S., Cognard E., and Hedgecock D. (2009). Centromere mapping in triploid families of the Pacific oyster Crassostrea gigas (Thunberg). Aquaculture 288, 172–183. doi: 10.1016/j.aquaculture.2008.12.006
In V. V., O’Connor W., Dove M., and Knibb W. (2016). Can genetic diversity be maintained across multiple mass selection lines of Sydney rock oyster, Saccostrea glomerata despite loss within each? Aquaculture 454, 210–216. doi: 10.1016/j.aquaculture.2015.12.030
Jobling M. (2012). Aquaculture - Farming aquatic animals and plants. Aquacult Int. 20, 807–809. doi: 10.1007/s10499-012-9530-8
Kimura M. (1980). A simple method for estimating evolutionary rates of base substitutions through comparative studies of nucleotide sequences. J. Mol. Evol. 16, 111–120. doi: 10.1007/BF01731581
Klinbunga S., Khamnamtong N., Tassanakajon A., Puanglarp N., Jarayabhand P., and Yoosukh W. (2003). Molecular Genetic Identification Tools for Three Commercially Cultured Oysters (Crassostrea belcheri, Crassostrea iredalei, and Saccostrea cucullata) in Thailand. Mar Biotechnol. 5, 27–36. doi: 10.1007/s10126-002-0047-4
Kusnadi A., Kurnianto D., Madduppa H., Zamani N., Ibrahim P., Hernawan U., et al. (2022). Genetic diversity and population structure of the boring giant clam (Tridacna crocea) in Kei Islands, Maluku, Indonesia. Biodiversitas J. Biol. Diversity 23, 1273–1282. doi: 10.13057/biodiv/d230311
Lam K. and Morton B. (2006). Morphological and mitochondrial-DNA analysis of the Indo-West Pacific rock oysters (Ostreidae: Saccostrea species). J. Mollus Stud. 72, 235–245. doi: 10.1093/mollus/eyl002
Langdon C., Evans F., Jacobson D., and Blouin M. (2003). Yields of cultured Pacific oysters Crassostrea gigas Thunberg improved after one generation of selection. Aquaculture 220, 227–244. doi: 10.1016/s0044-8486(02)00621-x
Larkin M. A., Blackshields G., Brown N. P., Chenna R., McGettigan P. A., McWilliam H., et al. (2007). Clustal W and clustal X version 2.0. Bioinformatics 23, 2947–2948. doi: 10.1093/bioinformatics/btm404
Leigh J. W., Bryant D., and Nakagawa S. (2015). popart: full-feature software for haplotype network construction. Methods Ecol. Evol. 6, 1110–1116. doi: 10.1111/2041-210x.12410
Li L., Wu X. Y., and Yu Z. N. (2013). Genetic diversity and substantial population differentiation in Crassostrea hongkongensis revealed by mitochondrial DNA. Mar Genom 11, 31–37. doi: 10.1016/j.margen.2013.06.001
Li Q., Yu H., and Yu R. H. (2006). Genetic variability assessed by microsatellites in cultured populations of the Pacific oyster (Crassostrea gigas) in China. Aquaculture 259, 95–102. doi: 10.1016/j.aquaculture.2006.05.030
Librado P. and Rozas J. (2009). DnaSP v5: a software for comprehensive analysis of DNA polymorphism data. Bioinformatics 25, 1451–1452. doi: 10.1093/bioinformatics/btp187
Liu S., Xue Q. G., Xu H. Q., and Lin Z. H. (2021). Identification of main oyster species and comparison of their genetic diversity in zhejiang coast, south of yangtze river estuary. Front. Mar Sci. 8. doi: 10.3389/fmars.2021.662515
Lu R., Chen Y., Ma P., Li C., Zhang Z., Zang G., et al. (2024). Species composition and distribution of common Crassostrea and Saccostrea oysters along the coast of Hainan Island. J. Oceanol Limnol 42, 1609–1620. doi: 10.1007/s00343-024-3213-y
Lu H., Huang X., Zhu J., and Yan W. (2011). Chromosomal Mapping of Ribosomal rRNA Genes in the Small Rock Oyster, Saccostrea mordax (Gould 1850). Int. J. Marine Sci. 1, 2–5. doi: 10.5376/ijms.2011.01.0002
Ma H., Li L., Xiao S., Zhang Y., and Yu Z. (2021). Microsatellite-based study of population genetics of Crassostrea hongkongensis in Southern China. Aquacult Rep. 19, 100591. doi: 10.1016/j.aqrep.2021.100591
Mantel N. (1967). The detection of disease clustering and a generalized regression approach. Cancer Res. 27, 209–220.
Morton K. L. B. (2004). The oysters of hong kong (Bivalvia: ostreidae and gryphaeidae). Raffles Bull. Zoology 52, 11–28.
Nei M. and Kumar S. (2000). Molecular Evolution and Phylogenetics (New York: Oxford University Press).
Nowland S. J., Silva C. N. S., Southgate P. C., and Strugnell J. M. (2019). Mitochondrial and nuclear genetic analyses of the tropical black-lip rock oyster (Saccostrea eChinata) reveals population subdivision and informs sustainable aquaculture development. BMC Genomics 20, 1–14. doi: 10.1186/s12864-019-6052-z
Ronquist F., Teslenko M., van der Mark P., Ayres D. L., Darling A., Höhna S., et al. (2012). MrBayes 3.2: efficient Bayesian phylogenetic inference and model choice across a large model space. Syst. Biol. 61, 539–542. doi: 10.1093/sysbio/sys029
Sekino M. and Yamashita H. (2013). Mitochondrial DNA barcoding for Okinawan oysters: a cryptic population of the Portuguese oyster Crassostrea angulata in Japanese waters. Fisheries Sci. 79, 61–76. doi: 10.1007/s12562-012-0577-2
Sekino M. and Yamashita H. (2016). Mitochondrial and nuclear DNA analyses of Saccostrea oysters in Japan highlight the confused taxonomy of the genus. J. Mollus Stud. 82, 492–506. doi: 10.1093/mollus/eyw022
Sultana S., Hasan M. M., Hossain M. S., Alim M. A., Das K. C., Moniruzzaman M., et al. (2022). Assessment of genetic diversity and population structure of Tenualosa ilisha in Bangladesh based on partial sequence of mitochondrial DNA cytochrome b gene. Ecol. Genet. Genomics 25, 100–139. doi: 10.1016/j.egg.2022.100139
Tajima F. (1989a). The effect of change in population size on DNA polymorphism. Genetics 123, 597–601. doi: 10.1093/genetics/123.3.597
Tajima F. (1989b). Statistical method for testing the neutral mutation hypothesis by DNA polymorphism. Genetics 123, 585–595. doi: 10.1093/genetics/123.3.585
Tamura K., Stecher G., and Kumar S. (2021). MEGA11: molecular evolutionary genetics analysis version 11. Mol. Biol. Evol. 38, 3022–3027. doi: 10.1093/molbev/msab120
Vadopalas B., LeClair L. L., and Bentzen P. (2004). Microsatellite and allozyme analyses reveal few genetic differences among spatially distinct aggregations of Geoduck clams (Panopea abrupta, Conrad 1849). J. Shellfish Res. 23, 693–706. doi: 10.1111/j.1365-2761.2004.00594.x
Wang H., Qian L., Liu X., Zhang G., and Guo X. (2010). Classification of a common cupped oyster from southern China. J. Shellfish Res. 29, 857–866. doi: 10.2983/035.029.0420
Wei H. J., Geng L. W., Shang X. C., Li L., Ma B., Zhang Y. Y., et al. (2023). Comparison genetic diversity and population structure of four Pseudaspius leptocephalus populations in Heilongjiang River Basin based on mitochondrial COI gene. Front. Mar Sci. 10. doi: 10.3389/fmars.2023.1158845
Yasuoka N. and Yusa Y. (2017). Direct evidence of bi-directional sex change in natural populations of the oysters Saccostrea kegaki and S. mordax. Plankton Benthos Res. 12, 78–81. doi: 10.3800/pbr.12.78
Zainal Abidin D. H., Mustaffa S., A. Rahim M., M. Nair D., Md. Naim D., and Mohd Nor S. A. (2016). Population genetics of the black scar oyster, Crassostrea iredalei: repercussion of anthropogenic interference. Mitochondrial DNA A 27, 647–658. doi: 10.3109/19401736.2014.913137
Zhan A., Hu J., Hu X., Zhou Z., Hui M., Wang S., et al. (2009). Fine-scale population genetic structure of zhikong scallop (Chlamys farreri): do local marine currents drive geographical differentiation? Mar Biotechnol. 11, 223–235. doi: 10.1007/s10126-008-9138-1
Keywords: Saccostrea mordax, distinct lineage, genetic diversity, population structure, mitochondrial DNA (COI gene)
Citation: Zhang Y, Ma H, Han C, Zhao Z, Wei Z, Duan X, Li J, Qin Y, Li J, Yu Z, Pan Y and Zhang Y (2025) Comparison of genetic diversity and population structure of Saccostrea mordax lineages A, B, and C across South China Sea and Celebes Sea. Front. Mar. Sci. 12:1593382. doi: 10.3389/fmars.2025.1593382
Received: 14 March 2025; Accepted: 01 May 2025;
Published: 30 May 2025.
Edited by:
Zekun Huang, Xiamen University, ChinaReviewed by:
Weiwei You, Xiamen University, ChinaXingzhi Zhang, Guangxi Academy of Fishery Sciences, China
Copyright © 2025 Zhang, Ma, Han, Zhao, Wei, Duan, Li, Qin, Li, Yu, Pan and Zhang. This is an open-access article distributed under the terms of the Creative Commons Attribution License (CC BY). The use, distribution or reproduction in other forums is permitted, provided the original author(s) and the copyright owner(s) are credited and that the original publication in this journal is cited, in accordance with accepted academic practice. No use, distribution or reproduction is permitted which does not comply with these terms.
*Correspondence: Ying Pan, eWluZ3BhbkBneHUuZWR1LmNu; Yuehuan Zhang, eWh6aGFuZ0BzY3Npby5hYy5jbg==
†These authors have contributed equally to this work