Abstract
The non-hydrostatic numerical model NHWAVE was employed to investigate the hydrodynamic behavior of a coastal region with submerged breakwater, focusing on the structural dimensions and incident wave conditions. In the numerical experiment, regular waves of varying specifications were used as incident waves, and the breakwater dimensions were adjusted based on the offshore distance from the shoreline and its vertical distance from the water surface to the crest. The above experimental conditions calculated water surface displacement and velocity at different depths. The shoreline response, including erosion and accretion, was predicted by assessing nearshore flow patterns, while the wave attenuation effect was quantified based on wave height variations. The results indicate that wave attenuation is significantly influenced by breaking-induced currents generated during wave interaction with the breakwater crest. A shorter vertical distance from submerged breakwater crest resulted in stronger breaking-induced currents. The rotational direction of vortex-induced nearshore flow patterns significantly influences shoreline response, resulting in either erosion or accretion. These findings provide insights into the hydrodynamic and sediment transport mechanisms associated with submerged breakwaters, contributing to optimizing coastal protection measures.
1 Introduction
Unlike traditional coastal structures, submerged breakwaters are installed underwater to protect the coastal environment while acting as a defense against coastal erosion and extreme wave intrusion. Being installed underwater and not visible above the sea surface, submerged breakwaters are highly advantageous for preserving coastal scenery. These structures also function as underwater resistance barriers, effectively dissipating wave energy (Longuet-Higgins and Stewart, 1964; Lamberti et al., 2005; Burcharth et al., 2007; Terrile and Brocchini, 2007; Ranasinghe et al., 2010). Recently, research has expanded beyond the physical behavior characteristics of submerged breakwaters to include studies on their economic benefits and ecological impacts on the local economy by creating waterfront spaces (Scyphers et al., 2015; Maiolo et al., 2020; Vona et al., 2020; Martin et al., 2021). Additionally, in coastal regions with submerged breakwaters, these structures affect the flow near the shoreline morphology and help mitigate coastal erosion (Peregrine, 1998; Zyserman et al., 2005; Martinelli et al., 2006; Ranasinghe et al., 2010). While submerged breakwaters offer various functional advantages, research on their wave attenuation performance and coastal erosion response remains limited, particularly due to the difficulty of conducting physical experiments and the site-specific nature of their deployment, which further constrains empirical investigations compared to conventional breakwater structures. Furthermore, numerous physical variables such as cross-sectional shapes, iteract with nonlinear waves, transformation and breaking processes must be considered, and their complex behavior necessitates laboratory-scale studies and field verification research (Hanson and Kraus, 1990; Turner et al., 2001; Ning et al., 2016; Qu et al., 2023; Xing et al., 2024; Hassanpour et al., 2025). However, hydraulic experiments and field studies require various constraints and significant costs, making research difficult. In contrast, numerical analysis is not influenced by actual environmental conditions and allows for diverse experimental scenarios (Bühler and Jacobson, 2001; Kennedy et al., 2006; Hoan et al., 2011; Retsinis and Papanicolaou, 2020; Gao et al., 2023). Numerical analysis is also more cost-effective than physical experiments or field studies and can significantly reduce computation time with sufficient computational resources (Liang et al., 2017; Zhu et al., 2019; Al-Towayti et al., 2024; Zheng et al., 2024). As computer technology advances, research in this field is becoming increasingly active (Brocchini et al., 2004; Meringolo et al., 2015; Pahar and Dhar, 2016; Akbari and Taherkhani, 2019; Kazemi et al., 2020).
As a solution, numerical research is actively being pursued, and with advancements in computational power, efforts continue to address increasingly complex problems such as the design of submerged structure, coastal erosion, morphological changes, etc (Huang et al., 2003; Ranasinghe et al., 2004, 2006; Zanuttigh, 2007; Chen et al., 2025). Ongoing research focuses on predicting topographic changes and wave energy dissipation under specific wave conditions (Gao et al., 2021, 2024; Liu, 2023; Dong et al., 2023). These advantages of numerical analysis are critical for evaluating the performance and structural stability of submerged breakwaters, which often require large-scale hydraulic model testing. Prior to physical experimentation, numerical simulations facilitate the design of reliable test conditions by offering predictive insights and enabling the estimation of physical quantities that are challenging to measure directly. Following the experiments, numerical analysis plays an essential role in performing sensitivity analyses on key physical parameters and in validating computational models through comparison with physical experiment data.
This study used a numerical model to investigate the primary functions of submerged breakwaters, focusing on wave attenuation effects and shoreline response predictions. Shoreline erosion and deposition responses were predicted through analysis based on the relationship between submerged breakwater dimensions and incident wave conditions. The numerical model’s computational domain and wave conditions were set to be reproducible at a laboratory scale, enabling validation of predictive accuracy through future hydraulics experiments. In particular, experimental conditions corresponding to the transitional phase, where distinguishing shoreline response as either erosion or deposition is challenging, were identified. These conditions will be utilized in hydraulic model experiments to analyze the physical behavior characteristics.
2 Numerical experiments
This study employed the non-hydrostatic numerical model NHWAVE (Non-Hydrostatic WAVE Model) to investigate the hydrodynamic behavior of a coastal region with submerged breakwaters. A detailed description of the governing equations, numerical methods, boundary conditions, and input conditions of the numerical model is provided below (Ma et al., 2014).
The numerical model employed in this study was initially validated against the benchmark results of Beji and Battjes (1993), while the modeling of free surface behavior was further validated through comparisons with the works of Lin and Li (2002); Stelling and Zijlema (2003); Yuan and Wu (2004); Bradford (2005). In addition, high-order dispersion characteristics in Boussinesq-type models were addressed by Lynett and Liu (2004). Furthermore, the model’s accuracy and scalability were demonstrated through comparisons with hydraulic model experiments on wave transformation and breaking phenomena in coastal environments (Berkhoff et al., 1982; Synolakis, 1987). Although the present study does not include a direct comparison with laboratory or field data, the numerical model employed herein has been extensively validated in previous studies under similar conditions. These studies demonstrated the model’s capability to accurately reproduce wave transformation, wave-induced currents, wave breaking and sediment transport. Therefore, the model results in this study are considered to be reliable within the defined scope.
2.1 Governing equations and numerical schemes
The governing equations are based on the incompressible Navier-Stokes equations (Equations 1, 2), and σ-coordinate system was applied to accurately simulate bottom topography and free surface displacement (Phillips, 1957). This numerical model incorporates a nonlinear k-Є turbulence model (Lin and Liu, 1998a; Ma et al., 2011), which has been validated by successfully simulating wave breaking on a planar beach (Lin and Liu, 1998b).
For spatial analysis, a Godunov-type method combining the finite volume method and finite difference method was employed Zhou et al. (2001); Kim et al. (2008); Liang and Marche (2009). For temporal analysis, a two-stage second-order nonlinear Strong Stability Preserving (SSP) Runge-Kutta scheme was applied Gottlieb et al. (2001). During model execution, Courant-Friedrichs-Lewy (CFL) condition of 0.5 was maintained to ensure model accuracy and stability. The accuracy of numerical calculations for fluid behavior and the free surface was enhanced by applying spatiotemporal numerical analysis techniques. The σ-coordinate system allowed for multi-layered depth-wise calculations, improving the accuracy of hydrodynamic pressure calculations influenced by wave-induced variations (Ma et al., 2014).
where, (i, j)=1, 2, 3, ui is the velocity component on , p is pressure, ρ is water density, is gravitational force, is turbulent stress with νt is turbulent kinematic viscosity.
where, , h is water depth and η is surface elevation. This coordinate system transforms the vertical coordinate into a uniformly distributed space ranging σ spans from 0 to 1 in (Equation 3), making it easier to handle complex variations in height by converting them into a consistent range. Applying the chain differentiation, the governing equations can be expressed as (Equations 4, 5). This numerical model calculates total pressure by dividing it into hydrodynamic and hydrostatic pressure components, and the turbulence diffusion term is approximated using a nonlinear k-ϵ turbulence model, which has been successfully applied to wave breaking on a planar beach (Ma et al., 2014).
where, . The fluxes and the sources terms are given by (Equations 6, 7).
In NHWAVE, the nonlinear turbulence model employs (Equation 8) to compute the turbulent eddy viscosity. The k-Є equations are derived as shown in (Equations 9, 10). The empirical constants used in the model are provided in (Equation 11), while the shear and buoyancy production terms are given in (Equations 12, 13), respectively.
where, the Reynolds stress is calculated by a nonlinear model proposed by Lin and Liu (1998a).
The numerical method applied in this model is a Godunov-type method, which combines the finite volume method and the finite difference method. The momentum equations are solved using a second-order Godunov finite volume method, and the HLL Riemann solver is employed to estimate fluxes at the faces of each computational cell. This numerical model incorporates various numerical techniques to precisely calculate fluid flow changes over time and space (Patankar, 1980). Boundary conditions can be set for inflow and outflow flux, wall boundaries, and free surface conditions. A minimum water depth is also defined to implement the wetting-drying treatment (Bradford, 2005). Detailed information on the governing equations and numerical methods can be found in the numerical model’s manual (Ma et al., 2014), and the model’s accuracy has been validated through multiple research studies (Ma et al., 2012, 2013).
2.2 Setup of numerical domain
The bathymetry of the coastal area with the installed breakwater was configured as follows to analyze wave height reduction and shoreline response based on the dimensions of the submerged breakwater and incident wave conditions. The study examined behavioral characteristics by varying the offshore distance (lx) from the shoreline and the vertical distance (sb) from the water surface to the submerged structure crest. The flow pattern behind the submerged breakwater changed significantly depending on the offshore distance, influencing shoreline variations. The vertical distance from the water surface affected the occurrence and intensity of breaking-induced currents on the breakwater crest, leading to its selection as an experimental condition.
The offshore distances from the shoreline were lx = 8 m and lx = 13 m. In comparison, the vertical distances from the water surface to the breakwater crest were set at sb = 0.10 m and sb = 0.15 m, resulting in four bathymetry configurations. The submerged breakwater width was 2.0 m, and its length was 6.0 m (Figure 1). The σ-coordinate system was applied to the computational domain, with a grid size of 0.025 m and three layers in the vertical direction. Since grid size and the number of vertical layers significantly affect computation time, these parameters were optimized to ensure numerical stability while avoiding excessive computational resource usage. The grid resolution in this study was determined based on the CFL condition, considering the characteristic flow velocity and time step. For the vertical discretization, three to five layers are typically employed, and the final configuration was selected by taking into account both the characteristics of the study domain and the limitations of available computational resources.
Figure 1
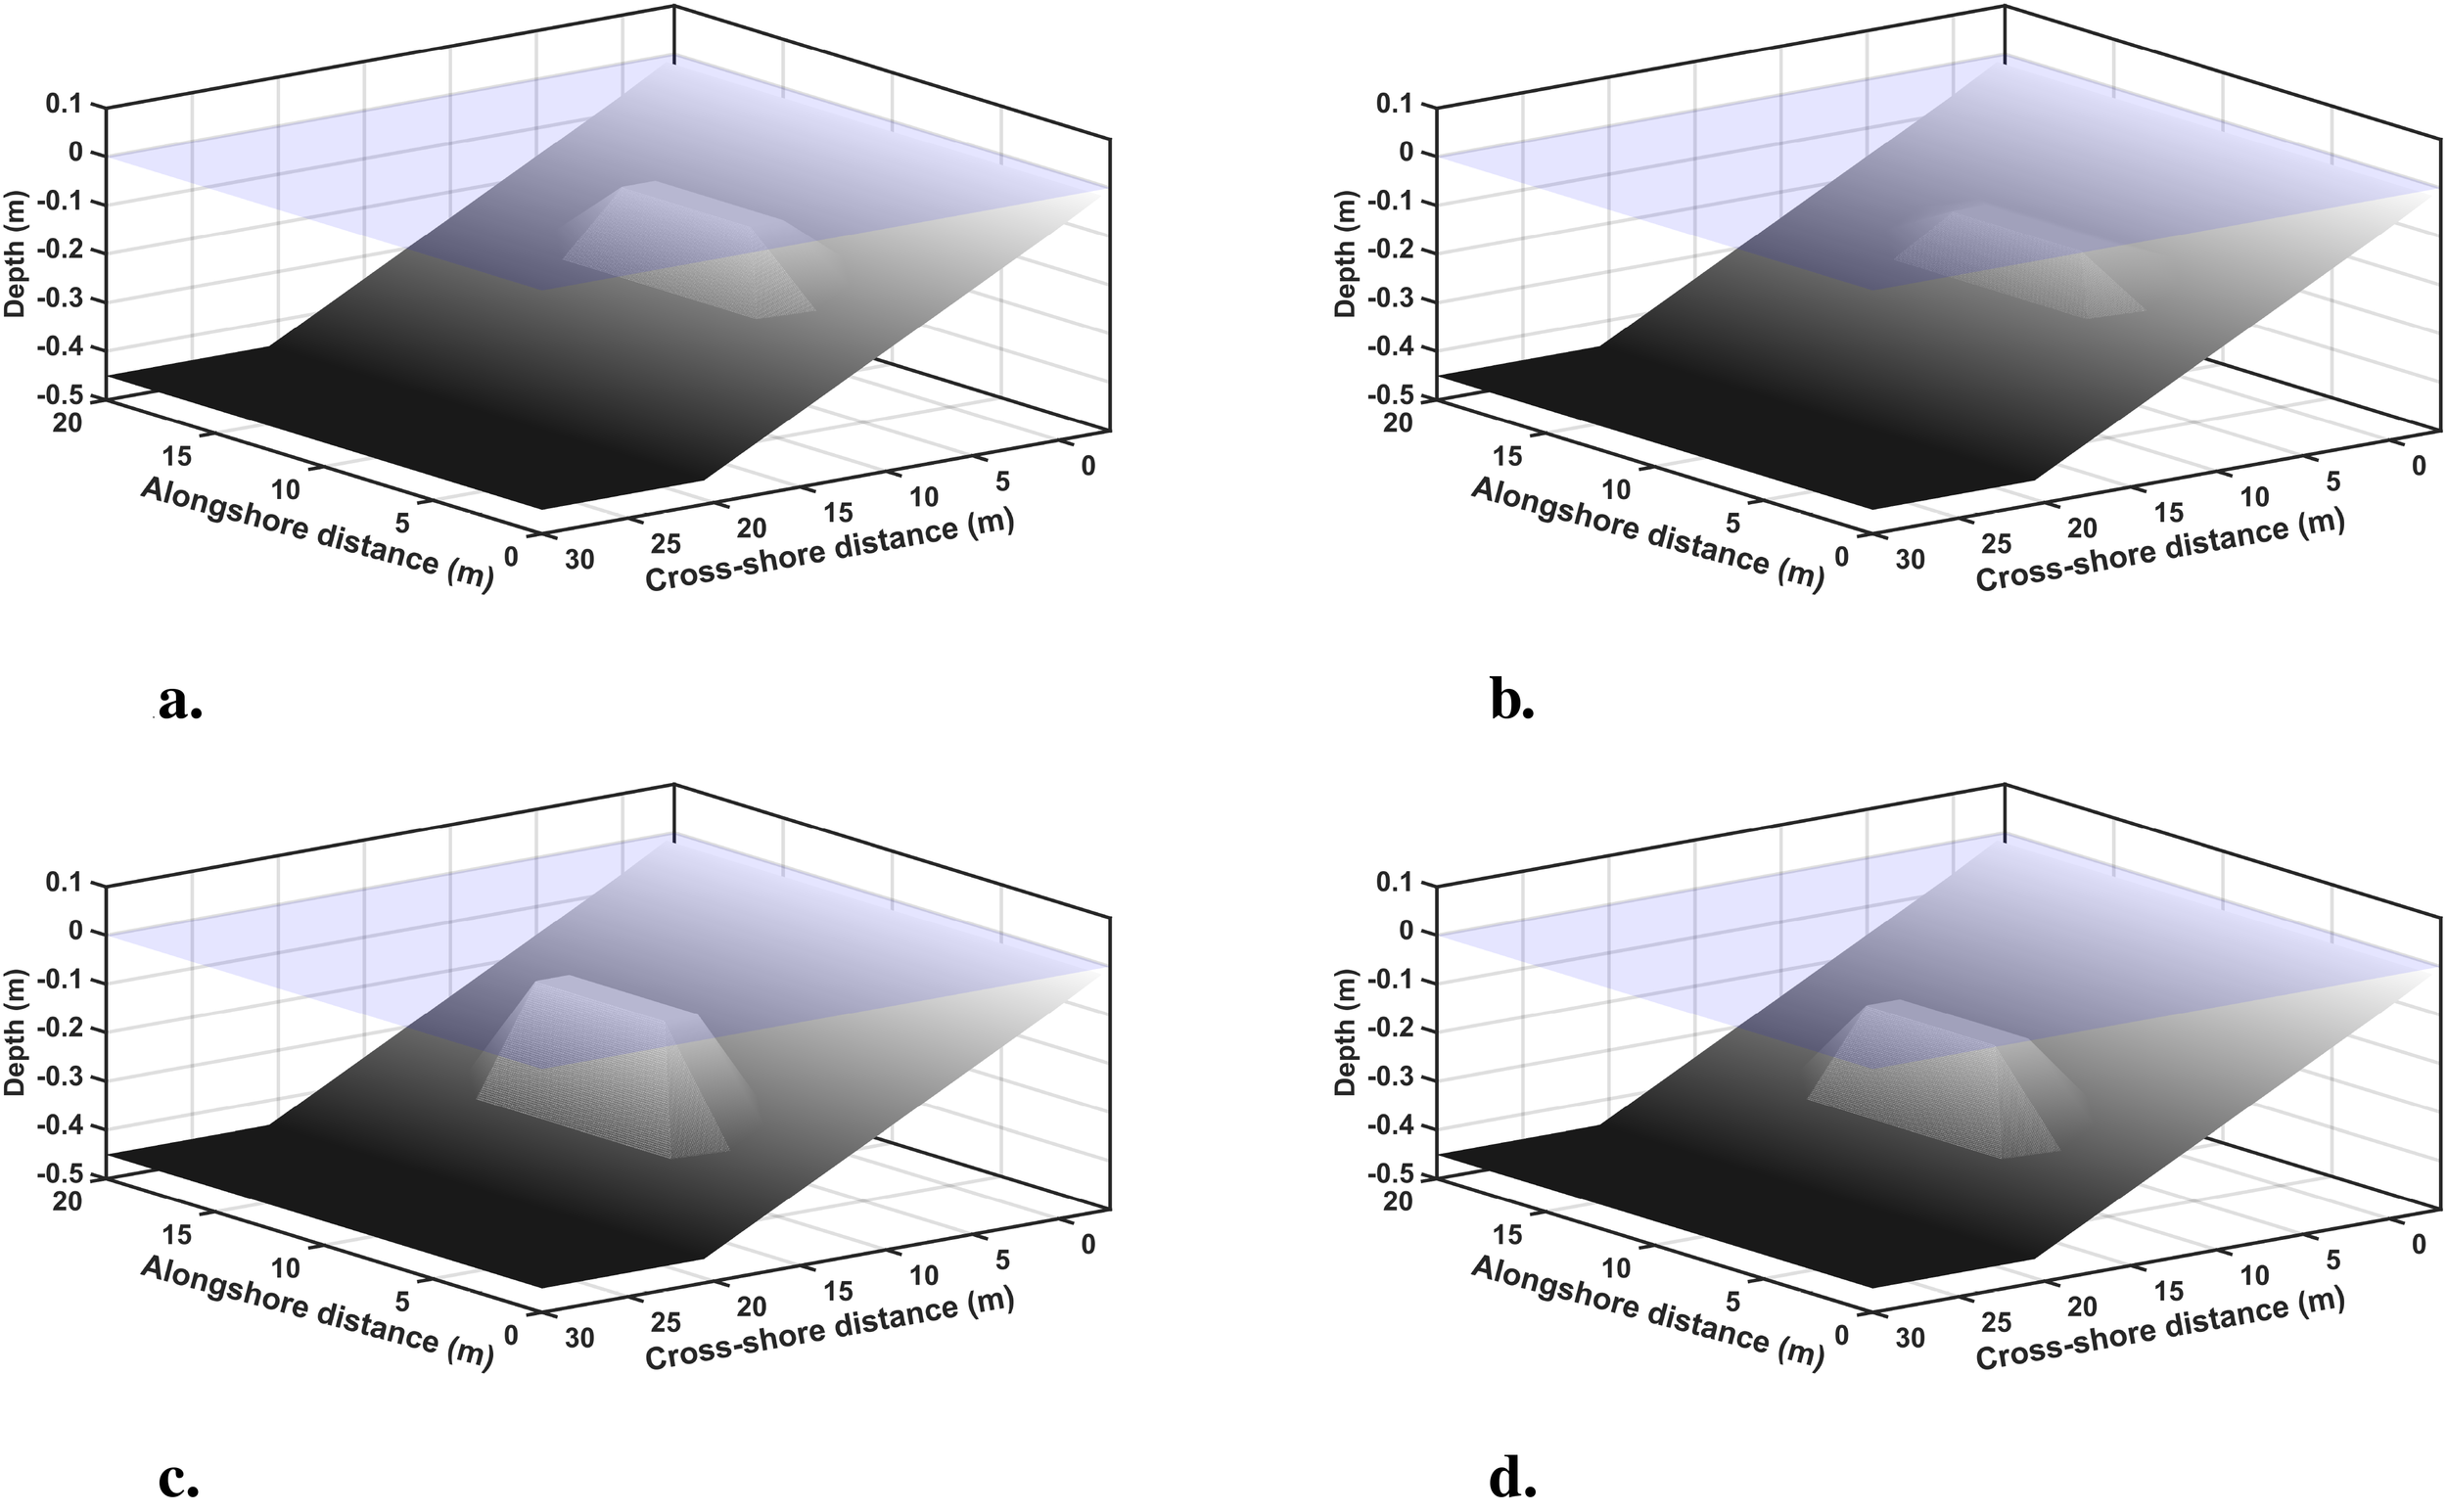
Definition sketch of 3-D numerical wave basin. (a) the offshore distance 8 m from the shoreline and the vertical distance 0.10 m from the water surface to the submerged structure crest (b) the offshore distance 8 m from the shoreline and the vertical distance 0.15 m from the water surface to the submerged structure crest (c) the offshore distance 13 m from the shoreline and the vertical distance 0.10 m from the water surface to the submerged structure crest (d) the offshore distance 13 m from the shoreline and the vertical distance 0.15 m from the water surface to the submerged structure crest.
2.3 Numerical simulation conditions
As shown in Figure 1, the numerical simulation grid was configured into four cases based on the distance from the shoreline and water surface to the submerged break-water. The incident wave conditions followed the regular wave heights and periods in Table 1. This study focused on understanding the characteristics of regular waves, with plans to extend the analysis to irregular wave conditions in future research. Since long-duration wave generation was unnecessary for regular waves, the wave generation time was optimized to minimize the influence of reflected waves.
Table 1
| Case No. | T (s) | H (m) |
|---|---|---|
| 1 | 1.0 | 0.075 |
| 2 | 2.0 | 0.075 |
| 3 | 3.0 | 0.075 |
| 4 | 1.0 | 0.100 |
| 5 | 2.0 | 0.100 |
| 6 | 3.0 | 0.100 |
| 7 | 1.0 | 0.125 |
| 8 | 2.0 | 0.125 |
| 9 | 3.0 | 0.125 |
| 10 | 1.0 | 0.150 |
| 11 | 2.0 | 0.150 |
| 12 | 3.0 | 0.150 |
Incident wave specifications for behavioral characteristics and shoreline response.
Figure 2 presents the time series data of surface displacement for a wave height of 0.150 m at different periods (Case 10-12), showing the incident wave profile most accurately reproduced at the center of the wave generation zone. The target waves were also closely matched throughout the wave generation for other experimental wave conditions. This confirms that the accuracy of the incident waves was sufficiently ensured for analyzing the physical characteristics of the submerged breakwater in the coastal environment.
Figure 2
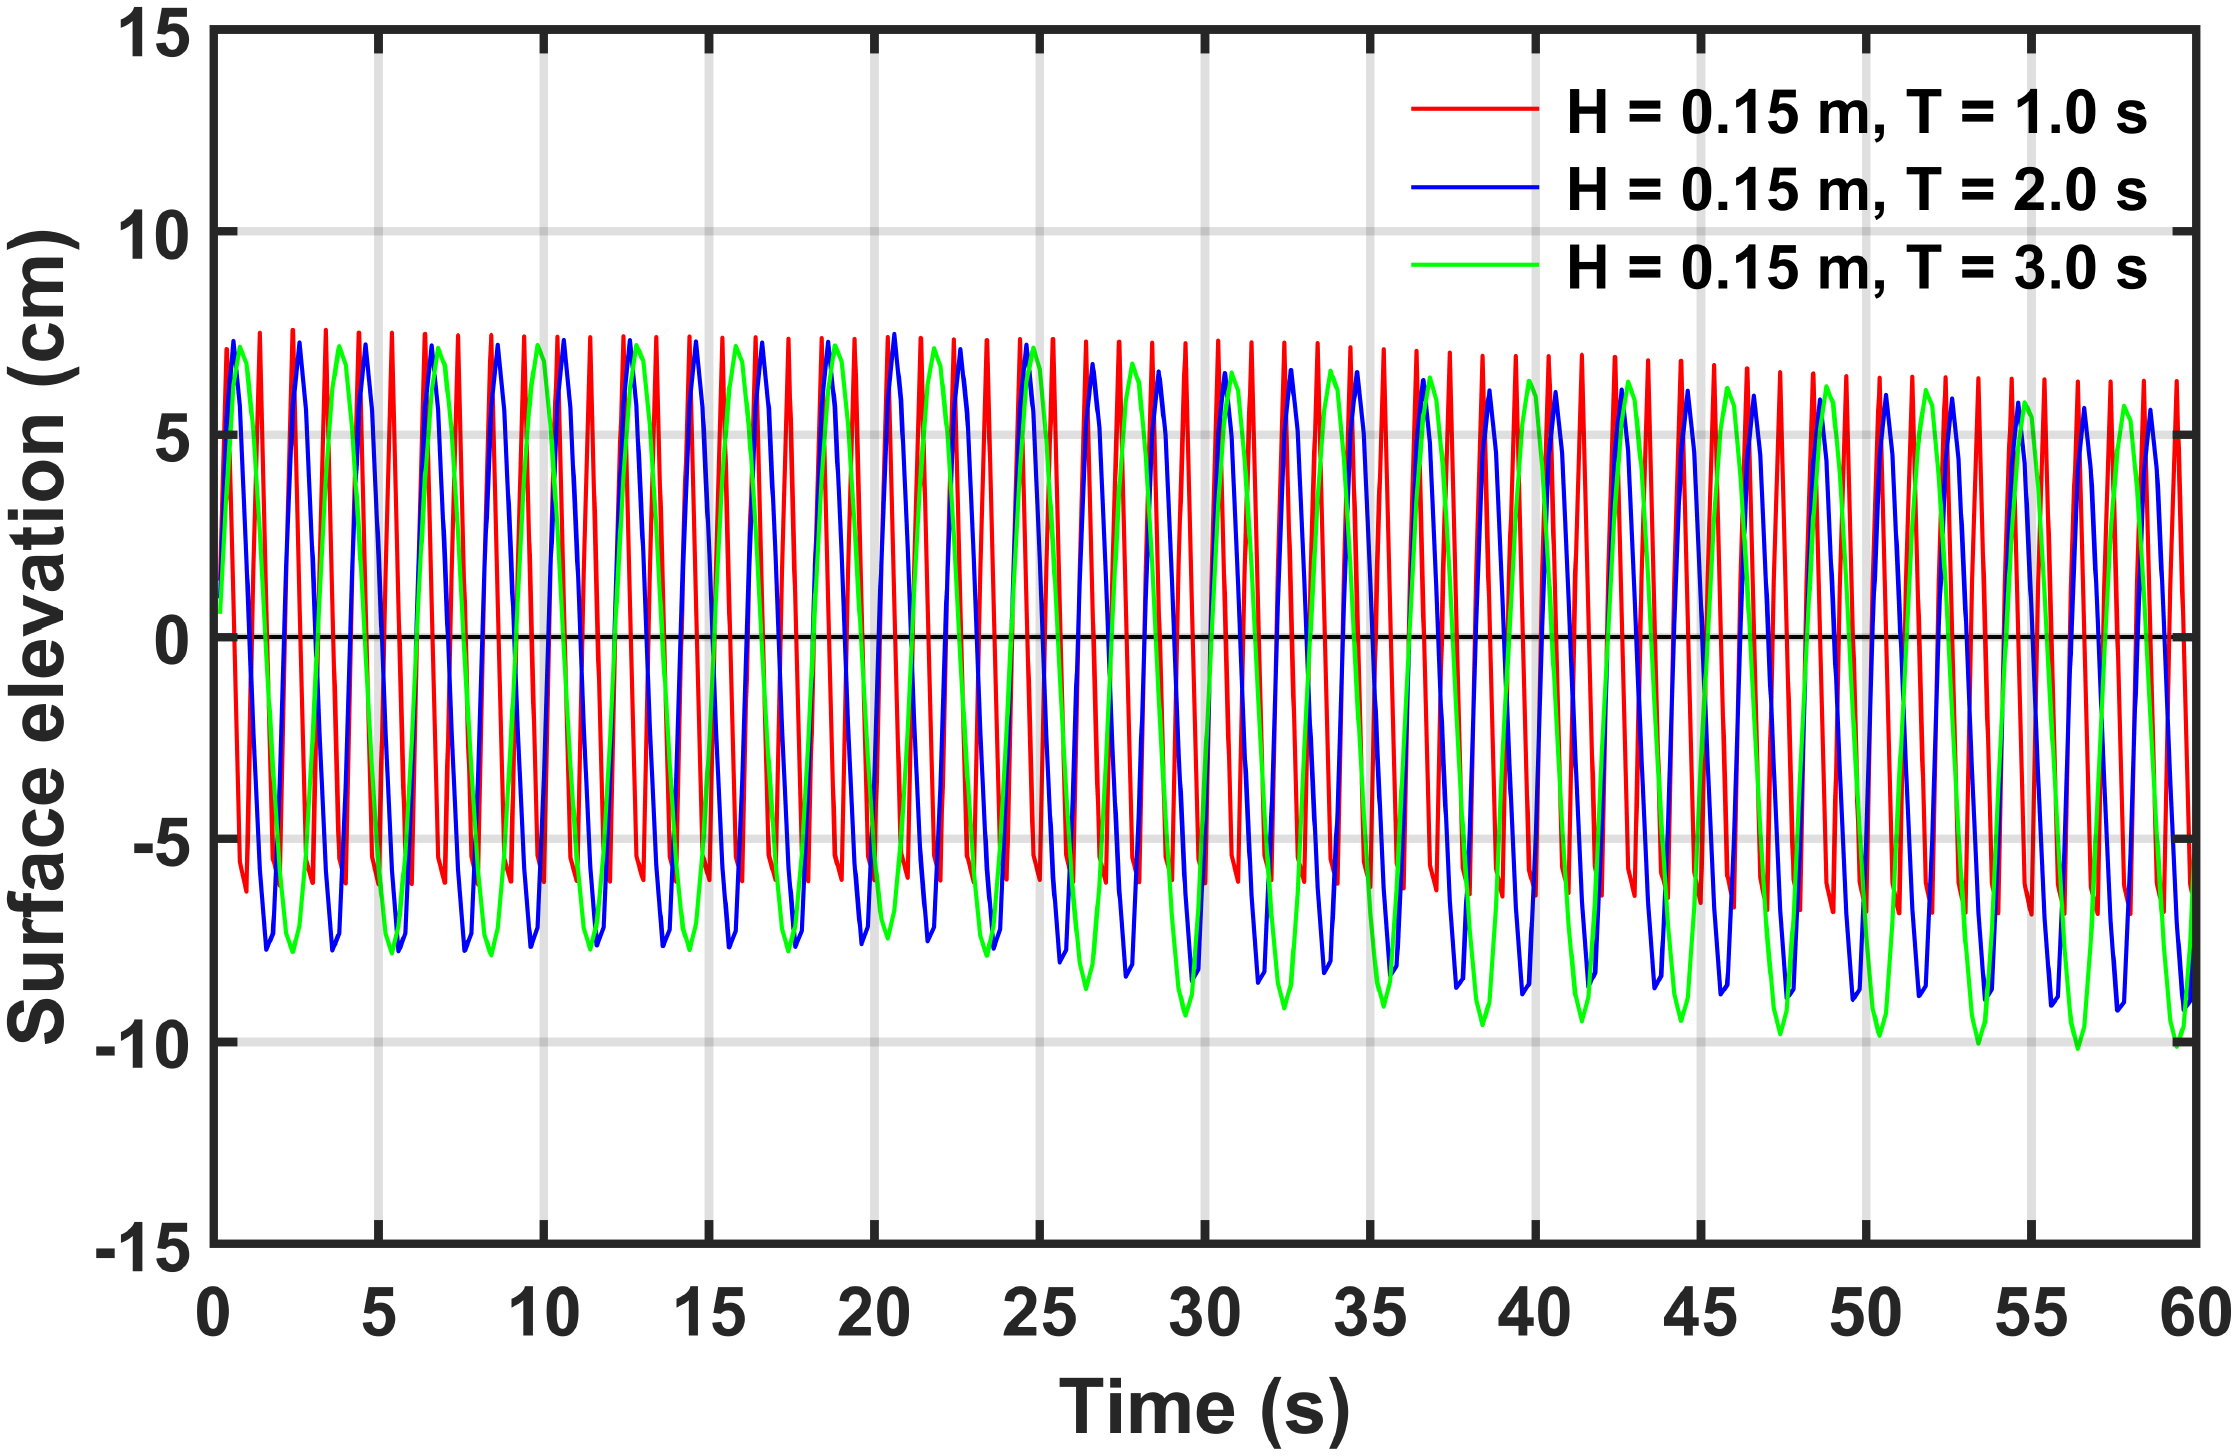
Time series data of water surface elevation at the center of the wave generation zone (H = 0.150 m, T = 1.0 s, 2.0 s, 3.0 s).
A numerical model was used to measure surface displacement and velocity components around the submerged breakwater to investigate flow patterns and shoreline response installed in the coastal area. The mean surface displacements, wave heights, and depth-averaged velocity distributions were computed based on these measurements. The numerical simulation results were analyzed by categorizing them according to the offshore distance from the shoreline and the vertical distance from the water surface to the breakwater crest. This analysis enabled the prediction of shoreline response based on flow patterns around the breakwater. Furthermore, the shoreline response due to the submerged breakwater dimensions and experimental wave conditions was compared with previous studies (Ranasinghe et al., 2010).
3 Results
Numerical simulation results were presented to investigate the hydrodynamic behavior and flow patterns of a coastal region with a submerged breakwater. To evaluate the wave attenuation effects of the structure and its influence on shoreline response, mean surface elevation, wave height distribution, and velocity distribution were computed and analyzed under various experimental conditions.
3.1 Mean surface elevations
The mean surface elevation was calculated by time-averaging the measured water surface variations at each grid point. The physical mechanisms of wave transformation, transmission through the submerged breakwater, and wave energy dissipation were identified by analyzing the mean surface elevation across all experimental conditions.
Figure 3 is a snapshot of the surface displacement approximately 40 s after the start of wave generation under the experimental condition where the submerged breakwater is installed 13 m from the shoreline and 0.10 m from the water surface(lx). As waves propagated over the breakwater, deformation occurred on the leeward side of the structure, with variations observed depending on the wave period under the same incident wave height condition.
Figure 3
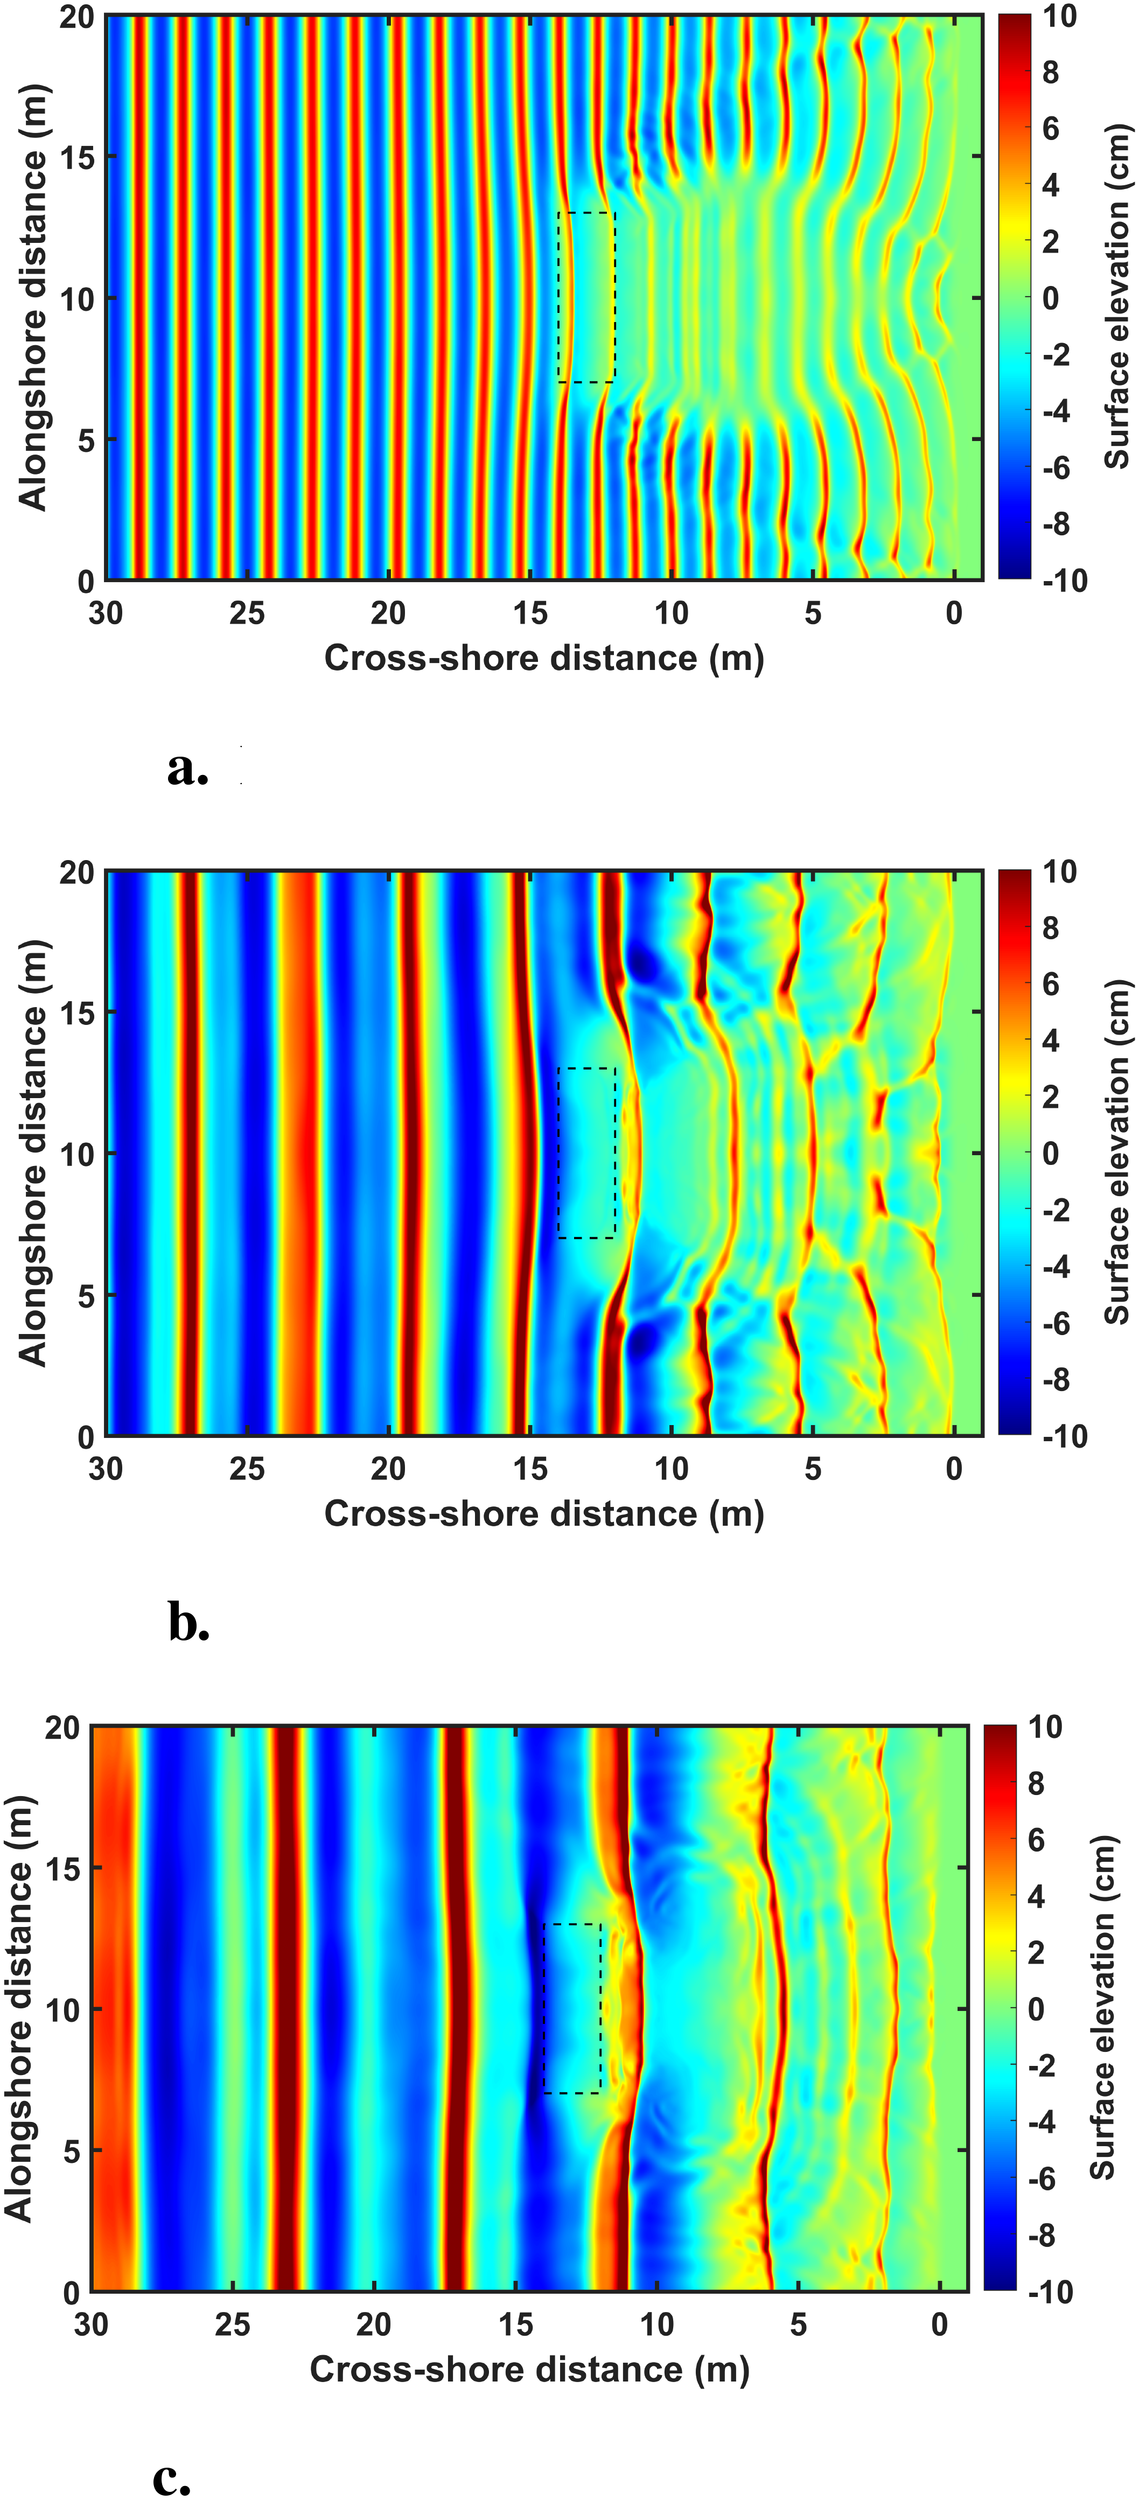
Snapshots of water level variations under H = 0.150 m of the incident wave conditions. (a) T = 1.0 s (b) T = 2.0 s (c) T = 3.0 s.
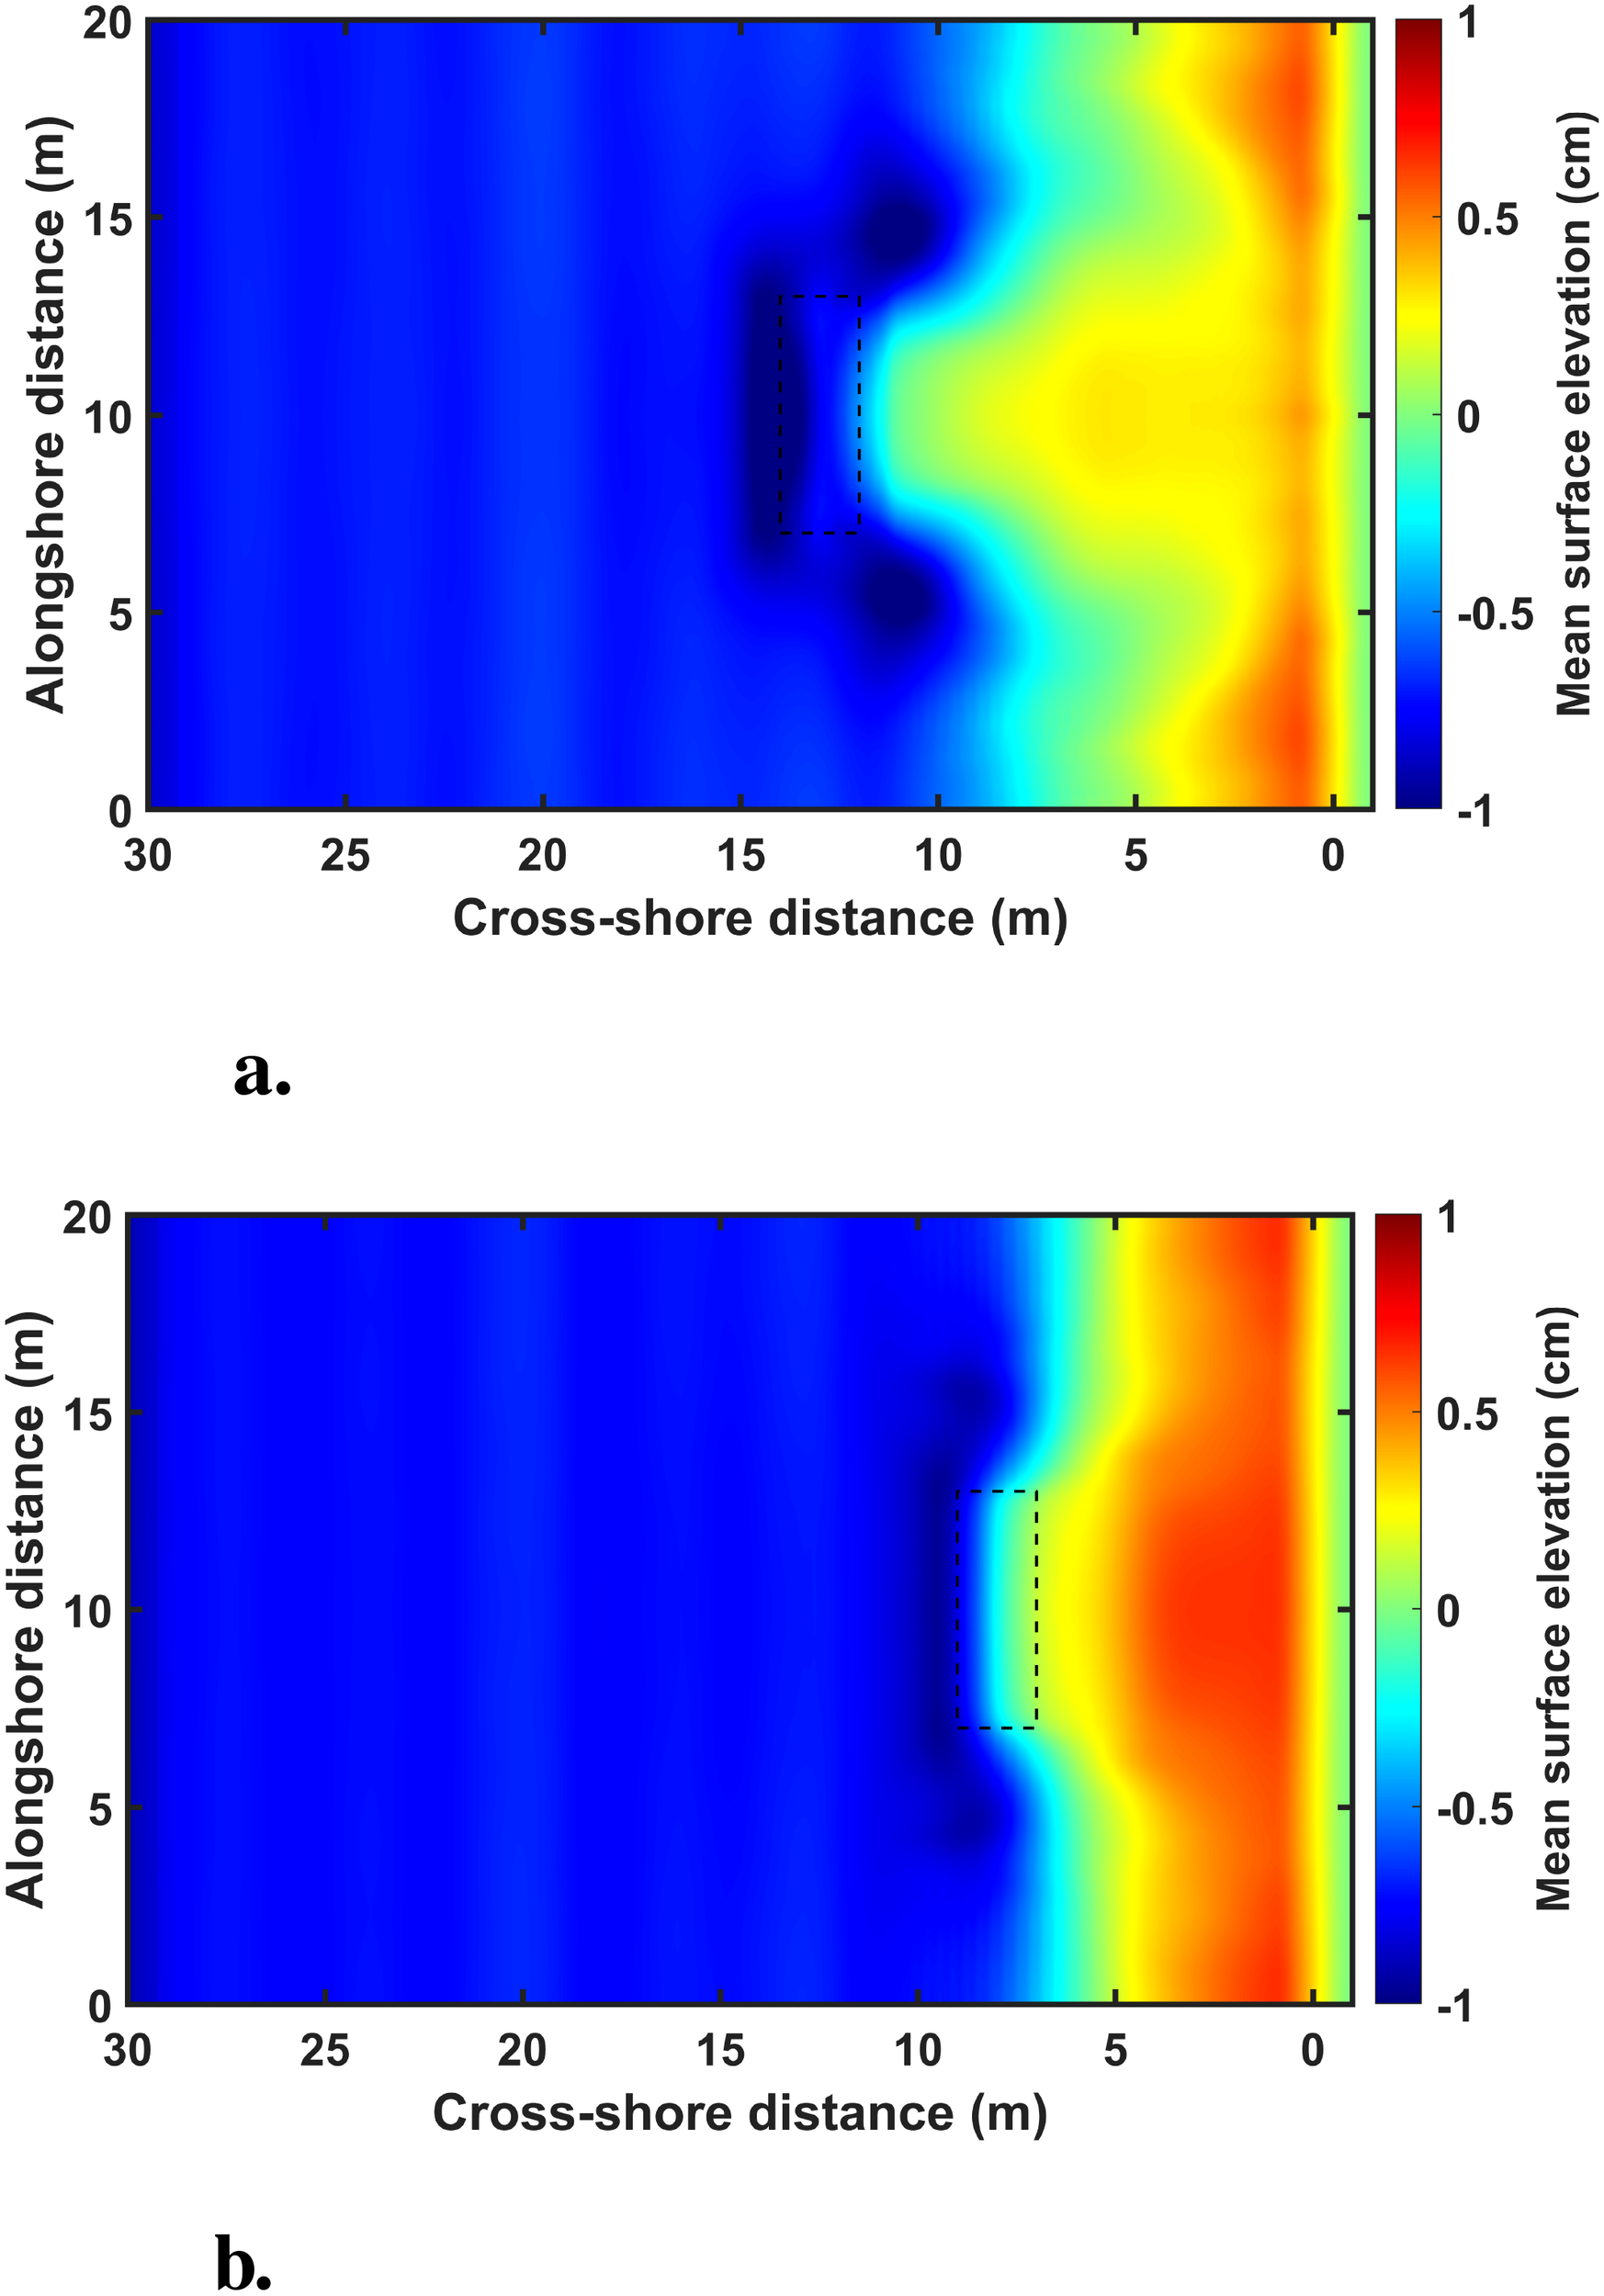
Figure 4 presents the mean surface elevation under Case 3 (H = 0.075 m, T = 3.0 s) at a distance of 13 m from the shoreline under different water surface experimental conditions. Specifically, Figure 4A corresponds to the sb is 0.10 m, while Figure 4B represents the sb is 0.15 m. As the incident waves passed over the breakwater crest, the mean surface level dropped sharply due to wave breaking, and then a wave setup was experienced near the shoreline. In particular, the greater vertical distance from the water surface to the submerged breakwater crest resulted in a more pronounced wave setup in the central region near the shoreline compared to cases with a smaller vertical distance.
Figure 4
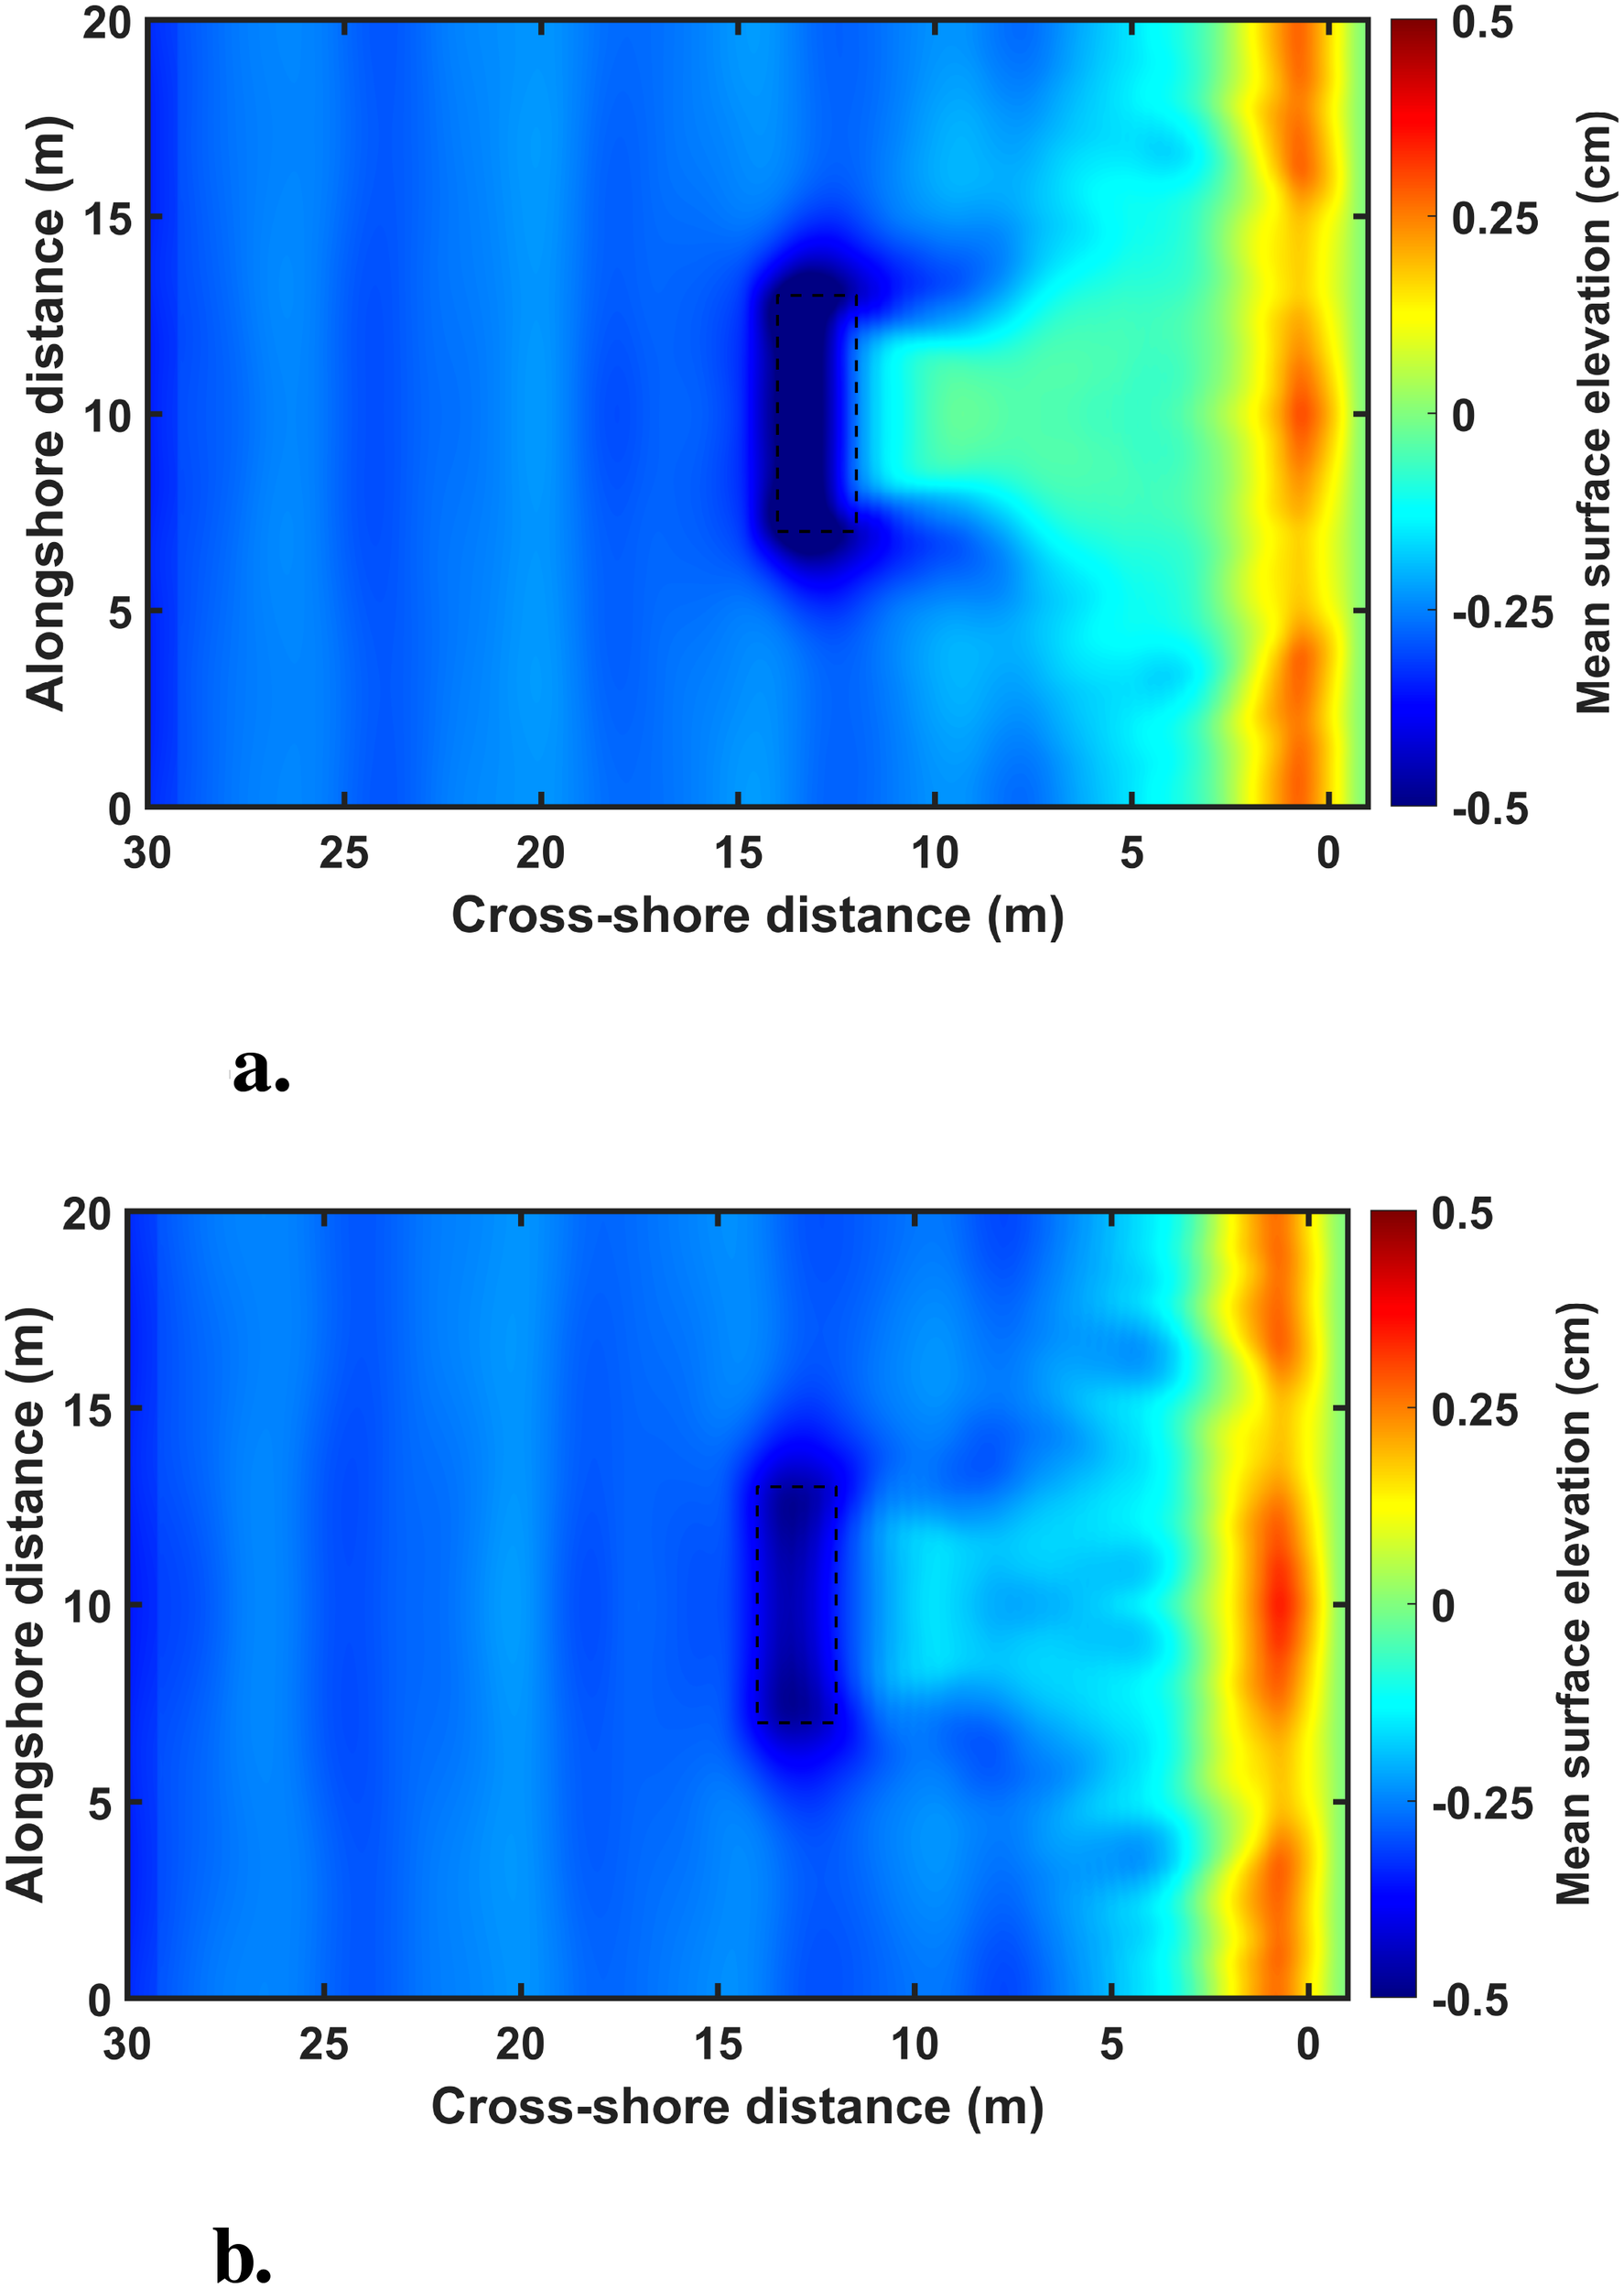
Mean surface elevations under H = 0.075 m and T = 3.0 s at the distance 13 m from the shoreline. (a) vertical distance 0.10 m from the water surface to the submerged structure crest (b) vertical distance 0.15 m from the water surface to the submerged structure crest.
Figure 5 shows the mean surface elevation under the same experimental conditions Case 8 (H = 0.125 m, T = 2.0 s) at the distance of 0.10 m from the water surface(sb), varying by the installation location of the submerged breakwater. When the offshore distance from the shoreline was shorter, the setup phenomenon was more pronounced, and an immediate increase in mean surface elevation was observed on the leeward side. This suggests that the offshore distance is one of the crucial factors influencing the intensity of breaking-induced currents over the submerged breakwater crest.
Figure 5
Mean surface elevations under H = 0.125 m and T = 2.0 s. (a)lx = 13 m (b)lx = 8 m.
3.2 Wave height distributions
The wave height distribution was calculated using the zero-crossing method based on the surface displacement results at each grid point. The overall wave height distribution provides insight into the wave energy transmission process, and in particular, it confirms the wave attenuation effect as the submerged breakwater reduces transmitted wave energy.
Figure 6 presents the wave height distribution under the experimental condition. Before reaching the breakwater, the wave height increased, but a sharp decrease was observed as the waves passed over the breakwater. The wave attenuation effect was most significant at the center of the breakwater, and differences in wave height distribution on the front and rear sides of the structure were observed depending on the vertical distance from the water surface to the breakwater crest.
Figure 6
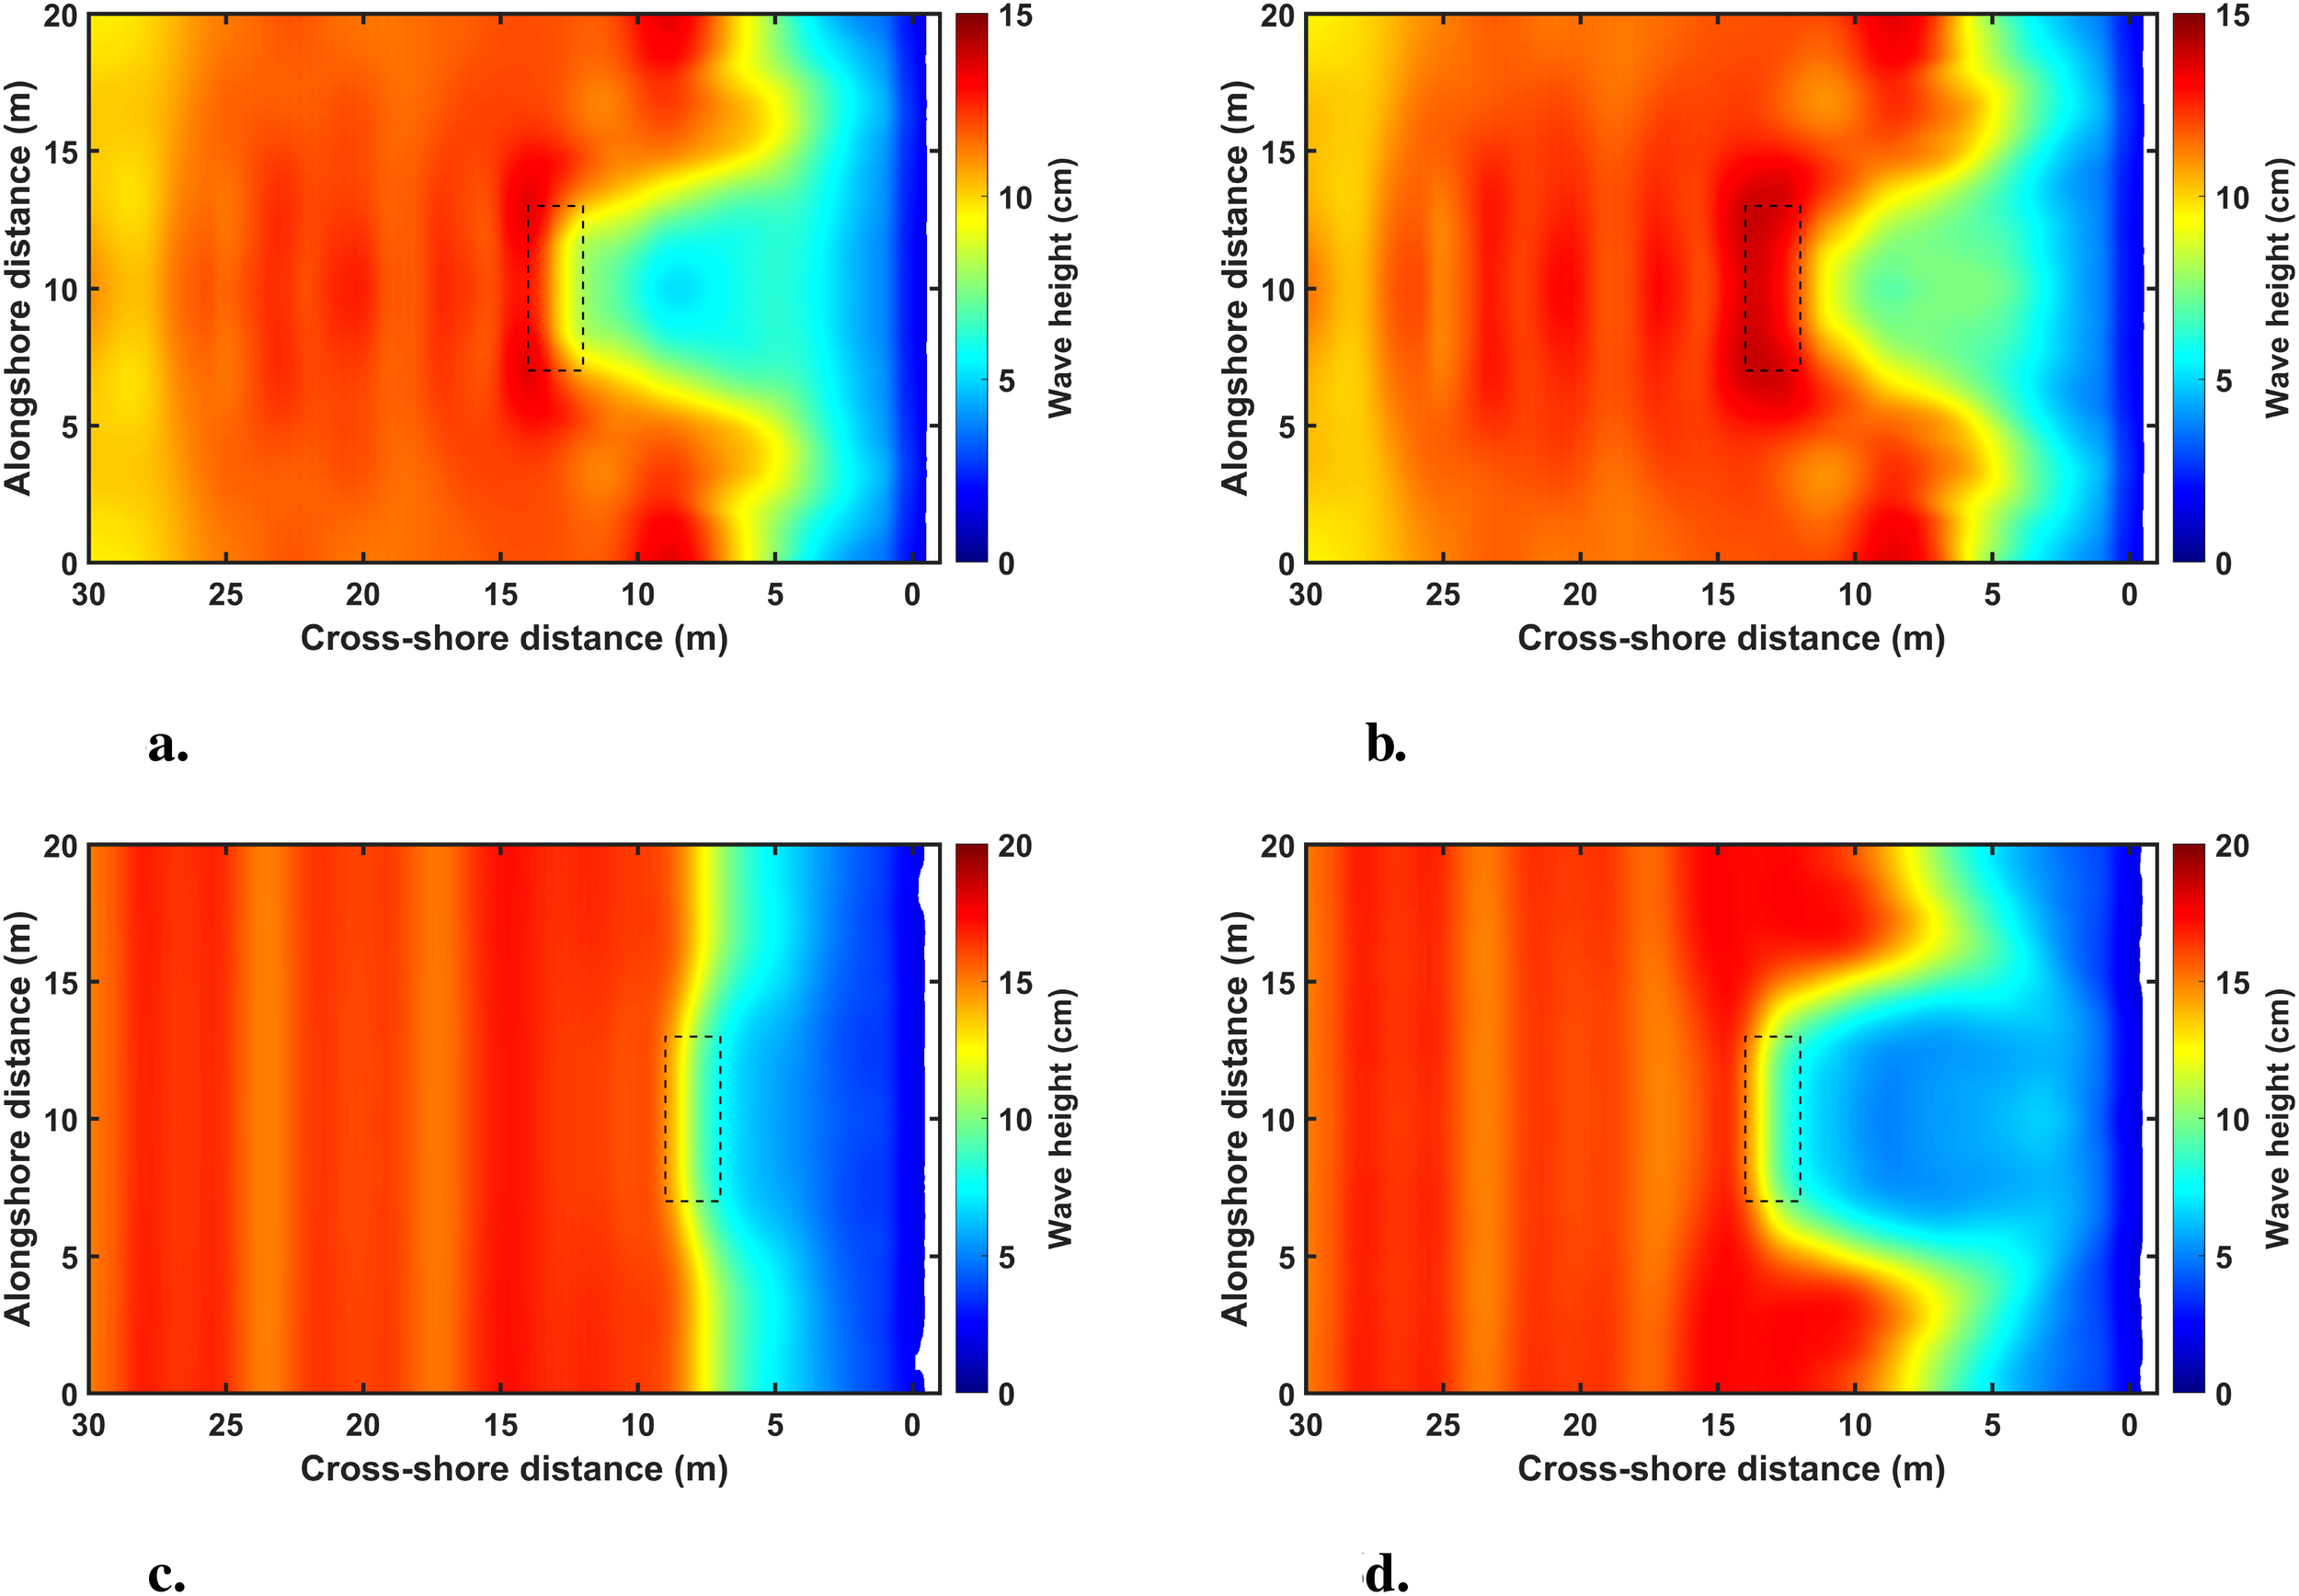
Wave height distributions as a function of incident wave conditions and submerged breakwater dimensions. (a) Case 6, lx = 13 m, sb = 0.10 m (b) Case 6, lx = 13 m, sb = 0.15 m (c) Case 11, lx = 8 m, sb = 0.15 m (d) Case 11, lx = 13 m, sb = 0.15 m.
Figure 7 illustrates the wave height ratio in the cross-shore direction at the center of the submerged breakwater under the incident wave condition, which is the 2 s wave period, varying by lx and sb. Here, Hi denotes the incident wave height, while Ho represents the wave height obtained from numerical simulations. The shaded region in the figure indicates the breakwater installation zone. Across all experimental conditions, the wave height consistently decreased as the waves propagated through the submerged breakwater. Wave attenuation rates for all experimental wave conditions were summarized as shown in Table 2. When lx = 8 m, the wave attenuation effect was approximately 3%–5% greater compared to lx = 13 m. Furthermore, under the same lx condition, the wave attenuation effect was about 15%–18% higher when sb = 0.1 m. These findings reaffirm the effectiveness of the breakwater in attenuation of waves for coastal protection. Given that the attenuation effect is influenced by breakwater design parameters, careful consideration is essential during the design process.
Figure 7
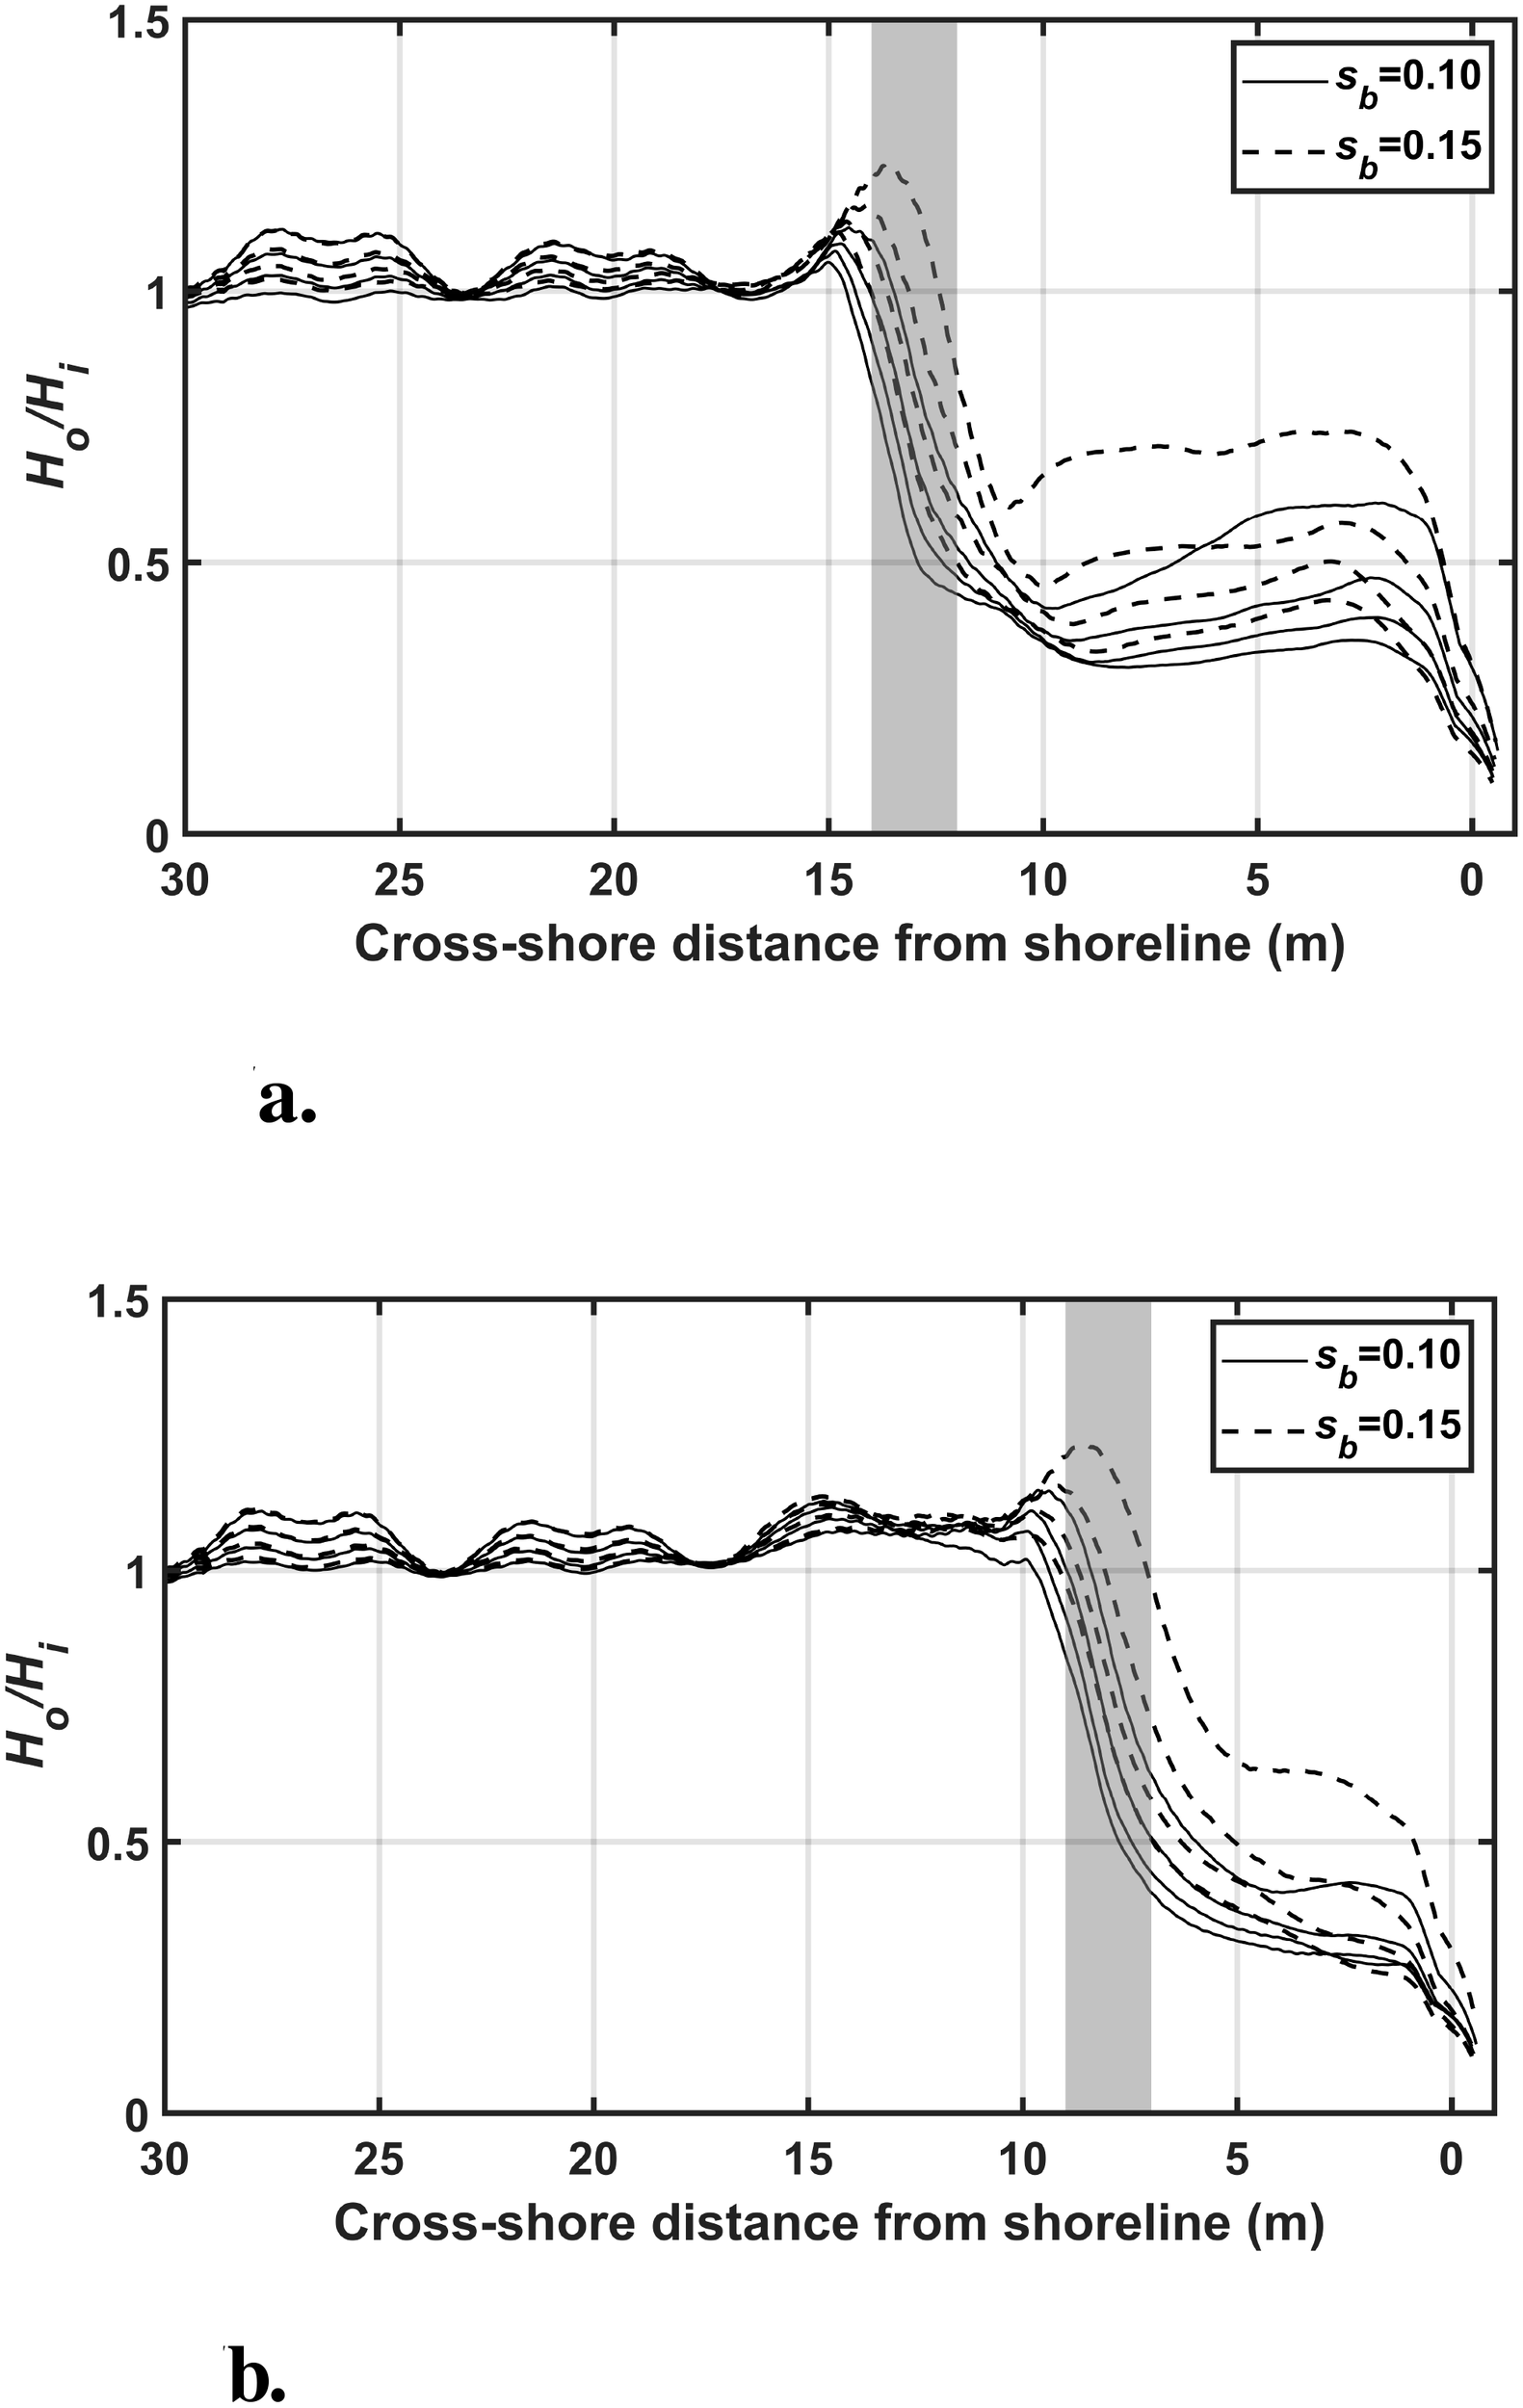
Wave height ratio (T = 2.0 s) of incident wave height to calculated wave height along the cross-shore distance from the shoreline. (a) the offshore distance 13 m from the shoreline (b) the offshore distance 8 m from the shoreline.
Table 2
| lx | sb | Mean (%) | Std. Dev. (%) |
|---|---|---|---|
| 8 | 0.10 | 58.4 | 9.9 |
| 8 | 0.15 | 40.8 | 17.8 |
| 13 | 0.10 | 53.2 | 11.3 |
| 13 | 0.15 | 37.9 | 17.5 |
Wave attenuation rate by experimental condition according to lx and sb.
3.3 Shoreline response
The installation of the submerged breakwater plays a significant role in mitigating shoreline changes by reducing incoming wave energy and altering nearshore current patterns. Under erosive conditions, the breakwater diminishes wave height at the shore, thereby reducing the potential for scouring and landward retreat of the beach. In depositional or accretion conditions, it promotes sediment stabilization by lowering hydrodynamic forcing in the lee zone. As a result, the structure contributes to minimizing both erosion and unintended excessive accretion, supporting a more stable shoreline morphology. To investigate how these processes influence actual shoreline responses, the flow patterns behind the submerged breakwater were analyzed in detail.
The flow pattern behind the submerged breakwater was analyzed to predict shoreline response. Ranasinghe et al. (2006) reports that the flow patterns in the vicinity of a submerged breakwater may be applied to categorize between erosion and accretion conditions at the shoreline. As shown in Figure 8, if four rotational flows with convergence at the shoreline are observed, the shoreline response can be predicted as an accretion response. In contrast, if two rotational flows with divergence at the shoreline appear, the shoreline response is expected to be an erosion response, as seen in Figure 9 (Ranasinghe et al., 2010).
Figure 8
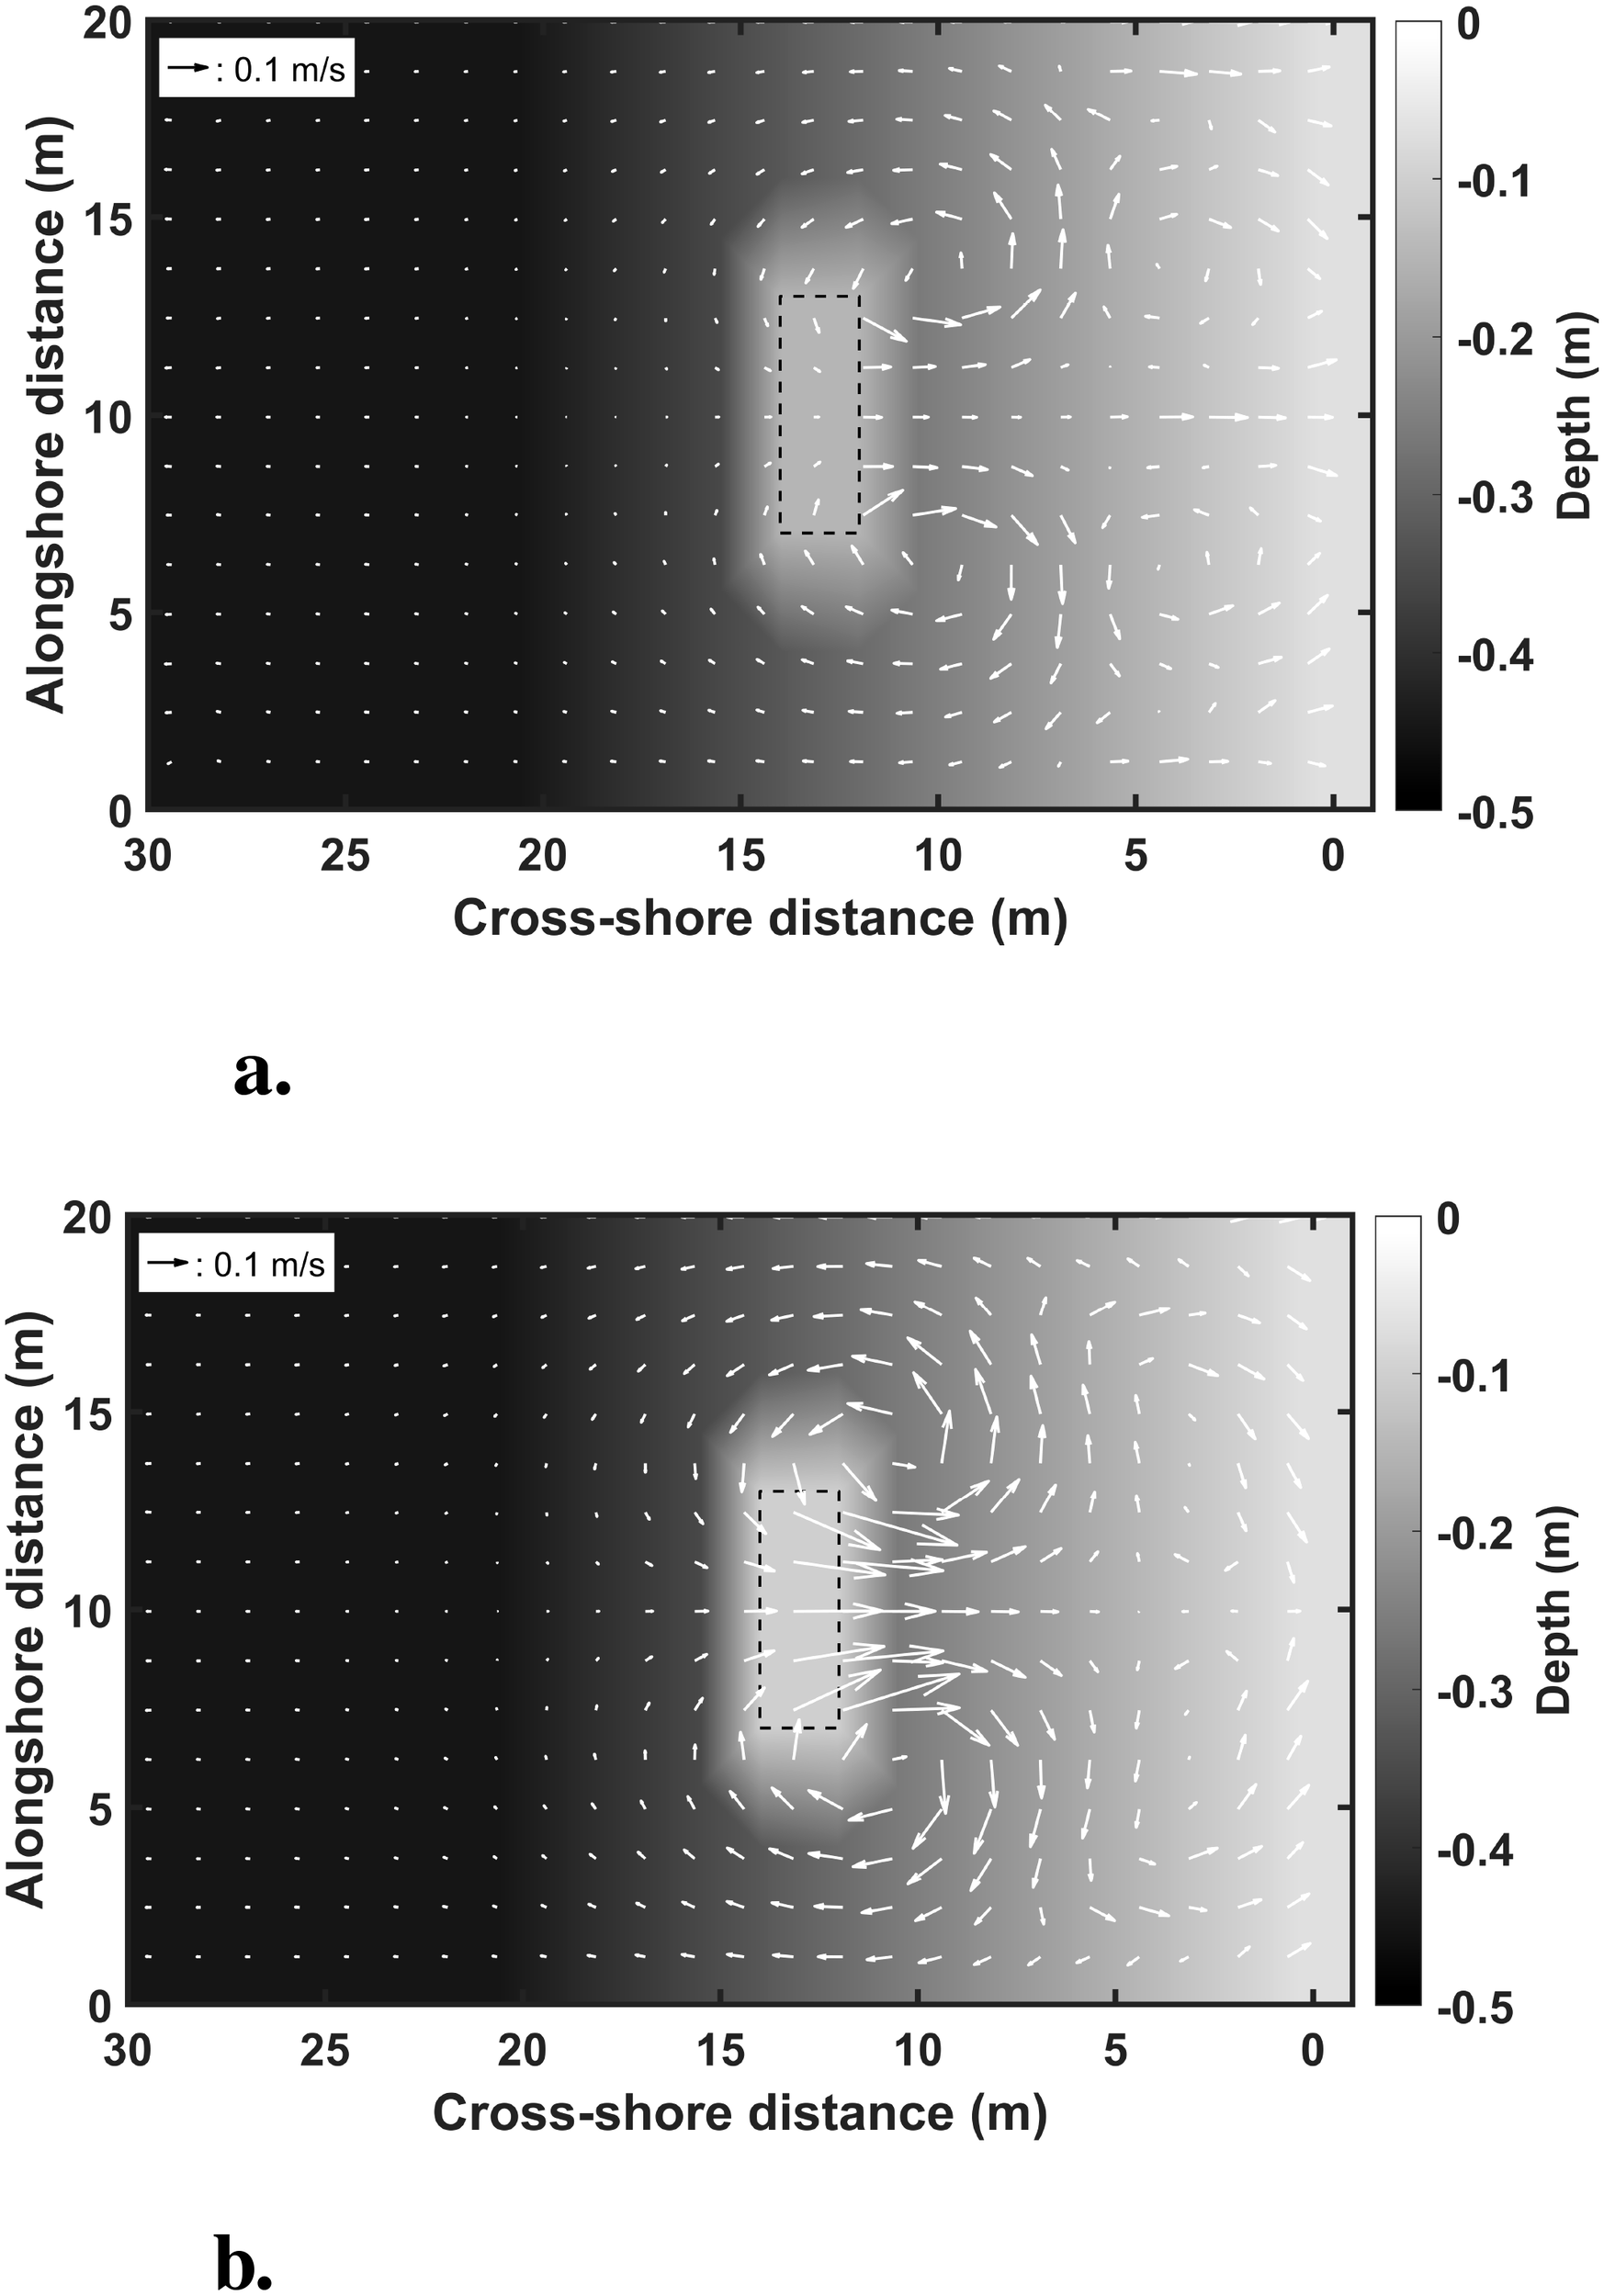
Velocity vectors about shoreline accretion response. (a) accretion flow pattern of lx = 13 m, sb = 0.15 m (b) accretion flow pattern of lx = 13 m, sb = 0.10 m.
Figure 9
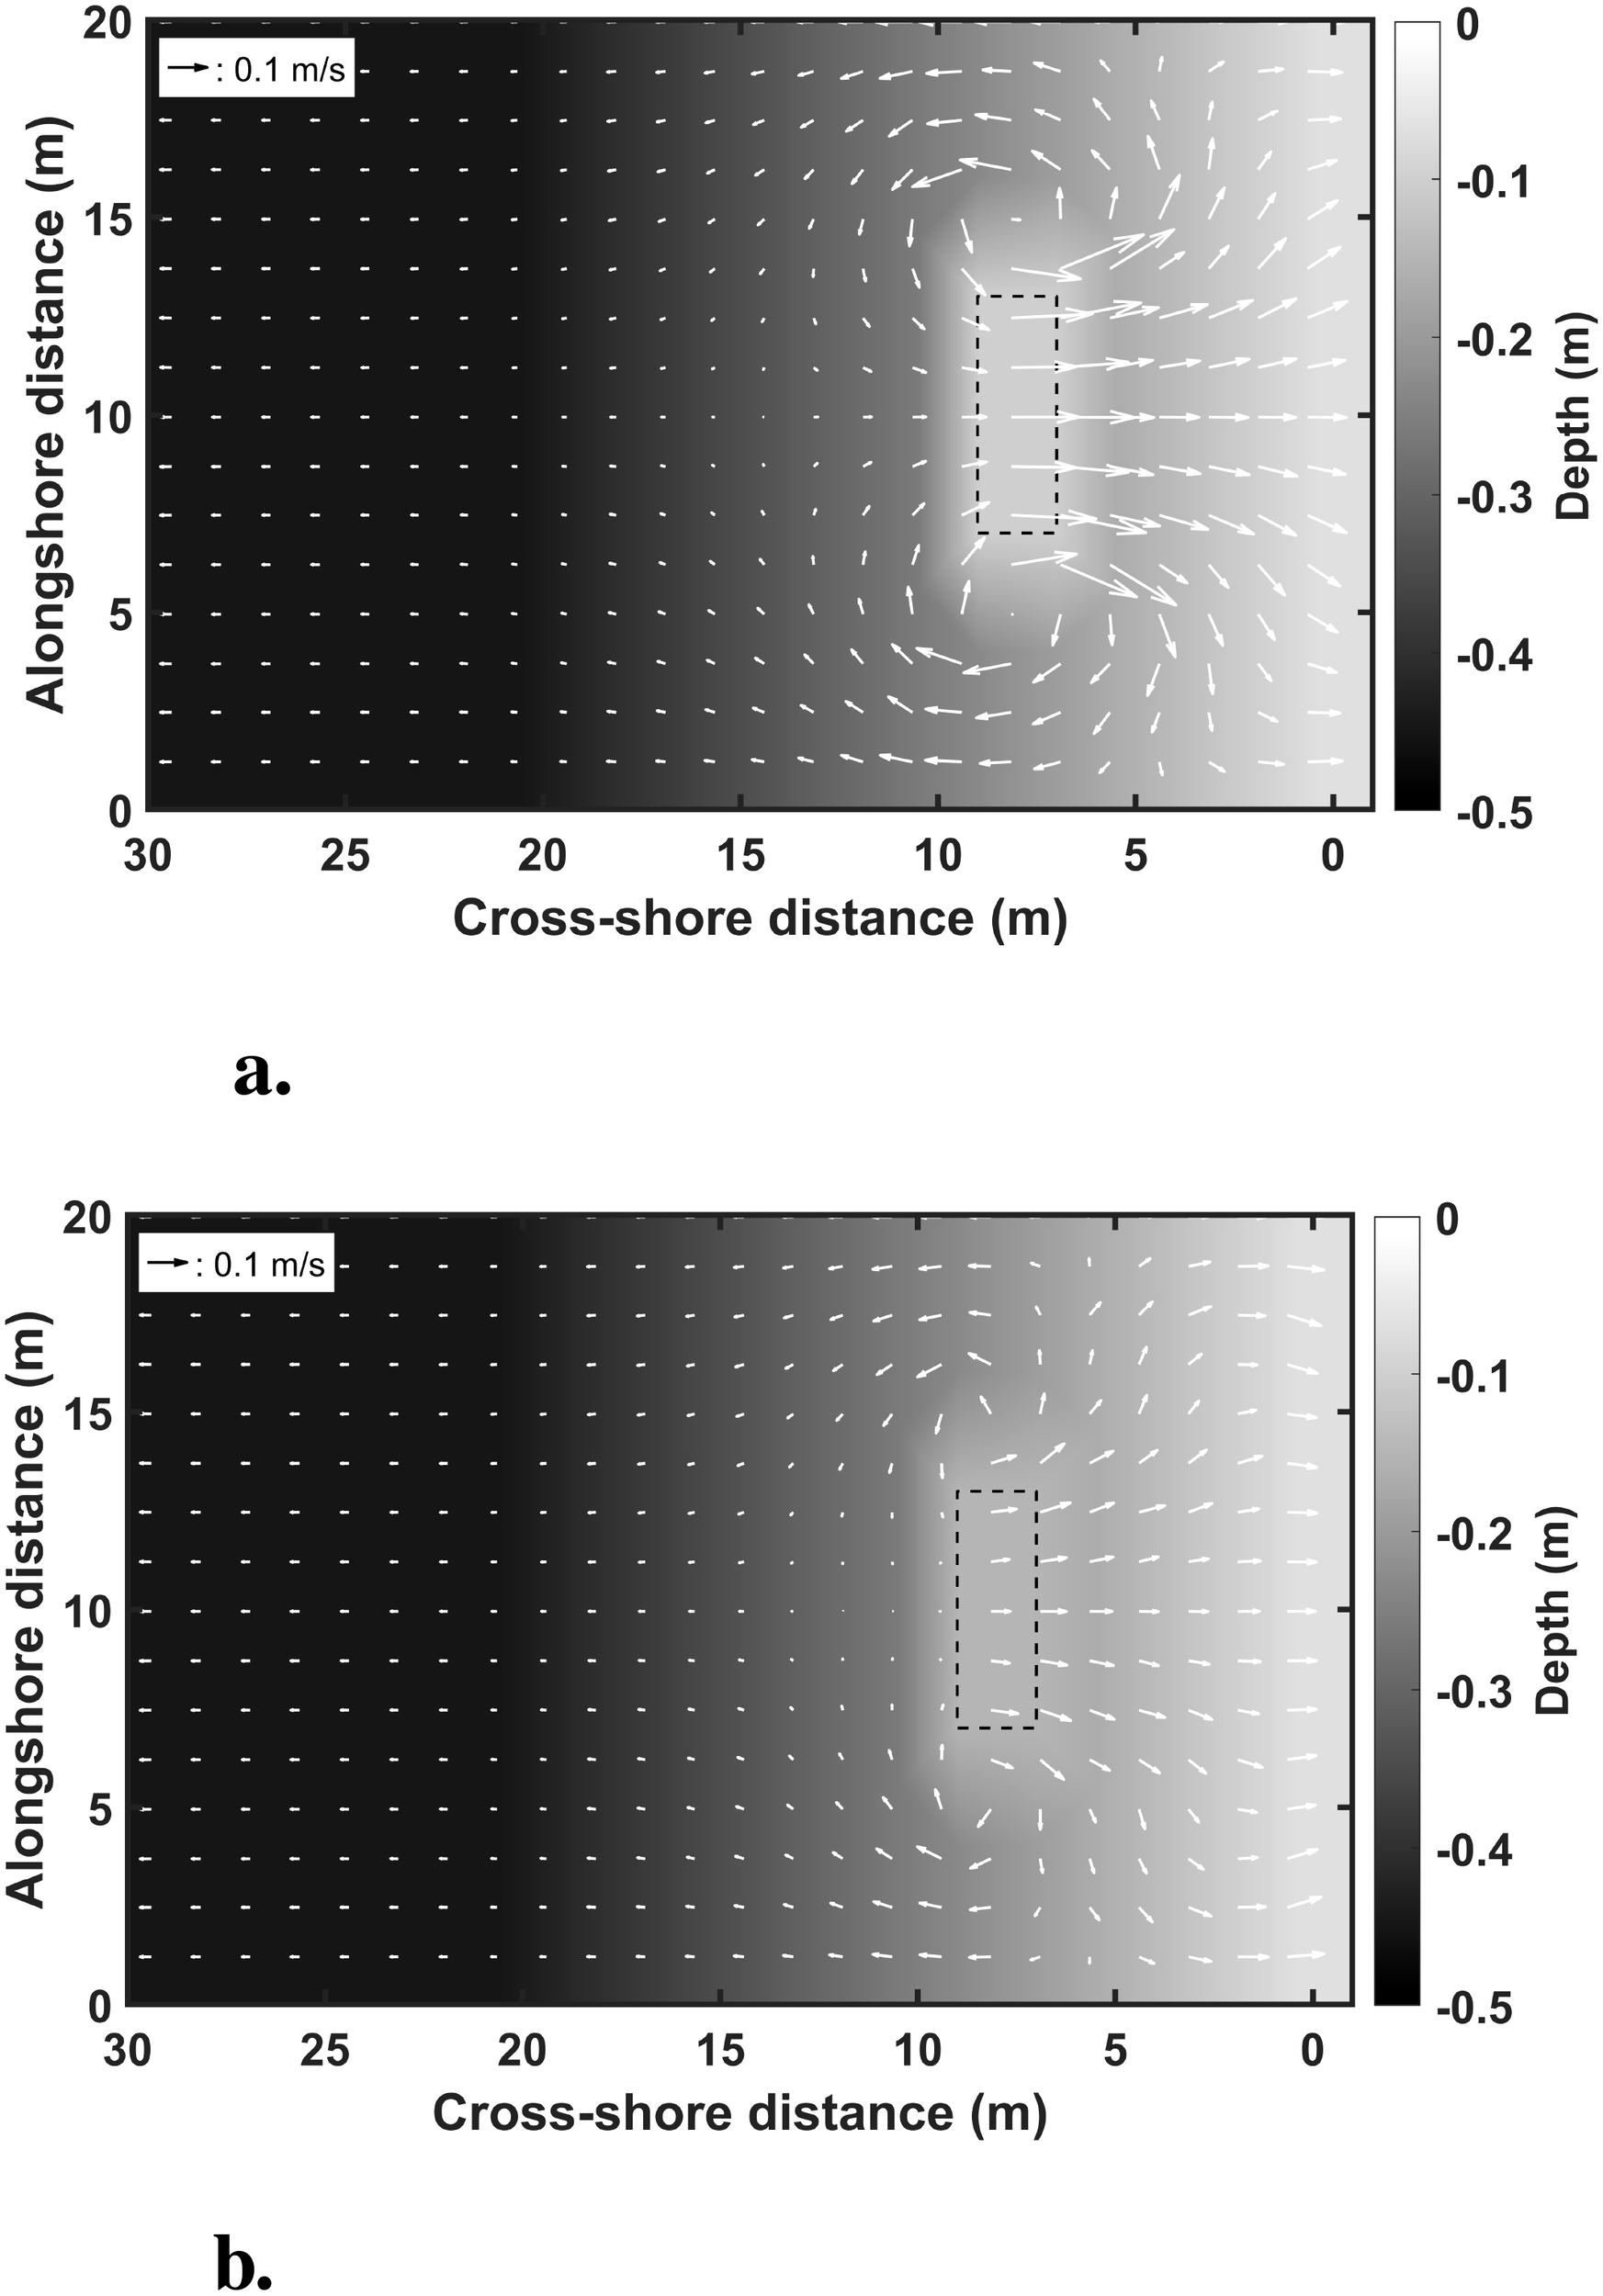
Velocity vectors about shoreline erosion response. (a) erosion flow pattern of lx = 8 m, sb = 0.10 m (b) erosion flow pattern of lx = 8 m, sb = 0.15 m.
To analyze the flow pattern in the coastal area with the submerged breakwater based on numerical simulation results, the average values of three vertical layers at the exact horizontal location were used in a grid coordinate system composed of three vertical layers. This approach accounts for the fact that shoreline erosion and accretion are influenced not only by surface flow patterns but also by the effects of nearshore currents, undertows, and other flows occurring throughout the entire water column. Therefore, depth-averaged velocity vectors were used to distinguish the depth effects on these hydrodynamic behaviors.
The flow pattern on the leeward side was analyzed based on the incident wave conditions and breakwater dimensions to assess the shoreline response. Overall, the installation location of the submerged breakwater is the most essential factor in predicting shoreline changes. Under the same experimental conditions, the parameter of a distance from the water surface appears to influence the intensity of breaking-induced currents. Strong breaking-induced currents developed over the breakwater crest when the submerged breakwater was installed closer to the shoreline, forming two large flow patterns. On the other hand, breaking-induced currents were not fully established when the breakwater was positioned farther from the shoreline, with a greater vertical distance between the crest and the water surface. Instead, four smaller rotational flow patterns emerged, generated by vortices forming at both ends of the breakwater.
When two large flow patterns are observed, an erosion response is expected at the central region of the shoreline behind the submerged breakwater. Conversely, when four smaller flow patterns develop in the leeward of the breakwater, a deposition response can be predicted at the central region of the shoreline (Ranasinghe et al., 2010). The development and intensity of breaking-induced currents passing over the breakwater crest are the most critical factors in determining the flow patterns behind the structure. These established flow patterns can be used to assess shoreline response. Currently, shoreline response has been predicted based on limited experimental conditions. To improve the reliability of the prediction criteria, additional experimental conditions are planned to be incorporated, and preliminary hydraulic model experiments will be conducted.
4 Conclusions
This study employed the non-hydrostatic numerical model to investigate wave attenuation and shoreline response predictions in a submerged breakwater. The wave attenuation effect and shoreline response varied depending on the submerged breakwater position and vertical distance from the water surface. Overall, the experimental wave conditions with extended periods exhibited a more significant wave attenuation effect.
The flow patterns developing in the lee of the breakwater were influenced by the intensity of breakinginduced currents forming over the breakwater crest. Additionally, the offshore distance of the breakwater and the vertical distance from the water surface to the breakwater crest were closely related to the development of breaking-induced currents. A shorter vertical distance resulted in stronger breakinginduced currents. The flow patterns behind the breakwater are dominant in predicting shoreline response, either as erosion or accretion. Specifically, two prominent flow patterns that developed at both ends of the breakwater were closely associated with an erosion response of the shoreline. Conversely, when two additional flow patterns formed near the shoreline due to interactions with the primary flow structures, the accretion response of the shoreline was predicted. Although this study was limited to regular wave conditions, it served as a necessary preliminary step toward evaluating applicability under real-world coastal environments. Prior to such application, it was essential to investigate the influence of key parameters governing flow dynamics and structural responses in the presence of submerged coastal structures. Among these factors, the establishment of well-controlled experimental conditions was considered fundamental to ensuring the reliability and reproducibility of the results. Future studies will further investigate irregular and extreme wave conditions to enhance the accuracy of shoreline response predictions, based on the numerical grid and incident wave parameters established in this study. Furthermore, to numerically simulate qualitative shoreline responses such as erosion and accretion, a coupled hydrodynamic–sediment transport model will be utilized to enable a quantitative evaluation of morphodynamic behavior. This coupling aims to provide a more comprehensive understanding of sediment transport behavior under the influence of hydrodynamic forcing. Moreover, comparisons with hydraulic experiments will be conducted to validate the numerical accuracy and predictions.
This research seeks to evaluate the applicability of submerged breakwaters in real coastal environments by providing critical physical insights for the design and construction of coastal protection structures. A comprehensive approach combining numerical simulations and hydraulic experiments will be employed to develop a precise shoreline response prediction framework, ensuring its applicability in construction site assessment and structural design.
Statements
Data availability statement
The raw data supporting the conclusions of this article will be made available by the authors, without undue reservation.
Author contributions
MR: Conceptualization, Writing – original draft, Writing – review & editing, Project administration, Validation, Methodology. CG: Validation, Writing – original draft. SH: Software, Writing – original draft. JL: Writing – original draft, Software. SJ: Writing – original draft, Validation. HK: Writing – original draft, Supervision, Methodology.
Funding
The author(s) declare that financial support was received for the research and/or publication of this article. This research was supported by the Korea Institute of Ocean Science and Technology (KIOST) under the project “Development of Advanced Technology for Ocean Energy, Harbor and Offshore Structure (PEA0321)”.
Conflict of interest
The authors declare that the research was conducted in the absence of any commercial or financial relationships that could be construed as a potential conflict of interest.
Generative AI statement
The author(s) declare that no Generative AI was used in the creation of this manuscript.
Publisher’s note
All claims expressed in this article are solely those of the authors and do not necessarily represent those of their affiliated organizations, or those of the publisher, the editors and the reviewers. Any product that may be evaluated in this article, or claim that may be made by its manufacturer, is not guaranteed or endorsed by the publisher.
References
1
Akbari H. Taherkhani A. (2019). Numerical study of wave interaction with a composite breakwater located on permeable bed. Coast. Eng.146, 1–13. doi: 10.1016/j.coastaleng.2018.12.006
2
Al-Towayti F. Teh H.-M. Ma Z. Jae I. Syamsir A. Al-Qadami E. (2024). Hydrodynamic performance assessment of emerged, alternatively submerged and submerged semicircular breakwater: An experimental and computational study. J. Mar. Sci. Eng.12, 1105. doi: 10.3390/jmse12071105
3
Beji S. Battjes J. (1993). Experimental investigation of wave propagation over a bar. Coast. Eng.19, 151–162. doi: 10.1016/0378-3839(93)90022-Z
4
Berkhoff J. Booy N. Radder A. (1982). Verification of numerical wave propagation models for simple harmonic linear water waves. Coast. Eng.6, 255–279. doi: 10.1016/0378-3839(82)90022-9
5
Bradford S. (2005). Godunov-based model for nonhydrostatic wave dynamics. J. Waterway Port Coastal Ocean Eng.131, 226–238. doi: 10.1061/(ASCE)0733-950X
6
Brocchini M. Kennedy A. Soldini L. Mancinelli A. (2004). Topographically controlled, breaking wave-induced macrovortices. part 1. widely separated breakwaters. J. Fluid Mechanics507, 289–307. doi: 10.1017/S002211200400878X
7
Bühler O. Jacobson T. (2001). Wave-driven currents and vortex dynamics on barred beaches. J. Fluid Mechanics449, 313–339. doi: 10.1017/S0022112001006322
8
Burcharth H. Hawkins S. Zanuttigh B. Lamberti A. (2007). Environmental Design Guidelines for Low Crested Coastal Structures (The Netherlands: Elsevier). doi: 10.1016/B978-0-08-044951-7.X5019-2
9
Chen J. Wang L. Yang S. Zhang J. (2025). Semi-resolved cfd–dem coupling simulation of wave interaction with submerged permeable breakwaters. Ocean Eng.321, 120411. doi: 10.1016/j.oceaneng.2025.120411
10
Dong Y. Zheng Z. Ma Y. Gao J. Ma X. Dong G. (2023). Numerical investigation on the mitigation of harbor oscillations by periodic undulating topography. Ocean Eng.279, 114580. doi: 10.1016/j.oceaneng.2023.114580
11
Gao J. Hou L. Liu Y. Shi H. (2024). Influences of bragg reflection on harbor resonance triggered by irregular wave groups. Ocean Eng.305, 117941. doi: 10.1016/j.oceaneng.2024.117941
12
Gao J. Ma X. Dong G. Chen H. Liu Q. Zang J. (2021). Investigation on the effects of bragg reflection on harbor oscillations. Coast. Eng.170, 103977. doi: 10.1016/j.coastaleng.2021.103977
13
Gao J. Shi H. Zang J. Liu Y. (2023). Mechanism analysis on the mitigation of harbor resonance by periodic undulating topography. Ocean Eng.281, 114923. doi: 10.1016/j.oceaneng.2023.114923
14
Gottlieb S. Shu C.-W. Tadmor E. (2001). Strong stability-preserving high-order time discretization methods. SIAM Rev.43, 89–112. doi: 10.1137/S003614450036757X
15
Hanson H. Kraus N. (1990). “Shoreline response to a single transmissive detached breakwater,” in Proceedings of the 22nd International Conference on Coastal Engineering (ASCE, Delft, The Netherlands), 2034–2046. doi: 10.1061/9780872627765.156
16
Hassanpour N. Lara J. L. Vicinanza D. Contestabile P. (2025). Laboratory experiments on transforming emerged into submerged breakwaters. Ocean Eng.324, 120610. doi: 10.1016/j.oceaneng.2025.120610
17
Hoan L. X. Hanson H. Larson M. Nam P. T. (2011). Modeling regional sediment transport and shoreline response in the vicinity of tidal inlets on the long island coast, United States. Coast. Eng.58, 554–561. doi: 10.1016/j.coastaleng.2011.03.003
18
Huang C.-J. Chang H.-H. Hwung H.-H. (2003). Structural permeability effects on the interaction of a solitary wave and a submerged breakwater. Coast. Eng.49, 1–24. doi: 10.1016/S0378-3839(03)00034-6
19
Kazemi E. Koll K. Tait S. Shao S. (2020). Sph modelling of turbulent open channel flow over and within natural gravel beds with rough interfacial boundaries. Adv. Water Resour.140, 103557. doi: 10.1016/j.advwatres.2020.103557
20
Kennedy A. Brocchini M. Soldini L. Gutierrez E. (2006). Topographically controlled, breakingwave-induced macrovortices. part 2. changing geometries. J. Fluid Mechanics559, 57–80. doi: 10.1017/S0022112006009979
21
Kim D. Cho Y.-S. Kim H. (2008). Well-balanced scheme between flux and source terms for computation of shallow-water equations over irregular bathymetry. J. Eng. Mechanics134, 277–290. doi: 10.1061/(ASCE)0733-9399(2008)134:4(277
22
Lamberti A. Archetti R. Kramer M. Paphitis D. Mosso C. Di Risio M. (2005). European experience of low crested structures for coastal management. Coast. Eng.52, 841–866. doi: 10.1016/j.coastaleng.2005.09.010
23
Liang D. Jian W. Shao S. Chen R. Yang K. (2017). Incompressible sph simulation of solitary wave interaction with movable seawalls. J. Fluids Struct.69, 72–88. doi: 10.1016/j.jfluidstructs.2016.11.015
24
Liang Q. Marche F. (2009). Numerical resolution of well-balanced shallow water equations with complex source terms. Adv. Water Resour.32, 873–884. doi: 10.1016/j.advwatres.2009.02.010
25
Lin P. Li C. W. (2002). A σ-coordinate three-dimensional numerical model for free surface wave propagation. Int. J. Numerical Methods Fluids38, 1045–1068. doi: 10.1002/fld.258
26
Lin P. Liu P.-F. (1998a). A numerical study of breaking waves in the surf zone. J. Fluid Mechanics359, 239–264. doi: 10.1017/S002211209700846X
27
Lin P. Liu P.-F. (1998b). Turbulent transport, vorticity dynamics, and solute mixing under plunging breaking waves in surf zone. J. Geophysical Res.103, 15677–15694. doi: 10.1029/98JC01360
28
Liu H.-W. (2023). An approximate law of class i bragg resonance of linear shallow-water waves excited by five types of artificial bars. Ocean Eng.267, 113245. doi: 10.1016/j.oceaneng
29
Longuet-Higgins M. Stewart R. (1964). Radiation stresses in water waves; a physical discussion, with applications. Deep Sea Res. Oceanogr. Abstr.11, 529–562. doi: 10.1016/0011-7471(64)90001-4
30
Lynett P. Liu P. L.-F. (2004). A two-layer approach to wave modelling. Proc. R. Soc. A.: Mathematical Phys. Eng. Sci.460, 2637–2669. doi: 10.1098/rspa.2004.1305
31
Ma G. Kirby J. T. Shi F. (2013). Numerical simulation of tsunami waves generated by deformable submarine landslides. Ocean Model.69, 146–165. doi: 10.1016/j.ocemod.2013.07.001
32
Ma G. Kirby J. Shi F. (2014). Non-Hydrostatic Wave Model NHWAVE: Documentation and User’s Manual (Version 2.0) (University of Delaware, Newark, DE, USA: Research Report CACR 14).
33
Ma G. Shi F. Kirby J. (2011). A polydisperse two-fluid model for surf zone bubble simulation. J. Geophysical Res.116, C05010. doi: 10.1029/2010JC006667
34
Ma G. Shi F. Kirby J. T. (2012). Shock-capturing non-hydrostatic model for fully dispersive surface wave processes. Ocean Model.43-44, 22–35. doi: 10.1016/j.ocemod.2011.12.002
35
Maiolo M. Mel R. Sinopoli S. (2020). A simplified method for an evaluation of the effect of submerged breakwaters on wave damping: The case study of calabaia beach. J. Mar. Sci. Eng.8, 510. doi: 10.3390/jmse8070510
36
Martin S. Temple N. Palino G. Cebrian J. Sparks E. (2021). The effects of large-scale breakwaters on shoreline vegetation. Ecol. Eng.169, 106319. doi: 10.1016/j.ecoleng.2021.106319
37
Martinelli L. Zanuttigh B. Lamberti A. (2006). Hydrodynamic and morphodynamic response of isolated and multiple low crested structures: Experiments and simulations. Coast. Eng.53, 363–379. doi: 10.1016/j.coastaleng.2005.10.018
38
Meringolo D. D. Aristodemo F. Veltri P. (2015). Sph numerical modeling of wave–perforated breakwater interaction. Coast. Eng.101, 48–68. doi: 10.1016/j.coastaleng.2015.04.004
39
Ning D. Chen L. Zhao M. Teng B. (2016). Experimental and numerical investigation of the hydrodynamic characteristics of submerged breakwaters in waves. J. Coast. Res.32, 800–813. doi: 10.2112/JCOASTRES-D-15-00091.1
40
Pahar G. Dhar A. (2016). Modeling free-surface flow in porous media with modified incompressible sph. Eng. Anal. Boundary Elements68, 75–85. doi: 10.1016/j.enganabound.2016.04.001
41
Patankar S. (1980). Numerical Heat Transfer and Fluid Flow (New York, NY, USA: McGraw-Hill).
42
Peregrine D. (1998). Surf zone currents. Theor. Comput. Fluid Dynamics10, 295–309. doi: 10.1007/s001620050065
43
Phillips N. (1957). A coordinate system having some special advantages for numerical forecasting. J. Meteorol.14, 184–185. doi: 10.1175/1520-0469(1957)014(0184:ACSHSS)2.0.CO;2
44
Qu K. Men J. Wang X. Li X. (2023). Numerical investigation on hydrodynamic processes of extreme wave groups on fringing reef. J. Mar. Sci. Eng.11, 63. doi: 10.3390/jmse11010063
45
Ranasinghe R. Larson M. Savioli J. (2010). Shoreline response to a single shore-parallel submerged breakwater. Coast. Eng.57, 1006–1017. doi: 10.1016/j.coastaleng.2010.06.002
46
Ranasinghe R. Symonds G. Black K. Holman R. (2004). Morphodynamics of intermediate beaches: a video imaging and numerical modelling study. Coast. Eng.51, 629–655. doi: 10.1016/j.coastaleng.2004.07.018
47
Ranasinghe R. Turner I. L. Symonds G. (2006). Shoreline response to multi-functional artificial surfing reefs: A numerical and physical modelling study. Coast. Eng.53, 589–611. doi: 10.1016/j.coastaleng.2005.12.004
48
Retsinis E. Papanicolaou P. (2020). Numerical and experimental study of classical hydraulic jump. Water12, 1766. doi: 10.3390/w12061766
49
Scyphers S. Powers S. Heck K. Jr. (2015). Ecological value of submerged breakwaters for habitat enhancement on a residential scale. Environ. Manage.55, 383–391. doi: 10.1007/s00267-014-0394-8
50
Stelling G. Zijlema M. (2003). An accurate and efficient finite-difference algorithm for non-hydrostatic free-surface flow with application to wave propagation. Int. J. Numerical Methods Fluids43, 1–23. doi: 10.1002/fld.595
51
Synolakis C. E. (1987). The runup of solitary waves. J. Fluid Mechanics185, 523–545. doi: 10.1017/S002211208700329X
52
Terrile E. Brocchini M. (2007). A dissipative point-vortex model for nearshore circulation. J. Fluid Mechanics589, 455–478. doi: 10.1017/S0022112007008130
53
Turner I. Leyden V. Cox R. Jackson L. McGrath J. (2001). Physical model study of the gold coast artificial reef. J. Coast. Res.29, 131–146. Available at: http://www.jstor.org/stable/25736211.
54
Vona I. Gray M. Nardin W. (2020). The impact of submerged breakwaters on sediment distribution along marsh boundaries. Water12, 1016. doi: 10.3390/w12041016
55
Xing W. Kuang C. Li H. Chen J. Shi L. Zou Q. (2024). Effect of open-area ratios on wave attenuation over a submerged reef breakwater: An experimental study. Ocean Eng.312, 119221. doi: 10.1016/j.oceaneng.2024.119221
56
Yuan H. Wu C.-H. (2004). An implicit three-dimensional fully non-hydrostatic model for free-surface flows. Int. J. Numerical Methods Fluids46, 709–733. doi: 10.1002/fld.778
57
Zanuttigh B. (2007). Numerical modelling of the morphological response induced by low-crested structures in lido di dante, Italy. Coast. Eng.54, 31–47. doi: 10.1016/j.coastaleng.2006.08.003
58
Zheng K. Cai Z. Zhang J. Zhao B. Duan W. (2024). Experimental and numerical studies on the short-term distribution of wave crest, wave height and wave period for the breaking long crest irregular waves. Ocean Eng.310, 118751. doi: 10.1016/j.oceaneng.2024.118751
59
Zhou J. Causon D. Mingham C. Ingram D. (2001). The surface gradient method for the treatment of source terms in the shallow-water equations. J. Comput. Phys.168, 1–25. doi: 10.1006/jcph.2000.6670
60
Zhu J. Cai F. Shi F. Qi H. Lei G. Liu J. et al . (2019). Beach response to breakwater layouts of drainage pipe outlets during beach nourishment. Estuarine Coast. Shelf Sci.228, 106354. doi: 10.1016/j.ecss.2019.106354
61
Zyserman J. A. Johnson H. K. Zanuttigh B. Martinelli L. (2005). Analysis of far-field erosion induced by low-crested rubble-mound structures. Coast. Eng.52, 977–994. doi: 10.1016/j.coastaleng.2005.09.013
Summary
Keywords
non-hydrostatic numerical model, NHWAVE, submerged breakwater, wave attenuation, shoreline response
Citation
Roh M, Gwon C-H, Hwang S, Lee J, Jang S-C and Kim H-S (2025) Numerical simulation of wave attenuation and shoreline response in a coastal region with submerged breakwater. Front. Mar. Sci. 12:1594844. doi: 10.3389/fmars.2025.1594844
Received
17 March 2025
Accepted
20 May 2025
Published
13 June 2025
Volume
12 - 2025
Edited by
Diego Fernandez Novoa, University of Vigo, Spain
Reviewed by
Junliang Gao, Jiangsu University of Science and Technology, China
Fangfang Zhu, The University of Nottingham Ningbo, China
Updates
Copyright
© 2025 Roh, Gwon, Hwang, Lee, Jang and Kim.
This is an open-access article distributed under the terms of the Creative Commons Attribution License (CC BY). The use, distribution or reproduction in other forums is permitted, provided the original author(s) and the copyright owner(s) are credited and that the original publication in this journal is cited, in accordance with accepted academic practice. No use, distribution or reproduction is permitted which does not comply with these terms.
*Correspondence: Hyung-Suk Kim, hskim0824@kunsan.ac.kr
Disclaimer
All claims expressed in this article are solely those of the authors and do not necessarily represent those of their affiliated organizations, or those of the publisher, the editors and the reviewers. Any product that may be evaluated in this article or claim that may be made by its manufacturer is not guaranteed or endorsed by the publisher.