Abstract
Few studies have investigated the potential drivers of high-resolution (daily and 24-hour scales) on ocean acidification (OA) and the carbonate system in a coastal estuary during an intense La Niña event. Therefore, we conducted the first high-resolution total scale pH (pHT) monitoring every three hours for 56 days (13 September to 7 November 2021) at the Colombian Pacific in El Muelle reef, Gorgona National Natural Park. Two moored autonomous submersible instruments (iSAMI-pH and CTD-Diver) were deployed at a depth of 2 m in an area influenced by extreme precipitation, river discharge, semi-diurnal tides, and southwest winds during La Niña 2020-2023. Total alkalinity was derived from salinity data and used alongside pHT to calculate sea surface seawater partial pressure of CO2 (pCO2w; μatm), dissolved inorganic carbon (DIC; μmol kg-1), and omega aragonite saturation (Ωa). The findings suggest that the observed low pH (7.93) and aragonite saturation state (Ωa = 2.22) values are likely attributed to increased precipitation. This enhanced precipitation resulted in higher river discharge, transporting naturally low-pH water to the island via mixing mechanisms (RiOMar type 2). Daily, decreasing solar radiation may reduce the seawater temperature, simultaneously elevating the pCO2w levels and reducing pHT. In contrast, elevated precipitation may reduce surface seawater salinity through freshwater dilution. Throughout the diurnal cycle, peak pHT values were recorded during late afternoon hours, likely driven by photosynthetic activity, while minimum values coincided with early morning periods of maximal respiratory activity. These results underscore the dynamic nature of this area and emphasize the need for long-term evaluation.
1 Introduction
Ocean acidification (OA) driven by human-induced increases in atmospheric carbon dioxide (CO2) (Sabine et al., 2004; Feely et al., 2009) has significantly altered carbonate chemistry, leading to increased concentration of hydrogen ions [H+] and reduced global pH levels (Kleypas et al., 1999; Caldeira and Wickett, 2003; Gattuso et al., 2015). The El Niño–Southern Oscillation (ENSO) modulates OA. During El Niño events in the Eastern Tropical Pacific, reduced trade winds weaken equatorial upwelling, limiting the transport of cold, nutrient- and carbon-rich waters from the deep ocean to the surface (Vaittinada Ayar et al., 2022). As a result, surface dissolved inorganic carbon (DIC) concentrations decrease, leading to relatively lower seawater pCO2w and reduced CO2 outgassing to the atmosphere (Feely et al., 2006; Ishii et al., 2014; Espinoza-Morriberón et al., 2019). In contrast, La Niña events strengthen the trade winds and enhance upwelling, bringing DIC and nutrient-rich waters to the surface (Vaittinada Ayar et al., 2022). This increase in upwelling elevates pCO2w levels, thereby increasing CO2 outgassing (Yasunaka et al., 2019) and can lead to lower pH levels in coastal waters, intensifying OA (Oliva-Méndez et al., 2018).
La Niña event also induces increased rainfall, which enhances river discharge in coastal areas (Restrepo and Kjerfve, 2000; Hernández et al., 2006; Blanco, 2009). This influx of freshwater significantly reduces the buffering capacity of estuaries to neutralize acids and maintain stable pH levels, because freshwater lacks the carbonate buffer system found in seawater. These conditions increase the solubility of CO2 and reduce the dissociation of bicarbonates (HCO3-) into carbonate ions (CO3-2; Cai et al., 2021). Additionally, rivers contribute to pH reduction by transporting organic matter, which releases carbon dioxide as it oxidizes upon reaching the sea (Salisbury et al., 2008; Zhai et al., 2015; Vargas et al., 2016). Moreover, nutrients from land and rivers are transported to coastal waters via runoff, forming low-salt river plumes that extend to the continental shelf, driven by winds and tides (Dai et al., 2022a). The areas influenced by these plumes, associated with the 19 largest rivers globally, cover an average of 3.7 × 10⁶ km2 annually (Kang et al., 2013), representing approximately 14% of the total global continental shelf area (Dai et al., 2022a). Thus, salinity variations in estuary systems are determined by the mixing process influenced by tidal movements, precipitation, river discharges, and seawater influx (Atekwana et al., 2022).
In the Colombian Caribbean, La Niña events have been observed to intensify precipitation, leading to increased freshwater inflow and a subsequent dilution that significantly reduces DIC and total alkalinity (TA) (Ricaurte-Villota et al., 2025). Furthermore, heavy rains in the tropical Pacific Ocean can modify salinity, with dilution effects persisting for over 10 days (Henocq et al., 2010). This phenomenon decreases two key parameters of the carbonate system: TA and DIC (Turk et al., 2010; Ashton et al., 2016; Ho and Schanze, 2020). The relationship between low salinity and variations in the carbonate system has also been documented in other coastal regions of the Eastern Tropical Pacific (10°N), where precipitation influences can extend over 40,000 km2, due to surface ocean currents dispersing freshwater over larger areas (Ho and Schanze, 2020).
Estuaries and coastal waters present greater complexity compared to open ocean waters when estimating OA and the carbonate system, as they are highly variable environments due to the mixing of seawater and freshwater (Wang et al., 2019; Nehir et al., 2022). Additionally, these Tropical Pacific waters, often influenced by anthropogenic activities, are critical for acidification studies. However, their complexity and the time scales (ranging from hours to interannual changes) require high-resolution monitoring to accurately assess OA (Carstensen et al., 2018; Nehir et al., 2022). One of the key parameters to monitor in estuaries is the natural variation of water pH (Nehir et al., 2022), which is typically measured using the National Bureau of Standards scale (pHNBS) and total pH scales (pHT). The pHT is preferred in oceanography due to its accuracy. It also considers other factors that affect proton activity in complex solutions such as seawater, including the presence of salts (Fassbender et al., 2021).
The equatorial Pacific waters are characterized by lower pH values (8.00; Zhong et al., 2025) compared to the global average (8.05; von Schuckmann et al., 2024), making this region a key area for analyzing OA and its ecological impacts. To address this, continuous monitoring efforts using in situ submersible spectrophotometric sensors, such as Lab-on-Chip (Yin et al., 2021; Nehir et al., 2022) and the iSAMI-pH (Valauri-Orton et al., 2025), have proven effective for small-scale autonomous monitoring of the total pH scale (pHT). For example, in the Pacific Coastal Ocean, significant pHT variation (7.93 to 8.37) has been associated with upwelling events (Monterey Bay, USA) which increase pCO2w and reduce pHT (Gray et al., 2011). In contrast, during periods without upwelling and in the rainy season, a more minor pHT variation (ranging from 7.98 to 8.06) has been observed along the Pacific coast of Costa Rica (Bahia Culebra; Sánchez-Noguera et al., 2018). In this region, a distinct 24-hour cycle was detected, with the lowest pHT occurring in the early morning hours, due to organic matter respiration at night, and the highest pHT values recorded in the late afternoon, associated with photosynthesis (Sánchez-Noguera et al., 2018).
In the Colombian Pacific Ocean, high-resolution measurements of pHT have not been conducted. Instead, discrete measurements related to carbonate chemistry and pHNBS have primarily been performed in the Caribbean Sea and the Pacific Ocean, including sampling sites around Gorgona National Natural Park (GNNP) by Instituto de Investigaciones Marinas y Costeras José Benito Vives de Andréis (INVEMAR) as part of the program “Red de Vigilancia para la Conservación y Protección de las Aguas Marinas y Costeras de Colombia (REDCAM)”. In Tayrona National Natural Park, studies such as those by Ricaurte-Villota et al. (2025) have collected discrete samples of pHNBS, TA, and DIC, revealing high variability strongly influenced by coastal upwelling, precipitation, and river runoff, which are further affected by ENSO events. The high variability of oceanographic processes in coastal regions underscores the need for high-resolution monitoring, as discrete measurements are limited in their ability to capture natural variability and achieve sufficient temporal resolution (Nehir et al., 2022). Gorgona National Natural Park, located on the Colombian Pacific continental shelf, is a potential hotspot for OA due to its exposure to frequent ENSO events, which drive significant climate variability through El Niño and La Niña events (Lavín et al., 2006; Emerton et al., 2017; Fiedler and Lavín, 2017; Berri et al., 2019). As part of the Eastern Tropical Pacific (ETP), it is influenced by the Choco Jet, which brings intense precipitation from September to November (Serna et al., 2018; Guzmán et al., 2014), further increasing the already high fluvial discharge from the Patia-Sanquianga deltaic complex, the largest in Colombia (Díaz, 2007). Additionally, the Intertropical Convergence Zone (ITCZ) intensifies cloudiness and precipitation during this period, reducing solar radiation and potentially impacting the carbonate system and OA by altering water temperature and CO2 solubility, as observed in other regions (Webster, 2020; Cai et al., 2021).
Therefore, this study investigates fine-scale, high-frequency dynamics in coastal carbonate chemistry using continuous measurements of pHT, temperature, salinity, and derivation of TA, DIC, pCO2w, and omega aragonite saturation (Ωa). Focusing on Gorgona National Natural Park (GNNP) in the Colombian Pacific Ocean (Panama Bight), it examines how freshwater pulses during strong rainy season La Niña events modulate coastal carbonate buffering capacity and influence pH stability and ecosystem resilience to ocean acidification under climatic stress. This study uses a fixed mooring equipped with autonomous sensors to characterize high-frequency variability (daily over 56 days and hourly over 24 hours) of pHT and other carbon chemistry variables (TA, pCO2w, and DIC). Additionally, it explores the influence of tidal dynamics (ebb vs. flood) on variations in pHT, salinity, temperature, pCO2w, DIC, and TA, synchronizing high-resolution measurements from the iSAMI-pH and CTD-Diver with tide height data to identify primary sources of pHT variation (oceanic vs. riverine influences). Furthermore, the relationships, both in magnitude and direction, between pHT, salinity, temperature, pCO2w, DIC, and TA, with external drivers such as daily solar radiation and daily precipitation (influenced by the Intertropical Convergence Zone, ITCZ) were analyzed. Daily mean values of the dependent variables were calculated to assess their response to these environmental factors under extreme climatic and hydrological dynamics. Finally, the study evaluates whether pHT, salinity, temperature, pCO2w, DIC, and TA exhibit significant differences between early morning and late afternoon within a 24-hour daily cycle, providing insights into diurnal variability in the study area. By addressing the critical role of fine-scale processes in shaping coastal carbonate chemistry, this research fills a significant gap in understanding the dynamics of coastal systems under extreme conditions.
2 Methods
2.1 Study area
The Gorgona National Natural Park (GNNP; 2° 55’45” - 3° 00’ 55” N, 78° 09’ 00″ - 78° 14’ 30” W) is located on the continental shelf of the Colombian Pacific basin (Figure 1). This region is characterized by warm and low-salinity surface waters (Giraldo López, 2008; Giraldo et al., 2008, 2011, 2014), and constitutes one of the rainiest regions of the world, being also the rainiest area of Colombia with annual values ranging from 2500 mm to 8000 mm (Rangel and Rudas, 1990; Blanco, 2009). This condition is mainly associated with the latitudinal migration of the Intertropical Convergence Zone (ITCZ; Díaz Guevara et al., 2008) and the Choco Jet Stream, which increases cloudiness and precipitation due to the convergence of trade winds from the northern and southern hemispheres (Prahl et al., 1990; Díaz Guevara et al., 2008; Guzmán et al., 2014; Serna et al., 2018). During the second half of the year, the ITCZ moves north, altering the wind direction near 3°N latitude, which becomes dominant in the southwesterlies and forms the Choco Jet off western Colombia (Poveda and Mesa, 2000; Amador et al., 2006; Guerrero Gallego et al., 2012). During the study period (September 13 to November 7, 2021), the area was affected by the strong La Niña 2020–2023 event (thermal anomalies of -1.4 ± 0.1°C; Supplementary Table 1, IDEAM, 2021) that increased total precipitation in the Colombian Pacific.
Figure 1
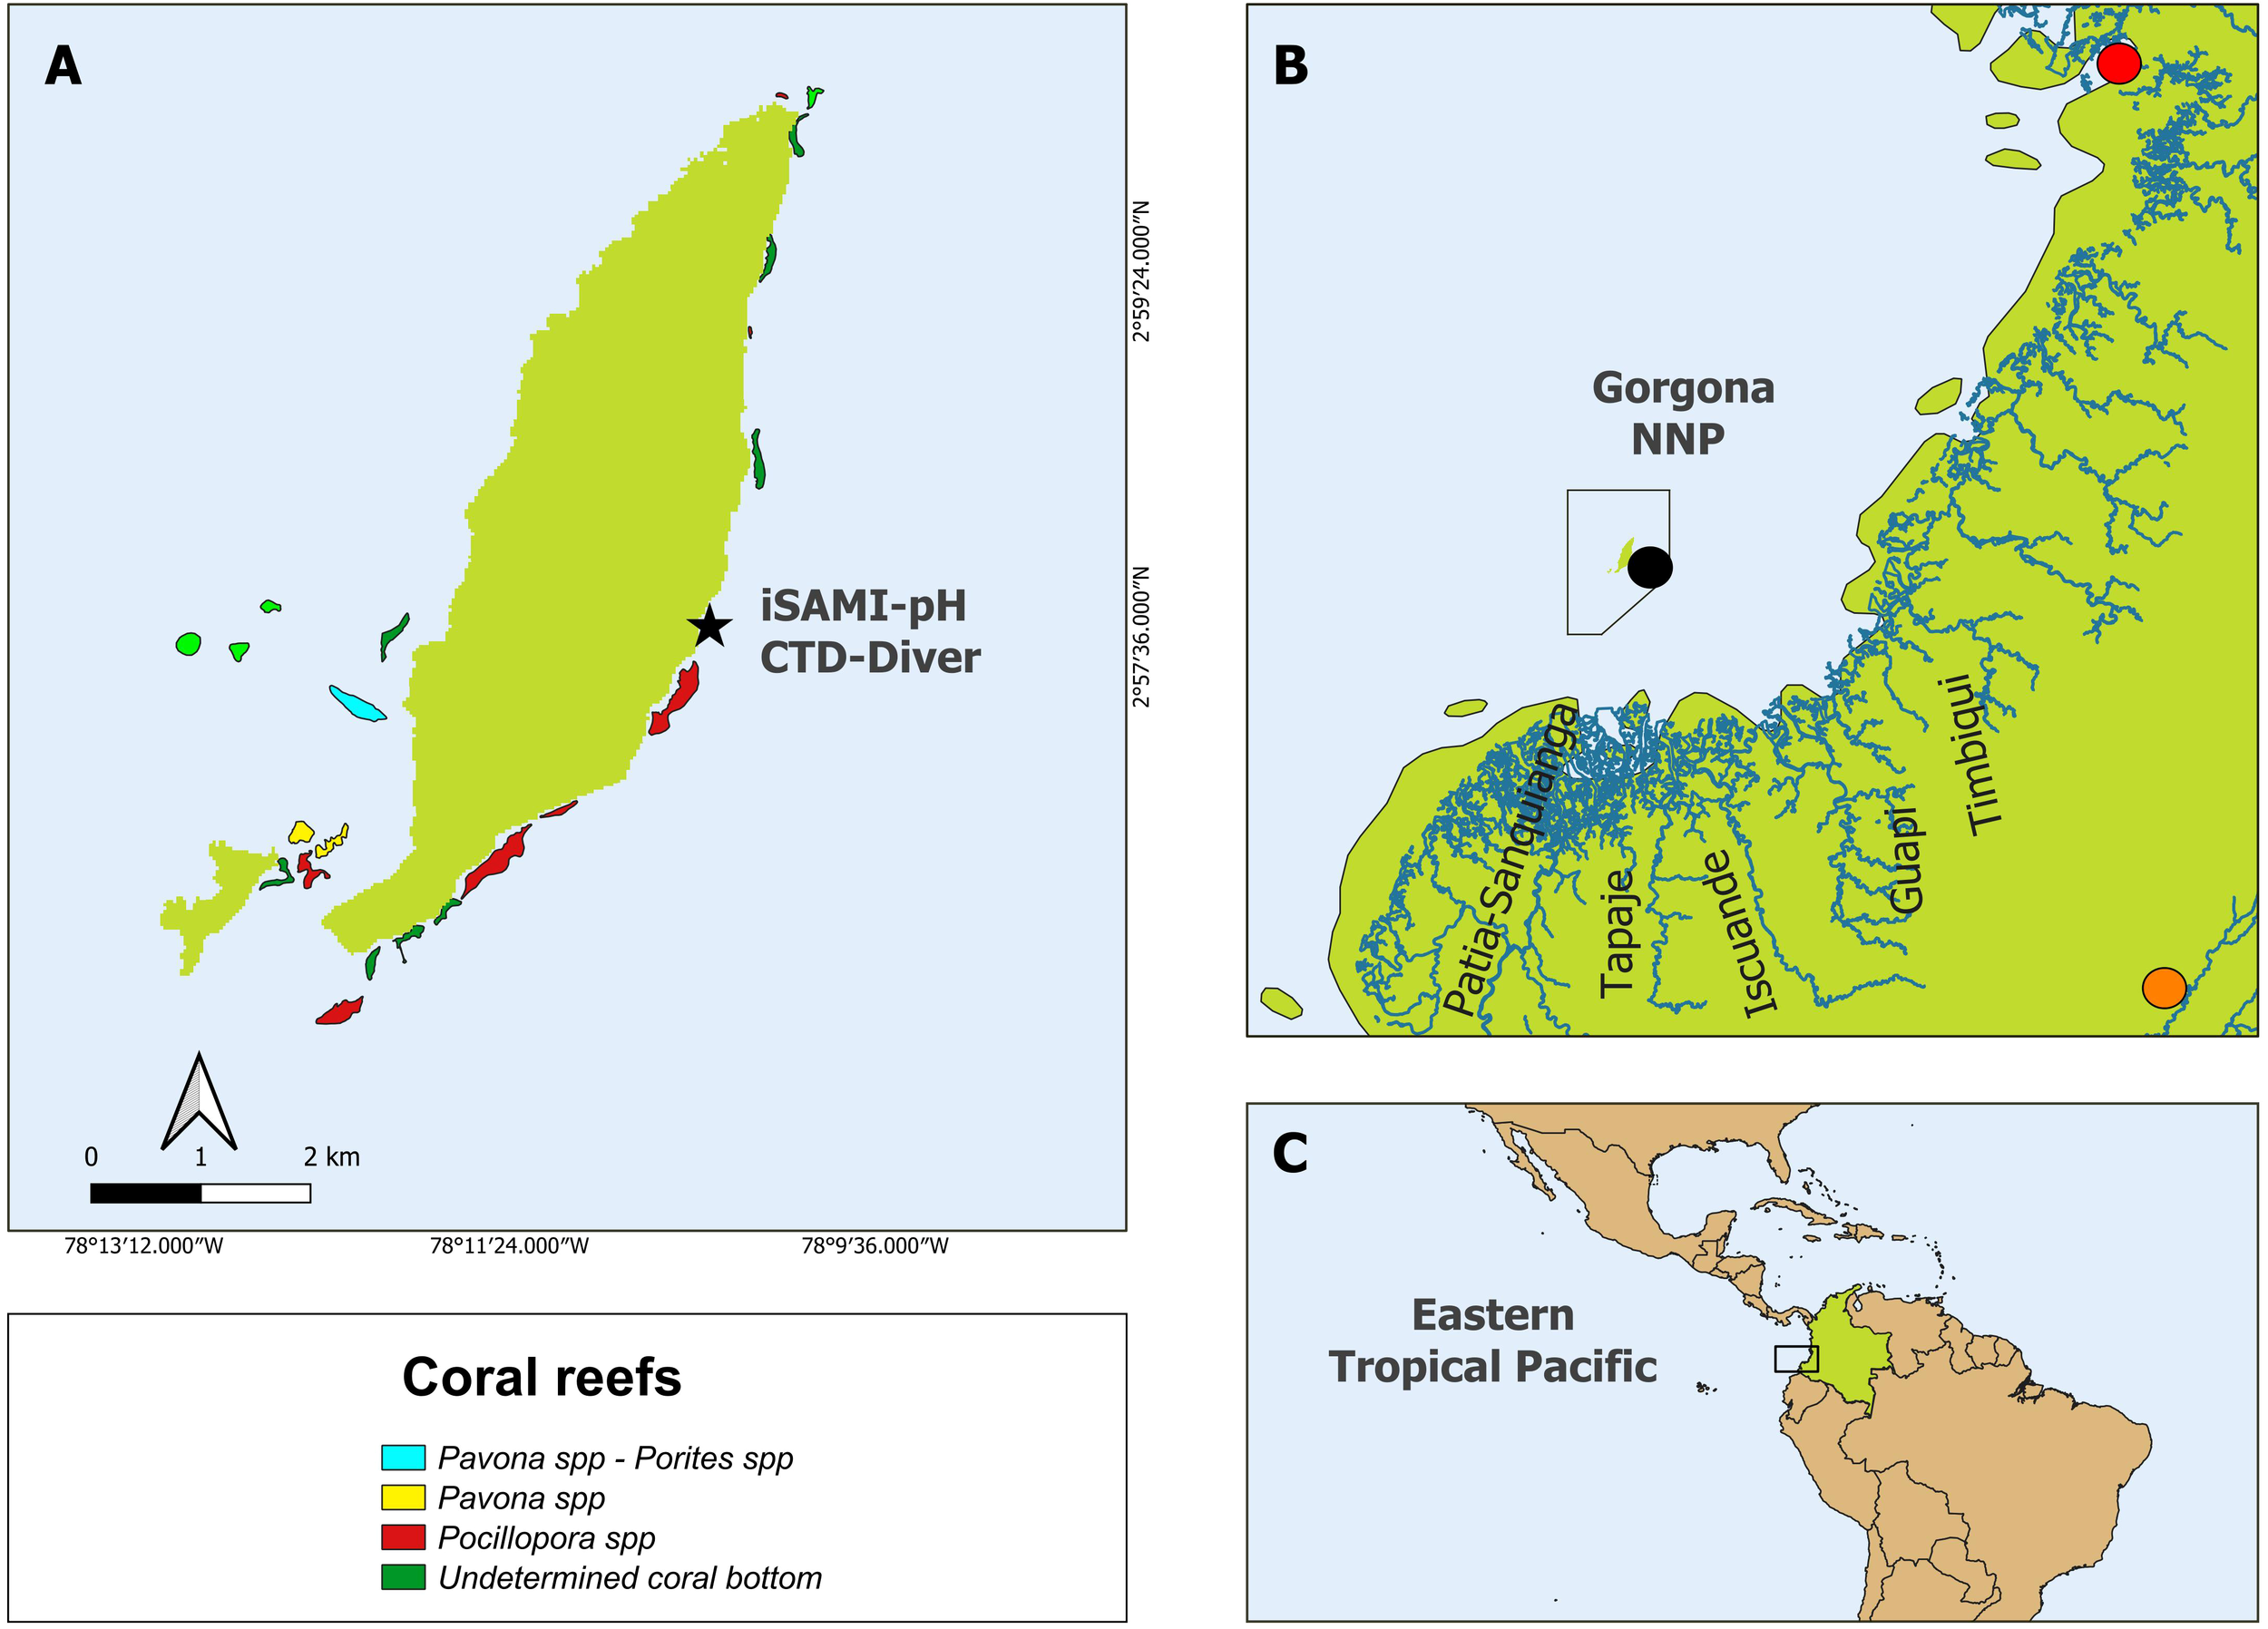
Location of Gorgona National Natural Park in the Colombian Pacific Ocean, Eastern Tropical Pacific (ETP). (A) iSAMI-pH and CTD-Diver measurements at El Muelle reef (black star). The colored polygons show the coral reefs (Pavona spp - Porites spp, Pavona spp, and Pocillopora spp) around Gorgona according to Colombia’s Atlas of Coral Areas until 2020 (INVEMAR, 2020a). (B) The black polygon shows the protected area of Gorgona Park and its proximity to the Pacific coast (around 50 km), as well as the main rivers influencing the island (Guapi River, Patia - Sanquianga Rivers, Tapaje River, and Iscuande River). The black dot represents the “57025020 Gorgona Guapi” pluviometric station (DHIME, 2025), the orange dot represents the “26015040 Arrayanales” for solar radiation measurements (DHIME, 2025), while the red point represents the Buenaventura station for tide height measurements (Flanders Marine Institute [VLIZ] and Intergovernmental Oceanographic Commission [IOC], 2025). (C) Square showed the island’s position within the ETP. The red polygon shows the Panama Bight, which includes the Panama and Colombian Pacific basins.
Gorgona Park is in front of the Patia-Sanquianga delta complex (Figure 1B), the largest in the country, which contributes approximately 23% of the total freshwater discharged to the Colombian Pacific (2045 m3 s-1; Díaz, 2007). This delta comprises several rivers, including the Guapi, Patia, Iscuande, Tapaje, and Sanquianga (Díaz, 2007, Figure 1B). Likewise, the tidal regime around GNNP is semi-diurnal, repeating twice in 24 hours, with two alternating high tides (5.82 m) and two low tides (-0.78 m; Flanders Marine Institute [VLIZ] and Intergovernmental Oceanographic Commission [IOC], 2025).
The Pacific coast has an average daily solar radiation of 3500 to 4000 Wh m-2 and an annual availability of solar radiation that varies between 1,080,000 and 1,440,000 Wh m-2 (UPME, 2005). During the year’s second half, solar radiation decreases until it reaches its minimum in December (Rangel and Rudas, 1990). Regarding its biodiversity, GNNP hosts one of the most critical coral reef areas in the Eastern Tropical Pacific (ETP) region in terms of structure and species diversity (Glynn et al., 1982; Zapata, 2001; Díaz et al., 2001) and connects the ETP with other Pacific regions (e.g., Hawaii, Polynesia) via larval potential dispersion (Romero-Torres et al., 2018). Remarkably, these reefs persist despite being regularly exposed to multiple environmental stressors. At the beginning of the year, they experience sub-aerial exposure during extreme low tides (Zapata, 2001; Zapata et al., 2010), low pH levels reaching as low as 7.4 (Giraldo and Valencia, 2013), cooler temperatures (16.69 °C; Giraldo et al., 2008), and hypoxic conditions (< 3.7 mg L-1) associated with seasonal upwelling (Castrillón-Cifuentes et al., 2023a, b). During the second half of the year, these reefs are subjected to low salinity levels during the rainy season (as low as 25; Giraldo et al., 2008), warmer temperatures (27 °C; Giraldo et al., 2008), and increased sedimentation rates (23.30 ± 4.34 g m-2 d-1; Lozano-Cortés et al., 2014). Coral species such as Pocillopora spp. and Pavona spp. dominate the eastern (leeward) and southern areas of Gorgona Island, while occurring more sparsely in the western and northern areas (Figure 1A, Zapata, 2001). The sampling point (Figure 1A) was located at the north end of El Muelle reef (northward surface current), where the genus Pocillopora spp. predominantly dominates this and the major eastern coral patch of Azufrada (Zapata, 2001; Romero-Torres and Acosta, 2010).
2.2 In situ measurements
Continuous measurements of pHT, conductivity (mS cm-1), and temperature (°C) were made at a fixed depth of around 2 meters in El Muelle reef, GNNP (2° 57’ 39” N, 78° 10’ 25” W; Figure 1A) from 13 September to 07 November 2021, every three hours, using a buoy anchoring system designed to compensate the tidal changes and to keep the equipment at a similar depth. The iSAMI-pH equipment (programmed with SAMI Client v2.5 software) was used to record pHT (accuracy: 0.0004 and precision: ± 0.0024) and temperature (accuracy: ± 0.14°C; at 24.55 °C Tris bottle number 10 Sunburst Sensors). The CTD Diver equipment (programmed with Diver Field software, Van Essen Instruments) was used to take conductivity measurements (accuracy: ± 1% mS cm-1). Conductivity data were also downloaded using Diver Field software. The salinity was calculated using the practical scaling relationship proposed by Aminot and Kérouel (2004). The iSAMI-pH data were downloaded with the SAMI program (QC pH v4.4). Because the QC pH v4.4 program handles a constant salinity of 35 units by default, the pHT data were corrected for salinity. To do the correction, the program was set to the corresponding average salinity (29.74 ± 0.94, 31.29; mean ± SD, maximum, n = 403) of the sampling point (2° 57’ 39” N, 78° 10’ 25” W). With the correction, differences in pHT of ± 0.01 units were observed. We used the average salinity value to ensure consistency in salinity correction, as the CTD Diver recorded salinity 30 minutes after iSAMI-pH measurements from October 10 to November 7. When both devices recorded simultaneously between September 13 and October 10, the difference between pH corrected with average and measured salinity was insignificant (± 0.0001). iSAMI recorded 49 outliers out of 441 data points, which were excluded from the analysis as iSAMI-pH identified them as measurement anomalies (error codes 100, 1001, 1010, and 1000) associated with issues related to pumping, dye supply, or blank measurement. Additionally, 19 temperature and 38 salinity data points were identified as outliers when plotting variables and their relationship to total pHT. These points were excluded from the analysis after applying a criterion based on standard deviation to consecutive measurements. Any change greater than 0.030 in pH, 0.30°C in temperature, or 0.94°C in salinity between measurements was considered a potential outlier. Flagged data points underwent contextual evaluation, considering environmental consistency (e.g., salinity-TA relationships, diel cycles, water mass characteristics), sensor artifacts, and physical plausibility. Only measurements inconsistent both statistically and contextually were excluded.
2.3 Carbonate system derivation
Total alkalinity (TA; μmol kg-1) was calculated using a regression line between salinity (in situ data taken with CastAway-CTD equipment) and TA. Preciado (2023) built the regression (y = 57.479x+249.08; R2 = 0.94; n=268) using measured local discrete TA data obtained from 8 sampling stations around Gorgona, one of which included the iSAMI-pH deployment site. The data were collected over 13 sampling months, from September 2021 to October 2022, at depths ranging from 2 to 80 meters, following the SOP-3b protocol (Dickson et al., 2007). Discrete samples of TA (± 13 μmol kg-1, Batch #182 2230.91μmol kg-1) were collected monthly at the iSAMI-pH site from November 2021 to July 2022. Comparing the measured TA values with those estimated from salinity, a mean difference of 11 ± 5 μmol kg-1 and a regression coefficient of R² = 0.91 were observed (Supplementary Figure 1). Specifically, in November 2021, the difference was 10 ± 3 μmol kg-1. This regression approach for estimating TA through salinity has been validated in previous studies (Lee et al., 2006; Takatani et al., 2014; Carter et al., 2016; Fassbender et al., 2017; Metzl et al., 2024).
For the derivation of the carbonate system pCO2w (μatm), dissolved inorganic carbon (DIC; μmol kg-1), and omega aragonite (Ωa), we used the Carbonate System equation solution (CO2sys v3.0, Pierrot et al., 2021), with the pair pHT (n = 392) from iSAMI-pH and TA derived from the former regression, as well as salinity from CTD (Aminot and Kérouel, 2004) and temperature (iSAMI-pH). Propagation error analysis using CO2sys v3.0 estimated uncertainties of ±52 µmol·kg-1 for DIC, ± 33 μatm for pCO2, and ±0.16 for Ωa. In the carbonate system equation solution, the following constants were used: (i) Dissociation constants for K1 and K2 from Millero, 2010) for waters ranging from 0 to 40, given that the study area the salinities variation are between 27.03 to 31.29, (ii) KHSO4 dissociation constant from Dickson (1990), (iii) KHF from Perez and Fraga (1987), (iv) Total pH scale (mol-kg SW), (v) [B]T value from Lee et al. (2010), and (vi) EOS-80 standard.
To evaluate the influence of temperature and salinity, pHT was normalized using the mean temperature (27.39°C) and salinity (29.74), as recommended by Terlouw et al. (2019). Additionally, normalization was performed using constant values representing the minimum observed temperature (26.72°C) and salinity (27.03), to account for the most extreme conditions in the dataset (Supplementary Figure 2). This normalization process isolates the potential effect of temperature and salinity on pHT, following the methodology outlined by Sarmiento and Gruber (2006). The influence of temperature and salinity corresponds to the difference between the normalized pHT and the in situ measured pHT.
2.4 Statistical analysis: evaluation of external forcing on carbon chemistry
2.4.1 Tidal movement data
Daily tide measurements (m) between 13 September and 07 November 2021 were obtained from the UNESCO Sea Level Monitoring Facility database (Flanders Marine Institute [VLIZ] and Intergovernmental Oceanographic Commission [IOC], 2025), specifically from the Buenaventura station (3° 53’ 26” N, 77° 4’ 51” W), which measures the tide using a radar sensor. These tide measurements were temporally synchronized with iSAMI-pH and CTD-Diver data and subsequently labeled according to the water movement (ebb or flood; Supplementary Figure 3). The dependent variables do not meet the assumptions of normality, so non-parametric tests were chosen (Supplementary Table 2). The Kruskal-Wallis nonparametric test was used to determine if there were significant differences (p < 0.05) in the dependent variables (pHT, salinity, temperature, pCO2W, DIC, and TA) when comparing tidal movements (ebb and flood tides).
2.4.2 Atmospheric variables, solar radiation, and precipitation, and correlation with carbon chemistry
For the study period, 56 days, daily solar radiation (Wh m-2) was obtained from the “26015040 Arrayanales” fixed station (2° 26’ 53” N, 76° 26’ 9” W; DHIME, 2025), and daily total precipitation (mm) from the “57025020 Gorgona Guapi” fixed station (2° 57’ 47” N, 78° 10’ 28” W; DHIME, 2025).
Daily means of the dependent variables (pHT, salinity, temperature, pCO2W, DIC, and TA) were calculated. A Spearman correlation analysis was performed between the dependent physical and chemical parameters and atmospheric variables (solar radiation and total precipitation) to evaluate the importance and direction of their relationship (rho value).
2.4.3 Hour carbon chemistry cycle analysis
The hourly cycle analysis was performed by calculating the average of the variables (pHT, salinity, temperature, pCO2W, DIC, and TA) taken at the same hour every three hours between 13 September and 7 November 2021. Carbonate alkalinity was also calculated following the equation proposed by Munhoven, 2013:
The Kruskal-Wallis test executed in RStudio was used to determine if there were significant differences (p-value < 0.05) in the dependent variables (pHT, salinity, temperature, pCO2W, DIC, TA, and carbonate alkalinity) when comparing the early morning hours (5:00 - 6:00) with the late afternoon hours (17:00 - 18:00).
3 Results
The sampling period took place during a year with strong La Niña conditions displaying atmospheric thermal anomalies of -1.4 ± 0.1°C (Supplementary Table 1; IDEAM, 2021) and extreme precipitation values (959 ± 316 mm/monthly; DHIME, 2025). Throughout the study period, pHT decreased from September until October 25 (Figure 2), after which it increased until November 7, while pCO2w, DIC, and salinity increased until October 25 and then decreased until November 7. Throughout the study period, pHT and pCO2w exhibited opposite trends (Figure 2), with lower pHT values corresponding to higher pCO2w levels and vice versa (Table 1). pHT averaged 8.01 ± 0.03, peaking on September 15 (8.09), then decreasing until October 25, reaching a minimum on October 16 (7.93), before increasing again until November 7. In contrast, pCO2w averaged 397 ± 36 μatm, reaching its minimum on September 15 (302 μatm), increasing until October 25, reaching a maximum on October 16 (499 μatm), and then decreasing until November 7. Salinity averaged 29.74 ± 0.94, increasing until October 25, with a peak on October 20 (31.29), then decreasing until November 7, reaching its minimum on that date (27.03). Similarly, TA averaged 1959 ± 54 μmol kg-1, increasing until October 25, with a maximum on October 20 (2048 μmol kg-1), then decreasing until November 7, when it reached its minimum (1803 μmol kg-1). DIC followed a similar pattern, averaging 1728 ± 49 μmol kg-1, increasing until October 25, with a maximum on October 11 (1807 μmol kg-1), and decreasing until November 7, with a minimum on November 5 (1574 μmol kg-1). The temperature averaged 27.39 ± 0.30°C, with a peak on September 20 (28.50°C), decreasing until October 9 and remaining stable until October 25 (27.25 ± 0.16°C), before oscillating until November 7, when it reached a minimum on November 4 (26.72°C).
Figure 2
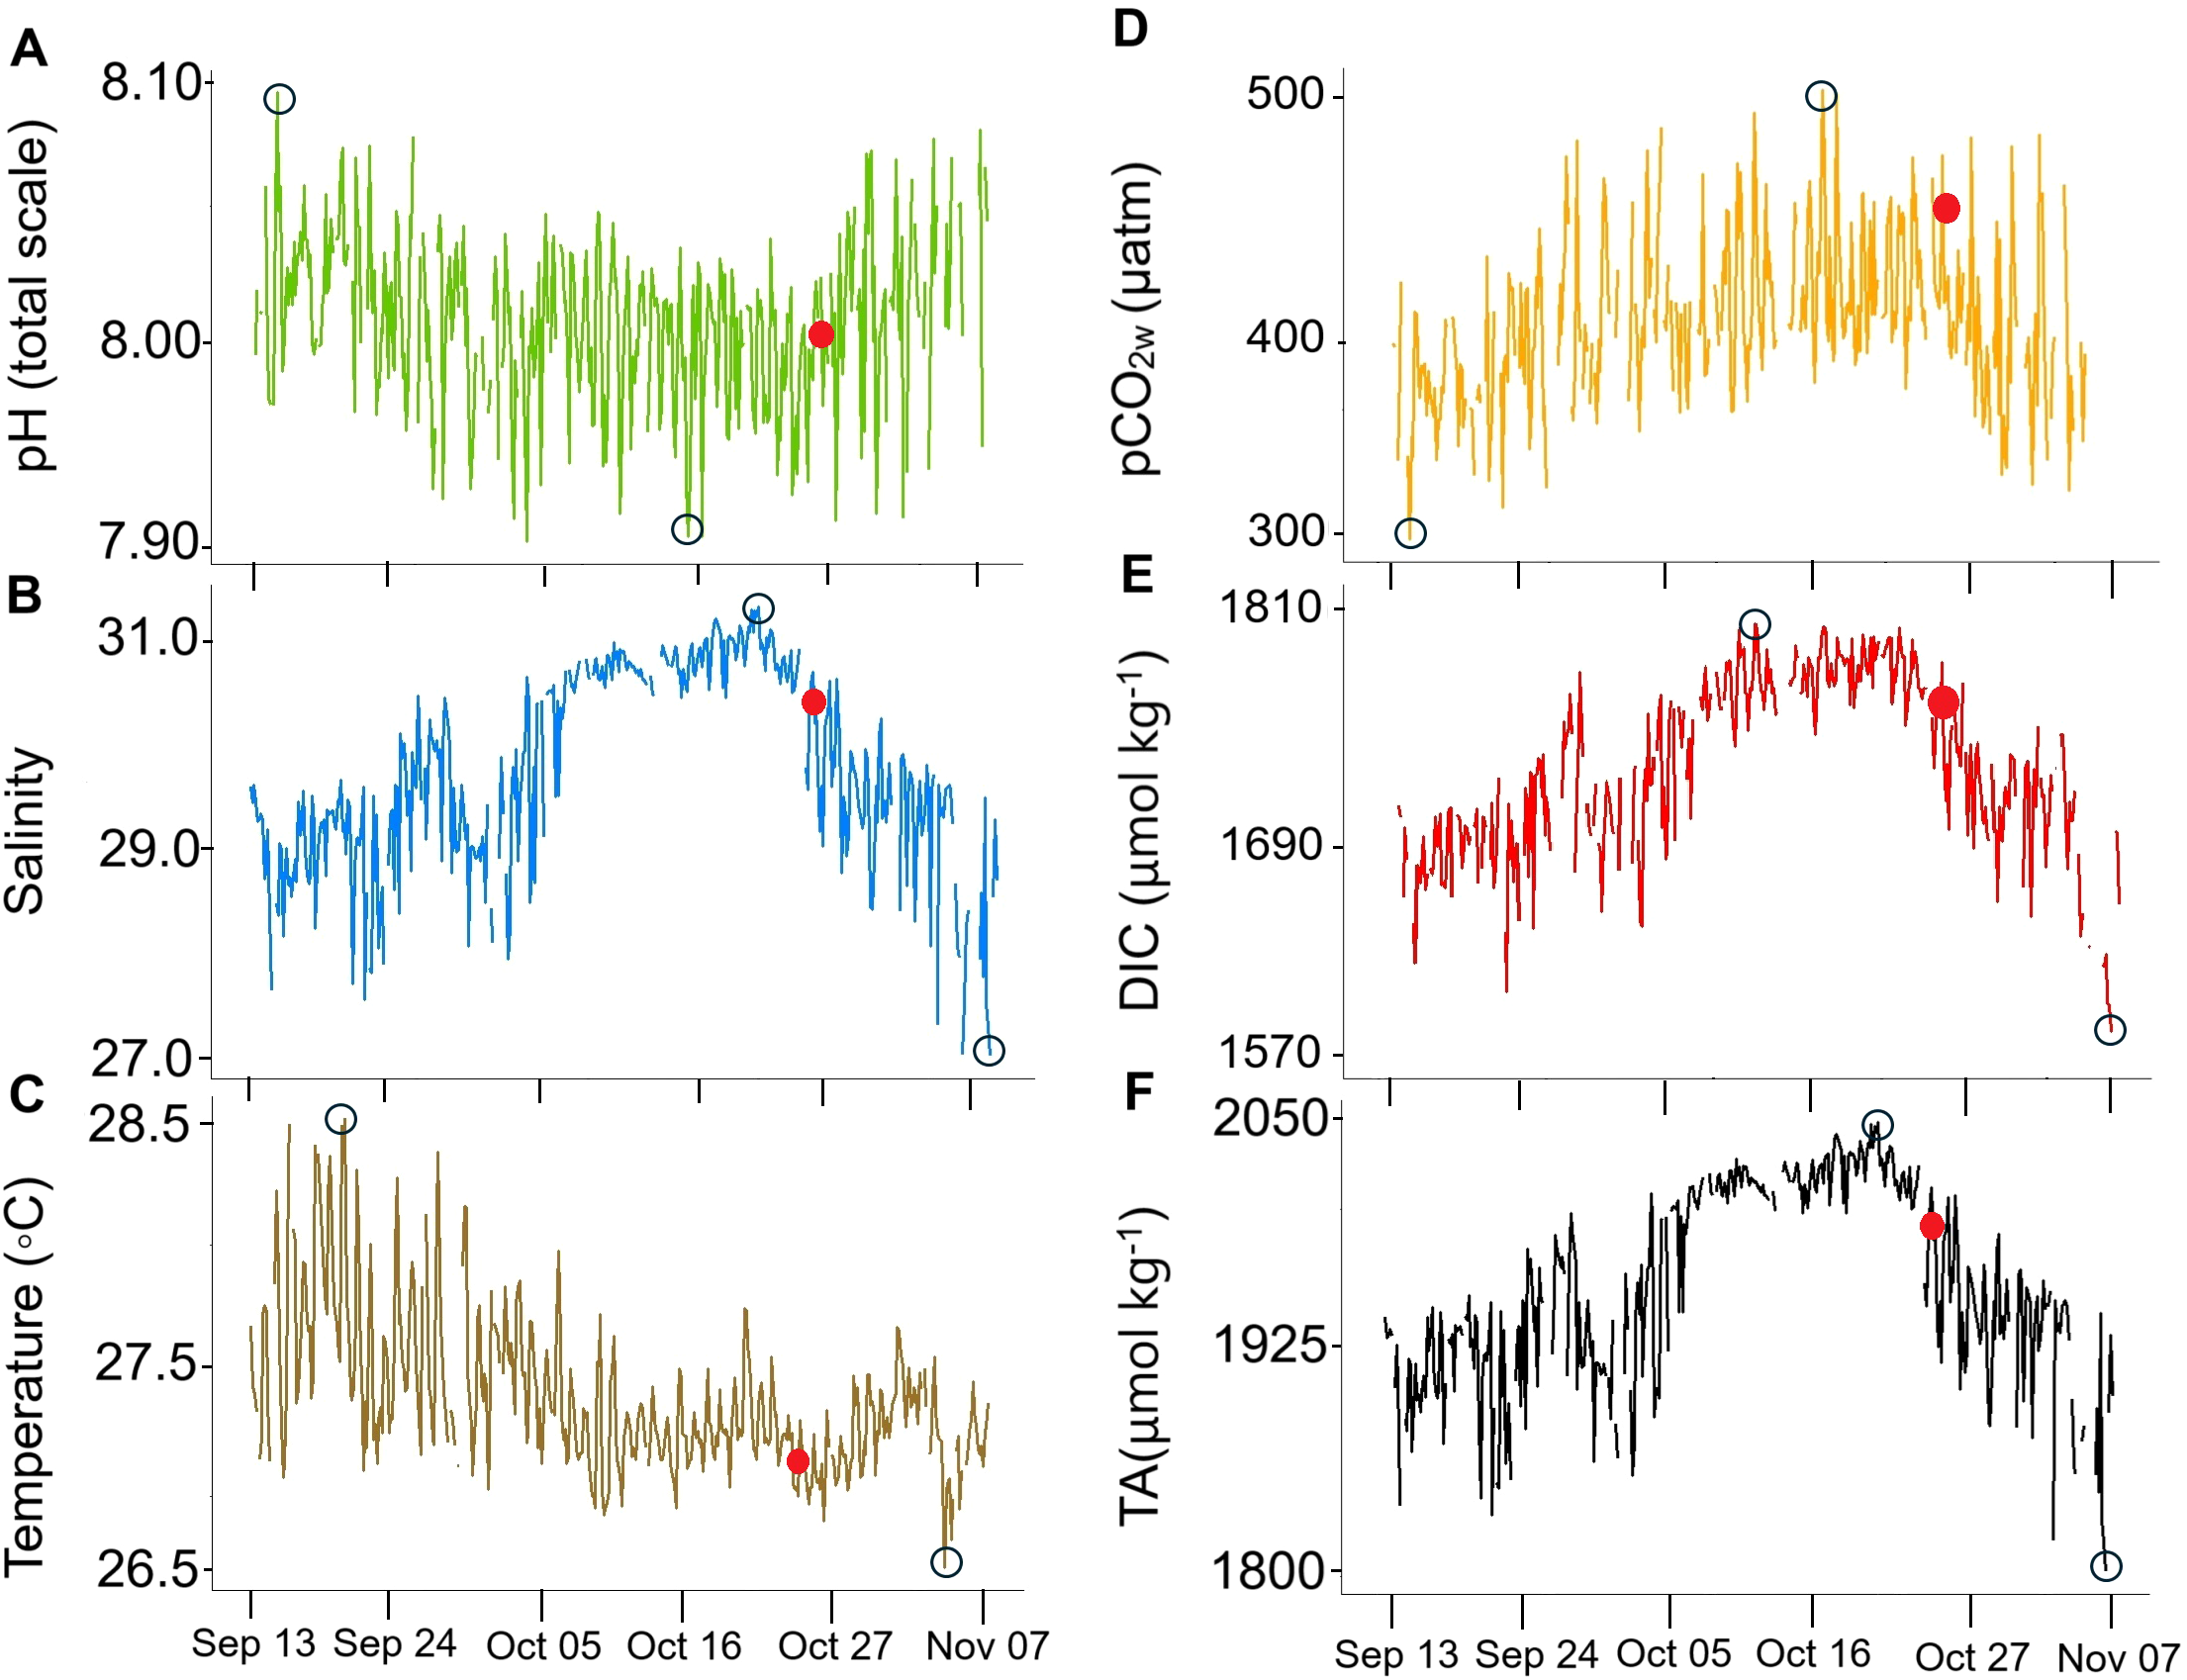
High-frequency measurements of (A) pHT (green), (B) salinity (blue), (C) temperature (brown), (D) pCO2w (orange), (E) dissolved inorganic carbon (DIC; red), and (F) total alkalinity (TA; black) every three hours between September 13 and November 07, 2021. The black circles highlight each variable’s highest and lowest values, while the red dot marks October 25, when pHT began to increase and pCO2w, salinity, TA, and DIC began to decrease.
Table 1
| Statistics | pH | Salinity | Temperature | pCO2w* | DIC * | TA * | Ωa* |
|---|---|---|---|---|---|---|---|
| (total scale) | (°C) | (μatm) | (μmol kg-1) | (μmol kg-1) | |||
| Mean ± SD |
8.01 ± 0.03 | 29.74 ± 0.94 | 27.39 ± 0.30 | 396.78 ± 36.25 | 1728.10 ± 49.06 | 1959.42 ± 54.14 | 2.71 ± 0.17 |
| Maximum | 8.09 | 31.29 | 28.50 | 498.94 | 1806.97 | 2047.60 | 3.09 |
| Minimum | 7.93 | 27.03 | 26.72 | 302.29 | 1574.23 | 1802.74 | 2.22 |
| N | 392 | 403 | 422 | 354 | 355 | 391 | 355 |
Descriptive statistics of the measured and derived variables (*) from September 13 to November 07, 2021, in El Muelle reef, GNNP, Colombian Pacific.
The mean value, standard deviation (SD), maximum, minimum, and sample size of the measured variables pHT, salinity, temperature, and derived variables pCO2w, DIC, TA, and Ωa are described.
When pHT was normalized using salinity and temperature, the variation attributed to mean salinity reached up to 0.001 pH units, and up to 0.047 pH units when using the minimum salinity. In contrast, minor temperature-related variations reached only 0.000028 pH units with the mean temperature and 0.017 pH units with the minimum temperature. These results suggest that salinity plays a more significant role than temperature in driving pHT variability (Supplementary Figure 2).
3.1 Tidal movement
No significant differences were found between high and low tides for the dependent variables of pHT, salinity, temperature, pCO2w, DIC, and TA (Supplementary Table 3). However, pHT during flood tide (8.010 ± 0.031) was slightly higher than during ebb tide (8.008 ± 0.029), with a lower positive slope on the regression line (Figure 3A). pCO2w and DIC showed similar values during the flood tide (396 ± 38 μatm and 1726 ± 52 µmol kg-¹, respectively) and the ebb tide (397 ± 35 μatm and 1730 ± 46 µmol kg-¹, respectively), with a slight negative slope observed in the regression trend (Figures 3D, E, respectively). Variables such as temperature, salinity, and TA exhibited slopes close to zero, indicating that this area’s seawater and river water are well-mixed.
Figure 3
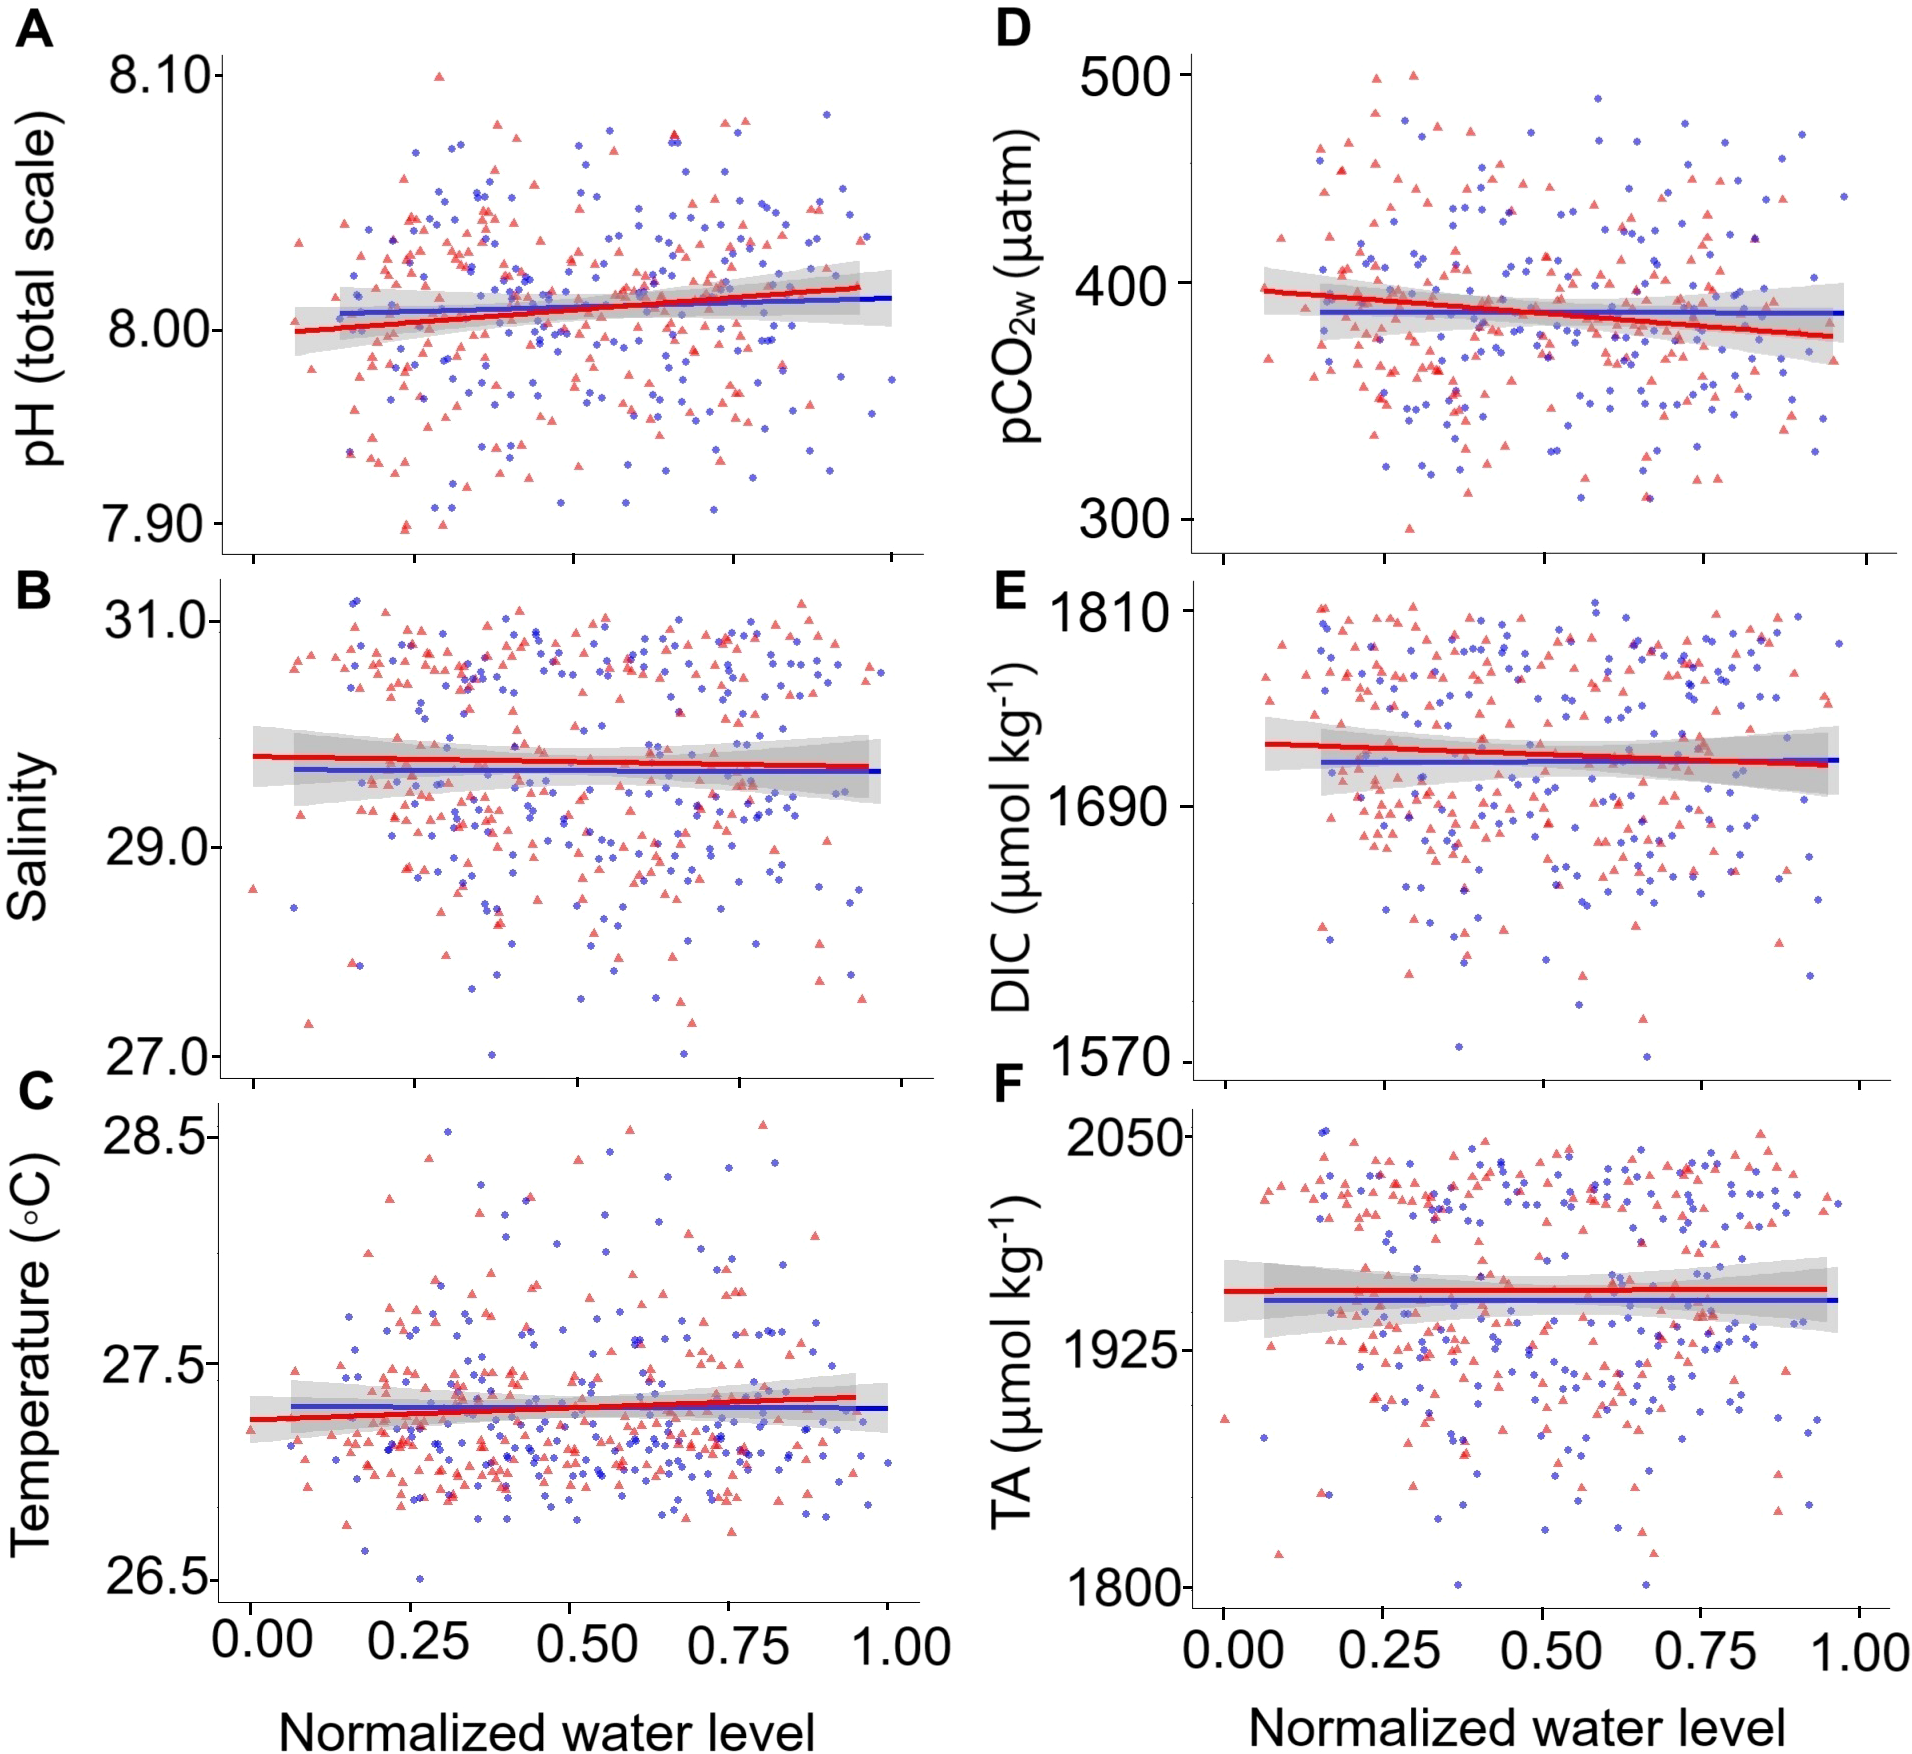
Normalized water level (0.00–1.00) plotted against the dependent variables: (A) pHT, (B) salinity, (C) temperature, (D) pCO2W, (E) dissolved inorganic carbon (DIC), and (F) total alkalinity (TA). The blue regression line and dots represent flood, while the red regression line and triangles represent ebb. A normalized tide value of 0.00 corresponds to a minimum low tide, and 1.00 corresponds to a maximum high tide.
3.2 Physico-chemical seawater parameters and atmospheric variables (56 days’ time scale)
The independent atmospheric variables (solar radiation and total precipitation) were correlated with water type (sea surface temperature and salinity) and carbon chemistry data (pHT, pCO2w, DIC, and TA). Total daily solar radiation showed the strongest correlations with all dependent variables; suggesting that average radiation values of 3078 ± 1098 Wh m-² (n= 56), as well as radiation values in a range of 1378 to 5968 Wh m-² displayed positively correlations with mean daily temperature and pHT, and negative correlations with salinity, pCO2w, DIC, and TA (Table 2). In contrast, total daily precipitation (mean average of 31 ± 27 mm; n= 56) within the 0 to 115 mm range only correlated negatively with mean daily salinity (Table 2). No significant correlation was observed between daily precipitation and pHT, temperature, pCO2W, DIC, and TA (Table 2). In addition, rainwater samples collected during the high rainfall season (May 2022) in GNNP showed the lowest salinity values (0.26).
Table 2
| Variables | Statistics | pHT | Salinity | T | pCO2w* | DIC * | TA* |
|---|---|---|---|---|---|---|---|
| Radiation | p value | 0.01 | 0.00 | 0.00 | 0.00 | 0.00 | 0.00 |
| rho | 0.37 | -0.41 | 0.51 | -0.46 | -0.42 | -0.41 | |
| Precipitation | p value | 0.22 | 0.04 | 0.85 | 0.13 | 0.06 | 0.06 |
| rho | 0.17 | -0.28 | 0.03 | -0.21 | -0.26 | -0.26 | |
| pH | p value | 0.00 | 0.03 | 0.00 | 0.00 | 0.00 | |
| rho | -0.54 | 0.29 | -0.95 | -0.63 | -0.53 | ||
| N | 56 | 56 | 56 | 56 | 56 | 56 |
Spearman correlation between the dependent variables (daily average) pHT, salinity, temperature, pCO2W, dissolved inorganic carbon (DIC), total alkalinity (TA), and the independent variables (daily total) solar radiation and precipitation.
In bold, the variables that were significantly correlated (p < 0.05). Dependent variables marked with an asterisk (*) indicate values derived either from a regression with salinity (e.g., TA) or calculated using CO2sys (e.g., pCO2W and DIC). In contrast, unmarked variables were directly measured in the field.
3.3 Diurnal, 24-hour cycle of the carbonate system
pHT, temperature, pCO2W, and DIC followed a pronounced diurnal cycle with significant differences (p < 0.05; Supplementary Table 4) between early morning and late evening hours (Figure 4). During early morning hours, after sunrise (5:00 - 6:00), at 8:00 the lowest values of pHT (7.993 ± 0.040; Figure 4A) and temperature (27.23 ± 0.18; Figure 4B) were recorded, as well as the highest values of pCO2W (413 ± 40 μatm; Figure 4C) and DIC (1739 ± 46 μmol kg-¹; Figure D). In the late afternoon (17:00 - 18:00), during sunset, the highest values of pHT (8.030 ± 0.025; Figure 4A) and temperature (27.61 ± 0.36; Figure 4B) were found, together with the lowest pCO2W (374 ± 25 μatm; Figure 4C) and DIC (1718 ± 50 μmol kg-¹; Figure 4D). In contrast, salinity (Figure 4E), TA (Figure 4F), and carbonate alkalinity did not show significant differences (p > 0.05, Supplementary Table 4) between early morning and late evening hours.
Figure 4
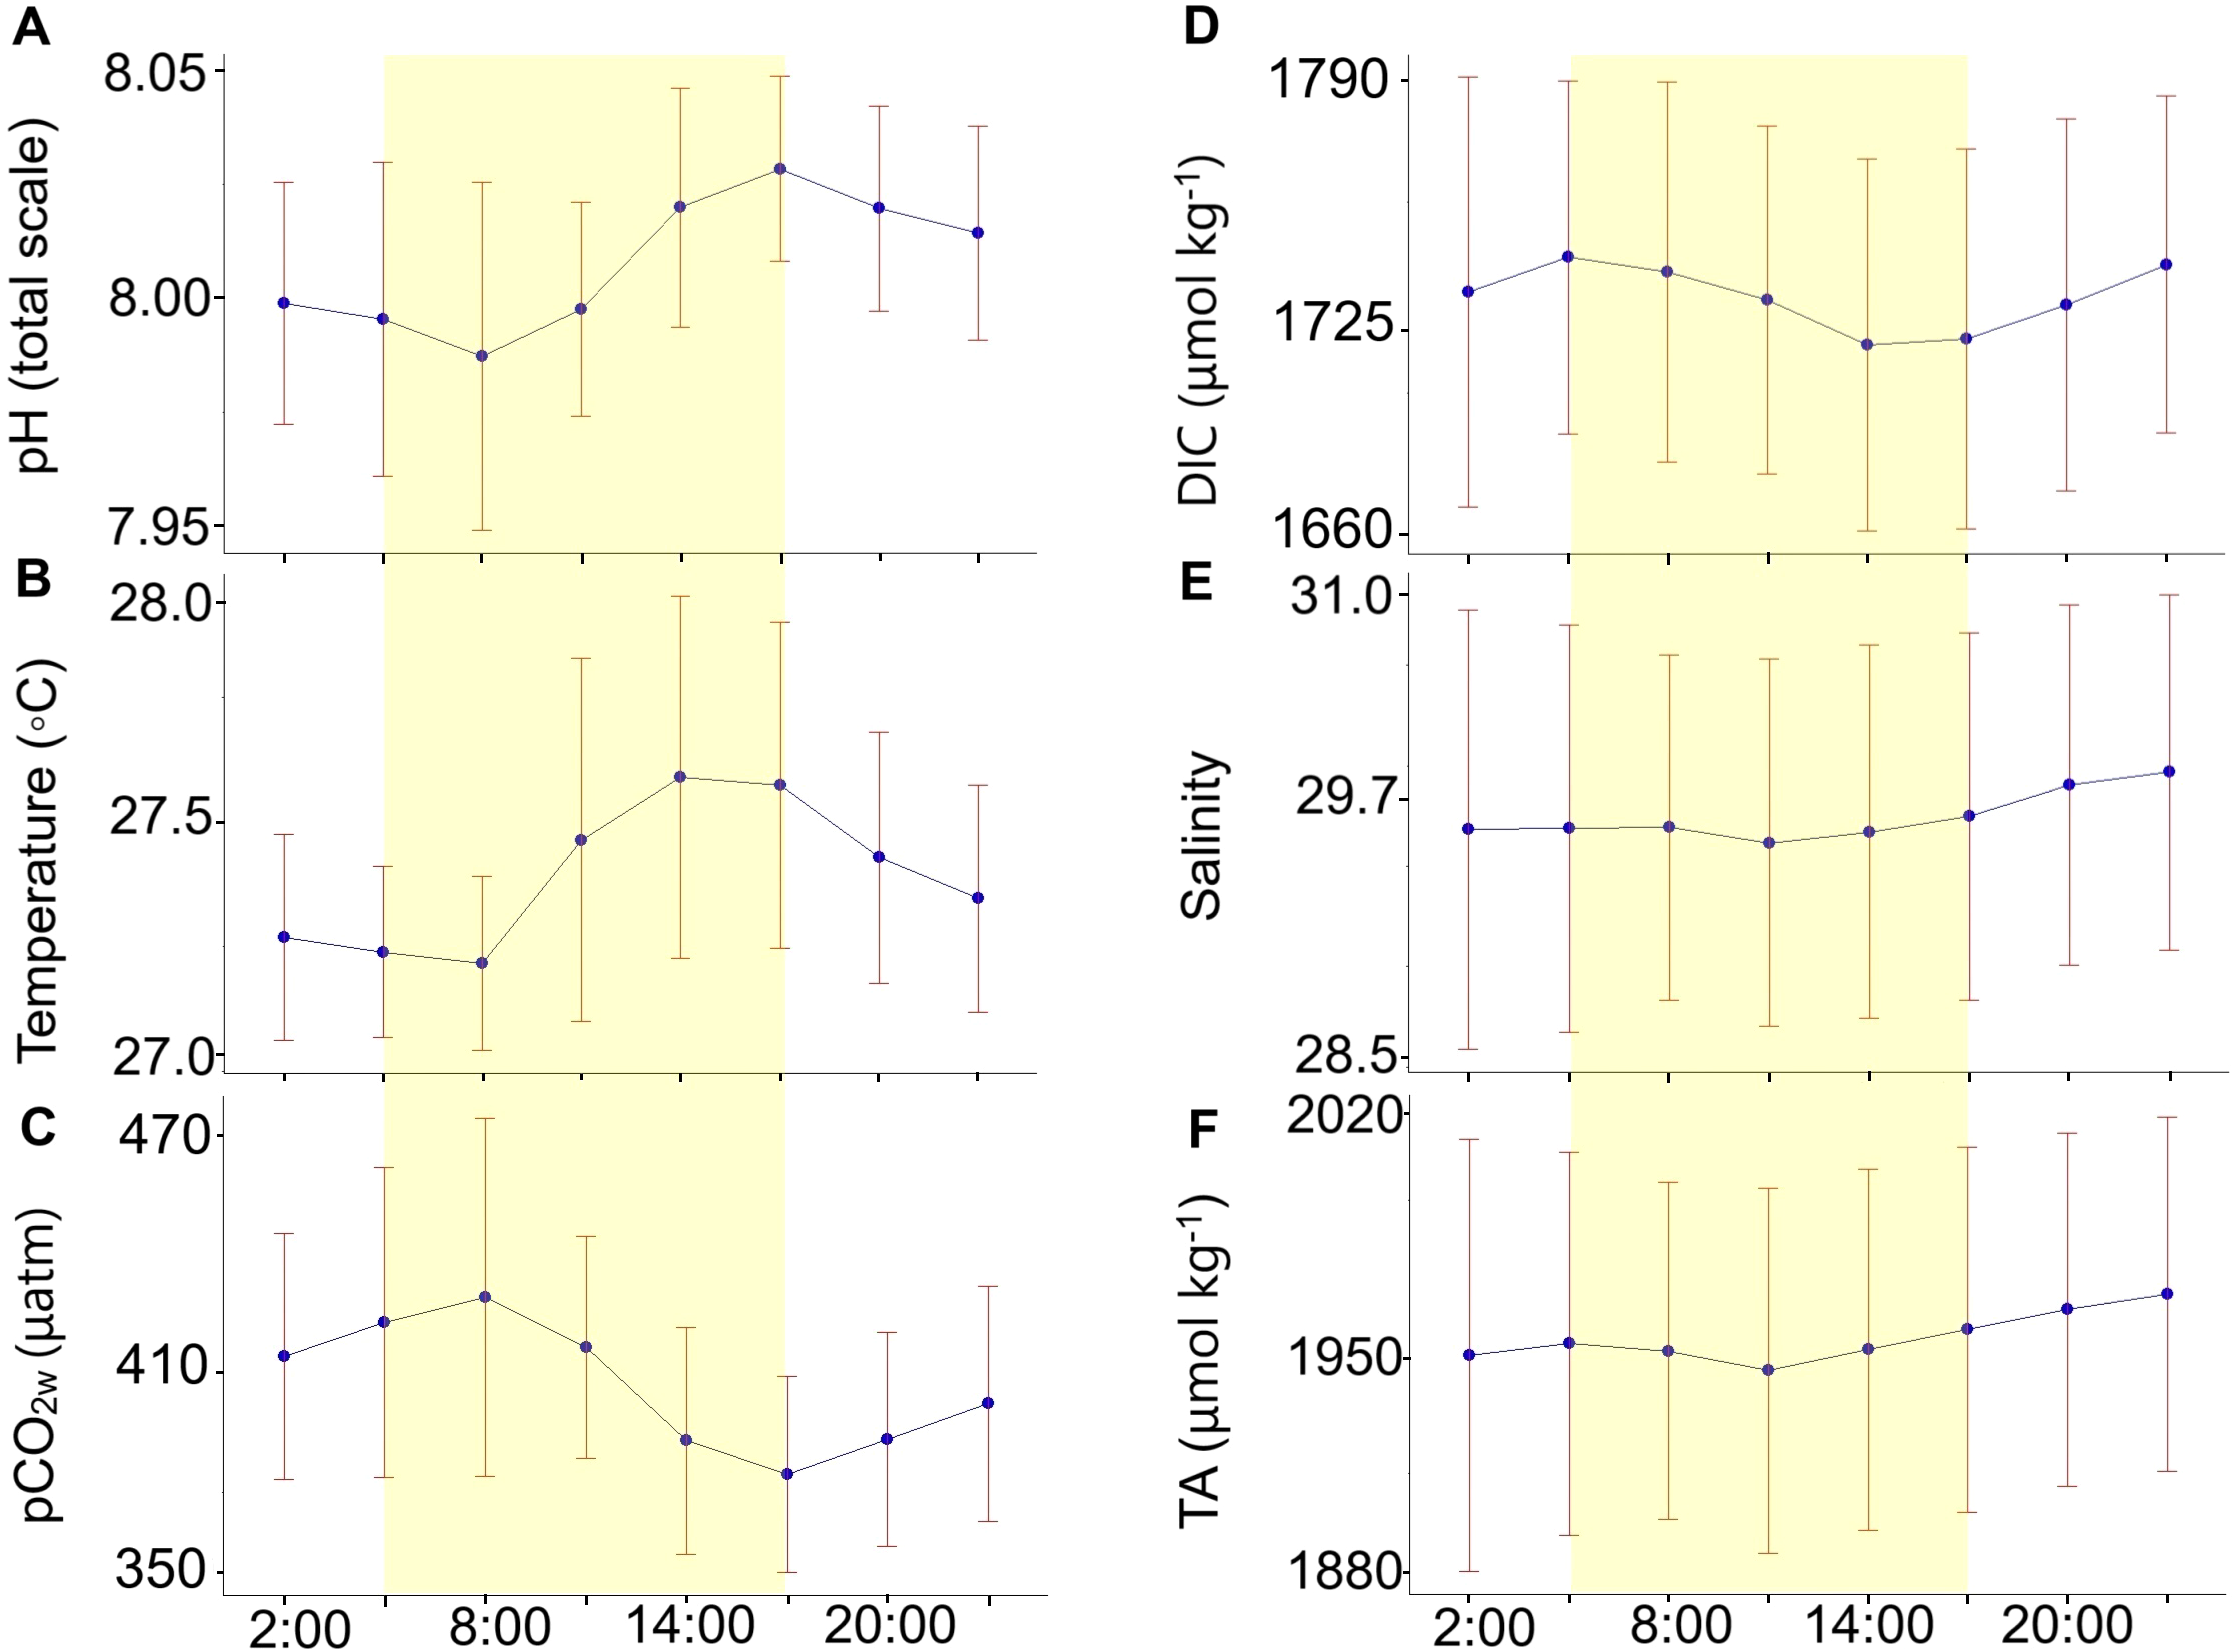
The diurnal scale (24 hours) of (A) pHT,(B) temperature, (C) pCO2W, (D) dissolved inorganic carbon (DIC), (E) salinity, and (F) total alkalinity (TA). The points represent the daily averages of measurements recorded every 3 hours over 56 consecutive days, with the red lines indicating the standard deviation of the daily averages. The shaded area highlights the daylight hours.
4 Discussion
4.1 Freshwater input, precipitation, and river discharges play a key role in the Pacific Colombian GNNP region
The high variability found in variables pHT, salinity, temperature, pCO2w, DIC, and TA at El Muelle reef highlights the influence of La Niña 2020–2023 event. La Niña event strengthened the Choco Jet (Hoyos et al., 2013; Arias et al., 2015; Serna et al., 2018), which caused an increase in precipitation in the Colombian Pacific basin and, consequently, an increase in the river flow into the sea (Restrepo and Kjerfve, 2000; Blanco, 2009; Serna et al., 2018). During the sampling period from September to November 2021, the station “57025020 Gorgona Guapi” recorded a total precipitation of 2878 mm, exceeding the total multiannual monthly average by more than 59% to 1815 mm.
Likewise, the station “53047010 Sangaral” recorded a monthly average flow of the Guapi River of 447 m³ s-1, exceeding by 44% the total multiannual monthly average of 309 m³ s-1. Thus, the sampling period was characterized by a considerable inflow of freshwater from river discharges and high rainfall that explained the reduced recorded salinity values and part of the pHT variability (Figure 2). The salinity normalization and correlation (Table 2) suggest that salinity plays a significant role in pHT variability. The interplay between low salinity and reduced alkalinity (directly correlated) and pH variability underscores its critical role in coastal biogeochemical cycles. Reduced salinity not only dilutes carbonate and bicarbonate ions but also disrupts the equilibrium of the CO2 system, as observed in estuarine zones by Feely et al. (2010) and Cai et al. (2021), where freshwater influx exacerbates anthropogenic CO2 uptake. These dynamics challenge the buffering capacity and resilience, particularly in reefs, where a range of water pH is essential for calcification.
Additionally, high rainfall and the consequent excess of freshwater (characteristic of a RioMar system) acted as a surface layer dilution factor (Zeebe and Wolf-Gladrow, 2001; Turk et al., 2010; Trujillo and Thurman, 2016; Ho and Schanze, 2020), contributing to reducing, even more, the salinity over time. For example, Ho and Schanze (2020) reported a rapid decrease in salinity of 4.4 at depths of 2 to 3 cm in response to heavy rainfall in the Eastern Equatorial Pacific, highlighting the impact of precipitation on coastal salinity dynamics. Salinity gradients and alkalinity depletion may act as synergistic stressors, which align with broader concerns about coastal acidification (Doney et al., 2009) and the ecological risks associated with climate change scenarios.
The tides exert a continuous physical influence, due considerable tidal variation, having maximum amplitudes of 5.82 m and minimum of -0.78 m in 2021 (3.39 ± 1.20 m; Flanders Marine Institute [VLIZ] and Intergovernmental Oceanographic Commission [IOC], 2025), implying millions of cubic meters of freshwater entering and leaving the coastal system, mixing oceanic water with freshwater coming from the Patia-Sanquianga complex plus the rainfall. The well-mixed RioMar water has minimal salinity variations throughout a full ebb and flow cycle (Figure 3). This high mixing condition persists up to 55 km downstream of the river mouth. As indicated by Palacios Moreno and Pinto Tovar (1992), due to the high tide, mixing begins at the river mouth, where seawater enters through the bottom of the Guapi River, resulting in waters with a salinity of 25.60 at 10 m, compared to 17 at 1 m. Furthermore, tides and the southern trade winds during La Niña events generate coastal currents and a strong swell (Osorio et al., 2014) that contribute to mixing these two water types, creating an estuary environment. Consequently, this coastal zone can be classified as a Type 2 RiOMar regime (Dai et al., 2022a), characterized by a high-energy tidal system and significant mixing near the river mouths (Lamarque et al., 2022).
In this scenario, the riverine influence reaching GNNP may explain the observed decrease in pHT over the study period. This trend is likely driven by the input of CO2 derived from riverine DIC, potentially due to the input and decomposition of organic matter, which increases H+ ion concentrations, as observed in other coastal regions (Vargas et al., 2016; Cai et al., 2021). In fact, in the Eastern Colombian Pacific, the observed decrease and low values of pHT were strongly correlated with salinity, pCO2w, and DIC (Table 2). Between 2018 and 2021, data collected at 13 river stations near the GNNP showed pHNBS values ranging from 6.3 to 8.3. Suspended solids ranged from 11 to 407 mg L-1, while nitrate (NO3-) concentrations ranged from 2 to 90.9 µg L-1. Phosphate (P-PO43-) levels fluctuated between 2 and 3.3 µg L-1, and chlorophyll-a concentrations ranged from 0.07 to 9.8 µg L-1. The highest values for these parameters were recorded during the year’s second half, coinciding with the rainy season (INVEMAR, 2020b; INVEMAR, 2022), which could contribute to acidification. This phenomenon aligns with RiOMar systems, where high DIC and nutrient inputs from rivers reach nearshore waters, and organic matter is subsequently exported to the continental shelf (Gan et al., 2009; Dai et al., 2022a). Decreases in pHT in other estuaries have been indirectly linked to fluvial discharges. For example, along the central-southern Chilean Pacific coast (Biobío River basin), the expansion of the river plume seaward led to reduced pHT conditions (7.6) during periods of maximum higher river discharge, compared to more oceanic stations where pHT ranged from 7.95 to 8.15 (Vargas et al., 2016). Likewise, in the South Pacific Ocean, in Coral Bay, fluvial discharges from low-pH rivers (7.739 ± 0.022) cause coastal areas with low pHT (8.014 ± 0.015) (Aguilera et al., 2013), similar to low pH observed across the GNNP Colombian Pacific Region. Indeed, the surface values (2m) of pHT (8.01 ± 0.03), salinity (29.74 ± 0.94), TA (1959 ± 54 µmol kg-1), DIC (1728 ± 49 µmol kg-1) and Ωa (2.71 ± 0.17) at El Muelle reef (GNNP) are below the surface averages reported for the North Pacific (8. 105 ± 0.06, 34.05 ± 0.86, 2255 ± 34 µmol kg-1, 1959 ± 42 µmol kg-1 and 3.30 ± 0.7; respectively) and the South Pacific (8.079 ± 0.03, 35.29 ± 0.55, 2319 ± 35 µmol kg-1, 2003 ± 39 µmol kg-1 and 3.52 ± 0.4) (Feely et al., 2009).
On the contrary, oceanic areas without river input, such as North Pacific Monterey Bay, have recorded relatively high pHT (Gray et al., 2011). However, at higher latitudes on the Pacific coast of Costa Rica, low pHT levels were associated with the rainy season (Sánchez-Noguera et al., 2018). A drop in pHT is also known to occur in the estuaries of Swartkops and Sundays in South Africa, where, due to strong inflows of freshwater, a high pHT decrease of 0,46 pH units was produced (Edworthy et al., 2022). The relatively low pHT of the Pacific Colombian Coast (El Muelle, GNNP, Table 3) is similar to studies in the East River China Sea, where the low pHT (7.98 to 8.07) was attributed to the high river inputs from the Changjiang plume, known to carry organic carbon, nutrients, and CO2 supersaturated water (Wu et al., 2021). We already know that freshwater inputs from rivers play a critical role in shaping carbonate chemistry in coastal systems, particularly in the continental shelf. As well as in our study site, Rérolle et al. (2018) have identified riverine discharges, characterized by high DIC and TA, as key drivers of reduced pHT in the Irish Sea, southern North Sea, and Skagerrak region. Further studies on carbon chemistry in the region are needed, including direct measurements of DIC and dissolved organic matter in the Patia-Sanquianga complex during wet and dry seasons. These and other chemical parameters, such as nutrients, are crucial to evaluating rivers’ contribution to coastal carbonate chemistry, particularly near reef systems, and the impact on ocean acidification (Borges et al., 2005; Cai et al., 2021). The main knowledge gaps include the effects of remineralization on pH in tropical estuaries (Dai et al., 2022b; Vargas et al., 2016) to understand the vulnerability of ecosystems to OA.
Table 3
| Location | Long. | Lat. | Ocean | Instrument | pHT range | Reference |
|---|---|---|---|---|---|---|
| Bahia Monterrey, EEUU |
121° 54′ 0″ W | 36° 49′ 48″ N | Pacific Ocean | iSAMI-pH | 7.93 - 8.37 | Gray et al., 2011 |
| Bahia Culebra, Costa Rica | 85° 36′ 0″ W | 10° 30′ 0″ N | Pacific Ocean | iSAMI-pH | 7.98 - 8.06 | Sánchez-Noguera et al., 2018 |
| East China Sea | 128° 30′ 0″ E | 30° 0′ 0″ N | Pacific Ocean | SeaFET Ocean pH sensor | 7.98 - 8.07 | Wu et al., 2021 |
| Northwest European Shelf Seas | 10° 0′ 0″ W to 10° 0′ 0″ E | 45° 0′ 0″ N to 60° 0′ 0″ N | Atlantic Ocean | Lab-on-Chip | 7.99 - 8.21 | Rérolle et al., 2018 |
| Algoa Bay, South Africa | 25° 48′ 0″ E | 33° 48′ 0″ S | Atlantic Ocean | iSAMI-pH | 7.98 - 8.44 | Edworthy et al., 2022 |
| Gorgona, Colombia | 78° 6′ 0″ W | 2° 54′ 0″ N | Pacific Ocean | iSAMI-pH | 7.93 - 8.09 | This study (2021) |
Comparison between autonomous sensors recorded total scale pH (pHT) across various geographical zones.
Note that the minimum pHT recorded at Gorgona Island, Colombia, is lower than in other regions.
4.2 Daily scale of carbon and physical seawater variability and atmospheric variables, solar radiation, and precipitation
During the study period, the ITCZ was located close to the equator in the Colombian Pacific Ocean (Díaz Guevara et al., 2008), which intensified cloudiness and precipitation due to the convergence of trade winds from the northern and southern hemispheres (Díaz Guevara et al., 2008). The increase in cloudiness likely contributed to the decline in solar radiation, which diminished from 3,709 ± 1,205 Wh m-2 in September to 2,501 ± 789 Wh m-2 in November, with a marked reduction between October 1 and 25 (2,488 ± 590 Wh m-2; Figure 5A). Given the positive correlation between solar radiation and temperature (Trujillo and Thurman, 2016; Webster, 2020), the decrease in solar radiation may explain the low SST observed from September 13 to November 7. According to Millero (2007, 2013) lower temperatures increase CO2 solubility in seawater, suggesting that the temperature decline likely improved oceanic CO2 uptake by enabling its transfer from the atmosphere to the ocean during the study period. The resulting CO2 increase could explain pCO2w and DIC’s highest values (Figure 2), particularly between October 1 and 25, when solar radiation was at its lowest (Figure 5). Thus, the solar radiation and temperature reduction may partially explain the observed decline in pHT during this period. The inverse correlation between pHT and pCO2w also suggests that fluctuations in pCO2w (indirectly DIC) could help explain pHT variations over September-November (Table 2; Zeebe and Wolf-Gladrow, 2001; Millero, 2013; Cai et al., 2021). After October 25, the rise in solar radiation and temperature may have led to a pHT increment by approximately 0.028 units, along with a decrease in pCO2w by 41 μatm and DIC by 100 μmol kg-1 (Figures 2D, E).
Figure 5
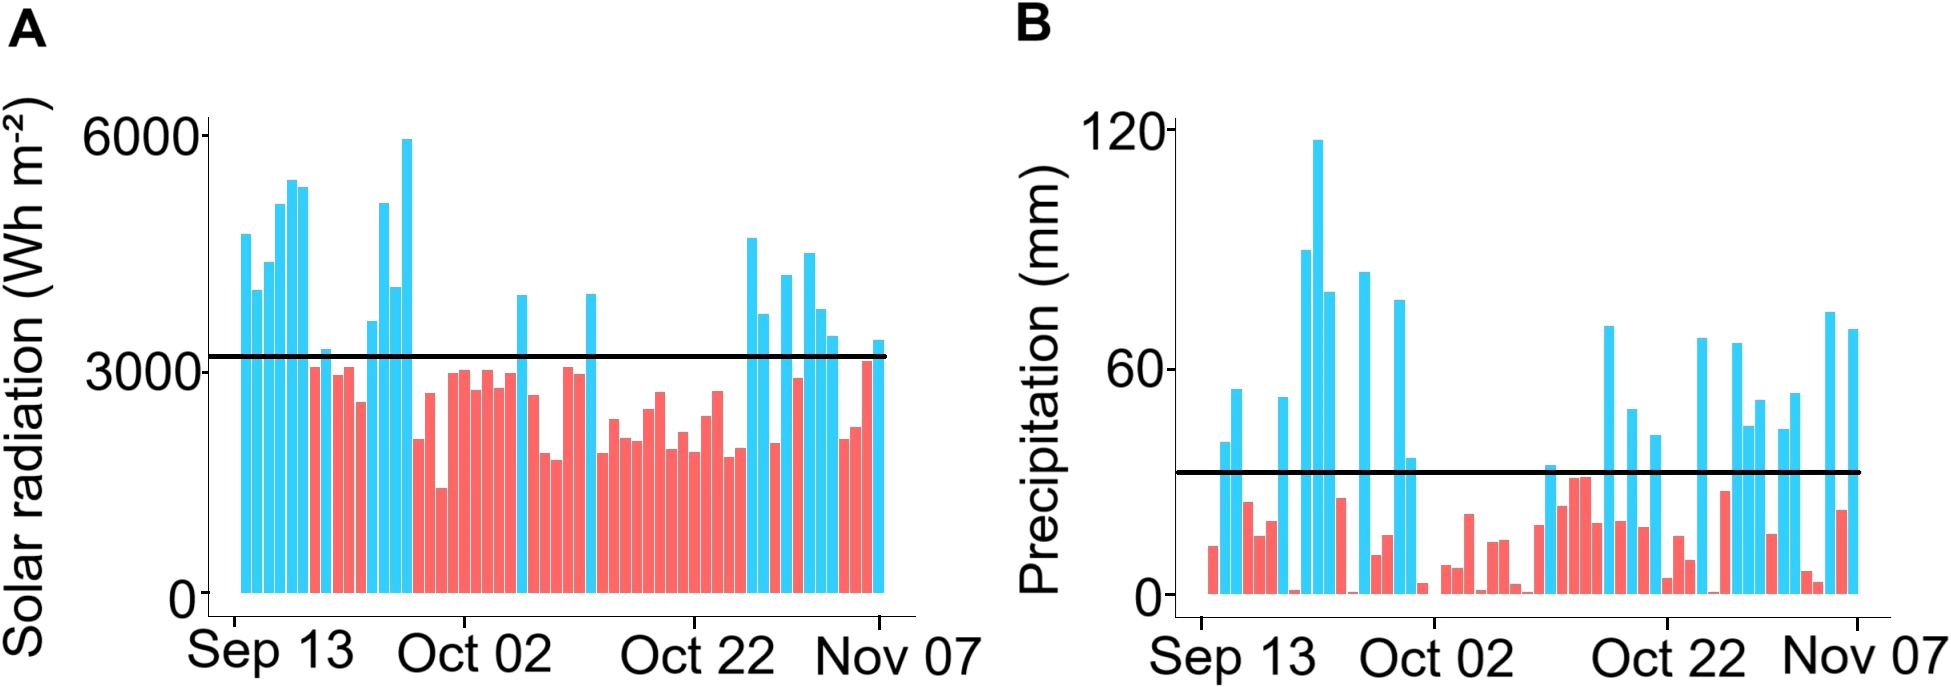
Atmospheric variables in the study area from September 13 to November 7, 2021. (A) Solar radiation was recorded at station 26015040 (Arrayanales). The black line indicates the daily (September to 7 November 2021) for solar radiation (3078 Wh m-2) and precipitation (31 mm), and (B) Total precipitation was recorded at station 57025020 (Gorgona). Periods above the daily average are highlighted in blue, while periods below the daily average are shown in red.
Between October 3 and 16, total precipitation amounted to 22 mm (Figure 5B), with most days recording values below the mean daily precipitation of 31 mm. The observed reduction in precipitation likely diminished freshwater inflow relative to seawater, thereby enhancing salinity levels and elevating TA and DIC concentrations during this period. During the sampling period (September 13 to November 7), evaporation (Copernicus Climate Change Service, 2024) was highest in October (-62 mm), followed by September (-36 mm) and November (-15 mm). However, in all cases, the monthly accumulated evaporation remained well below the corresponding monthly precipitation totals of 680 mm, 727 mm, and 261 mm, respectively (DHIME, 2025).
In addition to previously discussed mechanisms, the elevated levels of pCO2w, DIC, and salinity observed between October 1 and 25 may also be influenced by a coastal upwelling event. This hypothesis is supported by the positive values of zonal Ekman transport (ZET) during this period, which indicates eastward surface water movement, given the regional coastline orientation and prevailing wind patterns (Corredor-Acosta et al., 2020). The eastward Ekman transport suggests offshore water displacement and the potential for deeper, carbon- and nutrient-rich water upwelling (Supplementary Figure 4).
4.3 24-hour cycle of the carbonate system
During early morning hours (5:00 - 6:00 am), we registered the lowest pHT and temperature values, along with the highest concentration of pCO2w and DIC, suggesting the influence of night-time respiration processes before daylight (Millero, 2013; Albright et al., 2013; Sánchez-Noguera et al., 2018). On the other hand, the highest values of pHT and temperature and the lowest values of pCO2w and DIC recorded during the late afternoon (17:00 - 18:00) suggest photosynthetic processes during daylight driven by increased solar radiation (Cyronak et al., 2013). The mean diel change of 0.037 units in pHT and 0.38 °C in temperature between early morning and afternoon hours fall within the expected diel variability for shallow environments (0.7–17 m), where biological and physical processes significantly influence pH and temperature dynamics (Cyronak et al., 2013).
The absence of a significant difference in TA and carbonate alkalinity between early morning and late afternoon hours may be due to the derivation of TA using a TA-salinity relationship, which primarily accounts for processes such as evaporation, precipitation, and mixing tides (Spaulding et al., 2014). In contrast, calcification and dissolution, more likely to exhibit variations over a 24-hour cycle, may not be adequately reflected (Zeebe and Wolf-Gladrow, 2001; Millero, 2013; Cai et al., 2021). However, the data indicate that the El Muelle reef, close to the sampling point, is composed predominantly of Pocillopora spp. (Figure 1; Zapata, 2001; Acosta et al., 2007), was exposed during the sampling period to low pHT (8.01 ± 0.03), salinity (29.32 ± 1.01), and Ωa (2.71 ± 0.17). These environmental conditions are considered challenging for Pocillopora spp., which are known to be highly sensitive to reduced pH and lowered salinity associated with river discharge (Alvarado et al., 2005; Lizcano-Sandoval et al., 2018; Sánchez-Noguera, 2019). Notably, the global, annually averaged tolerance limit for coral reefs is an Ωa of 2.82, indicating that corals at this site live below the threshold commonly reported in the literature (Guan et al., 2015).
Despite these adverse conditions and frequent riverine influence, especially during the rainy season in the latter half of the year (Giraldo et al., 2008, 2011), Pocillopora spp. persist and even dominate the area (Zapata, 2001; Acosta et al., 2007; Lizcano-Sandoval et al., 2018). Previous studies have shown that Pocillopora spp. in GNNP can maintain growth rates (Lizcano-Sandoval et al., 2018) and tolerate hypoxia, low salinity, and temperature fluctuations by reducing reproductive output rather than growth (Castrillón-Cifuentes et al., 2023a, 2023). This suggests that these corals are either locally adapted or possess a degree of physiological tolerance to low pH, salinity, and Ωa. Similar findings from the Pearl River Estuary in Southeast China indicate that long-term hypo-salinity acclimation can enhance the tolerance of Pocillopora spp. to low salinity by reducing energy consumption, slowing metabolism, improving the energy metabolism of their symbiotic algae (Symbiodiniaceae), and altering their symbiotic bacterial communities to avoid bleaching (Chen et al., 2024). Nevertheless, Pocillopora spp. corals at Gorgona Island exhibit lower calcification rates (3.16 g CaCO3 cm-2 yr-1; Lizcano-Sandoval et al., 2018) compared to those reported in other reef systems, such as Panama (5–6 g CaCO3 cm-2 yr-1; Manzello, 2010) and Mexico (2.99–6.02 g CaCO3 cm-2 yr-1; Medellín-Maldonado et al., 2016; González-Pabón et al., 2021; Tortolero-Langarica et al., 2022). To establish a more robust correlation between the carbonate system and calcification rates in Pocillopora spp. at GNNP, future research efforts should prioritize in situ measurements of TA, dissolved oxygen, and direct calcification assessments (e.g., via buoyant weight or alkalinity anomaly techniques) on a 24-h scale during both rainy and dry seasons, to better quantify metabolic dynamics and clarify the adaptive capacity of this species under adverse environmental conditions.
In addition, future research should prioritize high-frequency measurements of pH, nutrient concentrations, and stable isotopes across diurnal, seasonal, and interannual timescales. These efforts should encompass both rainy and dry seasons and different ENSO phases, such as El Niño and neutral conditions, to better distinguish water sources in the region and assess the influence of these temporal scales on carbonate chemistry variability.
5 Conclusions
The natural variability of the Ocean Acidification on 24-hour and daily scales and during 56 days at El Muelle reef, Colombian Pacific, Gorgona Island, was assessed in a fixed station using high-resolution measurements of seawater pHT, salinity, and temperature taken every three hours during a year with a strong La Niña event and extreme precipitation months. The prolonged 2020–2023 La Niña event amplified rainfall and freshwater discharges from the Guapi River, establishing a Type 2 RIOMar (river-marine) system dominated by high-energy tidal dynamics and intense river-sea mixing. This freshwater influx likely contributed to localized declines in seawater pHT. Concurrently, the southward migration of the ITCZ triggered persistent cloud cover and strong southwesterly winds, attenuating solar radiation and lowering both sea surface temperatures and pHT. Enhanced rainfall within the RIOMar system further diluted the surface layer, progressively reducing salinity and TA, thereby diminishing the system’s buffering capacity against carbonate chemistry fluctuations. Biological processes such as photosynthesis and respiration shaped pronounced diurnal patterns within the 24-hour cycles, driving decreased and increased pH, pCO2w, and DIC. These results highlight the substantial and high-frequency variability of pH and acidification conditions formed by the heavy rainfall and runoff that characterize this Pacific Colombian region. Therefore, we strongly recommend implementing long-term monitoring programs (COCAS Ocean Decade Project) to support acidification impact studies and adaptive management and conservation efforts within this National Natural Park.
Statements
Data availability statement
The datasets generated for this study can be found in the NOAA - National Centers for Environmental Information (NCEI; Accession Number 0300707). https://www.ncei.noaa.gov/data/oceans/ncei/ocads/metadata/0300707.html).
Author contributions
AM: Conceptualization, Investigation, Methodology, Supervision, Validation, Visualization, Writing – original draft, Writing – review & editing, Data curation, Formal Analysis. AA: Conceptualization, Formal Analysis, Funding acquisition, Investigation, Methodology, Project administration, Resources, Supervision, Validation, Visualization, Writing – original draft, Writing – review & editing. AG: Conceptualization, Investigation, Methodology, Writing – review & editing. AC: Formal Analysis, Investigation, Supervision, Validation, Visualization, Writing – review & editing. JH: Conceptualization, Formal Analysis, Supervision, Validation, Visualization, Writing – review & editing. SG: Investigation, Methodology, Validation, Visualization, Writing – review & editing. CC: Methodology, Validation, Writing – review & editing. DR: Conceptualization, Supervision, Validation, Visualization, Writing – review & editing.
Funding
The author(s) declare financial support was received for the research and/or publication of this article. The Principal Investigator (PI), AA, acknowledges receiving financial support for various research activities, including purchasing equipment, acquiring laboratory and field materials, and funding field trips. Additionally, these funds were used to establish and equip a laboratory at the Pontificia Universidad Javeriana. Partial resources from the same fund were also allocated to cover the publication costs of this article (ID 21346). The National Geographic Explorer program funded this research through the project titled “Ocean Acidification Vulnerability in Colombia: First Monitoring Program in the Tropical Pacific” (Grant No. NGS-64756R-19), with additional COVID-19 grant support (Grant No. NGS-81727R-20). The Pontificia Universidad Javeriana provided further funding under the project “Monitoreo de acidificación marina en el Pacífico colombiano” (Project ID: 120132C0401200, No. 20019).
Acknowledgments
Dr. Cristian Vargas of the Laboratory of Aquatic Ecosystems Performance (LAFE) at the University of Concepción (EULA Chile) supported getting the iSAMI-pH equipment. The Ocean Foundation donated the GOA-ON in a Box kit, OA training, and grant support for equipment maintenance under the Memorandum of Understanding between Pontificia Universidad Javeriana and The Ocean Foundation (“TOF”). Dra. Andrea Corredor-Acosta thanks FONDECYT Postdoctoral Project No. 3230740, granted by the Chilean Agency for Research and Development (ANID). This research is part of the collaboration with the International COCAS project (2021-2030), Ocean Decade-United Nations (Leader Diana Ruiz Pino and Alban Lazar) https://oceandecade.org/fr/actions/coastal-observatory-for-climate-co2-and-acidification-for-theglobal-south-society-cocas/. We also thank Parques Nacionales Naturales de Colombia - Gorgona for their logistical support at Gorgona (Christian Díaz – research head & Monitoring of the Gorgona park), accommodation, boat, and the research permit No. 004 de 2020 - file number: OTRP 004-2020. To Dra. Reggie Spaulding, James Beck, and Dr. Christopher Sabine for their technical support with the iSAMI-pH equipment. To Camilo, Freddy, and Jaime for their help in the Ocean Acidification laboratory. To Juan Felipe Cifuentes for his assistance deploying the iSAMI-pH at El Muelle Reef. Thanks to Dr. Alan Giraldo of Universidad del Valle for funding research interns Cristian Claros, Sebastián Ortiz, and Natalia Londoño, who collaborated with us in the field sampling. We thank Camilo Rodríguez and Enrique Herman for their help during the long days of boat sampling and for hosting us in their home during our stay at Guapi.
Conflict of interest
The authors declare that the research was conducted in the absence of any commercial or financial relationships that could be construed as a potential conflict of interest.
The author(s) declared that they were an editorial board member of Frontiers, at the time of submission. This had no impact on the peer review process and the final decision.
Generative AI statement
The author(s) declare that no Generative AI was used in the creation of this manuscript.
Publisher’s note
All claims expressed in this article are solely those of the authors and do not necessarily represent those of their affiliated organizations, or those of the publisher, the editors and the reviewers. Any product that may be evaluated in this article, or claim that may be made by its manufacturer, is not guaranteed or endorsed by the publisher.
Supplementary material
The Supplementary Material for this article can be found online at: https://www.frontiersin.org/articles/10.3389/fmars.2025.1595871/full#supplementary-material
References
1
Acosta L. A. Uribe D. G. Isaacs P. (2007). Estudio de línea base de las formaciones coralinas de Yundigua y el muelle, isla Gorgona, Pacífico Colombiano. Universitas Scientiarum12, 65–81.
2
Aguilera V. M. Vargas C. A. Manríquez P. H. Navarro J. M. Duarte C. (2013). Low-pH freshwater discharges drive spatial and temporal variations in life history traits of the neritic copepod. Acartia tonsa. Estuaries Coasts36, 1084–1092. doi: 10.1007/s12237-013-9615-2
3
Albright R. Langdon C. Anthony K. R. N. (2013). Dynamics of seawater carbonate chemistry, production, and calcification of a coral reef flat, central Great Barrier Reef. Biogeosciences10, 6747–6758. doi: 10.5194/bg-10-6747-2013
4
Alvarado J. J. Cortés J. Fernández C. Nivia J. (2005). Comunidades y arrecifes coralinos del Parque Nacional Marino Ballena, costa del Pacífico de Costa Rica. Rev. Biología Trop.31, 1–20.
5
Amador J. A. Alfaro E. J. Lizano O. G. Magaña V. O. (2006). Atmospheric forcing of the eastern tropical Pacific: A review. Prog. Oceanography69, 101–142. doi: 10.1016/j.pocean.2006.03.007
6
Aminot A. Kérouel R. (2004). Hydrologie des écosystèmes marins: paramètres et analyses (Editions Quae).
7
Arias P. A. Martínez J. A. Vieira S. C. (2015). Moisture sources to the 2010–2012 anomalous wet season in northern South America. Climate Dynamics45, 2861–2884. doi: 10.1007/s00382-015-2511-7
8
Ashton I. G. Shutler J. D. Land P. E. Woolf D. K. Quartly G. D. (2016). A sensitivity analysis of the impact of rain on regional and global sea-air fluxes of CO2. PloS One11. doi: 10.1371/journal.pone.0161105
9
Atekwana E. A. Ramatlapeng G. J. Ali H. N. Njilah I. K. Ndondo G. R. N. (2022). Tide-salinity patterns reveal seawater-freshwater mixing behavior at a river mouth and tidal creeks in a tropical mangrove estuary. J. Afr. Earth Sci.196. doi: 10.1016/j.jafrearsci.2022.104684
10
Berri G. J. Bianchi E. Müller G. v. (2019). El Niño and la Niña influence on mean river flows of southern South America in the 20th century. Hydrological Sci. J.64, 900–909. doi: 10.1080/02626667.2019.1609681
11
Blanco J. F. (2009). The hydroclimatology of Gorgona island: seasonal and ENSO-related patterns. Actualidades Biológicas31, 111–121. doi: 10.17533/udea.acbi.331494
12
Borges A. V. Delille B. Frankignoulle M. (2005). Budgeting sinks and sources of CO2 in the coastal ocean: Diversity of ecosystems counts. Geophys. Res. Lett.32, L14601. doi: 10.1029/2005GL023053
13
Cai W. J. Feely R. A. Testa J. M. Li M. Evans W. Alin S. R. et al . (2021). Natural and anthropogenic drivers of acidification in large estuaries. Annu. Rev. Mar. Sci.13, 23–55. doi: 10.1146/annurev-marine-010419-011004
14
Caldeira K. Wickett M. E. (2003). Anthropogenic carbon and ocean pH. Nature425, 365–365. doi: 10.1038/425365a
15
Carstensen J. Chierici M. Gustafsson B. G. Gustafsson E. (2018). Long-term and seasonal trends in estuarine and coastal carbonate systems. Global Biogeochemical Cycles32, 497–513. doi: 10.1002/2017GB005781
16
Carter B. R. Williams N. L. Gray A. R. Feely R. A. (2016). Locally interpolated alkalinity regression for global alkalinity estimation. Limnology Oceanography: Methods14, 268–277. doi: 10.1002/lom3.10087
17
Castrillón-Cifuentes A. L. Zapata F. A. Giraldo A. Wild C. (2023a). Spatiotemporal variability of oxygen concentration in coral reefs of Gorgona Island (Eastern Tropical Pacific) and its effect on the coral Pocillopora capitata. PeerJ11, e14586. doi: 10.7717/peerj.14586
18
Castrillón-Cifuentes A. L. Zapata F. A. Wild C. (2023b). Physiological responses of Pocillopora corals to upwelling events in the Eastern Tropical Pacific. Front. Mar. Sci.10. doi: 10.3389/fmars.2023.1212717
19
Chen J. Yu X. Yu K. Chen B. Qin Z. Liao Z. et al . (2024). Potential adaptation of scleractinian coral Pocillopora damicornis during hypo-salinity stress caused by extreme pre-flood rainfall over south China. Environ. Res.262, 119848. doi: 10.1016/j.envres.2024.119848
20
Copernicus Climate Change Service, Climate Data Store (2024). ERA5 post-processed daily-statistics on single levels from 1940 to present (Copernicus Climate Change Service (C3S) Climate Data Store (CDS). doi: 10.24381/cds.4991cf48
21
Corredor-Acosta A. Cortés-Chong N. Acosta A. Pizarro-Koch M. Vargas A. Medellín-Mora J. et al . (2020). Spatio-temporal variability of chlorophyll-a and environmental variables in the Panama bight. Remote Sens.12, 2150. doi: 10.3390/rs12132150
22
Cyronak T. Santos I. R. Eyre B. D. (2013). Permeable coral reef sediment dissolution driven by elevated CO2 and porewater advection. Geophysical Res. Lett.40, 4876–4881. doi: 10.1002/grl.50948
23
Dai M. Lu Z. Zhai W. Chen B. Cao Z. Zhou K. et al . (2022a). Carbon cycling in the river-dominated ocean margins: Mechanisms, fluxes, and global significance. Front. Mar. Sci.9. doi: 10.3389/fmars.2022.789234
24
Dai M. Su J. Zhao Y. Hofmann E. E. Cao Z. Cai W.-J. et al . (2022b). Carbon fluxes in the coastal ocean: synthesis, boundary processes and future trends. Annu. Rev. Earth Planetary Sci.50, 593–626. doi: 10.1146/annurev-earth-032320
25
Datos Hidroclimatologicos y Meteorológicos. (DHIME) (2025).Consulta y Descarga de Datos Hidrometeorológicos. Available online at: http://dhime.ideam.gov.co/atencionciudadano/ (Accessed April 17, 2023).
26
Díaz M. J. (2007). “Deltas y Estuarios del Pacífico Colombiano,” in Deltas y estuarios de Colombia (Banco de Occidente, Cali).
27
Díaz J. M. Pinzón J. H. Perdomo A. M. Barrios L. M. López-Victoria M. (2001). “Generalidades: 17-26,” in Gorgona Marina: Contribución al conocimiento de una isla única., vol. 7 . Eds. En BarriosL. M.López-VictoriaM. (INVEMAR, Serie de Publicaciones Especiales, Santa Marta, Colombia), 160 pp.
28
Díaz Guevara D. C. Málikov I. Villegas Bolaños N. L. (2008). Características de las zonas de surgencia de la cuenca del Pacífico Colombiano y su relación con la zona de convergencia intertropical. Boletín Científico CIOH26, 59–71. doi: 10.26640/01200542.26.59_71
29
Dickson A. G. (1990). Standard potential of the reaction: AgCl (s)+ 12H2 (g)= Ag (s)+ HCl (aq), and the standard acidity constant of the ion HSO4– in synthetic sea water from 273.15 to 318.15 K. The. J. Chem. Thermodynamics22, 113–127. doi: 10.1016/0021-9614(90)90074-Z
30
Dickson A. G. Sabine C. L. Christian J. R. (2007). Guide to best practices for ocean CO2 measurements (North Pacific Marine Science Organization).
31
Doney S. C. Fabry V. J. Feely R. A. Kleypas J. A. (2009). Ocean acidification: The other CO2 problem. Annu. Rev. Mar. Sci.1, 169–192. doi: 10.1146/annurev.marine.010908.163834
32
Edworthy C. Potts W. M. Dupont S. Duncan M. I. Bornman T. G. James N. C. et al . (2022). A baseline assessment of coastal pH variability in a temperate South African embayment: implications for biological ocean acidification research. Afr. J. Mar. Sci.44, 367–381. doi: 10.2989/1814232X.2022.2147999
33
Emerton R. Cloke H. L. Stephens E. M. Zsoter E. Woolnough S. J. Pappenberger F. (2017). Complex picture for likelihood of ENSO-driven flood hazard. Nat. Commun.8. doi: 10.1038/ncomms14796
34
Espinoza-Morriberón D. Echevin V. Colas F. Tam J. Gutierrez D. Graco M. et al . (2019). Oxygen variability during ENSO in the tropical South Eastern Pacific. Front. Mar. Sci.5. doi: 10.3389/fmars.2018.00526
35
Fassbender A. J. Alin S. R. Feely R. A. Sutton A. J. Newton J. A. Byrne R. H. (2017). Estimating total alkalinity in the Washington State coastal zone: complexities and surprising utility for ocean acidification research. Estuaries Coasts40, 404–418. doi: 10.1007/s12237-016-0168-z
36
Fassbender A. J. Orr J. C. Dickson A. G. (2021). Interpreting pH changes. Biogeosciences18, 1407–1415. doi: 10.5194/bg-18-1407-2021
37
Feely R. A. Alin S. R. Newton J. Sabine C. L. Warner M. Devol A. H. et al . (2010). The combined effects of ocean acidification and low salinity on carbonate chemistry. Estuarine Coast. Shelf Science.88, 442–449. doi: 10.1016/j.ecss.2009.12.021
38
Feely R. A. Doney S. C. Cooley S. R. (2009). Ocean acidification: Present conditions and future changes in a high-CO2 world. Oceanography22, 36–47. doi: 10.5670/oceanog.2009.95
39
Feely R. A. Takahashi T. Wanninkhof R. McPhaden M. J. Cosca C. E. Sutherland S. C. et al . (2006). Decadal variability of the air-sea CO2 fluxes in the equatorial Pacific Ocean. J. Geophysical Research: Oceans111. doi: 10.1029/2005JC003129
40
Fiedler P. C. Lavín M. F. (2017). “Oceanographic conditions of the eastern tropical Pacific,” in Coral Reefs of the Eastern Tropical Pacific, vol. 8 . Eds. GlynnP.ManzelloD.EnochsI. (Springer, Dordrecht). Coral Reefs of the World. doi: 10.1007/978-94-017-7499-4_3
41
Flanders Marine Institute (VLIZ) and Intergovernmental Oceanographic Commission (IOC) (2025).Sea level station monitoring facility. Available online at: https://www.ioc-sealevelmonitoring.org (Accessed May 18, 2024).
42
Gan J. Li L. Wang D. Guo X. (2009). Interaction of a river plume with coastal upwelling in the northeastern South China Sea. Continental Shelf Res.29, 728–740. doi: 10.1016/j.csr.2008.12.002
43
Gattuso J. P. Magnan A. Billé R. Cheung W. W. Howes E. L. Joos F. et al . (2015). Contrasting futures for ocean and society from different anthropogenic CO2 emissions scenarios. Science349. doi: 10.1126/science.aac4722
44
Giraldo A. Rodríguez-Rubio E. Zapata F. (2008). Condiciones oceanográficas en isla Gorgona, Pacífico oriental tropical de Colombia. Latin Am. J. Aquat. Res.36, 121–128. doi: 10.3856/vol36-issue1-fulltext-12
45
Giraldo A. Valencia B. (2013). “Monitoreo del ambiente pelágico del PNN Gorgona: marzo 2013,” in Informe Técnico producto No. 8 del proyecto de investigación (Monitoreo de los valores objeto de conservación priorizados para las áreas protegidas Gorgona y Utría adscritas a la Dirección Terri, Cali).
46
Giraldo A. Valencia B. Acevedo J. D. Rivera M. (2014). Fitoplancton y zooplancton en el área marina protegida de Isla Gorgona, Colombia, y su relación con variables oceanográficas en estaciones lluviosa y seca. Rev. Biología Trop.62, 117–132. doi: 10.15517/rbt.v62i0.15982
47
Giraldo A. Valencia B. Ramírez D. G. (2011). Productividad planctónica y condiciones oceanográficas locales en Isla Gorgona durante julio 2006. Boletín Investigaciones Marinas y Costeras-INVEMAR40, 185–201.
48
Giraldo López A. (2008). Variabilidad espacial de temperatura, salinidad y transparencia en el ambiente pelágico del PNN Gorgona durante septiembre 2007 y marzo 2008. Boletín Científico CIOH26, 157–163. doi: 10.26640/01200542.26.157_163
49
Glynn P. W. Prahl H. V. Guhl F. (1982). Coral reefs of Gorgona Island, Colombia, with special reference to corallivores and their influence on community structure and reef development. Annales l’Institut Océanographique58, 243–277.
50
González-Pabón M. A. Tortolero-Langarica J. A. Calderon-Aguilera L. E. Solana-Arellano E. Rodríguez-Troncoso A. P. Cupul-Magaña A. L. et al . (2021). Low calcification rate, structural complexity, and calcium carbonate production of Pocillopora corals in a biosphere reserve of the central Mexican Pacific. Mar. Ecol.42, e12678. doi: 10.1111/maec.12678
51
Gray S. E. C. DeGrandpre M. D. Moore T. S. Martz T. R. Friederich G. E. Johnson K. S. (2011). Applications of in situ pH measurements for inorganic carbon calculations. Mar. Chem.125, 82–90. doi: 10.1016/j.marchem.2011.02.005
52
Guan Y. Hohn S. Merico A. (2015). Suitable environmental ranges for potential coral reef habitats in the tropical ocean. PloS One10, e0128831. doi: 10.1371/journal.pone.0128831
53
Guerrero Gallego J. Toro Botero F. M. Osorio Arias A. F. Álvarez Silva O. A. Giraldo A. (2012). Modelación hidrodinámica de los patrones de circulación en isla Gorgona (Colombia), para el año 2011. Escuela Geociencias y Medio Ambiente.
54
Guzmán D. Ruiz J. F. Cadena M. (2014). Regionalización de Colombia según la estacionalidad de la precipitación media mensual, a través análisis de componentes principales (ACP) (Bogotá DC: Informe Técnico. IDEAM).
55
Henocq C. Boutin J. Petitcolin F. Reverdin G. Arnault S. Lattes P. (2010). Vertical variability of near-surface salinity in the tropics: Consequences for L-band radiometer calibration and validation. J. Atmospheric Oceanic Technol.27, 192–209. doi: 10.1175/2009JTECHO670.1
56
Hernández D. Málikov I. Villegas N. (2006). Relaciones espacio-temporales entre la temperatura superficial del mar de la Cuenca del Pacífico Colombiano y el ciclo El Niño oscilación del sur. Memorias, 6 (1-2012).
57
Ho D. T. Schanze J. J. (2020). Precipitation-induced reduction in surface ocean pCO2: observations from the eastern tropical Pacific ocean. Geophysical Res. Lett.47. doi: 10.1029/2020GL088252
58
Hoyos N. Escobar J. Restrepo J. C. Arango A. M. Ortiz J. C. (2013). Impact of the 2010–2011 La Niña phenomenon in Colombia, South America: The human toll of an extreme weather event. Appl. Geogr.39, 16–25. doi: 10.1016/j.apgeog.2012.11.018
59
Instituto de Hidrología, Meteorología y Estudios Ambientales [IDEAM] (2021). Boletín Climatológico Septiembre de 2021 (Instituto de Hidrología, Meteorología y Estudios Ambientales).
60
Instituto de Investigaciones Marinas y Costeras José Benito Vives de Andréis [INVEMAR] (2020a). GDB Atlas de Áreas Coralinas de Colombia Fase II. Available online at: https://areas-coralinas-de-Colombia-invemar.hub.arcgis.com/maps/35e85cca85ca42b3a0a8be987b1c5fa3/about (Accessed August 30, 2023).
61
Instituto de Investigaciones Marinas y Costeras José Benito Vives de Andréis [INVEMAR] (2020b). Diagnóstico y evaluación de la calidad de las aguas marinas y costeras en el Caribe y Pacífico Colombianos (Instituto de Investigaciones Marinas y Costeras José Benito Vives de Andréis).
62
Instituto de Investigaciones Marinas y Costeras José Benito Vives de Andréis [INVEMAR] (2022). Diagnóstico y evaluación de la calidad de las aguas marinas y costeras en el Caribe y Pacífico Colombianos (Instituto de Investigaciones Marinas y Costeras José Benito Vives de Andréis).
63
Ishii M. Feely R. A. Rodgers K. B. Park G. H. Wanninkhof R. Sasano D. et al . (2014). Air–sea CO 2 flux in the Pacific Ocean for the period 1990–2009. Biogeosciences11, 709–734. doi: 10.5194/bg-11-709-2014
64
Kang Y. Pan D. Bai Y. He X. Chen X. Chen C. T. A. et al . (2013). Areas of the global major river plumes. Acta Oceanologica Sin.32, 79–88. doi: 10.1007/s13131-013-0269-5
65
Kleypas J. A. Buddemeier R. W. Archer D. Gattuso J. P. Langdon C. Opdyke B. N. (1999). Geochemical consequences of increased atmospheric carbon dioxide on coral reefs. Science284, 118–120. doi: 10.1126/science.284.5411.118
66
Lamarque B. Deflandre B. Schmidt S. Bernard G. Dubosq N. Diaz M. et al . (2022). Spatiotemporal dynamics of surface sediment characteristics and benthic macrofauna compositions in a temperate high-energy River-dominated Ocean Margin. Continental Shelf Res.247. doi: 10.1016/j.csr.2022.104833
67
Lavín M. F. Fiedler P. C. Amador J. A. Ballance L. T. Färber-Lorda J. Mestas-Nuñez A. M. (2006). A review of eastern tropical Pacific oceanography: Summary. Prog. Oceanography69, 391–398. doi: 10.1016/j.pocean.2006.03.005
68
Lee K. Kim T. W. Byrne R. H. Millero F. J. Feely R. A. Liu Y. M. (2010). The universal ratio of boron to chlorinity for the North Pacific and North Atlantic oceans. Geochimica Cosmochimica Acta74, 1801–1811. doi: 10.1016/j.gca.2009.12.027
69
Lee K. Tong L. T. Millero F. J. Sabine C. L. Dickson A. G. Goyet C. et al . (2006). Global relationships of total alkalinity with salinity and temperature in surface waters of the world’s oceans. Geophysical Res. Lett.33. doi: 10.1029/2006GL027207
70
Lizcano-Sandoval L. D. Londoño-Cruz E. Zapata F. A. (2018). Growth and survival of Pocillopora damicornis (Scleractinia: Pocilloporidae) coral fragments and their potential for coral reef restoration in the Tropical Eastern Pacific. Mar. Biol. Res.14, 887–897. doi: 10.1080/17451000.2018.1528011
71
Lozano-Cortés D. F. Giraldo A. Izquierdo V. (2014). Short-term assessment of the sediment deposition rate and water conditions during a rainy season on La Azufrada coral reef, Gorgona Island, Colombia. Rev. Biología Trop.62, 107–116. doi: 10.15517/rbt.v62i0.15981
72
Manzello D. P. (2010). Coral growth with thermal stress and ocean acidification: lessons from the eastern tropical Pacific. Coral Reefs29, 749–758. doi: 10.1007/s00338-010-0623-4
73
Medellín-Maldonado F. Cabral-Tena R. A. López-Pérez A. Calderón-Aguilera L. E. Norzagaray-López C. Chapa-Balcorta C. et al . (2016). Calcification of the main reef-building coral species on the Pacific coast of southern Mexico. Cienc. Marinas42, 209–225. doi: 10.7773/cm.v42i3.2650
74
Metzl N. Fin J. Lo Monaco C. Mignon C. Alliouane S. Antoine D. et al . (2024). A synthesis of ocean total alkalinity and dissolved inorganic carbon measurements from 1993 to 2022: the SNAPO-CO2-v1 dataset. Earth System Sci. Data16, 89–120. doi: 10.5194/essd-16-89-2024
75
Millero F. J. (2007). The marine inorganic carbon cycle. Chem. Rev.107, 308–341. doi: 10.1021/cr0503557
76
Millero F. J. (2010). Carbonate constants for estuarine waters. Mar. Freshw. Res.61, 139–142. doi: 10.1071/MF09254
77
Millero F. J. (2013). Chemical Oceanography. 4th ed (Boca Raton: CRC Press).
78
Munhoven G. (2013). Mathematics of the total alkalinity–pH equation–pathway to robust and universal solution algorithms: the SolveSAPHE package v1. 0.1. Geoscientific Model. Dev.6, 1367–1388. doi: 10.5194/gmd-6-1367-2013
79
Nehir M. Esposito M. Loucaides S. Achterberg E. P. (2022). Field application of automated spectrophotometric analyzer for high-resolution in situ monitoring of pH in dynamic estuarine and coastal waters. Front. Mar. Sci.9. doi: 10.3389/fmars.2022.891876
80
Oliva-Méndez N. Delgadillo-Hinojosa F. Pérez-Brunius P. Valencia-Gasti A. Huerta-Diaz M. A. Palacios-Coria E. et al . (2018). The carbonate system in coastal waters off the northern region of the Baja California Peninsula under La Niña conditions. Cienc. Marinas44, 203–220. doi: 10.7773/cm.v44i3.2833
81
Osorio A. F. A. Peláez-Zapata D. S. Guerrero-Gallego J. Álvarez-Silva O. Osorio-Cano J. D. Toro F. M. et al . (2014). Hydrodynamics applied to the management and conservation of marine and coastal ecosystems: Gorgona Island, Colombian Pacific Ocean. Rev. Biol. Trop.62, 133–147. doi: 10.15517/rbt.v62i0.15983
82
Palacios Moreno M. A. Pinto Tovar C. A. (1992). Estudio de la influencia de la marea en el río Guapi. Boletín Científico Centro Control Contaminación Del Pacific3, 3–13. doi: 10.26640/01213423.3.3_13
83
Perez F. F. Fraga F. (1987). Association constant of fluoride and hydrogen ions in seawater. Mar. Chem.21, 161–168. doi: 10.1016/0304-4203(87)90036-3
84
Pierrot D. Epitalon J.-M. Orr J. C. Lewis E. Wallace D. W. R. (2021). MS Excel program developed for CO2 system calculations – version 3.0. Available online at: https://github.com/dpierrot/co2sys_xl (Accessed June 20, 2025).
85
Poveda G. Mesa O. J. (2000). On the existence of Lloró (the rainiest locality on Earth): Enhanced ocean-land-atmosphere interaction by a low-level jet. Geophysical Res. Lett.27, 1675–1678. doi: 10.1029/1999GL006091
86
Prahl H. V. Cantera J. R. Contreras R R. (1990). Manglares y hombres del Pacífico Colombiano (Colciencias).
87
Preciado R. A. (2023). Variabilidad espacio-temporal del sistema carbonatos en Isla Gorgona, Pacífico Colombiano, Panamá Bight [Trabajo de grado, maestría en Ciencias Biológicas] (Pontificia Universidad Javeriana).
88
Rangel O. Rudas A. (1990). Aspectos microclimáticos. Biota y ecosistemas Gorgona, 41–51.
89
Rérolle V. M. Achterberg E. P. Ribas-Ribas M. Kitidis V. Brown I. Bakker D. C. et al . (2018). High resolution pH measurements using a lab-on-chip sensor in surface waters of Northwest European shelf seas. Sensors18, 2622. doi: 10.3390/s18082622
90
Restrepo J. D. Kjerfve B. (2000). Water discharge and sediment load from the western slopes of the Colombian Andes with focus on Rio San Juan. J. Geology108, 17–33. doi: 10.1086/314390
91
Ricaurte-Villota C. Murcia-Riaño M. Hernandez-Ayon J. M. (2025). Dynamics and drivers of the carbonate system: response to terrestrial runoff and upwelling along the Northeastern Colombian Caribbean coast. Front. Mar. Sci.11. doi: 10.3389/fmars.2024.1305542
92
Romero-Torres M. Acosta A. (2010). Corales duros del Pacífico Colombiano: guía visual de identificación Vol. 41 (Bogotá DC Colombia: Unión Gráfica Ltda.).
93
Romero-Torres M. Treml E. A. Acosta A. Paz-Garciá D. A. (2018). The Eastern Tropical Pacific coral population connectivity and the role of the Eastern Pacific Barrier. Sci. Rep.8. doi: 10.1038/s41598-018-27644-2
94
Sabine C. L. Feely R. A. Gruber N. Key R. M. Lee K. Bullister J. L. et al . (2004). The oceanic sink for anthropogenic CO2. Science305, 367–371. doi: 10.1126/science.1097403
95
Salisbury J. Green M. Hunt C. Campbell J. (2008). Coastal acidification by rivers: a threat to shellfish? Eos Trans. Am. Geophysical Union89, 513–513. doi: 10.1029/2008EO500001
96
Sánchez-Noguera C. (2019). Carbonate chemistry and coral reefs in the Pacific coast of Costa Rica [Doctoral dissertation] (Universität Hamburg).
97
Sánchez-Noguera C. Stuhldreier I. Cortés J. Jiménez C. Morales Á. Wild C. et al . (2018). Natural ocean acidification at Papagayo upwelling system (north Pacific Costa Rica): Implications for reef development. Biogeosciences15, 2349–2360. doi: 10.5194/bg-15-2349-2018
98
Sarmiento J. L. Gruber N. (2006). Ocean Biogeochemical Dynamics (Princeton University Press). doi: 10.2307/j.ctt3fgxqx
99
Serna L. M. Arias P. A. Vieira S. C. (2018). The Choco and Caribbean low-level jets during El Niño and El Niño Modoki events. Rev. la Academia Colombiana Cienc. Exactas Fisicas y Naturales42, 410–421. doi: 10.18257/raccefyn.705
100
Spaulding R. S. DeGrandpre M. D. Beck J. C. Hart R. D. Peterson B. De Carlo E. H. et al . (2014). Autonomous in situ measurements of seawater alkalinity. Environ. Sci. Technol.48, 9573–9581. doi: 10.1021/es501615x
101
Takatani Y. Enyo K. Iida Y. Kojima A. Nakano T. Sasano D. et al . (2014). Relationships between total alkalinity in surface water and sea surface dynamic height in the Pacific Ocean. J. Geophysical Research: Oceans119, 2806–2814. doi: 10.1002/2013JC009739
102
Terlouw G. J. Knor L. A. De Carlo E. H. Drupp P. S. Mackenzie F. T. Li Y. H. et al . (2019). Hawaii coastal seawater CO2 network: A statistical evaluation of a decade of observations on tropical coral reefs. Front. Mar. Sci.6. doi: 10.3389/fmars.2019.00226
103
Tortolero-Langarica J. J. A. Rodríguez-Troncoso A. P. Cupul-Magaña A. L. Morales-de-Anda D. E. Caselle J. E. Carricart-Ganivet J. P. (2022). Coral calcification and carbonate production in the eastern tropical Pacific: The role of branching and massive corals in the reef maintenance. Geobiology20, 533–545. doi: 10.1111/gbi.12491
104
Trujillo A. P. Thurman H. V. (2016). Essentials of Oceanography. 12th ed (Hoboken: Pearson Educación).
105
Turk D. Zappa C. J. Meinen C. S. Christian J. R. Ho D. T. Dickson A. G. et al . (2010). Rain impacts on CO2 exchange in the western equatorial Pacific Ocean. Geophysical Res. Lett.37. doi: 10.1029/2010GL045520
106
Unidad de Planeación Minero Energética [UPME] (2005). Atlas de Radiación solar de Colombia. Bogotá: UPME. 175 pp. Available at: http://www.upme.gov.co/Atlas_Radiacion.htm
107
Vaittinada Ayar P. Tjiputra J. Bopp L. Christian J. R. Ilyina T. Krasting J. P. et al . (2022). Contrasting projection of the ENSO-driven CO 2 flux variability in the Equatorial Pacific under high warming scenario. Earth System Dynamics Discussions2022, 1–31. doi: 10.5194/esd-13-1097-2022
108
Valauri-Orton A. Lowder K. B. Currie K. Sabine C. L. Dickson A. G. Chu S. N. et al . (2025). Perspectives from developers and users of the GOA-ON in a Box kit: A model for capacity sharing in ocean sciences. Oceanography38. doi: 10.5670/oceanog.2025.135
109
Vargas C. A. Contreras P. Y. Pérez C. A. Sobarzo M. Saldías G. S. Salisbury J. (2016). Influences of riverine and upwelling waters on the coastal carbonate system off Central Chile and their ocean acidification implications. J. Geophysical Research: Biogeosciences121, 1468–1483. doi: 10.1002/2015JG003213
110
von Schuckmann K. Moreira L. Cancet M. Gues F. Autret E. Baker J. et al . (2024). The state of the global ocean. State Planet4, 1–30. doi: 10.5194/sp-4-osr8-1-2024
111
Wang Z. A. Moustahfid H. Mueller A. Michel A. P. M. Mowlem M. Glazer B. T. et al . (2019). Advancing observation of ocean biogeochemistry, biology, and ecosystems with cost-effective in situ sensing technologies. Front. Mar. Sci.6. doi: 10.3389/fmars.2019.00519
112
Webster P. J. (2020). Dynamics of the tropical atmosphere and oceans (John Wiley and Sons).
113
Wu Y. Dai M. Guo X. Chen J. Xu Y. Dong X. et al . (2021). High-frequency time-series autonomous observations of sea surface p CO2 and pH. Limnology Oceanography66, 588–606. doi: 10.1002/lno.11625
114
Yasunaka S. Kouketsu S. Strutton P. G. Sutton A. J. Murata A. Nakaoka S. et al . (2019). Spatio-temporal variability of surface water pCO2 and nutrients in the tropical Pacific from 1981 to 2015. Deep Sea Res. Part II: Topical Stud. Oceanography169, 104680. doi: 10.1016/j.dsr2.2019.104680
115
Yin T. Papadimitriou S. Rérolle V. M. Arundell M. Cardwell C. L. Walk J. et al . (2021). A novel lab-on-chip spectrophotometric pH sensor for autonomous in situ seawater measurements to 6000 m depth on stationary and moving observing platforms. Environ. Sci. Technol.55, 14968–14978. doi: 10.1021/acs.est.1c03517
116
Zapata F. A. (2001). “Formaciones coralinas de la isla Gorgona,” in Gorgona marina: contribución al conocimiento de una isla única. Eds. BarriosL. M.López-VictoriaM. (Instituto de Investigaciones Marinas y Costeras [INVEMAR]), 27–40.
117
Zapata F. A. Rodríguez-Ramírez A. Caro-Zambrano C. Garzón-Ferreira J. (2010). Mid-term coral-algal dynamics and conservation status of a Gorgona Island (Tropical Eastern Pacific) coral reef. Rev. Biología Trop.58, 81–94. doi: 10.15517/rbt.v58i1.20025
118
Zeebe R. E. Wolf-Gladrow D. (2001). CO2 in seawater: equilibrium, kinetics, isotopes Vol. 65 (Gulf Professional Publishing).
119
Zhai W. D. Zang K. P. Huo C. Zheng N. Xu X. M. (2015). Occurrence of aragonite corrosive water in the North Yellow Sea, near the Yalu River estuary, during a summer flood. Estuarine Coast. Shelf Sci.166, 199–208. doi: 10.1016/j.ecss.2015.02.010
120
Zhong G. Li X. Song J. Qu B. Wang F. Wang Y. et al . (2025). A global monthly 3D field of seawater pH over 3 decades: a machine learning approach. Earth System Sci. Data17, 719–740. doi: 10.5194/essd-17-719-2025
Summary
Keywords
ocean acidification, riverine input, ENSO, RioMar, coral reef
Citation
Murcia A, Acosta A, Garcia AP, Corredor-Acosta A, Hernández‑Ayón JM, Guitiérrez S, Celis C and Ruiz-Pino D (2025) High-resolution monitoring of the pH under strong La Niña conditions in Gorgona Island, Colombian Pacific, Panama Bight. Front. Mar. Sci. 12:1595871. doi: 10.3389/fmars.2025.1595871
Received
18 March 2025
Accepted
22 July 2025
Published
12 August 2025
Volume
12 - 2025
Edited by
Martin F. Soto-Jimenez, National Autonomous University of Mexico, Mexico
Reviewed by
Juan Carlos Carrasco Navas-Parejo, University of Cádiz, Spain
Raffi Isah, University of Hawaii at Manoa, United States
Maria Lourdes San Diego-McGlone, University of the Philippines Diliman, Philippines
Updates
Copyright
© 2025 Murcia, Acosta, Garcia, Corredor-Acosta, Hernández‑Ayón, Guitiérrez, Celis and Ruiz-Pino.
This is an open-access article distributed under the terms of the Creative Commons Attribution License (CC BY). The use, distribution or reproduction in other forums is permitted, provided the original author(s) and the copyright owner(s) are credited and that the original publication in this journal is cited, in accordance with accepted academic practice. No use, distribution or reproduction is permitted which does not comply with these terms.
*Correspondence: Alberto Acosta, laacosta@javeriana.edu.co
Disclaimer
All claims expressed in this article are solely those of the authors and do not necessarily represent those of their affiliated organizations, or those of the publisher, the editors and the reviewers. Any product that may be evaluated in this article or claim that may be made by its manufacturer is not guaranteed or endorsed by the publisher.